twelve thousand years of dust: the holocene global dust cycle constrained … · 2016-01-09 · 870...
TRANSCRIPT
Clim. Past, 11, 869–903, 2015
www.clim-past.net/11/869/2015/
doi:10.5194/cp-11-869-2015
© Author(s) 2015. CC Attribution 3.0 License.
Twelve thousand years of dust: the Holocene global dust cycle
constrained by natural archives
S. Albani1,2, N. M. Mahowald1, G. Winckler3,4, R. F. Anderson3,4, L. I. Bradtmiller5, B. Delmonte2, R. François6,
M. Goman7, N. G. Heavens8, P. P. Hesse9, S. A. Hovan10, S. G. Kang11, K. E. Kohfeld12, H. Lu13, V. Maggi2,
J. A. Mason14, P. A. Mayewski15, D. McGee16, X. Miao17, B. L. Otto-Bliesner18, A. T. Perry1, A. Pourmand19,
H. M. Roberts20, N. Rosenbloom18, T. Stevens21, and J. Sun22
1Department of Earth and Atmospheric Sciences, Cornell University, Ithaca, NY, USA2Department of Environmental Sciences, University of Milano-Bicocca, Milano, Italy3Lamont–Doherty Earth Observatory, Columbia University, Palisades, NY, USA4Department of Earth and Environmental Sciences, Columbia University, New York, NY, USA5Department of Environmental Studies, Macalester College, Saint Paul, MN, USA6Department of Earth and Ocean Sciences, University of British Columbia, Vancouver, BC, Canada7Department of Geography and Global Studies, Sonoma State University, Rohnert Park, CA, USA8Department of Atmospheric and Planetary Sciences, Hampton University, Hampton, VA, USA9Department of Environmental Sciences, Macquarie University, Sydney, Australia10Department of Geoscience, Indiana University of Pennsylvania, Indiana, PA, USA11State Key Laboratory of Loess and Quaternary Geology, Institute of Earth Environment, Chinese Academy of Sciences,
Xi’an, China12School of Resource and Environmental Management, Simon Fraser University, Burnaby, BC, Canada13School of Geographic and Oceanographic Sciences, Nanjing University, Nanjing, China14Department of Geography, University of Wisconsin, Madison, WI, USA15Climate Change Institute, University of Maine, Orono, ME, USA16Department of Earth, Atmospheric and Planetary Sciences, Massachusetts Institute of Technology, Cambridge, MA, USA17Illinois State Geological Survey, Prairie Research Institute, University of Illinois, Champaign, IL, USA18National Center for Atmospheric Research, Boulder, CO, USA19Department of Marine Geosciences, Rosenstiel School of Marine and Atmospheric Science,
University of Miami, Miami, FL, USA20Department of Geography and Earth Sciences, Aberystwyth University, Aberystwyth, Wales, UK21Department of Earth Sciences, Uppsala University, Uppsala, Sweden22Key laboratory of Cenozoic Geology and Environment, Institute of Geology and Geophysics,
Chinese Academy of Science, Beijing, China
Correspondence to: S. Albani ([email protected])
Received: 30 September 2014 – Published in Clim. Past Discuss.: 13 November 2014
Revised: 16 March 2015 – Accepted: 6 May 2015 – Published: 11 June 2015
Published by Copernicus Publications on behalf of the European Geosciences Union.
870 S. Albani et al.: Twelve thousand years of dust
Abstract. Mineral dust plays an important role in the cli-
mate system by interacting with radiation, clouds, and bio-
geochemical cycles. In addition, natural archives show that
the dust cycle experienced variability in the past in response
to global and local climate change. The compilation of the
DIRTMAP (Dust Indicators and Records from Terrestrial
and MArine Palaeoenvironments) paleodust data sets in the
last 2 decades provided a benchmark for paleoclimate models
that include the dust cycle, following a time slice approach.
We propose an innovative framework to organize a paleodust
data set that builds on the positive experience of DIRTMAP
and takes into account new scientific challenges by provid-
ing a concise and accessible data set of temporally resolved
records of dust mass accumulation rates and particle grain
size distributions. We consider data from ice cores, marine
sediments, loess–paleosol sequences, lake sediments, and
peat bogs for this compilation, with a temporal focus on the
Holocene period. This global compilation allows the investi-
gation of the potential, uncertainties, and confidence level of
dust mass accumulation rate reconstructions and highlights
the importance of dust particle size information for accurate
and quantitative reconstructions of the dust cycle. After ap-
plying criteria that help to establish that the data considered
represent changes in dust deposition, 45 paleodust records
have been identified, with the highest density of dust deposi-
tion data occurring in the North Atlantic region. Although the
temporal evolution of dust in the North Atlantic appears con-
sistent across several cores and suggests that minimum dust
fluxes are likely observed during the early to mid-Holocene
period (6000–8000 years ago), the magnitude of dust fluxes
in these observations is not fully consistent, suggesting that
more work needs to be done to synthesize data sets for the
Holocene. Based on the data compilation, we used the Com-
munity Earth System Model to estimate the mass balance of
and variability in the global dust cycle during the Holocene,
with dust loads ranging from 17.2 to 20.8 Tg between 2000
and 10 000 years ago and with a minimum in the early to
mid-Holocene (6000–8000 years ago).
1 Introduction
Paleoclimate records from natural archives have laid founda-
tions for understanding the variability in the Earth’s climate
system over different timescales. Paleoclimate proxies shed
light on past environmental conditions, such as the compo-
sition of the atmosphere, global ice volume, sea level, and
surface temperatures (Bradley, 1999). Paleodust reconstruc-
tions paired with other proxies showed the response of the
climate system to orbitally induced forcing, including feed-
back mechanisms. Dust feedbacks on the climate system in-
clude scattering and absorption of solar radiation and indirect
effects on clouds and the global carbon cycle (e.g., Boucher
et al., 2013; Martin, 1990).
The story told by paleodust archives suggests that in-
creased aridity (An et al., 1991; Liu, 1985; Liu and Ding,
1998) and wind gustiness (McGee et al., 2010; Muhs et
al., 2013a) enhanced the dust cycle during cold periods
over glacial–interglacial timescales, with additional mecha-
nisms introducing characteristic geographic patterns and/or
imprinting the archives with characteristic signals in different
geographical settings. These mechanisms include increased
sediment availability by glacial erosion (Delmonte et al.,
2010a; Petit et al., 1999), reorganization of the atmospheric
circulation between mid- and high latitudes (Fuhrer et al.,
1999; Lambert et al., 2008; Mayewski et al., 1997, 2014),
shifts in the intertropical convergence zone (ITCZ) (McGee
et al., 2007; Rea, 1994), changes in the monsoonal variability
(Clemens and Prell, 1990; Hovan et al., 1991; Tiedemann et
al., 1994), and regional drying (Lu et al. 2010).
The growing number of paleodust archives and the inclu-
sion of the dust cycle in climate models has promoted syn-
thesis efforts in the compilation of global dust data sets (Ma-
howald et al., 1999). The Dust Indicators and Records from
Terrestrial and MArine Palaeoenvironments (DIRTMAP)
project (Kohfeld and Harrison, 2001) formalized the com-
pilation of dust mass accumulation rates (dust MARs, or
DMARs) from marine and ice cores, later complemented
by terrestrial sedimentary records (Derbyshire, 2003). This
project followed a time slice approach, providing reference
values of DMARs for the Last Glacial Maximum (LGM)
and late Holocene and for modern data, including from sed-
iment traps. DMAR is the fundamental measurement nec-
essary to cross-correlate variability among dust archives and
sites. Without it, only the relative timing and amplitude of in-
dividual records can be studied. In combination with global
climate models, DMAR data sets enable quantitative recon-
structions of the global dust cycle. The DIRTMAP compila-
tion showed a globally averaged glacial / interglacial ratio of
∼ 2.5 in dust deposition. Subsequent work expanded upon
the initial compilation (DIRTMAP2: Tegen et al., 2002),
and the most recent version of the database (DIRTMAP3:
Maher et al., 2010) also contains an extensive repository
of additional metadata from the original publications. The
DIRTMAP data sets have proven to represent an invaluable
tool for paleoclimate research and model–data intercompari-
son.
The full definition of the global dust cycle in terms of
DMAR is unavoidably linked to the dust grain size dis-
tributions that characterize the mass balance and its spa-
tial evolution. The more advanced dust models define a
model particle size range and distribution, which would re-
quire (although this has been often neglected) explicitly con-
sidering the size range of dust found in the dust deposi-
tion data in model–observation intercomparisons. This as-
pect was initially taken into account for terrestrial sediments
in Mahowald et al. (2006) to match the specific model size
range (0.1–10 µm) and was recently extended by Albani et
al. (2014). Nevertheless, the necessity of more extensive
Clim. Past, 11, 869–903, 2015 www.clim-past.net/11/869/2015/
S. Albani et al.: Twelve thousand years of dust 871
grain size information from dust data has been emphasized
by Maher et al. (2010), as well as by other review papers
on dust (e.g., Formenti et al., 2011; Mahowald et al., 2014).
Coherent information on grain size is missing in DIRTMAP3
(Maher et al., 2010) because of the difficulty of making a syn-
thesis from measurements produced by a variety of particle
size measurement techniques often yielding quite different
results (Mahowald et al., 2014; Reid, 2003).
A time slice approach is often used by the paleoclimate
modeling community to target key periods in climate his-
tory, such as the Last Glacial Maximum ∼ 21 000 years Be-
fore Present (LGM: 21 ka BP), or the mid-Holocene (MH:
6 ka BP), in the framework of the Paleoclimate Modelling
Inter-comparison Project (PMIP: Joussaume and Taylor,
2000). Continuing improvement in the performance of large-
scale supercomputers is opening up doors to performing tran-
sient simulations on paleoclimate timescales, both with inter-
mediate complexity (Bauer and Ganopolski, 2014) and more
complex Earth system models (ESMs) (Liu et al., 2009).
PMIP3 called for additional key transient experiments to
study abrupt climate change, with the implication that, at the
same time, target observational data sets with the necessary
temporal continuity and resolution are needed (Otto-Bliesner
et al., 2009).
We propose an innovative framework to organize a pa-
leodust data set that builds on the positive experience of
DIRTMAP and takes into account the new scientific chal-
lenges outlined above by providing a synthesized and acces-
sible data set of temporally resolved records of dust MARs
and size distributions. We aim to provide a database that is
a concise and accessible compilation of time series, includ-
ing age (with uncertainty), dust MAR (with uncertainty), and
dust particle size distribution (where available), standard-
ized by the use of a common binning scheme and comple-
mented by a categorical attribution of confidence based on
general consensus. Besides the basic information mentioned
above, we also report the ancillary information necessary to
re-derive the dust MARs time series, i.e., the detailed depths
and the relevant dust variables. Inspired by DIRTMAP, our
new compilation considers DMARs as the key variable for
a coherent study of paleodust archives. The elements of in-
novation that we introduce here (size distributions, tempo-
ral resolution, and attribution of confidence level), however,
constitute a leap forward to a new-generation dust database.
We focus on dust variability during the Holocene, with an
emphasis on the MH as a key PMIP scenario and also in
relation to the large variability that affected the, at present,
largest dust source in the world, northern Africa, with the
termination of the African Humid Period (AHP) (deMeno-
cal et al., 2000; McGee et al., 2013). For this reason we only
selected paleodust records encompassing the MH with some
degree of temporal resolution (see Sect. 3), although we show
the time series from the LGM in the paper to provide refer-
ence to other key climate conditions and to placeour work in
a fuller context with respect to the DIRTMAP compilation.
The developed framework is suitable for a more extensive
compilation.
We acknowledge that there is a richness of information
intrinsic to each sedimentary record (i.e., as in the original
studies) that is not necessarily fully captured by the synthe-
sized information we report, despite our efforts to be as com-
plete as possible: simplification is inherent in a synthesis. For
the sake of accessibility, we refrain from reporting extensive
information that cannot be coherently organized. We there-
fore provide a brief summary and refer to the relevant lit-
erature for detailed descriptions of specific records (Supple-
ment). In addition, because our purpose is to provide a quan-
titative constraint on the dust cycle, we only considered sedi-
mentary records that allow the derivation of meaningful dust
MARs with the information we could access. Many more
studies have focused on dust and provided important, good-
quality information, but they did not allow a time-resolved
estimate of dust MAR. We refer to these studies when appro-
priate, as they provide further context to ensure our interpre-
tations.
Finally, we use the Community Earth System Model
(CESM) in combination with the DMAR and size data (Al-
bani et al., 2014; Mahowald et al., 2006) from the compila-
tion to estimate the mass balance of the global dust cycle and
its variability during the Holocene.
Section 2 gives an overview of the kind of natural archives
initially considered for this compilation, while in Sect. 3 we
explain our methodological approach to selecting and orga-
nizing the records. In Sect. 4 we present the database and
model-based reconstructions and discuss the emerging prop-
erties in relation to the climate features in different spatial
domains. We summarize our work in Sect. 5.
2 Paleodust archives
Natural archives that preserve dust sediments have different
characteristics in terms of geographical settings and spatial
distributions around the globe, the accuracy of the age mod-
els and temporal resolution, and the ability to isolate eolian
dust from other depositional contributions. Each type of pa-
leodust archive has its own strengths and limitations, and it
is only by considering high-quality records of all types (from
land, ice, and ocean archives) that we can hope to build a
consistent reconstruction of the global dust cycle. We only
include paleodust records that allow the estimation of dust
MARs with relevance for medium- or large-scale dust ex-
port.
Natural archives preserve eolian dust within a sedimentary
matrix. The essential elements for a paleodust record are the
possibility of establishing a reliable chronology, the estima-
tion of the sedimentation rates, and the isolation of the eolian
component (Fig. 1). Throughout the paper we use the term
“sediment” in a broad sense that encompasses ice as well as
other sediments in a strict sense.
www.clim-past.net/11/869/2015/ Clim. Past, 11, 869–903, 2015

872 S. Albani et al.: Twelve thousand years of dust
Figure 1. Schematic representation of the process of calculation
of eolian DMAR (dust mass accumulation rate), and its relation
to the SR (sedimentation rate), DBD (dry bulk density), SBMAR
(sediment bulk MAR), and EC (eolian content). DMAR (on age
scale) is the typical path for loess–paleosol records, whereas DMAR
(chronology) indicates the final step of the workflow when EC is
also measured.
One of the key elements in the production of a paleodust
record is the possibility of establishing a depth–age relation.
Typically the starting point for this procedure is the attribu-
tion of age to a series of specific depth layers along the pro-
file, based on numerical dating or stratigraphic correlations.
Numerical dating can be based on the counting of annual lay-
ers, radionuclide decays (e.g., 14C), or exposure to radiation
(e.g., thermoluminescence (TL) or optically stimulated lumi-
nescence (OSL)) (Brauer et al., 2014). Stratigraphic correla-
tions either exploit stratigraphic markers, such as known vol-
canic eruptions and spikes in tracers of the atmospheric ther-
monuclear test explosions, or are attributed by wiggle match-
ing an age-carrier profile from the study site (e.g., δ18O of
foraminifera in marine sediment cores or methane concentra-
tion in ice cores) with a reference record of global signatures,
such as global ice volume (e.g., Martinson et al., 1987) or
the variations in atmospheric methane concentrations (e.g.,
Loulergue et al., 2008).
Sediment chronologies can be established based on the
initial age–depth relations identified along a profile. With
“chronology” we mean a continuous function that provides
a unique attribution of the depth–age relation along the en-
tire profile, based on some kind of age model. Age models
can vary from simple linear sedimentation models to com-
plex Bayesian models (Brauer et al., 2014).
A general expression for dust (or eolian – the two terms
will be used equivalently throughout the text) MARs is the
following: DMAR=SBMAR ·EC, where SBMAR is the
sediment bulk mass accumulation rate and EC is eolian con-
tribution.
The estimation of SBMAR relies on a couple of main ap-
proaches. The first one is based on estimating SBMARs be-
tween dated horizons as the product of sedimentation rates
(SRs) and dry bulk densities (DBDs): SBMAR=SR ·DBD.
Either a linear sedimentation rate (LSR) is derived between
dated layers or more complex age models are applied, result-
ing in diverse SR profiles. The other approach is specific to
the marine sediments realm, and it is largely (other than for
decay correction) independent of the underlying age model:
it is based on the assumption that the rapid scavenging of230Th produced in the water column by decay of dissolved
uranium results in its flux to the seafloor being equal or close
to its known rate of production. Measurements of 230Th in
marine sediments therefore allow us to estimate instanta-
neous SBMARs that are independent of LSRs (François et
al., 2004).
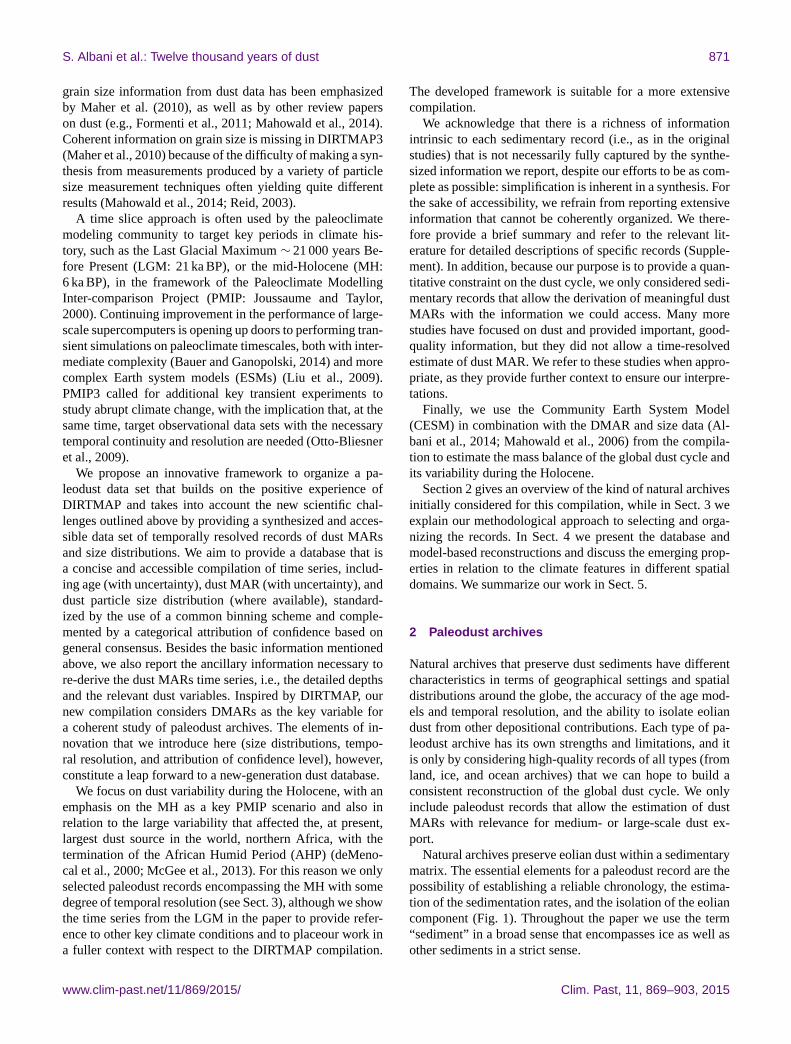
Because eolian DMAR is the product of at least two
factors (SBMAR and EC), the sampling (depth) resolution
at which the two of them are available will determine the
DMAR resolution, and in some cores the resolutions may co-
incide. Sometimes a constant LSR is assumed between dated
depth layers, whereas stratigraphic samples are analyzed at
a higher resolution and an estimated age is assigned based
on the age model (Fig. 2). On the timescale of interest, it
should be noted that deviations from the ideal pairing of EC
and SBMAR measurements along a profile might be consid-
ered acceptable if the resolutions are not too different. On the
other hand, if one variable (typically EC) has a much higher
resolution than the other, then its high resolution is not in-
formative with respect to their product (DMAR), and misin-
terpretations could arise. In those cases the lower-resolution
variable should be used to provide the pace of the record’s
resolution. We did not make any adjustments to the data in
this respect; note that we only have records where either the
resolutions match or they are very similar (see Supplement).
An additional aspect to consider when dealing with dust
MARs is the relationship between the dust deposition flux
(DF) and the dust MAR, i.e., to what extent the mea-
sured DMAR is representative (in a quantitative way) of
the dust deposition, which is of primary interest: ideally
DMAR=DF. Deviations from this ideal relation occur, for
instance, when sediment redistribution disturbs the ocean
sediments (François et al., 2004) or when erosion leaves
hiatuses in loess–paleosol sequences (Stevens et al., 2007).
When there is an indication of such occurrences, we took
focussing-corrected data in the former case or considered
only the undisturbed sections of the records in the latter case.
The other fundamental piece of information is the size dis-
tribution of dust, which is tightly coupled to the DMAR in
determining the magnitude (or mass balance) of the dust cy-
cle (Albani et al., 2014; Mahowald et al., 2014; Schulz et al.,
1998; Lu et al., 1999). In addition, size data is a necessary
piece of information to determine the provenance of dust. At
accumulation sites far from the major dust sources, size dis-
tribution allows (together with geochemical and mineralogi-
Clim. Past, 11, 869–903, 2015 www.clim-past.net/11/869/2015/
S. Albani et al.: Twelve thousand years of dust 873
Figure 2. Example of different resolution of SBMAR and EC
(Clemens and Prell, 1990).
cal data) the identification of local versus remote inputs (Al-
bani et al., 2012a; Delmonte et al., 2010b). At terrestrial sites
proximal to the source areas, it is necessary to evaluate the
amount of dust actually available for long-range transport
(Mahowald et al., 2006; Muhs et al., 2013a; Roberts et al.,
2003).
We next analyze the main characteristics of the different
kinds of paleodust records considered for this compilation:
ice cores, marine sediments, loess–paleosol sequences, lake
sediments and peat bogs.
2.1 Ice cores
Ice cores constitute a natural sampler of past atmospheric
composition, including greenhouse gases and aerosols. The
isolation of the eolian component from the ice matrix is
rather straightforward – it is usually obtained by melting the
ice at room temperature (Delmonte et al., 2004), although
sublimation of the ice is another option (Iizuka et al., 2013),
so that the ice allows the most pristine preservation of the
locally deposited atmospheric aerosol.
The presence of perennial ice limits the geographical cov-
erage of ice core records worldwide, and the recovery of long
dust stratigraphies is limited to the high latitudes and a few
alpine glaciers in the mid- and low latitudes. Often the EC
is a direct measure of the insoluble dust concentration and
size distribution in the ice samples, using either a Coulter
counter (Delmonte et al., 2004) or a laser diffraction particle
counter (Lambert et al., 2008). Alternatively a geochemical
dust proxy can be used (e.g., McConnell et al., 2007), and
the most common approach considers non-sea-salt calcium
(Röthlisberger et al., 2002; Fischer et al., 2007). Despite the
fact that the dust–calcium relation should be treated with cau-
tion under certain circumstances (Ruth et al., 2002, 2008),
this approach has successfully been used to produce dust
records in Greenland (e.g., Fuhrer et al., 1999; Mayewski et
al., 1997) and Antarctica (Lambert et al., 2012; Schüpbach et
al., 2013).
Since in most cases both dust (insoluble) and calcium
records were produced at the same location, we focus on
insoluble particle records, which also include dust size dis-
tributions. Possible non-dust contributions include volcanic
tephra, which is usually identifiable and excluded from the
records (e.g., Narcisi et al., 2010). For Greenland there is
only one record spanning the Holocene, GISP2, for which
we consider calcium as a proxy for dust (Mayewski et al.,
1997).
For the estimation of SBMAR, postdepositional changes
may potentially affect snow and ice accumulation rates
through surface redistribution or sublimation. In the polar
ice sheets plateaus these effects are probably negligible on
domes, where ice cores are usually drilled (Frezzotti et al.,
2007), so that dust DMAR=DF.
Polar ice core age models are in continuous evolution, and
they benefit from the growing number of deep ice cores.
A striking feature is the absolute counting of annual lay-
ers in Greenland ice cores (Vinther et al., 2006), which in
combination with several ice and stratigraphic markers (e.g.,
methane spikes, volcanic signals) allows establishing con-
sistent chronologies for both Greenland and Antarctic ice
cores. In this work we use the most recent Antarctic Ice Core
Chronology 2012 (AICC2012) chronology for Antarctic ice
cores (Veres et al., 2013). Because of the high sediment ma-
trix accumulation rates compared to other natural archives,
polar ice cores usually provide the highest-resolution dust
records. Dust concentration records are also available from
alpine glaciers (e.g., Thompson et al., 1995, 1997). While it
is possible to derive estimates of dust MARs on the glacial–
interglacial timescale (Kohfeld and Harrison, 2001), it is
problematic to calculate DMAR time series. This is because
there are no reliable age models due to the difficulty in es-
tablishing adequate accumulation stratigraphies in such en-
vironments.
With a few exceptions from sites on the edges of the
ice sheets both in Greenland (Renland: Hansson, 1994) and
Antarctica (e.g., TALDICE – TALos Dome Ice CorE: Al-
bani et al., 2012a; Delmonte et al., 2013), polar ice cores
are thought to archive almost exclusively dust from remote
source areas (Bory et al., 2003; Delmonte et al., 2010b) and
to be representative of the magnitude and variability in the
dust cycle at least over the high latitudes in both hemispheres
(Mahowald et al., 2011).
2.2 Marine sediments
With the oceans covering two thirds of the Earth’s surface
marine sediment cores represent key paleoclimate archives,
recording among other things global land ice volumes, ocean
productivity, and the main characteristics of the ocean deep
circulation (e.g., Bradley, 1999). Dust particles deposited
www.clim-past.net/11/869/2015/ Clim. Past, 11, 869–903, 2015

874 S. Albani et al.: Twelve thousand years of dust
to the ocean’s surface attach to other suspended particles
and get scavenged throughout the water column, determin-
ing the accumulation of eolian material in pelagic sedi-
ments (Bory and Newton, 2000). Despite the complexity
of and uncertainties in the dynamics of particle sedimenta-
tion throughout the water column (e.g., Bory and Newton,
2000; De La Rocha et al., 2008), as well as their poten-
tial advection downstream (Siegel and Deuser, 1997; Han et
al., 2008), we can reasonably make the approximation that
dust DF(surface)=DF(benthic). This is valid in most regions
(Siegel and Armstrong, 2002; Kohfeld and Tegen, 2007),
with the notable exception of the Southern Ocean (Kohfeld
and Harrison, 2001).
The pelagic environment is characterized by low deposi-
tion rates, so that most marine records naturally have a lower
temporal resolution than ice cores. Chronologies for marine
sediment cores are often derived by stratigraphic correlation
of δ18O records of benthic or pelagic foraminifera (represen-
tative of a combination of global ice volume and tempera-
ture) with reference stacks such as Mapping Spectral Vari-
ability in Global Climate (SPECMAP) (Imbrie et al., 1984;
Martinson et al., 1987) or LR04 (Lisiecki and Raymo, 2005).
In many studies, additional constraints for the age models
are given by radiocarbon dating foraminifera (e.g., Ander-
son et al., 2006; McGee et al., 2013) or tephras (Nagashima
et al., 2007), which is especially relevant for the Holocene.
The age–depth relation is usually assigned by linear inter-
polation between dated layers. Chronologies only based on
stratigraphic correlation of δ18O records are inherently af-
fected by a significant degree of uncertainty for the Holocene
because the youngest tie points in δ18O stacks can be consid-
ered the Last Glacial Maximum (18 ka BP) and the Marine
Isotopic Stage (MIS) boundary MIS1–2 (14 ka BP) (Lisiecki
and Raymo, 2005). Often, in the absence of absolute ages, the
assumption is made that the surface sediment age is 0 ka BP,
although the surface sediments may be disturbed or partially
lost during the core recovery.
Two main strategies are used to derive dust records from
marine cores. In the first, more traditional “operational” ap-
proach, SBMAR=LSR ·DBD, with LSR calculated from
the age model and DBD measured or estimated. EC is deter-
mined by isolating the lithogenic fraction from the sediment
matrix by the subsequent removal of the organic component,
carbonates, and biogenic opal by thermal or chemical treat-
ments (Rea and Janecek, 1981). In this approach the basic
assumption is that the entire lithogenic fraction is eolian in
origin. Corrections for volcanic contributions were attempted
by visual inspection (Hovan et al., 1991) or by the use of
geochemical tracers (Olivarez et al., 1991), which could also
help to distinguish fluvial from eolian inputs (Box et al.,
2011). Other spurious lithogenic inputs may include material
from turbidite currents, hemipelagic sediments, or ice-rafted
debris (e.g., Rea and Hovan, 1995). Additionally, sediment
redistribution may alter the depositional stratigraphy, bias-
ing the true sedimentation rates (François et al., 2004); this
is usually not accounted for in studies following this kind
of approach. Here, we exclude sites known (or very likely)
to be significantly affected by sediment redistribution (e.g.,
nepheloid layers: Kohfeld and Harrison, 2001) and ice-rafted
debris (Kohfeld and Harrison, 2001) and those close to the
continental margins (e.g., Serno et al., 2014).
The other strategy consists of deriving SBMAR from230Th profiling (François et al., 2004). Briefly, 230Th (half-
life: 75 690 years) is produced uniformly throughout the
ocean by radioactive decay of dissolved 234U. Due to its
high particle reactivity, 230Th is efficiently scavenged by par-
ticulate matter and has a short residence time in the ocean
(< 30 years) (Bacon and Anderson, 1982). The rain rate of
scavenged 230Th to the sediments is therefore equal to its
known rate of production in the overlying water column
(Henderson et al., 1999). SBMARs are calculated by divid-
ing the production rate of 230Th in the water column by
concentrations of scavenged 230Th in the sediment (Bacon,
1984; François et al., 2004).
At sites potentially influenced by sediment redistribution,
the 230Th profiling method is probably the more reliable ap-
proach for the determination of SBMAR, as it accounts for
sediment focusing (Anderson et al., 2008; François et al.,
2004). If it can be assumed that the lithogenic fraction is of
eolian origin, EC can be derived from the 232Th concentra-
tion in the sediment of a dust proxy (232Th). As 232Th con-
centrations in dust are generally more than 1 order of mag-
nitude higher than in most volcanic materials, 232Th levels
closely track continental inputs and are insensitive to vol-
canic inputs. In addition, 232Th offers the advantage, com-
pared to other dust proxies, that its concentration in global
dust sources is relatively invariable and close to the up-
per continental crust concentration (McGee et al., 2007). If
non-eolian contributions (such as volcanic contributions) are
present, multi-proxy approaches (using REE, 4He) can pro-
vide a means to isolate the eolian fraction (Serno et al., 2014).
On continental margin settings, high sedimentation rates are
related to the presence of fluvial inputs, which can be iso-
lated from the eolian component by the use of grain size end-
member modeling (McGee et al., 2013; Weltje, 1997).
Bioturbation, i.e., surface sediment mixing by benthic
fauna, is a common unconstrained feature of marine sed-
iments that acts as a smoothing filter on the sedimentary
stratigraphy, including ages and other profiles of interest,
with a typical vertical smoothing scale of 8–10 cm. A few
studies have evaluated the potential effects of the bioturba-
tion of their records, although they do not correct their pro-
files (François et al., 1990; McGee et al., 2013), based on a
simple deconvolution linear model (Bard et al., 1987).
2.3 Loess–paleosol sequences
The possibility of reconstructing the global dust cycle re-
quires observations that are distributed geographically to
constrain different regions, and that also encompass the evo-
Clim. Past, 11, 869–903, 2015 www.clim-past.net/11/869/2015/

S. Albani et al.: Twelve thousand years of dust 875
lution of dust spread from the source areas to the areas down-
wind and to remote regions. Terrestrial sediment records are
therefore necessary to constrain the location and magnitude
of past sources of dust. Loess can be defined as terrestrial
eolian sediments, composed predominantly of silt-size parti-
cles, formed by the accumulation of wind-blown dust (Pye,
1995; Liu, 1985), and covering vast regions (∼ 10 %) of the
land masses (e.g., Derbyshire et al., 1995; Rousseau et al.,
2011). The formation of loess deposits is often associated
with the proximity of major dust sources, the availability of
fine-grained erodible sediments and adequate winds, and a
suitable accumulation site (Pye, 1995; Liu, 1985). This re-
quires that a complex deposition–erosion balance determines
the actual rate of accumulation at a site and the alternation
of accumulation and weathering phases depending on the
dominant environmental conditions (Kemp, 2001; Muhs et
al., 2003a). Loess–paleosol records (or soil profiles) span-
ning the late Quaternary have shown to be important proxies
and dust archives, both on glacial–interglacial (e.g., Kohfeld
and Harrison, 2003; Muhs et al., 2008; Lu and Sun, 2000;
Lu et al., 1999) and millennial timescales (e.g., Mason et al.,
2003).
Because of their nature, loess records are more challenging
to interpret than marine or ice dust stratigraphies in quan-
titative terms, but they hold great potential under favorable
circumstances. In the case of loess–paleosol sequences, the
assumption is often made that EC= 1 because the other
soil component, i.e., the organic matter content is usually
very low, i.e., < 1 % (e.g., Miao et al., 2007). Nonetheless,
in carbon-rich soils, where organic matter can be ∼ 10 %,
this contribution should be taken into account (Muhs et al.,
2013b). Therefore, the implication is that the dust MAR is
entirely determined by SBMAR=LSR ·DBD. Depending
on the study, DBD is either measured or assumed based on
literature surveys, which adds significant uncertainty to cal-
culations. The LSR is determined based on the age–depth
relation. For this compilation, focused on the Holocene, we
only consider profiles for which absolute ages (or more cor-
rectly, numerical ages) have been measured rather than rely-
ing on stratigraphic correlations.
Depending on the availability of suitable material at loess
sites, radiocarbon dating is carried out on different organic
components such as plant material (e.g., charcoal, plant, and
wood fragments) or Succineidae (land snails). Humic acid
is also utilized; however, this medium provides less reliable
dates. Scarcity of organic samples could be a limitation for
chronologies relying on radiocarbon dating. An alternative
category of methods for numerical dating of loess deposits
is the luminescence-dating group of techniques (Roberts,
2008). In particular OSL dating of quartz grains with the
single aliquot regenerative (SAR) dose protocol (Wintle and
Murray, 2006) is considered to be quite robust (Roberts,
2008).
Bioturbation by faunal burrowing is an active process
complicating the interpretations of soil profiles, as indicated
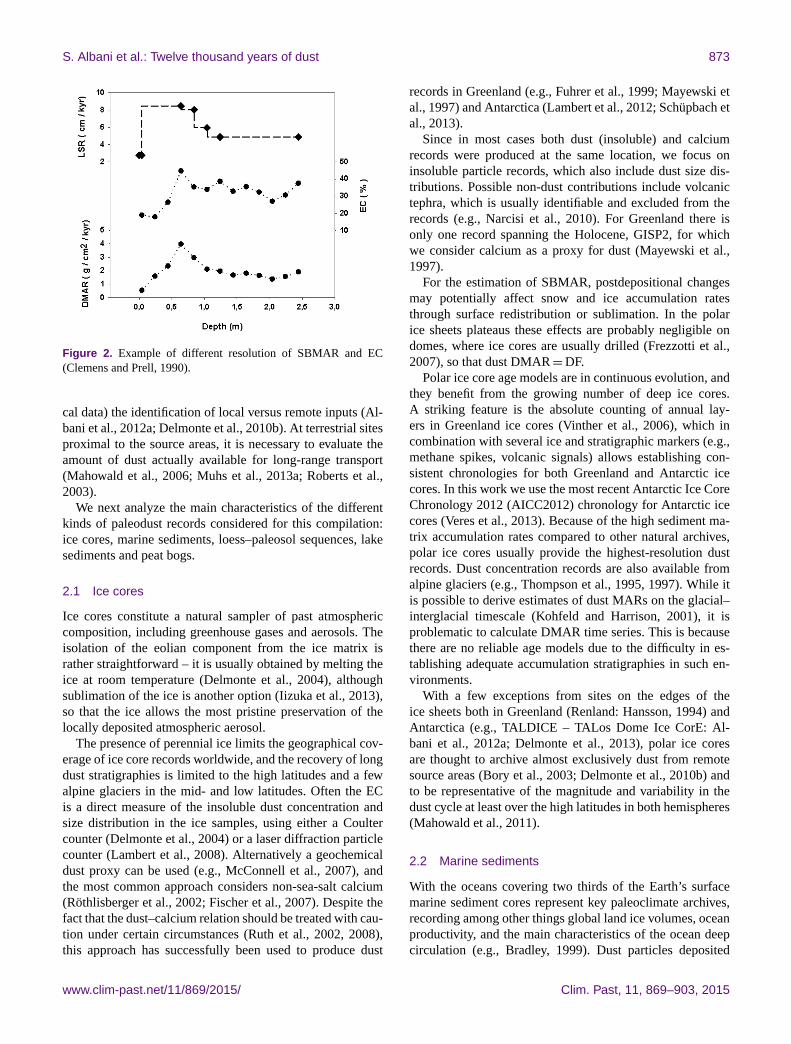
Figure 3. Conceptual plot of the evolution of dust deposition flux
(DF) and size distribution (% sand) as a function of distance from
the source.
by stratigraphic age inversions. In addition human activities
such as agriculture may cause significant perturbations to the
upper sections of soil profiles (Roberts et al., 2001). Ad-
ditional problems in the interpretation of soil profiles may
arise in cases where the origin of the loess is not primarily
eolian but rather the product or reworking of local deposits
(Kemp, 2001). We therefore did not consider sections from
areas where such occurrence was identified.
Even when a reworked origin can be excluded, it should
not be taken for granted that the DMAR=DF relation nec-
essarily holds in the case of loess deposits. Conceptually, we
can imagine the process of dust emission and deposition in
a regional setting as follows: dust emanates from a source
and starts to be deposited downwind at rates decreasing with
distance from the source (Fig. 3). A clear example of this
is evident in the maps showing the spatial variability in the
thickness of last glacial Peoria loess deposits in North Amer-
ica (Bettis III et al., 2003) or the loess deposition in the Chi-
nese Loess Plateau (CLP) (Liu, 1985; Lu and Sun, 2000).
Understanding the spatial scale of this process is essential.
Grain size data from sampling transects at various loca-
tions suggest that a sharp decrease in DMAR immediately
downwind of source areas is associated with a decrease in
the size distribution within 20–50 km Chewings et al., 2014;
Mason et al., 2003; Muhs et al., 2004; Winton et al., 2014),
before a slower decline in DMAR and size keeps on the
same trajectory on broader spatial scales (Ding et al., 2005;
Lawrence and Neff, 2009; Porter, 2001; Prins et al., 2007;
Sun et al., 2003). It is evident, then, that bulk DMARs (i.e.,
DMARs over the entire size range) from profiles located
within a very short distance (i.e., 20–50 km) from the sources
www.clim-past.net/11/869/2015/ Clim. Past, 11, 869–903, 2015
876 S. Albani et al.: Twelve thousand years of dust
are not suited for providing a representative estimate of DF
over a broad spatial domain unless the spatial scale of interest
is very fine (Cook et al., 2013). This has substantial impli-
cations for climate models and reconstructions of the mass
balance of the global dust cycle in general because a mis-
interpretation of the significance of bulk DMARs can drive
large overestimation of DF (Albani et al., 2014).
On the other hand, it happens that sites located in close
proximity to the sources have the highest accumulation rates,
allowing for better chances of obtaining high-resolution pro-
files that are of great utility in paleoclimate reconstructions.
Thus, often some of the better-resolved sites, especially those
having an adequate time resolution to show variability during
the Holocene, tend to be close to the sources.
After the steep decline in bulk DMAR close to the source
areas, we can imagine the DF blanketing the surface of the
Earth, slowly decreasing as the distance from the source in-
creases but approximately homogeneous over a broad area
at a coarse enough spatial resolution (Fig. 3). In reality the
DMAR is highly dependent on the local landforms, both for
accumulation and preservation of the deposited dust (Stevens
and Lu, 2009). Thus loess deposited on escarpments facing
the wind direction may be favorable for an enhanced dust
deposition (Bowen and Lindley, 1977; Mason et al., 2003).
More often erosion is a major player, so that DMAR < DF.
Upland sites are generally considered more suitable geomor-
phological settings to recover well-preserved profiles of DF
(Derbyshire, 2003; Kohfeld and Harrison, 2003; Mason et
al., 2003; Muhs et al., 2003a). Field examination of the broad
area where a profile was studied may provide evidence of
erosion (Lu et al., 2006), i.e., if the horizon’s stratigraphy
is not widely reproduced regionally, but in some cases evi-
dence for erosion is only available via detailed independent
age models (Buylaert et al., 2008; Stevens et al., 2008). In ad-
dition, supporting data from other proxies in the profile, i.e.,
bio- or chemostratigraphy, can provide grounds for establish-
ing the degree of coherence of specific sections (Markovic et
al., 2011).
2.4 Other paleodust archives: lake sediments and peat
bogs
Beside loess–paleosol sequences other land archives carry
the potential to preserve dust stratigraphies: lakes and om-
brotrophic peat bogs. Both can be located at an opportune
medium-range distance between the source areas and the
more remote oceanic and polar sites. In addition, the preser-
vation of large amounts of organic matter involves the possi-
bility of high-resolution radiocarbon dating, which is of great
value especially for a period such as the Holocene (Muhs et
al., 2003b; Marx et al., 2009; Le Roux et al., 2012).
While diverse in nature, lakes and peat bogs also share
some common issues that generally need to be addressed
in order to provide reliable paleodust profiles: the possibil-
ity of quantitatively isolating remote from local dust deposi-
tion and the basin-scale representativeness of eolian DMARs
compared to DF.
In some circumstances (when fluvial inputs and rain out-
wash can be excluded), lake deposits can preserve reliable
dust stratigraphies, with little or no unconformities and rel-
atively abundant organic matter for radiocarbon dating (e.g.,
Muhs et al., 2003b). Maar lakes, developed in craters formed
by explosive excavations associated with phreatomagmatic
eruptions, are often an ideal setting when the mafic composi-
tion of the basin is substantially different than the mineralog-
ical and geochemical characteristics of the remotely origi-
nated dust. However, a major problem with lakes is the pos-
sibility of sediment focusing in the deeper parts of the basin,
which may substantially affect SBMAR. With one exception,
we were not able to retrieve adequate DMARs from lakes for
this compilation, mostly because of problems with either the
age model, or a reliable estimation of EC (Supplement).
In recent years substantial progress has been made in re-
covering dust profiles from ombrotrophic peats. The estima-
tion of SBMAR depends on the radiocarbon dating of the
organic matter. The EC is determined by the elemental com-
position of the residual ash after the combustion of the or-
ganic matter. The identification of an adequate proxy for dust
can be challenging (Kylander et al., 2013), so that several
approaches, including multi-proxy-based approaches, have
been suggested (Marx et al., 2009). Even more challenging
is a quantitative isolation of the local versus remote dust in-
put; this is also because of the lack of size distribution data
in most cases, although a few studies have provided good ap-
proaches (Marx et al., 2009; Le Roux et al., 2012). At this
stage, substantial uncertainties still exist in general in peat
bog dust records for one or more of the variables necessary
to determine a reliable quantitative estimate of dust MARs
relevant for medium- or long-range transport. Nonetheless,
we expect that in the near future this goal will be achieved
because of the fast progress of research in this field (e.g.,
Ferrat et al., 2011; Kylander et al., 2013; Marx et al., 2009;
McGowan et al., 2010; Le Roux et al., 2012; Sapkota et al.,
2007; De Vleeschouwer et al., 2012).
3 Methodology
The goal of this compilation is to provide a quality-controlled
data set with a specific reference to the possibility of deriv-
ing reliable quantitative time series of eolian DMAR relevant
to broad spatial scales. According to this principle and con-
sidering the specific characteristics of the different paleodust
archives, we performed an extensive literature review to iden-
tify records suitable for the study of dust variability within
the Holocene, encompassing the MH period ∼ 6 ka BP.
There is a spectrum of possible approaches for the compi-
lation of this kind of database, lying between two extremes:
a minimal collection of DMARs (e.g., similar to DIRTMAP;
Kohfeld and Harrison, 2001) and an extensive compilation
Clim. Past, 11, 869–903, 2015 www.clim-past.net/11/869/2015/

S. Albani et al.: Twelve thousand years of dust 877
including a wide variety of metadata (e.g., DIRTMAP3; Ma-
her et al., 2010). For this work, we lean towards the first
approach, although we include uncertainties and some ad-
ditional information, but stick to the age models from the
original studies (Appendix A).
The concise operational product of the database is a set
of dust MAR time series, with quantitative estimates of the
uncertainties associated with both the age and DMAR. Dust
MAR uncertainty quantified here is only associated with the
calculations; hence, it includes the analytical errors and the
uncertainty associated with assumptions or approximations
in the magnitude of specific variables. We express all quan-
titative uncertainties as 1σ deviation, assuming a Gaussian
distribution of the error. It will be expressed either in abso-
lute terms or as a relative error, as specified in each case.
This approach does not convey the overall uncertainty re-
lated, for instance, to a specific technique or to a specific
physical setting, which is difficult to express quantitatively.
For this reason we complement the data set with a categori-
cal attribution of the overall confidence on the reliability of
the records for the purposes of this work.
Note that a large part of the actual uncertainties associ-
ated with each record are related to what we include in the
attribution of the confidence level and that the estimates pro-
vided for the quantifiable uncertainty constitute a first-order
approximation.
In the following paragraphs we report the criteria fol-
lowed for site selection and attribution of a confidence level
(Sect. 3.1), and we provide a general description of the ap-
proach used to report or calculate the age profiles of eo-
lian DMAR, with relative uncertainties (Sects. 3.2 and 3.3),
and the information on the size distributions where available
(Sect. 3.4). More specific information for each record is re-
ported in the Supplement. In Sect. 3.5 we describe the ap-
proach to estimating the mass balance of the global dust cy-
cle throughout the Holocene with the CESM.
3.1 Site selection and attribution of confidence level
In an initial phase of scrutinizing the existing literature, we
identified paleodust records of interest to our project, based
on the requirements that they
(a) have potential for calculating DMAR (i.e., the dust frac-
tion must be identified and quantified in some way; no
records with only size information).
(b) have sufficient material within the Holocene to quantify
DMAR (i.e., at least three data points occur between
0 and 11.7 ka BP, with at least one data point between
4.5 and 7.5 ka BP; three data points means three ages
for loess–paleosol sequences where EC= 1 and three
values of dust MAR for all other cases).
(c) have absolute (i.e., numerical) ages (only for terrestrial
sediments).
(d) include size information (only for the loess–paleosol
records).
We identified 124 sites meeting these criteria. We then la-
beled each of those sites with a categorical attribution of the
overall confidence we have that each record provides a quan-
titative profile of eolian DMAR with respect to the age and
that it is relevant to broad spatial scales, based on general
consensus.
The attribution of the confidence level is based on whether
or not there are substantial or critical uncertainties with re-
spect to three aspects: (1) SBMAR (and confidence that
DMAR=DF); (2) EC; (3) quantitative distinction between
remote and local EC (see Supplement Table 1).
The first criterion is related to the chronology itself and/or
to linking the chronology to SBMAR. We consider some
types of dates more reliable than others in this context, de-
pending on the kind of natural archive. Among the less re-
liable, some we consider acceptable per se (“substantial un-
certainty”), while others we associate with a “critical uncer-
tainty”.
For marine sediments, we consider both absolute ages and
stratigraphic correlation with oxygen stacks, bearing in mind
that they are both acceptable in the case of records based on
thorium profiling, but only absolute ages are acceptable when
the isolation of the terrigenous fraction is the method of de-
termining EC.
For ice cores, we regard age models based on a combina-
tion of absolute counting, stratigraphic correlations, and ice
thinning modeling (e.g., Veres et al., 2013) with high confi-
dence. These models apply to most of the polar ice cores. On
the other hand, records from smaller ice caps and glaciers
suffer from the lack of reliable age models, i.e., ice accu-
mulation profiles, which cannot be resolved on Holocene
timescales at present (L. Thompson, P. Gabrielli, C. Zdanow-
icz, personal communication, 2014).
For terrestrial sediments, we only considered numerical
ages (OSL, 14C), in the initial scrutiny phase. This is im-
portant as, in the case of loess–paleosol sequences, distur-
bances such as erosion and reworking (and agricultural prac-
tices, when they are not limited to depths attributed to the
last ∼ 2.5 kyr) can disrupt the ideal correspondence between
dust MAR and DF (Sect. 2.3). We consider evidence of such
an occurrence as a critical uncertainty. In addition, we have
attempted to identify sites whose stratigraphies are consis-
tent regionally and therefore demonstrate that they are more
likely to represent large-scale patterns. Sites with stratigra-
phies that diverge substantially from standard regional pro-
files suggest that these records are not likely to represent
large-scale patterns in dust deposition, and this represents a
critical uncertainty. When no critical uncertainties are iden-
tified, we still consider that SBMAR estimates from loess–
paleosol sequences contain substantial uncertainty, accord-
ing to this criterion (1).
www.clim-past.net/11/869/2015/ Clim. Past, 11, 869–903, 2015

878 S. Albani et al.: Twelve thousand years of dustTa
ble
1.
List
of
the
record
sin
clud
edin
this
com
pilatio
n,
with
their
exact
locatio
n(co
ord
inates),
geo
grap
hical
localizatio
n(0
:A
laska;
1:
Green
land
;2
:n
orth
ernA
fricaan
dN
orth
Atlan
tic;3
:A
rabian
Sea;
4:
No
rthA
merica;
5:
easternA
siaan
dN
orth
Pacifi
c;6
:eq
uato
rialP
acific;
7:
So
uth
Atlan
tic;8
:A
ntarctica;
9:
Au
stralia),an
dth
ety
pe
of
natu
ralarch
ive.
We
alsorep
ort
the
availab
ilityo
fsize
distrib
utio
ns
or
sizeclasses
(“yes”
ifin
clud
edin
the
datab
ase)an
dth
ed
etailso
fth
eestim
ation
of
the
fin
e(<
10
µm
)fractio
n.R
eference
toth
eo
rigin
al
stud
iesis
pro
vid
edin
the
secon
dco
lum
nfro
mth
erig
ht.
Th
eco
lum
no
nth
efar
righ
trep
orts
the
details
of
how
the
percen
tage
of
DM
AR
<1
0µ
mw
ascalcu
lated,b
asedo
neith
erth
ed
ata
repo
rtedin
the
datab
ase(see
alsoS
ect.3
.5),
perso
nal
com
mu
nicatio
ns
from
the
auth
ors
of
the
orig
inal
stud
ies,o
rin
form
edassu
mp
tion
sb
asedo
nn
earby
ob
servatio
ns
asd
escribed
in
Alb
ani
etal.
(20
14
).
Site
Longitu
de
Latitu
de
Area
Arch
ive
Confi
den
ceS
izedistrib
utio
ns
Referen
ceE
olian
dust
MA
R
(deg
.E
)(d
eg.N
)lev
elor
classes%
<10
µm
ED
C123.3
5−
75.1
8ice
core
hig
hyes
Delm
onte
etal.
(2004)
from
sizedistrib
utio
ns
(Supplem
ent)
Vosto
k-B
H7
106.8
−78.4
78
iceco
rehig
hyes
Delm
onte
etal.
(2004)
from
sizedistrib
utio
ns
(Supplem
ent)
GIS
P2
322.3
772.5
81
iceco
rem
ediu
mno
May
ewsk
iet
al.al.(1
997)
assum
e100
%;
Steffen
sen(1
997);
Alb
ani
etal.
(2014)
EN
06601-0
038P
G339.5
02
4.9
18
2m
arine
core
hig
hno
Fran
çois
etal.
(1990)
assum
e50
%;
Ratm
eyer
etal.
(1999);
Alb
ani
etal.
(2014)
EN
06601-0
021P
G339.3
75
4.2
33
2m
arine
core
hig
hno
Fran
çois
etal.
(1990)
assum
e50
%;
Ratm
eyer
etal.
(1999);
Alb
ani
etal.
(2014)
EN
06601-0
029P
G340.2
38
2.4
62
marin
eco
rehig
hno
Fran
çois
etal.
(1990)
assum
e50
%;
Ratm
eyer
etal.
(1999);
Alb
ani
etal.
(2014)
OC
437-0
7-G
C27
349.3
730.8
82
marin
eco
rem
ediu
myes
McG
eeet
al.(2
013)
from
sizedistrib
utio
ns
(Supplem
ent)
OC
437-0
7-G
C37
344.8
82
26.8
16
2m
arine
core
hig
hyes
McG
eeet
al.(2
013)
from
sizedistrib
utio
ns
(Supplem
ent)
OC
437-0
7-G
C49
342.1
46
23.2
06
2m
arine
core
hig
hyes
McG
eeet
al.(2
013)
from
sizedistrib
utio
ns
(Supplem
ent)
OC
437-0
7-G
C66
342.1
419.9
44
2m
arine
core
med
ium
yes
McG
eeet
al.(2
013)
from
sizedistrib
utio
ns
(Supplem
ent)
OC
437-0
7-G
C68
342.7
18
19.3
63
2m
arine
core
hig
hyes
McG
eeet
al.(2
013)
from
sizedistrib
utio
ns
(Supplem
ent)
RC
24-1
2348.5
83
−3.0
12
marin
eco
rehig
hno
Brad
tmiller
etal.
(2006)
assum
e50
%;
Ratm
eyer
etal.
(1999);
Alb
ani
etal.
(2014)
RC
24-0
7348.0
83
−1.3
33
2m
arine
core
hig
hno
Brad
tmiller
etal.
(2006)
assum
e50
%;
Ratm
eyer
etal.
(1999);
Alb
ani
etal.
(2014)
RC
24-0
1346.3
50.5
52
marin
eco
rehig
hno
Brad
tmiller
etal.
(2006)
assum
e50
%;
Ratm
eyer
etal.
(1999);
Alb
ani
etal.
(2014)
V22-1
82
342.7
3−
0.5
32
marin
eco
rehig
hno
Brad
tmiller
etal.
(2006)
assum
e50
%;
Ratm
eyer
etal.
(1999);
Alb
ani
etal.
(2014)
V30-4
0336.8
5−
0.2
2m
arine
core
hig
hno
Brad
tmiller
etal.
(2006)
assum
e50
%;
Ratm
eyer
etal.
(1999);
Alb
ani
etal.
(2014)
PS
2498-1
345.1
8−
44.2
57
marin
eco
rem
ediu
mno
Anderso
net
al.(2
014)
assum
e100
%
RC
27-4
259.8
16.5
3m
arine
core
hig
hno
Pourm
and
etal.
(2007)
assum
e60
%;
Clem
ens
etal.
(1998);
Clem
ens
and
Prell
(1990);
Alb
ani
etal.
(2014)
93K
L64.2
223.5
83
marin
eco
rem
ediu
mno
Pourm
and
etal.
(2004)
assum
e60
%;
Clem
ens
etal.
(1998);
Clem
ens
and
Prell
(1990);
Alb
ani
etal.
(2014)
OD
P138-8
48B
-1H
-1249
−3
6m
arine
core
med
ium
no
McG
eeet
al.(2
007)
assum
e100
%
OD
P138-8
49A
-1H
-1249
06
marin
eco
rem
ediu
mno
McG
eeet
al.(2
007)
assum
e100
%
OD
P138-8
50A
-1H
-1249
16
marin
eco
rem
ediu
mno
McG
eeet
al.(2
007)
assum
e100
%
OD
P138-8
51E
-1H
-1249
36
marin
eco
rem
ediu
mno
McG
eeet
al.(2
007)
assum
e100
%
OD
P138-8
52A
-1H
-1250
56
marin
eco
rem
ediu
mno
McG
eeet
al.(2
007)
assum
e100
%
OD
P138-8
53B
-1H
-1250
76
marin
eco
rem
ediu
mno
McG
eeet
al.(2
007)
assum
e100
%
TT
013-P
C72
220
06
marin
eco
rehig
hno
Anderso
net
al.(2
006)
assum
e100
%
TT
013-M
C27
220
−3
6m
arine
core
hig
hno
Anderso
net
al.(2
006)
assum
e100
%
TT
013-M
C69
220
26
marin
eco
rehig
hno
Anderso
net
al.(2
006)
assum
e100
%
TT
013-M
C97
220
06
marin
eco
rehig
hno
Anderso
net
al.(2
006)
assum
e100
%
TT
013-M
C19
220
−1.8
6m
arine
core
hig
hno
Anderso
net
al.(2
006)
assum
e100
%
V28-2
03
180.5
80.9
56
marin
eco
rehig
hno
Brad
tmiller
etal.
(2007)
assum
e100
%
V21-1
46
163
38
5m
arine
core
med
ium
yes
Hovan
etal.
(1991)
from
sizedistrib
utio
ns
(Supplem
ent)
SO
-14-0
8-0
5118.3
8−
16.3
59
marin
eco
rem
ediu
mno
Hesse
and
McT
ainsh
(2003);
assum
e57
%;
Fitzsim
mons
etal.
(2013)
P.P.
Hesse,
perso
nal
com
municatio
n,2014
E26.1
168.3
3−
40.2
89
marin
eco
rem
ediu
myes
Hesse
(1994);
Fitzsim
mons
etal.
(2013)
from
sizedistrib
utio
ns
(Supplem
ent)
Zag
osk
in_L
ake
197.9
63
0lak
em
ediu
myes
Muhs
etal.
(2003b)
from
sizeclasses
(Supplem
ent):
clay%+
1/4
silt%
Chitin
a215.6
261.5
40
loess–
paleo
sol
med
ium
yes
Muhs
etal.
(2013b)
from
sizeclasses
(Supplem
ent):
clay%+
1/4
silt%
Luoch
uan
109.4
235.7
55
loess–
paleo
sol
med
ium
yes
Lu
etal.
(2013)
from
sizedistrib
utio
ns
(H.L
u,perso
nal
com
m.)
Jiuzh
outai
103.7
536.0
75
loess–
paleo
sol
med
ium
no
Kohfeld
and
Harriso
n(2
003)
assum
e23
%(M
aher
etal.,
2010)
Duow
a102.6
335.6
55
loess–
paleo
sol
med
ium
no
Roberts
etal.
(2001)
assum
e42
%:
clay%+
1/4
silt%
Beig
uoyuan
107.2
836.6
25
loess–
paleo
sol
med
ium
yes
Stev
ens
and
Lu
(2009)
from
sizedistrib
utio
ns
(Supplem
ent)
Xifen
g107.7
235.5
35
loess–
paleo
sol
med
ium
yes
Stev
ens
and
Lu
(2009)
from
sizedistrib
utio
ns
(Supplem
ent)
Jingyuan
104.6
36.3
55
loess–
paleo
sol
med
ium
yes
Sun
etal.
(2012)
from
sizedistrib
utio
ns
(Supplem
ent)
Wein
an109.5
834.4
35
loess–
paleo
sol
med
ium
yes
Kan
get
al.(2
013)
from
sizedistrib
utio
ns
(Supplem
ent)
OW
R258.5
840.5
4lo
ess–paleo
sol
med
ium
yes
Miao
etal.
(2007)
from
sizeclasses
(Supplem
ent):
clay%+
1/4
silt%
LR
C259.8
141.4
84
loess–
paleo
sol
med
ium
yes
Miao
etal.
(2007)
from
sizeclasses
(Supplem
ent):
clay%+
1/4
silt%
Clim. Past, 11, 869–903, 2015 www.clim-past.net/11/869/2015/
S. Albani et al.: Twelve thousand years of dust 879
The second criterion relates to the ability of a quantitative
determination of the EC.
For marine cores, we rely on the original and subsequent
authors’ evaluation of contamination, e.g., the possibility of
non-eolian inputs, such as from sediment focusing, volcanic,
fluvial, hemipelagic, and ice-rafted materials. Marine records
that are definitely or very likely to be affected by unac-
counted for non-eolian inputs are rated as having critical un-
certainty. These include sites in regions that have been iden-
tified as being affected by non-eolian inputs, such as the vol-
canic materials and ice-rafted detritus in the North Pacific
(Serno et al., 2014), volcanic inputs in the eastern equato-
rial Pacific (Olivarez et al., 1991), possible non-eolian detri-
tus in the western Pacific Ontong Java Plateau (Kawahata,
1999), or sediment focusing and ice-rafted debris (IRD) in
the Southern Ocean (Kohfeld and Harrison, 2001). When the
possible presence of non-eolian components is more specu-
lative, we attribute a substantial level of uncertainty. In ad-
dition, estimates of EC made using quartz concentrations or
elemental (e.g., Al) proxies were rated as having substantial
uncertainty. Records based on 232Th, the experimental isola-
tion of eolian components, or a differencing method (EC= 1
−CaCO3 − opal−Corganic) to determine EC were preferred.
For ice cores, primary non-eolian inputs to the insoluble
particle material are volcanic in origin and can usually be sin-
gled out and selectively removed from the records (Narcisi et
al., 2010). In some cases though, they may be a widespread
presence in a record (Gabrielli et al., 2014), which we con-
sider cause for the attribution of substantial uncertainty. We
consider particle counters the more robust methods for the
determination of EC. Uncalibrated (for the size) laser coun-
ters give unreliable results, as both the size distributions and
the EC may be significantly affected, which we consider a
critical uncertainty. Among the 124 records initially selected,
a few ice core records rely on calcium as a proxy for dust.
Subtleties include the fact that total calcium is a worse proxy
than non-sea-salt (nss) calcium and that calcium in general is
a better proxy in Greenland than in Antarctica because of the
proportions of crustal versus nss-Ca in the two cases, with
sea salt deposition 1 order of magnitude higher than dust in
Antarctica but much lower in Greenland (Ruth et al., 2002,
2008). We simply assume a substantial uncertainty for all
records based on calcium.
For terrestrial records, we attribute substantial uncertainty
to the presence of non-eolian inputs, as identified by authors.
We attribute substantial uncertainty when an elemental proxy
was used for the determination of EC rather than relying on
the sedimentation rate of the eolian sediment or the residual
fraction after the elimination of non-eolian inputs. A critical
uncertainty is attributed to the use of quartz as a quantitative
proxy for EC.
The third criterion focuses on the quantitative and size-
resolved separation of local versus remote dust.
This criterion in fact does not apply to loess–paleosol se-
quences, where instead we applied constraints on the ne-
cessity of size information. For the other types of natural
archives, all the other records that we found to be most likely
affected by unaccounted for local dust inputs are rated as hav-
ing critical uncertainty. When the possible presence of local
dust inputs is likely, but more speculative, we attribute a sub-
stantial level of uncertainty.
Records that meet all criteria are labeled with “high con-
fidence”, whereas failing to meet one criterion results in
a record receiving the attribution of “medium confidence”
level. A record is given a low level of confidence when either
(a) two or more aspects are considered to be affected by sub-
stantial uncertainty or (b) even just one aspect is considered
to be a critical uncertainty. We only included those records in
the compilation (45 out of 124) that have high and medium
confidence levels (Table 1; Supplement).
3.2 Ages and chronologies
All the ages reported in this compilation are expressed in
thousands of years before 1950 AD (ka BP). We do not re-
derive the age models for the records in this compilation but
use the original chronologies reported in the relevant publi-
cations. This is the case for all records included in this com-
pilation. The only exceptions are the case of the Antarctic ice
cores, which have been reported according to the AICC2012
chronology (Veres et al., 2013), and a specific approach for
loess–paleosol sequences described below.
In Sect. 3.1, we explained how loess–paleosol sequences
with a medium confidence level satisfy the condition of
being representative of large-scale patterns. This is based
on the possibility of grouping them within subregional set-
tings where sequences exhibit a common stratigraphy. These
groups should also account for spatial variability in the tim-
ing of the onset of climatic conditions that are linked to spe-
cific loess–paleosol subunits, e.g., on the CLP. When pos-
sible (i.e., for the records in the western CLP: Duowa and
Jiuzhoutai), we constructed SBMAR records for those sites,
based on selecting (or interpolating in the case of Duowa;
see Supplement) only the dates at the interface between
two consecutive subunits, in fact reflecting the alternation of
soil and loess subunits (S0.S1–S0.L1–S0.S2–S0.L2–S0.S3).
We consider this as a slightly conservative approach, which
has the advantage of (a) limiting potential abrupt fluctua-
tions in DMARs, which may just be reflecting dating errors
(e.g., related to bioturbation), and (b) pairing the records to
some extent, consistently with the criteria mentioned earlier.
Note that a similar approach was used for the two loess–
paleosol sequences from Nebraska included in this compila-
tion (Wauneta, Logan Roadcut). For Jingyuan and the central
CLP (Beiguoyuan, Xifeng, Luochuan, Weinan), no such dis-
tinction of subunits within the Holocene paleosol (S0) is vis-
ible; thus, the time series are based on all the available dates.
The same holds for the one single site in Alaska (Chitina).
In the previous section we discussed how either a linear or
a more sophisticated age model is used to determine a pro-
www.clim-past.net/11/869/2015/ Clim. Past, 11, 869–903, 2015
880 S. Albani et al.: Twelve thousand years of dust
file’s chronology. Each numeric age or tie point is character-
ized by some uncertainty. The nature and magnitude of the
error depend on the specific technique and include the analyt-
ical error, and the calibration or wiggle-matching error when
applicable. We try to estimate this type of uncertainty quan-
titatively. Unquantifiable uncertainties include the effects of
bioturbation, sample contamination, etc.
Age uncertainties that can be estimated arise from three
different processes: (1) experimental error in a measurement
(e.g., 14C, OSL); (2) calibration errors (e.g., 14C calibra-
tion software, OSL measurement in water content); (3) other
age-model uncertainties. For instance, radiocarbon dating re-
quires corrections to account for the carbon reservoir effect
(Brauer et al., 2014). Calibration software has been devel-
oped to perform this task (e.g., Bronk Ramsey, 1995; Reimer
et al., 2009). All radiocarbon ages reported in this paper are
calibrated, according to the original references.
In the case of age models more complicated than the sim-
ple linear relation used to derive an LSR, errors associated
with ages are usually reported in the publications. An ex-
ample of this are the new ice core chronologies, such as
AICC2012, which report the associated age uncertainties
(Veres et al., 2013).
For a linear sedimentation model, the age of a given depth
horizon is calculated by linear interpolation between two
dated horizons. In this case the age error of the samples
is bound to the uncertainties associated with the bracketing
ages. The age-model error of the sample can then be derived
through the error propagation formula:
εsample =
√ε2a + ε
2b, (1)
where εa and εb are the age errors of the two adjacent dated
points between which the linearly interpolated sample age
was calculated.
The other usual possibility is that the age model of a site
was determined without the help of any absolute age marker,
but just by using stratigraphic correlation. A typical example
of such an age model is one based on stratigraphic correla-
tion of a marine sediment core site’s δ18O profile with the
SPECMAP stack (Imbrie et al., 1984). In this case and in all
other circumstances where the age error is not reported, we
arbitrarily assume an uncertainty of 6.8 % (1σ , correspond-
ing to an overall 10 %).
3.3 Eolian dust MARs
Dust MARs constitute the key element of this compilation.
We previously discussed (Fig. 2) the nonparallel depth reso-
lution of the age samples and the EC samples. Unless stated
otherwise, we always use a chronology targeted at the final
DMAR resolution, which is determined ultimately by the EC
resolution (see also Fig. 1). The typical exceptions are loess–
paleosol sequences, where SR alone (hence the resolution of
the age samples) determines the dust MAR.
We report both the SBMAR (or SR and DBD) and EC for
each point in the records, with relative uncertainties. The un-
certainties are taken from the original sources when available
and assigned otherwise. The dust MAR uncertainty is deter-
mined from the relative uncertainties in the factors SBMAR
and EC, combined through the error propagation formula:
εMAR =
√(εSBMAR
µSBMAR
)2
+
(εEC
µEC
)2
, (2)
with εSBMAR/EC and µSBMAR/EC representing the absolute
errors and the absolute values, respectively.
In this compilation, there are two cases when SBMAR
is provided directly instead of being the combination of
SR ·DBD: ice cores and marine sediment records derived us-
ing the thorium profiling method. In the case of ice cores
SBMAR corresponds to the ice accumulation rate, expressed
in meters (water equivalent) per year, which incorporates in-
formation about ice density and thinning with depth (Alley,
2000; Veres et al., 2013). When it is not reported, we as-
sume that the relative uncertainty is the same as that of the
age uncertainty. This is a reasonable approximation for the
Holocene records from the ice cores presented here, but sig-
nificantly larger uncertainties related to ice thinning models
should be considered for deeper sections of ice cores and for
glacial stages (Kindler et al., 2014). For marine cores, we
consider the relative uncertainty in the thorium excess (xs-
Th) parameter. When it is not reported, we assumed a rela-
tive uncertainty of 5 %, assigned based on an expert informed
guess.
In all other cases, for SR we consider that the relative un-
certainty is the same as the age uncertainty, which again is
combined, through the error propagation formula with the
other uncertainties. DBD is sometimes measured but often
just assumed, based on the literature from the broader region.
When no information was reported in the original works, we
assumed a dry bulk density of 1.48 g cm−3 for the CLP (Ko-
hfeld and Harrison, 2003) and 1.45 g cm−3 for North Amer-
ica (Bettis III et al., 2003). When not measured, we assumed
a 15 % relative uncertainty for DBD (Kohfeld and Harrison,
2003).
With the exception of loess, for which we assume EC= 1
unless otherwise stated, EC is either expressed in terms of the
fraction or concentration of dust or a proxy in the bulk sedi-
ment. For the Antarctic ice cores considered in this compila-
tion, the EC is determined according to the volume dust con-
centrations determined by a Coulter counter; the mass con-
centration is calculated by multiplying the volume with the
assumed dust density of 2.5 g cm−3 (Delmonte et al., 2004).
The uncertainty in this case is taken from the standard de-
viation of the ∼ three replicate measurements. When a dust
proxy is used instead to determine the EC, its concentration is
divided by the element’s typical abundance in dust (or crustal
abundance). In this case the analytical uncertainty (if not re-
ported, we assume 5 %) is combined with the uncertainty of
Clim. Past, 11, 869–903, 2015 www.clim-past.net/11/869/2015/
S. Albani et al.: Twelve thousand years of dust 881
the dust proxy, i.e., the variability in its amount in dust. We
keep the proxy–dust relation from the original studies when
available.
Several records in this compilation use 232Th as a dust
proxy, for which we assume 10.7 ppm in dust (McGee et al.,
2007) if not specified otherwise in the original papers. We
always assumed 9.3 % uncertainty for 232Th as a dust proxy
(McGee et al., 2007) or a combined uncertainty of 15 %
when the analytical uncertainty was not available. In one case
(GISP2), we used calcium as a dust proxy (Mayewski et al.,
1997), assuming a variable calcium–dust relation in Green-
land with respect to changing climate conditions, resulting in
26 % calcium in dust (Ruth et al., 2002; Steffensen, 1997),
with an arbitrarily assigned uncertainty of 20 %.
When the isolation of the detrital component from the sed-
iment matrix is done by the removal of carbonates, opal, and
organic matter, then the EC can be estimated from the bulk
terrigenous component. We assume 5 % uncertainty in this
procedure.
We stress once again that the quantitative uncertainties es-
timated here do not fully represent the overall uncertainty of
a record, which should be considered in combination with
the confidence level (Table 1).
3.4 Dust grain size distributions
Here, we focus on the importance of the grain size informa-
tion and its close link to the DMAR. When possible, we re-
trieved the size distributions associated with the records in
this compilation. Depending on the technique used, the size
data was collected in the form of size distributions (e.g., by
particle counters and laser particle analyzer) or size classes
(using the sieve and pipette method), e.g., the percentages of
sand, silt, and clay (Muhs et al., 2013; Lu et al., 1999).
Despite the differences and uncertainties associated with
specific methods (Mahowald et al., 2014; Reid, 2003), we
include the available information according to the original
sources. In the case of size classes, we report the informa-
tion as provided in the original papers. In addition, we take
an innovative approach to organizing the size distribution
data. First of all, we carry the original size distributions to a
new, common binning in order to enhance the accessibility of
the data and to facilitate the intercomparison among records.
Second, we associate the size distributions with the DMAR
time series sample-to-sample where possible so that DMAR
time series for different size ranges can be easily determined.
The re-binning procedure to adapt the original size dis-
tributions from observations is organized in a series of steps:
(1) definition of a new binning model; (2) building the cumu-
lative distribution from the normalized observations; (3) fit-
ting a spline curve to the observation cumulative distribu-
tion; (4) integration of the fitted spline curve into the new
bins; (5) evaluation and summary of the fit of the new binned
data to the original observations. The fitting spline in (3) is
bounded to have values between 0 and 1 and to be monoton-
ically nondecreasing.
One challenge in finding a new binning model is to avoid
significant distortion to the original size distribution, given
that observations have both a different resolution and a dif-
ferent size range. A compromise is necessary to preserve
both the actual dust flux (i.e., a size range wide enough to
include most observations) and the shape of the distributions.
The preservation of the size distribution properties, i.e., the
mass partitioning across the size spectrum, requires an ad-
equate number of bins and adequate spacing. We adopted
a new bin model with n= 76 bins, spanning the interval
of particle diameters between 0.28 and 208.34 µm. The bin
spacing is defined by a monotonically increasing function:
y= 0.089 · x+ 0.002, where x is the nth bin center, y is
the (n+ 1)th bin center, and x0= 0.35 µm (first bin center).
Bin edges are calculated by linear interpolation, halfway be-
tween two consecutive bin centres. This binning model is
very similar to the instrumental size binning of, e.g., Mulitza
et al. (2010) or McGee et al. (2013), in the same size range.
For all samples subject to re-binning, visual inspection of the
original and new distributions as well as the production of
objective metrics (Supplement) were performed,.
All references to size in this work refer to the particle’s di-
ameter. We always refer to volume or mass size distributions,
both in the main text and the Supplement.
3.5 Modelling the global dust cycle
Paleodust records not only represent excellent climate prox-
ies, but they also offer the possibility to quantitatively con-
strain the mass balance (or magnitude) of the global dust
cycle. Here, we use a dust model to extrapolate the avail-
able data to allow global coverage for the deposition, as
well as estimates of sources, concentrations, and aerosol op-
tical depth using the Community Earth System Model (Al-
bani et al., 2014; Mahowald et al., 2006, 2011). To represent
the impact of climate variability during the Holocene on the
dust cycle, we chose two reference periods for our simula-
tions with the CESM: the MH (6 ka BP) and the preindus-
trial (1850 AD), which we assume to be representative for the
early and mid-Holocene (5–11 ka BP) and the late Holocene
(1–5 ka BP) respectively, based on the first-order differences
in orbital forcing and climate in the two periods (e.g., Wanner
et al., 2008). The initial conditions for the MH simulations
are taken from a fully coupled climate equilibrium simulation
for 6 ka BP (http://www.cesm.ucar.edu/experiments/cesm1.
0/#paleo), which follows the PMIP3 prescriptions for green-
house gas concentrations and orbital forcing, with preindus-
trial prescribed vegetation (Otto-Bliesner et al., 2009), and
which was part of the PMIP3–CMIP5 (Coupled Model In-
tercomparison Project Phase 5) model experiments for the
IPCC Fifth Assessment Report (AR5) (Masson-Delmotte et
al., 2013; Flato et al., 2013). For the preindustrial simulation
www.clim-past.net/11/869/2015/ Clim. Past, 11, 869–903, 2015
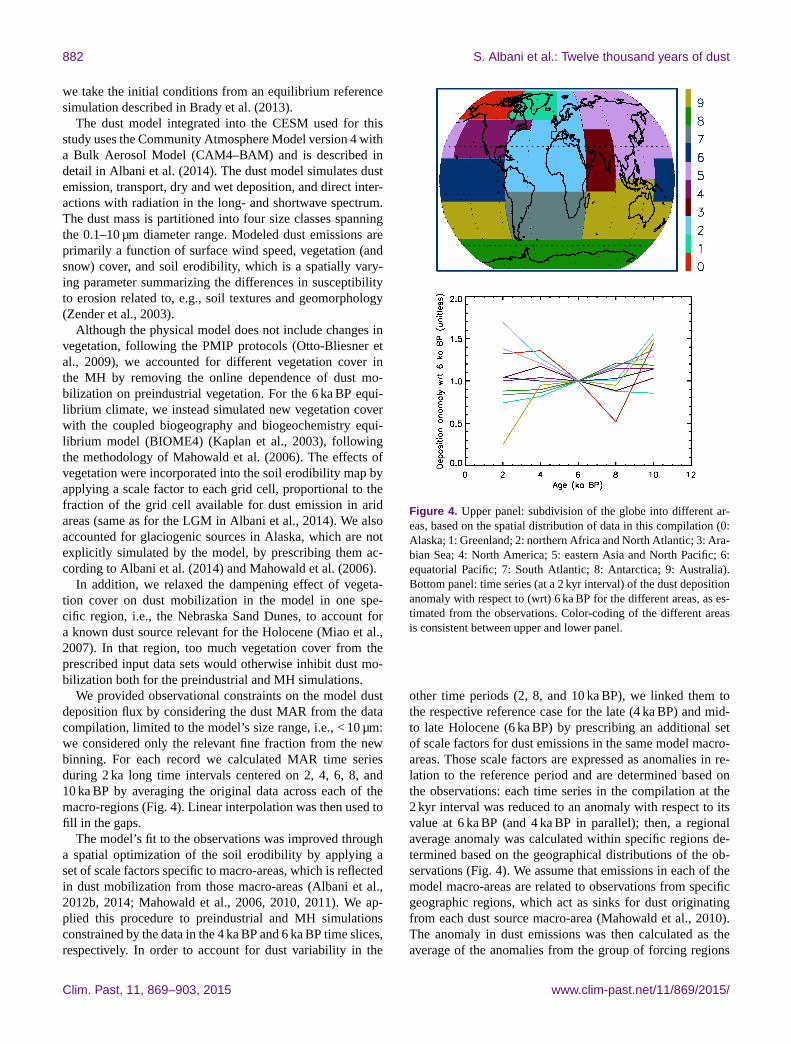
882 S. Albani et al.: Twelve thousand years of dust
we take the initial conditions from an equilibrium reference
simulation described in Brady et al. (2013).
The dust model integrated into the CESM used for this
study uses the Community Atmosphere Model version 4 with
a Bulk Aerosol Model (CAM4–BAM) and is described in
detail in Albani et al. (2014). The dust model simulates dust
emission, transport, dry and wet deposition, and direct inter-
actions with radiation in the long- and shortwave spectrum.
The dust mass is partitioned into four size classes spanning
the 0.1–10 µm diameter range. Modeled dust emissions are
primarily a function of surface wind speed, vegetation (and
snow) cover, and soil erodibility, which is a spatially vary-
ing parameter summarizing the differences in susceptibility
to erosion related to, e.g., soil textures and geomorphology
(Zender et al., 2003).
Although the physical model does not include changes in
vegetation, following the PMIP protocols (Otto-Bliesner et
al., 2009), we accounted for different vegetation cover in
the MH by removing the online dependence of dust mo-
bilization on preindustrial vegetation. For the 6 ka BP equi-
librium climate, we instead simulated new vegetation cover
with the coupled biogeography and biogeochemistry equi-
librium model (BIOME4) (Kaplan et al., 2003), following
the methodology of Mahowald et al. (2006). The effects of
vegetation were incorporated into the soil erodibility map by
applying a scale factor to each grid cell, proportional to the
fraction of the grid cell available for dust emission in arid
areas (same as for the LGM in Albani et al., 2014). We also
accounted for glaciogenic sources in Alaska, which are not
explicitly simulated by the model, by prescribing them ac-
cording to Albani et al. (2014) and Mahowald et al. (2006).
In addition, we relaxed the dampening effect of vegeta-
tion cover on dust mobilization in the model in one spe-
cific region, i.e., the Nebraska Sand Dunes, to account for
a known dust source relevant for the Holocene (Miao et al.,
2007). In that region, too much vegetation cover from the
prescribed input data sets would otherwise inhibit dust mo-
bilization both for the preindustrial and MH simulations.
We provided observational constraints on the model dust
deposition flux by considering the dust MAR from the data
compilation, limited to the model’s size range, i.e., < 10 µm:
we considered only the relevant fine fraction from the new
binning. For each record we calculated MAR time series
during 2 ka long time intervals centered on 2, 4, 6, 8, and
10 ka BP by averaging the original data across each of the
macro-regions (Fig. 4). Linear interpolation was then used to
fill in the gaps.
The model’s fit to the observations was improved through
a spatial optimization of the soil erodibility by applying a
set of scale factors specific to macro-areas, which is reflected
in dust mobilization from those macro-areas (Albani et al.,
2012b, 2014; Mahowald et al., 2006, 2010, 2011). We ap-
plied this procedure to preindustrial and MH simulations
constrained by the data in the 4 ka BP and 6 ka BP time slices,
respectively. In order to account for dust variability in the
Figure 4. Upper panel: subdivision of the globe into different ar-
eas, based on the spatial distribution of data in this compilation (0:
Alaska; 1: Greenland; 2: northern Africa and North Atlantic; 3: Ara-
bian Sea; 4: North America; 5: eastern Asia and North Pacific; 6:
equatorial Pacific; 7: South Atlantic; 8: Antarctica; 9: Australia).
Bottom panel: time series (at a 2 kyr interval) of the dust deposition
anomaly with respect to (wrt) 6 ka BP for the different areas, as es-
timated from the observations. Color-coding of the different areas
is consistent between upper and lower panel.
other time periods (2, 8, and 10 ka BP), we linked them to
the respective reference case for the late (4 ka BP) and mid-
to late Holocene (6 ka BP) by prescribing an additional set
of scale factors for dust emissions in the same model macro-
areas. Those scale factors are expressed as anomalies in re-
lation to the reference period and are determined based on
the observations: each time series in the compilation at the
2 kyr interval was reduced to an anomaly with respect to its
value at 6 ka BP (and 4 ka BP in parallel); then, a regional
average anomaly was calculated within specific regions de-
termined based on the geographical distributions of the ob-
servations (Fig. 4). We assume that emissions in each of the
model macro-areas are related to observations from specific
geographic regions, which act as sinks for dust originating
from each dust source macro-area (Mahowald et al., 2010).
The anomaly in dust emissions was then calculated as the
average of the anomalies from the group of forcing regions
Clim. Past, 11, 869–903, 2015 www.clim-past.net/11/869/2015/
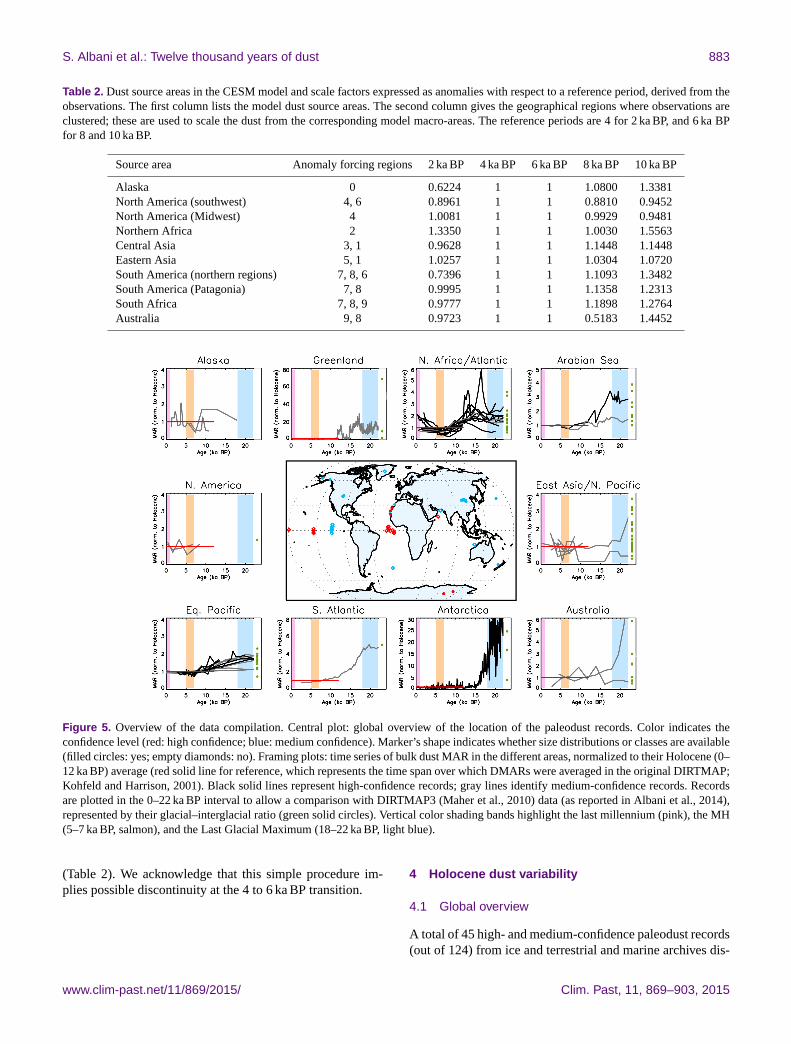
S. Albani et al.: Twelve thousand years of dust 883
Table 2. Dust source areas in the CESM model and scale factors expressed as anomalies with respect to a reference period, derived from the
observations. The first column lists the model dust source areas. The second column gives the geographical regions where observations are
clustered; these are used to scale the dust from the corresponding model macro-areas. The reference periods are 4 for 2 ka BP, and 6 ka BP
for 8 and 10 ka BP.
Source area Anomaly forcing regions 2 ka BP 4 ka BP 6 ka BP 8 ka BP 10 ka BP
Alaska 0 0.6224 1 1 1.0800 1.3381
North America (southwest) 4, 6 0.8961 1 1 0.8810 0.9452
North America (Midwest) 4 1.0081 1 1 0.9929 0.9481
Northern Africa 2 1.3350 1 1 1.0030 1.5563
Central Asia 3, 1 0.9628 1 1 1.1448 1.1448
Eastern Asia 5, 1 1.0257 1 1 1.0304 1.0720
South America (northern regions) 7, 8, 6 0.7396 1 1 1.1093 1.3482
South America (Patagonia) 7, 8 0.9995 1 1 1.1358 1.2313
South Africa 7, 8, 9 0.9777 1 1 1.1898 1.2764
Australia 9, 8 0.9723 1 1 0.5183 1.4452
Figure 5. Overview of the data compilation. Central plot: global overview of the location of the paleodust records. Color indicates the
confidence level (red: high confidence; blue: medium confidence). Marker’s shape indicates whether size distributions or classes are available
(filled circles: yes; empty diamonds: no). Framing plots: time series of bulk dust MAR in the different areas, normalized to their Holocene (0–
12 ka BP) average (red solid line for reference, which represents the time span over which DMARs were averaged in the original DIRTMAP;
Kohfeld and Harrison, 2001). Black solid lines represent high-confidence records; gray lines identify medium-confidence records. Records
are plotted in the 0–22 ka BP interval to allow a comparison with DIRTMAP3 (Maher et al., 2010) data (as reported in Albani et al., 2014),
represented by their glacial–interglacial ratio (green solid circles). Vertical color shading bands highlight the last millennium (pink), the MH
(5–7 ka BP, salmon), and the Last Glacial Maximum (18–22 ka BP, light blue).
(Table 2). We acknowledge that this simple procedure im-
plies possible discontinuity at the 4 to 6 ka BP transition.
4 Holocene dust variability
4.1 Global overview
A total of 45 high- and medium-confidence paleodust records
(out of 124) from ice and terrestrial and marine archives dis-
www.clim-past.net/11/869/2015/ Clim. Past, 11, 869–903, 2015

884 S. Albani et al.: Twelve thousand years of dust
tributed worldwide comprise the data compilation (Fig. 5).
It is noteworthy that, while in a few regions there is a rel-
ative abundance of observations (North Atlantic, equatorial
Pacific), there are few data from other parts of the world
(North Pacific, Southern Hemisphere) after the application
of filtering criteria.
The amplitude of bulk dust variability recorded from nat-
ural archives during the last 22 kyr relative to their Holocene
average allows a comparison with the DIRTMAP3 (Maher
et al., 2010) data with regard to the glacial–interglacial vari-
ability within several regions around the globe (Fig. 5).
Different regions show different patterns of variability dur-
ing the Holocene (e.g., the apparent low degree of variability
in the equatorial Pacific versus the mid-Holocene minimum
in the North African Margin), and even within certain regions
there may be significantly diverse trends, which will be dis-
cussed in more detail in the following sections.
4.2 Northern Africa and North Atlantic
The most striking display of variability during the Holocene
is shown by the cores from the northwestern African Mar-
gin (5 records), with an amplitude comparable to glacial–
interglacial variability (Fig. 5) (Adkins et al., 2006; McGee et
al., 2013). As first suggested by deMenocal et al. (2000), this
would be a clear mark of the significant changes in the cli-
matic conditions in northern Africa between the wetter early
to mid-Holocene compared to the drier late glacial and late
Holocene. During the so called “African Humid Period” in
the early to mid-Holocene, greening of the Sahara occurred,
i.e., changes in vegetation in response to increased humid-
ity and precipitation, as seen in pollen records and lake level
changes (e.g., Hoelzmann et al., 1998; Jolly et al., 1998;
Street-Perrott and Perrott, 1993). The cause of these changes
has been identified as an enhanced summer monsoon, driven
by changes in orbital forcing, sea surface temperature, and
vegetation (e.g., Braconnot et al., 2007; Claussen et al., 1999;
Kutzbach and Liu, 1997).
Figure 6 shows the large range of values (spanning 2 or-
ders of magnitude) encompassed by the DMAR estimates
from marine sediment cores to the west of the African coast.
Records from the equatorial Atlantic (lower temporal resolu-
tion) tend to show decreasing trends from the early to mid-
Holocene, with little or no variability afterwards (Bradtmiller
et al., 2007; François et al., 1990), compared to the sites
on the northwestern African Margin (higher temporal reso-
lution) that show a minimum in DMAR in the ∼ 5–9 ka BP
period (McGee et al., 2013).
The absolute values of bulk DMARs (dotted lines) are
higher for the sites close to the coast of northwestern Africa
(bluish colors) compared to the sites in the equatorial At-
lantic (reddish and greenish tones). When considering only
the fine fraction (< 10 µm: solid lines), three (out of five)
records from the northwestern African Margin are compa-
rable in magnitude to those in the equatorial Atlantic, at least
Figure 6. Detailed view of the dust records in the northern Africa–
North Atlantic region. Upper panel: geographical location of the pa-
leodust records. Bottom panel: time series of the bulk (dotted lines)
and “fine”, i.e., < 10 µm (solid lines), dust MARs. Color-coding is
consistent between upper and lower panel. Vertical grey solid lines
mark the subperiods within the Holocene as described in Sect. 3.4 at
an interval of 2 kyr. Please refer to the descriptive sheets in the Sup-
plement for a graphical display of the uncertainties for each record.
for the early to mid-Holocene, although they tend to be larger
in the late Holocene. On the other hand, two of the records
display very low values of DMARs, lower than the records
from the equatorial Atlantic, and are comparable to the equa-
torial Pacific.
Core top bulk dust MARs from northwestern African Mar-
gin cores match very well with modern sediment trap data
(Ratmeyer et al., 1999). On the other hand there is sub-
stantial uncertainty in the attribution of the fine fractions,
with records in the equatorial Atlantic loosely constrained
by present-day sediment trap data from the Cape Verde area
(Ratmeyer et al., 1999) and size data for the northwestern
African Margin based on actual measurements from sedi-
ment samples but relying on end-member modeling for the
separation between riverine and eolian inputs (McGee et al.,
2013).
This compilation and comparison suggests that there is
still a substantial knowledge gap in the area and ample space
Clim. Past, 11, 869–903, 2015 www.clim-past.net/11/869/2015/

S. Albani et al.: Twelve thousand years of dust 885
to debate the causes of the differences in magnitude and
trends between the records from the northwestern African
Margin and the equatorial Atlantic. For instance, there could
be differences related to shifts in the position of the ITCZ
in relation to the dust plume or related to differences in the
interpretation of the data, in particular with reference to the
grain size distributions and potential non-eolian components;
this would have implications for the spatial representative-
ness of the records.
4.3 Arabian Sea
Marine sediments from the Arabian Sea are of great value, as
they provide a rare opportunity to gather information about
past dust variability from the Middle East and central Asia,
about which little is known despite this arid belt being one of
the major dust sources worldwide (Prospero et al., 2002). The
most relevant climatic feature in the region is the seasonality
related to the onset of the southwestern Indian monsoon. The
largest dust activity in the region is from summer dust emis-
sions from Mesopotamia and the Arabian Peninsula, which
are thought to constitute the major dust sources at present for
the Arabian Sea, although contributions from Somalia and
Iran and Pakistan may be important (Prospero et al., 2002).
We report data from the cores RC-27-42 and 93KL, recov-
ered from the central Arabian Sea (Pourmand et al., 2007)
and the Little Murray Ridge in the northeast (Pourmand et
al., 2004), respectively. There are no clear common trends
between the two records, which indeed show very different
DMARs, 1 order of magnitude apart (Fig. 7). There is little
information to explain the difference in magnitude, which is
perhaps related to different sources, although possible fluvial
inputs to 93KL cannot be conclusively ruled out. There is
clear evidence that dust grains larger than 10 µm are present
in the Arabian Sea sediments (Clemens and Prell, 1990;
Clemens, 1998; Sirocko et al., 1991). The fine-fraction ra-
tio for the two records is a rough approximation common to
both records (Table 1).
4.4 North America
Evidence of dust deposition and accumulation during the
Holocene in North America is widespread and mainly linked
to loess deposits in the mid-continent (Bignell loess), partic-
ularly in Nebraska (Mason et al., 2003; Miao et al., 2007),
Kansas (Feng et al., 1994), North Dakota (Mason et al.,
2008), and eastern Colorado (Muhs et al., 1999; Pigati et al.,
2013). Most areas are characterized by relatively low thick-
ness, so that low temporal resolution does not allow assess-
ing Holocene variability, with the exception of a few sites in
Nebraska (Miao et al., 2007).
Unlike the other areas where loess origin is related to lo-
cal river systems, loess deposits in Nebraska have their im-
mediate sources in the extensive dune fields to the northwest.
Changes in the climatic conditions affecting vegetation cover
Figure 7. Same as Fig. 6 but for the Arabian Sea region.
have the potential to loosen or stabilize the dunes, altering
their potential as dust sources (Miao et al., 2007).
Well-studied sites at Wauneta have very high temporal res-
olution due to the high DMARs and allowed the identifica-
tion of different phases of dust accumulation and pedogen-
esis during the Holocene. The high accumulation rates are
related to the location, on the edge of tableland escarpments
facing the immediate source areas of the dust. The accumu-
lation rate drops off drastically in the downwind direction
from these sites; for example, the ∼ 6 m of Holocene loess
in the Old Wauneta Section thins to a little over 1 m within a
few hundred meters downwind, where a rather uniform loess
mantle covers the upland sites (Jacobs and Mason, 2007; Ma-
son et al., 2003). Another site to the northeast (Logan Road-
cut) shows lower bulk DMAR but similar phasing, associated
with the sequence of pedostratigraphic horizons (Miao et al.,
2007). When accounting for the size information, i.e., when
focusing on the fine-fraction DMARs, both the absolute val-
ues of DMAR drastically decrease and become comparable
in magnitude (Fig. 8). This suggests that the fine-fraction
DMARs (rather than bulk DMAR) can be considered more
representative of accumulation rates over large areas.
4.5 Alaska
Dust activity in Alaska has been reported for both the present
day (Crusius et al., 2011) and the past, in glacial and in-
www.clim-past.net/11/869/2015/ Clim. Past, 11, 869–903, 2015
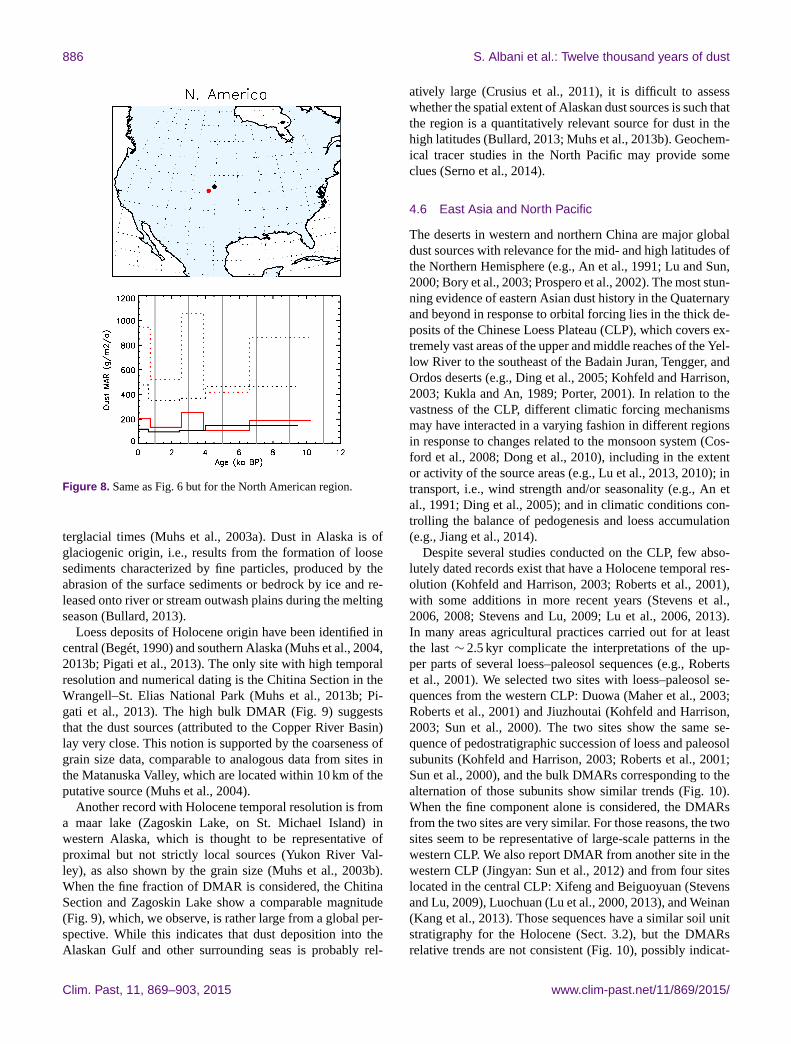
886 S. Albani et al.: Twelve thousand years of dust
Figure 8. Same as Fig. 6 but for the North American region.
terglacial times (Muhs et al., 2003a). Dust in Alaska is of
glaciogenic origin, i.e., results from the formation of loose
sediments characterized by fine particles, produced by the
abrasion of the surface sediments or bedrock by ice and re-
leased onto river or stream outwash plains during the melting
season (Bullard, 2013).
Loess deposits of Holocene origin have been identified in
central (Begét, 1990) and southern Alaska (Muhs et al., 2004,
2013b; Pigati et al., 2013). The only site with high temporal
resolution and numerical dating is the Chitina Section in the
Wrangell–St. Elias National Park (Muhs et al., 2013b; Pi-
gati et al., 2013). The high bulk DMAR (Fig. 9) suggests
that the dust sources (attributed to the Copper River Basin)
lay very close. This notion is supported by the coarseness of
grain size data, comparable to analogous data from sites in
the Matanuska Valley, which are located within 10 km of the
putative source (Muhs et al., 2004).
Another record with Holocene temporal resolution is from
a maar lake (Zagoskin Lake, on St. Michael Island) in
western Alaska, which is thought to be representative of
proximal but not strictly local sources (Yukon River Val-
ley), as also shown by the grain size (Muhs et al., 2003b).
When the fine fraction of DMAR is considered, the Chitina
Section and Zagoskin Lake show a comparable magnitude
(Fig. 9), which, we observe, is rather large from a global per-
spective. While this indicates that dust deposition into the
Alaskan Gulf and other surrounding seas is probably rel-
atively large (Crusius et al., 2011), it is difficult to assess
whether the spatial extent of Alaskan dust sources is such that
the region is a quantitatively relevant source for dust in the
high latitudes (Bullard, 2013; Muhs et al., 2013b). Geochem-
ical tracer studies in the North Pacific may provide some
clues (Serno et al., 2014).
4.6 East Asia and North Pacific
The deserts in western and northern China are major global
dust sources with relevance for the mid- and high latitudes of
the Northern Hemisphere (e.g., An et al., 1991; Lu and Sun,
2000; Bory et al., 2003; Prospero et al., 2002). The most stun-
ning evidence of eastern Asian dust history in the Quaternary
and beyond in response to orbital forcing lies in the thick de-
posits of the Chinese Loess Plateau (CLP), which covers ex-
tremely vast areas of the upper and middle reaches of the Yel-
low River to the southeast of the Badain Juran, Tengger, and
Ordos deserts (e.g., Ding et al., 2005; Kohfeld and Harrison,
2003; Kukla and An, 1989; Porter, 2001). In relation to the
vastness of the CLP, different climatic forcing mechanisms
may have interacted in a varying fashion in different regions
in response to changes related to the monsoon system (Cos-
ford et al., 2008; Dong et al., 2010), including in the extent
or activity of the source areas (e.g., Lu et al., 2013, 2010); in
transport, i.e., wind strength and/or seasonality (e.g., An et
al., 1991; Ding et al., 2005); and in climatic conditions con-
trolling the balance of pedogenesis and loess accumulation
(e.g., Jiang et al., 2014).
Despite several studies conducted on the CLP, few abso-
lutely dated records exist that have a Holocene temporal res-
olution (Kohfeld and Harrison, 2003; Roberts et al., 2001),
with some additions in more recent years (Stevens et al.,
2006, 2008; Stevens and Lu, 2009; Lu et al., 2006, 2013).
In many areas agricultural practices carried out for at least
the last ∼ 2.5 kyr complicate the interpretations of the up-
per parts of several loess–paleosol sequences (e.g., Roberts
et al., 2001). We selected two sites with loess–paleosol se-
quences from the western CLP: Duowa (Maher et al., 2003;
Roberts et al., 2001) and Jiuzhoutai (Kohfeld and Harrison,
2003; Sun et al., 2000). The two sites show the same se-
quence of pedostratigraphic succession of loess and paleosol
subunits (Kohfeld and Harrison, 2003; Roberts et al., 2001;
Sun et al., 2000), and the bulk DMARs corresponding to the
alternation of those subunits show similar trends (Fig. 10).
When the fine component alone is considered, the DMARs
from the two sites are very similar. For those reasons, the two
sites seem to be representative of large-scale patterns in the
western CLP. We also report DMAR from another site in the
western CLP (Jingyan: Sun et al., 2012) and from four sites
located in the central CLP: Xifeng and Beiguoyuan (Stevens
and Lu, 2009), Luochuan (Lu et al., 2000, 2013), and Weinan
(Kang et al., 2013). Those sequences have a similar soil unit
stratigraphy for the Holocene (Sect. 3.2), but the DMARs
relative trends are not consistent (Fig. 10), possibly indicat-
Clim. Past, 11, 869–903, 2015 www.clim-past.net/11/869/2015/

S. Albani et al.: Twelve thousand years of dust 887
Figure 9. Same as Fig. 6 but for Alaska.
ing that local effects may have a more diffuse influence on
DMARs at the central CLP sites. The central sites show a
more uniform stratigraphy during the Holocene (prevalence
of pedogenesis) with respect to the sites in the western CLP,
possibly indicating a stronger influence of the summer mon-
soon.
Dust plumes emanating from Asian deserts provide dust
inputs to the North Pacific Ocean (Rea, 1994), but because
of low sedimentation rates and the lack of carbonate-rich
sediments, the information from records with temporally re-
solved Holocene data is very limited. We show one record
from core V21-146 (Hovan et al., 1991) which exhibits rela-
tively little variability during the Holocene.
4.7 Greenland
Ice core records from Greenland are among the best tempo-
rally resolved paleoclimate proxies. They show the sharpest
and largest-amplitude oscillations observed in paleodust
records worldwide, following the trends exhibited by the
other proxies such as, e.g., δ18O, in the alternation of sta-
dial and interstadial phases during the last glacial period and
the deglaciation (Fuhrer et al., 1999; Mayewski et al., 1997;
Ruth et al., 2003; Steffensen et al., 2008).
Among the ice cores drilled in Greenland, only one has
a full Holocene dust record: GISP2 (Mayewski et al., 1997;
Zdanowicz et al., 2000; Zielinski and Mershon, 1997); for
Figure 10. Same as Fig. 6 but for eastern Asia and the North Pacific
Ocean.
this core we considered the calcium record as a proxy for dust
(Mayewski et al., 1997). Compared to the large variability in
the glacial period, the Holocene dust MAR is rather flat, but a
closer inspection shows an increasing trend from the early to
the mid-Holocene, followed by a declining trend in the late
Holocene and a rise during the last millennium (Fig. 11).
It is not clear whether dust variability during the Holocene
at GISP2 is related to (1) changes in the dust sources, which
are thought to be in central and eastern Asia (e.g., Bory et
al., 2003), (2) the atmospheric circulation, which did indeed
play a major role during the sharp glacial climate transi-
tions (Mayewski et al., 2014; Meeker and Mayewski, 2002;
Steffensen et al., 2008), or (3) changes in deposition mech-
anisms, which were suggested to be important on glacial–
interglacial timescales but may be of minor relevance dur-
ing the Holocene when accumulation rates are thought to be
rather stable (Unnerstad and Hansson, 2001). New studies
spanning the Holocene perhaps using dust MARs from parti-
cle counters at other sites may help understand whether this
is a consistent feature of dust deposition in Greenland.
4.8 Equatorial Pacific
The equatorial Pacific Ocean is one of the most remote re-
gions in the world. It is characterized by low dust deposi-
tion, correlated with global ice volume and dust in Antarc-
www.clim-past.net/11/869/2015/ Clim. Past, 11, 869–903, 2015
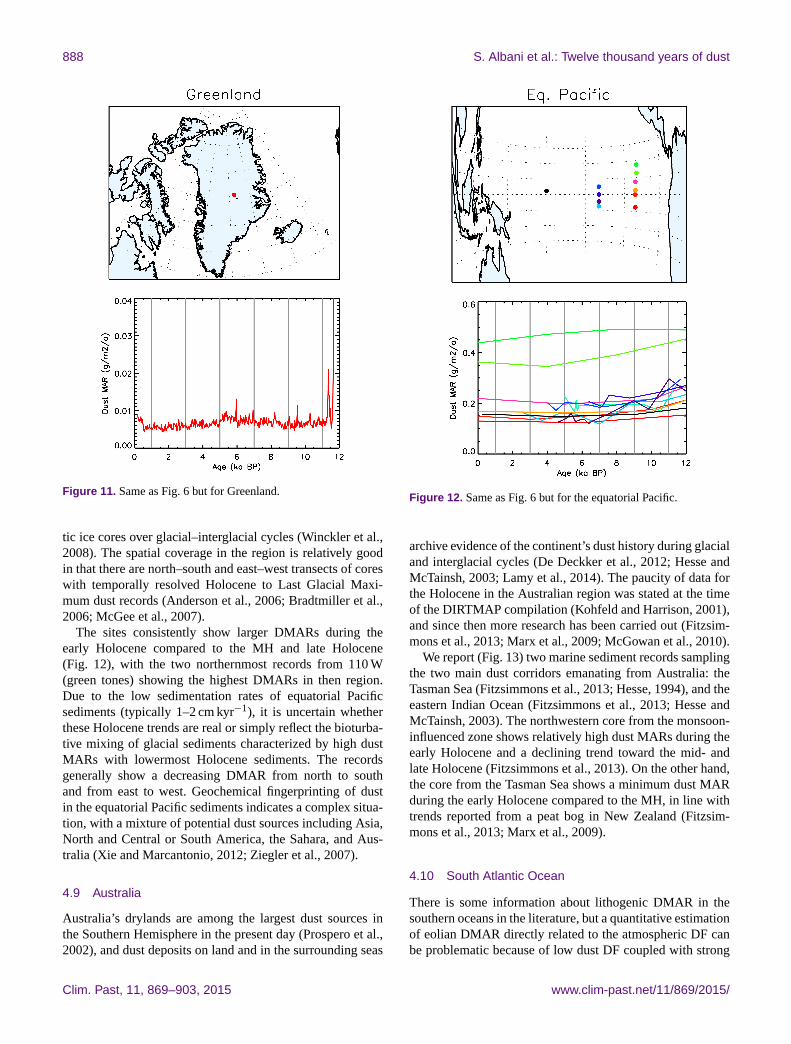
888 S. Albani et al.: Twelve thousand years of dust
Figure 11. Same as Fig. 6 but for Greenland.
tic ice cores over glacial–interglacial cycles (Winckler et al.,
2008). The spatial coverage in the region is relatively good
in that there are north–south and east–west transects of cores
with temporally resolved Holocene to Last Glacial Maxi-
mum dust records (Anderson et al., 2006; Bradtmiller et al.,
2006; McGee et al., 2007).
The sites consistently show larger DMARs during the
early Holocene compared to the MH and late Holocene
(Fig. 12), with the two northernmost records from 110 W
(green tones) showing the highest DMARs in then region.
Due to the low sedimentation rates of equatorial Pacific
sediments (typically 1–2 cm kyr−1), it is uncertain whether
these Holocene trends are real or simply reflect the bioturba-
tive mixing of glacial sediments characterized by high dust
MARs with lowermost Holocene sediments. The records
generally show a decreasing DMAR from north to south
and from east to west. Geochemical fingerprinting of dust
in the equatorial Pacific sediments indicates a complex situa-
tion, with a mixture of potential dust sources including Asia,
North and Central or South America, the Sahara, and Aus-
tralia (Xie and Marcantonio, 2012; Ziegler et al., 2007).
4.9 Australia
Australia’s drylands are among the largest dust sources in
the Southern Hemisphere in the present day (Prospero et al.,
2002), and dust deposits on land and in the surrounding seas
Figure 12. Same as Fig. 6 but for the equatorial Pacific.
archive evidence of the continent’s dust history during glacial
and interglacial cycles (De Deckker et al., 2012; Hesse and
McTainsh, 2003; Lamy et al., 2014). The paucity of data for
the Holocene in the Australian region was stated at the time
of the DIRTMAP compilation (Kohfeld and Harrison, 2001),
and since then more research has been carried out (Fitzsim-
mons et al., 2013; Marx et al., 2009; McGowan et al., 2010).
We report (Fig. 13) two marine sediment records sampling
the two main dust corridors emanating from Australia: the
Tasman Sea (Fitzsimmons et al., 2013; Hesse, 1994), and the
eastern Indian Ocean (Fitzsimmons et al., 2013; Hesse and
McTainsh, 2003). The northwestern core from the monsoon-
influenced zone shows relatively high dust MARs during the
early Holocene and a declining trend toward the mid- and
late Holocene (Fitzsimmons et al., 2013). On the other hand,
the core from the Tasman Sea shows a minimum dust MAR
during the early Holocene compared to the MH, in line with
trends reported from a peat bog in New Zealand (Fitzsim-
mons et al., 2013; Marx et al., 2009).
4.10 South Atlantic Ocean
There is some information about lithogenic DMAR in the
southern oceans in the literature, but a quantitative estimation
of eolian DMAR directly related to the atmospheric DF can
be problematic because of low dust DF coupled with strong
Clim. Past, 11, 869–903, 2015 www.clim-past.net/11/869/2015/

S. Albani et al.: Twelve thousand years of dust 889
sediment redistribution by currents and the input of non-
eolian material carried by floating icebergs, i.e., ice-rafted
debris (e.g., Kohfeld et al., 2013; Bradtmiller et al., 2009).
Nonetheless, a few studies exploiting the thorium profiling
method attempted to correct SBMAR for sediment redistri-
bution, providing new data (Anderson et al., 2014; Lamy et
al., 2014).
In particular the dust record from core PS2498-1 recov-
ered from the Mid-Atlantic Ridge in the sub-Antarctic South
Atlantic Ocean (Anderson et al., 2014) is characterized by a
high temporal resolution during the Holocene (Fig. 14). The
dust, whose source is hypothesized to be from South Amer-
ica, shows a marked declining trend during the Holocene,
with late Holocene values a factor of ∼ 2 lower than those
found in the early Holocene.
4.11 Antarctica
Ice core records from the East Antarctic Plateau (Delmonte
et al., 2004; Lambert et al., 2008) represent high-quality dust
records in terms of temporal resolution, reliability of the age
model (Veres et al., 2013), isolation of the eolian component
and measure of its size distribution (Delmonte et al., 2004,
2013), identification of remote sources (Albani et al., 2012b;
Delmonte et al., 2010b), and broadscale spatial representa-
tiveness (Mahowald et al., 2011). Similar to Greenland, the
Holocene dust MAR in the East Antarctic Plateau shows lit-
tle variability compared to the large glacial–interglacial and
stadial–interstadial variations.
Both records considered in this study, EPICA (European
Project for Ice Coring in Antarctica) Dome C (EDC) and
Vostok-BH7 (Delmonte et al., 2004; Lambert et al., 2008),
show a slightly declining trend in dust MAR throughout the
Holocene, superimposed on large variability (Lambert et al.,
2012) (Fig. 15). Some deglaciated areas and nunataks at the
edges of the ice sheets are prone to act as dust sources (Bory
et al., 2010; Bullard, 2013; Chewings et al., 2014; Delmonte
et al., 2010b, 2013). In such a remote environment, even
small amounts of local dust can give a relevant contribution
to the dust budget of ice cores, e.g., TALDICE (Albani et al.,
2012a; Delmonte et al., 2010b). Because dust from Antarc-
tic sources does not travel in significant amounts to the in-
terior of the East Antarctic Plateau (Delmonte et al., 2013),
it is unlikely that the declining Holocene DMARs at Vostok
and Dome C are related to the large variations seen in the
TALDICE record (Albani et al., 2012a).
Possible explanations may be related to the interplay of the
contributions from different dust source from South America
and Australia (Albani et al., 2012b; Delmonte et al., 2010b)
and atmospheric circulation changes.
Figure 13. Same as Fig. 6, the Australian region.
4.12 Mass balance of the global dust cycle throughout
the Holocene
A detailed comparison of modeled and observed dust depo-
sition (< 10 µm) for 6 ka BP (5–7 ka BP interval) is shown in
Fig. 16 (see the Supplement for the other time periods and the
dominant sources). The modeled deposition is generally con-
sistent with the observations of dust MAR spanning 6 orders
of magnitude, within a factor of 10, similar to previous stud-
ies (Albani et al., 2014; Mahowald et al., 2006). Nonetheless,
there are a few notable outliers.
While modeled deposition in the equatorial Atlantic is
very well reproduced, observations of DMAR in the north-
western African Margin appear to suggest overestimation by
the model for some sites in that region. There are several
possible (perhaps concurrent) explanations worth consider-
ing. First of all, the model may not be able to represent ade-
quately the spatial distribution of dust sources within north-
ern Africa, resulting in a different localization of the dust
plume and hence a different north–south gradient in the dust
deposition. On the other hand, it is possible that some incon-
sistencies exist among observations, due to different method-
ological approaches, as discussed in Sect. 4.2. From a global
perspective, there is an interesting aspect emerging from the
data in Fig. 16, which may support this argument. The obser-
vational DMARs in some of the North African Margin cores
www.clim-past.net/11/869/2015/ Clim. Past, 11, 869–903, 2015
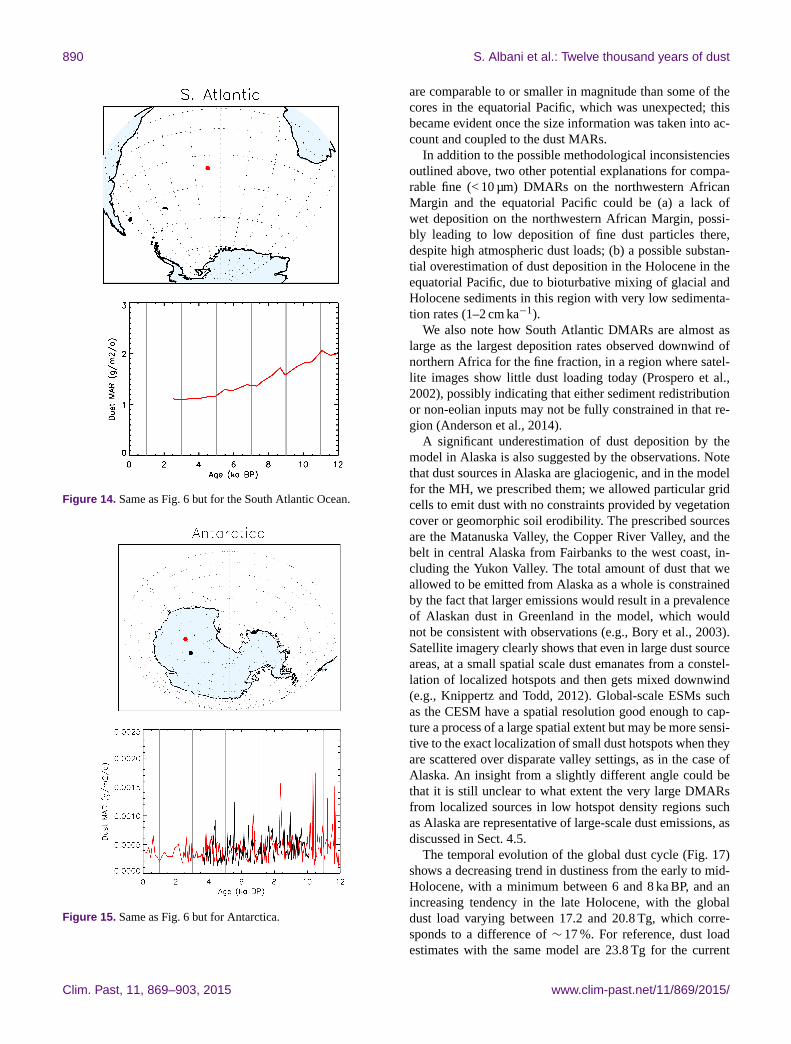
890 S. Albani et al.: Twelve thousand years of dust
Figure 14. Same as Fig. 6 but for the South Atlantic Ocean.
Figure 15. Same as Fig. 6 but for Antarctica.
are comparable to or smaller in magnitude than some of the
cores in the equatorial Pacific, which was unexpected; this
became evident once the size information was taken into ac-
count and coupled to the dust MARs.
In addition to the possible methodological inconsistencies
outlined above, two other potential explanations for compa-
rable fine (< 10 µm) DMARs on the northwestern African
Margin and the equatorial Pacific could be (a) a lack of
wet deposition on the northwestern African Margin, possi-
bly leading to low deposition of fine dust particles there,
despite high atmospheric dust loads; (b) a possible substan-
tial overestimation of dust deposition in the Holocene in the
equatorial Pacific, due to bioturbative mixing of glacial and
Holocene sediments in this region with very low sedimenta-
tion rates (1–2 cm ka−1).
We also note how South Atlantic DMARs are almost as
large as the largest deposition rates observed downwind of
northern Africa for the fine fraction, in a region where satel-
lite images show little dust loading today (Prospero et al.,
2002), possibly indicating that either sediment redistribution
or non-eolian inputs may not be fully constrained in that re-
gion (Anderson et al., 2014).
A significant underestimation of dust deposition by the
model in Alaska is also suggested by the observations. Note
that dust sources in Alaska are glaciogenic, and in the model
for the MH, we prescribed them; we allowed particular grid
cells to emit dust with no constraints provided by vegetation
cover or geomorphic soil erodibility. The prescribed sources
are the Matanuska Valley, the Copper River Valley, and the
belt in central Alaska from Fairbanks to the west coast, in-
cluding the Yukon Valley. The total amount of dust that we
allowed to be emitted from Alaska as a whole is constrained
by the fact that larger emissions would result in a prevalence
of Alaskan dust in Greenland in the model, which would
not be consistent with observations (e.g., Bory et al., 2003).
Satellite imagery clearly shows that even in large dust source
areas, at a small spatial scale dust emanates from a constel-
lation of localized hotspots and then gets mixed downwind
(e.g., Knippertz and Todd, 2012). Global-scale ESMs such
as the CESM have a spatial resolution good enough to cap-
ture a process of a large spatial extent but may be more sensi-
tive to the exact localization of small dust hotspots when they
are scattered over disparate valley settings, as in the case of
Alaska. An insight from a slightly different angle could be
that it is still unclear to what extent the very large DMARs
from localized sources in low hotspot density regions such
as Alaska are representative of large-scale dust emissions, as
discussed in Sect. 4.5.
The temporal evolution of the global dust cycle (Fig. 17)
shows a decreasing trend in dustiness from the early to mid-
Holocene, with a minimum between 6 and 8 ka BP, and an
increasing tendency in the late Holocene, with the global
dust load varying between 17.2 and 20.8 Tg, which corre-
sponds to a difference of ∼ 17 %. For reference, dust load
estimates with the same model are 23.8 Tg for the current
Clim. Past, 11, 869–903, 2015 www.clim-past.net/11/869/2015/

S. Albani et al.: Twelve thousand years of dust 891
Figure 16. Comparison of simulated dust deposition (g m−2 a−1) for the 6 ka BP case compared to observational estimates of the fine
(< 10 µm) eolian mass accumulation rate for the period 5–7 ka BP: observations (top); model (middle); model (bottom) versus observations
scatterplot. Horizontal bars represent the variability in observational data averaged within the 5–7 ka BP time lapse (1σ ). Locations of
observational sites are clustered in the scatterplots based on their geographical location, as indicated by the color-coding. In the bottom
scatterplot, squares indicate high confidence level, and diamonds represent medium confidence level.
climate and 37.4 Tg for the LGM (Albani et al., 2014). Simi-
larly, global dust deposition estimates during the Holocene
vary by ∼ 16 %, between ∼ 2900 Tg a−1 (10 ka BP) and
∼ 2400 Tg a−1 (8 ka BP) (Fig. 17).
Two distinct features characterize the spatial distribution
of dust during the Holocene. First, the early to mid-Holocene
is characterized by enhanced dustiness in the Southern Hemi-
sphere compared to the late Holocene. Second, there are
shifts between the relative importance of Asian versus north-
ern African sources. Even in the late Holocene though, there
seems to be an imbalance towards Asian sources, compared
to the present day. This may be related to the difficulties of
constraining the model to the observations in general and for
the northern African regions in particular, although the rela-
tive role of northern Africa as a dust source may have actu-
ally increased significantly since the preindustrial period due
to much increased dustiness (Mulitza et al., 2010).
www.clim-past.net/11/869/2015/ Clim. Past, 11, 869–903, 2015

892 S. Albani et al.: Twelve thousand years of dust
Figure 17. Dust deposition flux (g m−2 a−1) from the CESM during the Holocene snapshots at 2, 4, 6, 8, and 10 ka BP, based on spatially
variable emissions constrained by the observational mass accumulation rates. Black circles mark the locations of the observational records
in this compilation.
4.13 Particle size distributions
The organization of the available size distribution data into a
common binning scheme not only provides the tool to relate
DMARs within a common size range but also allows com-
paring modeled and observed size distributions (e.g., Albani
et al., 2014; Mahowald et al., 2014). In Fig. 18 we make this
kind of comparison for the 6 ka BP time slice, which high-
lights how the observed size distribution (blue solid lines) is
coarser close to the source areas and becomes finer for more
remote dust deposits such as marine sediments or ice core
archives. While significant uncertainties and biases may af-
fect the different observations of size distributions (e.g., Ma-
howald et al., 2014; Reid et al., 2003), this relation between
dust particle size and long-range transport is widely recog-
nized (e.g., Lawrence and Neff, 2009; Pye, 1995).
Modeled size distributions (red dashed lines) in general
capture this trend, with coarser size distributions simulated
for terrestrial deposits compared to dust deposition further
away from the dust sources. Notable exceptions are the
Antarctic ice core sites, which exhibit coarse distributions
in the model. This feature was already observed in previ-
ous studies and attributed mainly to biases in transport in the
CAM4–BAM, which is used for this study as well (Albani et
al., 2014; Mahowald et al., 2014).
Focussing on terrestrial deposits, we can also see the grad-
ual tendency for the observed and modeled size distributions
to shift towards finer distributions for larger distances from
the sources. For instance Weinan lies farther away from the
major dust sources in the Ordos, Badain Juran, and Teng-
ger (Fig. 18k) and shows the smallest relative contribution of
dust in the model’s bin 4 (5–10 µm) compared to the other
sites in the CLP. Similarly, Zagoskin Lake in Alaska lies far-
ther away from the putative sources in the Yukon Valley than
OWR does from the Sand Dunes in Nebraska (Fig. 18l), and
Zagoskin Lake exhibits finer particle size distributions.
The temporal variability in dust size distributions during
the Holocene is very limited both in the observations and the
model (not shown).
5 Conclusions
Here, we present the first study using an innovative approach
to organize a paleodust compilation for the Holocene from
different sedimentary archives by collecting and evaluating
dust records that allow the reconstruction of time series of
eolian mass accumulation rates with size information, with
relevance for medium- to long-range transport.
The resulting database has the following characteristics:
– It is concise and accessible. The main information for
each site included in the compilation is a time series
including age (with uncertainty), dust MAR (with un-
certainty), and size distribution (where available), stan-
Clim. Past, 11, 869–903, 2015 www.clim-past.net/11/869/2015/
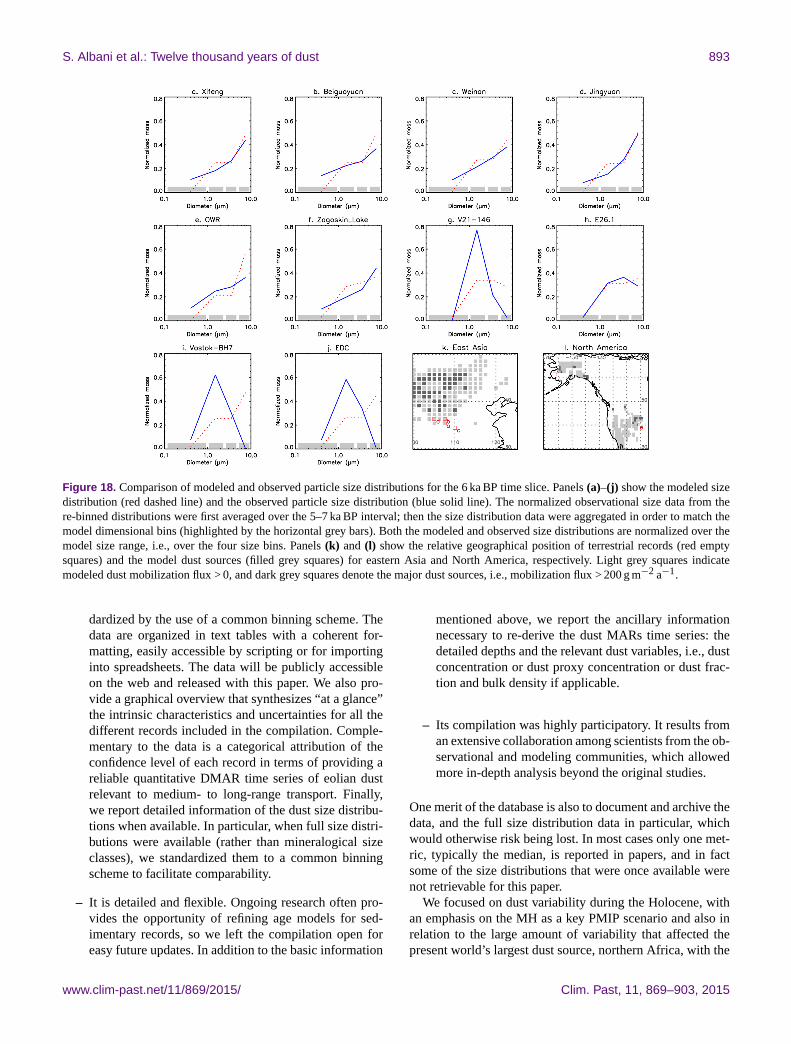
S. Albani et al.: Twelve thousand years of dust 893
Figure 18. Comparison of modeled and observed particle size distributions for the 6 ka BP time slice. Panels (a)–(j) show the modeled size
distribution (red dashed line) and the observed particle size distribution (blue solid line). The normalized observational size data from the
re-binned distributions were first averaged over the 5–7 ka BP interval; then the size distribution data were aggregated in order to match the
model dimensional bins (highlighted by the horizontal grey bars). Both the modeled and observed size distributions are normalized over the
model size range, i.e., over the four size bins. Panels (k) and (l) show the relative geographical position of terrestrial records (red empty
squares) and the model dust sources (filled grey squares) for eastern Asia and North America, respectively. Light grey squares indicate
modeled dust mobilization flux > 0, and dark grey squares denote the major dust sources, i.e., mobilization flux > 200 g m−2 a−1.
dardized by the use of a common binning scheme. The
data are organized in text tables with a coherent for-
matting, easily accessible by scripting or for importing
into spreadsheets. The data will be publicly accessible
on the web and released with this paper. We also pro-
vide a graphical overview that synthesizes “at a glance”
the intrinsic characteristics and uncertainties for all the
different records included in the compilation. Comple-
mentary to the data is a categorical attribution of the
confidence level of each record in terms of providing a
reliable quantitative DMAR time series of eolian dust
relevant to medium- to long-range transport. Finally,
we report detailed information of the dust size distribu-
tions when available. In particular, when full size distri-
butions were available (rather than mineralogical size
classes), we standardized them to a common binning
scheme to facilitate comparability.
– It is detailed and flexible. Ongoing research often pro-
vides the opportunity of refining age models for sed-
imentary records, so we left the compilation open for
easy future updates. In addition to the basic information
mentioned above, we report the ancillary information
necessary to re-derive the dust MARs time series: the
detailed depths and the relevant dust variables, i.e., dust
concentration or dust proxy concentration or dust frac-
tion and bulk density if applicable.
– Its compilation was highly participatory. It results from
an extensive collaboration among scientists from the ob-
servational and modeling communities, which allowed
more in-depth analysis beyond the original studies.
One merit of the database is also to document and archive the
data, and the full size distribution data in particular, which
would otherwise risk being lost. In most cases only one met-
ric, typically the median, is reported in papers, and in fact
some of the size distributions that were once available were
not retrievable for this paper.
We focused on dust variability during the Holocene, with
an emphasis on the MH as a key PMIP scenario and also in
relation to the large amount of variability that affected the
present world’s largest dust source, northern Africa, with the
www.clim-past.net/11/869/2015/ Clim. Past, 11, 869–903, 2015
894 S. Albani et al.: Twelve thousand years of dust
termination of the African Humid Period (deMenocal et al.,
2000; McGee et al., 2013).
An integrated approach of merging data and modeling
with the CESM allowed a spatially consistent reconstruc-
tion of the global dust cycle and its variability throughout
the Holocene. Our simulations indicate that the global dust
load showed significant variability ranging between 17.2 and
20.8 Tg, with a minimum during the early to mid-Holocene.
The model–data compilation is likely to be useful to both
dust and ocean biogeochemical modelers, who may use iron
and mineral dust as a ballast input to their model (e.g., Moore
et al., 2006), or for observational studies for putting to put
their cores into the context of existing estimates of deposi-
tional fluxes (e.g., Winckler et al., 2008).
In addition we report on two relevant aspects that emerged
from this work.
First, we showed how the size distribution of dust is in-
trinsically related to the DMAR: ignoring this tight coupling
would cause a misleading interpretation of the dust cycle, not
only for modeling studies but also in a broader sense.
Second, comparing DMARs within a consistent size range
allows for a consistent analysis of the spatial features of the
global dust cycle, which are not deducible by the simple anal-
ysis of relative timing and amplitude of the variations among
different paleodust reconstructions.
Our analysis shows that a knowledge gap in understand-
ing the relevant features of the global dust cycle still exists, in
particular for key regions such as northern African and Asian
dust sources, where quantitative information on the dust cy-
cle is limited or not fully consistent.
In our representation of the loess–paleosol data, we depict
them as DMAR time series, which is a rather innovative ap-
proach introduced in previous compilation efforts (Kohfeld
and Harrison, 2003) as well as in a few observational studies
(e.g., Muhs et al., 2013a; Roberts et al., 2003; Stevens and
Lu, 2009) but which is not widespread in the loess commu-
nity at large. We tentatively used an approach that privileges
pairing of the time series with the soil subunit stratigraphy.
Future work will be needed to better asses this approach as
well as alternative approaches.
The possibility of comparing not only the size range but
also the size distributions of dust particles offers additional
tools to understand the spatial evolution of the dust cycle (as
well as its temporal variability in principle). At a given cli-
mate state, for instance, it allows relating the records from
different sites to the major dust sources.
The work presented in this paper provides the tools for re-
lating DMARs and climate; future work will need to place
the dust records in the context of the climate conditions of
the different regions by comparing dust records to other pa-
leoclimate proxies.
We present a framework for future work on dust compi-
lations, and although we focused on the Holocene here, fu-
ture updates using this framework are intended to improve
the compilation. In addition, the framework provided for this
compilation can be extended to wider time periods in the fu-
ture, for example, the full span of the last glacial cycle and
the deglaciation and the late Holocene to the present day; this
would allow linking the past and the present dust cycle.
In conclusion, our work provides the framework for or-
ganizing a new-generation dust database, with time- and
size-resolved records of dust mass accumulation rates. In
its present form the compilation includes data spanning the
Holocene period. The use of a common, quantitative metric
allows comparing paleodust records in a consistent way. Our
analysis, based on the emerging properties of the data col-
lection, emphasizes the intimate link between particle size
distributions and DMARs and highlights apparent inconsis-
tencies among the records – hidden when the size informa-
tion is ignored; this indicates knowledge gaps in key regions.
Simulations with the CESM constrained by the data from the
compilation provide, for the first time, a reconstruction of
the variability in the global dust cycle during the Holocene,
which can be used as the basis for future studies of dust, cli-
mate, and biogeochemistry interactions.
Clim. Past, 11, 869–903, 2015 www.clim-past.net/11/869/2015/
S. Albani et al.: Twelve thousand years of dust 895
Appendix A: Description of the template database
tables and site sheets
All records in this compilation include a basic piece of infor-
mation: a time series of eolian DMAR, with 1σ uncertainty
on both ages and DMARs (Supplement), and a categorical
attribution of the confidence level (Table 1).
Because each record is characterized by a different number
of age points, a separate table is associated with each record.
In addition, a descriptive sheet is provided for each record,
with a graphical overview of the sampling of the profile and
the time-dependent dust MAR with uncertainties as well as
metadata. For sites where size information is available, an
additional integrative table is provided, as well as a document
with details about the re-binning procedure.
Each table in the database is a tab key-separated text doc-
ument, named after the site, as reported in Table 1. The
first four columns contain the basic information: age (ka BP),
dust MAR (g m−2 a−1), age error (ka), and Dust MAR error
(g m−2 a−1). A second set of columns includes data relative
to the depth of the samples and their age: depth top (cm),
depth bottom (cm), depth center (cm), age top (ka BP), age
bottom (ka BP), and age center (ka BP). Finally, a third set of
columns contains information relevant for the dust MAR cal-
culation: sediment bulk MAR (g m−2 a−1), SBMAR relative
error, sediment dry bulk density (SDBD) (g cm−3), SDBD
relative error, SR (cm kyr−1), SR relative error, eolian contri-
bution (fraction), EC (ppm), and EC relative error. All entries
are filled either with data or “NA”.
The tables with size information are also TAB-separated
text documents. There are two types of them: one with size
classes and one with the re-binned size distributions. The
first four columns again contain the basic information: age
(ka BP), dust MAR (g m−2 a−1), age error (ka), and dust
MAR error (g m−2 a−1). The other columns contain either
the size classes as reported in the original work or the binned
data, with upper and lower limits indicated in the first two
rows of the table. The numbers represent the percentage con-
tribution of each bin to the total dust mass. “NA” indicates no
data for bins outside the original measurements size range.
The descriptive sheet is composed of three panels. The up-
per one shows the dust MAR as a function of depth and high-
lights (grey shading) the sampling stratigraphy. The central
panel shows the dust MAR time series, with relative uncer-
tainties. The bottom panel contains a concise summary of
the sampling and of the methods used to determine the ages,
age model, SBMAR and EC (with relative uncertainties), and
size.
For the records with size distributions associated, an addi-
tional PDF document is provided, showing the fitting proce-
dure for each site: original (black) and new (red) cumulative
distributions, fitting spline (green), and original (black) and
new (red) mass–size distribution (scaled). In addition, sev-
eral percentiles across the size spectrum are compared for the
original and re-binned distributions. For the overall record
from one site, two summary metrics are produced, which
synthesize the overall fit to the original data: the Pearson’s
correlation coefficient of the 5th, 25th, 50th, 90th, and 95th
percentiles and the mean normalized bias (MNB):
MNB=1
nobs · ni
∑obs
∑i
(xobs,i
)−(yobs,i
)xobs,i
m, (A1)
where nobs is the number of samples for a site, ni is the
number of percentiles included in the calculation (here, five),
xobs,i is the original ith percentile for a given sample, and
yobs,i is the corresponding new binning percentile. In this
context, the MNB is a metric of the average over- or under-
estimation of the “coarseness” of the re-binned size distribu-
tions compared to the original observations.
www.clim-past.net/11/869/2015/ Clim. Past, 11, 869–903, 2015
896 S. Albani et al.: Twelve thousand years of dust
The Supplement related to this article is available online
at doi:10.5194/cp-11-869-2015-supplement.
Acknowledgements. We acknowledge assistance from NSF
grants 0932946, 1003509, and DOE-SC00006735. S. Albani
acknowledges funding from “Dote ricercatori”: FSE, Regione
Lombardia. G. Winckler acknowledges funding from NSF grant
AGS-1003505. Computing resources were provided by the Climate
Simulation Laboratory at NCAR’s Computational and Information
Systems Laboratory (CISL), sponsored by the National Science
Foundation and other agencies. We gratefully acknowledge Dan
Muhs for sharing his data and for thorough discussions on the in-
terpretation of terrestrial sediment records. We would like to thank
Youbin Sun for sharing his data from the Jingyuan section and for
his valuable comments on the manuscript. We also acknowledge
the constructive comments by F. Lambert and one anonymous
referee. We also would like to thank the following colleagues for
constructive discussions: L. Thompson, P. Gabrielli, C. Zdanow-
icz, S. Marx, M. Kylander, G. Le Roux, F. De Vleeschouwer,
P. DeDeckker, and D. Rea. The model dust fields discussed in the
paper are available upon request to the corresponding author.
Edited by: D.-D. Rousseau
References
Adkins, J., deMenocal, P., and Eshel, G.: The “African humid pe-
riod” and the record of marine upwelling from excess 230Th
in Ocean Drilling Program Hole 658C, Paleoceanography, 21,
PA4203, doi:10.1029/2005PA001200, 2006.
Albani, S., Delmonte, B., Maggi, V., Baroni, C., Petit, J.-R., Stenni,
B., Mazzola, C., and Frezzotti, M.: Interpreting last glacial to
Holocene dust changes at Talos Dome (East Antarctica): im-
plications for atmospheric variations from regional to hemi-
spheric scales, Clim. Past, 8, 741–750, doi:10.5194/cp-8-741-
2012, 2012a.
Albani, S., Mahowald, N. M., Delmonte, B., Maggi, V., and Winck-
ler, G.: Comparing modeled and observed changes in mineral
dust transport and deposition to Antarctica between the Last
Glacial Maximum and current climates, Clim. Dynamam., 38,
1731–1755, doi:10.1007/s00382-011-1139-5, 2012b.
Albani, S., Mahowald, N. M., Perry, A. T., Scanza, R. A., Zen-
der, C. S., Heavens, N. G., Maggi, V., Kok, J. F., and Otto-
Bliesner, B. L.: Improved dust representation in the Commu-
nity Atmosphere Model, J. Adv. Model. Earth Syst., 6, 541–570,
doi:10.1002/2013MS000279, 2014.
Alley, R. B.: The Younger Dryas cold interval as viewed
from central Greenland, Quat. Sci. Rev., 19, 213–226,
doi:10.1016/S0277-3791(99)00062-1, 2000.
An, Z., Kukla, G., Porter, S. C., and Xiao, J.: Late quaternary
dust flow on the chinese Loess Plateau, Catena, 18, 125–132,
doi:10.1016/0341-8162(91)90012-M, 1991.
Anderson, R. F., Fleisher, M. Q., and Lao, Y.: Glacial–interglacial
variability in the delivery of dust to the central equato-
rial Pacific Ocean, Earth Planet. Sci. Lett., 242, 406–414,
doi:10.1016/j.epsl.2005.11.061, 2006.
Anderson, R. F., Fleisher, M. Q., Lao, Y., and Winckler, G.: Modern
CaCO3 preservation in equatorial Pacific sediments in the con-
text of late-Pleistocene glacial cycles, Mar. Chem., 111, 30–46,
doi:10.1016/j.marchem.2007.11.011, 2008.
Anderson, R. F., Barker, S., Fleisher, M., Gersonde, R., Gold-
stein, S. L., Kuhn, G., Mortyn, P. G., Pahnke, K., and Sachs,
J. P.: Biological response to millennial variability of dust
and nutrient supply in the Subantarctic South Atlantic Ocean,
Philos. Trans. A. Math. Phys. Eng. Sci., 372, 20130054,
doi:10.1098/rsta.2013.0054, 2014.
Bacon, M. P.: Glacial to interglacial changes in carbonate and clay
sedimentation in the Atlantic Ocean estimated from 230Th mea-
surements, Isotope Geosci., 2, 97–111, 1984.
Bacon, M. P. and Anderson, R. F.: Distribution of thorium isotopes
between dissolved and particulate forms in the deep sea, J. Geo-
phys. Res., 87, 2045, doi:10.1029/JC087iC03p02045, 1982.
Bard, E., Arnold, M., Duprat, J., Moyes, J., and Duplessy, J.-
C.: Reconstruction of the last deglaciation: deconvolved records
of δ18O profiles, micropaleontological variations and accelera-
tor mass spectrometric 14C dating, Clim. Dynam., 1, 101–112,
doi:10.1007/BF01054479, 1987.
Bauer, E. and Ganopolski, A.: Sensitivity simulations with direct
shortwave radiative forcing by aeolian dust during glacial cycles,
Clim. Past, 10, 1333–1348, doi:10.5194/cp-10-1333-2014, 2014.
Begét, J.: Middle Wisconsinan Climate Fluctuations Recorded
in Central Alaskan Loess, Géographie Phys. Quat., 44, 3–13,
doi:10.7202/032793ar, 1990.
Bettis III, E. A., Muhs, D. R., Roberts, H. M., and Wintle, A. G.:
Last Glacial loess in the conterminous USA, Quat. Sci. Rev., 22,
1907–1946, doi:10.1016/S0277-3791(03)00169-0, 2003.
Bory, A., Wolff, E., Mulvaney, R., Jagoutz, E., Wegner, A., Ruth,
U., and Elderfield, H.: Multiple sources supply eolian mineral
dust to the Atlantic sector of coastal Antarctica: Evidence from
recent snow layers at the top of Berkner Island ice sheet, Earth
Planet. Sci. Lett., 291, 138–148, doi:10.1016/j.epsl.2010.01.006,
2010.
Bory, A. J.-M. and Newton, P. P.: Transport of airborne lithogenic
material down through the water column in two contrasting re-
gions of the eastern subtropical North Atlantic Ocean, Global
Biogeochem. Cy., 14, 297–315, doi:10.1029/1999GB900098,
2000.
Bory, A. J.-M., Biscaye, P., and Grousset, F. E.: Two dis-
tinct seasonal Asian source regions for mineral dust deposited
in Greenland (NorthGRIP), Geophys. Res. Lett., 30, 1167,
doi:10.1029/2002GL016446, 2003.
Boucher, O., Randall, D., Artaxo, P., Bretherton, C., Feingold, G.,
Forster, P., Kerminen, V.-M., Kondo, Y., Liao, H., Lohmann, U.,
Rasch, P., Satheesh, S. K., Sherwood, S., Stevens, B., and Zhang,
X. Y.: Clouds and Aerosols, in: Climate Change 2013: The Phys-
ical Science Basis. Contribution of Working Group I to the Fifth
Assessment Report of the Intergovernmental Panel on Climate
Change edited by: Stocker, T. F., Qin, D., Plattner, G.-K., Tignor,
M., Allen, S. K., Boschung, J., Nauels, A., Xia, Y., Bex, V., and
Midgley, P. M., Cambridge University Press, Cambridge, UK and
New York, NY, USA, 2013.
Bowen, A. J. and Lindley, D.: A wind-tunnel investigation of the
wind speed and turbulence characteristics close to the ground
over various escarpment shapes, Bound.-Layer Meteorol., 12,
259–271, doi:10.1007/BF00121466, 1977.
Clim. Past, 11, 869–903, 2015 www.clim-past.net/11/869/2015/
S. Albani et al.: Twelve thousand years of dust 897
Box, M. R., Krom, M. D., Cliff, R. A., Bar-Matthews, M.,
Almogi-Labin, A., Ayalon, A., and Paterne, M.: Response of
the Nile and its catchment to millennial-scale climatic change
since the LGM from Sr isotopes and major elements of
East Mediterranean sediments, Quat. Sci. Rev., 30, 431–442,
doi:10.1016/j.quascirev.2010.12.005, 2011.
Braconnot, P., Otto-Bliesner, B., Harrison, S., Joussaume, S., Pe-
terchmitt, J.-Y., Abe-Ouchi, A., Crucifix, M., Driesschaert, E.,
Fichefet, T., Hewitt, C. D., Kageyama, M., Kitoh, A., Laîné, A.,
Loutre, M.-F., Marti, O., Merkel, U., Ramstein, G., Valdes, P.,
Weber, S. L., Yu, Y., and Zhao, Y.: Results of PMIP2 coupled
simulations of the Mid-Holocene and Last Glacial Maximum –
Part 1: experiments and large-scale features, Clim. Past, 3, 261–
277, doi:10.5194/cp-3-261-2007, 2007.
Bradley, R. S.: Paleoclimatology: Reconstructing Climates of the
Quaternary, 2nd ed., Academic, San Diego, CA, 610 pp., 1999.
Bradtmiller, L. I., Anderson, R. F., Fleisher, M. Q., and Bur-
ckle, L. H.: Diatom productivity in the equatorial Pacific Ocean
from the last glacial period to the present: A test of the sili-
cic acid leakage hypothesis, Paleoceanography, 21, PA4201,
doi:10.1029/2006PA001282, 2006.
Bradtmiller, L. I., Anderson, R. F., Fleisher, M. Q., and Bur-
ckle, L. H.: Opal burial in the equatorial Atlantic Ocean
over the last 30 ka: Implications for glacial-interglacial changes
in the ocean silicon cycle, Paleoceanography, 22, PA4216,
doi:10.1029/2007PA001443, 2007.
Bradtmiller, L. I., Anderson, R. F., Fleisher, M. Q., and Burckle, L.
H.: Comparing glacial and Holocene opal fluxes in the Pacific
sector of the Southern Ocean, Paleoceanography, 24, PA2214,
doi:10.1029/2008PA001693, 2009.
Brady, E. C., Otto-Bliesner, B. L., Kay, J. E., and Rosenbloom, N.:
Sensitivity to glacial forcing in the CCSM4, J. Clim., 26, 1901–
1925, doi:10.1175/JCLI-D-11-00416.1, 2013.
Brauer, A., Hajdas, I., Blockley, S. P. E., Bronk Ramsey, Christo-
pher Christl, M., Ivy-Ochs, S., Moseley, G. E., Nowaczyk, N.
N., Rasmussen, S. O., Roberts, H. M., Spötl, C., Staff, R.
A., and Svensson, A.: The importance of independent chronol-
ogy in integrating records of past climate change for the 60-
8 ka INTIMATE time interval, Quat. Sci. Rev., 106, 47–66,
doi:10.1016/j.quascirev.2014.07.006, 2014.
Bronk Ramsey, C.: Radiocarbon calibration and analysis of stratig-
raphy : The OxCal Program, Radiocarbon, 37, 425–430, avail-
able at: http://ci.nii.ac.jp/naid/80008936407/en/ (last access: 25
July 2014), 1995.
Bullard, J. E.: Contemporary glacigenic inputs to the dust cycle,
Earth Surf. Process. Landf., 38, 71–89, doi:10.1002/esp.3315,
2013.
Buylaert, J.-P., Murray, A., Vandenberghe, D., Vriend, M., De
Corte, F., and Van den haute, P.: Optical dating of Chi-
nese loess using sand-sized quartz: Establishing a time frame
for Late Pleistocene climate changes in the western part
of the Chinese Loess Plateau, Quat. Geochron., 3, 99–113,
doi:10.1016/j.quageo.2007.05.003, 2008.
Chewings, J. M., Atkins, C. B., Dunbar, G. B., and Golledge, N.
R.: Aeolian sediment transport and deposition in a modern high-
latitude glacial marine environment, edited by: N. Lancaster,
Sedimentology, 61, 1535–1557, doi:10.1111/sed.12108, 2014.
Claussen, M., Kubatzki, C., Brovkin, V., Ganopolski, A., Hoelz-
mann, P., and Pachur, H.-J.: Simulation of an abrupt change in
Saharan vegetation in the Mid-Holocene, Geophys. Res. Lett.,
26, 2037–2040, doi:10.1029/1999GL900494, 1999.
Clemens, S. C.: Dust response to seasonal atmospheric forcing:
Proxy evaluation and calibration, Paleoceanography, 13, 471–
490, doi:10.1029/98PA02131, 1998.
Clemens, S. C. and Prell, W. L.: Late Pleistocene variability of Ara-
bian Sea summer monsoon winds and continental aridity: Eolian
records from the lithogenic component of deep-sea sediments,
Paleoceanography, 5, 109–145, doi:10.1029/PA005i002p00109,
1990.
Cook, B. I., Seager, R., Miller, R. L., and Mason, J. A.: Intensifica-
tion of North American Megadroughts through Surface and Dust
Aerosol Forcing, J. Clim., 26, 4414–4430, doi:10.1175/JCLI-D-
12-00022.1, 2013.
Cosford, J., Qing, H. R., Eglington, B., Mattey, D., Yuan, D. X.,
Zhang, M. L., and Cheng, H.: East Asian monsoon variability
since the Mid-Holocene recorded in a high-resolution, absolute-
dated aragonite speleothem from eastern China, Earth Planet.
Sci. Lett., 275, 296–307, 2008.
Crusius, J., Schroth, A. W., Gassó, S., Moy, C. M., Levy, R. C.,
and Gatica, M.: Glacial flour dust storms in the Gulf of Alaska:
Hydrologic and meteorological controls and their importance as
a source of bioavailable iron, Geophys. Res. Lett., 38, L06602,
doi:10.1029/2010GL046573, 2011.
De Deckker, P., Moros, M., Perner, K., and Jansen, E.: Influence of
the tropics and southern westerlies on glacial interhemispheric
asymmetry, Nat. Geosci., 5, 266–269, doi:10.1038/ngeo1431,
2012.
De La Rocha, C. L., Nowald, N., and Passow, U.: Interactions
between diatom aggregates, minerals, particulate organic car-
bon, and dissolved organic matter: Further implications for
the ballast hypothesis, Global Biogeochem. Cy., 22, GB4005,
doi:10.1029/2007GB003156, 2008.
Delmonte, B., Petit, J. R., Andersen, K. K., Basile-Doelsch, I.,
Maggi, V., and Ya Lipenkov, V.: Dust size evidence for oppo-
site regional atmospheric circulation changes over east Antarc-
tica during the last climatic transition, Clim. Dynam., 23,
doi:10.1007/s00382-004-0450-9, 2004.
Delmonte, B., Andersson, P., Schöberg, H., Hansson, M., Pe-
tit, J. R., Delmas, R., Gaiero, D. M., Maggi, V., and Frez-
zotti, M.: Geographic provenance of aeolian dust in East
Antarctica during Pleistocene glaciations: preliminary results
from Talos Dome and comparison with East Antarctic and
new Andean ice core data, Quat. Sci. Rev., 29, 256–264,
doi:10.1016/j.quascirev.2009.05.010, 2010a.
Delmonte, B., Baroni, C., Andersson, P. S., Schoberg, H., Hansson,
M., Aciego, S., Petit, J.-R., Albani, S., Mazzola, C., Maggi, V.,
and Frezzotti, M.: Aeolian dust in the Talos Dome ice core (East
Antarctica, Pacific/Ross Sea sector): Victoria Land versus remote
sources over the last two climate cycles, J. Quat. Sci., 25, 1327–
1337, doi:10.1002/jqs.1418, 2010b.
Delmonte, B., Baroni, C., Andersson, P. S., Narcisi, B., Salva-
tore, M. C., Petit, J. R., Scarchilli, C., Frezzotti, M., Albani,
S., and Maggi, V.: Modern and Holocene aeolian dust vari-
ability from Talos Dome (Northern Victoria Land) to the in-
terior of the Antarctic ice sheet, Quat. Sci. Rev., 64, 76–89,
doi:10.1016/j.quascirev.2012.11.033, 2013.
deMenocal, P., Ortiz, J., Guilderson, T., Adkins, J., Sarnthein, M.,
Baker, L., and Yarusinsky, M.: Abrupt onset and termination
www.clim-past.net/11/869/2015/ Clim. Past, 11, 869–903, 2015
898 S. Albani et al.: Twelve thousand years of dust
of the African Humid Period, Quat. Sci. Rev., 19, 347–361,
doi:10.1016/S0277-3791(99)00081-5, 2000.
Derbyshire, E.: Loess, and the Dust Indicators and Records
of Terrestrial and Marine Palaeoenvironments (DIRTMAP)
database, Quat. Sci. Rev., 22, 1813–1819, doi:10.1016/S0277-
3791(03)00209-9, 2003.
Derbyshire, E., Kemp, R., and Meng, X.: Variations in loess and
palaeosol properties as indicators of palaeoclimatic gradients
across the Loess Plateau of North China, Quat. Sci. Rev., 14,
681–697, doi:10.1016/0277-3791(95)00077-1, 1995.
De Vleeschouwer, F., Pazdur, A., Luthers, C., Streel, M., Mauquoy,
D., Wastiaux, C., Le Roux, G., Moschen, R., Blaauw, M.,
Pawlyta, J., Sikorski, J., and Piotrowska, N.: A millen-
nial record of environmental change in peat deposits from
the Misten bog (East Belgium), Quat. Int., 268, 44–57,
doi:10.1016/j.quaint.2011.12.010, 2012.
Ding, Z. L., Derbyshire, E., Yang, S. L., Sun, J. M., and Liu, T. S.:
Stepwise expansion of desert environment across northern China
in the past 3.5 Ma and implications for monsoon evolution, Earth
Planet. Sci. Lett., 237, 45–55, doi:10.1016/j.epsl.2005.06.036,
2005.
Dong, J., Wang, Y., Cheng, H., Hardt, B., Edwards, R. L., Xing-
gong, K., Jiangying, W., Shitao, C., Dianbing, L., Xiuyang, J.,
and Kan, Z.: A high-resolution stalagmite record of the Holocene
East Asian monsoon from Mt Shennongjia, central China, The
Holocene, 20, 257–264, 2010.
Feng, Z.-D., Johnson, W. C., Sprowl, D. R., and Lu, Y.: Loess ac-
cumulation and soil formation in central Kansas, United States,
during the past 400 000 years, Earth Surf. Process. Landf., 19,
55–67, doi:10.1002/esp.3290190105, 1994.
Ferrat, M., Weiss, D. J., Strekopytov, S., Dong, S., Chen, H., Na-
jorka, J., Sun, Y., Gupta, S., Tada, R., and Sinha, R.: Improved
provenance tracing of Asian dust sources using rare earth el-
ements and selected trace elements for palaeomonsoon studies
on the eastern Tibetan Plateau, Geochim. Cosmochim. Ac., 75,
6374–6399, doi:10.1016/j.gca.2011.08.025, 2011.
Fischer, H., Fundel, F., Ruth, U., Twarloh, B., Wegner, A., Ud-
isti, R., Becagli, S., Castellano, E., Morganti, A., Severi, M.,
Wolff, E., Littot, G., Röthlisberger, R., Mulvaney, R., Hutterli,
M. A., Kaufmann, P., Federer, U., Lambert, F., Bigler, M., Hans-
son, M., Jonsell, U., de Angelis, M., Boutron, C., Siggaard-
Andersen, M.-L., Steffensen, J. P., Barbante, C., Gaspari, V.,
Gabrielli, P., and Wagenbach, D.: Reconstruction of millennial
changes in dust emission, transport and regional sea ice cover-
age using the deep EPICA ice cores from the Atlantic and Indian
Ocean sector of Antarctica, Earth Planet. Sci. Lett., 260, 340–
354, doi:10.1016/j.epsl.2007.06.014, 2007.
Fitzsimmons, K. E., Cohen, T. J., Hesse, P. P., Jansen, J., Nan-
son, G. C., May, J.-H., Barrows, T. T., Haberlah, D., Hilgers,
A., Kelly, T., Larsen, J., Lomax, J., and Treble, P.: Late Qua-
ternary palaeoenvironmental change in the Australian drylands,
Quat. Sci. Rev., 74, 78–96, doi:10.1016/j.quascirev.2012.09.007,
2013.
Flato, G., Marotzke, J., Abiodun, B., Braconnot, P., Chou, S. C.,
Collins, W., Cox, P., Driouech, F., Emori, S., Eyring, V., Forest,
C., Gleckler, P., Guilyardi, E., Jakob, C., Kattsov, V., Reason, C.,
and Rummukainen, M.: Evaluation of Climate Models. In: Cli-
mate Change 2013: The Physical Science Basis. Contribution of
Working Group I to the Fifth Assessment Report of the Intergov-
ernmental Panel on Climate Change, edited by: Stocker, T. F.,
Qin, D., Plattner, G.-K., Tignor, M., Allen, S. K., Boschung, J.,
Nauels, A., Xia, Y., Bex, V., and Midgley, P. M., Cambridge Uni-
versity Press, Cambridge, United Kingdom and New York, NY,
USA, 2013.
Formenti, P., Schütz, L., Balkanski, Y., Desboeufs, K., Ebert, M.,
Kandler, K., Petzold, A., Scheuvens, D., Weinbruch, S., and
Zhang, D.: Recent progress in understanding physical and chem-
ical properties of African and Asian mineral dust, Atmos. Chem.
Phys., 11, 8231–8256, doi:10.5194/acp-11-8231-2011, 2011.
François, R., Bacon, M. P., and Suman, D. O.: Thorium 230
profiling in deep-sea sediments: High-resolution records of
flux and dissolution of carbonate in the equatorial Atlantic
during the last 24,000 years, Paleoceanography, 5, 761–787,
doi:10.1029/PA005i005p00761, 1990.
François, R., Frank, M., Rutgers van der Loeff, M. M., and Bacon,
M. P.: 230 Th normalization: An essential tool for interpreting
sedimentary fluxes during the late Quaternary, Paleoceanogra-
phy, 19, PA1018, doi:10.1029/2003PA000939, 2004.
Frezzotti, M., Urbini, S., Proposito, M., Scarchilli, C., and Gan-
dolfi, S.: Spatial and temporal variability of surface mass bal-
ance near Talos Dome, East Antarctica, J. Geophys. Res., 112,
F02032, doi:10.1029/2006JF000638, 2007.
Fuhrer, K., Wolff, E. W., and Johnsen, S. J.: Timescales for
dust variability in the Greenland Ice Core Project (GRIP) ice
core in the last 100,000 years, J. Geophys. Res., 104, 31043,
doi:10.1029/1999JD900929, 1999.
Gabrielli, P., Hardy, D., Kehrwald, N., Cozzi, G., Turetta, C., Bar-
bante, C., and Thompson, L.: Deglaciated areas of Kilimanjaro
as a source of volcanic trace elements deposited on the ice cap
during the late Holocene, Quatern. Sci. Rev., 93, 1–10, 2014.
Han, Q., Moore, J. K., Zender, C., Measures, C., and Hy-
des, D.: Constraining oceanic dust depostion using sur-
face ocean dissolved Al, Global Biogeochem. Cy., 22,
doi:10.1029/2007GB002975, 2008.
Hansson, M. E.: The Renland ice core. A Northern Hemisphere
record of aerosol composition over 120,000 years, Tellus B, 46,
390–418, doi:10.1034/j.1600-0889.1994.t01-4-00005.x, 1994.
Henderson, G. M., Heinze, C., Anderson, R. F., and Winguth, A.
M. E.: Global distribution of the 230Th flux to ocean sediments
constrained by GCM modeling, Deep Sea Res. Part I, 46, 1861–
1893, 1999.
Hesse, P. P.: The record of continental dust from Australia
in Tasman Sea Sediments, Quat. Sci. Rev., 13, 257–272,
doi:10.1016/0277-3791(94)90029-9, 1994.
Hesse, P. P. and McTainsh, G. H.: Australian dust deposits: modern
processes and the Quaternary record, Quat. Sci. Rev., 22, 2007–
2035, doi:10.1016/S0277-3791(03)00164-1, 2003.
Hoelzmann, P., Jolly, D., Harrison, S. P., Laarif, F., Bonnefille,
R., and Pachur, H.-J.: Mid-Holocene land-surface conditions
in northern Africa and the Arabian Peninsula: A data set for
the analysis of biogeophysical feedbacks in the climate system,
Global Biogeochem. Cy., 12, 35–51, doi:10.1029/97GB02733,
1998.
Hovan, S. A., Rea, D. K., and Pisias, N. G.: Late Pleis-
tocene Continental Climate and Oceanic Variability Recorded
in Northwest Pacific Sediments, Paleoceanography, 6, 349–370,
doi:10.1029/91PA00559, 1991.
Clim. Past, 11, 869–903, 2015 www.clim-past.net/11/869/2015/

S. Albani et al.: Twelve thousand years of dust 899
Iizuka, Y., Delmonte, B., Oyabu, I., Karlin, T., Maggi, V., Albani, S.,
Fukui, M., Hondoh, T., and Hansson, M.: Sulphate and chloride
aerosols during Holocene and last glacial periods preserved in the
Talos Dome Ice Core, a peripheral region of Antarctica, Tellus B,
65, doi:10.3402/tellusb.v65i0.20197, 2013.
Imbrie, J., Hays, J. D., Martinson, D. G., McIntyre, A., Mix, A.
C., Morley, J. J., Pisias, N. G., Prell, W. L., and Shackleton,
N. J.: The orbital theory of Pleistocene climate: support from
a revised chronology of the marine δ18O record, Milankovitch
Clim. Underst. Response to Astron. Forcing, 1, 269, available at:
http://adsabs.harvard.edu/abs/1984mcur.conf..269I, (last access:
9 May 2014), 1984.
Jacobs, P. M. and Mason, J. A.: Late Quaternary climate change,
loess sedimentation, and soil profile development in the central
Great Plains: A pedosedimentary model, Geol. Soc. Am. Bull.,
119, 462–475, doi:10.1130/B25868.1, 2007.
Jiang, W., Yang, X., and Cheng, Y.: Spatial patterns of veg-
etation and climate on the Chinese Loess Plateau since
the Last Glacial Maximum, Quat. Int., 334–335, 52–60,
doi:10.1016/j.quaint.2013.10.039, 2014.
Jolly, D., Harrison, S., Damnati, B., and Bonnefille, R.: Simulated
climate and biomes of Africa during the late quaternary, Quat.
Sci. Rev., 17, 629–657, doi:10.1016/S0277-3791(98)00015-8,
1998.
Joussaume, S. and Taylor, K. E.: The Paleoclimate Modeling Inter-
comparison Project. In: PMIP, Paleoclimate Modeling Intercom-
parison Project (PMIP): proceedings of the third PMIP work-
shop, Canada, 4–8 october 1999, in WCRP-111, WMO/TD-
1007, edited by: Braconnot, P., 271, 2000.
Kang, S. G., Wang, X. L., and Lu, Y. C.: Quartz OSL chronol-
ogy and dust accumulation rate changes since the Last Glacial
at Weinan on the southeastern Chinese Loess Plateau, Boreas,
42, 815–829, 2013.
Kaplan, J. O., Bigelow, N. H., Prentice, I. C., Harrison, S. P.,
Bartlein, P. J., Christensen, T. R., Cramer, W., Matveyeva, N.
V., McGuire, A. D., Murray, D. F., Razzhivin, V. Y., Smith,
B., Walker, D. A., Anderson, P. M., Andreev, A. A., Brubaker,
L. B., Edwards, M. E., and Lozhkin, A. V.: Climate change
and Arctic ecosystems: 2. Modeling, paleodata-model compar-
isons, and future projections, J. Geophys. Res., 108, 8171,
doi:10.1029/2002JD002559, 2003.
Kawahata, H.: Fluctuations in the ocean environment within the
Western Pacific Warm Pool during Late Pleistocene, Paleo-
ceanography, 14, 639–652, doi:10.1029/1999PA900023, 1999.
Kemp, R. A.: Pedogenic modification of loess: significance for
palaeoclimatic reconstructions, Earth-Sci. Rev., 54, 145–156,
doi:10.1016/S0012-8252(01)00045-9, 2001.
Kindler, P., Guillevic, M., Baumgartner, M., Schwander, J., Landais,
A., and Leuenberger, M.: Temperature reconstruction from 10 to
120 kyr b2k from the NGRIP ice core, Clim. Past, 10, 887–902,
doi:10.5194/cp-10-887-2014, 2014.
Knippertz, P. and Todd, M. C.: Mineral dust aerosols over the
Sahara: Meteorological controls on emission and transport
and implications for modeling, Rev. Geophys., 50, RG1007,
doi:10.1029/2011RG000362, 2012.
Kohfeld, K. E. and Harrison, S. P.: DIRTMAP: the geological
record of dust, Earth-Sci. Rev., 54, 81–114, doi:10.1016/S0012-
8252(01)00042-3, 2001.
Kohfeld, K. and Harrison, S. P.: Glacial-interglacial changes in dust
deposition on the Chinese Loess Plateau, Quat. Sci. Rev., 22,
1859–1878, doi:10.1016/S0277-3791(03)00166-5, 2003.
Kohfeld, K. and Tegen, I.: Record of mineral aerosols and their role
in the Earth system, Treatise Geochem., 4, 1–26, 2007.
Kohfeld, K. E., Graham, R. M., de Boer, A. M., Sime, L.
C., Wolff, E. W., Le Quéré, C., and Bopp, L.: Southern
Hemisphere westerly wind changes during the Last Glacial
Maximum: paleo-data synthesis, Quat. Sci. Rev., 68, 76–95,
doi:10.1016/j.quascirev.2013.01.017, 2013.
Kukla, G. and An, Z. S.: Loess stratigraphy in central China, Palaeo-
geogr. Palaeoclim. Palaeoecol., 72, 203–225, 1989.
Kutzbach, J. E. and Liu, Z.: Response of the African Monsoon to
Orbital Forcing and Ocean Feedbacks in the Middle Holocene,
Science, 278, 40–443, doi:10.1126/science.278.5337.440, 1997.
Kylander, M. E., Bindler, R., Cortizas, A. M., Gallagher, K., Mörth,
C.-M., and Rauch, S.: A novel geochemical approach to paleo-
records of dust deposition and effective humidity: 8500 years of
peat accumulation at Store Mosse (the “Great Bog”), Sweden,
Quat. Sci. Rev., 69, 69–82, doi:10.1016/j.quascirev.2013.02.010,
2013.
Lambert, F., Bigler, M., Steffensen, J. P., Hutterli, M., and Fis-
cher, H.: Centennial mineral dust variability in high-resolution
ice core data from Dome C, Antarctica, Clim. Past, 8, 609–623,
doi:10.5194/cp-8-609-2012, 2012.
Lambert, F., Delmonte, B., Petit, J. R., Bigler, M., Kaufmann, P.
R., Hutterli, M. A., Stocker, T. F., Ruth, U., Steffensen, J. P., and
Maggi, V.: Dust-climate couplings over the past 800,000 years
from the EPICA Dome C ice core, Nature, 452, 616–619,
doi:10.1038/nature06763, 2008.
Lamy, F., Gersonde, R., Winckler, G., Esper, O., Jaeschke, A.,
Kuhn, G., Ullermann, J., Martinez-Garcia, A., Lambert, F.,
and Kilian, R.: Increased dust deposition in the Pacific South-
ern Ocean during glacial periods, Science, 343, 403–407,
doi:10.1126/science.1245424, 2014.
Lawrence, C. R. and Neff, J. C.: The contemporary physi-
cal and chemical flux of aeolian dust: A synthesis of direct
measurements of dust deposition, Chem. Geol., 267, 46–63,
doi:10.1016/j.chemgeo.2009.02.005, 2009.
Lisiecki, L. E. and Raymo, M. E.: A Pliocene-Pleistocene stack of
57 globally distributed benthic δ18O records, Paleoceanography,
20, PA1003, doi:10.1029/2004PA001071, 2005.
Liu, T. S.: Loess and Environment, China Ocean Press, Beijing, 31–
67, 1985.
Liu, T. S. and Ding, Z. L.: Chinese loess and the palaeomonsoon,
Ann. Rev. Earth Planet. Sci., 26, 111–145, 1998.
Liu, Z., Otto-Bliesner, B. L., He, F., Brady, E. C., Tomas, R.,
Clark, P. U., Carlson, A. E., Lynch-Stieglitz, J., Curry, W.,
Brook, E., Erickson, D., Jacob, R., Kutzbach, J., and Cheng,
J.: Transient simulation of last deglaciation with a new mech-
anism for Bolling-Allerod warming, Science, 325, 310–314,
doi:10.1126/science.1171041, 2009.
Loulergue, L., Schilt, A., Spahni, R., Masson-Delmotte, V., Blu-
nier, T., Lemieux, B., Barnola, J.-M., Raynaud, D., Stocker, T.
F., and Chappellaz, J.: Orbital and millennial-scale features of
atmospheric CH4 over the past 800,000 years, Nature, 453, 383–
386, doi:10.1038/nature06950, 2008.
www.clim-past.net/11/869/2015/ Clim. Past, 11, 869–903, 2015

900 S. Albani et al.: Twelve thousand years of dust
Lu, H. and Sun, D.: Pathways of dust input to the Chinese Loess
Plateau during the Last Glacial and Interglacial periods, Catena,
40, 251–261, 2000.
Lu, H., Van Huissteden, J., An, Z. S., Nugteren, G., and Vanden-
berghe, J.: East Asia winter monsoon changes on millennial time
scale before the Last Glacial-interglacial cycle, J. Quat. Sci., 14,
101–111, 1999.
Lu, H., Stevens, T., Yi, S., and Sun, X.: An erosional hiatus in
Chinese loess sequences revealed by closely spaced optical dat-
ing, Chinese Sci. Bull., 51, 2253–2259, doi:10.1007/s11434-
006-2097-x, 2006.
Lu, H., Wang, X. Y., Li, L. P.: Aeolian sediment evidence that global
cooling has driven late Cenozoic stepwise aridification in central
Asia, edited by: Clift, P. D., Tada, R., and Zheng, H., in: Monsoon
Evolution and Tectonics–Climate Linkage in Asia, Geological
Society, London, Special Publications, 342, 29–44, 2010.
Lu, H., Yi, S., Liu, Z., Mason, J. A., Jiang, D., Cheng, J., Stevens,
T., Xu, Z., Zhang, E., Jin, L., Zhang, Z., Guo, Z., Wang, Y., and
Otto-Bliesner, B.: Variation of East Asian monsoon precipitation
during the past 21 k.y., and potential CO2 forcing, Geology, 41,
1023–1026, doi:10.1130/G34488.1, 2013.
Maher, B. A., Meng Yu, H., Roberts, H. M., and Wintle, A. G.:
Holocene loess accumulation and soil development at the west-
ern edge of the Chinese Loess Plateau: implications for mag-
netic proxies of palaeorainfall, Quat. Sci. Rev., 22, 445–451,
doi:10.1016/S0277-3791(02)00188-9, 2003.
Maher, B. A., Prospero, J. M., Mackie, D., Gaiero, D., Hesse,
P. P., and Balkanski, Y.: Global connections between aeolian
dust, climate and ocean biogeochemistry at the present day and
at the last glacial maximum, Earth-Science Rev., 99, 61–97,
doi:10.1016/j.earscirev.2009.12.001, 2010.
Mahowald, N., Kohfeld, K., Hansson, M., Balkanski, Y., Harri-
son, S. P., Prentice, I. C., Schulz, M., and Rodhe, H.: Dust
sources and deposition during the last glacial maximum and cur-
rent climate: A comparison of model results with paleodata from
ice cores and marine sediments, J. Geophys. Res., 104, 15895,
doi:10.1029/1999JD900084, 1999.
Mahowald, N., Albani, S., Engelstaedter, S., Winckler, G., and
Goman, M.: Model insight into glacial-interglacial paleodust
records, Quat. Sci. Rev., 30, 832–854, 2011.
Mahowald, N., Albani, S., Kok, J. F., Engelstaeder, S., Scanza, R.,
Ward, D. S., and Flanner, M. G.: The size distribution of desert
dust aerosols and its impact on the Earth system, Aeolian Res.,
15, 53–71, doi:10.1016/j.aeolia.2013.09.002, 2014.
Mahowald, N. M., Muhs, D. R., Levis, S., Rasch, P. J., Yoshioka,
M., Zender, C. S., and Luo, C.: Change in atmospheric mineral
aerosols in response to climate: Last glacial period, preindustrial,
modern, and doubled carbon dioxide climates, J. Geophys. Res.,
111, D10202, doi:10.1029/2005JD006653, 2006.
Mahowald, N. M., Kloster, S., Engelstaedter, S., Moore, J. K.,
Mukhopadhyay, S., McConnell, J. R., Albani, S., Doney, S. C.,
Bhattacharya, A., Curran, M. A. J., Flanner, M. G., Hoffman,
F. M., Lawrence, D. M., Lindsay, K., Mayewski, P. A., Neff, J.,
Rothenberg, D., Thomas, E., Thornton, P. E., and Zender, C. S.:
Observed 20th century desert dust variability: impact on climate
and biogeochemistry, Atmos. Chem. Phys., 10, 10875–10893,
doi:10.5194/acp-10-10875-2010, 2010.
Markovic, S. B., Hambach, U., Stevens, T., Kukla, G. J., Heller,
F., McCoy, W. D., Oches, E. A., Buggle, B., and Zöller, L.:
The last million years recorded at the Stari Slankamen (North-
ern Serbia) loess-palaeosol sequence: revised chronostratigraphy
and long-term environmental trends, Quat. Sci. Rev., 30, 1142–
1154, doi:10.1016/j.quatscirev.2011.02.003, 2011.
Martin, J. H.: Glacial-interglacial CO 2 change: The Iron Hypothe-
sis, Paleoceanography, 5, 1–13, doi:10.1029/PA005i001p00001,
1990.
Martinson, D. G., Pisias, N. G., Hays, J. D., Imbrie, J., Moore, T.
C., and Shackleton, N. J.: Age dating and the orbital theory of
the ice ages: Development of a high-resolution 0 to 300,000-
year chronostratigraphy, Quat. Res., 27, 1–29, doi:10.1016/0033-
5894(87)90046-9, 1987.
Marx, S. K., McGowan, H. A., and Kamber, B. S.: Long-range dust
transport from eastern Australia: A proxy for Holocene aridity
and ENSO-type climate variability, Earth Planet. Sci. Lett., 282,
167–177, doi:10.1016/j.epsl.2009.03.013, 2009.
Mason, J. A., Jacobs, P. M., Hanson, P. R., Miao, X., and Goble, R.
J.: Sources and paleoclimatic significance of Holocene Bignell
Loess, central Great Plains, USA, Quat. Res., 60, 330–339,
doi:10.1016/j.yqres.2003.07.005, 2003.
Mason, J. A., Miao, X., Hanson, P. R., Johnson, W. C., Jacobs, P.
M., and Goble, R. J.: Loess record of the Pleistocene–Holocene
transition on the northern and central Great Plains, USA, Quat.
Sci. Rev., 27, 1772–1783, doi:10.1016/j.quascirev.2008.07.004,
2008.
Masson-Delmotte, V., Schulz, M., Abe-Ouchi, A., Beer, J.,
Ganopolski, A., González Rouco, J. F., Jansen, E., Lambeck, K.,
Luterbacher, J., Naish, T., Osborn, T., Otto-Bliesner, B., Quinn,
T., Ramesh, R., Rojas, M., Shao, X., and Timmermann, A.: In-
formation from Paleoclimate Archives, in: Climate Change 2013:
The Physical Science Basis. Contribution of Working Group I to
the Fifth Assessment Report of the Intergovernmental Panel on
Climate Change edited by: Stocker, T. F., Qin, D., Plattner, G.-K.,
Tignor, M., Allen, S. K., Boschung, J., Nauels, A., Xia, Y., Bex,
V., and Midgley, P. M., Cambridge University Press, Cambridge,
UK and New York, NY, USA, 2013.
Mayewski, P. A., Meeker, L. D., Twickler, M. S., Whitlow, S., Yang,
Q., Lyons, W. B., and Prentice, M.: Major features and forcing
of high-latitude northern hemisphere atmospheric circulation us-
ing a 110,000-year-long glaciochemical series, J. Geophys. Res.,
102, 26345, doi:10.1029/96JC03365, 1997.
Mayewski, P. A., Sneed, S. B., Birkel, S. D., Kurbatov, A. V., and
Maasch, K. A.: Holocene warming marked by abrupt onset of
longer summers and reduced storm frequency around Greenland,
J. Quat. Sci., 29, 99–104, doi:10.1002/jqs.2684, 2014.
McConnell, J. R., Aristarain, A. J., Banta, J. R., Edwards, P. R.,
and Simões, J. C.: 20th-Century doubling in dust archived in an
Antarctic Peninsula ice core parallels climate change and deser-
tification in South America, P. Natl. Acad. Sci. USA, 104, 5743–
5748, doi:10.1073/pnas.0607657104, 2007.
McGee, D., Marcantonio, F., and Lynch-Stieglitz, J.: Deglacial
changes in dust flux in the eastern equatorial Pacific, Earth
Planet. Sci. Lett., 257, 215–230, doi:10.1016/j.epsl.2007.02.033,
2007.
McGee, D., Broecker, W. S., and Winckler, G.: Gustiness: The
driver of glacial dustiness?, Quat. Sci. Rev., 29, 2340–2350,
doi:10.1016/j.quascirev.2010.06.009, 2010.
McGee, D., deMenocal, P. B., Winckler, G., Stuut, J. B. W.,
and Bradtmiller, L. I.: The magnitude, timing and abrupt-
Clim. Past, 11, 869–903, 2015 www.clim-past.net/11/869/2015/

S. Albani et al.: Twelve thousand years of dust 901
ness of changes in North African dust deposition over the
last 20,000yr, Earth Planet. Sci. Lett., 371–372, 163–176,
doi:10.1016/j.epsl.2013.03.054, 2013.
McGowan, H. A., Marx, S. K., Soderholm, J., and Denholm, J.: Ev-
idence of solar and tropical-ocean forcing of hydroclimate cycles
in southeastern Australia for the past 6500 years, Geophys. Res.
Lett., 37, RG1007, doi:10.1029/2010GL042918, 2010.
Meeker, L. D. and Mayewski, P. A.: A 1400-year high-resolution
record of atmospheric circulation over the North Atlantic and
Asia, Holocene, 12, 257–266, 2002.
Miao, X., Mason, J. A., Johnson, W. C., and Wang,
H.: High-resolution proxy record of Holocene climate
from a loess Section in Southwestern Nebraska, USA,
Palaeogeogr. Palaeoclimatol. Palaeoecol., 245, 368–381,
doi:10.1016/j.palaeo.2006.09.004, 2007.
Moore, J. K., Doney, S., Lindsay, K., Mahowald, N., and Michaels,
A.: Nitrogen fixation amplifies the ocean biogeochemical re-
sponse to decadal timesclae variations in mineral dust deposition,
Tellus, 58B, 560–572, 2006.
Muhs, D. R., Agera, T., Bettis III, E. A., McGeehinc, J., Beena, J.
M., Begétd, J. E., Pavichc, M. J., Stafford, T. W., and Stevens,
D. A. S. P.: Stratigraphy and palaeoclimatic significance of Late
Quaternary loess–palaeosol sequences of the Last Interglacial–
Glacial cycle in central Alaska, Quat. Sci. Rev., 22, 1947–1986,
doi:10.1016/S0277-3791(03)00167-7, 2003a.
Muhs, D. R., Ager, T. A., Been, J., Bradbury, J. P., and Dean, W.
E.: A late quaternary record of eolian silt deposition in a maar
lake, St. Michael Island, western Alaska, Quat. Res., 60, 110–
122, doi:10.1016/S0033-5894(03)00062-0, 2003b.
Muhs, D. R., McGeehin, J. P., Beann, J., and Fisher, E.: Holocene
loess deposition and soil formation as competing processes,
Matanuska Valley, southern Alaska, Quat. Res., 61, 265–276,
doi:10.1016/j.yqres.2004.02.003, 2004.
Muhs, D. R., Bettis III, E. A., Aleinikoff, J. N., McGeehin, J. P.,
Beann, J., Skipp, G., Marshall, B. D., Roberts, H. M., Johnson,
W. C., and Benton, R.: Origin and paleoclimatic significance of
late Quaternary loess in Nebraska: Evidence from stratigraphy,
chronology, sedimentology, and geochemistry, Geol. Soc. Am.
Bull., 120, 1378–1407, doi:10.1130/B26221.1, 2008.
Muhs, D. R., Aleinikoff, J. N., Stafford, T. W. . J., Kihl, R., Been,
J., Mahan, S. A., and Cowherd, S.: Late Quaternary loess in
northeastern Colorado: Part I – Age and paleoclimatic signifi-
cance, Geol. Soc. Am. Bull., 111, 1861–1875, doi:10.1130/0016-
7606(1999)111, 1999.
Muhs, D. R., Bettis, E. A., Roberts, H. M., Harlan, S. S., Paces,
J. B., and Reynolds, R. L.: Chronology and provenance of last-
glacial (Peoria) loess in western Iowa and paleoclimatic implica-
tions, Quat. Res., 80, 468–481, doi:10.1016/j.yqres.2013.06.006,
2013a.
Muhs, D. R., Budahn, J. R., McGeehin, J. P., Bettis, E. A.,
Skipp, G., Paces, J. B., and Wheeler, E. A.: Loess origin,
transport, and deposition over the past 10,000 years, Wrangell-
St. Elias National Park, Alaska, Aeolian Res., 11, 85–99,
doi:10.1016/j.aeolia.2013.06.001, 2013b.
Mulitza, S., Heslop, D., Pittauerova, D., Fischer, H. W., Meyer, I.,
Stuut, J.-B., Zabel, M., Mollenhauer, G., Collins, J. A., Kuhnert,
H., and Schulz, M.: Increase in African dust flux at the onset of
commercial agriculture in the Sahel region, Nature, 466, 226–
228, doi:10.1038/nature09213, 2010.
Nagashima, K., Tada, R., Matsui, H., Irino, T., Tani, A., and Toy-
oda, S.: Orbital- and millennial-scale variations in Asian dust
transport path to the Japan Sea, Palaeogeogr. Palaeoclimatol.
Palaeoecol., 247, 144–161, doi:10.1016/j.palaeo.2006.11.027,
2007.
Narcisi, B., Petit, J.-R., and Chappellaz, J.: A 70 ka record of ex-
plosive eruptions from the TALDICE ice core (Talos Dome, East
Antarctic plateau), J. Quaternary Sci., 25, 844–849, 2010.
Olivarez, A. M., Owen, R. M., and Rea, D. K.: Geochemistry of
eolian dust in Pacific pelagic sediments: Implications for paleo-
climatic interpretations, Geochim. Cosmochim. Acta, 55, 2147–
2158, doi:10.1016/0016-7037(91)90093-K, 1991.
Otto-Bliesner, B. L., Joussaume, S., Braconnot, P., Harrison,
S. P., and Abe-Ouchi, A.: Modeling and Data Syntheses
of Past Climates: Paleoclimate Modelling Intercomparison
Project Phase II Workshop; Estes Park, Colorado, 15–19
September 2008, Eos, Trans. Am. Geophys. Union, 90, 93,
doi:10.1029/2009EO110013, 2009.
Petit, J. R., Jouzel, J., Raynaud, D., Barkov, N. I., Barnola, J. M.,
Basile, I., Bender, M., Chappellaz, J., Davis, M., Delaygue, G.,
Delmotte, M., Kotlyakov, V. M., Legrand, M., Lipenkov, V. Y.,
Lorius, C., Pepin, L., Ritz, C., Saltzman, E., and Stievenard,
M.: Climate and atmospheric history of the past 420,000 years
from the Vostok ice core, Antarctica, Nature, 399, 429–436,
doi:10.1038/20859, 1999.
Pigati, J. S., McGeehin, J. P., Muhs, D. R., and Bettis, E.
A.: Radiocarbon dating late Quaternary loess deposits using
small terrestrial gastropod shells, Quat. Sci. Rev., 76, 114–128,
doi:10.1016/j.quascirev.2013.05.013, 2013.
Porter, S. C.: Chinese loess record of monsoon climate during the
last glacial–interglacial cycle, Earth-Science Rev., 54(1-3), 115–
128, doi:10.1016/S0012-8252(01)00043-5, 2001.
Pourmand, A., Marcantonio, F., and Schulz, H.: Variations in pro-
ductivity and eolian fluxes in the northeastern Arabian Sea
during the past 110 ka, Earth Planet. Sci. Lett., 221, 39–54,
doi:10.1016/S0012-821X(04)00109-8, 2004.
Pourmand, A., Marcantonio, F., Bianchi, T. S., Canuel, E. A.,
and Waterson, E. J.: A 28-ka history of sea surface tempera-
ture, primary productivity and planktonic community variabil-
ity in the western Arabian Sea, Paleoceanography, 22, PA4208,
doi:10.1029/2007PA001502, 2007.
Prins, M. A., Vriend, M., Nugteren, G., Vandenberghe, J., Lu, H.,
Zheng, H., and Jan Weltje, G.: Late Quaternary aeolian dust in-
put variability on the Chinese Loess Plateau: inferences from un-
mixing of loess grain-size records, Quat. Sci. Rev., 26, 230–242,
doi:10.1016/j.quascirev.2006.07.002, 2007.
Prospero, J. M., Ginoux, P., Torres, O., Nicholson, S. E., and Gill,
T. E.: Environmental characterization of global sources of at-
mospheric soil dust identified with the NIMBUS 7 Total Ozone
Mapping Spectrometer (TOMS) absorbing aerosol product, Rev.
Geophys., 40, 1002, doi:10.1029/2000RG000095, 2002.
Pye, K.: The nature, origin and accumulation of loess, Quat. Sci.
Rev., 14, 653–667, doi:10.1016/0277-3791(95)00047-X, 1995.
Ratmeyer, V., Fischer, G., and Wefer, G.: Lithogenic particle fluxes
and grain size distributions in the deep ocean off NW Africa: im-
plications for seasonal changes of aeolian dust input and down-
ward transport, Deep-Sea Res. I, 46, 1289–1337, 1999.
www.clim-past.net/11/869/2015/ Clim. Past, 11, 869–903, 2015

902 S. Albani et al.: Twelve thousand years of dust
Rea, D. K.: The paleoclimatic record provided by eolian deposition
in the deep sea: The geologic history of wind, Rev. Geophys., 32,
159, doi:10.1029/93RG03257, 1994.
Rea, D. K. and Hovan, S. A.: Grain size distribution and deposi-
tional processes of the mineral component of abyssal sediments:
Lessons from the North Pacific, Paleoceanography, 10, 251–258,
doi:10.1029/94PA03355, 1995.
Rea, D. K. and Janecek, T. R.: Late cretaceous history of eo-
lian deposition in the mid-pacific mountains, central North Pa-
cific Ocean, Palaeogeogr. Palaeoclimatol. Palaeoecol., 36, 55–
67, doi:10.1016/0031-0182(81)90048-1, 1981.
Reid, J. S., Jonsson, H. H., Maring, H. B., Smirnov, A., Savoie,
D. L., Cliff, S. S., Reid, E. A., Livingston, J. M., Meier, M. M.,
Dubovik, O., and Tsay, S. C.: Comparison of size and morpho-
logical measurements of coarse mode dust particles from Africa,
J. Geophys. Res., 108, 8593, doi:10.1029/2002JD002485, 2003.
Reimer, P. J., Baillie, M. G. L., Bard, E., Bayliss, A., Beck, J. W.,
Blackwell, P. G., Ramsey, C. B., Buck, C. E., Burr, G. S., Ed-
wards, R. L., Friedrich, M., Grootes, P. M., Guilderson, T. P.,
Hajdas, I., Heaton, T. J., Hogg, A. G., Hughen, K. A., Kaiser,
K. F., Kromer, B., McCormac, F. G., Manning, S. W., Reimer,
R. W., Richards, D. A., Southon, J. R., Talamo, S., Turney, C.
S. M., van der Plicht, J., and Weyhenmeyer, C. E.: IntCal09 and
Marine09 radiocarbon age calibration curves, 0–50,000 yeats cal
BP, [online] available at: http://researchcommons.waikato.ac.nz/
handle/10289/3622 (last access: 25 July 2014), 2009.
Roberts, H. M.: The development and application of lumines-
cence dating to loess deposits: a perspective on the past,
present and future, Boreas, 37, 483–507, doi:10.1111/j.1502-
3885.2008.00057.x, 2008.
Roberts, H. M., Muhs, D. R., Wintle, A. G., Duller, G. A. T.,
and Bettis, E. A.: Unprecedented last-glacial mass accumula-
tion rates determined by luminescence dating of loess from
western Nebraska, Quat. Res., 59, 411–419, doi:10.1016/S0033-
5894(03)00040-1, 2003.
Roberts, H. M., Wintle, A. G., Maher, B. A., and Hu, M.:
Holocene sediment-accumulation rates in the western Loess
Plateau, China, and a 2500-year record of agricultural ac-
tivity, revealed by OSL dating, The Holocene, 11, 477–483,
doi:10.1191/095968301678302913, 2001.
Röthlisberger, R., Mulvaney, R., Wolff, E. W., Hutterli, M. A.,
Bigler, M., Sommer, S., and Jouzel, J.: Dust and sea-salt vari-
ability in central East Antarctica (Dome C) over the last 45 kyrs
and its implications for southern high-latitude climate, Geophys.
Res. Lett., 29, 1963, doi:10.1029/2002GL015186, 2002.
Rousseau, D.-D., Antoine, P., Gerasimenko, N., Sima, A., Fuchs,
M., Hatté, C., Moine, O., and Zoeller, L.: North Atlantic abrupt
climatic events of the last glacial period recorded in Ukrainian
loess deposits, Clim. Past, 7, 221–234, doi:10.5194/cp-7-221-
2011, 2011.
Le Roux, G., Fagel, N., De Vleeschouwer, F., Krachler, M., De-
baille, V., Stille, P., Mattielli, N., van der Knaap, W. O., van
Leeuwen, J. F. N., and Shotyk, W.: Volcano- and climate-
driven changes in atmospheric dust sources and fluxes since
the Late Glacial in Central Europe, Geology, 40, 335–338,
doi:10.1130/G32586.1, 2012.
Ruth, U., Wagenbach, D., Bigler, M., Steffensen, J. P., Röth-
lisberger, R., and Miller, H.: High-resolution micropar-
ticle profiles at NorthGRIP, Greenland: case studies of
the calcium-dust relationship, Ann. Glaciol., 35, 237–242,
doi:10.3189/172756402781817347, 2002.
Ruth, U., Wagenbach, D., Steffensen, J. P., and Bigler, M.: Continu-
ous record of microparticle concentration and size distribution in
the central Greenland NGRIP ice core during the last glacial pe-
riod, J. Geophys. Res., 108, 4098, doi:10.1029/2002JD002376,
2003.
Ruth, U., Barbante, C., Bigler, M., Delmonte, B., Fischer, H.,
Gabrielli, P., Gaspari, V., Kaufmann, P., Lambert, F., Maggi,
V., Marino, F., Petit, J.-R., Udisti, R., Wagenbach, D., Wegner,
A., and Wolff, E. W.: Proxies and Measurement Techniques for
Mineral Dust in Antarctic Ice Cores, Environ. Sci. Technol., 42,
5675–5681, doi:10.1021/es703078z, 2008.
Sapkota, A., Cheburkin, A. K., Bonani, G., and Shotyk, W.: Six
millennia of atmospheric dust deposition in southern South
America (Isla Navarino, Chile), The Holocene, 17, 561–572,
doi:10.1177/0959683607078981, 2007.
Schulz, M., Balkanski, Y. J., Guelle, W., and Dulac, F.: Role
of aerosol size distribution and source location in a three-
dimensional simulation of a Saharan dust episode tested against
satellite-derived optical thickness, J. Geophys. Res., 103, 10579,
doi:10.1029/97JD02779, 1998.
Schüpbach, S., Federer, U., Kaufmann, P. R., Albani, S., Barbante,
C., Stocker, T. F., and Fischer, H.: High-resolution mineral dust
and sea ice proxy records from the Talos Dome ice core, Clim.
Past, 9, 2789–2807, doi:10.5194/cp-9-2789-2013, 2013.
Serno, S., Winckler, G., Anderson, R. F., Hayes, C. T., McGee, D.,
Machalett, B., Ren, H., Straub, S. M., Gersonde, R., and Haug, G.
H.: Eolian dust input to the Subarctic North Pacific, Earth Planet.
Sci. Lett., 387, 252–263, doi:10.1016/j.epsl.2013.11.008, 2014.
Siegel, D. A. and Armstrong, R. A.: Corrigendum to “Trajectories
of sinking particles in the Sargasso Sea: modeling of statistical
funnels above deep-ocean sediment traps” [Deep-Sea Res. 44,
1519–1541], Deep-Sea Res., 49, 1115–1116, 2002.
Siegel, D. A. and Deuser, W. G.: Trajectories of sinking particles
in the Sargasso Sea: modeling of statistical funnels above deep-
ocean sediment traps, Deep-Sea Res., 44, 1519–1541, 1997.
Sirocko, F., Sarnthein, M., Lange, H., and Erlenkeuser, H.: Atmo-
spheric summer circulation and coastal upwelling in the Arabian
Sea during the Holocene and the last glaciation, Quat. Res., 36,
72–93, doi:10.1016/0033-5894(91)90018-Z, 1991.
Sun, J. M., Kohfeld, K. E., and Harrison, S. P.: Records of aeolian
dust deposition on the Chinese Loess Plateau during the Late
Quaternary, Technical Reports – Max-Planck-Institute für Bio-
geochemie 1, pp 318, 2000.
Steffensen, J. P.: The size distribution of microparticles from se-
lected segments of the Greenland Ice Core Project ice core repre-
senting different climatic periods, J. Geophys. Res., 102, 26755,
doi:10.1029/97JC01490, 1997.
Steffensen, J. P., Andersen, K. K., Bigler, M., Clausen, H. B., Dahl-
Jensen, D., Fischer, H., Goto-Azuma, K., Hansson, M., Johnsen,
S. J., Jouzel, J., Masson-Delmotte, V., Popp, T., Rasmussen, S.
O., Röthlisberger, R., Ruth, U., Stauffer, B., Siggaard-Andersen,
M.-L., Sveinbjörnsdóttir, A. E., Svensson, A., and White, J. W.
C.: High-resolution Greenland ice core data show abrupt cli-
mate change happens in few years., Science, 321, 680–684,
doi:10.1126/science.1157707, 2008.
Stevens, T. and Lu, H.: Optically stimulated luminescence dating
as a tool for calculating sedimentation rates in Chinese loess:
Clim. Past, 11, 869–903, 2015 www.clim-past.net/11/869/2015/
S. Albani et al.: Twelve thousand years of dust 903
comparisons with grain-size records, Sedimentology, 56, 911–
934, doi:10.1111/j.1365-3091.2008.01004.x, 2009.
Stevens, T., Armitage, S. J., Lu, H. Y., and Thomas, D. S. G.: Sed-
imentation and diagenesis of Chinese loess: Implications for the
preservation of continuous high-resolution climate records, Ge-
ology, 34, 849-852, doi:10.1130/G22472.1, 2006.
Stevens, T., Thomas, D. S. G., Armitage, S. J., Lunn, H. R., and Lu,
H. Y.: Reinterpreting climate proxy records from late Quaternary
Chinese loess: A detailed OSL investigation, Earth-Sci. Rev., 80,
111–136, 2007.
Stevens, T., Lu, H., Thomas, D. S. G., and Armitage, S. J.: Optical
dating of abrupt shifts in the late Pleistocene East Asian Mon-
soon, Geology, 36, 415–418, doi:10.1130/G24524A.1, 2008.
Street-Perrott, F. A. and Perrott, R. A.: Holocene vegetation, lake
levels and climate of Africa. In: Global climates since the last
glacial maximum, 318–356, University of Minnesota Press, Min-
nesota, 1993.
Sun, J. M., Kohfeld, K. E., and Harrison, S. P.: Records of aeolian
dust deposition on the Chinese Loess Plateau during the Late
Quaternary, Technical Reports – Max-Planck-Institute für Bio-
geochemie, 1, 318 pp., 2000.
Sun, D., Chen, F., Bloemendal, J., and Su, R.: Seasonal variability of
modern dust over the Loess Plateau of China, J. Geophys. Res.,
108, 4665, doi:10.1029/2003JD003382, 2003.
Sun, Y., Clemens, S. C., Morrill, C., Lin, X., Wang, X., and
An, Z.: Influence of Atlantic meridional overturning circula-
tion on the East Asian winter monsoon, Nat. Geosci., 5, 46–49,
doi:10.1038/NGEO1326, 2012.
Tegen, I., Harrison, S. P., Kohfeld, K. E., Prentice, I. C., Coe, M.,
and Heimann, M.: The impact of vegetation and preferential
source areas on the dust aerosol cycle, J. Geophys. Res., 107,
4576, doi:10.1029/2001JD000963, 2002.
Thompson, L. G., Mosley-Thompson, E., Davis, M. E., Lin,
P. N., Henderson, K. A., Cole-Dai, J., Bolzan, J. F., and
Liu, K. B.: Late Glacial Stage and Holocene tropical ice
core records from Huascaran, Peru, Science, 80, 269, 46–50,
doi:10.1126/science.269.5220.46, 1995.
Thompson, L. G., Yao, T., Davis, M. E., Henderson, K. A., Mosley-
Thompson, E., Lin, P.-N., Beer, J., Synal, H.-A., Cole-Dai, J.,
and Bolzan, J. F.: Tropical Climate Instability: The Last Glacial
Cycle from a Qinghai-Tibetan Ice Core, Science, 80, 276, 1821–
1825, doi:10.1126/science.276.5320.1821, 1997.
Tiedemann, R., Sarnthein, M., and Shackleton, N. J.: Astronomic
timescale for the Pliocene Atlantic δ18O and dust flux records
of Ocean Drilling Program Site 659, Paleoceanography, 9, 619–
638, doi:10.1029/94PA00208, 1994.
Unnerstad, L. and Hansson, M.: Simulated airborne particle size
distributions over Greenland during Last Glacial Maximum,
Geophys. Res. Lett., 28, 287–290, 2001.
Veres, D., Bazin, L., Landais, A., Toyé Mahamadou Kele, H.,
Lemieux-Dudon, B., Parrenin, F., Martinerie, P., Blayo, E., Blu-
nier, T., Capron, E., Chappellaz, J., Rasmussen, S. O., Severi,
M., Svensson, A., Vinther, B., and Wolff, E. W.: The Antarctic
ice core chronology (AICC2012): an optimized multi-parameter
and multi-site dating approach for the last 120 thousand years,
Clim. Past, 9, 1733–1748, doi:10.5194/cp-9-1733-2013, 2013.
Vinther, B. M., Clausen, H. B., Johnsen, S. J., Rasmussen, S. O.,
Andersen, K. K., Buchardt, S. L., Dahl-Jensen, D., Seierstad, I.
K., Siggaard-Andersen, M.-L., Steffensen, J. P., Svensson, A.,
Olsen, J., and Heinemeier, J.: A synchronized dating of three
Greenland ice cores throughout the Holocene, J. Geophys. Res.,
111, D13102, doi:10.1029/2005JD006921, 2006.
Wanner, H., Beer, J., Bütikofer, J., Crowley, T. J., Cubasch, U.,
Flückiger, J., Goosse, H., Grosjean, M., Joos, F., Kaplan, J. O.,
Küttel, M., Müller, S. A., Prentice, I. C., Solomina, O., Stocker,
T. F., Tarasov, P., Wagner, M., and Widmann, M.: Mid- to Late
Holocene climate change: An overview, Quat. Sci. Rev., 27,
1791–1828, doi:10.1016/j.quascirev.2008.06.013, 2008.
Weltje, G. J.: End-member modeling of compositional data: numeri-
cal statistical algorithms for solving the explicit mixing problem,
Math. Geol., 29, 503–549, 1997.
Winckler, G., Anderson, R. F., Fleisher, M. Q., McGee, D.,
and Mahowald, N.: Covariant glacial-interglacial dust fluxes
in the equatorial Pacific and Antarctica, Science, 320, 93–96,
doi:10.1126/science.1150595, 2008.
Wintle, A. G. and Murray, A. S.: A review of quartz optically stim-
ulated luminescence characteristics and their relevance in single-
aliquot regeneration dating protocols, Radiat. Meas., 41, 369–
391, doi:10.1016/j.radmeas.2005.11.001, 2006.
Winton, V. H. L., Dunbar, G. B., Bertler, N. A. N., Millet,
M.-A., Delmonte, B., Atkins, C. B., Chewings, J. M., and
Andersson, P.: The contribution of aeolian sand and dust
to iron fertilization of phytoplankton blooms in southwestern
Ross Sea, Antarctica, Global Biogeochem. Cy., 28, 423–436,
doi:10.1002/2013GB004574, 2014.
Xie, R. C. and Marcantonio, F.: Deglacial dust provenance
changes in the Eastern Equatorial Pacific and implications for
ITCZ movement, Earth Planet. Sci. Lett., 317–318, 386–395,
doi:10.1016/j.epsl.2011.11.014, 2012.
Zdanowicz, C. M., Zielinski, G. A., Wake, C. P., Fisher, D. A., and
Koerner, R. M.: A Holocene Record of Atmospheric Dust Depo-
sition on the Penny Ice Cap, Baffin Island, Canada, Quat. Res.,
53, 62–69, doi:10.1006/qres.1999.2091, 2000.
Zender, C. S., Newman, D., and Torres, O.: Spatial hetero-
geneity in aeolian erodibility: Uniform, topographic, geomor-
phic, and hydrologic hypotheses, J. Geophys. Res., 108, 4543,
doi:10.1029/2002JD003039, 2003.
Ziegler, C. L., Murray, R. W., Hovan, S. A., and Rea, D. K.: Resolv-
ing eolian, volcanogenic, and authigenic components in pelagic
sediment from the Pacific Ocean, Earth Planet. Sci. Lett., 254,
416–432, 2007.
Zielinski, G. A. and Mershon, G. R.: Paleoenvironmental im-
plications of the insoluble microparticle record in the GISP2
(Greenland) ice core during the rapidly changing climate of the
Pleistocene-Holocene transition, Geol. Soc. Am. Bull., 109, 547–
559, doi:10.1130/0016-7606(1997)109, 1997.
www.clim-past.net/11/869/2015/ Clim. Past, 11, 869–903, 2015