twi lasersnake2 report 22883 11 13 final twi...5.1 beam characterisation 5 5.1.1 single dimensional...
TRANSCRIPT

22883/11/13 TWI Ltd
Safety Case First Experimental Report
Deliverable D3.27 (v1.1 D3.23)
TWI-011 12-13
LaserSnake2 110128

22883/11/13 TWI Ltd
Table of Contents
1 Introduction 3
2 Definitions 3
3 Equipment 4
3.1 Laser source 4
3.2 Focussing lenses 4
4 Materials 4
4.1 Materials in the cave 4
4.2 Materials that have been processed in the work presented below 4
5 Experimental Approach 5
5.1 Beam characterisation 5 5.1.1 Single dimensional beam profiling by moving mirror edge 5
5.2 Damage threshold beam profiling 8 5.2.1 3D visualisation of beam profile via silica granule sintering 13
5.3 Temperature monitoring of stable illumination 14 5.3.2 Temperature fall time 16
5.4 Temperature monitoring of moving beam 18
5.5 Temperature monitoring under ablation conditions, establishing damage thresholds for various materials 20
5.6 Monitoring of emissions beyond the cutting point 22
5.7 Tests on beam absorption materials 25
5.8 Tests on spark arrester materials 26
5.9 Worked example defining a safety sphere based on results obtained to date. 32
6 Disclaimer 33 Tables 1- 2 Figures 1-15 Appendix: Method for temperature measurement

22883/11/13 3 TWI Ltd
1 Introduction
This document is the first report of experimental progress in Task 3.7 of the Lasersnake2 project. Results based on the suggested work scope presented in Deliverable D3.22 are presented in this report.
The report covers the following subjects:
Beam Characterisation. Temperature monitoring of different materials during stable laser beam irradiation
conditions. Temperature monitoring with a moving beam. Temperature monitoring under ablation conditions. Damage threshold measurements. Tests on potential beam arresters. Tests on potential spark arresters Data to support the ‘safety sphere’ concept.
2 Definitions
For the purposes of the safety case study, the following definitions have been applied: Laser source – An electro-optic device that converts electric power to optical power in the form of coherent laser radiation and makes it available externally for use as a power beam. Cutting head – An engineered assembly of mechanical and optical parts, occasionally including electric sensors, pneumatic and gas jet parts. The cutting head collects laser light arriving at its input from a Laser source and focusses it to a point set at a predefined distance from one of its parts.
Spot size – The diameter of a focussing laser beam in any position along its propagating axis. This is usually defined by the perimeter where the beam intensity contains 86% of the beam energy, if Gaussian optics are used to describe beam propagation. The minimum spot size (at a beam focus) is also often referred to as the beam waist diameter. Experimentally, beam diameter is sometimes described at the ‘99%’ intensity points as this is usually easier to see on beam ‘imprints’. Collimating lens – A lens system comprising a single lens or a combination of lenses that receives the diverging laser beam as it leaves the optical fibre and renders this close to parallel for subsequent focussing to a small spot. Focussing lens – A lens system comprising a single lens or a combination (more usual for very short focal lengths) of lenses that is used inside the cutting head in order to focus a beam of light to a predefined spot size and distance. Beam caustic – Measured evolution of the beam radius along the propagation direction. Acting beam – An uninterrupted converging laser beam that is used for a cutting application. It relates to the beam between the focussing lens and the beam waist position. Stray beam – Any bundle of laser light rays that propagates beyond the beam waist of the laser cutting system, (ie beyond the acting beam) as a result of partial or full transmission, reflection or diffraction of the acting beam. Breakthrough beam – A particular stray beam which is a bundle of laser light rays that propagates beyond the processing spot of the laser cutting system, as a result of partial or full transmission of the acting beam. A breakthrough beam propagates in the same direction as the acting beam. Spark arrester – A piece of material, a structure or an enclosure that stops sparks produced in the cutting process, from propagating further than the limits defined by itself.
22883/11/13 4 TWI Ltd
Beam arrester - A piece of material, a structure or an enclosure that stops laser light of a specific wavelength from propagating further than the limits defined by itself. Beam parameter product - The beam parameter product (BPP) of a laser beam is defined as the product of beam radius (measured at the beam waist – smallest possible spot size achievable with the specific focussing lens) and the beam divergence half-angle (measured in the far field). The usual units are mm mrad (millimeters times milliradians). The BPP is often used to specify the beam quality of a laser beam: the higher the beam parameter product, the lower is the beam quality. Depth of focus - Length along the path of beam propagation, either side of the focus, in which the spot size magnitude does not grow by more than 5% that of the smallest achievable spotsize at focus. It is calculated in the following manner: DoF = 8 BPP (ρ²-1)0.5 (f/D)² Where BPP = beam parameter product, ρ = 5% tolerance factor defined above, f = the lens focal length and D is the beam spot size at the focussing lens.
3 Equipment
3.1 Laser source
A 5kW Yb fibre laser source emitting at 1.074µm has been used for all the experiments described in this report. A fibre laser source was considered the best choice for the Lasersnake2 experiments due to the inherent capability of producing a high quality collimated optical beam. The high quality of the emitted beam implies that the beam can achieve a very small spot at long focal distances and maintain a long depth of focus, qualities that are most useful in laser cutting.
3.2 Focussing lenses
The work described in this report used either 250mm focal length (FL) or 500mm FL focussing lenses, as used in other parts of WP3.
4 Materials
4.1 Materials in the cave
During the Optioneering and Deselection meeting, a low detail specification of existing cell materials was drafted. Materials with the potential to interact with the beam include:
Carbon Steel structures. Manganese steel. Gaiter polymer sheathing of the MSM equipment installed on the walls. Concrete material as used for the construction of the cave walls, coated with paint or
naked. Lead loaded radiation shielding window glass. Cabling and hose sheath polymer materials. Electronic and electrical devices, such as cameras, switches, etc.
4.2 Materials that have been processed in the work presented below
The materials that have been processed in the work reported here were:
Carbon steel plates of various thicknesses Graphite plates of various thicknesses Cast concrete Glass granules in the form of sand Fibreboard material Calcite based fire retardant material Silica fibre based fire retardant material

22883/11/13 5 TWI Ltd
Black PVC polymer Clear PLA polymer Graphoil (exfoliated graphite sheet) Polymer based laser safety ‘glass’, FILTRON.
5 Experimental Approach
5.1 Beam characterisation
The beam emitted by the 5kW fibre laser source has been profiled in the region of the beam focus within another work sub-package dealing with the cutting performance of diffractive optical elements. Beam characterisation using 120mm collimating and 250mm focussing lenses has been performed within the Safety Case work, with the goal to characterise the beam at long distances from the focal point of the optical system, ie at points it might interact with cell materials. The beam was delivered through a 150micron diameter fibre for this study. Characterisation began near the focus so as to be able to correlate data and extended to distances of a few meters away from the focus. The measurements consisted of determining single dimensional beam profiles using the ‘moving mirror edge’ method and as two dimensional profiles, using the ‘photosensitive surface change threshold approach’. A three dimensional imprint of the beam was also attempted using silica granules.
5.1.1 Single dimensional beam profiling by moving mirror edge
To measure the beam profile in one dimension a mirror edge was passed through the propagating beam while its power was constantly measured. The mirror slowly reveals or hides the beam. The recorded break through beam on the power monitor is essentially the volume integral of the beam intensity in Cartesian coordinates (i.e. x, y and intensity being the three dimensions that are being integrated), expressed progressively as a limited integral in the dimension that the mirror is moving. Hence by mathematical regression of the integral equation against the measured power per mirror displacement for the parameters centre of the X coordinate and beam waist, at a particular Z can be deduced. Alternatively, by differentiating the measured beam power per mirror displacement, uni-axial beam profile can be determined at a specific distance from the focus. Figure 1 demonstrates the main concept. For simplicity, it is assumed that the laser emits a Gaussian beam or very near to that. The effective spot size can thus be deduced at any point along the beam path.
Figure 1 Beam size and profile determination. In order to derive the beam dimensions (known as the ‘waist’) for each distance from the focus where a measurement took place, a curve of a Gaussian beam integral was fitted via the MS Excel Solver tool, using the non-linear regression algorithm, onto the measured values of breakthrough power. The mathematical expressions used are given below:
MirrorLens
Carbon block damp
Power meter
Beam transmitted
Focal point
Z
X
Y

22883/11/13 6 TWI Ltd
Beam intensity of a Gaussian beam of maximum intensity Io with a 2ω diameter waist (also known as spot size), ω(z) at a radius r from the central beam axis and distance z from the focus where the minimum beam waist is ωo .
Ir,z = Io·(ωo/ω(z))²·exp(-2·r²/ω(z)²) [1] Converting equation (1) into Cartesian coordinates where the centre of the beam lies at µ,ν in the x and y dimensions respectively and replacing Io = 2·P·ωo/π (P=maximum power of the incident beam) we have: Ix,y = 2·P·exp(-2·((x-µ)²+(y-ν)²)/ω(z)²) / π·ω(z)² [2]
If the mirror is scanning through the beam in the x dimension, then the integral of the Gaussian intensity surface profile in the y dimension is from -∞ to +∞ and constant, equal to:
-∞ to +∞ʃ exp(-2·(y-ν)²)/ω(z)²) dy = (π·ω(z)²/2)0.5 [3]
Consequently, the limited integral, (by the degree of displacement of the mirror against the beam profile- integral of intensity), representing transmitted power further than the mirror is equal to: -∞ to xʃ Ix,y dx = P·(1-erf((x-µ)·e/ω(z)))/2 [4]
Equation [4] was fitted against the measured power values obtained against mirror displacement in order to determine the beam spot size at a specific distance from the focus. Figure 2 is a typical plot of the measured power values for a 1kW incident beam taken at 260mm from the focus, with the fitted Gaussian curve and the intensity profile derived from differentiated measurements.
Figure 2 Single direction beam profile measurements (solid line) of a 1kW beam, at 260mm from the beam focus. Fitted Gaussian integral to the measured points (dashed line) and integrated measured points against 1mm displacements, indicating power density per mm² (dotted line, right hand axis). Measurements were performed at 5kW and 1kW incident power settings, and at distances from the focus ranging from 260mm to 3000mm. Figure 3 is a plot of modelled beam propagation up to 3200mm from the focus of a 250mm FL lens, assuming a beam delivery system with 150µm diameter fibre and a 120mm FL collimator. The plot also displays the fitted beam waists that were derived from the measured data, as points. For the powers of 1
0
10
20
30
40
50
60
70
0
200
400
600
800
1000
0 5 10 15 20 25 30 35
Beam
intensity in
W/m
m²
Measured power of revealed beam
in W
Mirror displacement in mmMeasured Power Fitted Gaussian integral
Spot size on Fitted integral Differentiatedpoints

22883/11/13 7 TWI Ltd
and 5kW, the beam diameter change is quite linear with distance, over the range of distances measured. It is interesting to note that the data for 1kW match with a 6mm.mrad beam parameter product for the laser beam, while the data for 5kW match with a 6.6mm.mrad beam parameter product. This can be explained for a normal un-filtered laser resonator by considering that a higher q value, (amplification capacity of the laser source medium) which in this case is achieved by increasing the pumping diode current (laser source driving current), will enable more modes to resonate in the amplifying resonator. In multiple module fibre lasers, more modules are being switched on when emitting 5kW of output power instead of 1kW, thus the beam quality is diluted by more lower order mode beams being multiplexed into the output fibre at somewhat oblique angles to each other, thus resulting in a multimode beam of near Gaussian profile (away from focus). Indeed the 5kW laser system by IPG that was used for these experiments is sold as a multi-mode laser source and not single mode which would correspond to a pure Gaussian beam intensity profile at the highest power capacity.
Figure 3 Comparison between modelled beam propagation and fitted beam waist results from a 6.0mm.mrad beam matching the 1kW data and a 6.6mm.mrad beam matching the 5kW data. The 500W data are displayed for comparison at 3 distances from lens only. From the measurements taken using the proposed beam generation and delivery described above, the system can be characterised as below:
Laser source: Diode pumped Fibre Multimode. Laser maximum power: 5kW. Beam delivery fibre diameter: 150µm. Beam collimating lens: 120mm focal length. Beam focussing lens: 250mm focal length. Beam parameter product: 6.0 and 6.6 mm.mrad for 1 and 5kW respectively. Beam divergence half angle: 22.4 and 24.4 mrad for 1 and 5kW respectively. Depth of focus: ±1.30 and ±1.18mm for 1 and 5kW respectively.
The implications for the project of this piece of work are believed to be:
Establishing a scientifically robust method for characterising, in terms of beam
diameter, a focussed beam at long distances from the focus point of a lens.
0
50
100
150
200
250
0 500 1000 1500 2000 2500 3000 3500
Experimentally derived sport size in
mm
Distance from focus in mm
5kW 1kW
500W 6.6mm.mrad modelled beam
6.0mm.mrad modelled beam

22883/11/13 8 TWI Ltd
Assuming that the laser and optical system are the ones described above, the equation for defining beam spot size at any distance is:
ω(z) = ωo (1 + z /(π ωo² / λ) )0.5
Where z = the distance from the focal point at which the spot size is being defined, ωo = beam spot size at focus, λ = laser wavelength.
Assuming that the laser and optical system are the ones described above, the equation
for defining beam intensity is:
I(z) = 4·P / π·ω(z)2 Where P is the maximum beam power being used.
5.2 Damage threshold beam profiling
A further classic method for obtaining beam size and shape information, is via direct material irradiation with a propagating laser beam. Paper, sheet metal, photographic paper, and various polymers and fibre-glass protection materials have been tested against this method. The experiments took place with the optical system described above in 5.1.2. For most of these tests a 500mm focal length focussing lens was used, while a 250mm lens was used in specific tests only. The objective of the tests was to prove the method of time effective profiling of a laser beam via the use of sacrificial material and suggest possible materials best suited for beam profiling using this technique.
The damage effects noted on the materials will be the result of power density applied for a limited amount of time on a specific material, with a specific surface finish, and thus are expected to be independent of the expansion characteristics of the beam or its profile. However, as the beam intensity changes over the irradiation area, unless it is an exact top-hat beam profile, various different effects are being noticed. These can be loss of material due to ablation, melting or vitrification, oxidation of the surface, thermally induced chemical changes to the material, changes in the surface structure or changes in colour of the material. For a Gaussian beam, these changes might be expected to occur as concentric rings around the centre of the beam. The materials tested are listed below:
Printed black paper (on conventional inkjet photocopier). Undeveloped photographic paper exposed to radiation and then developed under
daylight for 24h. Spray painted aluminium sheet 0.9mm thickness. (Single layer was created by
consecutive overlapping passes by 40%, at speed of ~100mm/s with black acrylic matt paint).
Black anodised mat finished aluminium sheet, 0.5mm thickness. Vermiculux® calcium silicate based fire protection board. Promatect 250, silica based fire protection board.
Figure 4 demonstrates the concept of relating damage effects observed during the irradiation of Vermiculux (Calcium Silicate based fire protection board) material against a Gaussian beam profile. On the picture, one can observe an outer ring of darker discoloration of the material, followed by a lighter coloured thin discoloured ring which is in turn surrounding a concavity that has resulted from intense material ablation. In order to identify what damage level corresponds to the beam size, the diameter of the outer perimeter of these rings was measured for the aforementioned materials at various distances from the focal point and different applied powers and exposure times (as different materials react differently). Hence the measured imprint diameters represent the material area that was irradiated with a power density above a certain magnitude. This is not necessarily the intensity that corresponds to the beam intensity anticipated at the beam spot size (~86% of the maximum beam intensity). Ideally an imprint that is close in size to the beam imprint should be found.

22883/11/13 9 TWI Ltd
Figure 4 Laser beam induced damage on Calcium Silicate based material Vermiculux after irradiation for 1 sec at 5kW with a beam, defocussed at 18.25mm spot size, with superimposed 2D laser beam intensity profile corresponding to the central line of the imprinted damage and its power integral adjusted for height. Both graphs are indicating the concept and are displayed against arbitrary unit increment in the vertical axis. The pink arrows indicate where the beam spot size limits are expected on the imprint. For each material, certain changes that occurred consistently were observed and used for determining perceived beam spot size. Figure 5 shows a photograph of beam imprint on spray painted steel plate to indicate these changes, used to establish beam diameter.
Figure 5. Laser beam induced damage on spray painted steel plate. The material was painted with Black Plasti-kote spray Matt Super (B&Q) and irradiated with a 5kW beam defocussed to 116.86mm spot size. The imposed graph shows the calculated beam
22883/11/13 10 TWI Ltd
intensity profile for that spot size and it’s integral in one dimension. The green triangles demonstrate the beam spot size limits as derived in 5.1.1
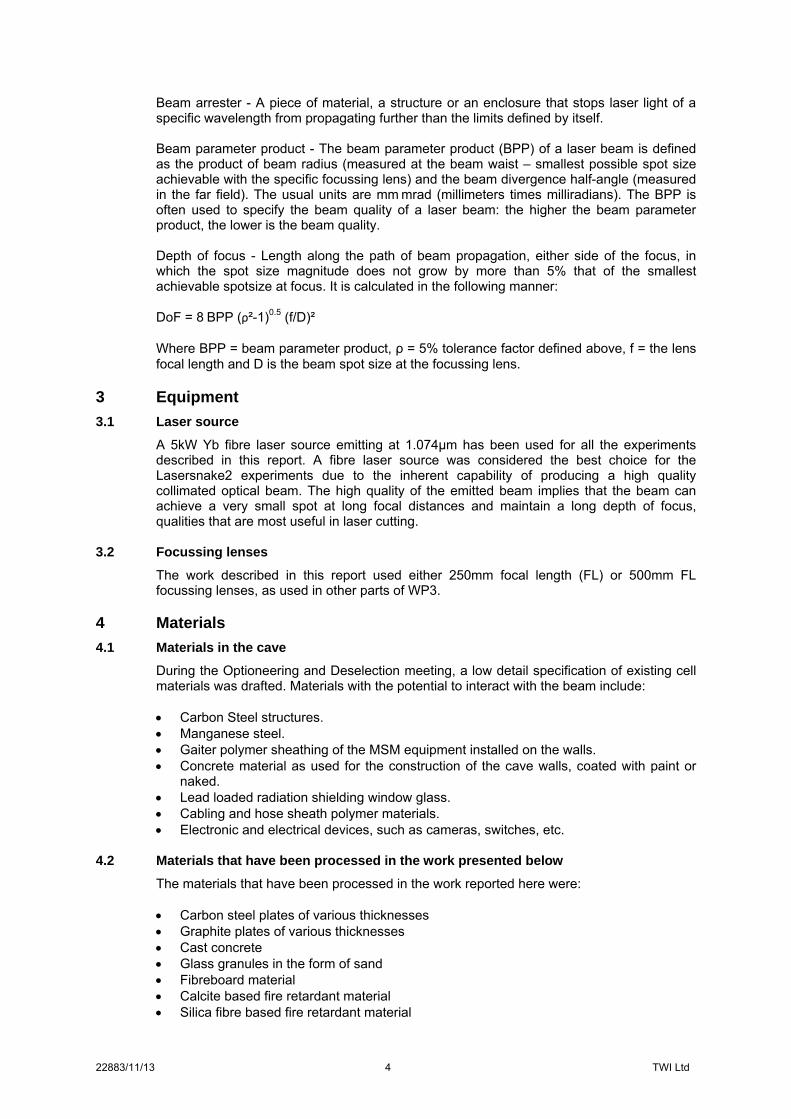
Figure 6 Contains a series of plotted data of beam diameters as measured on imprints, against propagation distance arising from beam irradiations on the materials tested. On each of the graphs a solid green line represents the calculated beam diameter derived in 5.1.1 above. Irradiation times of 1ms (papers) to 1s (fibre boards) were used.
At large distances from the focus, the beam intensity drops significantly and eventually cannot match the damage threshold required for obtaining the change. At close distances to the focus, below 100mm, thermal dissipation effects distort the material to a greater extent and thus larger spots can be perceived in error. It is noteworthy that for some materials the different changes induced by the laser radiation could be useful indicators of beam diameter over a range of propagation distances. The implications for the project of this piece of work are believed to be:
A material that shows good consistency over a large range of distances is the black
anodised aluminium, probably due to the high thermal conductivity of the base material and a higher damage threshold of the changes observed.
The painted aluminium sheet did not perform as well, as paint has a much lower damage threshold than the metal itself.
Printed black paper can be used, but irradiation times or emitted power levels must be adjusted accordingly throughout the interrogation distance. Also, due to its low damage threshold for shading, this paper is useful for checking beam diameter at long distances (1-5m for example).
The Vermiculux material also proves quite consistent in results, with power densities of 1 to 20W/mm² (for the 250mm lens used here, these correspond to distances of 1 to ~2.5m)
a)
0
2
4
6
8
10
12
14
16
18
20
‐400 ‐200 0 200 400 600
Spot size in
mm
Distance from focal point in mm
Printed Paper
5kW,1ms‐shaded
5kW,1ms‐White
5kW,1ms‐Burnt
1kW,2ms‐Shaded
1kW,2ms‐White
1kW,2ms‐Burnt
1kW,1ms‐Shaded
1kW,1ms ‐ White
1kW,1ms‐Burnt
modelled beam

22883/11/13 11 TWI Ltd
b) Figure 6 Perceived beam spotsize on the shaded and white boundaries of the beam print created during irradiation on various materials. The thick light green line indicates the modelled beam spot size for comparison with the results: a) Paper printed in conventional photocopier with a full black image; b) Spray painted aluminium in black, all results with a 5kW power setting;
c)
0.00
2.00
4.00
6.00
8.00
10.00
12.00
14.00
16.00
18.00
20.00
0 200 400
Spot size in
mm
Distance from focal point in mm
Spray painted aluminium
Modelled reference
5ms‐Shaded
5ms ‐ Grey
5ms ‐ Exposed Metal
5ms ‐ Molten
1ms ‐ Shaded
1ms ‐ Grey
1ms ‐ Exposed Metal
1ms ‐ Molten
0.00
2.00
4.00
6.00
8.00
10.00
12.00
14.00
16.00
18.00
20.00
0 100 200 300 400 500
Spot size in
mm
Distance from focal point in mm
Ptotographic paper
Modelled reference
1ms‐Shaded
1ms‐Grey
1ms‐White
1ms‐Ash
25ms‐Shaded
25ms‐Grey
25ms‐White
25ms‐Ash

22883/11/13 12 TWI Ltd
d)
Figure 6 (continued). Perceived beam spotsize on the shaded and white boundaries of the beam print created during irradiation on various materials. The thick light green line indicates the modelled beam spot size for comparison with the results: c) Photographic paper, all results with a 5kW power setting; d) Black anodised aluminium sheet;
e)
0.00
20.00
40.00
60.00
80.00
100.00
120.00
‐1000 0 1000 2000 3000 4000
Spot size i nmm
Distance from focal point in mm
Blackened aluminium
Modelled reference
5kW,1ms ‐ Shaded
5kW,1ms‐Metal
5kW,5ms‐Shaded
5kW,5ms ‐ Metal
5kW,10ms ‐ Shaded
5kW,10ms ‐ Metal
0.00
1.00
2.00
3.00
4.00
5.00
6.00
7.00
8.00
9.00
10.00
‐200 ‐100 0 100 200
Spot size in
mm
Distance from focal point in mm
Blackened aluminium ‐ closer to focus
Modelled reference
5kW,1ms ‐ Shaded
5kW,1ms‐Metal
5kW,5ms‐Shaded
5kW,5ms ‐ Metal
5kW,10ms ‐ Shaded
5kW,10ms ‐ Metal

22883/11/13 13 TWI Ltd
f)
Figure 6 (continued). Perceived beam spotsize on the shaded and white boundaries of the beam print created during irradiation on various materials. The thick light green line indicates the modelled beam spot size for comparison with the results: e) Same as –d, emphasized only in the region around the focus; f) Vermiculux and Promatect 250 fire protection boards, results with a 5kW power setting,
1 second irradiation time. 5.2.1 3D visualisation of beam profile via silica granule sintering
Glass granules of sizes between 10 and 150µm were placed in a 400ml steel container. The mass was flattened by lightly shaking the container, allowing gravity to define a horizontal plane. The silica granule mass was illuminated at a specific distance from the 250mm FL focussing lens. The beam was directed at an angle normal to the gravity defined normal plane. The vitrified aggregation of granules was then retracted from the rest of the granule mass. The reversed vitrified aggregation is expected to represent the 3D shape of the illumination beam. A new surface was created for each illumination. The following illuminations were performed under these conditions:
3 second duration of illumination at 3kW power setting, and 650mm from lens 10 second duration of illumination at 5kW power setting, and 650mm from lens 20 second duration of illumination at 5kW power setting, and 650mm from lens 10 second duration of illumination at 5kW power setting, and 500mm from lens 20 second duration of illumination at 5kW power setting, and 750mm from lens 50 second duration of illumination at 5kW power setting, and 750mm from lens
0.00
20.00
40.00
60.00
80.00
100.00
120.00
0 1000 2000 3000 4000
Spot size in
mm
Distance from focal point in mm
Fire protection boards
Modelled reference
Vermiculux ‐Discoloured
Vermiculux ‐ White
Promatect 250 ‐Surface Damage
Promatect 250 ‐Vitrified

22883/11/13 14 TWI Ltd
a)
Figure 7 Sintered silica granules transformed into a 3D imprint of the beam. The silica granules sample was irradiated for 10s at 650mm from focus with 5kW power. The first two illumination conditions returned very shallow surface melts of the granules and no usable imprint. Illuminations for longer than 10s generated deeper imprints of the beam but the extremities curling in due to surface tension governing the post illumination cooling process. When irradiated for 10 seconds with a 5kW beam, a good imprint of the beam profile was generated by fusion of the granules, with minimum interference from post-illumination effects. The imprint diameter corresponded to 93% of the calculated beam diameter at this position. The implications for the project of this piece of work are believed to be: A method for confirming the intensity profile of the beam is as expected (i.e. near-
Gaussian and circular) at different distances form the focus, is established.
5.3 Temperature monitoring of stable illumination
5.2.1 Introduction Temperature rise and fall times on various materials irradiated by the laser beam have been investigated for beam sizes occurring at distances from the focal point of up to 500mm with the 500mm FL lens and up to 10mm with the 250mm FL lens. The temperature was monitored with a spot pyrometer, focused over a 2mm area in diameter. The pyrometer focus was concentric with the beam irradiated area, and in the middle of the two centres of the elliptic projection of the beam when irradiating at an angle to the material surface. Measurements were taken with 4 angles between the beam and the sample plane, 90º, 60º, 30º and 10º (grazing angle). The pyrometer used has a temperature measurement saturation limit of 1048ºC. It was found that when irradiating with 5kW of laser power at the distances from the focal point stated above, this limit was easily reached for all materials tested, which included steel, concrete and graphite. For the steel and concrete materials, reaching this saturation limit implies change of phase to a liquid (for some steels this condition is near the change of phase temperature). For the graphite material, it was observed that the material eventually reaches the point of sublimation, unless the illumination is with a 10mm spot size and at an angle greater than 30º, in which case, sublimation is minimal and nitrides may form on the surface. Experiments consisted of turning on the data acquisition from the pyrometer and then irradiating the sample, at a given distance from the beam focus with a given power for a given time.

22883/11/13 15 TWI Ltd
5.2.2 Temperature rise time analysis The rate of temperature rise rate was calculated from temperature values recorded using the IMPAC pyrometer as described in the Appendix. Figure 8 shows comparisons of temperature rise rates times measured as the temperature approached the saturation limit or the maximum recorded temperature. Note that the stated power densities of 6.3kW/mm², 254W/mm² and 63W/mm² correspond to calculated spot diameters of 1, 5 and 10mm diameter respectively, at 5kW power.
a) Figure 8 Temperature rise rates against power density and illumination angle, measured for: a) steel (15mm thickness);
b)
0
5
10
15
20
25
30
35
0 2000 4000 6000 8000
Temperature rise rate (ºK/m
s)
Power Density (W/mm²)
Steel
90º
60º
30º
10º
0
5
10
15
20
25
30
35
0 1000 2000 3000 4000 5000 6000 7000
Temperature rise rate (ºK/m
s)
Power Density (W/mm²)
Graphite
90º
60º
30º
10º

22883/11/13 16 TWI Ltd
c)
Figure 8 (continued). Temperature rise rates against power density and illumination angle, measured for: b) Graphite (12mm thickness); c) Concrete (45mm thickness). From the graphs it can be seen that the limit of temperature rise, near the saturation point of ~1000ºC is 33 ºK/ms, which is related to the 5kW laser power being delivered. As the beam gets larger the temperature rise rate drops. A more pronounced drop is seen as the beam approaches the grazing angle. The relationships appear to follow a non-linear trend similar to the sine of the illumination angle. It is also evident that when irradiating with a 5kW beam at angles larger than 30º from the sample surface and distances smaller than 0.5m from the focal point, exposure times of 1s will cause damage to any of the three materials. Meanwhile, if the illumination times are below 10ms and the beam diameter is greater than 1mm (20 to 50mm away from the focal point) all materials can withstand illumination. A temperature rise of around 300 to 400ºC will be expected under these conditions and perhaps some oxidation or minimum surface effects will occur in a normal atmosphere. This stands for all three materials.
The implications for the project of this piece of work are believed to be:
This observation will become useful when the analysis of beam transmission through a
material that is being cut is performed. If temporal transmissions of less than 10ms are observed during the cut, occurring at every mm of travel/cut distance, another surface can then be deposited safely (in terms of laser irradiation) behind the cut material, or in proximity to it, at only approximately 30 to 50mm.
Steels and graphite are expected to withstand prolonged exposure of several seconds when irradiated with beams close to a grazing angle of incidence and a beam spot size larger than 10mm.
5.3.2 Temperature fall time
Temperature fall times were also assessed in the same trials as above. Fall rates were calculated as the overall rate of temperature drop from the 90% point of the maximum temperature (or the pyrometer saturation temperature) to the 10% point. All fall rates are indicated as negative values as temperature change rates. As observed in Figure , the fall rates are between 6 and 20 ºK/s, for steel and graphite and much slower for concrete, between 3 and 7 ºK/s. It is also evident that the transition between a 5mm and a 10mm spot incident spot diameter enables higher temperature fall times. Thus with a larger spot, the energy has been distributed over a larger area and thus diffuses much faster than a small
0
5
10
15
20
25
30
0 1000 2000 3000 4000 5000 6000 7000
Temperature rise rate (ºK/m
s)
Power Density (W/mm²)
Concrete
90º
60º
30º
10º

22883/11/13 17 TWI Ltd
heated spot. There are small variations in the rates of change between the illumination angles. These are greater for steel and graphite, which exhibit metallic thermal conductivity rather than concrete which is expected to sustain most of the absorbed energy near the surface of the material. Temperature conductance in the grain interface of such a material is thus what governs the cool down process and it is not expected to change much with the temperature level of the grains themselves.
a) Figure 9 Temperature fall times against power density and illumination angle measured for: a) Steel (15mm thickness);
b)
‐18
‐16
‐14
‐12
‐10
‐8
‐6
‐4
‐2
0
0 1000 2000 3000 4000 5000 6000 7000
Temperature fall rate (ºK/s)
Power Density (W/mm²)
Steel
90º
60º
30º
10º
‐20
‐18
‐16
‐14
‐12
‐10
‐8
‐6
‐4
‐2
0
0 1000 2000 3000 4000 5000 6000 7000
Temperature fall rate (ºK/s)
Power Density (W/mm²)
Graphite
90º
60º
30º
10º

22883/11/13 18 TWI Ltd
c) Figure 9 (continued). Temperature fall times against power density and illumination angle measured for: b) graphite (12mm thickness); c) concrete (45mm thickness).
The implications for the project of this piece of work are believed to be:
The graphs help to determine a post-processing safe to handle time. This time can be
effectively applied for materials used to surround the laser processed item or around the cave. The assessment may help to consider handling with polymer based end-effectors of a mechanical manipulator. The assessment may also provide an indication of safe to proceed with other processes that may be affected by high temperature of items in the cave.
Hence as general indication, and allowing for some 20% contingency, concrete can be considered to have a safe temperature fall rate of 3 ºK/s and a melting point of the order of glass, at around 1700ºC (Temperature fall rates are expected to be much higher when the materials are in the molten state and at elevated temperatures above 1500ºC) and thus the material would be expected to return to near room temperature within almost 10 minutes. When the material is placed at distances that the spot size is expected to be larger than 10mm, then this safe to handle time reduces to approximately 5 minutes, assuming a fall rate of 6 ºK/s.
Applying the same concept to steel, the starting temperature can be set at 1500ºC
(approximate melting points of iron or nickel) and minimum fall rate can be considered to be at 5 ºK/s (20% contingency), hence the required time would be 5 minutes. For a spot size large than 10mm, a fall rate of 14 can be expected, hence reducing the safe to handle time to approximately 2 minutes.
In the case of graphite, the starting point can be set to 2500 ºC, i.e. near the sublimation point. Temperature is expected to drop much faster when above 1500 ºC, however this is reserved as extra contingency. The lowest rate can be considered 6 ºK/s and as a result, an average time for handling can be set to 7 minutes. For a spot size larger than 10mm the temperature fall time can be set at 14 ºK/s. Consequently the safe time to handle could be set at 3 minutes.
5.4 Temperature monitoring of a moving beam
Trials have been performed with a moving beam and a moderately defocussed laser beam diameter of 5mm. Data obtained on steel plate, of 15mm thickness, with incident beam powers of 1kW and 3kW are plotted in Figures 10 and 11 respectively.
‐8
‐7
‐6
‐5
‐4
‐3
‐2
‐1
0
0 1000 2000 3000 4000 5000 6000 7000
Temperature fall rate (ºK/s)
Power Density (W/mm²)
Concrete
90º
60º
30º
10º

22883/11/13 19 TWI Ltd
What can be observed on the plots is the difference in duration that the material spends above a given temperature between the two laser powers used. As a comparison, the time that the material spends above 200ºC can be noted. For the 1kW beam this is 2.5, 3.8 and 13s for speeds of 1500, 500 and 100mm/min respectively. For the 3kW beam this is 4, 6.8 and 50s respectively. For the slowest speed, the time spent above 200ºC is 285% longer for the 3kW beam than for the 1kW beam. For the fastest speed, the difference is 60%. Hence there appears to be a logarithmic relationship between processing speed and maintaining temperature above a certain level. It is also interesting to note the ‘warm up’ slope in these graphs before the main temperature peak. A small warm up is expected for metals like steel due to thermal conduction of the material. Copper would be expected to demonstrate a longer warm up at higher temperatures, while trials on concrete would be expected to exhibit warm up times of a few ms only. The warm up of course has a dependency on processing speed and beam power.
Figure 10 Temperature monitoring of 15mm thick steel plate while passing a 1kW beam of 5mm diameter spot size at various speeds, over the pyrometer sensor.
Figure 11 Temperature monitoring of 15mm thick steel plate while passing a 1kW beam of 5mm diameter spot size at various speed, over the pyrometer sensor.
0
200
400
600
800
1000
1200
0 50 100 150 200Temperature (ºC)
Time (s)
1kW Moving beam on Steel plate
100 mm/min 500 mm/min 1500 mm/min
0
200
400
600
800
1000
1200
0 50 100 150 200Temperature (ºC)
Time (s)
3kW Moving beam on Steel plate
100 mm/min 500 mm/min 1500 mm/min

22883/11/13 20 TWI Ltd
The implications for the project of this piece of work are believed to be: The work allows a basic evaluation of how a moving beam process (like cutting) at a
specified speed can significantly reduce the time that a material is exposed to high temperature levels that may cause faster thermal degradation to the material.
5.5 Temperature monitoring under ablation conditions, establishing damage thresholds
for various materials
In laser irradiation conditions promoting material ablation, the fast material loss from the surface abducts energy that has been initially deposited on the material via illumination, i.e. all material that has reached ablation temperature evaporates and leaves the vicinity of the surrounding molten and solid material quickly, while any temperature exchange between the gas phase and liquid/solid phase material is less effective compared to exchanges in molten to solid material. Hence temperature rise in the bulk material adjacent to the point of illumination may be limited under ablation conditions. In these experiments the temperature of the material (steel, concrete and graphite) surface was monitored at 1mm, 2mm and 3mm radial distance from the centre of the focussed beam. The material was placed at the focal position and beam power was set at 5kW in order to ensure ablation of material. The laser beam was emitted as a single pulse with various durations. A 250mm FL lens was used. Surface ablation was possible in all illumination conditions but at varying depth and width. Figure 12 depicts the highest temperatures recorded at the radial positions from focus, for each of the three materials investigated. For all three materials, the largest radial drop in temperature under the specific illumination conditions, was obtained with a 100ms laser pulse. The 1 and 10ms pulses marginally generated an ablated dimple in the materials and little energy was distributed to the surrounding material. During long pulses of 1s, for steel and concrete, the heat is most likely being transferred from the ablation point into the material via convection and conduction of the molten pool and thus the temperature equalises radially to the extent of monitoring (3mm). For graphite however, a molten phase does not occur, hence material either ablates or remains in the material solid. Hence a significant temperature gradient remains over the 3mm radius of monitoring for the 1s long pulse. For concrete such a condition is observed up to a pulse duration of 500ms, while above that a molten pool of aggregate material would be anticipated. The implications of this work for the project are believed to be:
Any unwanted illumination of materials that may occur with a power density capable of
material ablation and a duration less than 100ms, will not cause damage that will extend further than 3mm on any of the tested material, as the maximum recorded temperature at such a distance is approximately 30% of the temperature at 1mm from the focus point.

22883/11/13 21 TWI Ltd
a)
b) Figure 12 Graphs of radial temperature at set distances of 1, 2 and 3mm from the focus. Drawn lines correspond to different pulse durations at 5kW laser power. Materials: a) Steel; b) Graphite;
0
200
400
600
800
1000
1200
1 1.5 2 2.5 3
Maxim
um temperature recorded in
ºC
Distance from beam central axis, in mm
Temperature drop radially from pulsed illumination point on Steel
1ms 10ms 100ms 200ms 500ms 1000ms
0
200
400
600
800
1000
1200
1 1.5 2 2.5 3
Maxim
um temperature recorded in
ºC
Distnace from beam central axis in mm
Temperature drop radially from pulsed illumination point on Graphite
1ms 10ms 100ms 200ms 500ms 1000ms

22883/11/13 22 TWI Ltd
c) Figure 12 (continued). Graphs of radial temperature at set distances of 1, 2 and 3mm from the focus. Drawn lines correspond to different pulse durations at 5kW laser power. Materials: c) Concrete.
5.6 Monitoring of emissions beyond the cutting point
Assuming that during cutting operations the beam will be turned on for the minimum possible amount of time, i.e. only when actually working on the material, it is important to understand how the beam is transmitted through the material being cut. This study is focussed only on the breakthrough beam during cutting and not on any transmissions that may be occurring in different directions to the acting beam, as these would be affected by reflections and other diffracting or refracting phenomena that are occurring at the cutting point. The temporal behaviour of the breakthrough beam was investigated using a fast silicon photodiode with a signal rise time response of 1ns. The photodiode chosen was the Thorlabs DET10A with a 50Ω in line load resistor in order to sustain the smallest possible response time of the detector. The detector features a photodiode with an active area of 0.8mm². A beam splitter window angled at 45º to the incident diverging beam was used to allow most of the multi-kW power beam through and sample only a small fraction of the beam. A 5mm aperture was also used to protect the detector from the diverged beam and permit a beam fraction only over the photodiode’s active area. A large aperture of 10mm in diameter or a moving protection window was used between the material being cut and the beam splitting window, in order to protect the beam splitter from the spark projectiles of the cutting operation. The detector, apertures, sampling window and protection window, were all aligned on the central axis direction of the acting beam by +/- 0.5mrad from the focal point. The photocurrent was monitored with a 500MHz storage oscilloscope. The sampling rate was adopted to accommodate the duration of illumination, while ensuring that events were captured with adequate bandwidth. A 4kW maximum power setting was used for the acting beam, as at this power the sensitivity of the detector was near saturation. Trials were
0
200
400
600
800
1000
1200
1 1.5 2 2.5 3
Maxim
um temperature recorded in
ºC
Distance from beam central axis in mm
Temperature drop radially from pulsed illumination point on Concrete
1ms 10ms 100ms 200ms 500ms 1000ms

22883/11/13 23 TWI Ltd
performed cutting 3mm thick mild steel plates, with the surface of the plate facing the acting beam set at focus. A 250mm FL lens was used and a cutting nozzle adapted to give a short stand-off distance. Recordings were obtained from cuts with 2 bar and 6 bar assist gas pressure, at speeds of 10, 25, 50 and 100mm/s, for each pressure setting. The assist gas was compressed air delivered through a 3mm diameter nozzle orifice.
Figure 13 Recorded signals of breakthrough beam during laser cutting of 3mm plate with 4kW incident beam, 250mm FL lens and 2bar air pressure. Cutting was performed at four different speeds.

22883/11/13 24 TWI Ltd
Figure 14 Recorded signals of breakthrough beam during laser cutting of 3mm plate with 4kW incident beam, 250mm FL lens and 6 bar air pressure. Cutting was performed at four different speeds. As can be observed in Figure and 14, the shortest transmission event recorded on the detector was of approximately 1ms for all settings. At 10 to 25mm/s process speeds the average transmitted power was 2 to 3kW. At a slow process speed of 10mm/s the transmission increased by 0.5kW, at low assist gas pressure and 1.5kW at high pressure. These larger changes occurred at longer time intervals of 1s. At the faster speed of 50mm/s the average transmission was at around 1kW, denoting that the main part of the transmitted beam starts to be deflected from the central axis of the acting beam. The phenomenon was stronger at the highest speed trialled of 100mm/s where most of the beam appeared deflected. A noise of 20W is evident at the fastest cutting speeds. Another set of events occurring at 25mm/s, was transitions of 1kW in amplitude at 6 bar and 0.4kW at 2bar, of 250ms in duration. The observed events might be due to fluctuations in the convection motion of the molten metal around the acting beam that has penetrated the metal. As a result, expected changes in beam intensity of about 1kW over the shortest periods of 1ms and longest periods of 1s, might be possible.
The implications of this work for the project are believed to be: This information has been used in deciding illumination durations in tests of materials
as beam arresters. The general observation that the breakthrough beam amplitude reduces as higher cutting speeds are applied implies that smaller damages can be expected on surrounding materials in a cutting cell under fast processing conditions. Conversely when deciding to process at low speeds, it is important to apply maximum protection behind the items being cut.

22883/11/13 25 TWI Ltd
5.7 Tests on beam absorption materials
Tests have been performed on different materials for their use as beam arresters. The tests aim to define the capability of the materials to withstand laser illumination at levels of a few kilowatts and distances from the focal point of twice the focal length or more. The following materials have been tested:
Graphite panel Steel plate Molybdenum sheet (representing refractory metals) Black anodised aluminium sheet Graphoil® Perspex based Filtron® Concrete slab Each material was tested to a maximum distance of 3m from the laser focal point. The lens used was of 250mm FL. The highest recorded temperatures, rise times to those temperatures and illumination duration that achieved significant deterioration was recorded for each material. Changes in the surface properties of the material, that affect the optical absorption of the material, can cause local catastrophic failure of the material rendering it inadequate as beam arrester. Indications of the power density causing this condition, for each distance from focus, were calculated from the fitted model of the beam diameter derived in 5.1.1, and the applied power. The tables below list the results obtained for the materials stated above. For some materials like graphite, Graphoil® and the Mo sheet, the maximum temperature recorded at distances near to the focus is 1000ºC, as the pyrometer sensors used saturated at that point.
Table 1 Details of deterioration results on different materials for different propagation distances
0.5m Distance from focus – 4.7W/mm² Material Highest
Temperature (ºC) Rise time to highest temperature (s)
Surface deterioration duration (s)
Material deterioration duration (s)
Graphite plate Sensor saturated 0.07 0.1 ~300 Steel plate 1000 0.1 0.1 30 Mo Sheet Sensor saturated 1 0.01 ~120 Blackened Al 340 0.01 0.1 20 Graphoil Sensor saturated 0.1 0.01 ~300 Filtron 412 0.2 0.001 1 Concrete slab Sensor saturated 1 0.01 ~~1200
1m Distance from focus – 1.2W/mm² Material Highest
Temperature (ºC) Rise time to highest temperature (s)
Surface deterioration duration (s)
Material deterioration duration (s)
Graphite plate Sensor saturated 0.520 1 ~1800 Steel plate 510 1 1 ~180 Mo Sheet 430 1 1 ~1200 Blackened Al 560 0.1 0.1 60 Graphoil Sensor saturated 0.650 0.1 N/A Filtron 400 0.1 0.01 4 Concrete slab 840 1 0.01 N/A

22883/11/13 26 TWI Ltd
Table 1 (continued). Details of deterioration results on different materials for different propagation distances.
2m Distance from focus – 300mW/mm²
Material Highest
Temperature (ºC)
Rise time to highest
temperature (s)
Surface deterioration duration (s)
Material deterioration duration (s)
Graphite plate 400 1 N/A N/ASteel plate 180 1 30 N/AMo Sheet 100 1 N/A N/A
Blackened Al 130 0.1 1 N/AGraphoil 320 1 1 N/A
Filtron 370 1 1 20Concrete slab 270 1 ~60 N/A
3m Distance from focus – 133mW/mm²
Material Highest
Temperature (ºC)
Rise time to highest
temperature (s)
Surface deterioration duration (s)
Material deterioration duration (s)
Graphite plate 250 1 N/A N/ASteel plate 70 1 N/A N/AMo Sheet N/A N/A N/A N/A
Blackened Al 100 1 20 N/AGraphoil 200 1 N/A N/A
Filtron 240 1 1 200Concrete slab 60 1 ~180 N/A
The implications of this work for the project are believed to be: Data is provided to help understand the effects of illumination on various materials that
can be used to stop the beam from progressing further than the active process space. Materials such as graphite, Graphoil® and molybdenum perform best in terms of
withstanding exposure to high power density illumination. Graphoil® is a material of moderate cost that features good flexibility, good absorbance
of laser light (and suppression of further spread of laser light), low weight and high durability against laser illumination.
Black anodised aluminium is a cost effective material that can achieve beam absorption (and suppression of further spread) while demonstrating moderate durability against illumination.
Filtron can be used to contain laser light (coherent light) at low intensity levels, but should not be subjected to direct illumination.
5.8 Tests on spark arrester materials
The effectiveness of materials in stopping the progress of sparks that are produced during a typical laser cutting process has been tested. The materials tested are listed in Table 2. Normally during a laser cutting process, the laser beam is melting the material that is being cut, often causing a small fraction of it to become airborne due to the high energy input which is achieving localised combustion. The cutting gas that is used simultaneously in the process is delivered at high pressure (and therefore velocity) onto the molten mass of material and thus helps to expel this material thus leaving behind a clean gap. The largest mass of the expelled material, whether it arises from the energetic laser heating process or the cutting gas thrust, is projected away from the material in the form of sparks. The ejected material during a laser cut forms the dross that can be found around the material and the area where the cut took place. Most of the sparks travel in a cone opposite the side of the material that is being illuminated. Some of the sparks are ejected radially around the cutting point on the illuminated side of the material, particularly during piercing of material being cut. A smaller

22883/11/13 27 TWI Ltd
percentage has a random trajectory in any direction, with the least likely path being against the stream of assist gas coming from the laser processing head. The cone of sparks projected in the direction of the acting beam, from the non-illuminated side of the processed material, may have its axis of symmetry coinciding with the axis of the acting beam or may be inclined against it. The samples tested were placed inside the projected spark cone, as much as possible towards the centre of the cone, where the spark and projected particle density is expected to be the highest. The materials were not directly irradiated by the beam or a breakthrough beam. They may however have been subjected to occasional illumination by deflected or scattered laser radiation. In any case, no evident effects of deterioration by laser illumination were visible on the materials tested. The material being cut was 3mm thick mild steel plate, 15cm long, in the cutting direction. The material was placed at 3mm from the nozzle which delivered the assist gas jet coaxially to the laser beam. Six bar of gas pressure was applied at the nozzle exit. The gas nozzle diameter was 3mm. The material was residing at the beam focus of the 250mm FL lens. A 120mm collimator was used and a 150µm diameter delivery fibre. The material was moved against the beam and the material being tested at a linear speed of 5mm/s. At this speed the cone of sparks expands from -10º to +60º from the axis of the acting beam, and the inclination is opposite to the motion direction of the moving material that is being processed. Ten cuts were completed for each material tested. Two samples of each material were used for the trials. One at a distance of 100mm from the steel plate being cut and the other at 200mm distance. All the items were stood on a sheet of black anodised aluminium of about 0.5x0.5m. The samples being tested were also weighed before and after the cutting process. Table 2 Material gain in weight of samples that were exposed to sparks generated during 10 repeated cutting operations. Some of the materials exhibited a loss of weight as the projected spark particles have eroded the surfaces to some extent.
ID Number Distance (cm) Before (g) After (g) Material Material Gain per
area (mg/cm²)
1a 20 194.82 193.87 SiO2 fibre board -5.62
1b 10 389.43 382.07 SiO2 fibre board -43.55
2B 20 450.4 449.8 Ca fibre board -3.55
2A 10 593.59 587.26 Ca fibre board -37.46
3a 20 22.59 22.62 refractory metal 0.30
3b 10 21.43 21.47 refractory metal 0.40
4a 20 2.45 2.48 Graphoil® 0.66
4b 10 2.56 3.81 Graphoil® 27.43
5a 20 13.47 13.47 Filtron® perspex 0.00
5b 10 12.99 13.06 Filtron® perspex 1.79
6a 20 229.83 229.6 graphite -3.18
6b 10 234.61 234.94 graphite 4.57
7a 20 8.14 8.18blackened Al with
grease 0.82
7b 10 9.96 10.11blackened Al with
grease 3.06
8a 20 6.17 6.19black anodised
aluminium 0.41
8b 10 7.1 7.23black anodised
aluminium 2.65
In Table A1 the amount of material gained by each sample is listed. Some of the materials like the fire protection boards, exhibited loss of material after processing. The loss was more pronounced when placed close to the cutting point, where the density and speed of

22883/11/13 28 TWI Ltd
the projected sparks is expected to be higher. Due to the highly brittle or crumbly nature of these materials, they were effectively being eroded by the high speed sparks and particles. Some of the projected material was trapped on the materials exhibiting losses, as observed on the images of the specimens after cutting shown in Figure 14, but the gain in material does not necessarily counterbalance the losses. An interesting case is graphite which was eroded when placed at 20cm from the cut but the material gain surpassed losses when placed closer at 10cm. Graphite and carbon based materials are expected to have higher affinity to hot metal and metal particles. Thus when the graphite sample is placed closer to the hot source of the sparks, it has the capability to absorb more of them. The situation was more pronounced on Graphoil® which due to its smooth finish and relatively higher resistance to friction induced decomposition, showed limited material retention at the 20cm distance but significant increase at the distance of 10cm, where the sample managed to retain material equal to half its initial weight, up to 1.25g (27mg/cm²). The second highest material retention was shown by the grease coated Al samples, but reaching only 3.06mg/cm² and then by the black anodised aluminium itself, reaching 2.65mg/cm², both at the 10cm distance from the cutting point. All metallic sheet materials including Graphoil® demonstrated dross retention of about 3 to 5mg/cm², at the 20cm distance. Any material that had adhered to the molybdenum sheet was easily removed by wiping with a cloth or fingers, leaving behind the same smooth surface as the starting material, so no changes had occurred on the material surface during the exposure. The implications of this work for the project are believed to be:
Although some material retention was demonstrated by all the materials tested, this
was not considered significant enough in order to suggest their uses specifically for collecting dross from the cutting operation. Most of the materials however, demonstrated good resistance to damage (see Figure 15) from generated sparks, especially when considering the least likely situation that protection materials will be required at a distance of only 100mm from the cutting point.
Some of the materials like the composite fire protection boards may show signs of wear after a few hundred passes.
The Perspex Filtron® material also sustained significant degradation and was embedded with metallic particles when placed at 100mm from the cutting point but at 200mm, no damage was observed on this material. In this material, the degradation is of course unrelated to the beam filtering capabilities of the material but to its PMMA base, but it is interesting to understand the capability of this material to withstand exposure to generated sparks.
Considering the low cost (£20 per m²) and performance of the black anodised aluminium in restricting the spread of sparks and particles, its capability to absorb laser radiation and conduct heat and it’s flexibility at 0.5mm thickness, it is considered a good candidate for arresting sparks.
The best performing candidate as spark arrester would be the Graphoil® material but at a much higher cost than black anodised aluminium.

22883/11/13 29 TWI Ltd
a)
b) Figure 15 Images of samples exposed to the spark shower during 10 cutting passes of a 3mm mild steel sheet. Samples on the left were situated at 20cm from the cut and on the right at 10cm. The material types depicted are: a) Silica based fire protection board; b) Calcium based fire protection board;
22883/11/13 30 TWI Ltd
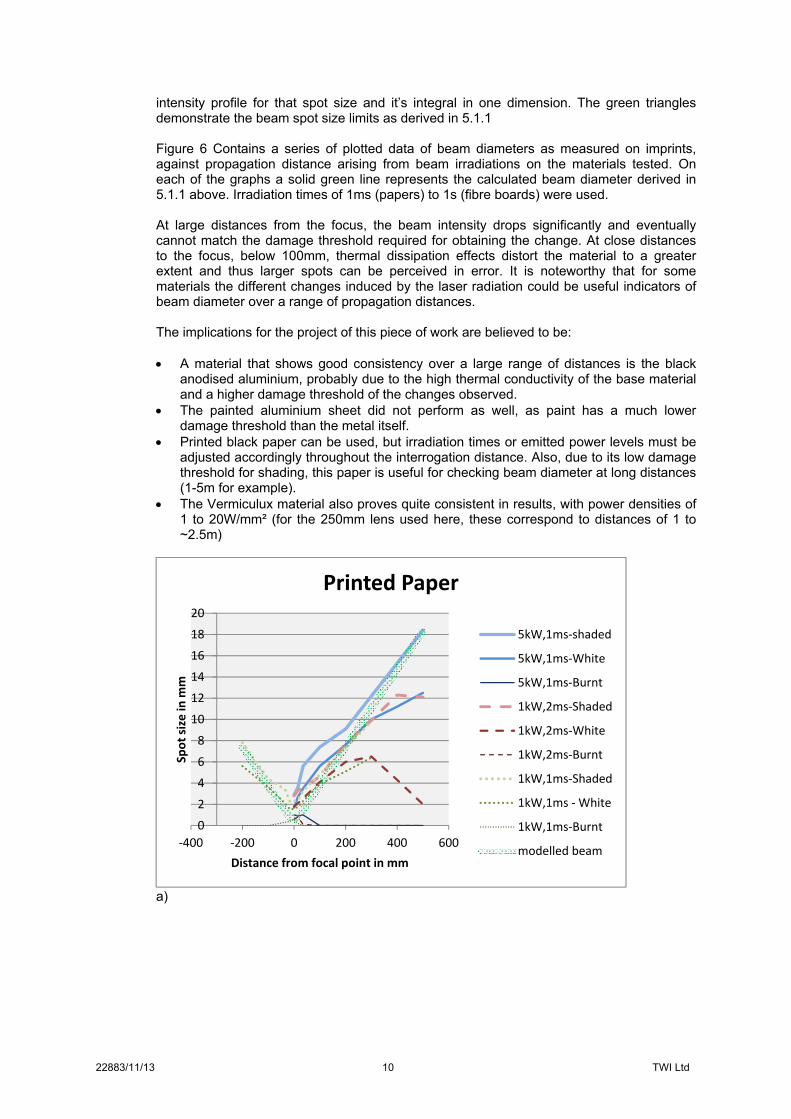
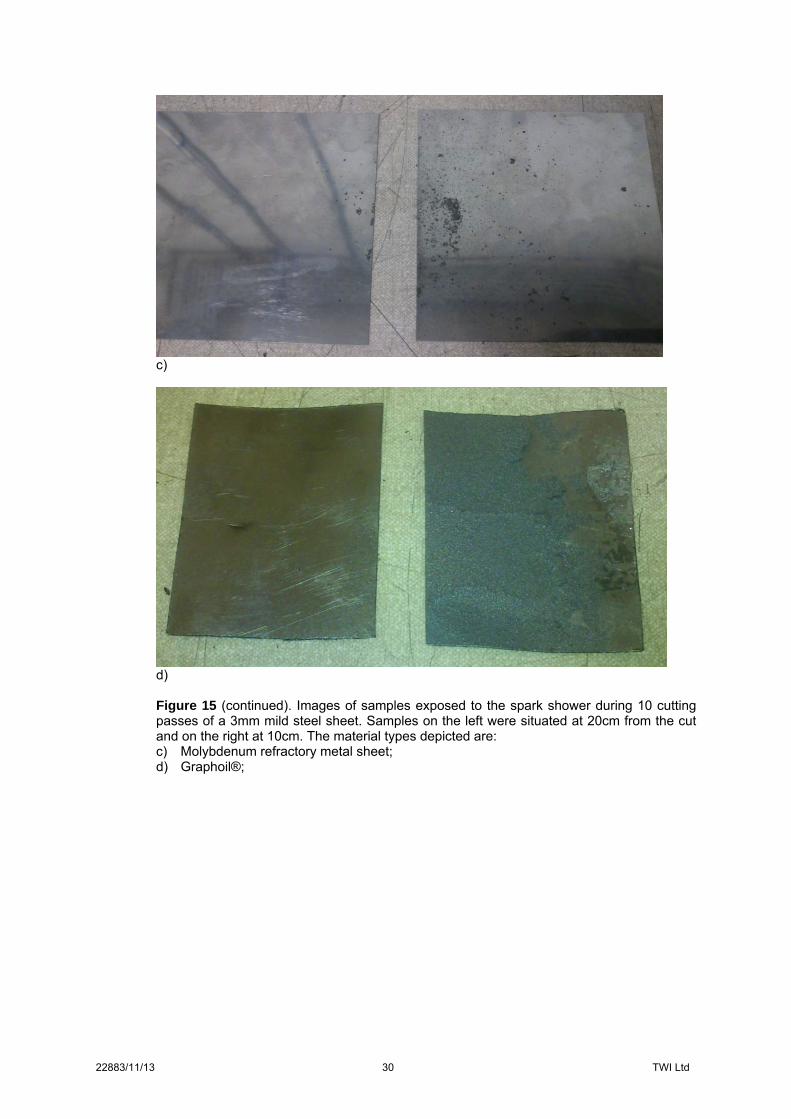
c)
d) Figure 15 (continued). Images of samples exposed to the spark shower during 10 cutting passes of a 3mm mild steel sheet. Samples on the left were situated at 20cm from the cut and on the right at 10cm. The material types depicted are: c) Molybdenum refractory metal sheet; d) Graphoil®;

22883/11/13 31 TWI Ltd
e)
f) Figure 15 (continued). Images of samples exposed to the spark shower during 10 cutting passes of a 3mm mild steel sheet. Samples on the left were situated at 20cm from the cut and on the right at 10cm. The material types depicted are: e) Perspex based Filtron®, f) graphite blocks, g) black anodised aluminium with vacuum
grease layer, f) Graphite blocks;

22883/11/13 32 TWI Ltd
g)
h)
Figure 15 (continued). Images of samples exposed to the spark shower during 10 cutting passes of a 3mm mild steel sheet. Samples on the left were situated at 20cm from the cut and on the right at 10cm. The material types depicted are: g) Black anodised aluminium with vacuum grease layer; h) Black anodised aluminium.
5.9 Worked example defining a safety sphere based on results obtained to date.
In order to assess how long a material will withstand laser radiation at a specified radial distance from the beam focus, the following approach can be followed, based on the results provided in the sections above. Two example cases are presented below for steel and graphite. Case for steel: The exemplar beam delivery system consists of a 150μm diameter fibre, a 120mm FL collimating lens and a 250mm FL focussing lens, and the laser is expected to irradiate at 5kW power. A piece of 3mm thick steel is placed behind the sample to be cut at 1m from the anticipated position of the beam focus. The direction of illumination is normal to its surface. The beam diameter on the steel is thus going to be ~73mm. At 5kW the power density applied will be approximately 1.19W/mm². If the beam is turned on before it begins cutting, then the steel piece behind the process point is going to receive the full beam

22883/11/13 33 TWI Ltd
power. The material can thus remain in the beam safely for a few seconds based on the damage thresholds listed for steel in the tables of section 5.6. If the direct illumination is sustained for 2 to 3 minutes, the material is expected to deteriorate significantly. By inclining the steel surface by 60 degrees, one can expect the rate of temperature rise to reduce to approximately half of that in the normal incidence condition (based on the temperature rise rates in Figure 8.a above), as the power density of the beam is relatively low. Hence, safe illumination before material deterioration can progress for up to 4min since the anticipated temperature rise time is now halved. However, part of the beam is now being reflected away from the steel piece and care should be taken not to direct the beam to any more sensitive materials located further away. In all conditions the steel plate material is expected to sustain surface oxidation within the first second of the illumination duration, based on the tables in section 5.6. If the material is going to be exposed only to the breakthrough beam when processing at 25mm/s, at normal incidence, i.e. the cutting process is going to start and finish in the sample being processed, then we can expect the steel plate at 1m from the focal point to receive about 2kW of power in average, based on the results presented in figures 7 and 8 of section 5.5. The illumination time before material deterioration, can thus be doubled. Case for graphite: The exemplar beam delivery system consists of a 150μm diameter fibre, a 120mm FL collimating lens and a 250mm FL focussing lens, and the laser is expected to irradiate at 5kW power. The cutting process will start outside the material that is being cut and the beam will take 3 seconds to enter the that material. The cutting process will take 15 seconds to be completed once the beam has engaged with the material that is being cut. The material being cut is placed at the beam focus. A block of graphite is placed at 250mm behind the material. The breakthrough beam will illuminate the graphite block at normal angle of incidence. Based on the equations given in the implications of section 5.1.1, the power density at the plane of the graphite is 19W/mm² over an area of 261.9mm². By referring to the damage thresholds listed in the tables of section 5.6, the material will withstand this irradiation for approximately 75s. Allowing some contingency, it can be taken that the maximum illumination time for the material before any significant deterioration can commence is 1 minute. Hence the material can be subjected to the full capacity of the beam for the whole duration of the process without risking its performance integrity as a beam arrester. Minor surface damage effects might be observed on the material, as based on the first table of section 5.6, and these are expected to come about within 0.1s of illumination, at a power density of ¼ of that expected in this exemplar arrangement.
6 Disclaimer
The data and results contained within this document are advisory in nature, expressed as an opinion only and no warranty, expressed or implied, is given as to the suitability of such advice or results for any particular purpose. Any information made available by TWI Ltd over the World Wide Web does not form part of any contract. Whilst every effort has been made to ensure the accuracy of the information presented, TWI Ltd cannot accept responsibility for any errors.

22883/11/13 TWI Ltd
Appendix
Method for temperature measurement

22883/11/13 TWI Ltd
Method for temperature measurement
Further to thermocouples the instrument of choice for monitoring temperature changes in the materials assessed in this study is an industrial grade pyrometer. Pyrometers are adopted by the raw steel sheet and wire manufacturing industry (as well as many others) due to the non-contact possibility of generating temperature readings with small errors, and the high reliability they demonstrate in industrial environments. For this particular application, by selecting the correct sensor semiconductor, one can avoid interference with the laser wavelength in use. One commercially available device that has been tested in conjunction with laser processing using beams at around the 1µm emission band is the IMPAC IPE140. TWI has, in previous studies, used the MB10 variant of this device for monitoring temperature rise in metals during fibre laser irradiation at 1072µm. The device characteristics are listed in Table A1 below Table A1 Device characteristics of IMPAC IPE140 MB10 pyrometer
Wavelength sensitivity 3 … 5µm Temperature range 30 … 1000ºC Accuracy: (ε = 1, t90 = 1 s, Tamb = 23°C)
below 400°C: 2.5°C above 400°C: 0.4% of reading in °C +1°C
Repeatability 0.1% of reading in °C + 1°C Exposure time 1.5ms, adjustable to 10s Emissivity setting Adjustable from 0.1 to 1 in steps of 0.01 Min. measurement area 0.3mm The pyrometer approach suffers from a potential disadvantage, for applications where the nature of the material on which the laser beam is incident might vary, in that a change of material will usually result in a change of emissivity. This could mean that such a device may generate different measurements of temperature for different materials, as each material is expected to emit black body radiation in different quantities as it heats up. The surface finish of a material will also affect emissivity. Some examples are the difference between concrete, featuring emissivity of 0.65 at the 1µm band, graphite with emissivity of 0.85 and stainless steel with emissivity of 0.35 in the same wavelength region. (Raytek, 2003) Moreover, highly reflective (shiny) examples of the same materials feature smaller emissivity values than rough (matt) surfaces and materials. As an example, the emissivity of polished lead is 0.1, against 0.6, for a rough surface finish of the same metal, with both values at the 1.6µm sensor region. (Raytek, 2013) Such variations are more pronounced in the short wavelength ranges of 1 to 2.5 µm, rather than the medium to long wavelengths of 3 to 14µm. The sensor used for studies in the LaserSnake project has a lower susceptibility to material emissivity variations, when compared to the more common pyrometer equipment operating around the 1 to 2µm wavelength region, especially within common ranges of iron based metal alloys and steels. Nonetheless, the dual colour pyrometer calibration approach was taken here in order to cross correlate and validate readings on different materials. This approach, which is becoming more and more dominant in the industries that utilise pyrometers for temperature determination of a variety of materials, is to additionally use a second pyrometer with spectral sensitivity at a different wavelength range. This is commonly achieved by using a sensing semiconductor element of different type. The two signals can be combined by a computer algorithm and analysed in order to derive the emissivity value of the material being examined, or to actively generate an emissivity proof temperature signal. The Calex PU 151 pyrometer, was used to provide a solution for parallel monitoring of temperature. This pyrometer is sensitive in the 8-14µm spectral region (also well away from the laser wavelength) and can measure temperatures from -40 to 1000ºC. Consequently it can generate a well matched complementary temperature dependent signal to the primary pyrometer sensor, the IMPAC IPE 140. These measurements are performed as calibration measurements only as the IPMAC pyrometer is tuned to match the measurement area of the lower cost Calex pyrometer. The monitoring diameter for the calibration trials was 50mm and the sample materials were placed at 1m away from the focus of the 250mm FL lens. By applying the correct emissivity value to the IMPAC pyrometer, the measurement area is then kept to a minimum while performing the safety case trials. Calibration measurements were then performed for steel, graphite, concrete, black PVC polymer, blackened aluminium, molybdenum sheet, spray painted black aluminium, Nylon blue tinted sheet,
22883/11/13 TWI Ltd
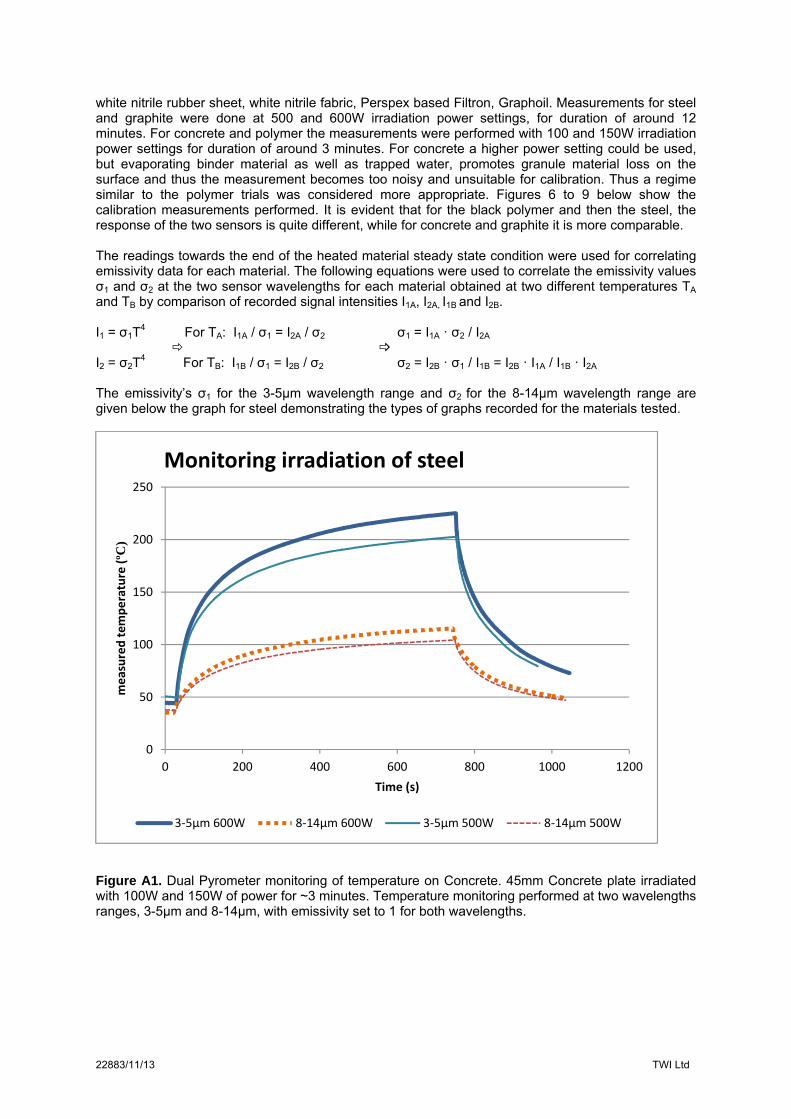
white nitrile rubber sheet, white nitrile fabric, Perspex based Filtron, Graphoil. Measurements for steel and graphite were done at 500 and 600W irradiation power settings, for duration of around 12 minutes. For concrete and polymer the measurements were performed with 100 and 150W irradiation power settings for duration of around 3 minutes. For concrete a higher power setting could be used, but evaporating binder material as well as trapped water, promotes granule material loss on the surface and thus the measurement becomes too noisy and unsuitable for calibration. Thus a regime similar to the polymer trials was considered more appropriate. Figures 6 to 9 below show the calibration measurements performed. It is evident that for the black polymer and then the steel, the response of the two sensors is quite different, while for concrete and graphite it is more comparable. The readings towards the end of the heated material steady state condition were used for correlating emissivity data for each material. The following equations were used to correlate the emissivity values σ1 and σ2 at the two sensor wavelengths for each material obtained at two different temperatures TA and TB by comparison of recorded signal intensities I1A, I2A, I1B and I2B. I1 = σ1T
4 For TA: I1A / σ1 = I2A / σ2 σ1 = I1A · σ2 / I2A
I2 = σ2T
4 For TB: I1B / σ1 = I2B / σ2 σ2 = I2B · σ1 / I1B = I2B · I1A / I1B · I2A
The emissivity’s σ1 for the 3-5µm wavelength range and σ2 for the 8-14µm wavelength range are given below the graph for steel demonstrating the types of graphs recorded for the materials tested.
Figure A1. Dual Pyrometer monitoring of temperature on Concrete. 45mm Concrete plate irradiated with 100W and 150W of power for ~3 minutes. Temperature monitoring performed at two wavelengths ranges, 3-5µm and 8-14µm, with emissivity set to 1 for both wavelengths.
0
50
100
150
200
250
0 200 400 600 800 1000 1200
measured temperature (ºC
)
Time (s)
Monitoring irradiation of steel
3‐5µm 600W 8‐14µm 600W 3‐5µm 500W 8‐14µm 500W

22883/11/13 TWI Ltd
Table A2 listing recorded emissivities
Recorded emissivities Emisivity 3-5 µm Emisivity 8-14 µm Steel 0.72 0.38 Molybdenum 0.67 0.18 Concrete 0.23 0.42 Graphite 0.97 0.93 Graphoil 0.82 0.79 Black PVC 0.86 0.96 Filtron 0.61 0.93 Blue PVC 0.12 0.72 Clear PVC 0.10 0.72 Nitrile rubber 0.14 0.85 White nitrile fabric 0.17 0.81