twin: personality-based recommender system -...
TRANSCRIPT
TWIN: Personality-based Recommender System
Alexandra Roshchina
Master of Science (research) in Information Technology
Institute of Technology Tallaght
Dublin, Ireland
2012

TWIN: Personality-based Recommender System
Alexandra Roshchina
being a thesis presented for the award of Master of Science
(research) degree in Information Technology
Supervisors
Dr John Cardiff
Department of Computing
Institute of Technology Tallaght, Dublin, Ireland
Prof Paolo Rosso
NLE Lab-ELiRF
Universidad Politécnica de Valencia, Spain
Submitted to the Higher Education and Training Awards
Council (HETAC)
2012


Abstract
One of the important issues arising in the modern world is the information overload problem. In
order to help the person navigate through the sea of all possible choices available online,
Recommender Systems have started to appear. They collect preferences of people based on
explicit ratings of various products or on the analysis of behaviours of the users working within
the system. Therefore Recommender Systems become able to suggest new items to their users
taking into account things liked by people with similar tastes.
The process of preferences retrieval and the choice of the recommendation algorithm are key
parts of the Recommender System construction. There are a number of classical approaches
available: content-based, collaborative filtering, etc. with the tendency to choose the combination
of them to create a hybrid system. But recently a new type of Recommender System has
appeared that utilises personality information about the users. It provides a more personalised
approach to user representation aimed at improving the quality of the recommendations.
In this thesis we propose the TWIN Personality-based Recommender System. In order to
produce recommendations it applies the results achieved in the personality from the text
recognition research field to Personality-based Recommender System user profile modelling. In
this way it creates a bridge between the efforts of automatic personality score estimation from
plain text and the field of Recommender Systems. TWIN also serves as a tool for visualizing the
resulting scores to perform personality analysis. We show that the application of the TWIN in
online tourism domain produces valuable results in recommending tourist facilities to
“like-minded” people. We describe the components of the TWIN system, the experiments
conducted on the system, and we present an analysis of the very promising results obtained.


Declaration
I hereby certify that the material, which I now submit for assessment on the programmes of study
leading to the award of a Master of Science (research), is entirely my own work and has not been
taken from the work of others except to the extent that such work has been cited and
acknowledged within the text of my own work. No portion of the work contained in this thesis
has been submitted in support of an application for another degree or qualification to this or any
other institution.
_________________________ ________________
Signature of candidate Date
I hereby certify that to the best of my knowledge all the unreferenced work described in this
thesis and submitted for the award of a Master of Science (research) is entirely the work of
Alexandra Roshchina. No portion of the work contained in this thesis has been submitted in
support of an application for another degree or qualification to this or any other institution.
_________________________ ________________
Signature of supervisor Date


Acknowledgements
I would like to express my gratitude to my principal supervisor Dr. John Cardiff (Institute of
Technology Tallaght, Dublin, Ireland) for his careful guidance, tremendous patience and
eagerness to provide support in the face of uncertainty at any stage of my work on the thesis. I
would also like to thank my co-supervisor Dr. Paolo Rosso (Universidad Politécnica de
Valencia, Spain) for his generous feedback, valuable corrections and provision of the up-to-date
information.
I want to say to my parents, Sergey Roshchin and Marina Zakrevskaya, that my heart is full of
love, respect and deep appreciation for all that they gave me, for helping me to become the
person I am, for always being there to give me a hand. I also want to thank them for their
ruthless judgements that gave me so much motivation and willingness to learn and grow. My
gratitude also goes to all the members of my family and relatives for all the sacrifices they had
made to support me, for their love and warmth. Especially, to my sister Elizaveta Roshchina for
sharing all my sorrows and joys, for her understanding and the sparkling brightness of her smile.
I would like to thank Barry Feeney for providing me a safe and supportive environment to finish
my thesis and get a valuable work experience. Special thanks to Aisling O’Brien and Sr.
Bernadette Purcell for all their time, energy and support. To Joe McDonagh for the advice in
psychological research methods. To all the staff of the Institute of Technology Tallaght and
especially to Patricia Magee, Stephen Howell, Eileen Costelloe and Frances Clynes for giving
me the example to follow. To all the students of Institute of Technology Tallaght for all their
mistakes and successes that made me grow personally and professionally.
A very-very special thanks I want to address to the members of my Social Media Research
Group and personally to Lorraine Carmody for all her care and attention, to Maria Mitina for
sharing her knowledge and especially to Fernando Perez Tellez for the emotional support and all
the invaluable experience and knowledge gained while working together.
To the Soroptimist International Organization that gave me a sense of security and support.
Personally to Maura Maginn and her family for everything they had made for me, for their
kindness and help in conducting the experiments for the thesis.
To Sera Ann, Nicola Ferrari, Martin, Rob and Stella, the weirdest people I have ever met, who
became my friends and helped me to learn a lot about life. To David Connolly, Mildred de la
Vega and Maureen Mcnally for all the support and care.
To Raymund Ryan for the opportunity of singing in his choir and take part in the concerts. To
Dodder Valley Partnership and Intercultural Drop-in Center for the opportunity to improve my
English skills and personally to Stefan Piskorski for his enthusiasm.
I want to thank Alexey Kharkov and his family for being part of my life, for helping me to grow,
for sharing my dreams and ideas.

To my dearest friend Marina Vigolova who is always there and takes me as I am with all my
crazy ideas. To Varvara Magomedova and Evelina Kim for being my soul friends.
And especially I want to express my love to Viktor Kapustin, my teacher.
List of publications based on this thesis
1. Sánchez García, J., Callarisa, L., Cardiff, J., Roshchina, A. (2012). Harnessing Social
Media Platforms to Measure Customer-based Hotel Brand Equity, International Journal
of Tourism Management Perspectives, Elsevier, accepted for publication.
2. Roshchina A., Cardiff J., Rosso P. (2012). Evaluating the Similarity Estimator
Component of the TWIN Personality-based Recommender System. in LREC 2012 - 8th
International Conference on Language Resources and Evaluation, Istanbul.
3. Sánchez García, J., Callarisa, L., Cardiff, J., Roshchina, A. (2011). Análisis del valor de
marca de las top 10 cadenas hoteleras en las top 10 ciudades a través de las comunidades
virtuales, in Estrategias Competitivas en Canales de Distribución Comercial Tradicional
Versus On-Line, pp. 381-407, Casielles,Trespalacios Gutiérrez, Estrada Alonso,
González Mieres (coordinadores), Cátedra Fundación Ramón Areces de Distribución
Comercial, ISBN 978-84-8367-357-7 (book chapter, in Spanish).
4. Roshchina A., Cardiff J., Rosso P. (2011). A Comparative Evaluation of Personality
Estimation Algorithms for the TWIN Recommender System. In: Proc. CIKM 3rd Int.
Workshop on Search and Mining User-generated Contents, SMUC-2011, Glasgow,
Scotland.
5. Roshchina A., Cardiff J., Rosso P. (2011). User Profile Construction in the TWIN
Personality-based Recommender System. In: Proc. IJCNLP Workshop on Sentiment
Analysis where AI meets Psychology, 5th Int. Joint Conf. on Natural Language
Processing, SAAIP-2011, Chiang Mai, Thailand.
6. Roshchina, J. Cardiff, P. Rosso, A. Troussov. (2008). Ontological data freshness on the
web. In: Proc. 3rd Int. Conf. for Internet Technology and Security Transactions,
ICITST-2008.

Table of Contents
Chapter 1: Introduction .................................................................................................................... 1
1.1 Motivation ......................................................................................................................... 2
1.2 Aim ................................................................................................................................... 2
1.3 Thesis organization ........................................................................................................... 3
Chapter 2: Background .................................................................................................................... 5
2.1 Recommender Systems ..................................................................................................... 5
2.1.1 Collaborative filtering Recommender Systems ......................................................... 7
2.1.2 Content-based Recommender Systems ..................................................................... 9
2.1.3 Other types of Recommender Systems .................................................................... 11
2.1.4 Data mining methods for Recommender Systems .................................................. 11
2.1.5 User profile construction for Recommender Systems ............................................. 13
User model ............................................................................................................................. 13
Visual user profile ................................................................................................................. 13
2.2 Personality estimation ..................................................................................................... 14
2.2.1 Psychometrics and questionnaire construction ........................................................ 15
2.2.2 Personality traits classification ................................................................................ 16
2.2.3 The Big Five ............................................................................................................ 17
2.2.4 Psycholinguistics and Social Media ........................................................................ 18
The Linguistic Inquiry and Word Count (LIWC) Program ................................................... 24
2.3 Personality-based Recommender Systems ..................................................................... 26
2.3.1 Tkalčič approach...................................................................................................... 27
2.3.2 Hu and Pu approach ................................................................................................. 27
2.3.3 Nunes approach ....................................................................................................... 28
2.4 Summary ......................................................................................................................... 29
Chapter 3: The TWIN System ....................................................................................................... 31
3.1 Task description .............................................................................................................. 32

3.2 TWIN system components .............................................................................................. 33
3.2.1 User Data Processor................................................................................................. 33
3.2.2 The Similarity Estimator ......................................................................................... 41
3.2.3 The Results Visualiser ............................................................................................. 42
3.3 Summary ......................................................................................................................... 42
Chapter 4: Experiments and Results .............................................................................................. 45
4.1 Online travelling domain and Recommender Systems ................................................... 45
4.2 TripAdvisor data collection ............................................................................................ 46
4.2.1 TripAdvisor data ...................................................................................................... 47
4.3 Calculating personality from the text .............................................................................. 50
4.4 User profile construction ................................................................................................ 53
4.5 Comparison of the performance of Personality Recogniser Algorithms ........................ 56
4.6 Summary ......................................................................................................................... 58
Chapter 5: Evaluation .................................................................................................................... 60
5.1 Questionnaire-based evaluation ...................................................................................... 60
5.1.1 Obtaining personality data ....................................................................................... 61
Constructing the set of users .................................................................................................. 61
Using social media services ................................................................................................... 61
5.1.2 Convergence analysis .............................................................................................. 62
5.2 Text-based evaluation ..................................................................................................... 63
5.2.1 TripAdvisor experiment .......................................................................................... 63
Polarity of the reviews ........................................................................................................... 65
Other reviews’ fields ............................................................................................................. 66
5.3 Summary ......................................................................................................................... 67
Chapter 6: Conclusions and further work ...................................................................................... 69
6.1 Major contributions ......................................................................................................... 70
6.2 Further work ................................................................................................................... 71
Bibliography .................................................................................................................................. 73

Appendix A. Detailed representation of the TWIN user profile ontology……………………77
Appendix B. TWIN system implementation ............................................................................. 82

List of Figures
Figure 2.1: Recommending K best items (extracted from (Terveen and Hill, 2001)) .................... 6
Figure 2.2: Content-based RSs: challenges and research directions (extracted from (Semeraro,
2010)) ............................................................................................................................................ 10
Figure 2.3: Fragment of the myPersonality application user interface (extracted from (Quercia et
al. (2011)) ...................................................................................................................................... 20
Figure 2.4: Egogram. Traits of five ego states (extracted from (Minamikawa and Yokoyama
2011)) ............................................................................................................................................ 21
Figure 2.5: Pearson correlations between various features scores and personality scores
(extracted from (Golbeck et al., 2011)) ......................................................................................... 22
Figure 2.6: Assigning the personality characteristic of the utterance using AMVFs (Brockmann,
2009)) ............................................................................................................................................ 23
Figure 2.7: LIWC categories (extracted from (Mairesse, 2007)) .................................................. 26
Figure 3.1: TWIN system: architecture ......................................................................................... 33
Figure 3.2: The list of MRC categories (extracted from (Mairesse, 2007)) .................................. 34
Figure 3.3: Support vector regression. ε = 1. Regression line for 8 data points, one attribute
considered (extracted from (Witten and Frank, 2005)) ................................................................. 38
Figure 3.4: TWIN user ontology ................................................................................................... 40
Figure 3.5: TWIN user (Cheryl63) profile ontology ..................................................................... 43
Figure 4.1: TripAdvisor data experiment using TWIN system ..................................................... 47
Figure 4.2. TripAdvisor hotel information .................................................................................... 48
Figure 4.3: TripAdvisor hotel review ............................................................................................ 49
Figure 4.4: Example TripAdvisor user profile .............................................................................. 49
Figure 4.5. Extraversion scores distribution .................................................................................. 51
Figure 4.6: Agreeableness scores distribution ............................................................................... 51
Figure 4.7: Consciousness scores distribution ............................................................................... 52
Figure 4.8: Neuroticism scores distribution .................................................................................. 52
Figure 4.9: Openness to experience scores distribution ................................................................ 53
Figure 4.10: Extraversion scores distribution with means for each review set ............................. 54
Figure 4.11: Agreeableness scores distribution with means for each review set .......................... 54
Figure 4.12: Conscientiousness scores distribution with means for each review set .................... 55
Figure 4.13: Neuroticism scores distribution with means for each review set .............................. 55
Figure 4.14: Openness to experience scores distribution with mean scores for each review set .. 56
Figure 4.15: Algorithms results comparison. Consciousness score. ( linreg - linear regression,
m5mt - M5’ model tree, m5rt- M5’ regression tree, svm - support vector machines) .................. 57
Figure 5.1: Big Five questionnaire web page ................................................................................ 61
Figure 5.2: The percentage of correctly found reviews considering plain personality scores. Each
Y value represents a combination of the Big Five parameters (E – Extraversion, A –
Agreeableness, N – Neuroticism, C – Consciousness, O – Openness to Experience) .................. 63
Figure 5.3: The percentage of correctly found reviews considering mean personality scores
vectors per person as the training set. ............................................................................................ 64
Figure A.1: TWIN user profile ontology ....................................................................................... 81
Figure B.1: TWIN system website ................................................................................................ 82
Figure B.2: TWIN system: main structural components ............................................................... 83
Figure B.3: TWIN system: structure of the Client and Server components .................................. 83
Figure B.4: Client. ClientGUI package contents ........................................................................... 84
Figure B.5: Client. ClientNetwork package contents .................................................................... 85
Figure B.6: Client package of the Server ...................................................................................... 86
Figure B.7: User package of the Server ......................................................................................... 86
Figure B.8: ReviewsManager package of the Server .................................................................... 87
Figure B.9: GoogleMapGUI package of the Client ....................................................................... 88
Figure B.10: The structure of the twin-users table ........................................................................ 89
Figure B.11: The structure of the twin_reviews table ................................................................... 89
Figure B.12: The structure of the twin_hotels table ...................................................................... 89
Figure B.13: Logging in into TWIN .............................................................................................. 90
Figure B.14: The semi-transparent error window and the loading screen beneath ....................... 90
Figure B.15: Main GUI elements of the TWIN interface.............................................................. 91
Figure B.16: TWIN user profile window ...................................................................................... 92
Figure B.17: RDF representation of the user profile data ............................................................. 92
Figure B.18: Results of the recommendation on the Google Map ................................................ 93

List of Tables
Table 1.1 Collaborative filtering RSs: problems and possible solutions ......................................... 8
Table 4.1: TripAdvisor hotels’ fields crawled ............................................................................... 48
Table 4.2: TripAdvisor reviews’ fields crawled ............................................................................ 48
Table 4.3: TripAdvisor dataset parameters.................................................................................... 50
Table 4.4: Extraversion scores parameters .................................................................................... 51
Table 4.5: Agreeableness scores parameters ................................................................................. 51
Table 4.6: Consciousness scores parameters ................................................................................. 52
Table 4.7: Neuroticism scores parameters ..................................................................................... 52
Table 4.8: Openness to experience scores parameters .................................................................. 53
Table 4.9: ANOVA test for the algorithms comparison ................................................................ 57
Table 4.10: Algorithms that differ significantly ............................................................................ 58

1
Chapter 1: Introduction
During the years of its existence the Web has changed the way people think of the processes of
getting appropriate information and the way they communicate with each other. With the
transformation of the Web from the provision of "brochure-like" access to the information
owned and edited by companies and authorities, global net developers have realised the
importance of the previously unnoticed individual opinions of Web content readers and the
impact they could make on the process of information dissemination. Due to the appearance of
the more intuitive tools of content manipulation and administration, the model of a person’s
interaction with the Web has changed. The user and her interests and needs have become the
main starting point of all actions held by online intelligent applications. By exploiting the
“wisdom of the crowds” (Surowiecki, 2005) such applications make use of the collective
intelligence to get a broader view over the particular area of knowledge.
The availability of billions of words collected together in billions of documents has become one
of the greatest opportunities for a person and at the same time one of his deepest fears. Web
users have started experiencing the huge overload of the multitude of information that is
appearing online with the development of Web 2.0 facilities providing the user-generated content
(e.g., Wikis, blogs, file sharing tools, etc.). As the volume of such products and services has
grown tremendously, it has become necessary to help the user choosing from the broad set of
options. When considering situations with high uncertainty (for example, searching for a hotel in
a place to which the user has never been) people tend to avoid rational decision making
procedures (Oliveira, 2007). Formal attributes of the various objects under evaluation (for
example, the number of hotel stars, ratings of hotel facilities, etc.) can be interpreted differently
by different people and sometimes do not provide sufficient information to make a particular
decision. Thus there appears a necessity to find an expert’s advice to follow. The common
practice has become to write expert or user-generated reviews to describe and rate all the
parameters of the particular product or service.
As the volume of the available reviews itself grows, the possibility of manual processing and
analysing of each individual review becomes extremely tedious for most of the users leading to

2
the tendency to go only through the first page of search results and rarely further than the second
or third one (Viney, 2008). The solution to the information overload problem was found in the
development of the so-called Recommender System, the main aim of which is to provide
automatic suggestions of items (or even other people) that have specific characteristics similar to
the preferences of the target user.
1.1 Motivation
Traditional Recommender Systems collect information from the user explicitly by asking the
user to fill in the fields in the user profile (usually demographic data or products ratings) or
implicitly by studying user behaviour (logs of purchases, content analysis, etc.) (Tuzhilin, 2005).
With the growing interest in the connection between the consumer personality and specific
characteristics of the products (e.g. brands) the person is more likely to purchase (Mulyanegara
et al., 2007) the challenging task of introducing the personality dimension into Recommender
Systems has arisen.
Only a few approaches of personality-based user model construction exist in the field of
Recommender Systems. One of them retrieves personality information through asking the user to
manually fill in questionnaires (Nunes, 2008). However it seems to be at least problematic to
require each user to go through this procedure during the profile construction step. Furthermore,
people do not always provide sincere answers and incorrect data can produce a negative impact
on the quality of the recommendation.
One of the alternatives to questionnaires could be the estimation of the personality from the user
generated content that is freely available in many online communities. Much work has been done
in the field of psychology to extract specific features from the text to establish the connection
between the way the person writes and her personality (Tausczik and Pennebaker, 2009). Thus,
the unique approach we follow here is the challenging task of adding the personality dimension
to the Recommender System through the automatic personality recognition from linguistic cues
from the texts of the users (Mairesse, 2007).
1.2 Aim
We propose the “Tell me What I Need” (TWIN) Personality-based Recommender System to
implement the possibility of recommending items chosen by the like-minded (or “twin”) people
with similar personality types estimated from the plain text.

3
In order to evaluate the performance of the TWIN system we have chosen to apply it to the
online travelling domain. We experiment with datasets collected from the tourist’s reviews
managing website and create a web application to produce the recommendations of the hotels.
Below we provide the main hypotheses of the thesis.
Hypothesis 1
The pattern of personality scores automatically estimated from the texts written by authors in the
online travelling domain calculated by means of algorithms available from psychological
research may vary from one person to another.
Hypothesis 2
Personality-based user model constructed from such personality scores may be used as a
personality profile for the proposed TWIN Recommender System.
Hypothesis 3
TWIN Recommender System with such personality profile may provide accurate
recommendations.
1.3 Thesis organization
This thesis is organized as follows. In Chapter 2 we provide the background information about
Recommender Systems, existing personality theories, practical ways of personality estimation
and we present an overview of the emerging field of Personality-based Recommender Systems.
In Chapter 3 we describe the components of the TWIN system and their functionality. Chapter 4
presents the experiments conducted in order to validate the TWIN system. The possible ways of
evaluating the TWIN system are described in Chapter 5. The details of the system
implementation are given in Chapter 6. Finally, in Chapter 7 we summarise the outcomes of our
work and describe possible directions for the future research.

4
5
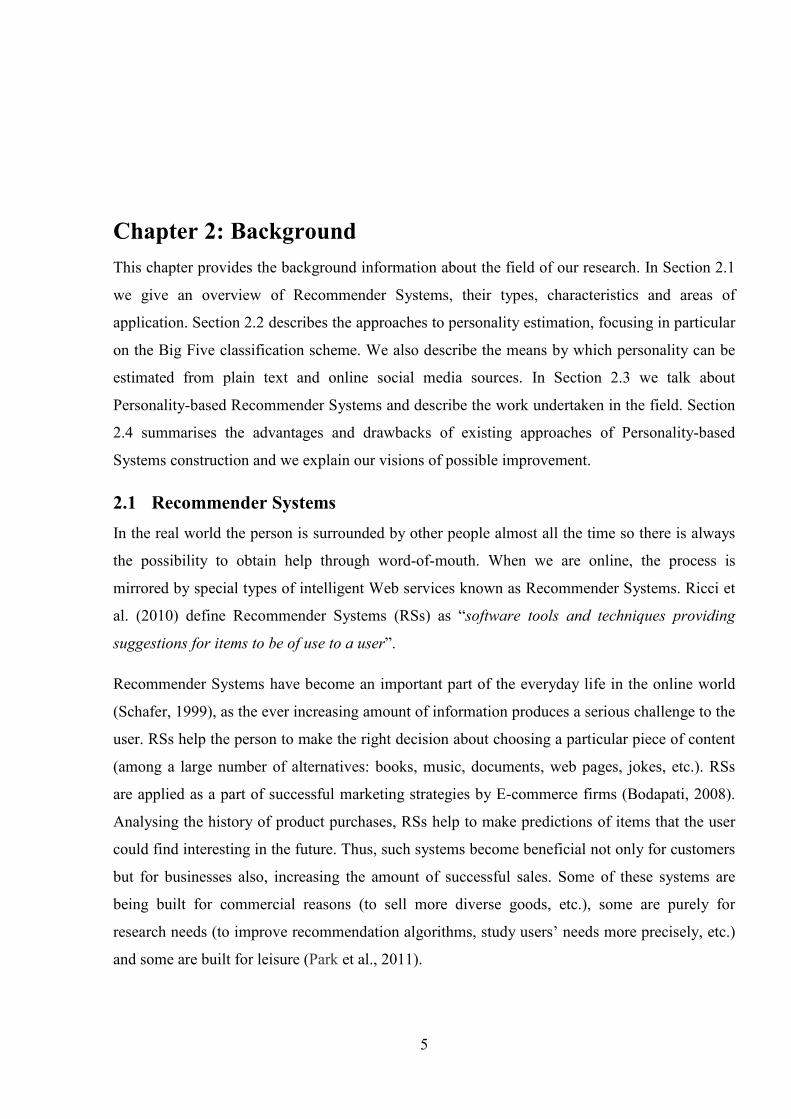
Chapter 2: Background
This chapter provides the background information about the field of our research. In Section 2.1
we give an overview of Recommender Systems, their types, characteristics and areas of
application. Section 2.2 describes the approaches to personality estimation, focusing in particular
on the Big Five classification scheme. We also describe the means by which personality can be
estimated from plain text and online social media sources. In Section 2.3 we talk about
Personality-based Recommender Systems and describe the work undertaken in the field. Section
2.4 summarises the advantages and drawbacks of existing approaches of Personality-based
Systems construction and we explain our visions of possible improvement.
2.1 Recommender Systems
In the real world the person is surrounded by other people almost all the time so there is always
the possibility to obtain help through word-of-mouth. When we are online, the process is
mirrored by special types of intelligent Web services known as Recommender Systems. Ricci et
al. (2010) define Recommender Systems (RSs) as “software tools and techniques providing
suggestions for items to be of use to a user”.
Recommender Systems have become an important part of the everyday life in the online world
(Schafer, 1999), as the ever increasing amount of information produces a serious challenge to the
user. RSs help the person to make the right decision about choosing a particular piece of content
(among a large number of alternatives: books, music, documents, web pages, jokes, etc.). RSs
are applied as a part of successful marketing strategies by E-commerce firms (Bodapati, 2008).
Analysing the history of product purchases, RSs help to make predictions of items that the user
could find interesting in the future. Thus, such systems become beneficial not only for customers
but for businesses also, increasing the amount of successful sales. Some of these systems are
being built for commercial reasons (to sell more diverse goods, etc.), some are purely for
research needs (to improve recommendation algorithms, study users’ needs more precisely, etc.)
and some are built for leisure (Park et al., 2011).

6
An intuitive visualization of the recommendation process is presented on Figure 2.1
(Pu et al., 2011). It shows that the essence of the recommendation task is that it produces the
filter constructed over all the available options the user can choose from. Instead of considering
thousands of alternatives the user now takes only a limited number of items into account. It
should be noted that Step 3 is not obligatory as in some Recommender Systems the user does not
have access to the profile and cannot make manual changes to it. According to the quality of the
received recommendations the user can alter the preferences to improve the future performance
of the system.
Figure 2.1: Recommending K best items
Recently with the appearance of the various mobile devices and services such as GPS and Wi-Fi,
a new dimension is being introduced to the Recommender Systems area. It provides a number of
challenges due to the limitations of the mobile devices compared to PCs. Nevertheless it also
brings new characteristics: location-awareness (the physical location of the person is known at
any particular moment) and ubiquity (the information can be delivered at any time when it is
required) (Ricci, 2010). Mobile Recommender Systems are appearing to serve a number of tasks
including search for tourist attractions (services, places, etc.), route recommendations, news and
multimedia recommendations, etc.
There exist a number of main types of Recommender Systems: collaborative filtering, content-
based and a number of others. They are described in more details below.

7
2.1.1 Collaborative filtering Recommender Systems
This of the most popular type of Recommender System and is widely used nowadays
(Gemmell et al., 2009). Collaborative filtering systems rely on users’ ratings in order to provide
recommendations. This approach allows the recommendation of items highly rated by similar
individuals and does not require extensive knowledge about items themselves. This is especially
valuable when considering multimedia items for which content analysis and comparison is at
least challenging. Furthermore, items with totally different content types could also be compared
and recommended (which is not possible in content-based systems). One of the important
features is the quality-based approach that relies on opinions of other individuals and not on the
properties of items.
The main underlying task of collaborative filtering RSs is the choice of the appropriate similarity
measure. The most popular measures are described below:
1. Cosine similarity (each item’s attributes are seen as a multidimensional vector and to
assess the similarity between two such vectors the cosine of the angle between them is
considered)
2. Pearson correlation similarity (based on the correlation between two items)
3. Probability-based similarity (if the user purchased one item after another then the
probability of the similarity of those items increases)
The classical example of a collaborative-filtering RS is Amazon1 that recommends books and
other goods based on the user’s purchase behaviour and its similarity with what other people
prefer to buy. Among the other examples is MovieLens2. Users provide information about the
movies they love or hate and the system is recommending new movies to watch based on the
preferences of the people with the same taste. Another example is Netflix3 that recommends
movies and TV shows that are rated by its users.
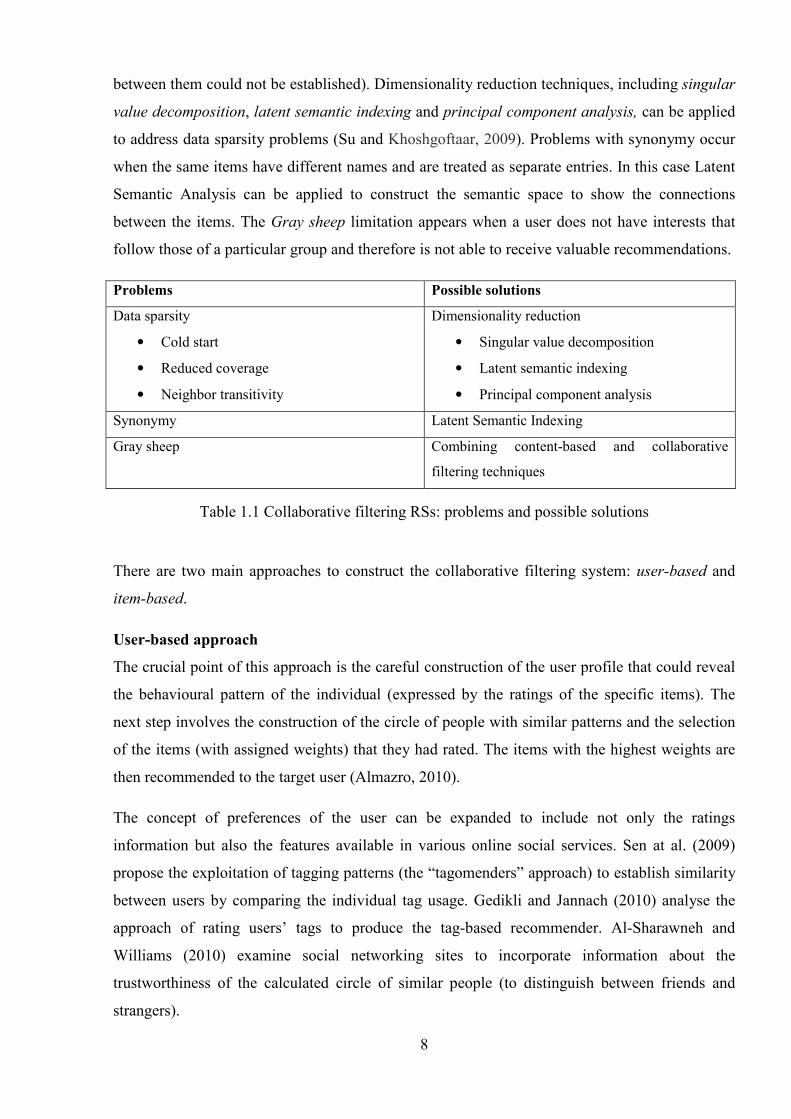
Table 1.1 shows the problems that exist in the field of collaborative filtering RSs and their
possible solutions (Su and Khoshgoftaar, 2009). As the amount of products and people involved
is huge, the user-item matrix is usually very sparse that produces three main problems: cold start
(new users will not receive proper recommendations if there are no other people’s ratings yet),
reduced coverage (not all the items in the system are rated) and neighbour transitivity (users may
have similar interests but they haven't rated the same items yet and therefore the connection
1 http://www.amazon.com
2 http://movielens.umn.edu
3 https://signup.netflix.com
8
between them could not be established). Dimensionality reduction techniques, including singular
value decomposition, latent semantic indexing and principal component analysis, can be applied
to address data sparsity problems (Su and Khoshgoftaar, 2009). Problems with synonymy occur
when the same items have different names and are treated as separate entries. In this case Latent
Semantic Analysis can be applied to construct the semantic space to show the connections
between the items. The Gray sheep limitation appears when a user does not have interests that
follow those of a particular group and therefore is not able to receive valuable recommendations.
Problems Possible solutions
Data sparsity
• Cold start
• Reduced coverage
• Neighbor transitivity
Dimensionality reduction
• Singular value decomposition
• Latent semantic indexing
• Principal component analysis
Synonymy Latent Semantic Indexing
Gray sheep Combining content-based and collaborative
filtering techniques
Table 1.1 Collaborative filtering RSs: problems and possible solutions
There are two main approaches to construct the collaborative filtering system: user-based and
item-based.
User-based approach
The crucial point of this approach is the careful construction of the user profile that could reveal
the behavioural pattern of the individual (expressed by the ratings of the specific items). The
next step involves the construction of the circle of people with similar patterns and the selection
of the items (with assigned weights) that they had rated. The items with the highest weights are
then recommended to the target user (Almazro, 2010).
The concept of preferences of the user can be expanded to include not only the ratings
information but also the features available in various online social services. Sen at al. (2009)
propose the exploitation of tagging patterns (the “tagomenders” approach) to establish similarity
between users by comparing the individual tag usage. Gedikli and Jannach (2010) analyse the
approach of rating users’ tags to produce the tag-based recommender. Al-Sharawneh and
Williams (2010) examine social networking sites to incorporate information about the
trustworthiness of the calculated circle of similar people (to distinguish between friends and
strangers).
9
Item-based approach
The Item-based approach relies on the similarity between items instead of similarity between
users. The recommendation of the new items is based on the computation of the current user
ratings history to identify the ratings pattern. Item-based methods are more preferable when the
number of users is considerably higher than the number of items and when the changes in the
item sets are not very frequent compared to the changes in the users (Ricci et al., 2010).
An example of a collaborative filtering system is Movies2Go4 which is aimed at recommending
movies and TV programs. It provides results based on user voting data (Mukherjee et al., 2001).
Another popular music listening website is Last.fm5. By analysing the history of user’s
preferences, the Scrobbler6 application updates the library of tracks on the user’s computer or
iPod. The implemented Recommender System produces a list of recommendations of new
musical compositions.
2.1.2 Content-based Recommender Systems
Content-based filtering is the oldest type of recommendation approach (Olsson, 2003). The user
is supposed to feed the system with his initial ratings on a number of items for the system to be
able to recommend pieces of content that have similar attributes to those that the user had
already seen.
Recommender Systems of this type do not take other users’ ratings into account. Therefore one
of the main advantages of content-based RSs is that the user’s unique taste is not smoothed by
preferences of people from like-minded groups (Nageswara and Talwar, 2008). Thus, people
with extreme likes will still receive appropriate recommendations. However, sometimes this
advantage turns into drawback due to the overspecialization problem discussed below.
Content-based RSs try to provide recommendations based only on the attributes (author, title and
other metadata) of the item or its content. This leads to one of the drawbacks: if items do not
contain any metadata initially (music, video) it is necessary to explicitly define it (Nageswara
and Talwar, 2008). Recently the elegant solution to the above mentioned problem has been
found with the appearance of social tagging facilities allowing people to explicitly annotate the
content they are uploading to the system (as well as associating the existing item with the
concept represented by the tag). The resulting structure provides a simple self-organizing
classification approach known as folksonomy (Mathes, 2004). Folksonomy can be utilised for the
4 http://www.movies2go.net
5 http://www.last.fm
6 http://www.last.fm/download

10
construction of content-based Recommender System profiles describing items by the tags
attached to them (Cantador et al., 2010).
Some of the challenging opportunities for the development of the content-based RSs as well as
the main problems are presented in Figure 2.2 (Semeraro, 2010). The first drawback is the
limitation of the content analysis. Due to polysemy, multi-word concepts and synonymy, the
keyword representation of items and profiles is not always accurate. Semantic analysis of the
extracted keywords could be performed to choose the most appropriate ones. The second
drawback is the overspecialization that brings the emergence of the unbreakable circle of the
very similar recommendations based on the unchanging interests of the person. Such limitation
can be overcome by introducing serendipity into the results produced by the RS for the user to
discover some unusual items that would not be normally considered as interesting.
Figure 2.2: Content-based RSs: challenges and research directions
To create a valuable representation of the item the traditional content analysis techniques, such
as keyword extraction approach, are becoming out-of-date (due to polysemy, synonymy, etc.).
Social media services are recognised now as a valuable source of information that could be
integrated within the system from external sources (ontologies, folksonomies, etc.)
(Agichtein, 2009).
Content-based RSs are in some way “easier” than collaborative filtering systems as they do not
depend on other users’ preferences. But in some cases this advantage turns into a drawback. It
11
introduces overspecialisation when the user is recommended only the same types of the items he
used to like in the past (homophily problem). If other people’s tastes were taken into account the
user would receive recommendations of completely new items not necessarily similar to those
already positively validated by him (Nageswara and Talwar, 2008). The solution to this problem
could be found in the development of new algorithms that would encourage serendipity –
“recommendation of surprisingly new items” (Semeraro, 2010).
It is quite straightforward to provide explanations of the recommendations in the RSs of this type
as it could be represented as a list of content attributes similar to the user preferences
(Semeraro, 2010). Another advantage of content-based RSs is that they are able to recommend
new items and do not require a person to rate the new content in order to start providing
recommendations (first-rater problem).
One example of content-based RSs is the ACR News7. The site serves as an entry point for air
conditioning and refrigeration professionals. The system provides daily news in the field by
means of the Usenet news Recommender System and utilises the content-based filtering
algorithm.
There are many examples of content-based RSs in the field of music and films recommendations.
The example of the music RS is Pandora Radio8 that suggest the music composition similar to
the one the user already likes.
2.1.3 Other types of Recommender Systems
Other types of Recommender Systems include demographic Recommender Systems (based on
the age, country or language of the user), knowledge-based Recommenders (specialising in
recommending data from a particular domain of knowledge by estimating a person’s needs in
that field), community-based (recommendations are based on the items that are favourable for
user’s friends), hybrid Recommender Systems (which utilise a combination of the above
mentioned approaches) and the emerging type of personality-based Recommenders (which use
personality characteristics to find matching people). We discuss Personality-based RSs in more
detail in Section 2.3.
2.1.4 Data mining methods for Recommender Systems
Most data is stored in electronic formats nowadays. This leads to the possibility of automatically
or semi-automatically processing of the information. The efficiency of the analysis is studied in
the data mining discipline (Witten and Frank, 2005). The main purpose of practical data mining
7 http://www.acr-news.com
8 http://www.pandora.com
12
is to find hidden patterns in the training set (usually labelled with correct answers manually by
human experts) and describe them explicitly in a specific structural format, which will allow the
assignment of the previously unseen instances to a particular class.
Data mining methods can be broadly classified into two categories: supervised and unsupervised
approaches. Supervised algorithms at the learning stage make use of the data annotated with
correctly assigned classes while unsupervised algorithms try to learn the structure from the
unlabelled data by grouping similar objects together according to the specific distance function
(Witten and Frank, 2005). Recommender Systems make use of the algorithms and techniques
available from the data mining field for the information extraction purposes (Sharma and Suman,
2011). The most widely used approaches are discussed below.
Classification
Classification is a “mapping from unlabelled instances to classes” (Kotsiantis, 2007). One of the
most popular classifiers applied for the RSs is the k-nearest-neighbours (kNN) (Almazro et al.,
2010) which is based on the idea that if the current user or item is close (or similar) to one of the
groups in the training set then it should be assigned to the same class as the set of “neighbours”.
kNN is a lazy learner as it makes decisions only at the classification step and it is frequently
used as a baseline algorithm to be implemented and further extended for the Recommender
System (Bogers, 2009). It represents an unsupervised data mining method. Other examples of
classifiers are decision trees (which construct a set of rules based on the training set data),
Bayesian classifiers (which introduce the probability-based set of rules to deal with uncertainty),
and neural networks (in which the structures of nodes and weighted links based on the analogy
with the way the neurons wok in the biological brain).
Association rules
Association rules are computed by analysing the patterns of co-occurrence of items during the
same transaction performed by the user (Park et al., 2011). The larger the frequency of the set
(support count) of items (the more often they occur together) the higher the confidence of the
underlying rule (Ricci, 2010). The Association rules approach is normally utilised to process
large datasets as it produces a compact representation of their content (Nunes, 2010).
Clustering
Clustering is a technique used to create the partitioning of the data into “natural” groups where
all the members are “similar” (applying a specific distance measure) to each other. Clustering for
the RSs is less accurate than, for example, kNN classifiers as the recommendations produced are
13
based on the average of the opinions of other people in the same cluster. Therefore, for
efficiency reasons, the combination of clustering and kNN is usually utilised (Nunes, 2010).
User data is pre-clustered offline and kNN is applied only within the appropriate cluster (Alag,
2009).
2.1.5 User profile construction for Recommender Systems
One of the most important parts of the Recommender System development is the construction of
the user model, that would be best processed by the application, and providing its proper visual
representation that would be convenient and intuitive for the user.
User model
Recommender Systems collect the information about a particular user either explicitly (asking
individuals to provide their preferences) or implicitly (automatically analysing the data or the
activity of the user) and store it in the Preference Provider (or simply, the user profile). The
appearance of various social services on the web brings about the possibility of gathering a large
amount of “outside world” information in order to describe the user from different points of
view. For example, Ghosh and Dekhil (2008) propose the description of the user through
gathering the data from a number of sources: Google Calendar9, FOAF
10 (the Friend Of a Friend
project), etc. and to cover the diversity of formats in the data through the construction of a Retail
User Profile Ontology to store semantically enriched profile entries. The user profile thus is
described using RDF triples and is accessible via SPARQL queries, creating an easily extensible
approach to effectively deal with semi-structured and sparse data. Diederich and Iofciu (2006)
describe the user based on the keywords (viewed as tags) crawled from the DBLP11 data set
publications. More recently there has appeared an interest in the personality-based user profile.
Nunes (2008) proposes to construct it by means of personality questionnaires to explicitly
retrieve the information about the user.
Visual user profile
The development of the graphical user interface is a challenging task that involves the analysis of
the tastes and preferences of the target audience as most of the users evaluate the general
performance of the application based on the usability of its interface (Gribova, 2007). Usability
reflects the quality and the satisfaction of users’ interactions with the system.
9 https://www.google.com/calendar
10 http://www.foaf-project.org/
11 http://www.informatik.uni-trier.de/~ley/db/
14
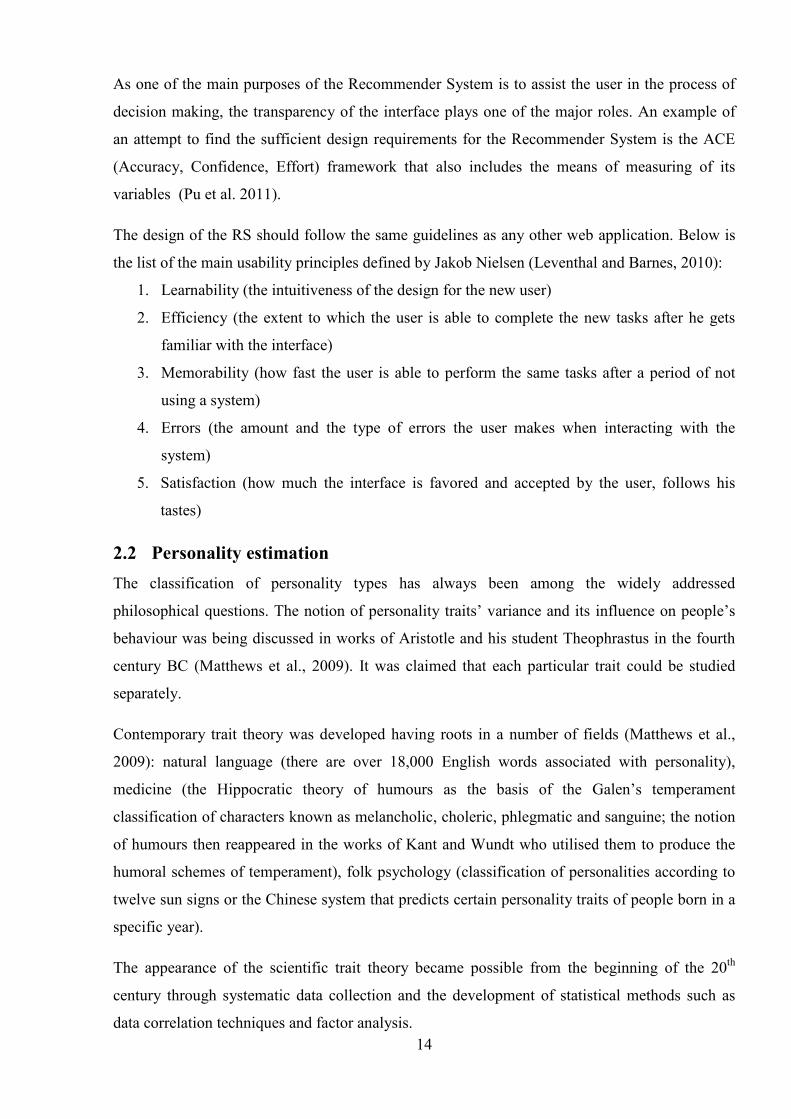
As one of the main purposes of the Recommender System is to assist the user in the process of
decision making, the transparency of the interface plays one of the major roles. An example of
an attempt to find the sufficient design requirements for the Recommender System is the ACE
(Accuracy, Confidence, Effort) framework that also includes the means of measuring of its
variables (Pu et al. 2011).
The design of the RS should follow the same guidelines as any other web application. Below is
the list of the main usability principles defined by Jakob Nielsen (Leventhal and Barnes, 2010):
1. Learnability (the intuitiveness of the design for the new user)
2. Efficiency (the extent to which the user is able to complete the new tasks after he gets
familiar with the interface)
3. Memorability (how fast the user is able to perform the same tasks after a period of not
using a system)
4. Errors (the amount and the type of errors the user makes when interacting with the
system)
5. Satisfaction (how much the interface is favored and accepted by the user, follows his
tastes)
2.2 Personality estimation
The classification of personality types has always been among the widely addressed
philosophical questions. The notion of personality traits’ variance and its influence on people’s
behaviour was being discussed in works of Aristotle and his student Theophrastus in the fourth
century BC (Matthews et al., 2009). It was claimed that each particular trait could be studied
separately.
Contemporary trait theory was developed having roots in a number of fields (Matthews et al.,
2009): natural language (there are over 18,000 English words associated with personality),
medicine (the Hippocratic theory of humours as the basis of the Galen’s temperament
classification of characters known as melancholic, choleric, phlegmatic and sanguine; the notion
of humours then reappeared in the works of Kant and Wundt who utilised them to produce the
humoral schemes of temperament), folk psychology (classification of personalities according to
twelve sun signs or the Chinese system that predicts certain personality traits of people born in a
specific year).
The appearance of the scientific trait theory became possible from the beginning of the 20th
century through systematic data collection and the development of statistical methods such as
data correlation techniques and factor analysis.
15
The process of personality modelling includes the construction of the basic classification
dimensions and the questionnaire for measuring them. This is the primary concern of the
psychometrics field of study that develops “theory and technique of educational and
psychological measurement, which includes the measurement of knowledge, abilities, attitudes,
and personality traits”12.
In the era of virtual communities and electronic data exchange, the personality dimension is
supporting a number of tasks in such areas as e-learning and training (e.g. to construct learners’
psychological profiles in order to choose a better educational approach), entertainment (to build
highly intellectual gaming environments), etc. Depending on the data available, personality traits
can be estimated explicitly through questionnaires (John, 1991) or implicitly. The implicit
scenario involves the extraction of specific features from texts written by the particular person
(Mairesse et al., 2007) or the construction of special learning environments where the behaviour,
emotions and conversational parameters of the person can be observed (Robison et al., 2009).
2.2.1 Psychometrics and questionnaire construction
Gustav Fechner in his “Elemente der Psychophysics” defined psychophysics (the precursor of
psychometrics) as “an exact science of the fundamental relations of dependency between body
and mind” (Jones and Thissen, 2007). The modern discipline of psychometrics was formalised
with the appearance of the Psychometric society in the University of Chicago in 1935 and in
1936 the book “Psychometric Methods” was published by J. P. Guilford (Jones and Thissen,
2007).
Psychometrics applies statistical methods and models to process data for psychological research.
In order to calculate the personality representation the researcher should carefully construct the
questionnaire, reflecting the number of hypothesised trait categories. There are three formal
quality characteristics of the questionnaire defined and estimated by psychometrics (Matthews et
al., 2009):
1. Reliability
This step is used to test the internal consistency of the questionnaire. The most common
measure here is the Cronbach alpha13 statistic which compares the variance of answers to
each particular question with the variance of whole test results.
12 http://en.wikipedia.org/wiki/Psychometrics
13 http://en.wikipedia.org/wiki/Cronbach's_alpha

16
2. Stability
The questionnaire should pass the test-retest step: initial test results should correlate
highly with the repeated measurement over a period of time.
3. Validity
Obtained results should be checked for correlation with some independent quality index
or proved experimentally.
The development of the modern psychometrics is associated with the changes in measurements
of the psychological data and its analysis through the creation of improved personality scales
with extended administrative capabilities (e.g. item response theory (Morizot et al., 2007)).
2.2.2 Personality traits classification
A number of statistical approaches are used to find correlations between various traits, following
which factor analysis techniques are applied to group positively correlated traits into larger
groups. Each dimension consists of a number of traits that are related to each other and thus if a
person has one of the traits in a particular dimension he is likely to have other traits from the
same group.
A number of traits’ classifications exist (Matthews et al., 2009):
1. 16PF14 (Sixteen Personality Factor Questionnaire) by Cattell, Eber and Tatsuoka. It
measures 16 traits (Warmth, Reasoning, Emotional Stability, Dominance, etc.);
2. CPI15 (California Psychological Inventory). It measures the data on 18 scales and consists
of 434 true-false questions. CPI is widely used in industry as a way to estimate the
leadership and coaching abilities to improve the personal performance;
3. OPQ16 (Occupational Personality Questionnaire). It estimates 31 traits and is used for
personnel recruitment purposes (to assess the preferred style of behaviour at work);
4. EPQ-R17 (Eysenck Personality Questionnaire-Revised). It measures three factors
(Extroversion, Neuroticism and Psychoticism). It has been applied in human resources
management, clinical research and career counselling;
5. NEO-PI-R18 (NEO-Personality Inventory-Revised) by McCrae and Costa (1996) known
as “The Big Five”. It consists of 240 questions, and has used for occupational assessment,
counselling and research.
14 http://www.ipat.com
15https://www.cpp.com/products/cpi/index.aspx
16 http://www.psychtesting.org.uk/test-registration-and-test-reviews/test-reviews.cfm?page=summary&Test_ID=185
17 http://www.edits.net/products/41-epqrepqr-shortjepq.html
18 http://www4.parinc.com/Products/Product.aspx?ProductID=NEO-PI-R

17
Slight variations present in the naming of the five factors in “The Big Five” and some critics
argue (Matthews et al., 2009) that the above mentioned number of traits is not sufficient to
reflect all the diversity of existing traits while others suppose that five could be further reduced
to a smaller amount of traits. Nevertheless, “The Big Five” personality traits classification is one
of the most widely used and recognised (Matthews et al., 2009). It covers most of the traits’
classification schemes.
2.2.3 The Big Five
The short version of the NEO-PI-R – Big Five Inventory (BFI)19 – consists of 44 questions and is
widely used in research as it requires less time to be filled in and prevents the participants from
becoming bored (John et al., 2008). Thus we have chosen BFI for the purposes of personality
modelling in the TWIN Recommender System.
The Big Five model includes the dimensions of Openness to experience, Consciousness,
Extraversion, Agreeableness and Neuroticism (abbreviated as OCEAN). The brief description of
each of the categories is provided below.
Extraversion
Extraversion refers to the desire of active and energetic participation in the world around. Such
people are open to communications, talkative and tend to experience positive emotions.
Introverts on the contrary are more focused on their own feelings and do not need so much
external stimulation which lead to the comfortableness of being alone.
Agreeableness
Agreeable people tend to eagerly cooperate with others and are generally seen as helpful and
generous compared to people with disagreeable behaviour that includes self-interest and
sometimes even unfriendliness. More generally, agreeable people are often unable to make tough
decisions because they tend to care about other people’s interests more.
Conscientiousness
Conscientiousness is seen as the ability to control impulses and to hold to long-term plans as
well as being able to foresee the consequences of one’s behaviour. Such people are usually
perceived as intelligent and wise. In extreme cases it could lead to perfectionism and tendency to
become a workaholic. Unconscientious people tend to enjoy things that bring immediate
satisfaction and perceived as are spontaneous, joyful, impulsive and unreliable.
19 http://www.ocf.berkeley.edu/~johnlab/bfi.htm
18
Neuroticism
Neuroticism is positively correlated with the susceptibility to experiencing negative feelings such
as anxiety, anger and depression. Neurotics respond very emotionally and tend to perceive each
situation as threatening which causes an inability to think clearly and make right decisions under
stress. Low levels of neuroticism usually mean emotional stability and calmness as well as low
exposure to negative thoughts.
Openness to experience
This trait represents the tendency of the person to be sensitive to new ideas, non-conventional
thinking and to being intellectually curious. It also includes the ability of symbolic thinking on
the high level of abstraction. When scored low on this trait, people tend to have more common
interests with which they are more familiar and do not like complex ambiguous things.
2.2.4 Psycholinguistics and Social Media
Psycholinguistics is the discipline that makes an attempt to “uncover the mental processes that
are implicated in the acquisition, production, and comprehension of language” (Altmann, 2006).
The first studies in psycholinguistics go back to Freud’s slips of the tongue that were claimed to
reveal the person’s real intentions leading to unconsciously made speech mistakes. Further
research tried to linguistically detect a person’s anxiety level and to diagnose psychological
deviations by analysing transcribed speech.
With the appearance of social data on the Internet, linguists and psychologists have gained
access to large corpora of texts reflecting the way people talk naturally (which typically also
include information about the author such as age, gender, social status, interests, etc.). From the
1970’s computerised text analysis tools have started to appear. While the first programs used to
implement sophisticated algorithms were based on language variables not directly visible to
users, subsequently created tools became more and more transparent.
The volume of social services on the Web is constantly growing, including blogs (a resource to
express private, scientific or other means of opinions, posing questions, discussing problems,
etc.), wikis (online text collections that allow users to write their own articles as well as edit other
authors’ articles; these are used for setting up digital libraries, knowledge repositories of large
companies and institutions, and for developing technical documentation), file sharing tools
(services to share things such as photos (Flickr20) and bookmarks (del.icio.us
21) and to
20 http://flickr.com/
21 http://delicious.com/

19
conveniently organise them) and Social Networks (services such as Facebook22, Bebo
23,
Twitter24, etc. that offer a space for the user to organise personal information, maintain existing
relationships and find new friends). The data available from the above mentioned services
combined with data collected through thoroughly organised laboratory studies provides a broader
view of the interconnection between language and human behaviour.
Research has shown that there is a correlation between the Big Five dimensions and linguistic
features found in texts. Tausczik and Pennebaker (2009) have discovered that the use of first-
person singular pronouns correlates with depression levels, while the volume of positive
emotions words reveals extraversion. Mairesse et al. (2007) has shown that emotional stability
(the opposite of neuroticism) is correlated with the amount of swearing and anger words used by
the person while agreeableness is associated with back-channelling (personality types were
estimated from self-reports and observers’ reports). Some of the traits were studied more
thoroughly (for example, extraversion) which could be caused by a higher level of
representativeness of the particular trait related linguistic cues (Mairesse et al., 2007).
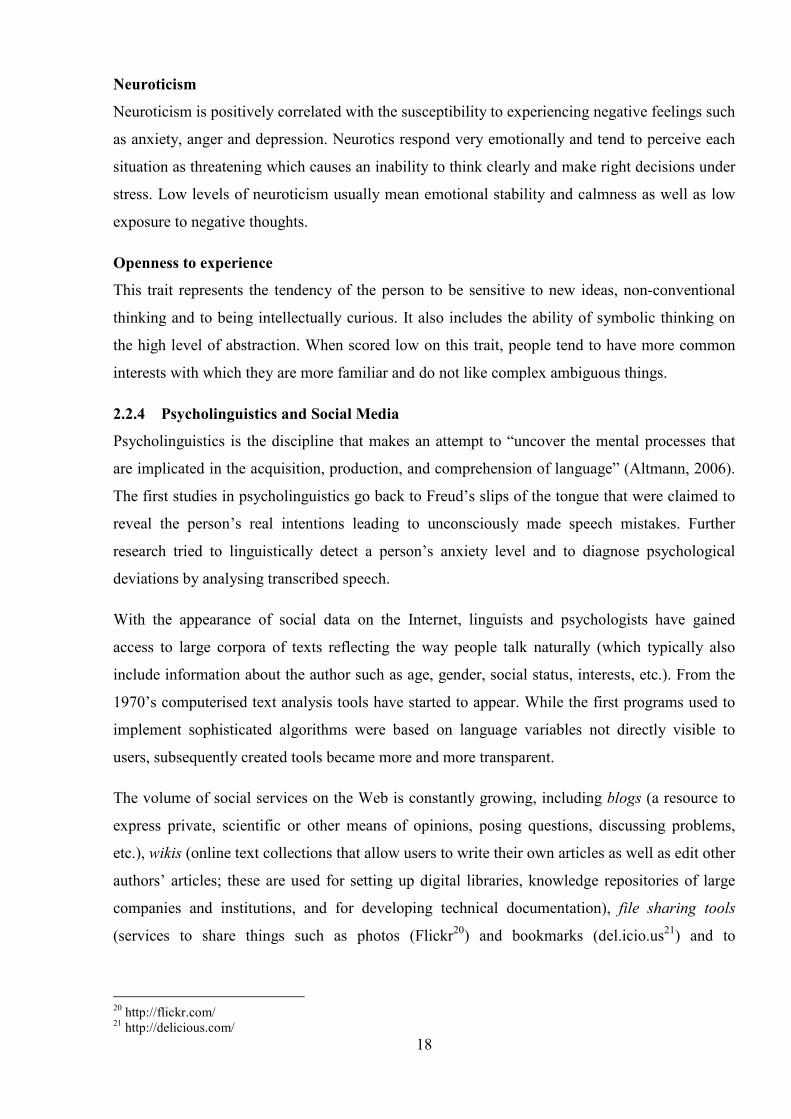
Quercia et al. (2011) conduct their research in the area of social media (Twitter posts in
particular) to study the personality of the users. They have established connections between
Twitter users and their Facebook profiles working with the Facebook application myPersonality
(some of the users provided the links to their Twitter accounts) developed by the “myPersonality
Research” project25. An example of the application's user interface is shown in Figure 2.3.
The authors have classified Twitter users into 5 categories: listeners (who mainly follow others
and do not provide a lot of content themselves; correlations were found with extraversion
(positive) and neuroticism (negative) traits and between the age of the individual and the amount
of users to follow), popular (who have many followers; there is a positive correlation between
the popularity of the user and his age), highly-read (who are highly cited in other people’s
reading lists and their personality type shows high scores in openness to experience) and
influential (described below).
To estimate the amount of influence of the people in the last group two measures are used: the
Klout score26 (depends on the number of times the tweet was clicked, replied and retweeted) and
the measure introduced by the TIME magazine (based on the Twitter and Facebook popularity)
22 http://facebook.com/
23 http://bebo.com/
24 http://twitter.com/
25 http://mypersonality.org/research/
26 http://klout.com
20
(Silver, 2010). The Influential trait positively correlates with extraversion and additionally
individuals with high scores in the TIME measure also have scored highly on conscientiousness.
Figure 2.3: Fragment of the myPersonality application user interface
Oberlander and Nowson (2006) have focused on classifying the personality of the authors of
weblogs, based on the ideolects (individual words usage) of the people. They have been using bi-
and tri-grams to extract the personality from the text (all nouns were tagged via CLAWS). The
authors have found that even the small set of extracted features shows the correlation between
the features and particular personality traits.
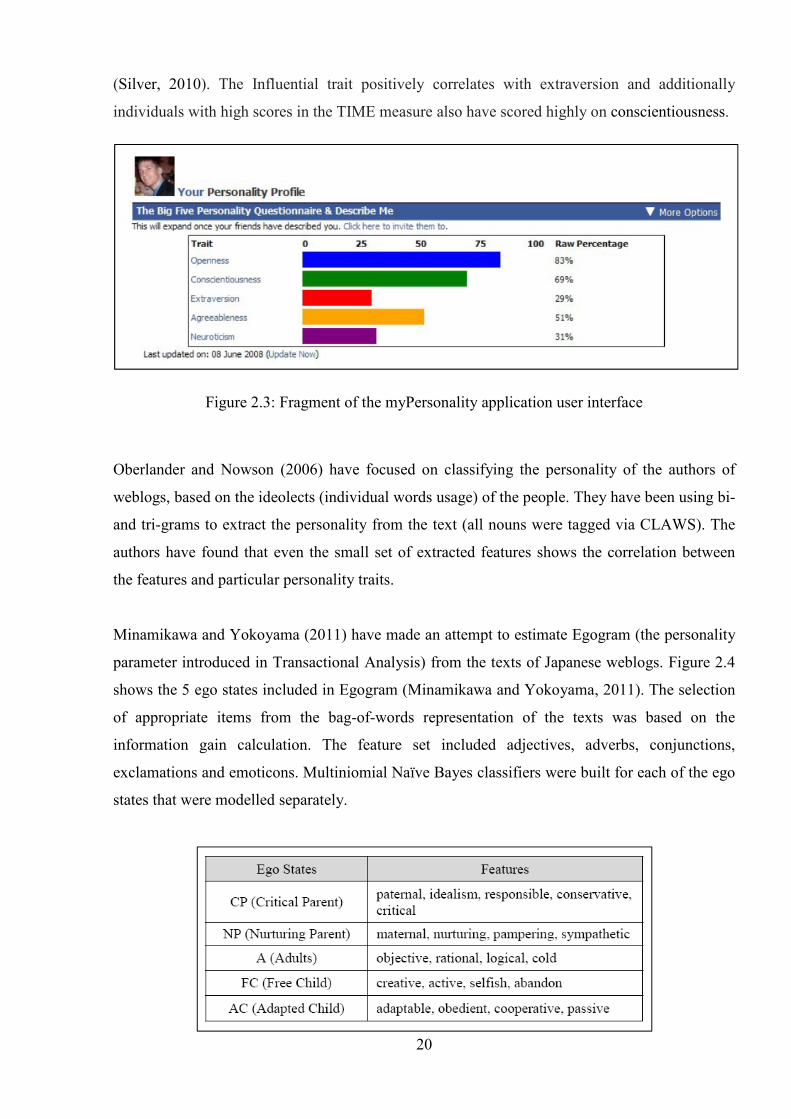
Minamikawa and Yokoyama (2011) have made an attempt to estimate Egogram (the personality
parameter introduced in Transactional Analysis) from the texts of Japanese weblogs. Figure 2.4
shows the 5 ego states included in Egogram (Minamikawa and Yokoyama, 2011). The selection
of appropriate items from the bag-of-words representation of the texts was based on the
information gain calculation. The feature set included adjectives, adverbs, conjunctions,
exclamations and emoticons. Multiniomial Naïve Bayes classifiers were built for each of the ego
states that were modelled separately.

21
Figure 2.4: Egogram. Traits of five ego states
Celli (2012) has proposed an unsupervised approach to personality estimation based on linguistic
cues. He analysed FriendFeed27 (the popular Italian social network) data in order to construct the
personality model of the authors, selecting 22 features mentioned in Mairesse et al. (2007). The
evaluation procedure involved the comparison of the scores produced for various posts of the
same user. Two measures are introduced – accuracy (showing the reliability of the model) and
validity (the variability of the personality type among the posts of the same author) - which are
calculated in an unsupervised way. The author has found that the most common personality type
on FriendFeed is an extrovert, insecure, agreeable, organised and unimaginative person. The
average accuracy of the results is 0.631 and the average validity is 0.729 (Celli, 2012).
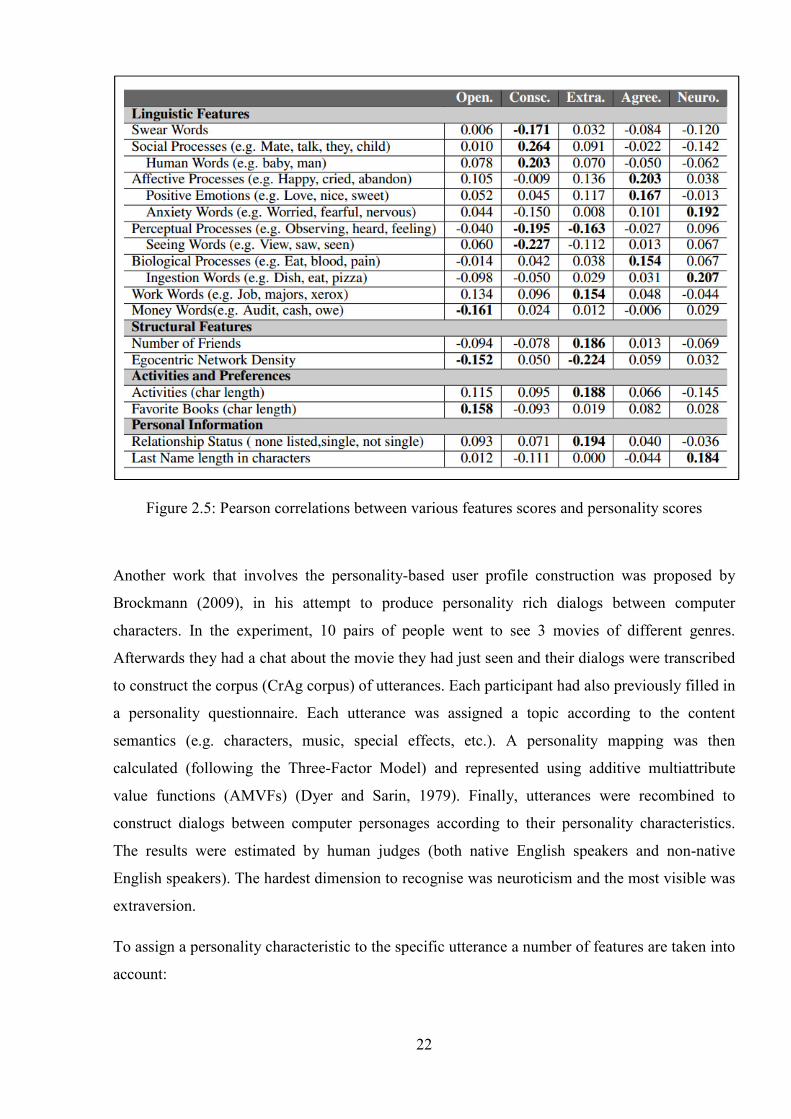
Golbeck et al. (2011) estimated the personality of Facebook users. Each Facebook profile
provides a lot of valuable information (birthday, location, the number of education places and
job positions, last profile update, the date the user joined the Facebook, etc.). One of the features
of the profile is the availability of “About Me” and status updates texts. These were used as a
source of estimating the personality based on linguistic cues. The authors found that the
Conscientiousness factor has the largest number of correlations with linguistic categories. To
predict the personality, the authors considered three groups of features apart from linguistic ones.
The correlations between the features scores and personality scores (estimated from
questionnaires of the users) are shown in Figure 2.5. In order to predict the personality score, the
M5’Rules and Gaussian Processes algorithms of the WEKA (Hall et al., 2009) tool were applied.
Results have shown that the personality type based on the Facebook profile features can be
predicted to within the 11% of its actual value.
27 http://friendfeed.com
22
Figure 2.5: Pearson correlations between various features scores and personality scores
Another work that involves the personality-based user profile construction was proposed by
Brockmann (2009), in his attempt to produce personality rich dialogs between computer
characters. In the experiment, 10 pairs of people went to see 3 movies of different genres.
Afterwards they had a chat about the movie they had just seen and their dialogs were transcribed
to construct the corpus (CrAg corpus) of utterances. Each participant had also previously filled in
a personality questionnaire. Each utterance was assigned a topic according to the content
semantics (e.g. characters, music, special effects, etc.). A personality mapping was then
calculated (following the Three-Factor Model) and represented using additive multiattribute
value functions (AMVFs) (Dyer and Sarin, 1979). Finally, utterances were recombined to
construct dialogs between computer personages according to their personality characteristics.
The results were estimated by human judges (both native English speakers and non-native
English speakers). The hardest dimension to recognise was neuroticism and the most visible was
extraversion.
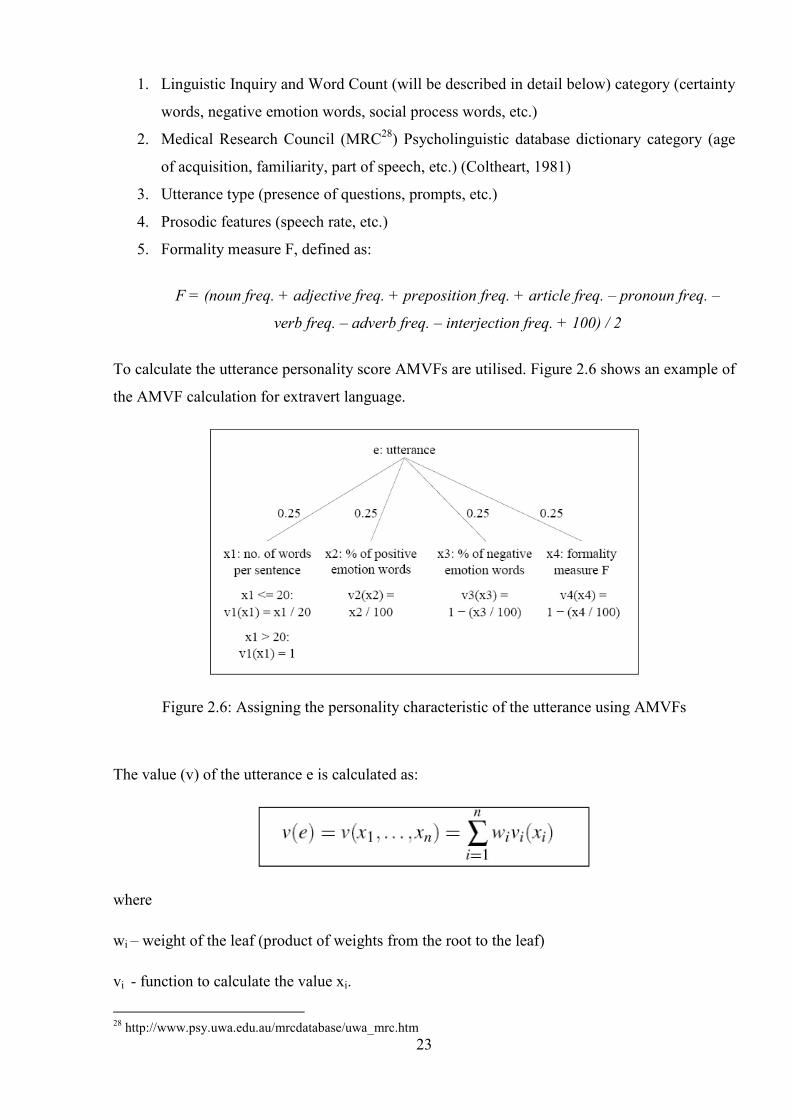
To assign a personality characteristic to the specific utterance a number of features are taken into
account:
23
1. Linguistic Inquiry and Word Count (will be described in detail below) category (certainty
words, negative emotion words, social process words, etc.)
2. Medical Research Council (MRC28) Psycholinguistic database dictionary category (age
of acquisition, familiarity, part of speech, etc.) (Coltheart, 1981)
3. Utterance type (presence of questions, prompts, etc.)
4. Prosodic features (speech rate, etc.)
5. Formality measure F, defined as:
F = (noun freq. + adjective freq. + preposition freq. + article freq. – pronoun freq. –
verb freq. – adverb freq. – interjection freq. + 100) / 2
To calculate the utterance personality score AMVFs are utilised. Figure 2.6 shows an example of
the AMVF calculation for extravert language.
Figure 2.6: Assigning the personality characteristic of the utterance using AMVFs
The value (v) of the utterance e is calculated as:
where
wi – weight of the leaf (product of weights from the root to the leaf)
vi - function to calculate the value xi.
28 http://www.psy.uwa.edu.au/mrcdatabase/uwa_mrc.htm

24
The Linguistic Inquiry and Word Count (LIWC) Program
One of the most widely used tools in the personality research is the Linguistic Inquiry and Word
Count29 program (Tausczik and Pennebaker, 2009) which was exploited in many projects
described above. LIWC is a text analysis tool that counts and sorts words according to their
psychological categories defined in the program dictionaries. The program processes the text
word by word, establishing the category of each word and calculating the overall percentage of
each of the discovered categories.
The LIWC categories are linked to various psychological processes in order to find the
correlations between them:
1. Attentional Focus
The usage of personal pronouns is related to the focus of attention. The more people
are involved in a painful experience and focus on themselves, the higher the number
of personal pronouns. The tense of the verbs reflects the temporal state of the focus of
attention. For example, the study of political advertisements has shown that positive
advertisements use present and future tenses of the verb to talk about acts of the
candidate while negative ones focus on the past actions of the opponent.
2. Emotionality
LIWC is able to identify the usage rates of positive and negative emotions. The
research shows that the higher the number of emotion words, the more involved the
person is in the traumatic experience.
3. Social relationships
The language can give insight into the status of the people involved in the
conversation. The lower the status, the more the first-person singular is used and the
higher the rate of questions asked.
Word count shows the intensity of the communication within the group and assents
(agree, ok, etc.), question marks and first-person plural can reveal the level of
cohesion within the group. However when assents appear at the very beginning of the
discussion they could signal blind agreement.
Word usage can also indicate deception and honesty. A high percentage of negative
emotion words, motion words, sense words, fewer exclusion words and less first-
singular could detect that the person is lying.
29 http://www.liwc.net

25
The analysis of pronouns reflects the closeness of the relationship. The greater the
number of second person, the lower the satisfaction with the relationship and the
higher the tendency to criticism and confrontation.
4. Thinking styles
Exclusive words usually signal the attempt to make a distinction between a number of
possible solutions and conjunctions are used to group thoughts together. The use of
causal and insight words can mean the process of the reevaluation of the past event
and often the improvement of the physical health.
5. Individual differences
LIWC categories can be used to relate the language usage to the personality traits. For
example, extraversion could be expressed by the higher words count, higher
percentage of social words and positive emotion words.
At the moment the dictionary contains more than 80 predefined categories including:
1. General descriptor categories (word count, words per sentence, etc.)
2. Standard linguistic dimensions (pronouns, adverbs, prepositions, etc.)
3. Words reflecting psychological processes (social processes, cognitive processes, etc.)
4. Personal concern categories (work, leisure, money, etc.)
5. Paralinguistic dimensions (assents, fillers, etc.)
6. Punctuation categories
The list of categories and their abbreviations is shown in Figure 2.7.

26
Figure 2.7: LIWC categories
2.3 Personality-based Recommender Systems
Recent research shows that users tend to appreciate Personality-based Recommender Systems
more than classical ratings-based systems, and return to sites that implement them more often
(Hu and Pu, 2009), as such approach is relatively new and systems can match people’s interests
at a deeper level. This type of RS can be used to recommend very different products from
movies to research papers as personality will serve as a linking factor (Hu, 2010) and similarity
measures for RSs based on personality features produce promising results (Tkalčič et al., 2009).
As the idea itself is still an emerging trend, the variety of proposed systems of this type is not
extensive.
Nunes (2010) in her research provides an overview of the state of the art of Personality-based
RSs. She mentions three pioneering works in the field. The concept of the emotional intelligence
was incorporated into the user profile by Gonzalez et al (2007) to create the Smart User Profile
(which includes feelings, impressions and emotional states of the users as well as their moods
retrieved by means of machine learning techniques). Masthoff and Gatt (2006) experiment with
predicting group satisfaction based on the individual user satisfaction (the more satisfaction and

27
positive emotions the first purchase brings to the user, the more likely he will return to make
another purchase). Saari et al. (2005) have introduced the concept of psychological
customization to extract the user’s emotional state, attention, learning abilities, etc. at the
particular moment of working with the system.
“What to rent” 30
is an example of an implementation of a Personality-based Recommender
System. It utilises the LaBarrie31 theory in order to produce suggestions of films to watch
depending not only on the personality but also on the current mood of the user. The personality
construction procedure involves filling in the questionnaire to assess the main features of the
character of the individual for movies recommendation.
It the following subsections, we survey the principal works in Personality-based Recommender
Systems.
2.3.1 Tkalčič approach
Tkalčič et al. (2009) proposed a personality-based approach for collaborative filtering RSs that
follows the Big Five model. They make an assumption that the personality of the user doesn’t
change significantly over time and thus the neighborhood of the user can be calculated in
advance (lower real-time computational effort). The personality scores were calculated by means
of the questionnaire. The authors applied and tested three similarity measures for the offline
collaborative filtering experiment: ratings-based, using Euclidian distance with the Big Five data
and weighted Euclidian distance with the Big Five data. The approaches using the Big Five data
have performed statistically equivalent or better than ratings-based.
2.3.2 Hu and Pu approach
A Personality-based music Recommender System was introduced by Hu and Pu (2010). The
authors base their system on the correlations between musical preferences and personality types
that follow the finding of Rentfrow (2003). Rentfrow found four preference groups according to
various styles of music compositions that people are fond of. For example, the “reflective and
complex” group (which prefers jazz, blues and classical music) has correlations with openness to
new experience Big Five dimension and “energetic and rhythmic” group (which tends to
appreciate rap, hip-hop, funk and electronic music) correlates positively with extraversion and
agreeableness.
The personality data of the music RS has been calculated by means of the Big Five
questionnaire. The similarity between the two users has been estimated based on the Pearson
30 http://whattorent.com
31 http://whattorent.com/theory.php

28
correlation coefficient with the personality scores. The authors have also tested the combined
similarity measure that incorporates ratings data. They have shown that the personality-based
approach achieves a significant improvement over the baseline of considering only ratings data.
2.3.3 Nunes approach
In her research, Nunes (2008) proposes the personality-based Recommender System to provide a
better personalised environment for the customer. She claims that one interesting outcome of
introducing a psychological dimension into the recommender system could be the possibility of
products categorization based not only on their attributes (price, physical parameters, etc.) but
also on the effect they may have on the consumer.
To construct the user profile, Nunes (2008) proposes the following model. Cuser-i is represented
by the list of pairs (personality trait and its value) of the following format:
C user−i = [((i, d, f)1 , v1 ), ((i, d, f)2 , v2 ), . . . , ((i, d, f)n , vn )],
where
i – one of the items in NEO-IPIP inventory (“have a vivid imagination”, “get angry
easily”, “trust others”, etc.),
d – Big Five categories,
f – Big Five category facet,
v – personality trait value expressed by valence taken from the list of 5 possible options
(very-inaccurate, moderately-inaccurate, neither-accurate-nor-inaccurate, moderately-
accurate, very-accurate).
In order to fill in the user profile an online tool is utilised which has a number of questionnaires
for the user to complete. It is organised as a list of statements from NEO-IPIP inventory. Each of
the statements should be evaluated by the user (choosing from the five possible options
mentioned above). After completion, results are calculated based on the NEO-IPIP Norms
developed by Johnson (list of mean values and standard deviations (SD) for each of the Big Five
categories and each of 6 facets in those categories) using the following formulas:
Score BigFive−facet user−i = 50 + ( 10 * ( score facet user−i ) − mean facet ) / SD facet )
Score BigFive−domain user−i = 50 + ( 10 * ( score domain user−i ) − mean domain ) / SD domain )
29
Finally, the user is presented with the detailed description of his personality organised in the
prognostic report.
Nunes (2008) conducted a number of experiments to evaluate the constructed Recommender
System. In the first experiment 100 participants were asked to complete the NEO-IPIP Inventory
(300 statements) to describe the personality of an ideal president and the personality of two real
candidates using the online tool. Only 10% of people were able to complete the whole task (900
statements in total). To assess the validity of the experiment the results of the recommendation of
one of the candidates (based on the profile of the ideal president) were compared to the actual
voting option participants chose. If only the 5 main categories of the Big Five model were taken
into account the accuracy of the recommendation was 80%. With the decomposition of the main
categories down to 30 facets the accuracy reached 100%. In the second experiment the Social
Matching system was imitated. 280 participants were asked to intuitively form groups to work on
a project. The choice they made was then compared to the predictions of the Recommender
System. As only a small percentage of participants were able to complete the whole
questionnaire from the NEO-IPIP Inventory, the experiment was repeated with the new
questionnaire based on TIPI Inventory with only 10 statements to evaluate. As a result 4, out of
19 intuitively formed groups were predicted with 100% accuracy.
2.4 Summary
In this chapter we have described the emerging research area of Personality-based Recommender
Systems. We have studied the existing approaches and algorithms of building an RS and
presented an overview of the personality estimation task.
It was found that existing Personality-based RSs utilise questionnaires (mostly following the Big
Five model) in order to construct the personality profile of the user. One of the drawbacks of this
method is the amount of time required to complete the task. The other important factor is the
correctness of the information provided by the user as questionnaire statements may be
misinterpreted or answered inaccurately.
In our research, we introduce an alternative way of constructing a Personality Based RS, which
provides an automatic calculation of the user’s personality scores from text that they write,
which is freely accessible from online accounts on social media services. We apply the tools of
personality from the text estimation available from previous research. The advantage of the
proposed approach is that it does not require any special effort (e.g. filling in the questionnaire,
etc.) from the user to estimate his personality (other than the user profile name from the
appropriate social media resource) to receive appropriate recommendations.

30

31
Chapter 3: The TWIN System
The number of available Recommender Systems is constantly growing nowadays in order to
improve the quality of the user’s time spent online and to provide a convenient shortcut to the
most valuable and personalised information. Recommender Systems trace the behaviour of
people and automatically process the artefacts they create in order to learn the users’ preferences.
Such information leads to the possibility of recommending newly appearing items based on a
person's likes and dislikes.
As one of the main contributions of online communities (such as Facebook, TripAdvisor, etc.) is
the exchange of pure text messages, the most beneficial way of gathering implicit information
about the authors involves the application of natural language processing tools and techniques.
Such text analysis could be more efficient compared to the standard voting procedures and
extraction of the attributes of an item utilised in traditional Recommender Systems
(Fleischman and Hovy, 2003).
Recent research in psychology has developed tools that allow the estimation of the author’s
personality from the context of the words that are used in the text (Tausczik and Pennebaker,
2009). We have decided to apply those findings to introduce the personality dimension in the
Recommender Systems field. One of the main advantages of the approach is that the user is not
required to perform any additional steps (such as filling in questionnaires, voting, or providing
descriptions of the content) to get appropriate recommendations. The personality is constructed
automatically from the text of the users through the analysis of their natural style of writing.
Furthermore, this eliminates the subjectivity and interference that could be introduced by the
user evaluating or describing content.
In this research work, we propose the TWIN (“Tell me What I Need”) Personality-based
Recommender system, which follows a combination of the content-based and user-based
collaborative filtering approaches. We make an assumption that the “similarity” between people
can be established by analysing the context of the words they are using. Accordingly, the
occurrence of the particular words in the particular text reflects the personality of the author.
32
This suggestion leads to the possibility of the text-based detection of a circle of “twin-minded”
authors whose choices could be quite similar and thus could be recommended to each other.
3.1 Task description
Facing the uncertainty arising from the high amount of options available in online communities,
the user needs a tool (a Recommender System) that would help him to navigate through the
content in the most effective way. Therefore such a tool should become the bridge between the
user (his characteristics) and other people and their contributions.
The ideal situation for the individual working with the Recommender System is the implicit
gathering of his preferences, their automatic analysis and the provision of the list of most
relevant items based on those characteristics. As the crucial part of the process is choosing the
right type of information that would describe the user most precisely, the personality assessment
could be more effective than the description provided by purely demographic or behavioral data
(“traces” of the user behavior within the system, such as pages viewed, items purchased, etc.).
As the automatic and effortless approach is the preferred one, the personality should be estimated
from online sources that already have some of the user contributions available for analysis.
Existing online communities (Facebook, TripAdvisor, Twitter, etc.) provide a large amount of
such freely accessible information that can be collected and processed to produce personality
scores for the individual.
In the TWIN system we follow the personality-based approach described in Chapter 2 to
represent the user (following the Big Five model). Thus the first step the system performs when
the user logs in is the crawling of resources already created by the person. As mentioned
previously, we are estimating the personality from the textual content automatically using the
tool created in previous research (Mairesse, 2007). In this way, the individual is not obliged to
explicitly provide his personal information, ratings, answer any questions, etc., which saves him
time and minimises the effort.
When the personality analysis is over, the information is stored in the database and used to
construct and visualise the user profile. To generate the precise description of the user
information an ontology is constructed based on the general vocabularies freely available on the
Semantic Web (Berners-Lee, 2001).
The TWIN system can be utilised in two different ways: as a RS or as a personality visualiser.
The main approach is to use TWIN as a Recommender System (asking to actually perform the
recommendations). In order to produce recommendations, TWIN searches for the profiles of
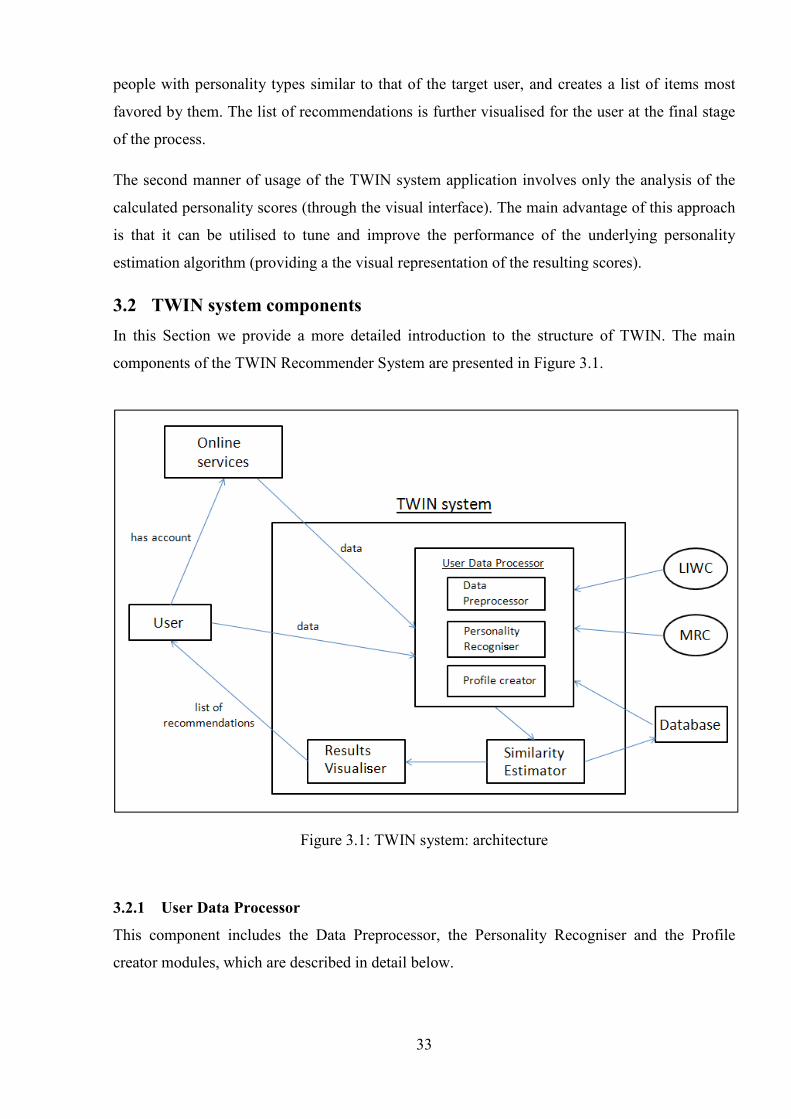
33
people with personality types similar to that of the target user, and creates a list of items most
favored by them. The list of recommendations is further visualised for the user at the final stage
of the process.
The second manner of usage of the TWIN system application involves only the analysis of the
calculated personality scores (through the visual interface). The main advantage of this approach
is that it can be utilised to tune and improve the performance of the underlying personality
estimation algorithm (providing a the visual representation of the resulting scores).
3.2 TWIN system components
In this Section we provide a more detailed introduction to the structure of TWIN. The main
components of the TWIN Recommender System are presented in Figure 3.1.
Figure 3.1: TWIN system: architecture
3.2.1 User Data Processor
This component includes the Data Preprocessor, the Personality Recogniser and the Profile
creator modules, which are described in detail below.
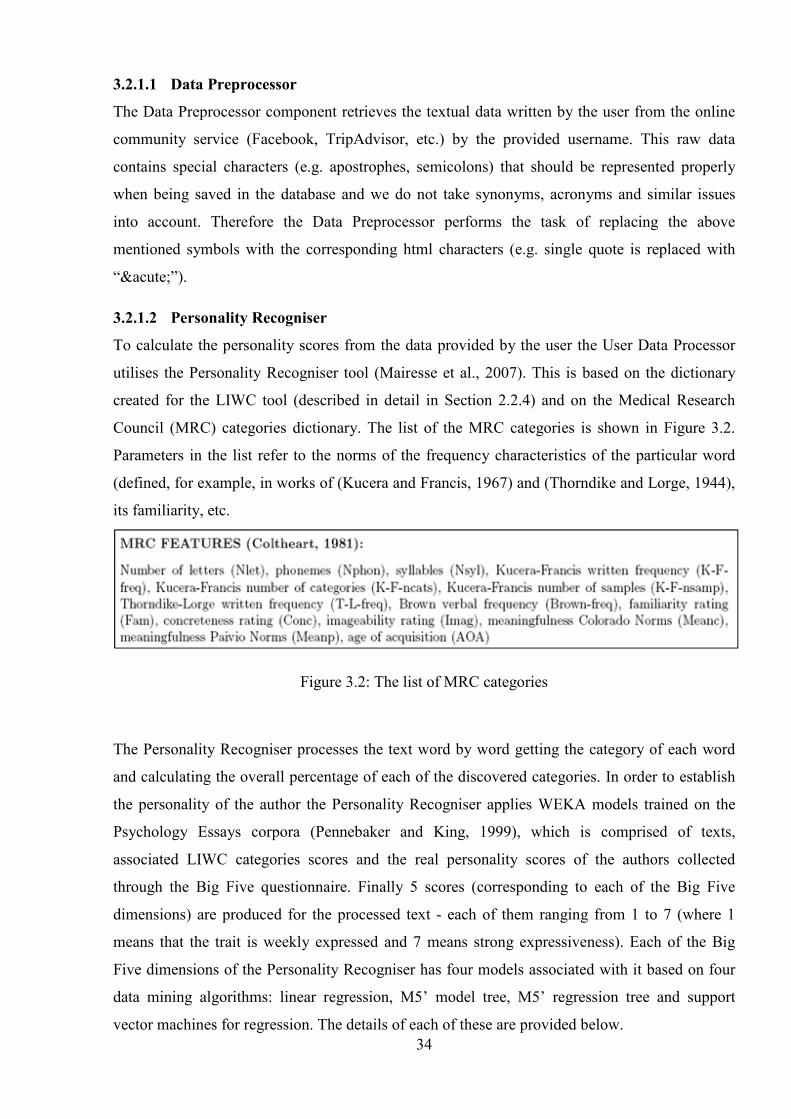
34
3.2.1.1 Data Preprocessor
The Data Preprocessor component retrieves the textual data written by the user from the online
community service (Facebook, TripAdvisor, etc.) by the provided username. This raw data
contains special characters (e.g. apostrophes, semicolons) that should be represented properly
when being saved in the database and we do not take synonyms, acronyms and similar issues
into account. Therefore the Data Preprocessor performs the task of replacing the above
mentioned symbols with the corresponding html characters (e.g. single quote is replaced with
“´”).
3.2.1.2 Personality Recogniser
To calculate the personality scores from the data provided by the user the User Data Processor
utilises the Personality Recogniser tool (Mairesse et al., 2007). This is based on the dictionary
created for the LIWC tool (described in detail in Section 2.2.4) and on the Medical Research
Council (MRC) categories dictionary. The list of the MRC categories is shown in Figure 3.2.
Parameters in the list refer to the norms of the frequency characteristics of the particular word
(defined, for example, in works of (Kucera and Francis, 1967) and (Thorndike and Lorge, 1944),
its familiarity, etc.
Figure 3.2: The list of MRC categories
The Personality Recogniser processes the text word by word getting the category of each word
and calculating the overall percentage of each of the discovered categories. In order to establish
the personality of the author the Personality Recogniser applies WEKA models trained on the
Psychology Essays corpora (Pennebaker and King, 1999), which is comprised of texts,
associated LIWC categories scores and the real personality scores of the authors collected
through the Big Five questionnaire. Finally 5 scores (corresponding to each of the Big Five
dimensions) are produced for the processed text - each of them ranging from 1 to 7 (where 1
means that the trait is weekly expressed and 7 means strong expressiveness). Each of the Big
Five dimensions of the Personality Recogniser has four models associated with it based on four
data mining algorithms: linear regression, M5’ model tree, M5’ regression tree and support
vector machines for regression. The details of each of these are provided below.

35
Linear Regression
Linear regression is one of the basic algorithms for mining the data with numeric attributes. It
provides the linear combination of all the attribute values with their weights estimated from the
training data in order to represent a particular class (Witten and Frank, 2005):
x = w0 + w1a1 + w2a2 + ... + wkak,
where wk is a weight, ak is the value of the attribute and x is a class.
Below is an example of the fragment of the openness to experience WEKA model with linear
regression algorithm:
ZOPEN = 0.0008 * BROWN-FREQ + -0.009 * CONC + -0.0212
* FAM + 0 * K-F-FREQ + 0.1653 * K-F-NCATS + 0.0076 *
MEANC + 0.2425 * NLET + 0.9659 * NPHON + -0.917 * NSYL
+ 0 * T-L-FREQ + 0.0007 * WPS + 0.1557 * Qmarks + 0.0127
* Unique + -0.0377 * Dic + -0.0168 * Sixltr + 0.0546 *
Pronoun + 0.1225 * We + -0.0434 * Self + 0.0792 * You +
0.0747 * Other + 0.0668 * Article + 0.0219 * Preps + -0.0636 *
Number + 0.1443 * Affect + -0.1315 * Posemo + 0.1275 *
Posfeel + -0.1593 * Optim + -0.1151 * Negemo + -0.0821 *
Anger + -0.0365 * Cogmech + 0.0606 * Insight + 0.0664 *
Discrep + 0.1525 * Inhib + 0.0343 * Tentat + 0.0741 * Certain
+ 0.0564 * Senses + 0.0671 * Hear + -0.0928 * Feel + -0.066
* Social + 0.0739 * Humans + -0.0291 * Time + -0.0177 *
Present + 0.0319 * Excl + -0.0701 * Achieve + 0.2034 * Swear
+ 0.0541 * Period + 0.0557 * Comma + 0.2532 * Colon +
0.1957 * SemiC + 0.0475 * Dash + 0.0599 * Apostro + 0.3377 *
Parenth + -0.0443 * AllPct + 13.0094
where attribute values (BROWN-FREQ, CONC, etc.) are the percentage of words found under
each of the LIWC and MRC categories (see Section 2.2.4 for the explanations of the
abbreviations). The choice of the specific categories for modelling of each of the Big Five
dimensions is learned from the training data.
Decision Trees
Regression and model trees are types of general decision trees (Witten and Frank, 2005) that deal
with numeric prediction (rather than category prediction). A decision tree is a structure learned
from the training data. Each node of the tree represents a function to compare specific attributes

36
of the unseen instance that needs to be classified. Each leaf assigns a class (or the probability of
the specific class) to the instance after all the comparisons have been made while traversing all
the nodes of the tree down to the particular leaf. The specific types of decision trees used by
Personality Recogniser are regression and model trees structures.
Regression trees differ from ordinary decision trees in the fact that their leaves contain the
average value assigned to the instances that reach that leaf. Below is an example of a fragment of
the WEKA extraversion model using the M5' Regression tree algorithm (only the first of the
leaves with linear regression model - LM1 - is shown):
Sexual <= 0.125 :
| Period <= 6.275 : LM1 (409/116.28%)
| Period > 6.275 :
| | Social <= 5.785 : LM2 (280/109.868%)
| | Social > 5.785 :
| | | Hear <= 1.365 : LM3 (253/120.444%)
| | | Hear > 1.365 : LM4 (86/123.519%)
Sexual > 0.125 :
| Negate <= 2.955 :
| | FAM <= 601.589 :
| | | Article <= 4.495 : LM5 (259/114.439%)
| | | Article > 4.495 : LM6 (326/121.763%)
| | FAM > 601.589 :
| | | Tentat <= 2.865 : LM7 (253/106.73%)
| | | Tentat > 2.865 :
| | | | Assent <= 0.125 : LM8 (157/105.593%)
| | | | Assent > 0.125 :
| | | | | T-L-FREQ <= 30894.95 : LM9 (108/117.678%)
| | | | | T-L-FREQ > 30894.95 : LM10 (40/117.341%)
| Negate > 2.955 : LM11 (305/134.66%)
LM num: 1
ZEXTRA =
+ 4.7964
LM num: 2
ZEXTRA =
+ 4.3708

37
where attribute values (Assent, Article, Negate, etc.) are the percentage of words found under
each of the LIWC and MRC categories. Only two examples of leaves are shown (“LM num: 1”
and “LM num: 2”).
Model trees have linear regression models in their leaves. Below is an example of a fragment of
the WEKA Consciousness model using the M5' Model tree algorithm (only the first of the leaves
with linear regression model – “LM num: 1” - is shown):
Swear <= 0.925 :
| Pronoun <= 16.71 : LM1 (22/49.343%)
| Pronoun > 16.71 : LM2 (46/77.164%)
Swear > 0.925 :
| Sexual <= 0.615 : LM3 (14/68.303%)
| Sexual > 0.615 :
| | NSYL <= 1.137 : LM4 (4/34.268%)
| | NSYL > 1.137 : LM5 (10/52.965%)
LM num: 1
CON.J =
0.0133 * CONC
- 0.0222 * IMAG
- 0.0572 * Pronoun
+ 0.0658 * Posemo
- 0.5933 * Sad
+ 0.0386 * Insight
- 0.0387 * Senses
+ 0.0437 * Comm
- 0.1082 * Swear
+ 8.2099
where attribute values (Pronoun, Swear, etc.) are the percentage of words found under each of
the LIWC and MRC categories.

38
Support Vector Machines for Regression
Figure 3.3: Support vector regression. ε = 1. Regression line for 8 data points, one attribute
considered
As with linear regression, the main aim of the support vector machines algorithm is to find a
function to approximate the training data points and minimise the prediction error (Witten and
Frank, 2005). The difference lies in the fact that the user can specify the ε parameter in order to
draw a tube around the regression line (see Figure 3.3).
The ε parameter represents how close the line will fit the training set. All errors (the deviations
from the regression line) within the tube are ignored and only support vectors (those lying on the
tube border or outside) will have an influence on the prediction error. The task of the algorithm
is to find a balanced solution between a minimum prediction error and the maximum flatness of
the tube.
Below is a fragment of the SVM model for the Consciousness parameter. Only attribute weights
are shown, not support vectors.

39
(normalised) ZCONSC =
0.0724 * (normalised) AOA
+ -0.3523 * (normalised) BROWN-FREQ
+ 0.0705 * (normalised) CONC
+ 0.0243 * (normalised) FAM
+ -0.0827 * (normalised) IMAG
+ 0.0326 * (normalised) K-F-FREQ
+ 0.0509 * (normalised) K-F-NCATS
+ -0.0581 * (normalised) K-F-NSAMP
+ 0.0543 * (normalised) MEANC
+ -0.0203 * (normalised) MEANP
+ -0.1685 * (normalised) NLET
+ -0.0056 * (normalised) NPHON
+ 0.1571 * (normalised) NSYL
+ 0.2616 * (normalised) T-L-FREQ
+ 0.022 * (normalised) WPS
+ 0.0258 * (normalised) Qmarks
+ -0.1017 * (normalised) Unique
…
3.2.1.3 Profile creator
The common way to save information about people and to model their identity within
Recommender Systems is to create User Profiles. These profiles can be knowledge-based (if
person’s details are acquired through questionnaires) or behaviour-based (extracted by means of
various natural language processing techniques) (Nunes, 2008). Here we follow the behaviour-
based approach, retrieving the profile data implicitly through the analysis of the text written by
the particular person.
We have decided to apply the principles of the Semantic Web and reuse existing ontologies to
construct the user model of the TWIN system. This format allows the sharing of the information
in a meaningful way between various applications (Roshchina et al., 2008) and such a choice is a
step towards a RS in that applies the ontology-based knowledge representation approach
proposed in recent research (Cantador, 2008). In order to represent the TWIN user we have built
an ontology based on the GUMO (Heckmann, 2005), Dublin Core32 and FOAF
33 vocabularies.
Figure 3.4 shows the relationship between the classes in the constructed user ontology. A more
detailed description of the classes can be found in Appendix A.
32 http://dublincore.org
33 http://www.foaf-project.org

40
Figure 3.4: TWIN user ontology
The Friend of a Friend (FOAF) vocabulary, originally created by Dan Brickley and Libby Miller,
is aimed at describing people, relations between them, their interests (Mika, 2004). FOAF has
become very popular with the emergence and fast spreading of social on-line networking
services.
Dublin Core vocabulary is aimed at bringing semantics to the discovery and managment of
resources promoting interoperability and co-operation. It provides a way of extensively
describing multipurpose metadata.
The GUMO ontology provides a way of extensively describing the user and is a part of the
framework that realises the concept of ubiquitous user modelling (Heckmann, 2005). It includes
demographic information, psychological state, among other aspects. It has appropriate classes to
represent the Big Five model personality parameters as well as general user data (age, gender,
etc.).
The GUMO vocabulary defines two classes that we have utilised the purpose of the TWIN user
profile construction: gumo:UnformattedText.100324 (to describe any text with no specific
41
structure) and gumo:Person.110003 (to represent the general user). The main classes introduced
in the TWIN ontology are the Review class, implemented as a subclass of
gumo:UnformattedText.100324, and the TWINUser class, being a subclass of the
gumo:Person.110003 and the corresponding GUMO classes to model the personality of the user.
Figure 3.5 shows an instance of the user ontology describing one of the users of the TWIN
system (Cheryl63) exported to and visualised by Protégé ontology editor. It can be seen that
Cheryl63 (an instance of the TWINUser class) has written five reviews (instances of the Review
class) and has personality scores that are instances of the corresponding GUMO Big Five model
classes.
The profile of each of the users is constructed as a mean of the scores produced by the
Personality Recogniser for each of the pieces of textual information created by the individual and
crawled from the corresponding online community. Thus, each user profile is seen as the
following structure:
Profileuser-i = [ (bfi-open, vi,1), (bfi-cons, vi,2), (bfi-extra, vi,3), (bfi-agree, vi,4), (bfi-neuro, vi,5) ],
where
user-i is the profile of the current user,
bfi-open is the Big Five Openness to Experience parameter,
bfi-cons is the Big Five Consciousness parameter,
bfi-extra is the Big Five Extraversion parameter,
bfi-agree is the Big Five Agreeableness parameter,
bfi-neuro is the Big Five Neuroticism parameter
and vi,j are the values of the corresponding Big Five parameter.
3.2.2 The Similarity Estimator
The goal of the Similarity Estimator is to search for similar-typed people among all of the users
profiles within the system, based on the assigned personality scores. The final recommendations
are calculated considering the items liked by the community of discovered people.
As the k-nearest neighbour approach (kNN) shows high performance (Islam et al., 2007) and is
relatively easy to apply for the RS, we have chosen to implement it for the Similarity Estimator

42
component. The kNN algorithm calculates the value of the distance function in order to select k-
nearest points from the current one and assign the majority class of the found circle of
neighbours. To estimate the similarity of user profiles, we have chosen the most commonly used
Euclidian distance (Witten and Frank, 2005):
where k is the number of attributes (in our case the maximum was 5) and ak are attribute values.
The typical values for the k parameter (the number of neighbours) are 1, 3 and 5 (Islam et al.,
2007). We have chosen the value 5 so that the number of recommendations will not be too large
and at the same time will be sufficient to produce meaningful results.
3.2.3 The Results Visualiser
The Results Visualiser is constructed as a Flash application to represent the results of the
recommendation for the user. It requires the user profile name of the particular social media site
to retrieve the textual information written by the user. After the calculation of the personality
performed by the Profile creator, its visual representation is provided by the Results Visualiser.
Therefore the user can analyse his personality scores and compare them to other users’ scores.
3.3 Summary
In this chapter we have provided a description of the TWIN system and its components. We have
introduced the means by which it applies personality from the text recognition (the Personality
Recogniser tool available from the previous research) to form the basis of the underlying
recommendation algorithm for the RS.
The main components of the TWIN system were discussed in detail: the User Data Processor
(which collects the data written by the user from the social media online resource, analyses it,
calculates personality scores and stores the results in the user profile following the constructed
user ontology), the Similarity Estimator (which performs the general functionality of the RS by
applying the kNN algorithm to find the circle of people with similar personality) and the Results
Visualiser (the Flash user interface that visualises the calculated personality of the user and
presents the list of found recommendations).
In the following Chapter, we proceed to describe the experiments conducted with the TWIN
system, and discuss their outcomes.

43
Figure 3.5: TWIN
user (C
heryl63) profile ontology

44
45
Chapter 4: Experiments and Results
In this chapter we provide the description of the experiments performed in order to evaluate the
possibility of the TWIN system construction as well as the structure of the dataset crawled from
the TripAdvisor website.
4.1 Online travelling domain and Recommender Systems
One of the fastest developing online domains is the travelling sector. Travellers trying to find a
suitable accommodation tend to rely on a number of factors. In particular their choice depends
on the hotel awareness (the place is somehow more familiar to the person, for example as a result
of advertising) and hotel attitude based on the attributes of the hotel that are pivotal to the person
(for example location, cleanliness, service, etc.) (Vermeulen and Seegers, 2008; Sánchez García
et al., 2011). Thus the choice the traveller makes can become highly influenced by the market
games, advertising, popularity of some locations, etc. For this reason many people tend to trust
more the opinions of other travellers when making a decision about a particular place to go
(O’Connor, 2010).
Research shows that the role of social media in the online travelling domain, which allows
experience sharing, is significant and a high percentage of search engine results are links to the
social media sites belonging to a number of major categories like virtual community sites, review
sites, personal blog sites and social networking tools (Xiang and Gretzel, 2010).
Recently social sites such as TripAdvisor34 have started to emerge to allow their users to publish
reviews of the places to which they have travelled. TripAdvisor provides the interface to search
through the travel facilities (hotels, restaurants, etc.), check their availability for a specific date
and read the reviews associated with them. Most of the users of TripAdvisor (97%) return to the
site and utilise its content to plan their next trip (O’Connor, 2010). But as the volume of the
available reviews is growing in size every day, it is impractical for users to manually retrieve and
consider each review. This is where the necessity of constructing a Recommender System
34 http://www.tripadvisor.com

46
appears to provide automatic filtering of relevant touristic places through the analysis of reviews
texts and travellers profiles.
4.2 TripAdvisor data collection
In order to evaluate the performance of the TWIN system, we apply it in the travelling domain,
to suggest hotels from the TripAdvisor site by filtering out reviews produced by people with
like-minded views to those of the user. In order to establish the similarity between people we
construct a user profile by modelling the user’s personality (according to the Big Five model)
based on linguistic cues collected from the user-generated text of the reviews. This approach
provides recommendations that rely on factors independent in many ways from the user’s pre-
existing attitudes in the hotel market. It also avoids the subjective step of specifying explicit
preferences.
Our perspective of text oriented investigation of interests was chosen according to the following
principles:
• Sites such as tripadvisor.com allow the user to provide a broad description of the hotel
based on their evaluation of its location, quality, service and many other factors as well as
on the availability of photo uploading facilities. However many users ignore these
options and fill in only the main section of the review – the text itself. Therefore it is
useful to have a tool that would be able to make recommendations inferred from texts of
the reviews.
• In many cases, factors such as gender, age and marital status do not play a significant role
when talking about people’s preferences and general interests.
• This approach can be used in addition to the more classical search based on the
predefined fields mentioned earlier.
The diagram in Figure 4.1 describes the experiment with the TripAdvisor dataset:
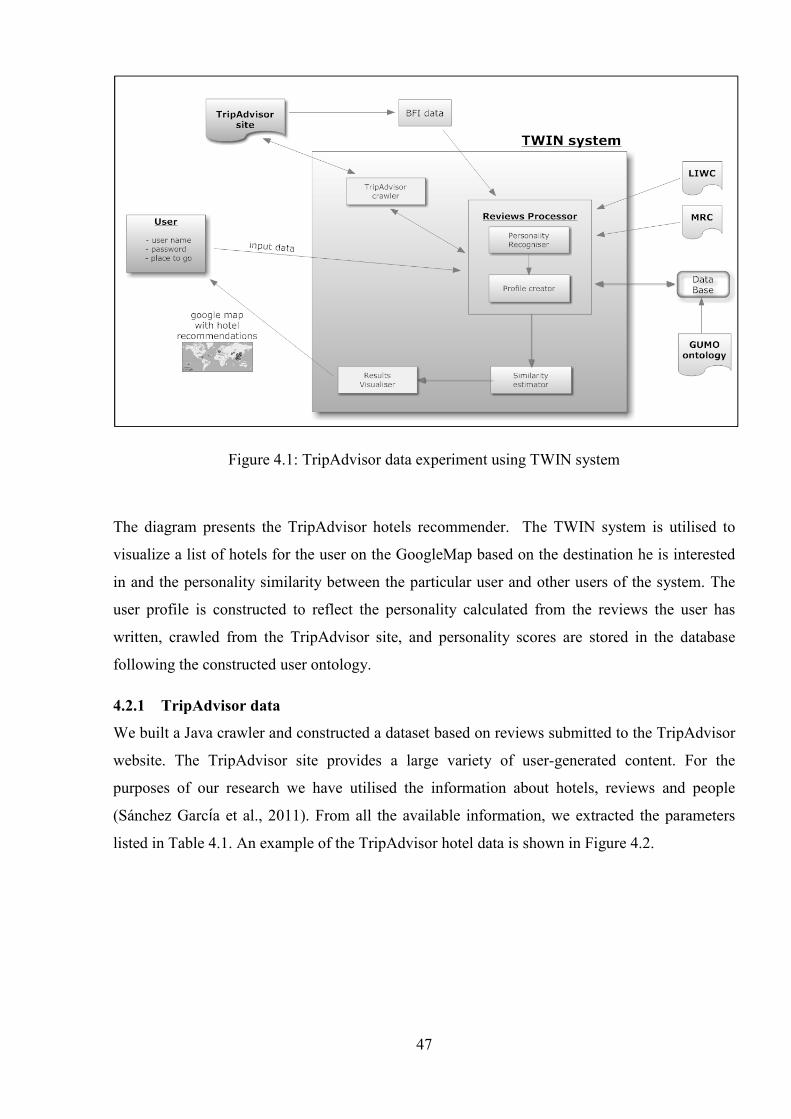
47
Figure 4.1: TripAdvisor data experiment using TWIN system
The diagram presents the TripAdvisor hotels recommender. The TWIN system is utilised to
visualize a list of hotels for the user on the GoogleMap based on the destination he is interested
in and the personality similarity between the particular user and other users of the system. The
user profile is constructed to reflect the personality calculated from the reviews the user has
written, crawled from the TripAdvisor site, and personality scores are stored in the database
following the constructed user ontology.
4.2.1 TripAdvisor data
We built a Java crawler and constructed a dataset based on reviews submitted to the TripAdvisor
website. The TripAdvisor site provides a large variety of user-generated content. For the
purposes of our research we have utilised the information about hotels, reviews and people
(Sánchez García et al., 2011). From all the available information, we extracted the parameters
listed in Table 4.1. An example of the TripAdvisor hotel data is shown in Figure 4.2.

Parameter
Name of the hotel
Number of stars
TripAdvisor index
Rating by reviewers
City and brand name
Table
All the available fields included in the TripAdvisor dataset are shown in
review information is shown
Parameter
Review title
Hotel rating
Text of the review
Detailed hotel ratings (value, rooms, location, cleanliness, service, sleep quality)
Date of stay
The purpose of the hotel visit
People the reviewer were travelling with
The field states whether the reviewer would recommend the hotel to others
The author of the review
Table
48
Parameter
Name of the hotel
Number of stars
TripAdvisor index
Rating by reviewers
City and brand name
Table 4.1: TripAdvisor hotels’ fields crawled
Figure 4.2. TripAdvisor hotel information
ncluded in the TripAdvisor dataset are shown in
information is shown in Figure 4.3.
Detailed hotel ratings (value, rooms, location, cleanliness, service, sleep quality)
The purpose of the hotel visit
People the reviewer were travelling with
The field states whether the reviewer would recommend the hotel to others
The author of the review
Table 4.2: TripAdvisor reviews’ fields crawled
ncluded in the TripAdvisor dataset are shown in Table 4.2. The typical
Detailed hotel ratings (value, rooms, location, cleanliness, service, sleep quality)
The field states whether the reviewer would recommend the hotel to others
: TripAdvisor reviews’ fields crawled

Finally, Figure 4.4 shows a
(especially the “Travel preferences” section) the most important information
the number of contributions (reviews, photos, blog posts) made by
Figure
35
http://www.tripadvisor.ie/ShowUserReviews-g60763
36 http://www.tripadvisor.ie/members/drp62
49
shows a standard user profile. As most of the profiles are incomplete
(especially the “Travel preferences” section) the most important information
of contributions (reviews, photos, blog posts) made by each
Figure 4.3: TripAdvisor hotel review35
Figure 4.4: Example TripAdvisor user profile36
g60763-d1776857-r105393078-The_Setai_Fifth_Avenue_a_Capella_managed_Hotel-New_York_City_New_York.html
http://www.tripadvisor.ie/members/drp62
standard user profile. As most of the profiles are incomplete
(especially the “Travel preferences” section) the most important information to be gathered was
each person.
36
New_York_City_New_York.html

50
4.3 Calculating personality from the text
As mentioned above, there are two main ways of estimating the personality of an individual. The
most widely used is questionnaire completion, while the more challenging way is to estimate the
personality based on linguistic cues.
We investigated the questionnaire approach for the TWIN system construction and have built a
web page with the Big Five questionnaire37 (John, 2008). As the time required to fill in the
questionnaire is approximately 15 minutes and most users are not sufficiently motivated to
complete it, we decided to implement the personality from the text estimation only.
We processed reviews data with the Personality Recogniser tool to produce the Big Five scores
for each of the reviews texts. The overview of the dataset is presented in Table 4.3.
Parameter Value
Number of reviews 14,000
Number of people 1,030
Average number of reviews per person 13.8
Minimum number of reviews per person 5
Maximum number of reviews per person 40
Number of words in all reviews 2.9 million
Average number of words per review 210.8
Average number of words per sentence 16.6
Minimum number of words per sentence 3
Maximum number of words per sentence 39.7
Table 4.3: TripAdvisor dataset parameters
At the pre-processing stage we filtered out the small percentage of those (approximately 1.2%)
for which the scores were incorrectly calculated (i.e., those which were outside the expected
range of 1 to 7). As each score is calculated from the text of the review independently (for more
details see Section 3.2.1.2), we have analysed each of them separately. The results per each
dimension are summarised in Tables 4.4-4.8 and Figures 4.5-4.9.
37 http://www.ocf.berkeley.edu/~johnlab/bfi.php

51
Extraversion
Parameter Value
Minimum 1.01
Maximum 6.988
Mean 3.665
Standard deviation 0.634
Table 4.4: Extraversion scores parameters
Figure 4.5. Extraversion scores distribution
Agreeableness
Parameter Value
Minimum 1.024
Maximum 6.964
Mean 3.675
Standard deviation 0.708
Table 4.5: Agreeableness scores parameters
Figure 4.6: Agreeableness scores distribution
Consciousness
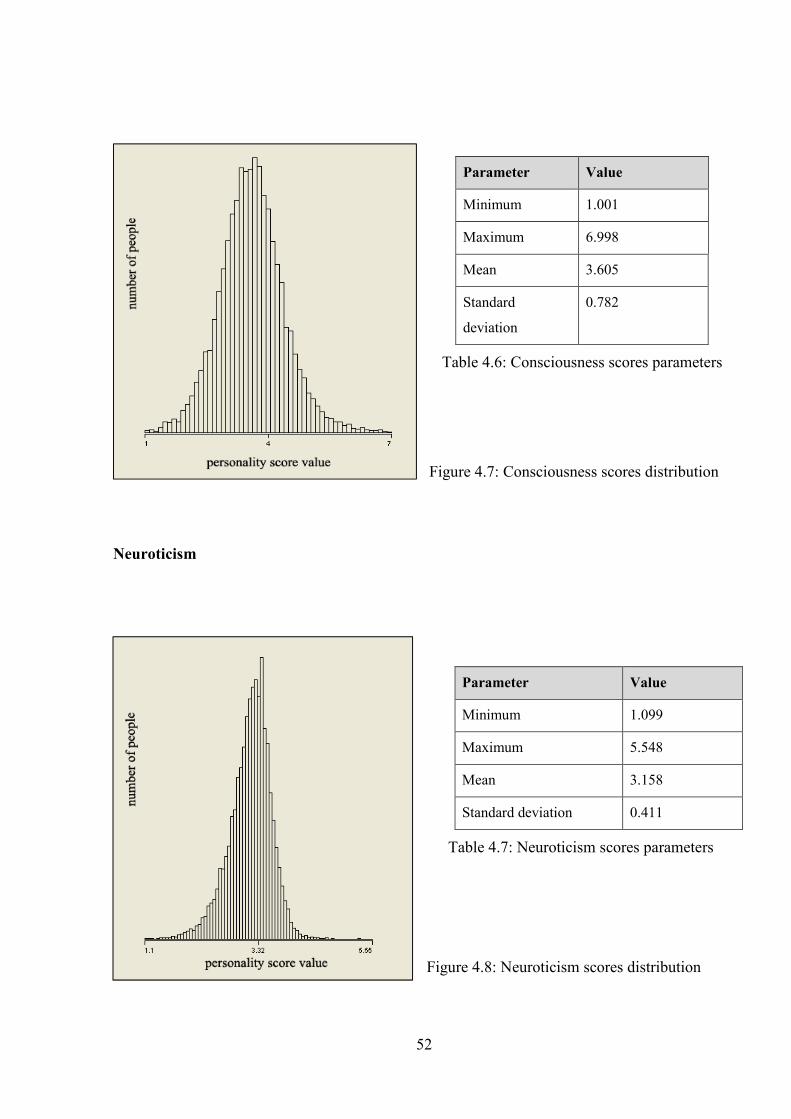
52
Parameter Value
Minimum 1.001
Maximum 6.998
Mean 3.605
Standard
deviation
0.782
Table 4.6: Consciousness scores parameters
Figure 4.7: Consciousness scores distribution
Neuroticism
Parameter Value
Minimum 1.099
Maximum 5.548
Mean 3.158
Standard deviation 0.411
Table 4.7: Neuroticism scores parameters
Figure 4.8: Neuroticism scores distribution
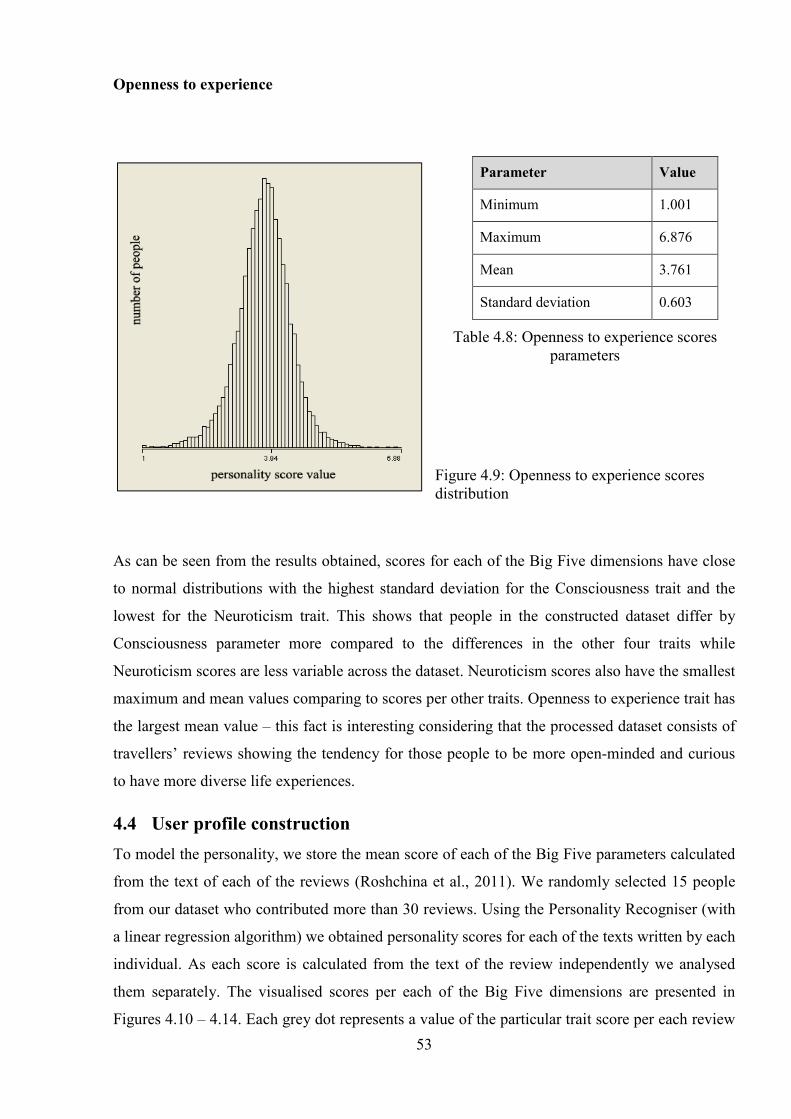
53
Openness to experience
Parameter Value
Minimum 1.001
Maximum 6.876
Mean 3.761
Standard deviation 0.603
Table 4.8: Openness to experience scores
parameters
Figure 4.9: Openness to experience scores
distribution
As can be seen from the results obtained, scores for each of the Big Five dimensions have close
to normal distributions with the highest standard deviation for the Consciousness trait and the
lowest for the Neuroticism trait. This shows that people in the constructed dataset differ by
Consciousness parameter more compared to the differences in the other four traits while
Neuroticism scores are less variable across the dataset. Neuroticism scores also have the smallest
maximum and mean values comparing to scores per other traits. Openness to experience trait has
the largest mean value – this fact is interesting considering that the processed dataset consists of
travellers’ reviews showing the tendency for those people to be more open-minded and curious
to have more diverse life experiences.
4.4 User profile construction
To model the personality, we store the mean score of each of the Big Five parameters calculated
from the text of each of the reviews (Roshchina et al., 2011). We randomly selected 15 people
from our dataset who contributed more than 30 reviews. Using the Personality Recogniser (with
a linear regression algorithm) we obtained personality scores for each of the texts written by each
individual. As each score is calculated from the text of the review independently we analysed
them separately. The visualised scores per each of the Big Five dimensions are presented in
Figures 4.10 – 4.14. Each grey dot represents a value of the particular trait score per each review

54
of the current person. Dots with a “+” symbol in the middle show the mean score of all the
reviews of the person. Line that joins all of such dots helps to see more clearly the variability in
the mean scores.
Figure 4.10: Extraversion scores distribution with means for each review set
Figure 4.11: Agreeableness scores distribution with means for each review set

55
Figure 4.12: Conscientiousness scores distribution with means for each review set
In order to check whether the means of personality scores per person differ from each other we
have performed the ANOVA test (Analysis Of Variance) (Meloun and Militky, 2011). Normally
when there are only two samples the standard t-test is applied but here we were comparing the
variance of mean values of 15 samples representing 15 different people. The test has shown
significant differences (p < 0.001) between persons in each of the Big Five categories. Thus it
can be concluded that mean scores vary sufficiently from one person to another showing
different personality patterns for each person which results in the correctness of the
Hypothesis 1. This fact enables us to use the mean score as the estimation of the personality in
each of the 5 dimensions. Therefore we can accept that the Hypothesis 2 is also correct.
Figure 4.13: Neuroticism scores distribution with means for each review set

56
It can be seen that openness to experience scores have the highest variability in means which
suggests that this trait may be the easiest to detect. This result is in agreement with Mairesse et
al. (2007) who had also found that openness to experience is the easiest trait to model.
Figure 4.14: Openness to experience scores distribution with mean scores for each review set
4.5 Comparison of the performance of Personality Recogniser Algorithms
To evaluate the performance of the 4 algorithms available in the Personality Recogniser we
selected 15 people who contributed more than 30 reviews from our dataset (Roshchina et al.,
2011). We calculated the scores of each of the Big Five parameters for each review separately
applying all the 4 algorithms. To compare the performance of the algorithms we analysed the
standard deviations of the scores of reviews written by the same person. The hypothesis under
consideration is that the algorithm producing scores that differ the least for the reviews of the
same author will be the best to apply for the personality recognition task in the TWIN system.
We studied the performance of the algorithms separately for each dimension as the Big Five
scores are estimated independently from the text of the review. For each personality trait we
have constructed 4 samples (representing each of the 4 algorithms) of standard deviations of the
reviews scores of the 15 individuals. The ANOVA test (Meloun and Militky, 2011) results have
shown significant differences between the samples for almost all of the Big Five parameters.
Therefore, the performance of the algorithms differs for all of the traits (see Table 4.9).
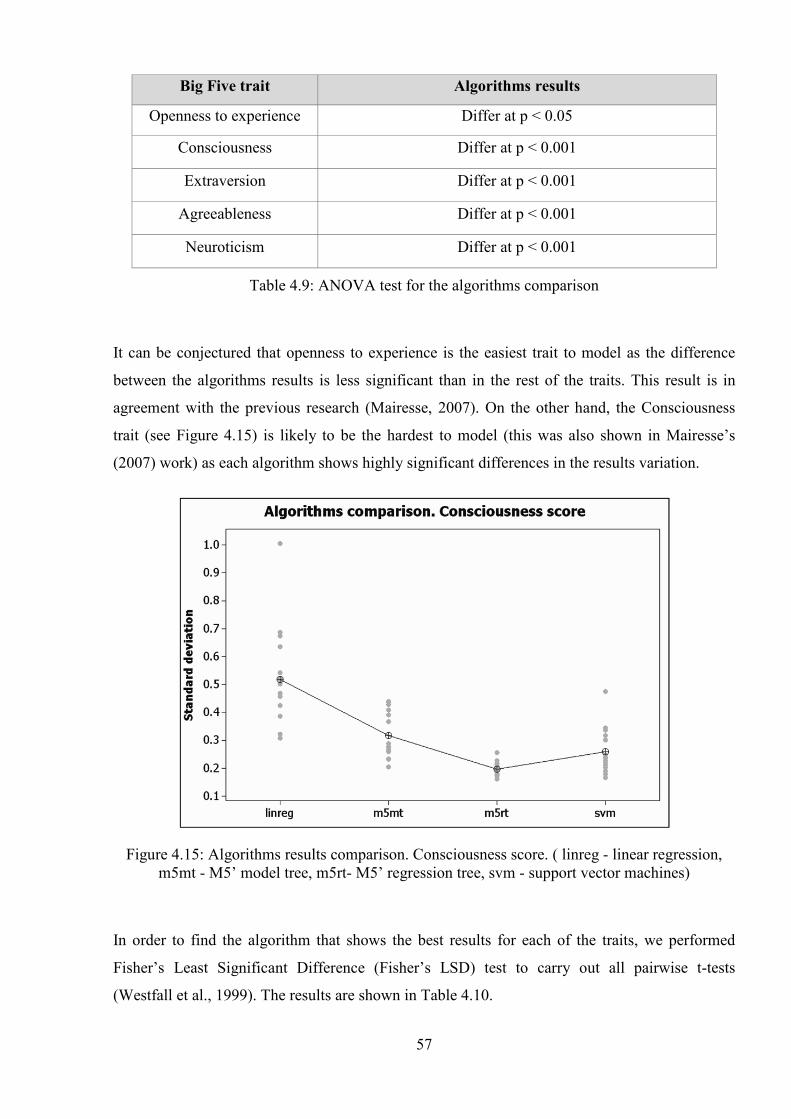
57
Big Five trait Algorithms results
Openness to experience Differ at p < 0.05
Consciousness Differ at p < 0.001
Extraversion Differ at p < 0.001
Agreeableness Differ at p < 0.001
Neuroticism Differ at p < 0.001
Table 4.9: ANOVA test for the algorithms comparison
It can be conjectured that openness to experience is the easiest trait to model as the difference
between the algorithms results is less significant than in the rest of the traits. This result is in
agreement with the previous research (Mairesse, 2007). On the other hand, the Consciousness
trait (see Figure 4.15) is likely to be the hardest to model (this was also shown in Mairesse’s
(2007) work) as each algorithm shows highly significant differences in the results variation.
Figure 4.15: Algorithms results comparison. Consciousness score. ( linreg - linear regression,
m5mt - M5’ model tree, m5rt- M5’ regression tree, svm - support vector machines)
In order to find the algorithm that shows the best results for each of the traits, we performed
Fisher’s Least Significant Difference (Fisher’s LSD) test to carry out all pairwise t-tests
(Westfall et al., 1999). The results are shown in Table 4.10.
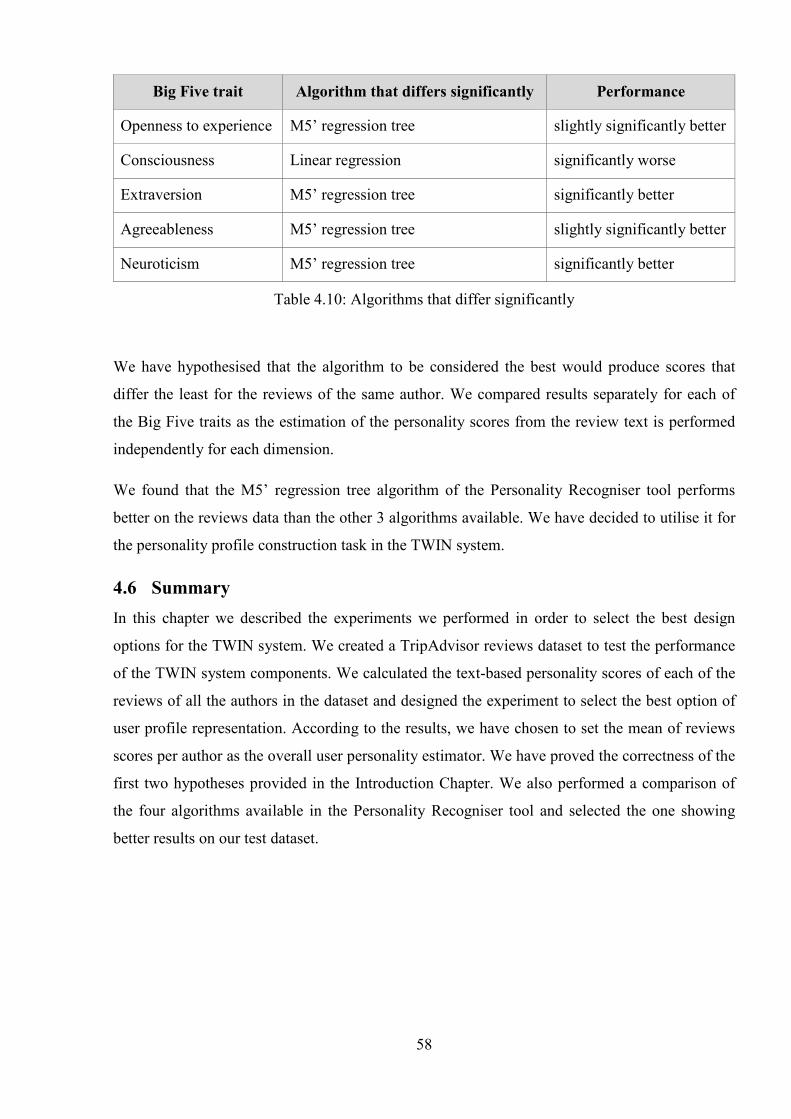
58
Big Five trait Algorithm that differs significantly Performance
Openness to experience M5’ regression tree slightly significantly better
Consciousness Linear regression significantly worse
Extraversion M5’ regression tree significantly better
Agreeableness M5’ regression tree slightly significantly better
Neuroticism M5’ regression tree significantly better
Table 4.10: Algorithms that differ significantly
We have hypothesised that the algorithm to be considered the best would produce scores that
differ the least for the reviews of the same author. We compared results separately for each of
the Big Five traits as the estimation of the personality scores from the review text is performed
independently for each dimension.
We found that the M5’ regression tree algorithm of the Personality Recogniser tool performs
better on the reviews data than the other 3 algorithms available. We have decided to utilise it for
the personality profile construction task in the TWIN system.
4.6 Summary
In this chapter we described the experiments we performed in order to select the best design
options for the TWIN system. We created a TripAdvisor reviews dataset to test the performance
of the TWIN system components. We calculated the text-based personality scores of each of the
reviews of all the authors in the dataset and designed the experiment to select the best option of
user profile representation. According to the results, we have chosen to set the mean of reviews
scores per author as the overall user personality estimator. We have proved the correctness of the
first two hypotheses provided in the Introduction Chapter. We also performed a comparison of
the four algorithms available in the Personality Recogniser tool and selected the one showing
better results on our test dataset.

59

60
Chapter 5: Evaluation
The effectiveness and usefulness of the TWIN system depends on the accuracy of the personality
match. The evaluation therefore requires a separate independent experiment to evaluate the
correctness of the estimation of the author’s personality. Two approaches can be considered
here: contacting people directly and asking them to fill in a questionnaire in order to establish
their actual personality scores (ideal situation) or (if this is not possible) trying to compare the
scores of different pieces of textual information produced by the same author.
In this Chapter we provide a description of the two approaches mentioned above. After
completing this task, we should be able to compute the performance of the personality
recognition algorithm. This would allow us to experiment with and compare other models apart
from the one implemented in the Personality Recogniser. As the main contribution of this work
is the constructed TWIN application, we provide in this Chapter the TWIN system evaluation
guidelines for future work as well as one of the first attempts in this direction.
5.1 Questionnaire-based evaluation
The first approach we could follow in order to evaluate the TWIN system is to consider the
actual personality scores and comparing them to the scores computed from the text. As
mentioned in Section 2.3, the standard approach taken by Personality-based RSs is the use of the
questionnaire. The TWIN system, built as a web-based application, includes a link to the
questionnaire page mentioned in Section 4.2.1 that has an instance of the Big Five Inventory
(John, 2008). Although the brevity of the questionnaire results in a lower accuracy than the
standard Big Five questionnaire NEO-PI-R (NEO-Personality Inventory-Revised) by McCrae
and Costa (1996) and contains only 44 questions, it has been successfully applied in many
research projects (some of which were mentioned in Chapter 2). It allows “efficient and flexible
assessment of the five dimensions” and is widely used in the personality from the text
recognition (Golbeck et al., 2011). The fragment of the web page with the questionnaire is
presented in Figure 5.1.

61
Figure 5.1: Big Five questionnaire web page
5.1.1 Obtaining personality data
We considered two approaches of obtaining the personality scores through the questionnaire:
constructing the sample of people who would like to take part in the experiment or using online
social media services to contact people.
Constructing the set of users
We could consider the traditional approach of creating a circle of volunteers (at least 35 people)
who could contribute between 5 and 13 pieces of textual information (with the preference of 7)
they had written and fill in the personality questionnaire. We have chosen 5-13 items in order to
have a similar number of textual pieces to analyse as in the constructed TripAdvisor dataset for
comparison reasons (5 was the minimum number of reviews per person and 13 was the mean
number of reviews). The chosen length of the review is the standard 250 words (which is also
close to 210.8 - the average number of words per review in the collected TripAdvisor dataset).
Using social media services
Social media services provide a convenient way of contacting a large number of people and
receiving a fast response. In particular the personality information could be extracted from
services such as TripAdvisor or Facebook by crawling the texts written by people or other
information such as age, location, etc.

62
In order to contact the authors of reviews from the TripAdvisor site, we constructed a small tool
to automatically send the request to complete the Big Five questionnaire from the web page
mentioned above. The program applies the Java API of the Selenium web browsers automation
tool38 to open the TripAdvisor user profile and send a message with the link and the description
of the TWIN project to the target user. We rejected this approach as the policy of the
TripAdvisor site does not allow us to send messages to its users with links to external web sites.
A lot of textual information are available on Facebook in the form of users’ comments and
discussions. As mentioned in Section 2.2.4, the personality user profile was constructed under
the “myPersonality Research” project containing the Big Five scores. This information could be
utilised in order to compare the scores calculated from the text of users’ comments with the
scores available from the “myPersonality” profile.
5.1.2 Convergence analysis
In order to evaluate the performance of the personality from the text recognition algorithm we
could use convergence analysis. It estimates how fast one value is approaching to the other, or
one distribution to another (Robu et al., 2009). In our case, it could be used to reflect the
dynamics of the personality estimation.
A similar task arises in the work of Robison et al. (2009), in which the authors predicted the
personality of people from their interaction with the constructed educational environment Crystal
Island based on three factors: situational attributes (location of the person, actions, etc.),
affective attributes (responses to virtual agents, frequency of emotions, etc.) and conversational
attributes (frequency and duration of communication with virtual agents). As each of the
participants is required to fill in the personality questionnaire before taking part in the
experiment, the real personality scores are known. The convergence analysis is applied to
estimate how fast the induced scores approach the real scores in real time.
For our purposes we could apply convergence analysis in order to track how fast the computation
of the personality values approaches the real scores gathered from the questionnaire. The
dimension of time could be introduced by adding one piece of text of the same author at each
step. Therefore we could compare the number of algorithms based on this evaluation procedure
measuring their speed and accuracy.
38 http://seleniumhq.org/

63
5.2 Text-based evaluation
For the second evaluation approach we assume that no actual personality values are known for
people whose pieces of text are analysed to construct user profiles. The performance of the
personality recognition algorithm could be estimated from the hypothesis that texts of the same
author should belong to the same cluster when performing clustering of all the available texts.
We have tested this approach on our TripAdvisor dataset, as described below.
5.2.1 TripAdvisor experiment
In order to evaluate the performance of the kNN algorithm that forms the basis of the Similarity
Estimator component (Roshchina et al., 2012), we have designed the following experiment.
We selected 26 people from the TripAdvisor dataset who have contributed more than 35 reviews.
We split the data into two parts: training and test sets. For the test set, we selected 5 reviews
from the list of reviews of each person in the training set (at the same time deleting those reviews
from the training set). We experimented with two types of training sets: with reviews’ scores per
person (821 instances) and with mean vectors of reviews’ scores per person (26 instances).
Figure 5.2: The percentage of correctly found reviews considering plain personality scores. Each
Y value represents a combination of the Big Five parameters (E – Extraversion,
A – Agreeableness, N – Neuroticism, C – Consciousness, O – Openness to Experience)
As we found that different traits of the Big Five have different levels of estimation complexity
(see Section 4.3), we experimented with all 31 combinations of the Big Five parameters to feed
the WEKA (Hall et al., 2009) kNN algorithm in order to select the combination that would

64
produce better results. The results are summarised in Figure 5.2 (training set with plain scores of
reviews per person) and Figure 5.3 (training set with mean scores of reviews per person).
Figure 5.3: The percentage of correctly found reviews considering mean personality scores
vectors per person as the training set.
It can be seen that results of the classification are not very optimistic, although similar results
were obtained by Mairesse (2007) for the regression classification task. He stated that “the
improvements seem relatively small” (over the baseline) explaining that the essence of the
regression algorithm requires “the association of an exact scalar value with each individual”. The
results we obtained can be considered promising taking into account the difficulty of the
personality from the text estimation on real-world data. One of the key points in personality
score calculation is the recognition of sentence and word boundaries which are not always
defined strictly in reviews dataset (missing punctuation marks, misspelled words, etc.). Thus, one
of the approaches to improve the results is to incorporate additional information available in the
TripAdvisor user profile, e.g. age, gender, location, etc., as well as the experimentation with the
personality from the text recognition algorithm itself. Therefore we cannot totally reject the
correctness of the Hypothesis 3 as the underlying personality calculation algorithm needs further
improvement.
It can be concluded that the kNN algorithm performs better when considering the mean vectors
of reviews’ scores that represent the overall personality of the author. Therefore it was
reasonable to select these mean vectors to be saved as the user profile information in the TWIN
system (see Section 4.3).

65
It can be seen that not all combinations of the Big Five parameters produce the same results.
Figure 5.3 shows that the combination “Extraversion-Neuroticism-Consciousness-Openness to
Experience” performs better than any other combination, with the combination of all the five
traits occupying second place. Therefore, in future work we could optimise the TWIN system
constructing the user profile considering only four dimensions of the Big Five.
Polarity of the reviews
In the experiment described above, we did not take the polarity of the reviews into account when
performing the kNN search. TripAdvisor allows its users to rate the hotel from 1 to 5 when
contributing the review. Reviews that give a negative assessment to the hotel intuitively would
contain more negative words, and this fact could influence the calculation of the specific
personality score (e.g., neuroticism). Additionally, the amount of negative and positive reviews
itself could provide some interesting insights in the type of the personality of the author.
We considered 3 classes of reviews: negative (hotel rating is less than 2), neutral (hotel rating of
3) and positive (hotel rating greater than 4). This data has been incorporated in the feature
vectors to perform the kNN algorithm. Figure 5.4 and Figure 5.5 show the results of the kNN
classification considering the polarity of the reviews.
Figure 5.4: The percentage of correctly found reviews considering the polarity of the reviews and
using plain personality scores as the training set.
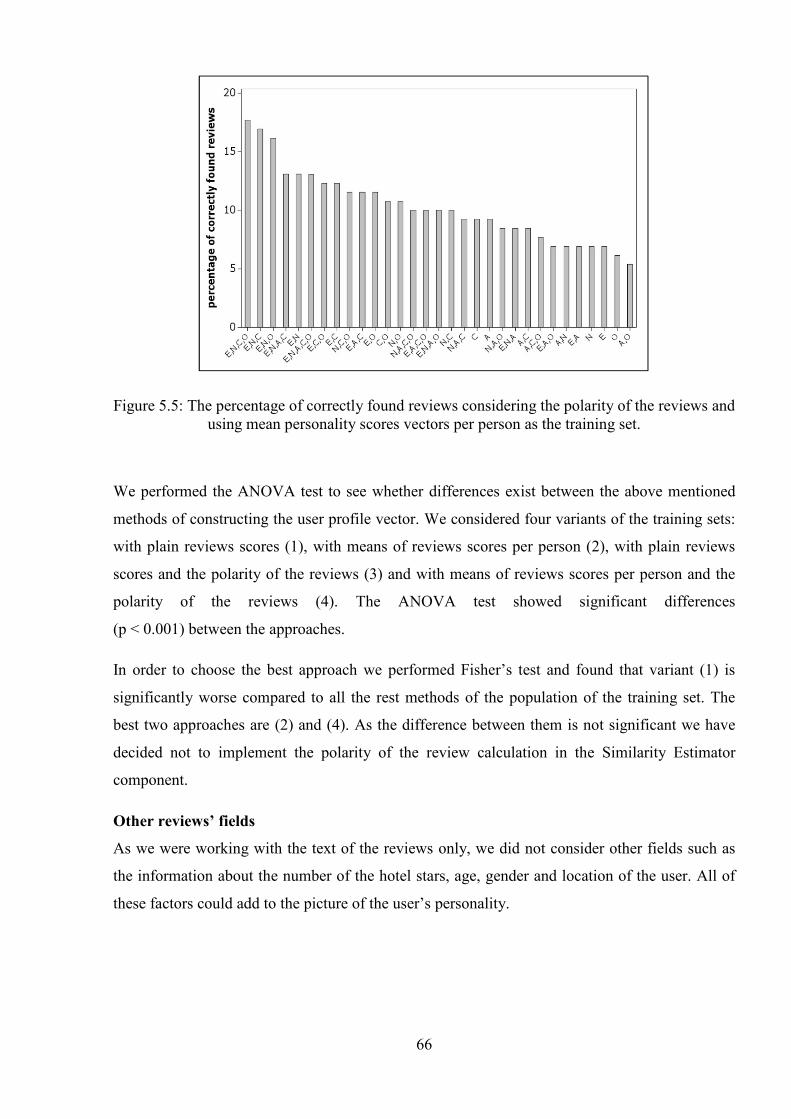
66
Figure 5.5: The percentage of correctly found reviews considering the polarity of the reviews and
using mean personality scores vectors per person as the training set.
We performed the ANOVA test to see whether differences exist between the above mentioned
methods of constructing the user profile vector. We considered four variants of the training sets:
with plain reviews scores (1), with means of reviews scores per person (2), with plain reviews
scores and the polarity of the reviews (3) and with means of reviews scores per person and the
polarity of the reviews (4). The ANOVA test showed significant differences
(p < 0.001) between the approaches.
In order to choose the best approach we performed Fisher’s test and found that variant (1) is
significantly worse compared to all the rest methods of the population of the training set. The
best two approaches are (2) and (4). As the difference between them is not significant we have
decided not to implement the polarity of the review calculation in the Similarity Estimator
component.
Other reviews’ fields
As we were working with the text of the reviews only, we did not consider other fields such as
the information about the number of the hotel stars, age, gender and location of the user. All of
these factors could add to the picture of the user’s personality.

67
5.3 Summary
In this chapter we have described the possible ways of the TWIN system evaluation. We have
discussed the two alternative approaches we could follow: text-based and questionnaire-based.
The Questionnaire-based approach requires constructing the circle of people who would be able
to fill in the Big Five questionnaire in order to compare the real personality scores to the scores
calculated from the text provided by the volunteers. We mentioned that the comparison could be
made by means of the convergence analysis to reflect the dynamics of the personality estimation.
Following the text-based approach we experimented with the WEKA kNN algorithm
implementation to estimate the performance of the Similarity Estimator component. We found
that taking into account various combinations of Big Five traits scores produces different
percentage of correctly found reviews per person. The combination of Extraversion,
Neuroticism, Consciousness and Openness to Experience gives the largest percentage followed
by the combination of all five traits. The overall results could not be considered very satisfactory
but they are still promising and are mostly in line with the previous research. We have suggested
a number of improvements to the current algorithm (considering the polarity of the reviews,
etc.).
The results of the evaluation procedures do not show the correctness of the Hypothesis 3 but they
do not either give sufficient evidence to reject it. It can be concluded that the suggested
improvements to the current personality estimation algorithm could provide more support to the
Hypothesis 3.

68

69
Chapter 6: Conclusions and further work
In this research we have developed, presented, and conducted experiments on the TWIN
Personality-based Recommender System. We have investigated the challenging task of the
personality from the text estimation and applied it to the TWIN Recommender System in the
online travelling domain.
The main issues addressed in this work are:
1. The study of the methods and algorithms for the Recommender System construction
2. The study of the tools and techniques for personality from the text recognition
3. The collection of a TripAdvisor reviews dataset
4. The construction of the TWIN system user profile
5. The building of the Apache Tomcat-based TWIN Server
6. The development of the Flash user interface for the TWIN system
7. The implementation of the TWIN system in the online travelling domain
In order to validate the methods forming the base of the TWIN system we have performed a
number of experiments. We constructed a TripAdvisor dataset consisting of 14,000 reviews
written by 1,030 people. We calculated the personality scores using the Personality Recogniser
tool. We have processed the results and calculated the main statistics (minimum, maximum,
mean and standard deviation) for each of the Big Five traits (Extraversion, Agreeableness,
Consciousness, Neuroticism and Openness to experience). For each dimension the distribution of
the resulting scores has appeared to be normal.
One of the major tasks of the Recommender System construction is the development of the user
profile. In order to find the appropriate structure for the profile we chose 15 people from the
TripAdvisor dataset who contributed more than 35 reviews. We performed the ANOVA test to
see whether the personality scores pattern varies sufficiently from one person to another. As the
answer was positive we decided to use the mean score of all the reviews (for each of the Big Five
parameters) written by the particular person as the estimator of his personality. The experiment
allowed us to accept the correctness of the Hypothesis 1 and the Hypothesis 2.

70
The Personality Recogniser tool has 4 algorithms (Linear regression, M5’ model tree, M5’
regression tree and SVM) and we have utilised the same set of reviews as in the previous
experiment to compare the performance of each of them. The hypothesis we considered is that
the algorithm producing scores that differ the least for the reviews of the same author will be the
best to apply for the personality recognition task in the TWIN system. We applied the ANOVA
test and the Fisher’s LSD test to conclude that M5’ regression tree performs sufficiently better
for the 4 of Big Five parameters. Therefore we have chosen it as the main personality from the
text estimation algorithm for the TWIN system.
This experiment was held in order to evaluate the Similarity Estimator – the main component of
the TWIN system that provides the Recommender System functionality. We were focusing on
the scores of each individual review here. With the 26 people chosen, we found that the
percentage of the correctly identified reviews was 10% on average. Considering the difficulty of
the task of the personality from the text recognition and especially the fact that the research was
based on the real world data from the TripAdvisor, we concluded that the results are satisfactory.
The results of the experiment do not provide sufficient support to the Hypothesis 3 and the
modification of the personality estimation algorithm is needed in order to prove the correctness
of the Hypothesis 3.
The TWIN system was developed as a client-server application and applied in the online
travelling domain. Its functionality was used to provide recommendations of hotels to the
TripAdvisor website users with similar personality types. The estimation of the personality was
based on the texts of the TripAdvisor reviews crawled and analysed for each of the TWIN
system users.
6.1 Major contributions
The major contributions of this research work are as follows:
1. The application of the automatic personality from the text recognition methods to the
construction of the user profile of the Personality-based Recommender System.
In this thesis we have made an attempt to create a bridge between the personality of the
person estimated from the text and personalities of other people implemented as a
Recommender System. One of the main features of the resulting Personality-based RS is
the absence of the need to fill in the questionnaire that is a time consuming step.
2. Generating TripAdvisor reviews datasets and experimenting with them.
The Java crawler was constructed to collect 14,000 reviews written by 1,030 people. We
have discussed a number of experiments that were performed over the subset of the

71
above mentioned dataset in order to develop the TWIN system. Among the outcomes of
the experiments is the conclusion that Openness to experience trait is the easiest to detect
while Consciousness trait is the hardest to model.
3. The development of the TWIN system
We have provided the detailed description of the Recommender System that was
proposed in this thesis, including the Server and Client parts of the application.
6.2 Further work
There are a number of experiments that could be performed in future research that we would
consider to be of great interest. The following tasks are the list of the issues left for the future
work:
1. Convergence analysis of the reviews’ personality scores estimated from the text and from
the Big Five questionnaire filled in by the corresponding author.
In order to evaluate the performance of the currently implemented algorithm of the
Similarity Estimation component we are planning to perform the convergence analysis
that will show how fast the real personality scores are approaching the scores that are
estimated from the text. That would give us the tool of comparing the performance of the
current implementation of the Similarity Estimator and the other algorithms that we plan
to evaluate.
2. The development of the improved algorithm for the personality from the text recognition.
As the algorithm implemented in the Personality Recogniser did not show the desired
results, one of the tasks for the future work is its improvement (e.g. considering other
fields of TripAdvisor reviews and different linguistic cues apart from those stored in
LIWC and MRC dictionaries, etc.).
3. The improvement of the user interface according to the usability recommendations.
This step will involve changes in the user graphical interface of the Client: the
implementation of the more efficient and optimised algorithm for the construction of the
circle of nearest neighbors in the Similarity Estimator component (decreasing the
response time of the recommendations calculation step), providing a more intuitive
visualization of the personality in the user profile window, etc.

72
73
Bibliography
Agichtein E., Hearst M.A, Soboroff I. (2009). The Search and Social Media Workshop at
SIGIR 2009 First Session: Online Communities and Recommender Systems.
Alag, S. (2009). Collective Intelligence in Action, Greenwich, CT: Manning Publications,
p.365.
Almazro, D. et al., 2010. A Survey Paper on Recommender Systems. Arxiv preprint arXiv,
abs/1006.5, p.129-15.
Al-Sharawneh J., Williams M.-A. (2010). Credibility-aware Web-based Social Network
Recommender: Follow the Leader. In: RSWEB’10, Barcelona, p.1-8.
Altmann, G. (2006). History of Psycholinguistics. Cognitive Neuropsychology, p.1-9.
Berners-Lee, T., Hendler, J. & Lassila, O. (2001). The Semantic Web. Scientific American,
284(5), p.34-43.
Bodapati, A.V. (2008). Recommendation Systems with Purchase Data. Journal of Marketing
Research, 45(1), p.77-93.
Bogers T., Van Den Bosch A. 2009. Collaborative and Content-based Filtering for Item
Recommendation on Social Bookmarking Websites. ACM RecSys ’09 Workshop on
Recommender Systems and the Social Web, p.9-16.
Brockmann, C. (2009). Personality and Alignment Processes in Dialogue: Towards a
Lexically-Based Unified Model. Ph. D. thesis. University of Edinburgh, UK.
Cantador I., Bellogin A., Vallet D. 2010. Content-based Recommendation in Social Tagging
Systems. Proc. of the 4th ACM Conference on Recommender Systems, RecSys 2010,
p.237-240.
74
Cantador, I. (2008). Exploiting the Conceptual Space in Hybrid Recommender Systems: a
Semantic-based Approach. Ph. D. thesis, Universidad Autónoma de Madrid (UAM),
Madrid, Spain.
Celli, F. (2012). Unsupervised Personality Recognition for Social Network Sites.
In Proceedings of ICDS, Valencia, p. 59-62.
Coltheart, M., 1981. The MRC Psycholinguistic Database. Quarterly Journal of
Experimental Psychology, 33A(4), p.497-505.
Diederich J., Iofciu T. (2006). Finding Communities of Practice from User Profiles Based On
Folksonomies. Practice, p.288-297.
Dyer, J.S., Sarin, R.K. (1979). Measurable Multiattribute Value Functions. Operations
Research, 27(4), p.810-822.
Fleischman M., Hovy E. H.: Recommendations without user preferences: a natural language
processing approach. IUI 2003, p. 242-244.
Gedikli F., Jannach D. (2010). Rating items by rating tags. In: RSWEB’10, Barcelona,
p. 25–32.
Gemmell, J. et al., 2008. Improving FolkRank With Item-Based Collaborative
Filtering. RecSys09, p.17-24.
Ghosh R, Dekhil M. (2008). Mashups for semantic user profiles. Proceeding of the 17th
international conference on World Wide Web 08, p.12-29.
Golbeck J., Robles C., Turner K. (2011). Predicting personality with social media. In CHI
Extended Abstracts, p. 253-262.
Gonzalez G., de la Rosa J. L., Montaner M. (2007). Embedding Emotional Context in
Recommender Systems. In the 20th International Florida Artificial Intelligence Research
Society Conference-FLAIRS, Key West, Florida.
Gribova V (2007). A Method of Estimating Usability of a User Interface Based on its Model.
International Journal of Information Theories & Applications, 14, p. 43-47.
Hall M. et al. (2009). The WEKA Data Mining Software: An Update. SIGKDD Explorations,
11(1), p.10-18.
Heckmann D. (2005). Ubiquitous User Modeling. IOS Press.

75
Hu R. (2010). Design and User Issues in Personality-based Recommender
Systems. Perception, 36(3), p.357-360.
Hu R., Pu P. (2009). Acceptance issues of personality-based recommender systems.
Proceedings of the third ACM conference on Recommender systems RecSys 09, p.221.
Hu R., Pu P. (2010). A Study on User Perception of Personality-Based Recommender
Systems. In: P. De Bra, A. Kobsa, and D. Chin (Eds.): UMAP 2010, LNCS 6075, pp. 291-
302.
Islam, M.J. et al. (2007). Investigating the Performance of Naive- Bayes Classifiers and K-
Nearest Neighbor Classifiers. International Conference on Convergence Information
Technology ICCIT 2007, p.1541-1546.
John O. P., Naumann L. P., Soto C. J. (2008). Paradigm shift to the integrative Big Five trait
taxonomy: History, measurement, and conceptual issues. Handbook of personality: Theory
and research. New York, NY: Guilford Press, p. 114-158.
John, O.P., Donahue, E.M. & Kentle, R.L. (1991). The Big Five Inventory - Versions 4a and
54, University of California, Berkeley, Institute of Personality and Social Research.
Jones L.V., Thissen, D. (2007). A History and Overview of Psychometrics. In C. R. Rao & S.
Sinharay, eds. Handbook of Statistics. North Holland, p.1-27.
Kotsiantis S.B. 2007. Supervised Machine Learning: A Review of Classification
Techniques. Informatica, 31(3), p.249-268.
Kucera and Francis, W. N. (1967). Computational Analysis of Present-Day American
English. Providence: Brown University Press.
Leventhal L.M., Barnes J.A. (2010). Usability engineering: process, products, and examples,
Prentice Hall.
Mairesse F., Walker M. A., Mehl M., Moore R. (2007).Using Linguistic Cues for the
Automatic Recognition of Personality in Conversation and Text. Journal of Artificial
Intelligence Research, p. 457-500.
Marmanis H., Babenko D. (2009). Algorithms of the intelligent web. US: Manning
Publications.

76
Masthoff J., Gatt A. (2006). In pursuit of satisfaction and the prevention of embarrassment:
effective state in group recommender systems. User Modeling and User-AdaptedInteraction
16, 3-4, 281-319.
Mathes, A. 2004. Folksonomies - Cooperative Classification and Communication Through
Shared Metadata The Creation of Metadata. Communication, p.1-19.
Matthews G., Deary I. J., Whiteman M. C. (2009). Personality Traits. Cambridge, UK:
Cambridge University Press, p.23-26.
McCrae R. R., Costa P. (1996). Toward a new generation of personality theories: Theoretical
contexts for the five-factor model. The Fivefactor Model of Personality. New York, US: The
Guildford Press, p. 51-87.
Meloun M., Militky J. (2011). Statistical data analysis: A practical guide. India: Woodhead
Publishing, p. 40-423.
Mika P. (2004). Social Networks and the Semantic Web. Springer Science+Business Media,
LLC.
Minamikawa, A., Yokoyama, H. (2011). Blog tells what kind of personality you have, ACM
Press, p. 271-220.
Morizot J., Ainsworth A.T., Reise S.P. (2007). Chapter 24: Toward modern psychometrics.
In Handbook of research methods in personality psychology. The Guilford Press, p.407-423.
Mukherjee R., Jonsdottir G., Sen S., Sarathi P. (2001). MOVIES2GO: an Online Voting
based Movie Recommender System. Proceedings of the Fifth International Conference on
Autonomous Agents, ACM Pres, p. 114–115.
Mulyanegara, R.C., Tsarenko, Y., Anderson, A. (2007). The Big Five and brand personality:
Investigating the impact of consumer personality on preferences towards particular brand
personality. Journal of Brand Management, 16(4), p.234-247.
Nageswara Rao, K., Talwar, V.G. (2008). Application domain and functional classification
of recommender systems a survey. DESIDOC Journal of Library Information Technology,
28(3), p.17-35.
Nunes, M.A.S.N. (2008). Recommender Systems based on Personality Traits. Thèse de
Doctorat en Informatique. Université Montpellier 2.

77
Nunes, M.A.S.N. (2010). Towards to Psychological-based Recommenders Systems: A
survey on Recommender Systems. Scientia Plena, 6(8), p.1-28.
O’Connor, P. (2010). Managing a Hotel’s Image on TripAdvisor. Journal of Hospitality
Marketing Management, 19(7), p.754-772.
Oberlander, J., Nowson, S. (2006). Whose thumb is it anyway? Classifying author
personality from weblog text. Computational Linguistics, (July), p.627-634.
Oliveira, A. (2007). A Discussion of Rational and Psychological Decision-Making Theories
and Models: The Search for a Cultural-Ethical Decision-Making Model. Journal of Business
Ethics, 12(2), p.12-17.
Olsson T. (2003). Bootstrapping and Decentralizing Recommender Systems.
Park D.H., Kim H.K., Kim J.K., 2011. A Review and Classification of Recommender
Systems Research. Social Science, 5, p.290-294.
Pennebaker J. W., King L. A. (1999). Linguistic styles: Language use as an individual
difference. Journal of Personality and Social Psychology, 77, p.1296–1312.
Pu P., Faltings B., Chen L., Zhang J., Viappiani P. (2011). Usability Guidelines for Product
Recommenders Based on Example Critiquing Research. Recommender Systems Handbook.
US: Springer, p. 511-545.
Quercia D., Kosinski M., Stillwell D., Crowcroft J. (2011). Our Twitter Profiles, Our
Selves: Predicting Personality with Twitter. Paper presented at the Third IEEE International
Conference on Social Computing (SocialCom2011), Boston, USA.
Rentfrow P. J., Gosling S. D. (2003). The do re mi’s of everyday life: The Structure and
Personality Correlates of Music Preferences. Journal of Personality and Social Psychology,
84, p.1236—1256.
Ricci F. (2010). Mobile Recommender Systems. Area, 12(3), p.1-24.
Ricci F., Rikach L., Shapira B., Kantor P. (2010). Recommender Systems Handbook. US:
Springer. p. 62.
Robison, J.L., Rowe J., McQuiggan S., Lester J. (2009). Predicting User Psychological
Characteristics from Interactions with Empathetic Virtual Agents. In Proceedings of the
Ninth International Conference on Intelligent Virtual Agents. Springer, p. 330–336.
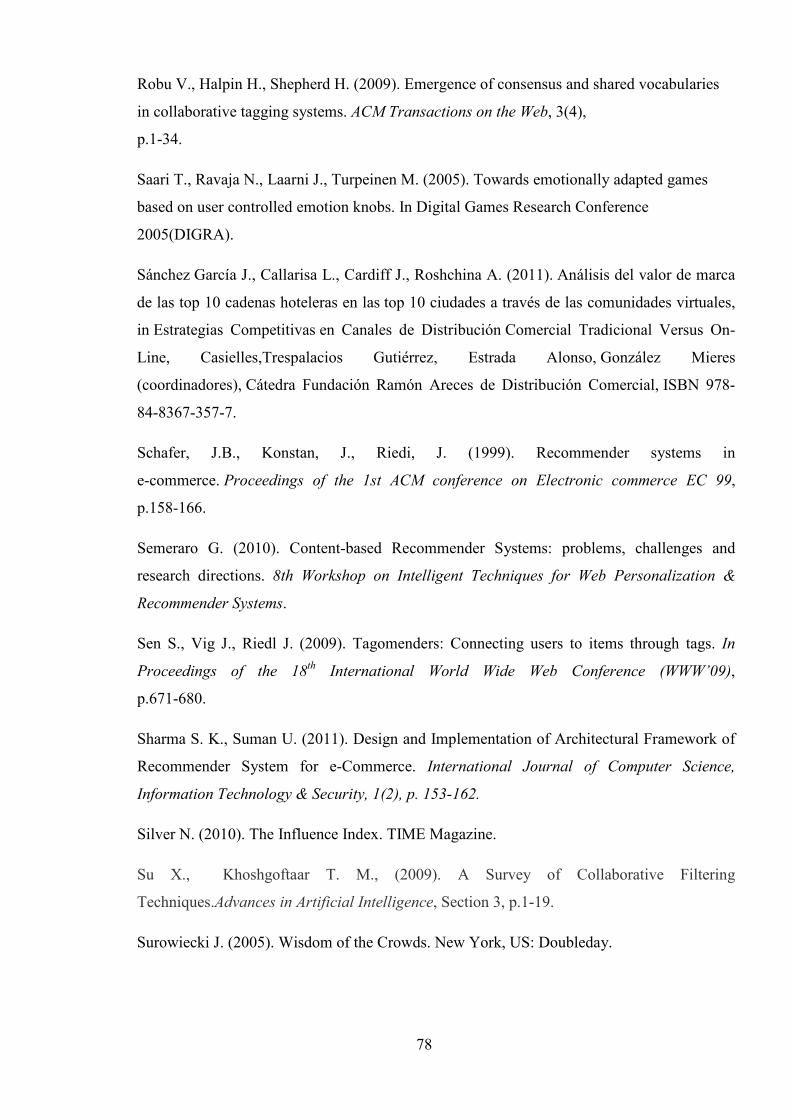
78
Robu V., Halpin H., Shepherd H. (2009). Emergence of consensus and shared vocabularies
in collaborative tagging systems. ACM Transactions on the Web, 3(4),
p.1-34.
Saari T., Ravaja N., Laarni J., Turpeinen M. (2005). Towards emotionally adapted games
based on user controlled emotion knobs. In Digital Games Research Conference
2005(DIGRA).
Sánchez García J., Callarisa L., Cardiff J., Roshchina A. (2011). Análisis del valor de marca
de las top 10 cadenas hoteleras en las top 10 ciudades a través de las comunidades virtuales,
in Estrategias Competitivas en Canales de Distribución Comercial Tradicional Versus On-
Line, Casielles,Trespalacios Gutiérrez, Estrada Alonso, González Mieres
(coordinadores), Cátedra Fundación Ramón Areces de Distribución Comercial, ISBN 978-
84-8367-357-7.
Schafer, J.B., Konstan, J., Riedi, J. (1999). Recommender systems in
e-commerce. Proceedings of the 1st ACM conference on Electronic commerce EC 99,
p.158-166.
Semeraro G. (2010). Content-based Recommender Systems: problems, challenges and
research directions. 8th Workshop on Intelligent Techniques for Web Personalization &
Recommender Systems.
Sen S., Vig J., Riedl J. (2009). Tagomenders: Connecting users to items through tags. In
Proceedings of the 18th International World Wide Web Conference (WWW’09),
p.671-680.
Sharma S. K., Suman U. (2011). Design and Implementation of Architectural Framework of
Recommender System for e-Commerce. International Journal of Computer Science,
Information Technology & Security, 1(2), p. 153-162.
Silver N. (2010). The Influence Index. TIME Magazine.
Su X., Khoshgoftaar T. M., (2009). A Survey of Collaborative Filtering
Techniques.Advances in Artificial Intelligence, Section 3, p.1-19.
Surowiecki J. (2005). Wisdom of the Crowds. New York, US: Doubleday.
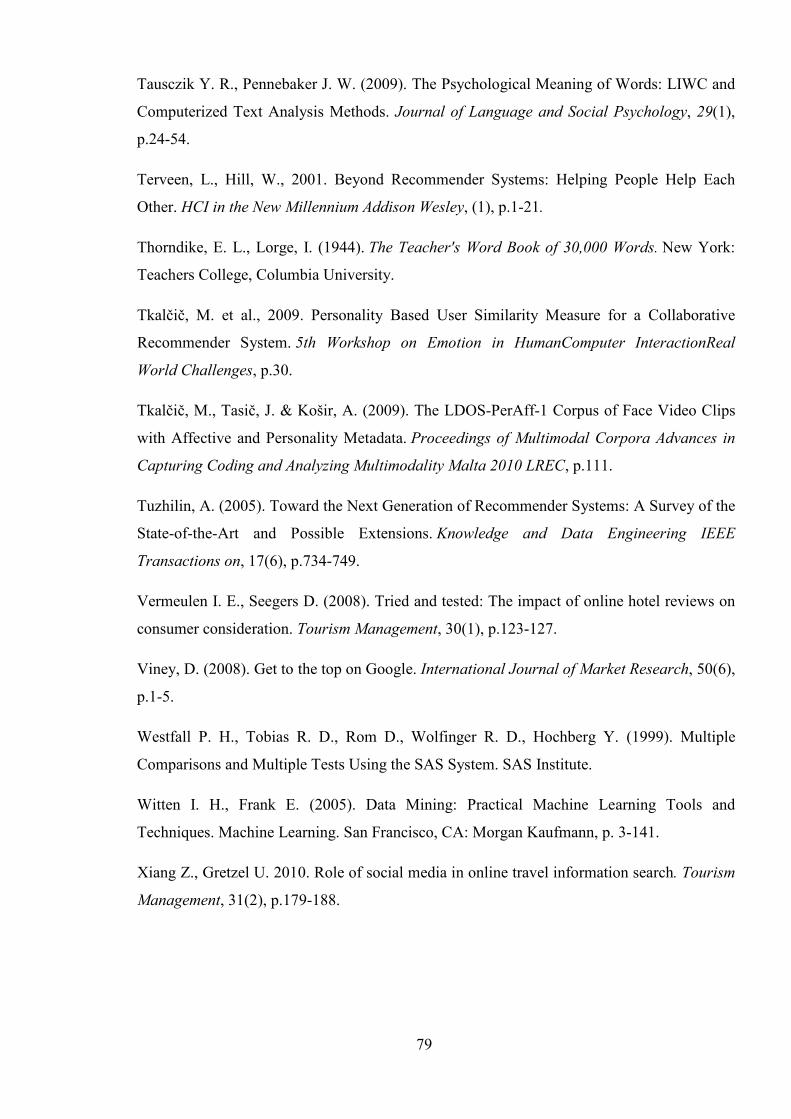
79
Tausczik Y. R., Pennebaker J. W. (2009). The Psychological Meaning of Words: LIWC and
Computerized Text Analysis Methods. Journal of Language and Social Psychology, 29(1),
p.24-54.
Terveen, L., Hill, W., 2001. Beyond Recommender Systems: Helping People Help Each
Other. HCI in the New Millennium Addison Wesley, (1), p.1-21.
Thorndike, E. L., Lorge, I. (1944). The Teacher's Word Book of 30,000 Words. New York:
Teachers College, Columbia University.
Tkalčič, M. et al., 2009. Personality Based User Similarity Measure for a Collaborative
Recommender System. 5th Workshop on Emotion in HumanComputer InteractionReal
World Challenges, p.30.
Tkalčič, M., Tasič, J. & Košir, A. (2009). The LDOS-PerAff-1 Corpus of Face Video Clips
with Affective and Personality Metadata. Proceedings of Multimodal Corpora Advances in
Capturing Coding and Analyzing Multimodality Malta 2010 LREC, p.111.
Tuzhilin, A. (2005). Toward the Next Generation of Recommender Systems: A Survey of the
State-of-the-Art and Possible Extensions. Knowledge and Data Engineering IEEE
Transactions on, 17(6), p.734-749.
Vermeulen I. E., Seegers D. (2008). Tried and tested: The impact of online hotel reviews on
consumer consideration. Tourism Management, 30(1), p.123-127.
Viney, D. (2008). Get to the top on Google. International Journal of Market Research, 50(6),
p.1-5.
Westfall P. H., Tobias R. D., Rom D., Wolfinger R. D., Hochberg Y. (1999). Multiple
Comparisons and Multiple Tests Using the SAS System. SAS Institute.
Witten I. H., Frank E. (2005). Data Mining: Practical Machine Learning Tools and
Techniques. Machine Learning. San Francisco, CA: Morgan Kaufmann, p. 3-141.
Xiang Z., Gretzel U. 2010. Role of social media in online travel information search. Tourism
Management, 31(2), p.179-188.

80

Appendix A: Detailed representation of the TWIN user profile ontology
81
Figure A.1: TWIN
user profile ontology

Appendix B: TWIN system implementation
78
B.1 TWIN system development
During the process of application development we have built a JSP-based website39 with the
summary of the TWIN system description. The main page of the website is represented on
Figure B.2.
Figure B.2: TWIN system website
The structural components of the TWIN system are shown on Figure B.3. The TWIN system is
built as a client-server web application. The Server part is written in Java under the Apache
Tomcat server40 and utilises the MySQL
41 database for data storage. The Client part utilises the
Flash technology and is written in ActionScript342.
39 http://twin-persona.org
40 http://tomcat.apache.org
41 http://www.mysql.com
42 http://www.adobe.com/devnet/actionscript.html

83
Figure B.3: TWIN system: main structural components
B.2 Architecture of the TWIN application
The detailed representation of the contents of the implemented Client and Server parts of the
TWIN system are shown on Figure B.4.
Figure B.4: TWIN system: structure of the Client and Server components
84
The communication between the parts is performed via http. The main functionality of the
application is realised on the Server and is available to the Client through the twin.jsp web page.
The page provides an interface to save the new user data, to get hotels recommendations, get the
user RDF profile description and a number of additional functions (such as caching the latitude
and longitude returned by the Google Maps flash API, etc.).
Figure B.5 shows the structure of the classes of the Client graphical user interface. The
ClientGUI.MainWindow class is the entry point and it includes all the main functionality. It
loads the rest of the windows on request.
Figure B.5: Client. ClientGUI package contents
The other GUI windows are inherited from the ClientGUI.PopupWindow class which sets the
dimensions of the window, adds the closing button and the drag&drop effects.
ClientGUI.UserNameWindow is the first window that the user is presented with. It simply
requests the existing TripAdvisor name from the individual and sends it to the Server in order to
crawl the reviews from the TripAdvisor user profile. ClientGUI.ErrorWindow displays the errors
85
that could occur in the process of connecting to the server, opening the database connection,
reviews crawling, personality calculation, etc. ClientGUI.RDFWindow shows the user profile
data exported in the RDF format following the TWIN user profile ontology mentioned above.
ClientGUI.UserProfileWindow shows the main representation of the calculated personality and
will be discussed in details in the following Section. ClientGUI.Tooltip and
ClientGUI.LoadingScreen are additional classes utilised to provide broader descriptions of the
Big Five traits and to indicate the loading process accordingly.
ClientGUI.MainWindow communicates with the Server via the
ClientNetwork.ServerConnection class shown on Figure B.6 and stores the response in the
serverResponse variable. The response in the String format is further parsed and its components
are passed to the appropriate handlers.
Figure B.6: Client. ClientNetwork package contents
The Server utilises Client (see Figure B.7) and User (see Figure B.8) packages to process the
data sent by the Client application. It stores the main user parameters (name, review information
and Big Five personality scores) in the database. It calculates the recommendations of the hotels

86
applying the kNN algorithm to the users’ personality vectors. Additionally the Server performs
the conversion of the user data to RDF format in User.UserProfileManager class.
Figure B.7: Client package of the Server
Figure B.8: User package of the Server

87
In order to crawl and process (calculate the personality scores) the reviews of the user the
ReviewsManager package is used (see Figure B.9). It utilises the PersonalityRecogniser classes
and the ReviewsManager.TripAdvisorReviewsCrawler. The retrieval and the processing of the
TripAdvisor HTML pages are performed through the Java API of the Selenium web browsers
automation tool by means of XPath language43. This class saves the text of the review with the
information about the hotel (name, address, region, country and city).
Figure B.9: ReviewsManager package of the Server
The results of the recommendation procedure (kNN LinearSearch among other user profiles) are
sent to the Client and visualised on the Google Map. The contents of the Client GoogleMapGUI
package are shown on Figure B.10.
43 http://www.w3.org/TR/xpath/

88
Figure B.10: GoogleMapGUI package of the Client
B.3 Data structures
All information required for the TWIN system is stored in three MySQL tables: “twin_users”,
“twin_reviews” and “twin_hotels”. The user profile information is saved in the “twin_users”
table that has the structure shown in Figure B.11. Reviews of each of the people are saved in the
“twin_reviews” table that has a structure shown in Figure B.12. Each review has the author, the
url, the text of the review itself, the values of the Big Five scores and the information about the
hotel (region, country, city and hotel_id). The structure of the “twin_hotels” table is shown in
Figure B.13 including the name of the hotel, its address, its latitude and longitude (the last fields
are used to visualise the hotel on the GoogleMap).
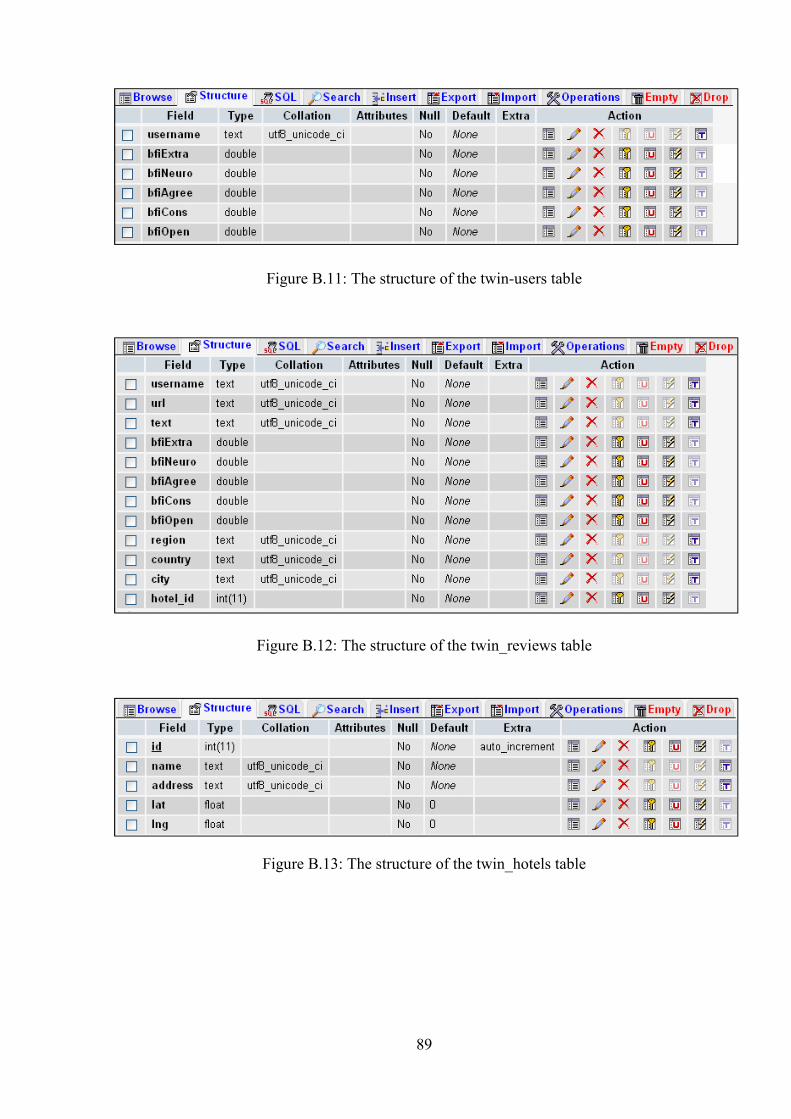
89
Figure B.11: The structure of the twin-users table
Figure B.12: The structure of the twin_reviews table
Figure B.13: The structure of the twin_hotels table

90
B.4 Graphical user interface of the TWIN application
This Section provides the screenshots and the descriptions of the windows of the graphical user
interface.
The first screen that the user is presented with is a Log in window that requires the existing
TripAdvisor user name to start the process of calculating recommendations (see Figure B.14).
Figure B.14: Logging in into TWIN
Figure B.15 shows the loading screen and a semi-transparent error window that appears
whenever the Server experiences a problem with the connection to the database or any other
error happens.
Figure B.15: The semi-transparent error window and the loading screen beneath
The visual representation of the main window with all the interface elements is shown on
Figure B.16. The name of the current user is displayed in the top left corner of the window with
the Log out button. The navigation buttons (“View profile” and “Please, fill in the
questionnaire”) are in the right top corner. The questionnaire link leads to the webpage with the
Big Five inventory.
In the middle of the main window there is the ClientGUI.DestinationWindow which allows the
user to choose the destination country and city to search for the hotel. Currently there are 3,000
test profiles loaded into the system. Therefore, the number of countries and cities available for
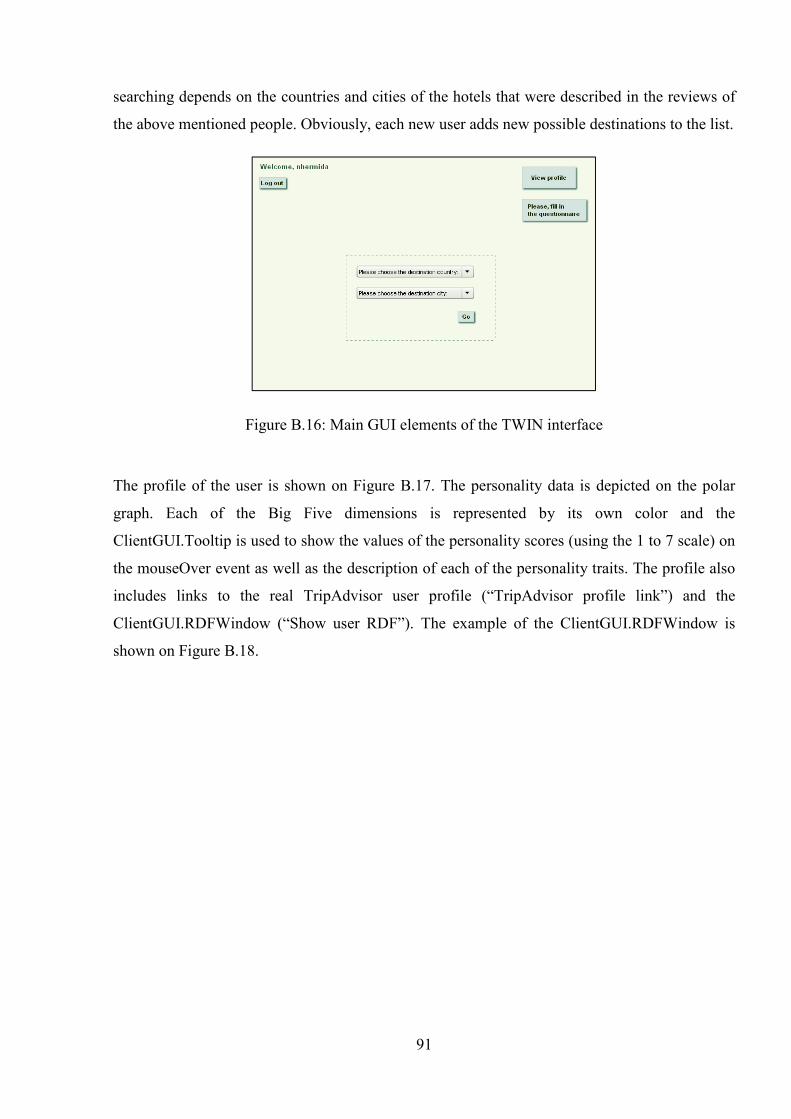
91
searching depends on the countries and cities of the hotels that were described in the reviews of
the above mentioned people. Obviously, each new user adds new possible destinations to the list.
Figure B.16: Main GUI elements of the TWIN interface
The profile of the user is shown on Figure B.17. The personality data is depicted on the polar
graph. Each of the Big Five dimensions is represented by its own color and the
ClientGUI.Tooltip is used to show the values of the personality scores (using the 1 to 7 scale) on
the mouseOver event as well as the description of each of the personality traits. The profile also
includes links to the real TripAdvisor user profile (“TripAdvisor profile link”) and the
ClientGUI.RDFWindow (“Show user RDF”). The example of the ClientGUI.RDFWindow is
shown on Figure B.18.

92
Figure B.17: TWIN user profile window
Figure B.18: RDF representation of the user profile data

93
The results of the recommendation algorithm are visualised and each found hotel is represented
as the marker on the Google Map based on the address of the hotel. The address is saved during
the reviews crawling stage and the latitude and longitude are requested via the Google
Geocoding service44. The window with the search results is shown on Figure B.19. For each of
the found hotels the name of the hotel, its address and the list of users’ reviews (with the link to
the user profile and the link to the review on the TripAdvisor website) are displayed.
Figure B.19: Results of the recommendation on the Google Map
B.5 Summary
In this chapter we have provided the detailed description of the TWIN system components: the
Server (written in Java) and the Client (Flash-based GUI). We gave the link to the deployed
TWIN system that is currently available online in demo mode.
44 http://code.google.com/apis/maps/documentation/flash/services.html#Geocoding

94
We described in detail the contents of the Java and ActionScript packages of the Server and the
Client and the relationships between constructed classes. We have shown the structure of the
MySQL tables that contain the data required for the application to work.
In the last Section we have provided the overview of the graphical interface with the screenshots
of the deployed TWIN application: log in window to provide a TripAdvisor username, main
interface window with the selection of available destinations, user profile window with the
visualization of the user personality data (Big Five traits with corresponding scores), RDF user
data window showing the RDF representation of the information about the user and the results
window with the sample recommendation result set.