twitter sentiment analysis using natural language toolkit ...the field of sentiment analysis,...
TRANSCRIPT

Abstract— The sentiment analysis of Twitter data has gained
much attention as a topic of research. The ability to obtain
information about a public opinion by analyzing Twitter data
and automatically classifying their sentiment polarity has
attracted researchers because of the concise language used in
tweets. In this study, we aimed to use the Valence Aware
Dictionary for sEntiment Reasoner (VADER) to classify the
sentiments expressed in Twitter data. However, because most
previous studies were oriented to binary classification, in this
study, we propose a multi-classification system for analyzing
tweets. We used VADER to classify tweets related to the 2016
US election. The results showed good accuracy in detecting
ternary and multiple classes.
Index Terms— Natural Language Toolkit (NLTK), Twitter,
sentiment analysis, Valence Aware Dictionary and sEntiment
Reasoner (VADER)
I. INTRODUCTION
OCIAL media technologies exist in several different
forms, such as blogs, business networks, photo sharing,
forums, microblogs, enterprise social networks, video
sharing networks, and social networks. As the number of
social media technologies has increased, various online
social networking services, such as Facebook, YouTube,
and Twitter, have become popular because they allow
people to express and share their thoughts and opinions
about life events.
These networks enable users to have discussions with
different people across the world and to post messages in the
forms of texts, images, and videos [1], [2]. Moreover, social
media are enormous sources of information for companies
to monitor the public opinion and receiving polls about the
products they manufacture. Microblogging services have
become the best known and the most commonly used
platforms. Furthermore, they have evolved to become
significant sources of different types of information [3].
Twitter is a popular microblogging service that allows users
to share, deliver, and interpret real-time, short, and simple
Manuscript received December 17, 2018; revised January 08, 2019.
This work was supported by National Natural Science Foundation
of China (Nos. 61672179, 61370083, 61402126), Heilongjiang Province Na
tural Science Foundation of China (No. F2015030), Science Fund for Yout
hs in Heilongjiang Province (No. QC2016083) and Postdoctoral Fellowship
in Heilongjiang Province (No. LBHZ14071).
Shihab Elbagir is now with the College of Computer Science and
Technology, Harbin Engineering University, Heilongjiang, 150001, China
(corresponding author phone: 187-046-00712; e-mail: shihabsaad@
yahoo.com). He was with Faculty of Computer Science and Information
Technology, Shendi University, Shendi, Sudan
Jing Yang is with College of Computer Science and Technology, Harbin
Engineering University, Heilongjiang, 150001, China (e-mail:
messages called tweets [4]. Therefore, Twitter provides a
rich source of data that are used in the fields of opinion
mining and sentiment analysis. Recently, the sentiment
analysis of Twitter data has attracted the attention of
researchers in these fields. However, most state-of-the-art
studies have used sentiment analysis to extract and classify
information about the opinions expressed on Twitter
concerning several topics, such as predictions, reviews,
elections, and marketing.
Currently, many tools, such as Linguistic Inquiry and
Word Count (LIWC) [5], offer the means of extracting
advanced features from texts. However, most of these tools
require some programming knowledge. In the present work,
the Valence Aware Dictionary and sEntiment Reasoner
(VADER) [6] is used to determine the polarity of tweets and
to classify them according to multiclass sentiment analysis.
The remainder of this paper is structured as follows: section
2 provides a brief description of related studies in the
literature. In section 3, we present in detail the proposed
method, and we describe the tool used in this study. In
section 4, we discuss the results. In section 5, we conclude
and provide recommendations for future work.
II. RELATED WORK
Recently, researchers have shown increasing interest in
the field of sentiment analysis, particularly regarding
Twitter data. The following are previous studies that have
contributed to the field of sentiment analysis in the past few
years. Wagh et al. [7] developed a general sentiment
classification system for use if no label data are available in
the target domain. In this system, labeled data in a different
domain are used. Moreover, this system was used to
calculate the frequency of each term in a tweet. In this study,
a dataset containing four million tweets that were publicly
available by Stanford University was analyzed. This dataset
was used to predict the polarity of sentiments expressed in
people’s opinions. Traditional classification algorithms can
be used to train sentiment classifiers from manually labeled
text data, but the manually labeling work is expensive and
time-consuming. The study found that if a classifier trained
in one domain is applied directly to other domains, the
performance is extremely low. The work showed the
accuracy of different algorithms for different numbers of
tweets, such as the following: Naive Bayes, Multi-nominal
NB, Linear SVC, Bernoulli NB classifier, Logistic
Regression, and the SGD classifier. The results showed that
the proposed system was more efficient than the existing
systems.
Twitter Sentiment Analysis Using Natural
Language Toolkit and VADER Sentiment
Shihab Elbagir and Jing Yang
S
Proceedings of the International MultiConference of Engineers and Computer Scientists 2019 IMECS 2019, March 13-15, 2019, Hong Kong
ISBN: 978-988-14048-5-5 ISSN: 2078-0958 (Print); ISSN: 2078-0966 (Online)
IMECS 2019

Gilbert [6] developed VADER, which is a simple rule-
based model for general sentiment analysis and compared its
effectiveness to 11 typical state-of-the-practice benchmarks,
including Affective Norms for English Words(ANEW),
Linguistic Inquiry and Word Count (LIWC), the General
Inquirer, Senti WordNet, and machine learning-oriented
techniques that rely on the Naive Bayes, Maximum Entropy,
and Support Vector Machine (SVM) algorithms. The study
described the development, validation, and evaluation of
VADER. The researcher used a combination of qualitative
and quantitative methods to produce and validate a
sentiment lexicon that is used in the social media domain.
VADER is utilizing a parsimonious rule-based model to
assess the sentiment of tweets. The study showed that
VADER improved the benefits of traditional sentiment
lexicons, such as LIWC. VADER was differentiated from
LIWC because it was more sensitive to sentiment
expressions in social media contexts, and it generalized
more favorably to other domains.
Mane et al. [8] presented a sentiment analysis using
Hadoop, which quickly processes vast amounts of data on a
Hadoop cluster in real time. The researchers aimed to
determine whether the users expressed a positive or negative
opinion. This approach was focused on the speed of
performing sentiment analysis of real-time Twitter data
using Hadoop. The Hadoop platform was designed to solve
problems that involved large, unstructured, and complex
data. It used the divide and rule method for processing such
data. The overall accuracy of the project was determined by
the time required to access from various modules. In the
analysis, the code yielded outstanding accuracy. The study
used a numbering approach to rate the statements in multi-
classes, which assigned a suitable range of different
sentiments. Moreover, the approach could be used in other
social media platforms, such as movie reviews (e.g., IMDB
reviews) and personal blogs. Along the same line, Bouazizi
and Ohtsuki [9] introduced SENTA, which helps users
select from a wide variety of features those that are the best
fit for the application used to run the classification. The
researchers used SENTA to perform the multi-class
sentiment analysis of texts collected from Twitter. The study
was limited to seven different sentiment classes. The results
showed that the proposed approach reached an accuracy as
high as 60.2% in the multi classification. This approach was
shown to be sufficiently accurate in both binary
classification and ternary classification.
III. METHODOLOGY
A. Proposed Method
The current study consists of three phases. Phase one
concerns the acquisition of Twitter data. Phase two focuses
on the initial preprocessing work carried out to clean and
remove irrelevant information from the tweets. Phase three
deals with the use of the NLTK’s VADER analyzer as well
as the scoring method applied to the VADER results to
assess its ability to classify tweets on a five-point scale.
As aforementioned that, the purpose of the data
acquisition phase was to obtain Twitter data. The methods
used to extract Twitter data allowed real-time access to
publicly available raw tweets. To gather the data, we used
Network Overview Discovery and Exploration for Excel
(NodeXL) [10]. We collected a total of 2,430 political
tweets concerning the 2016 US presidential election, which
were published on Twitter’s public message board and
posted from 22 to 24 November 2016. Also, NodeXL, set
the limit to a maximum of 2,000 tweets, from which we
obtained a reduced data set. In order to collect the most
relevant tweets, we used hashtags containing the candidates’
names, Hillary and Trump. These names and “Election”
were used as keywords to retrieve tweets, such as #Election
Day results, #US Election 2016, #Election 2016, #Hillary
Clinton, #Donald Trump.
A tweet is a microblog message posted on Twitter. It is
limited to 140 characters. Most tweets contain text and
embed URLs, pictures, usernames, and emoticons. They
also contain misspellings. Hence, a series of preprocessing
steps were carried out to remove irrelevant information from
the tweets. The reason is that the cleaner the data, the more
suitable they are for mining and feature extraction, which
leads to the improved accuracy of the results. The tweets
were also preprocessed to eliminate duplicate tweets and re-
tweets from the dataset, which led to a final sample of 1,415
tweets. Each tweet was processed to extract its main
message. To preprocess these data, we used Python’s
Natural Language Toolkit (NLTK). First, a regular
expression (Regex) in Python was run to detect and discard
tweets special characters, such as URLs (“http://url”),
retweet (RT), user mention (@), and unwanted punctuation.
Because hashtags (#) often explain the subject of the tweet
and contain useful information related to the topic of the
tweet, they are added as a part of the tweet, but the “#”
symbol was removed.
Next, various functions of NLTK were used to convert
the tweets to lowercase, remove stop words (i.e., words that
do not express any meaning, such as is, a, the, he, them,
etc.), tokenize the tweets into individual words or tokens,
and stem the tweets using the Porter stemmer. When the
preprocessing steps are complete, the dataset was ready for
sentiment classification.
In phase three, the sentiments expressed in the tweets
were classified. VADER Sentiment Analyzer was applied to
the dataset. VADER is a rule-based sentiment analysis tool
and a lexicon that is used to express sentiments in social
media [6]. First, we created a sentiment intensity analyzer to
categorize our dataset. Then the polarity scores method was
used to determine the sentiment. The VADER Sentiment
Analyzer was used to classify the preprocessed tweets as
positive, negative, neutral, or compound. The compound
value is a useful metric for measuring the sentiment in a
given tweet. In the proposed method, the threshold values
used to categorize tweets as either positive, negative, or
neutral. Typical threshold values used in this study are Refer
to “(1)”:
Positive sentiment: compound value > 0.001, assign
score = 1
Neutral sentiment: (compound value > -0.001) and
(compound value < 0.001), assign score =0
Proceedings of the International MultiConference of Engineers and Computer Scientists 2019 IMECS 2019, March 13-15, 2019, Hong Kong
ISBN: 978-988-14048-5-5 ISSN: 2078-0958 (Print); ISSN: 2078-0966 (Online)
IMECS 2019
Negative sentiment: compound value < -0.001,
assign score = -1 (1)
In the current study, a tweet with a compound
value greater than the threshold was considered a
positive tweet, and a tweet with a compound value less than
the threshold was considered a negative tweet. In the
remaining cases, the tweet was considered neutral. Next, we
defined a scoring rule to determine whether the overall
sentiment polarity in each tweet was in one of five classes:
high positive, positive, neutral, negative, and high negative
Refer to “(2)”. In the proposed method, the scoring rule is
used to classify tweets into five sentiment classes as follows:
Test the overall sentiment of the tweet.
If (score value) = 1:
Calculate the overall tweet polarity as:
If (positive value > 0.5) assign tweet polarity = +2
Else: (positive value < 0.5) assign tweet polarity = +1
If (score value) = -1:
Calculate the overall tweet polarity as:
If (negative value > 0.5) assign tweet polarity = -2
Else: (negative value < 0.5) assign tweet polarity = -1
If (score value = 0) assign tweet polarity = 0 (2)
The polarity value gives the overall sentiment polarity of
the tweet. The polarity value is set between -2 (highly
negative) to +2 (highly positive). Positive tweets are
classified as highly positive or positive depending on the
positive value; negative tweets are classified as highly
negative or negative depending on the negative value; in
other cases, tweets are classified as neutral.
B. Tools
1) NodeXL
NodeXL Basic is a free and open-source network
analysis and visualization software package that is used with
Microsoft Excel [10]. This popular package is similar to
other network visualization tools, such as Pajek, UCINET,
and Gephi. NodeXL allows the quick and accessible
collection of social media data through a set of import tools
that gather data from social networks, such as Flickr,
YouTube, Facebook, and Twitter. NodeXL focuses on the
collection of publicly available data, such as Twitter
statuses, and it follows the relationships of users who have
made their accounts public. These features allow NodeXL
users to instantly retrieve relevant social media data and
integrate aspects of these data and their analysis into one
tool [11].
2) Natural Language Toolkit(NLTK)
NLTK is a free open-source Python package that provides
several tools for building programs and classifying data.
NLTK is suitable for linguists, engineers, students,
educators, researchers, and developers who work with
textual data in natural language processing and text analytics
[12]. NLTK provides an easy way to use the interfaces of
over 50 corpora and lexical resources. It includes a group of
text processing libraries for classification, tokenization,
stemming, tagging, parsing, and semantic reasoning [13].
3) Valence Aware Dictionary and sEntiment Reasoner
(VADER)
VADER is a lexicon and rule-based sentiment analysis
tool that is specifically attuned to the sentiments expressed
in social media. It is an entirely free open-source tool.
VADER also takes into consideration word order and degree
modifiers [6].
IV. RESULTS AND DISCUSSION
The results of a Twitter sentiment analysis using NLTK
and VADER sentiment analysis tools are discussed in this
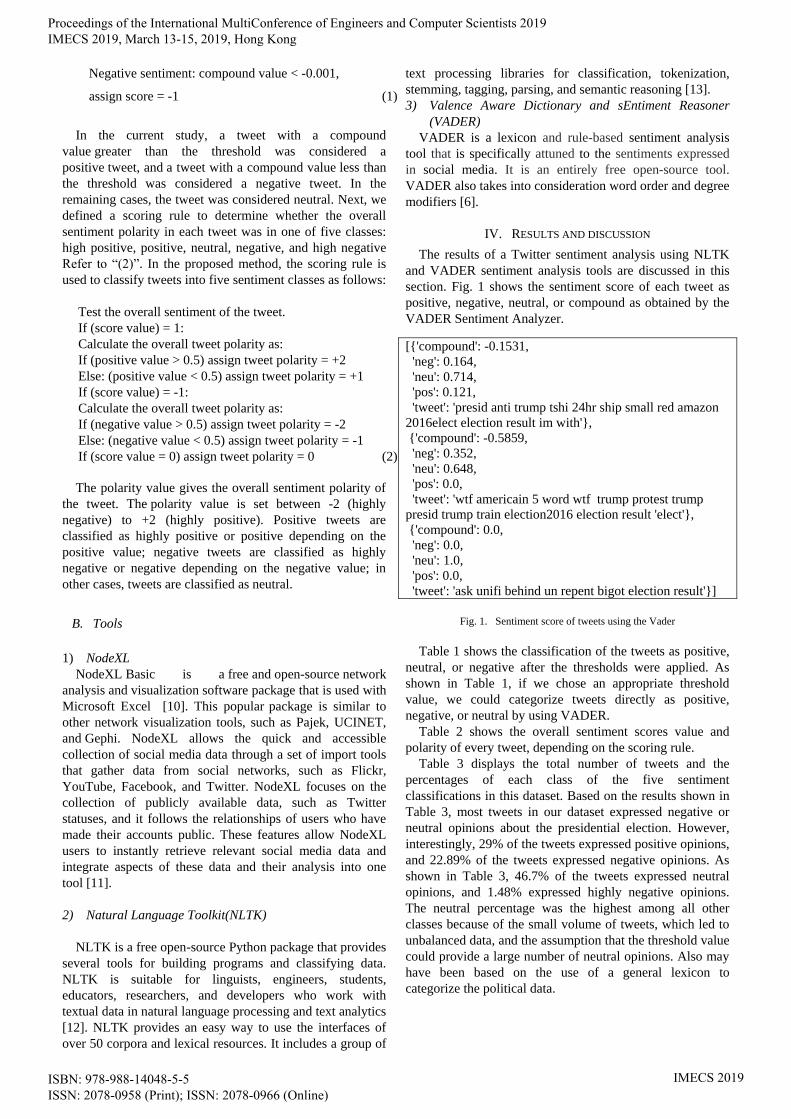
section. Fig. 1 shows the sentiment score of each tweet as
positive, negative, neutral, or compound as obtained by the
VADER Sentiment Analyzer.
Fig. 1. Sentiment score of tweets using the Vader
Table 1 shows the classification of the tweets as positive,
neutral, or negative after the thresholds were applied. As
shown in Table 1, if we chose an appropriate threshold
value, we could categorize tweets directly as positive,
negative, or neutral by using VADER.
Table 2 shows the overall sentiment scores value and
polarity of every tweet, depending on the scoring rule.
Table 3 displays the total number of tweets and the
percentages of each class of the five sentiment
classifications in this dataset. Based on the results shown in
Table 3, most tweets in our dataset expressed negative or
neutral opinions about the presidential election. However,
interestingly, 29% of the tweets expressed positive opinions,
and 22.89% of the tweets expressed negative opinions. As
shown in Table 3, 46.7% of the tweets expressed neutral
opinions, and 1.48% expressed highly negative opinions.
The neutral percentage was the highest among all other
classes because of the small volume of tweets, which led to
unbalanced data, and the assumption that the threshold value
could provide a large number of neutral opinions. Also may
have been based on the use of a general lexicon to
categorize the political data.
[{'compound': -0.1531,
'neg': 0.164,
'neu': 0.714,
'pos': 0.121,
'tweet': 'presid anti trump tshi 24hr ship small red amazon
2016elect election result im with'},
{'compound': -0.5859,
'neg': 0.352,
'neu': 0.648,
'pos': 0.0,
'tweet': 'wtf americain 5 word wtf trump protest trump
presid trump train election2016 election result 'elect'},
{'compound': 0.0,
'neg': 0.0,
'neu': 1.0,
'pos': 0.0,
'tweet': 'ask unifi behind un repent bigot election result'}]
Proceedings of the International MultiConference of Engineers and Computer Scientists 2019 IMECS 2019, March 13-15, 2019, Hong Kong
ISBN: 978-988-14048-5-5 ISSN: 2078-0958 (Print); ISSN: 2078-0966 (Online)
IMECS 2019
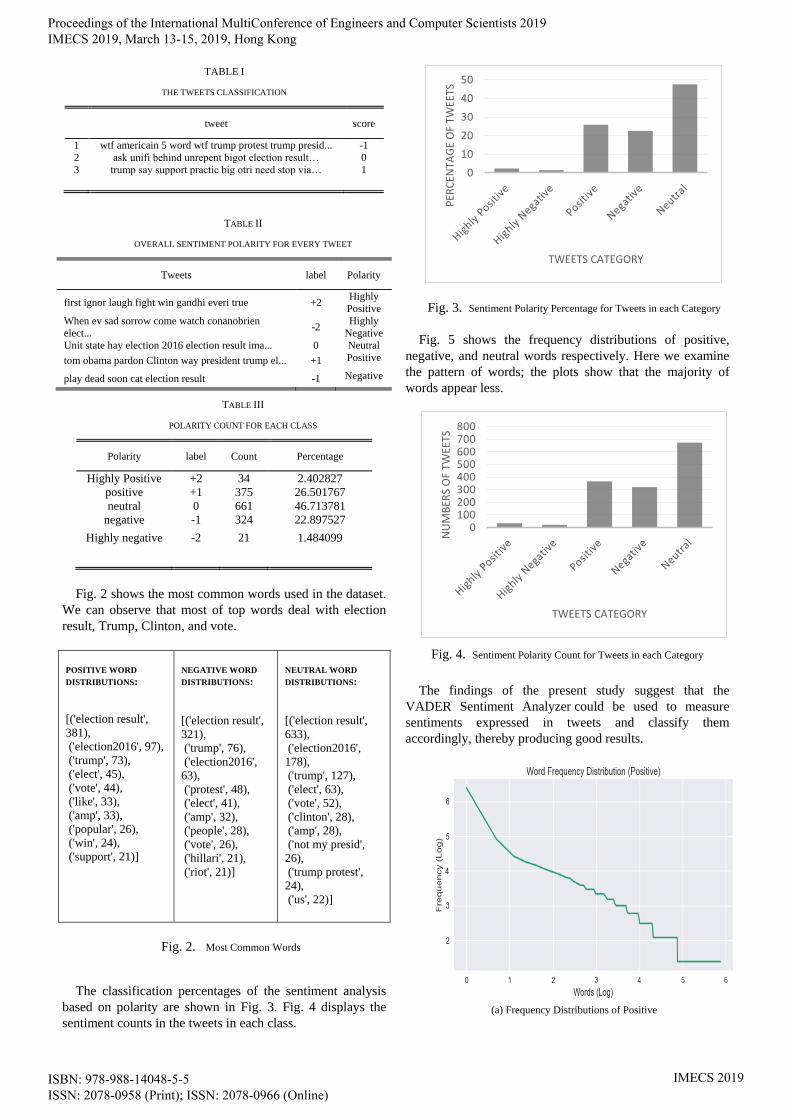
TABLE I
THE TWEETS CLASSIFICATION
tweet score
1 wtf americain 5 word wtf trump protest trump presid... -1
2 ask unifi behind unrepent bigot election result… 0
3 trump say support practic big otri need stop via… 1
TABLE II
OVERALL SENTIMENT POLARITY FOR EVERY TWEET
Tweets label Polarity
first ignor laugh fight win gandhi everi true +2 Highly
Positive
When ev sad sorrow come watch conanobrien
elect... -2
Highly
Negative
Unit state hay election 2016 election result ima... 0 Neutral
tom obama pardon Clinton way president trump el... +1 Positive
play dead soon cat election result -1 Negative
TABLE III
POLARITY COUNT FOR EACH CLASS
Polarity label Count Percentage
Highly Positive +2 34 2.402827
positive +1 375 26.501767
neutral 0 661 46.713781
negative -1 324 22.897527
Highly negative -2 21 1.484099
Fig. 2 shows the most common words used in the dataset.
We can observe that most of top words deal with election
result, Trump, Clinton, and vote.
POSITIVE WORD
DISTRIBUTIONS:
[('election result',
381),
('election2016', 97),
('trump', 73),
('elect', 45),
('vote', 44),
('like', 33),
('amp', 33),
('popular', 26),
('win', 24),
('support', 21)]
NEGATIVE WORD
DISTRIBUTIONS:
[('election result',
321),
('trump', 76),
('election2016',
63),
('protest', 48),
('elect', 41),
('amp', 32),
('people', 28),
('vote', 26),
('hillari', 21),
('riot', 21)]
NEUTRAL WORD
DISTRIBUTIONS:
[('election result',
633),
('election2016',
178),
('trump', 127),
('elect', 63),
('vote', 52),
('clinton', 28),
('amp', 28),
('not my presid',
26),
('trump protest',
24),
('us', 22)]
Fig. 2. Most Common Words
The classification percentages of the sentiment analysis
based on polarity are shown in Fig. 3. Fig. 4 displays the
sentiment counts in the tweets in each class.
Fig. 3. Sentiment Polarity Percentage for Tweets in each Category
Fig. 5 shows the frequency distributions of positive,
negative, and neutral words respectively. Here we examine
the pattern of words; the plots show that the majority of
words appear less.
Fig. 4. Sentiment Polarity Count for Tweets in each Category
The findings of the present study suggest that the
VADER Sentiment Analyzer could be used to measure
sentiments expressed in tweets and classify them
accordingly, thereby producing good results.
(a) Frequency Distributions of Positive
0
10
20
30
40
50
PER
CEN
TAG
E O
F TW
EETS
TWEETS CATEGORY
0 100 200 300 400 500 600 700 800
NU
MB
ERS
OF
TWEE
TS
TWEETS CATEGORY
Proceedings of the International MultiConference of Engineers and Computer Scientists 2019 IMECS 2019, March 13-15, 2019, Hong Kong
ISBN: 978-988-14048-5-5 ISSN: 2078-0958 (Print); ISSN: 2078-0966 (Online)
IMECS 2019

(b) Frequency Distributions of Negative
(c) Frequency Distributions of Neutral
Fig. 5. Frequency Distributions of Positive, Negative, and Neutral
Words
V. CONCLUSION
In this study, the NLTK and the VADER analyzer were
applied to conduct a sentiment analysis of Twitter data and
to categorize tweets according to a multi-classification
system. The case study was the 2016 US presidential
election. The results indicated that the VADER Sentiment
Analyzer was an effective choice for sentiment analysis
classification using Twitter data. VADER easily and quickly
classified huge amounts of data. However, the present study
has the following limitations. First, a small volume of data
was used. Second, a general lexicon was used to categorize
specific data. Third, the data were not trained. In future
work, we will improve our system by using large volumes of
data, a specific lexicon, and a corpus for training the data to
obtain good results.
REFERENCES
[1] B. J. Jansen, M. Zhang, K. Sobel, and A. Chowdury, “Twitter power:
Tweets as electronic word of mouth,” J. Am. Soc. Inf. Sci. Technol.,
vol. 60, no. 11, pp. 2169–2188, 2009.
[2] V. Kharde and P. Sonawane, “Sentiment analysis of twitter data: a
survey of techniques,” arXiv Prepr. arXiv1601.06971, 2016.
[3] P. Selvaperumal and D. A. Suruliandi, “a Short Message
Classification Algorithm for Tweet Classification,” Int. Conf. Recent
Trends Inf. Technol., pp. 1–3, 2014.
[4] T. Singh and M. Kumari, “Role of Text Pre-processing in Twitter
Sentiment Analysis,” Procedia Comput. Sci., vol. 89, pp. 549–554,
2016.
[5] Y. R. Tausczik and J. W. Pennebaker, “The psychological meaning of
words: LIWC and computerized text analysis methods,” J. Lang. Soc.
Psychol., vol. 29, no. 1, pp. 24–54, 2010.
[6] C. J. H. E. Gilbert, “Vader: A parsimonious rule-based model for
sentiment analysis of social media text,” in Eighth International
Conference on Weblogs and Social Media (ICWSM-14). Available at
(20/04/16)
http://comp.social.gatech.edu/papers/icwsm14.vader.hutto.pdf, 2014.
[7] B. Wagh, J. V Shinde, and P. A. Kale, “A Twitter Sentiment Analysis
Using NLTK and Machine Learning Techniques,” Int. J. Emerg. Res.
Manag. Technol., vol. 6, no. 12, pp. 37–44, 2018.
[8] S. B. Mane, Y. Sawant, S. Kazi, and V. Shinde, “Real Time
Sentiment Analysis of Twitter Data Using Hadoop,” Int. J. Comput.
Sci. Inf. Technol., vol. 5, no. 3, pp. 3098–3100, 2014.
[9] M. Bouazizi and T. Ohtsuki, “A Pattern-Based Approach for Multi-
Class Sentiment Analysis in Twitter,” IEEE Access, vol. 3536, no. c,
pp. 1–21, 2017.
[10] M. A. Smith et al., “Analyzing (social media) networks with
NodeXL,” in Proceedings of the fourth international conference on
Communities and technologies, 2009, pp. 255–264.
[11] D. L. Hansen, B. Shneiderman, and M. A. Smith, Analyzing social
media networks with NodeXL: Insights from a connected world.
Morgan Kaufmann, 2010.
[12] S. Bird, E. Klein, and E. Loper, Natural language processing with
Python: analyzing text with the natural language toolkit. “ O’Reilly
Media, Inc.,” 2009.
[13] Natural Language Toolkit http://www.nltk.org/ (Date Last Accessed,
November 20, 2018).
Proceedings of the International MultiConference of Engineers and Computer Scientists 2019 IMECS 2019, March 13-15, 2019, Hong Kong
ISBN: 978-988-14048-5-5 ISSN: 2078-0958 (Print); ISSN: 2078-0966 (Online)
IMECS 2019