two big ideas in teaching 'big data': coincidence and ... · two big ideas in teaching...
TRANSCRIPT
Two Big Ideas in Teaching Big Data 2014 V2b
2014-Schield-ASA-TCC-6up 1
2014 Schield ASA TCC 1
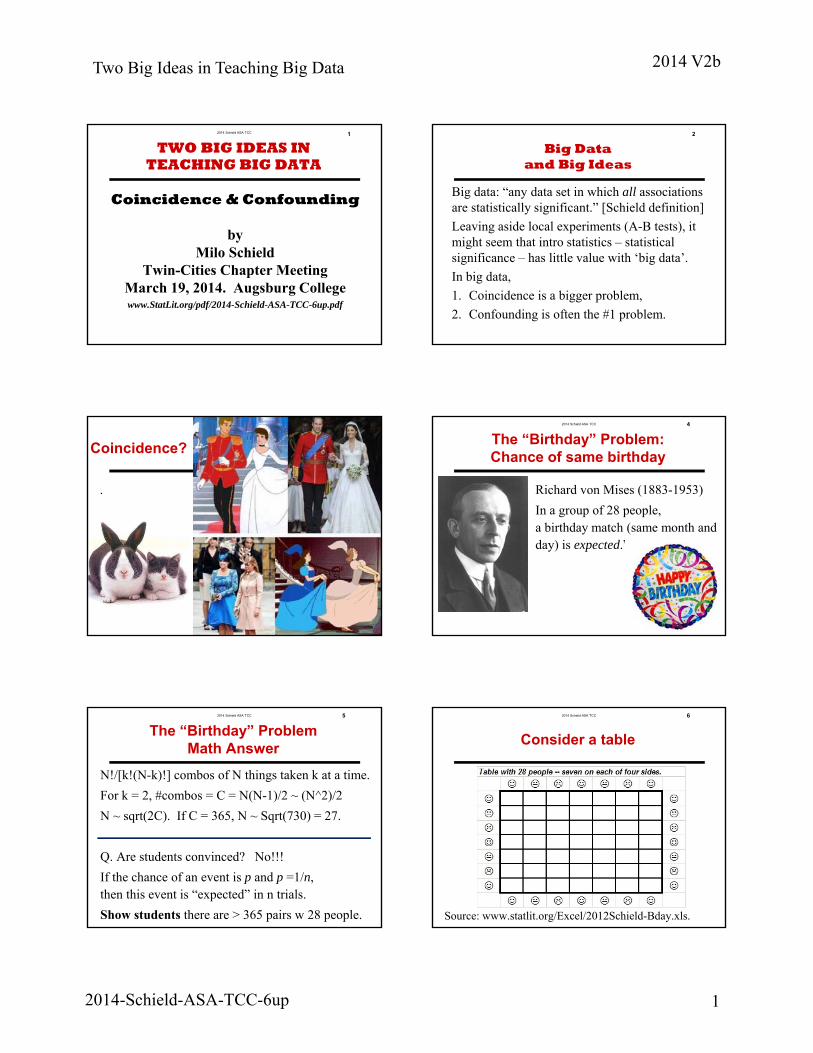
Coincidence & Confounding
byMilo Schield
Twin-Cities Chapter MeetingMarch 19, 2014. Augsburg Collegewww.StatLit.org/pdf/2014-Schield-ASA-TCC-6up.pdf
TWO BIG IDEAS IN TEACHING BIG DATA
2
Big Data and Big Ideas
Big data: “any data set in which all associations are statistically significant.” [Schield definition]
Leaving aside local experiments (A-B tests), it might seem that intro statistics – statistical significance – has little value with ‘big data’.
In big data,
1. Coincidence is a bigger problem,
2. Confounding is often the #1 problem.
2014 Schield ASA TCC 3
Coincidence?
.
2014 Schield ASA TCC 4
The “Birthday” Problem:Chance of same birthday
Richard von Mises (1883-1953)
In a group of 28 people, a birthday match (same month and day) is expected.”.
2014 Schield ASA TCC 5
The “Birthday” ProblemMath Answer
N!/[k!(N-k)!] combos of N things taken k at a time.
For k = 2, #combos = C = N(N-1)/2 ~ (N^2)/2
N ~ sqrt(2C). If C = 365, N ~ Sqrt(730) = 27.
Q. Are students convinced? No!!!
If the chance of an event is p and p =1/n, then this event is “expected” in n trials.
Show students there are > 365 pairs w 28 people.
2014 Schield ASA TCC 6
Consider a table
Source: www.statlit.org/Excel/2012Schield-Bday.xls.

Two Big Ideas in Teaching Big Data 2014 V2b
2014-Schield-ASA-TCC-6up 2
2014 Schield ASA TCC 7
Get Birthdays (Mn/Dy):Color cell with row-column match
2014 Schield ASA TCC 8
Four Quadrants:49 possible connections each
Source: www.statlit.org/Excel/2012Schield-Bday.xls.
2014 Schield ASA TCC 9
Top-to-Bottom & Left-to-Right:49 connections each
.
2014 Schield ASA TCC 10
Same-Edge (four):21 connections each
.
2014 Schield ASA TCC 11
Connections and Chance
Pairs GROUP Details
196 Quadrants 1-4 49 pairs each
49 Left-to-Right
49 Top-to-Bottom
84 Within each side 21 pairs each
378 TOTAL
A preselected birthday match has one chance in 365.
In a group of 28, we have 378 pairs: (N-1)(N/2).
A somewhere match is expected – > 50% of the time.
Conjecture:
The longer
the run,
the more unlikely
the outcome.
Empirical test
Coincidence: Flipping a fair coinGetting a “run” of heads

Two Big Ideas in Teaching Big Data 2014 V2b
2014-Schield-ASA-TCC-6up 3
Flip coins in rows. 1=HeadsRed = Run of heads.
Green: Length of longest run in that row Source: www.statlit.org/Excel/2012Schield-Runs.xls
Run of 4 heads: 1 chance in 2^4 = 1/16Run of 19 heads: 1 in 2^19 = 1/524,288
15
Consider a run of 10 heads?What is the chance of that?
Question is ambiguous! Doesn’t state context!
1. Chance of 10 heads on the next 10 flips? p = 1/2; k = 10.P = p^k = (1/2)^10 = one chance in 1,024
2. Chance of at least one run of 10 heads somewhere when flipping 1,024 sets* of 10 coins each? At least 50%
* or (conjecture) when flipping 1,033 coins: 1/p + k-1.
16
Coincidence increases as data size increases
.. Sets of 10 fair coins with 10 heads
0%
25%
50%
75%
100%
100 300 500 700 900 1100
Number of sets of 10 coins each
Chance of no set with 10 heads
Chance of at least one set with 10 heads
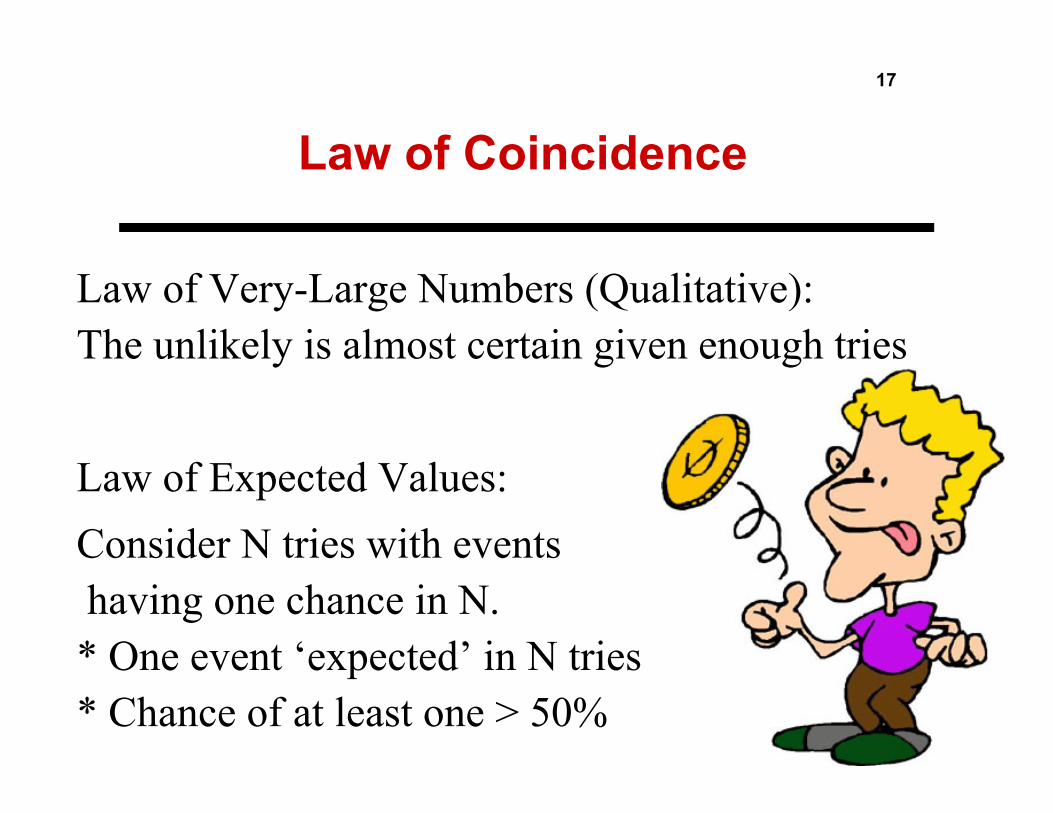
Law of Very-Large Numbers (Qualitative): The unlikely is almost certain given enough tries
Law of Expected Values:
Consider N tries with eventshaving one chance in N.* One event ‘expected’ in N tries* Chance of at least one > 50%
17
Law of Coincidence
18
Second Big Idea:Confounding
Big data will force statistical education to deal with causation in observational studies.
1. Most big data are observational.
2. Most big data users want to use associations as evidence for causation.
3. Confounding is the #1 problem.
4. ‘Confound’, ‘predict’ and explain’, will need clarification.
Two Big Ideas in Teaching Big Data 2014 V2b
2014-Schield-ASA-TCC-6up 4
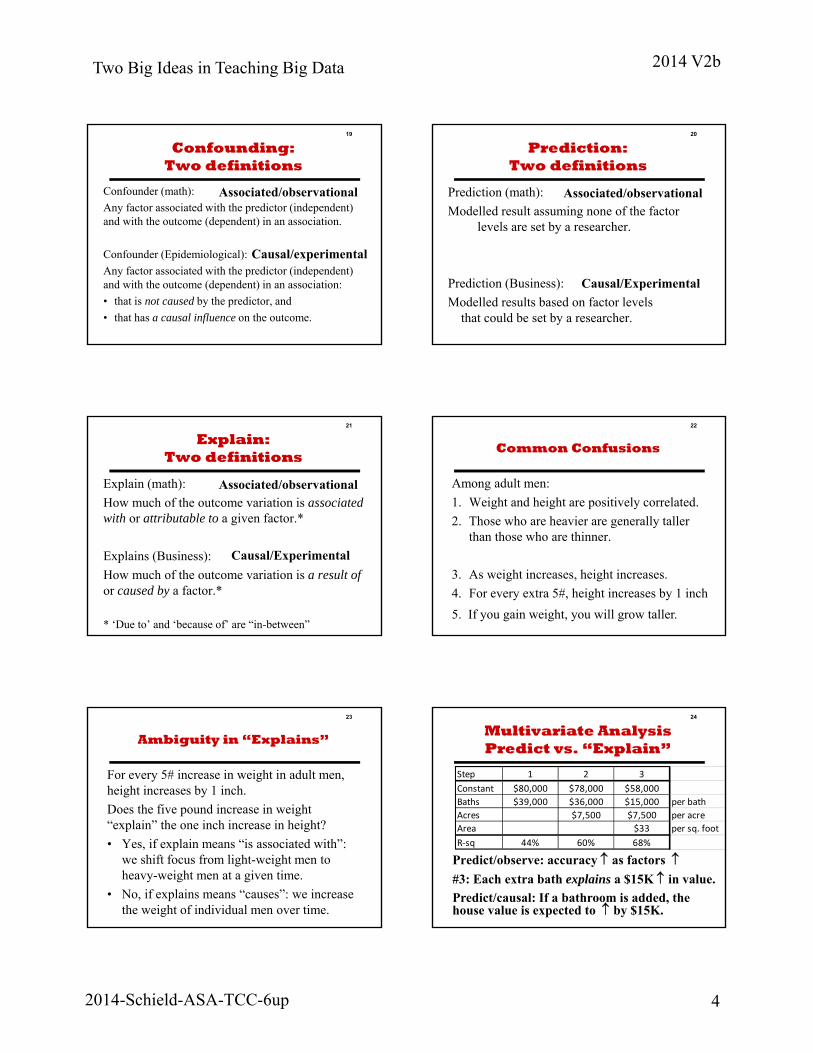
19
Confounding:Two definitions
Confounder (math):
Any factor associated with the predictor (independent) and with the outcome (dependent) in an association.
Confounder (Epidemiological):
Any factor associated with the predictor (independent) and with the outcome (dependent) in an association:
• that is not caused by the predictor, and
• that has a causal influence on the outcome.
Associated/observational
Causal/experimental
20
Prediction:Two definitions
Prediction (math):
Modelled result assuming none of the factor levels are set by a researcher.
Prediction (Business):
Modelled results based on factor levels that could be set by a researcher.
Associated/observational
Causal/Experimental
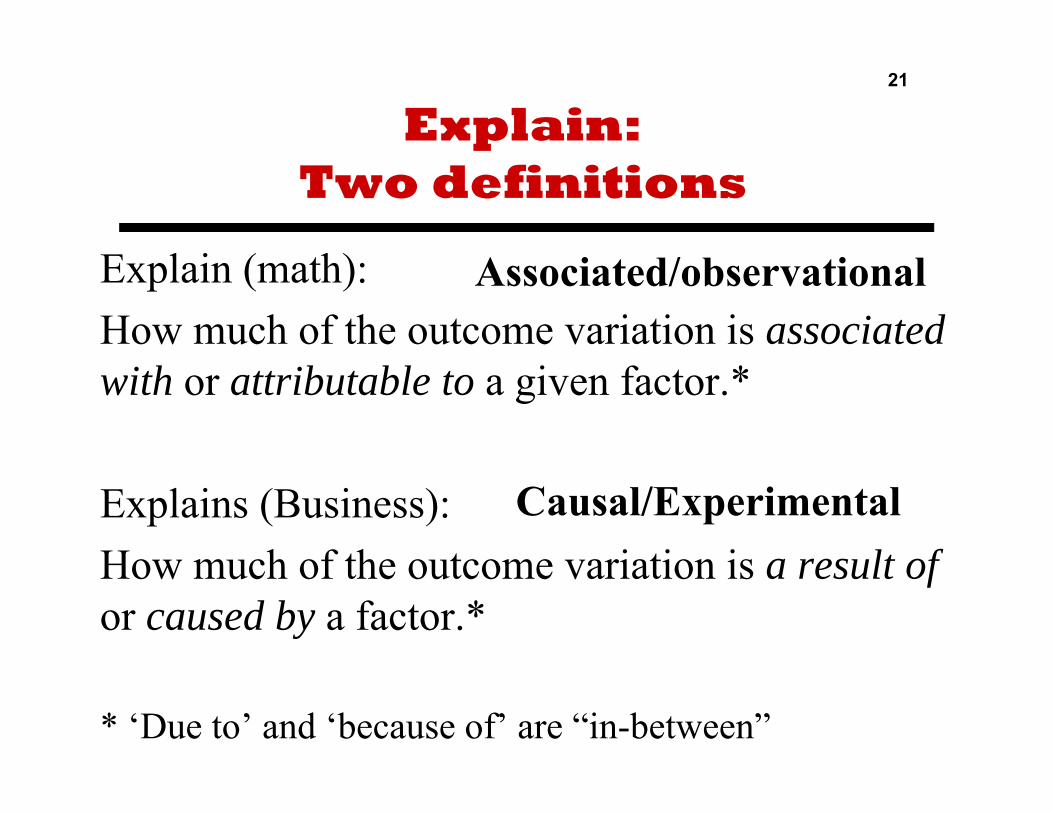
21
Explain:Two definitions
Explain (math):
How much of the outcome variation is associated with or attributable to a given factor.*
Explains (Business):
How much of the outcome variation is a result ofor caused by a factor.*
* ‘Due to’ and ‘because of’ are “in-between”
Associated/observational
Causal/Experimental
22
Common Confusions
Among adult men:
1. Weight and height are positively correlated.
2. Those who are heavier are generally taller than those who are thinner.
3. As weight increases, height increases.
4. For every extra 5#, height increases by 1 inch
5. If you gain weight, you will grow taller.
23
Ambiguity in “Explains”
For every 5# increase in weight in adult men, height increases by 1 inch.
Does the five pound increase in weight “explain” the one inch increase in height?
• Yes, if explain means “is associated with”: we shift focus from light-weight men to heavy-weight men at a given time.
• No, if explains means “causes”: we increase the weight of individual men over time.
24
Multivariate AnalysisPredict vs. “Explain”
Predict/observe: accuracy as factors
Step 1 2 3
Constant $80,000 $78,000 $58,000
Baths $39,000 $36,000 $15,000 per bath
Acres $7,500 $7,500 per acre
Area $33 per sq. foot
R‐sq 44% 60% 68%
#3: Each extra bath explains a $15K in value.
Predict/causal: If a bathroom is added, the house value is expected to by $15K.

Two Big Ideas in Teaching Big Data 2014 V2b
2014-Schield-ASA-TCC-6up 5
25
Modeling:What to Take into Account
Consider modeling the outcome in this causal diagram:
Predictor Confounder Outcome
Kaplan: Model Outcome on PredictorSchield: Model Outcome on Predictor and Confounder
1.Who is right?
Schield in predicting; Kaplan in causal explaining.
2. Can both be right? YES!!!
26
Causation & Simpson’s Paradox
Simpson’s paradox is not a paradox in prediction.
Simpson’s paradox is only a paradox in forming a causal explanation or conclusion.
In a prediction the signs and sizes of the coefficients are all but irrelevant. R-sq is what counts.
In a causal explanation, the size and sign of the coefficients matter. R-sq is all but irrelevant.
27
Conclusion
Many – if not most – big-data users want causal explanations and causal predictions.
Math-stats can help us explain why coincidence increases as the size of the data increases.
Mathematics doesn’t study causation. There is no mathematical operator or operation for causes.
Statistics education must say more about causation than simply saying “Association is not Causation.”
28
Recommendations
1. Schield (2011) Coincidence in Runs and Clusters www.statlit.org/pdf/2012Schield-MAA.pdf
2. Pearl (2000). Simpson’s Paradox: An Anatomy. http://bayes.cs.ucla.edu/R264.pdf
3. Pearl (2009), Causal inference in statistics. http://ftp.cs.ucla.edu/pub/stat_ser/r350.pdf
4. Gelman blog (2014). On Simpson’s Paradox.http://andrewgelman.com/2014/02/09/keli-liu-xiao-li-meng-simpsons-paradox/

2014 Schield ASA TCC 1
Coincidence & Confounding
byMilo Schield
Twin-Cities Chapter MeetingMarch 19, 2014. Augsburg Collegewww.StatLit.org/pdf/2014-Schield-ASA-TCC-6up.pdf
TWO BIG IDEAS IN TEACHING BIG DATA

2
Big Data and Big Ideas
Big data: “any data set in which all associations are statistically significant.” [Schield definition]
Leaving aside local experiments (A-B tests), it might seem that intro statistics – statistical significance – has little value with ‘big data’.
In big data,
1. Coincidence is a bigger problem,
2. Confounding is often the #1 problem.

2014 Schield ASA TCC 3
Coincidence?
.

2014 Schield ASA TCC 4
The “Birthday” Problem:Chance of same birthday
Richard von Mises (1883-1953)
In a group of 28 people, a birthday match (same month and day) is expected.”.

2014 Schield ASA TCC 5
The “Birthday” ProblemMath Answer
N!/[k!(N-k)!] combos of N things taken k at a time.
For k = 2, #combos = C = N(N-1)/2 ~ (N^2)/2
N ~ sqrt(2C). If C = 365, N ~ Sqrt(730) = 27.
Q. Are students convinced? No!!!
If the chance of an event is p and p =1/n, then this event is “expected” in n trials.
Show students there are > 365 pairs w 28 people.

2014 Schield ASA TCC 6
Consider a table
Source: www.statlit.org/Excel/2012Schield-Bday.xls.

2014 Schield ASA TCC 7
Get Birthdays (Mn/Dy):Color cell with row-column match

2014 Schield ASA TCC 8
Four Quadrants:49 possible connections each
Source: www.statlit.org/Excel/2012Schield-Bday.xls.

2014 Schield ASA TCC 9
Top-to-Bottom & Left-to-Right:49 connections each
.

2014 Schield ASA TCC 10
Same-Edge (four):21 connections each
.

2014 Schield ASA TCC 11
Connections and Chance
Pairs GROUP Details
196 Quadrants 1-4 49 pairs each
49 Left-to-Right
49 Top-to-Bottom
84 Within each side 21 pairs each
378 TOTAL
A preselected birthday match has one chance in 365.
In a group of 28, we have 378 pairs: (N-1)(N/2).
A somewhere match is expected – > 50% of the time.

Conjecture:
The longer
the run,
the more unlikely
the outcome.
Empirical test
Coincidence: Flipping a fair coinGetting a “run” of heads

Flip coins in rows. 1=HeadsRed = Run of heads.
Green: Length of longest run in that row

Source: www.statlit.org/Excel/2012Schield-Runs.xls
Run of 4 heads: 1 chance in 2^4 = 1/16Run of 19 heads: 1 in 2^19 = 1/524,288

15
Consider a run of 10 heads?What is the chance of that?
Question is ambiguous! Doesn’t state context!
1. Chance of 10 heads on the next 10 flips? p = 1/2; k = 10.P = p^k = (1/2)^10 = one chance in 1,024
2. Chance of at least one run of 10 heads somewhere when flipping 1,024 sets* of 10 coins each? At least 50%
* or (conjecture) when flipping 1,033 coins: 1/p + k-1.

16
Coincidence increases as data size increases
.. Sets of 10 fair coins with 10 heads
0%
25%
50%
75%
100%
100 300 500 700 900 1100
Number of sets of 10 coins each
Chance of no set with 10 heads
Chance of at least one set with 10 heads
Law of Very-Large Numbers (Qualitative): The unlikely is almost certain given enough tries
Law of Expected Values:
Consider N tries with eventshaving one chance in N.* One event ‘expected’ in N tries* Chance of at least one > 50%
17
Law of Coincidence

18
Second Big Idea:Confounding
Big data will force statistical education to deal with causation in observational studies.
1. Most big data are observational.
2. Most big data users want to use associations as evidence for causation.
3. Confounding is the #1 problem.
4. ‘Confound’, ‘predict’ and explain’, will need clarification.

19
Confounding:Two definitions
Confounder (math):
Any factor associated with the predictor (independent) and with the outcome (dependent) in an association.
Confounder (Epidemiological):
Any factor associated with the predictor (independent) and with the outcome (dependent) in an association:
• that is not caused by the predictor, and
• that has a causal influence on the outcome.
Associated/observational
Causal/experimental

20
Prediction:Two definitions
Prediction (math):
Modelled result assuming none of the factor levels are set by a researcher.
Prediction (Business):
Modelled results based on factor levels that could be set by a researcher.
Associated/observational
Causal/Experimental
21
Explain:Two definitions
Explain (math):
How much of the outcome variation is associated with or attributable to a given factor.*
Explains (Business):
How much of the outcome variation is a result ofor caused by a factor.*
* ‘Due to’ and ‘because of’ are “in-between”
Associated/observational
Causal/Experimental
22
Common Confusions
Among adult men:
1. Weight and height are positively correlated.
2. Those who are heavier are generally taller than those who are thinner.
3. As weight increases, height increases.
4. For every extra 5#, height increases by 1 inch
5. If you gain weight, you will grow taller.

23
Ambiguity in “Explains”
For every 5# increase in weight in adult men, height increases by 1 inch.
Does the five pound increase in weight “explain” the one inch increase in height?
• Yes, if explain means “is associated with”: we shift focus from light-weight men to heavy-weight men at a given time.
• No, if explains means “causes”: we increase the weight of individual men over time.

24
Multivariate AnalysisPredict vs. “Explain”
Predict/observe: accuracy as factors
Step 1 2 3
Constant $80,000 $78,000 $58,000
Baths $39,000 $36,000 $15,000 per bath
Acres $7,500 $7,500 per acre
Area $33 per sq. foot
R‐sq 44% 60% 68%
#3: Each extra bath explains a $15K in value.
Predict/causal: If a bathroom is added, the house value is expected to by $15K.

25
Modeling:What to Take into Account
Consider modeling the outcome in this causal diagram:
Predictor Confounder Outcome
Kaplan: Model Outcome on PredictorSchield: Model Outcome on Predictor and Confounder
1.Who is right?
Schield in predicting; Kaplan in causal explaining.
2. Can both be right? YES!!!

26
Causation & Simpson’s Paradox
Simpson’s paradox is not a paradox in prediction.
Simpson’s paradox is only a paradox in forming a causal explanation or conclusion.
In a prediction the signs and sizes of the coefficients are all but irrelevant. R-sq is what counts.
In a causal explanation, the size and sign of the coefficients matter. R-sq is all but irrelevant.

27
Conclusion
Many – if not most – big-data users want causal explanations and causal predictions.
Math-stats can help us explain why coincidence increases as the size of the data increases.
Mathematics doesn’t study causation. There is no mathematical operator or operation for causes.
Statistics education must say more about causation than simply saying “Association is not Causation.”

28
Recommendations
1. Schield (2011) Coincidence in Runs and Clusters www.statlit.org/pdf/2012Schield-MAA.pdf
2. Pearl (2000). Simpson’s Paradox: An Anatomy. http://bayes.cs.ucla.edu/R264.pdf
3. Pearl (2009), Causal inference in statistics. http://ftp.cs.ucla.edu/pub/stat_ser/r350.pdf
4. Gelman blog (2014). On Simpson’s Paradox.http://andrewgelman.com/2014/02/09/keli-liu-xiao-li-meng-simpsons-paradox/