“two out of three” skin sensitization its for hazard identification
TRANSCRIPT

A. Mehling, D. Urbisch, N. Honarvar, T. Ramirez, S.N. Kolle, B. van Ravenzwaay, R. Landsiedel
Case study 1: The AOP-based “two out of three” skin sensitization ITS for hazard identification
Alternatives for skin sensitization testing and assessment: A joint Cefic-LRI / Cosmetics
Europe / EPAA workshop April 23, 20151

Overview: Title and purpose (e.g. screening/hazard identification/potency prediction)
Rationale underlying the construction of the approach including coverage of the AOP
Description of the information sources used and readouts used (e.g. DPRA, prediction obtained with the proposed prediction model or % Cys depletion or % unreacted Cys)
Chemical used to develop (train) and test the approach (number, selection, reference in vivo data, others)
Process applied to derive the prediction/assessment (i.e. tiered testing strategy, support vector machine, Bayesian, Neural networks, others possibly illustrated with a diagram/workflow)
Predictive capacity of the approach
Limitations in the application of the approach:
a) because of technical limitations and
b) because of wrong predictions
Conclusions
2

Title and purpose (e.g. screening/hazard identification/potency prediction)Title:The AOP-based “two out of three” skin sensitization integrated testing strategy (ITS) for hazard identification
Purpose: Skin sensitization hazard identification and classification for regulatory purposes such as: Globally Harmonized System of Classification, Labelling and Packaging of Chemicals
(GHS) Regulation on Registration, Evaluation, Authorization and Restriction of Chemicals
(REACH) Regulation (EC) No 1223/2009 of the European Parliament and of the Council on
Cosmetics (EU Cosmetics Regulation)
Without the need to use animal-based test methods!3

Rationale underlying the construction of the approach including coverage of the AOP
This strategy covers key events 1, 2 and 3 of the AOP All methods are published in peer-reviewed journals, 2 are OECD TGs and 1 is an OECD TG
draft A broad range of chemicals have been assessed using the individual methods High quality human and/or LLNA data was available for these chemicals
4
ARE-Nrf2 test method
(OECD 442 D;KeratinoSensTM or
LuSens)
h-CLAT (OECD draft) or
(m)MUSST
Protein reactivity DC activationKC activation
DPRA (OECD 442 C)
Key event 1(MIE) Key event 3Key event 2
Molecular Initiating Event (MIE)
Cellular Response
Organism Response
Organ Response
Chemical structure and properties

Description of the information sources used and readouts usedThe readouts/prediction models of the individual methods are those previously describedand published (not all readouts listed)
Key event 1: Direct peptide reactivity assay (OECD TG 442 C peptide depletion due to Cys andLys adducts; peptide depletion of over 6.38% indicates a sensitizer
Key event 2: ARE-Nrf2 luciferase test method (OECD TG 442 D): A luciferase reporter gene is used to assess keratinocyte activation. An increase > 1.5 indicates a sensitizer (cell-viability >70%); KeratinoSens (!); LuSens (Ramirez et al., 2014)
Key event 3: 1) Human cell line activation test (h-CLAT; OECD TG draft): Upregulation of CD54 (EC 200)/CD86 (EC150) on THP-1 cells (cell-viability>50%); 2) (modified) Myeloid U937 skinsensitization test [(m)MUSST]: Upregulation CD86 (EC150) on U937 cells (Ade et al., Bauch et al., 2011; Urbisch et al., 2015)
OECD Toolbox: in silico; to define possible peptide reactivity mechanisms
5

LuSens/KeratinoSensTM h-CLAT/(m)MUSST
Protein reactivity DC activation
Weight of evidence:Results of 2 out of 3 tests determine the classification
KC activation
DPRA
Key event 1(MIE) Key event 3Key event 2
Molecular Initiating Event (MIE)
Cellular Response
Organism Response
Organ Response
Chemical structure and properties
Process applied to derive the prediction/ assessment
6
Molecular Initiating Event (MIE)
Cellular Response
Organism Response
Organ Response
Chemical structure and properties

Data Set 1:Chemical used to develop and test the approachNo predefined chemical training set was used – the prediction model was developed after analyzing
the results:
54 substances: Additives/ stabilizers/ detergents (30%); fragrances (24%), cosmetic preservatives
(22%), cosmetic solvents (11%), cosmetic dyes (7%)
LLNA and human skin sensitization information available (references in Bauch et al., 2012)
The chemicals selected included the performance standards for OECD TG 429 (LLNA)
Compared to human data Sensitivity SpecificityPositive
predictivevalue
Negative predictive
valueAccuracy
In vivo standard LLNA 96% 81% 87% 94% 90%
Predictionmodel
DPRA, LuSensand mMUSST 93% 95% 96% 91% 94%
7

in-house post-validation
WoE I WoEII
WoE I w/o PEI, AF
WoE II w/o PEI, AF
WoE I w/o PEI, AF, PE
WoE II w/o PEI, AF, PE
n 38 35 24 21 24 21
vs. LLNA/GPMT
LLNA/GPMT
LLNA/GPMT
LLNA/GPMT
LLNA/GPMT
LLNA/GPMT
Sensitivity [%] 71 75 88 94 93 93Specificity [%] 86 73 85 70 90 86
Accuracy [%] 76 74 87 85 92 90
The protocols for the test methods are intended for defined substances - not mixtures, plant extracts, etc. (use of molar equivalents)
Formulations and polyethylene imine polymers were not well predicted indicating a need to adapt the methods (e.g. further optimize the gravimetric approach used)
WoE I: DPRA, LuSens, mMUSST; WoE II: DPRA, LuSens, h-CLAT; AF: agrochemical formulation; PEI: polyethylene imine; PE: plant extract
Guth et al., WC9, 2014; Poster-ID: II-1-103
Data set 2:Predictive capacity: ‘real life’ substances
8
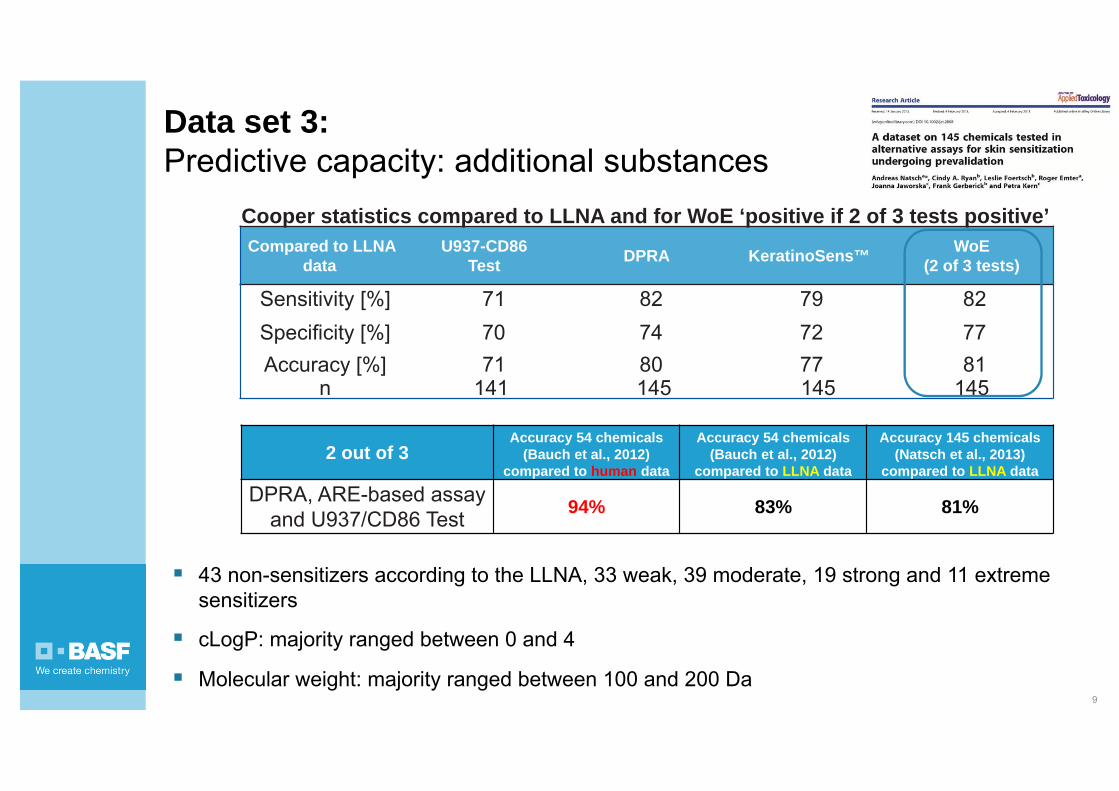
Compared to LLNA data
U937-CD86Test DPRA KeratinoSens™ WoE
(2 of 3 tests)
Sensitivity [%] 71 82 79 82Specificity [%] 70 74 72 77Accuracy [%] 71 80 77 81
n 141 145 145 145
Cooper statistics compared to LLNA and for WoE ‘positive if 2 of 3 tests positive’
43 non-sensitizers according to the LLNA, 33 weak, 39 moderate, 19 strong and 11 extreme sensitizers
cLogP: majority ranged between 0 and 4
Molecular weight: majority ranged between 100 and 200 Da
Data set 3:Predictive capacity: additional substances
9
2 out of 3 Accuracy 54 chemicals
(Bauch et al., 2012) compared to human data
Accuracy 54 chemicals(Bauch et al., 2012)
compared to LLNA data
Accuracy 145 chemicals(Natsch et al., 2013)
compared to LLNA data
DPRA, ARE-based assay and U937/CD86 Test 94% 83% 81%

Data set 4:Predictive capacity of the approach
Compared to HUMAN/LLNA data n Sensitivity [%]
Specificity [%]
Positive predictive value [%]
negative predictive value [%]
Accuracy [%]
DPRA + KeratinoSens + h-CLAT 101/180 90/82 90/72 96/89 79/59 90/79
DPRA + KeratinoSens + (m)MUSST 95/171 84/79 100/77 100/90 70/59 88/78
DPRA + LuSens + h-CLAT 90/133 90/83 89/78 95/91 80/64 90/82
DPRA + LuSens + (m)MUSST 75/126 87/84 100/84 100/93 75/69 91/8410

Mechanistic domainsPredictive capacity of the approach
Accuracies [%] DPRA Keratino-Sens LuSens h-CLAT (m)MUSST '2 out of
3' ITSno alerts
vs. human data 76 82 80 59 82 80vs. LLNA data 68 64 64 69 71 70
n 34 33 25 29 28 30Acylating agents
vs. human data 82 58 50 83 56 83vs. LLNA data 100 42 33 83 67 83
n 11 12 6 12 9 12Michael acceptors
vs. human data 86 100 100 90 80 95vs. LLNA data 86 90 100 100 87 95
n 22 21 10 20 15 22Quinone precursors
vs. human data 91 90 71 91 80 91vs. LLNA data 91 90 71 91 80 91
n 11 10 7 11 10 11Schiff‘base formers
vs. human data 77 79 86 93 75 92vs. LLNA data 85 71 86 86 67 85
n 13 14 7 14 12 13SN1/2 agents
vs. human data 100 83 100 92 78 100vs. LLNA data 82 100 100 75 78 83
n 11 12 5 12 9 12SNAr agents
vs. human data Only 2 chemicals with human data in this domain vs. LLNA data 100 83 100 100 75 100
n 5 6 2 4 4 6
Protein binding mechanisms: defined via OECD toolbox vers. 3.2 and scientificliterature
Highest accuracies:- Michael acceptors - Nucleophilic substitutions (SN) - Quinone precursors
Lowest accuracy:Acylating agents(→ no/little Cys binding capacities)
Assessing protein binding mechanisms
offers a way to obtain a more accurate estimate
of the predictive performance
11

Using an in silico + in vitro combinationPredictive capacity of the approach
Reference:LLNA data;Results in
[%]
in chemico Approach
in silico Approach (QSAR Toolbox v3.2)
DPRA OASIS Profiler
OECD Profiler
Overall in silico Result2
Sensitivity 82 67 65 66
Specificity 72 86 86 90
Accuracy 79 73 71 73
45 non-sensitizers and 113 sensitizers
The OECD toolbox 3.2 offers a tool for protein reactivity
When used alone, the overall accuracy is moderate
When combined with other in vitro methods with an AOP based rationale (2 out of 3) high accuracies can beachieved
Note: Skin metabolism and autoxidation simulator not considered
Urbisch et al., WC9, 2014; Poster-ID: II-1-103
Ref.: LLNA & Human data; Results in [%]
‘2 of 3 WoE’ = KeratinoSens, (m)MUSST + …
A
+ DPRA
B
+ Toolbox Profilers
Sensitivity 80 86 79 82
Specificity 80 96 85 96
Accuracy 80 89 81 86
12

Limitations in the application of the approach: because of
Physical state, e.g. gases, highly lipophilic substances (cell culture)
Stability under test conditions, e.g. DPRA/high pH Lys
Interference with the detection system (bubbles formed by surfactants can interfere with flow cytometric detection in some cytometers, depletion of peptides not due to adduct formation, pigments could interfere with viability readouts)
Substances with high cytotoxicity cannot always be tested to a sufficiently high concentration
Complex mixture, e.g. plant extracts or formulations are difficult to evaluate as molecular weights or molar equivalents are used in most tests
Pre- and prohaptens are not always reliably predicted (e.g. due to the limited metabolic capacities)
Depending on the protein binding mechanisms, the individual assays may have varying predictivities
a) technical limitations
b) wrong predictions
13

Conclusions Based on the extensive comparative studies conducted (currently n = 180), the ‘2 out of 3’ weight of
evidence approach affords high predictivity for skin sensitization hazard identification (even better
than the LLNA)
A large data set has been made available, including human data (Urbisch et al., 2015; open-access)
Identification of the proposed mechanistic peptide reactivity can help to build even more confidence in
the predictions
Pre- or prohaptens, highly lipophilic, cytotoxic substances, mixtures, etc. substances are challenging
Potency assessments remain a challenge
No toxicological test is perfect (not even the LLNA) – it is important to know their strengths and
limitations
Non-animal approaches can now be used for hazard identification with a sufficient degree of
confidence for many chemicals (both for non-sensitizers and sensitizers) 14

The beauty (?!) of simplicity
3 Elements:Very simple - but we‘re getting the picture!
1
23
15

Acknowledgements
Many thanks to all the companies and theiremployees that developed the methods, publishedresults (both human, animal and nonanimal) and thatmade the various publications possible!
17

DISCLAIMER This document, or any answers or information provided herein by BASF, does not constitute a legally binding obligation of BASF. While the descriptions, designs, data and information contained herein are presented in good faith and believed to be accurate, they are provided for your guidance only. Because many factors may affect processing or application/use, we recommend that you make tests to determine the suitability of a product for your particular purpose prior to use. It does not relieve our customers of the obligation to perform a full inspection of the products upon delivery or any other obligation. The claims and supporting data provided in this publication have not been evaluated for compliance with any jurisdiction’s regulatory requirements and the results reported may not be generally true under other conditions or in other matrices. Users must evaluate what claims and information are appropriate and comply with a jurisdiction’s regulatory requirements.
NO WARRANTIES OF ANY KIND, EITHER EXPRESS OR IMPLIED, INCLUDING WARRANTIES OF MERCHANTABILITY OR FITNESS FOR A PARTICULAR PURPOSE, ARE MADE REGARDING PRODUCTS DESCRIBED OR DESIGNS, DATA OR INFORMATION SET FORTH, OR THAT THE PRODUCTS, DESIGNS, DATA, OR INFORMATION MAY BE USED WITHOUT INFRINGING THE INTELLECTUAL PROPERTY RIGHTS OF OTHERS. IN NO CASE SHALL THE DESCRIPTIONS, INFORMATION, DATA, OR DESIGNS PROVIDED BE CONSIDERED A PART OF OUR TERM SAND CONDITIONS OF SALE.
18