two-phase pressure drop of …/67531/metadc625555/m2/1/high...they proposed a correlation for a...
TRANSCRIPT

TWO-PHASE PRESSURE DROP OF REFRIGERANTS DURINGFLOW BOILING IN SMALL CHANNELS: AN EXPERIMENTAL
INVESTIGATION AND CORRELATION DEVELOPMENT*
T. N, Tran,l’2 M.-C. Chyu,’ M. W. Wambsganss,2 and D. M. France3lDepartrnent of Mechanical Engineering, Texas Tech University,
Lubbock, TX 79409, U.S.A.
2Energy Technology Division, Argonne National Laboratory, Argonne, IL 60439, U.S.A.3Departrnent of Mechanical Engineering, University of Illinois at Chicago,
Chicago, IL 60607, U.S.A.
lheeutwnittedmanuaoripthesbaencra3tedby the Unhsilyof Chioago as Operator ofArgonneNationalLaboratory(%gcuHM underCOOfreotNo. W-31-1OS-ENG-3SWth theUs.Dapattmmtof Energy.The Us.Governmentrefeinaforitaetf,endothersactingcmitsbehatf,a paid-up,no+wxotueii,inwocabk waridwide kenae in acid artiofeto reproduoe,Prapetaderivativeworks,disttiiutecopiesto the publii, andperformpubliolyend dispteypubliiy. by or on behetfof tieGownmeM
Submitted to Int. Conf. on Compact Heat Exchangers and Enhancement Technology for theProcess Industries, Banff, Canada, July 18-23, 1999.
*Work supported by the U.S. Department of Energy, Office of Energy Efficiency and RenewableEnergy, OffIce of Industrial Technologies, under Contract W-3 l-109-Eng-38.

DISCLAIMER
This repo~ was prepared as an account of work sponsoredby an agency of the United States Government. Neither theUnited States Government nor any agency thereof, nor anyof their employees, make any warranty, express or implied,or assumes any legal liability or responsibility for theaccuracy, completeness, or usefulness of any information,apparatus, product, or process disclosed, or represents thatits use would not infringe privately owned rights. Referenceherein to any specific commercial product, process, orservice by trade name, trademark, manufacturer, orotherwise does not necessarily constitute or imply itsendorsement, recommendation, or favoring by the UnitedStates Government or any agency thereof. The views andopinions of authors expressed herein do not necessarilystate or reflect those of the United States Government orany agency thereof.

DISCLAIMER
Portions of thisdocument may be illegible
in electronicimageproduced from the
document.
products. Images arebest available original

TWO-PHASE PRESSURE DROP OF REFRIGERANTS DURINGFLOW BOILING IN SMALL CHANNELS: AN EXPERIMENTAL
INVESTIGATION AND CORRELATION DEVELOPMENT
T. N. Tran, 1J*M.-C. Chyu, * M. W. Warnbsganss,2 and D. M. France3lDepartment of Mechanical Engineering, Texas Tech University,
Lubbock, TX 79409, U.S.A.2Energy Technology Division, Argonne National Laboratory, Argonne, IL 60439, U.S.A.
3Department of Mechanical Engineering, University of Illinois at Chicago,Chicago, IL 60607, U.S.A.
ABSTRACT
Two-phase flow pressure drop measurements were made during a phase-change heattransfer process with three refrigerants (R- 134a, R-12, and R-1 13) at six different pressuresranging from 138 IcPato 856 M?%and in two sizes of round tubes (2.46 mm and 2.92 mm insidediameters) and one rectangular channel (4.06 x 1.7 mm). State-of-the-art large-tube correlationsfailed to satisfactorily predict the experimental data. The data were used to develop a newcorrelation for two-phase pressure drop during flow boiling in small channels. The correlationwas then tested against the experimental data for the three refrigerants; the error was +20°/0.
INTRODUCTION
Only a few studies in the literature report on two-phase fluid flow and heat transfer incompact heat exchangers. Nevertheless, extensive applications exist in the process industries,where phase-change heat transfer allows more compact heat exchanger designs with betterperformance than those used for single-phase operation. To further the application of compactheat exchangers in the process industries, there is a need to understand the fundamental issues oftwo-phase flow and heat transfer in small channels representative of compact heat exchanger flowpassages.
In the refrigeration/air conditioning industry, including automobile environment control, afi.mdamental understanding of multiphase-flow and heat transfer involving boiling and condensingof refrigerants in small channels is important. In particular, there is a need for a validated designcorrelation for two-phase pressure drop that will facilitate the design and optimization ofcompact heat exchangers for use with refrigerants.
Jung and Radermacher (1989) conducted experiments with refrigerants R-22, R- 114, R-12,and R-152, and refrigerant mixtures in 4-m long, 9.1-mm-inside-diameter, stainless steel tubes.They proposed a correlation for a two-phase flow total pressure drop of pure and mixedrefrigerants. In their correlation, the two-phase multiplier is expressed as a fimction of qualityand reduced pressure.
Souza and Pimenta (1995), following their work in 1992 (Souza et al. 1992), testedrefrigerants R-134a, R-12, R-22, MP-39, and R-32/l 25 in a copper tube with two sections; onehad an inside diameter (ID) of 7.75 mm, and the other an ID of 10.92 mm. They proposed a

2
semi-empirical correlation to calculate the two-phase flow multiplier for pure and mixedretligerants,
Two-phase flow pressure drop and evaporation heat transfer of refrigerants in smallchannels have been studied at Argonne National Laboratory (Warnbsganss et al. 1993, 1994; Tranet al. 1996), and a correlation for nucleate flow boiling has been reported (Tran et al. 1997). Inthe Argonne study, two smooth circular tubes and one rectangular channel with hydraulicdiameters of 2.46 mm, 2.92 mm, and 2.40 mm, respectively were used to simulate flow passagestypical of plate-fin heat exchangers. One of the objectives of the study was to determine if large-tube correlations can be used to predict two-phase pressure drop of refrigerants in smallchannels, with hydraulic diameter of about 3 mm, and, as necessary, to develop an experimentallyvalidated predictive method that can facilitate the design and optimization of compact heatexchangers for refrigerants, including those that are environmentally acceptable. The results ofthe experimental investigation and correlation evaluation/development are presented in this paper.
EXPERIMENTS
The test apparatus, instrumentation, test procedures, and data reduction methodology, havebeen presented in detail by Tran et al. (1997). Three different refrigerants were tested in fourdifferent channels, as summarized in Table 1.
Single-phase tests were performed to validate the instrumentation and data reductionmethod (Tran 1998), then two-phase flow pressure drop tests were performed with R-134a atfour different averaged pressures of 356,441, 634, and 835 kPzq with R-12 at the txvo averagedpressures of517 and 824 kPa; and with R-113 at an averaged pressure of 169 kPa. The accuracyof the data base was assessed by an uncertainty analysis based on the method of sequentialperturbations (Moffat 1988; Holman and Gajda 1978). This method allows estimation of anoverall uncertainty of a set of data by integrating the uncertainty of each source of error into thedata base independently, then using a root sum square method to calculate the overalluncertainty. The uncertainty analysis was incorporated into the spreadsheet program, and anuncertainty was calculated for every test run of each data set. The uncertainty in themeasurement of the pressure drop was found to be M OO/O.
The total two-phase flow pressure drop consists of two components: an accelerationcomponent and a fictional component. The accelerational pressure drop component results fromacceleration of the flow during the evaporation process. It was evaluated and shown to be smallrelative to the frictional component. Therefore, the measured two-phase pressure drop data wasassumed to be representative of the frictional component.

,
3
Tablel. Summary ofdatafor two-phase flowpressure drop test
Test Series
Parameter la Zb 3b 4C
Refrigerant
Channel Material
Channel Geometry
Dh (mm)
Total Length (mm)
Pr
G (kg/m%)
q“ (kW/m2)
Exit Quality, x
No. of Data Points
R-113 R-12
Stainless steel Brass
Circdar circular
2.92 2.46
412 914
0.04-0.058 0.12-0.21
50-400 63-832
8.8-90.8 7.5-59.5
0.02-0.95 0.21-0.94
39 137
R-12
Brass
Rectangular
2.40(1.70 X4.06)
88 I
0.18-0.23
44-505
7.7-129
0.22-0.82
132
R-134a
Brass
circular
2.46
914
0.08-0.21
33-502
2.2-49.8
0.24-0.90
302
awmbsgms et al. (1993).
bTran et al. (1996).cTran (1998).
EXPERIMENTAL RESULTS
For a given refrigerant and test channel, the range of test conditions and the number of testdata points are given in Table 1. For all tests, the flow entered the test section in a subcooledcondition, and the starting point of saturated boiling ranged from 0.2 to 0.5 mm downstream ofthe first pressure port location. Because the pressure drop over the subcooled length is negligiblysmall, the pressure drop measured by the differential pressure transducer was that of thesaturated flow boiling section. Exit quaMy varied from test to test. The experimental pressuredrop data were plotted against exit quality for the averaged pressure of the particular test seriesand various values of mass flux.

4
. .,
Refrigerant R-134a
In Fig. l,theexperimental pressure drop datifor tests witi R-134ame plotiedagtinst exitquality for various values of mass flux and a saturation pressure of 835 kPa. The results showthat the two-phase flow pressure drop increases as the exit quality increases, as well as increaseswith mass flux; these trends agree with those of a large tube.
100
0.1
G (k@mzs)
~ 52 *8
~743!2
+111 *lo+144s
+ 169 *18
~ 260 *18
+ 395 s
~ 475 e
0.2 0.3 0.4 0.5 0.6 0.7 0.8 0.9 1x
exit
Fig. 1. Pressure drop of R-134a at pavg = 835 kpa as a function of exit quality atvarious values of mass flux
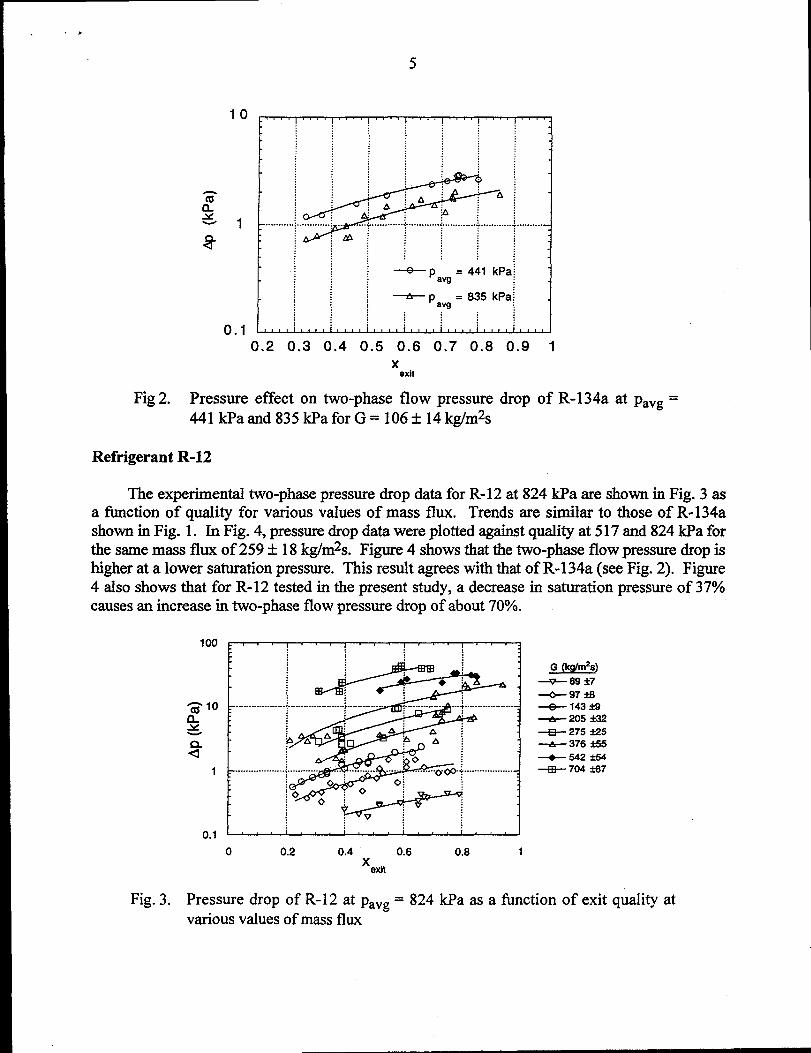
The pressure effect on two-phase flow pressure drop was also investigated. A typicalresult is shown in Fig. 2, where two-phase flow pressure drop is higher at a lower saturationpressure. This is reasonable because at a lower pressure (lower saturation temperature), the fluidhas a higher viscosity and a higher density than it has at a higher pressure. Also, the ratio ofliquid to vapor density increases at lower reduced pressure. For R-134% a decrease in saturationpressure of 47% causes an increase in two-phase flow pressure drop of about 60%. Thispressure effect is also in agreement with large-tube results.
In an attempt to compare the pressure drop data of R-134a in the present study to that of alarge tube, the present data were compared to the test results that Eckels et aI. (1994) obtainedfor R-134a in a large smooth tube with an ID of 8 mm and a test section length of 3.6 m. Due tothe difference in the test section [email protected],the comparison is based on pressure gradient instead ofpressure drop. The comparison shows that at a saturation pressure of 350 kp~ mass flux of 307+50 kg/mzs, ad a qulity rage of ().68 H.07 (the closest available quality range compared tothe 0.82 + 0.05 in Eckels et al. [1994]), the pressure gradient in the present small-channel studyis about 3.3 times higher than that of the large-tube data. It is noteworthy that in their pressuredrop tests, the inlet quality varied from 7 to 11%, while in the present study, the inlet qualitywas <1O/O. The Eckels et al. tube diameter was approximately three times that of the tube used inthe present study.
5
.,
10
1
r
...........
0.1 L
m................................................—+-P = 441 kPa
avg
~P ~vg= 835kPa!........0.2 0.3 0.4 0.5 0.6 0.7 0.8 0.9 1
xexit
Fig2. Pressure effect on two-phase flow pressure drop of R-134aat pavg=441 kpaand 835 lcpafor G= 106*14 kg/m2s
Refrigerant R-12
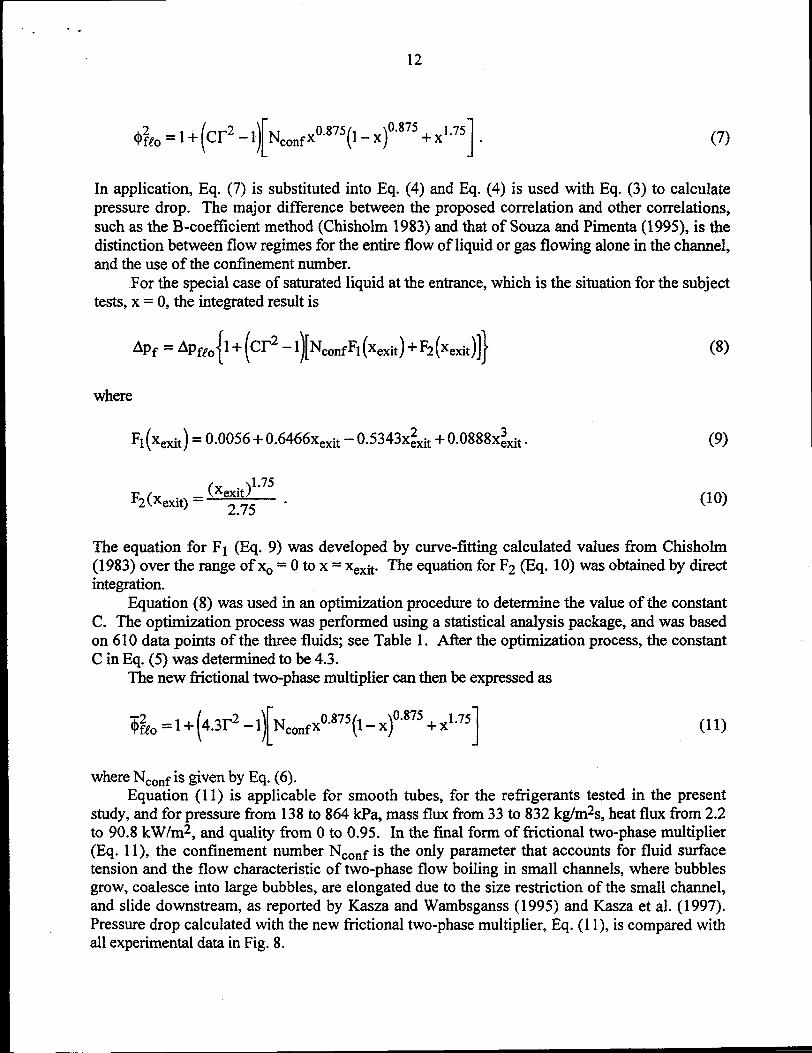
The experimental two-phase pressure drop data for R-12 at 824 kpa are shown in Fig. 3 asa function of quality for various values of mass flux. Trends are similar to those of R- 134ashown in Fig. 1. In Fig. 4, pressure drop data were plotted against qualityat517 and 824 kpa forthe same mass flux of 259&18 kg/m2s. Figure 4 shows that the two-phase flow pressure drop ishigher at a lower saturation pressure. This result agrees with that of R-134a (see Fig. 2). Figure4 also shows that for R-12 tested in the present study, a decrease in saturation pressure of 37%causes an increase in two-phase flow pressure drop of about 70°/0.
1001’
~ 69*7-C-97*
~ 10 -e- 143S$ ~ 205ti2-
%
0.1 1 f ! I
o 0.2 0.4 0.6 0.8 1x
exit
Fig. 3. Pressure drop of R-12 at pavg = 824 kPa as a finction of exit quality atvarious values of mass flux

6
‘“”m10
1
—
.........C9
x
—
--y-=
............. ...........
9---+-=
-L-L !........‘0.2 0.3 0.4 0.5 0.6 0.7 0.8 0.9 1
xexit
Fig. 4. Pressure effect on two-phase flow pressure drop of R-12 at pavg= 517 kpa
ad Pavg= 824kpa for G = 259* 18 kg/mzs and xexit = 0.58 * 0.28
Comparison of R-134a and R-12
Refrigerant R-134a is a replacement for R-12 in the refrigeration and air conditioningindustry. Therefore, it is of interest and useful to compare the performance of these tworefrigerants in terms of pressure drop. Such information is usefbl to designers in the selection ofthe appropriate parameters to use with refrigerant R-134a in the design of a new system, or inretrofitting an existing R- 12 refrigeration system.
Because both R-134a and R-12 were tested in the same test section under similar testconditions, a direct comparison of two-phase flow pressure drop can be made. Knowing thattwo-phase flow pressure drop is a fimction of saturation pressure, exit quality, and mass flux, thecomparison can be made based on either the same mass flux or the same heating rate, as suggestedby Eckels and Pate (1991). Comparison based on the same heating rate was suggested becauseR-1 34a has a higher latent heat of vaporization than that of R-12, and also because a design isoften based on a specified heating or cooling rate.
We compared the pressure drop data of R-134a and R-12 in terms of mass flux for asaturation pressure of 835 kPa and a quality of 0.7 ~ 0.05 (Fig. 5). The results show the sametrend reported by Eckels and Pate (1991) for a large tube of 8 mm dia. and 3.67 m length, testedat a saturation pressure of =350 to 490 I@a (=5- 15°C saturation temperature). Figure 5 showsthat the two-phase flow pressure drop of R-134a is up to 31% higher than that of R- 12 for arange of mass flux from 60 to 300 kg/m2s and a quality of 0.7& 0.05. This result is comparableto the difference in pressure drop of up to 50% reported by Eckels and Pate (1991) for a range ofmass flux from 125 to 400 kg/m% at a quality of 0.80 to 0.88. Again, the tube used by Eckelsand Pate was more than three times larger in diameter, and the quality was higher and thesaturation pressure was much lower, than those of the present study.

.
7
Fig. 5.
20
15
10
5
00 50 100 150 200 250 300 350 400
G (kg/m*s)
Comparison of two-phase flow pressure drop between R-134a andR-12 in terms of mass flux for xexit = 0.7 ~ 0.05 and pavg = 835 kPa
Figure 6presents the comparison of pressure drop in terms of heat flux, at the quaMy of0.7 ~0.05. ‘l_’’hiscomparison indicates that for a given heating rate, the two-phase flOWpressuredrop of R-134a is 31 to 44% lower than that of R-12 for the range of heat flux from 5 to31 kW/m2. This result is comparable with that reported by Eckels and Pate (1991) for a largetube, where the pressure drop of R-134a was 10 to 30’%0lower than that of R-12 for the sameheat capacity. Again, the difference from Eckels and Pate’s result is due to the much smaller tube,the Iower quality, and the higher saturation pressure of the present study. The lower pressuredrop of R-134a compared to that of R-12 in Fig. 6 is seen because a lower mass flux of R-134a isrequired to achieve the same heating rate as R- 12 due to the higher latent heat of vaporization ofR-134a.
R-113 in Round Tube and R-12 in Rectangular Channel
To broaden the data base for small-channel two-phase flow pressure drop, the pressuredrop results from flow boiling tests with R-1 13 (Wambsganss et al. 1993) were also included.Unlike R-134a and R-12, which have simiktr fluid physical properties, R-113 has a higher surfacetension, higher liquid viscosity, higher liquid density, and lower gas density than those of R- 12and R-1 34a at the same saturation pressure or temperature. The two-phase flow pressure dropdata of R-113 exhibit the same trends, with quality and mass flux, as in R-134a and R-12 (Tran1998).
The hydraulic diameter of the rectangular channel used with R- 12, was approximately equalto the diameter of the circular tube. A comparison of the test data from R-12 in round tube, withthe data from R-12 in rectangular channel, showed no significant difference that would indicate ageometry effect,

25
20
15
10
0 5 10 15 20 25 30 35 40
q’ (kW/m2)
Fig. 6. Comparison of two-phase flow pressure drop between R-134a andR-12 in terms of heat flux for x = 0.7 + 0.05 and pavg = 835 kpa
COMPARISON WITH LARGE TUBE CORRELATIONS
The experimental data were compared with five state-of-the-art correlations for predictingtwo-phase fi-ictional pressure drop in large tubes: (1) Friedel’s correlation (Friedel 1979), (2) theB-coefficient method (Chisholm 1983), (3) the C-coefficient method (Chishohn 1983), (4) Jungand Radermacher correlation (Jung and Radermacher 1989), and (5) Souza and Pimentacorrelation (Souza and Pimenta 1995). These correlations were developed specifically for largetubes with inside diameter of 8 mm or larger. The correlations of Jung and Raderrnacher andSouza and Pimenta were developed from refrigerant data. Tran (1998) summarizes the fivecorrelations and presents detailed (i.e., fi,mction of quality) comparisons with the experimental&@, a typical comparison plot is given in Fig. 7.
A careful review of the frictional two-phase flow pressure drop comparison betweenmeasured data and the five large-tube correlations led to the conclusions below (Tran 1998). Atlow mass flux, lower qualities, and certain pressures, some of the correlations satisfactorilypredict experimental results, while the others significantly underpredict (as four of thecorrelations do in Fig. 7) or slightly overpredict the results. For all saturation pressures, none ofthe hirge-tube correlations satisfactorily predict the measured frictional two-phase flow pressuredrop for mass flux >150 kg/m%, and qualities larger than =0.6.

9
F“’’!’’’’!’’’’!’’’’!”’’”!”’““l
-.. —Eq. (ii) . . . . . . . . ..' . .. . . .. . .. . . . . .. . .. . . . . . . . . . . .. fif . .. . . ..."." ""..-‘---- Friedel (1979)
,iy~
/.
- - -B codficimt /j
--- — . .C *ffffi,*”, i # .- . . . . ..j . . . . . .. . . . . . .. . ... . . .. . . . . . . . . . . . . . . .. . . . . . . . . . . . . . . .
—.. --souza g Pinmnmj/o;
(199s) J ,.:
‘-. ---.-Jung& .. . . .. . . ....+ . . . . . . . . . . . .. . .. . .. . . . .. ... . . . .../.... . . . . . . . . . . . .
RarMmaeher(1089)
: .~. .:#0°~.: .-
. . . . . . . . . . . . . . . . .. . .. . . .. . .. . . . . . . . . . . . . .. . . . . .. . . . ~.. , . . . ..>..f.. . . . .. . . . . . . . . ... . . .. . . . . .. . . . .
:,, .- ,-; . . . j0 .:0 -.-; .O
,.: # “ >.. :. . . . . . . . . . . . . . . . ... . . .. . . . . . . . .. . ...+ . . . . .. . ..-. ... . . . . . . . .. .AIL.-. -..:..; .. . . . . . . . . .. . . . .
:-.~-- :-. .?
o 100 200 300 400 500 600G (kg/m2s)
Fig. 7. Comparison of experimental data for R-134a at pavg = 365 lcp~ and x =0.73 *0.02 with five large-tube correlations
We suggest that the reason why the large-tube correlations fail to predict small-channelresponse is related to the different flow behavior in small channels. The coalesced bubbles areconfiied, elongated, and slide over a thin liquid film as they flow downstream, compared to theflow boiling in a Iarge tube where the bubbles grow and flow aJong the tubes going throughdifferent flow regimes without restriction. Therefore, it is reasonable to suggest that the greaterpressure drop in a small channel may be due to additional friction related to thedeformed/elongated bubble movement. Also, for the case of large tubes, the particularexperiments of Souza and Pimenta (1995) showed a flow regime change &om annular to mist at aquality of =0.85, and the pressure drop reached a peak at this point. When the flow regimechanges from annular to mist, the tube wall dries OUGand the shear stress at the wall falls at aquality of =0.85 due to a large viscosity ratio of 20 between the liquid refrigerant and its vapor(Souza and Pimenta 1995). Most of the large-tube correlations predict a much lower pressuredrop at this point. However, the comparison in the present study shows that the decreasedprediction of pressure drop using large-tube correlations starts at a lower quality of =0.6, and thedecrease is clearly evident at x = 0.73 * 0.02 for all four pressures. This indicates that the large-tube correlations cannot be used in predicting two-phase flow pressure drop in small channels fora quality >0.6. The present comparison also suggests that the transition from annular flow tomist flow regime did not occur in small channels until the quality is >0.85; in other words, thedryout point will be extended fiirther downstream than that in a large tube.

10
PRESSURE DROP CORRELATION
In the following, a new pressure drop correlation is developed on the basis of Chisholm’s B-coefflcient method (Chisholm 1983). For two-phase flow in a smooth tube, the B-coefficient isdefined by
$!,o=l+p-l)~x”.’’’(xy ”’”’+xlx”]”] ,
where
()dp
z fgo~2 =
()
dp “
& f..
The value of B is determined according to the criteria given in Table 2.
Table 2. Criteria for selecting B
r B II I 4.8 I
59.5 I 500< G<1900 I 2400/G I
I >1900” I 55/G”.5 I
1 <600” ~ 520/(rG””5)9.5-= ~K28 I
>600”I I 21A’ I
I 15,000>28
~2G0.5I
The two-phase pressure drop over a quality range x = Xato x = xb can be calculated as
(Xb1Xa)f::+:to(x)dx .W?(3= _
(1)
(2)
(3)
(4)

““
11
The B-coefficient method does not contain a parameter that accounts for the effect of tubedimension and fluid surface tension. Surface tension is expected to be an important fluidproperty that needs to be included in the two-phase flow pressure drop correlation, particularlyfor refrigerants. In the B-coefficient method, the pressure effect is reflected in the change ofdensity and viscosity of the vapor and liquid phases. The size effect is included in thecalculation of single-phase Fanning friction factor f, which relies on the Reynolds number as inthe case of frictional pressure drop of single-phase flow. The complexity of two-phase flow,therefore, is not fidly described, especially for small channels where the pressure drop is stronglyinfluenced by the dynamics of the growing and flowing bubbles confined in a narrow space with aflowing liquid phase. Additional factors must be considered, including the effects of the interfacebetween vapor and liquid phases, and the wetted surface between liquid and the channel wall.
In developing the new correlation, the definitions of B and r2 were modified to betterreflect the physics of flow boiling in small tubes in which the channel size, fluid physicalproperties, mass flux, pressure, and quality are important factors. Anew parameter related to ~is defined as
y2=cxr2=C(dp’dz)fgo
(dp’dz)f,o “(5)
The constant C in Eq. (5) is considered to be a scaling factor that represents the difference inpressure gradient between small tubes and large tubes.
A dimensionlessnext sought. Cornwellnumber,” expressed as
r a
number that can be used to substitute for the current B-coefficient wasand Kew (1993) proposed a dimensionless group called the “confinement
10.5
1, .1N ,= Lg(p’-Pg)jcon D“
(6)
The numerator of this dimensionless parameter represents the ratio of surface tension force tobuoyancy force, and D is the diameter of the channel. Comwell andKew(1993) and Kew andComwell (1995) performed boiling heat transfer tests with R-113 in a small channel, with gapsize of 1 to 3 mm, and reported that the confinement number correlated well with their heattransfer test results. However, in their published papers, they did not use the confinementnumber to correlate their two-phase flow pressure drop data. In our development of the newcorrelation, we used the confhlement number as a substitute for the B coefficient, because theconfinement number, NCOnf,includes stiace tension and hydraulic diameter and can thus accountfor the maximum size of the bubble confined in small channel during a flow boiling process. Theconfinement number NConf,given by Eq. (6),alsoshows that a smaller channel gives a highervalue of Nconfi which leads to a higher pressure drop.
Including the scaling factor C as a multiplier on ~, and using the confinement number NCOnfto replace B, the new form is given as
‘. -.
12
( )[ ()1
&o= 1+ cr2 -1 Nconfx0.875 1_ x 0.875+X1.75 . (7)
In application, Eq. (7) is substituted into Eq. (4) and Eq. (4) is used with Eq. (3) to calculatepressure drop. The major difference between the proposed correlation and other correlations,such as the B-coeffkient method (Chishohn 1983) and that of Souza and Pimenta (1995), is thedistinction between flow regimes for the entire flow of liquid or gas flowing alone in the channel,and the use of the confkement number.
For the special case of saturated liquid at the entrance, which is the situation for the subjecttests, x = O,the integrated result is
{ ( 2-l)[NcotiF~(xexit) +F~(x.xit)]}Apf = Apfto 1+ cr
‘l(xexit ) = 0.0056+0.6466x~xi~–0.5343X~~,t+0.0888X~xi~.
‘2(%it) =(Xexit)*.75 .
2.75
(8)
(9)
(lo)
The equation for F1 @q. 9) was developed by curve-fitting calculated values from Chisholm(1983) over the range of x. = Oto x = ~xit. The equation for F2 @q. 10) was obtained by directintegration.
Equation (8) was used in an optimization procedure to determine the value of the constantC. The optimization process was performed using a statistical amdysis package, and was basedon 610 data points of the three fluids; see Table 1. After the optimization process, the constantC in Eq. (5) was determined to be 4.3.
The new fictional two-phase multiplier can then be expressed as
( )[&/O =1+ 4.3r2’1 NconfX0.875 1_ x 0.875+X1.75()1
(11)
where NConfis given by Eq. (6).Equation (11 ) is applicable for smooth tubes, for the refrigerants tested in the present
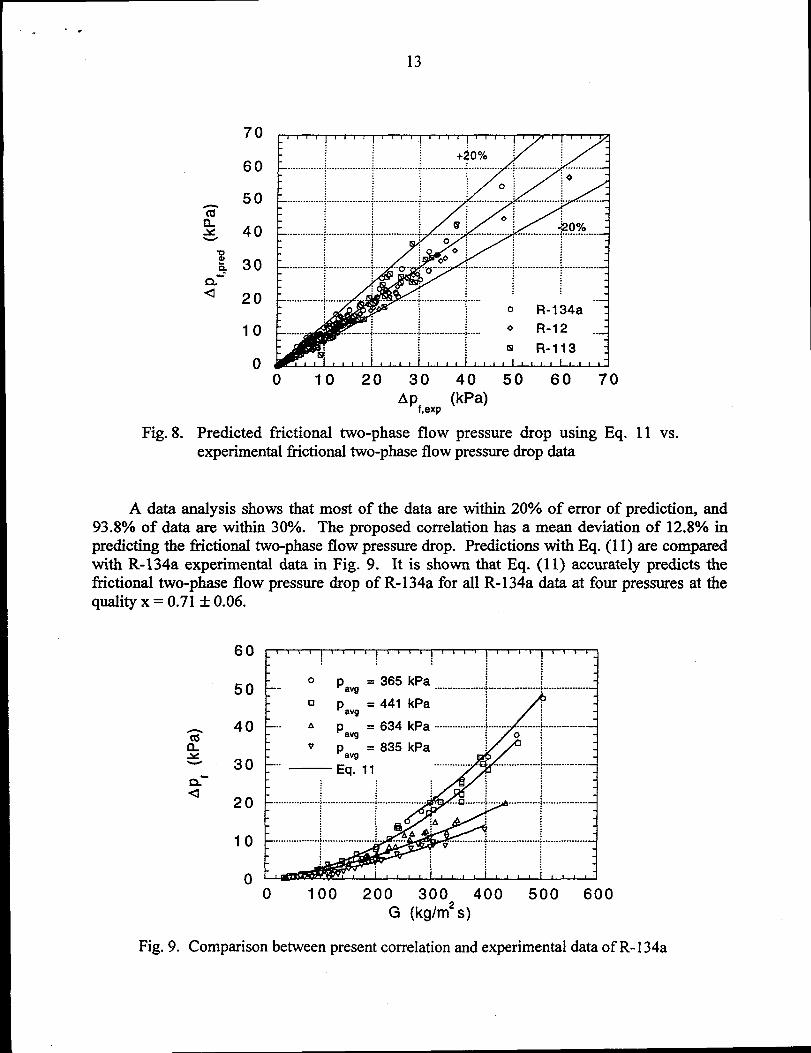
study, and for pressure horn 138 to 864 kp~ mass flux from 33 to 832 kg/mzs, heat flux from 2.2to 90.8 kW/m2, and quality from Oto 0.95. In the final form of fictional two-phase multiplier(Eq. 11), the confinement number Nconf is the only parameter that accounts for fluid surfacetension and the flow characteristic of two-phase flow boiling in small channels, where bubblesgrow, coalesce into large bubbles, are elongated due to the size restriction of the small channel,and slide downstream, as reported by Kasza and Wambsganss (1995) and Kasza et al. (1997).Pressure drop calculated with the new frictional two-phase multiplier, Eq. (11), is compared withall experimental data in Fig. 8.
13
.’ -
70
60
50
40
30
20
10
00 10 20 30 40 50 60 70
Ap~,XP (kPa)
Fig. 8. Predicted frictional two-phase flow pressure drop using Eq. 11 vs.experimental frictional two-phase flow pressure drop data
A data analysis shows that most of the data are within 20% of error of prediction, and93.8% of data are within 30%. The proposed correlation has a mean deviation of 12.8% inpredicting the fictional two-phase flow pressure drop. Predictions with Eq. (11) are comparedwith R-1 34a experimental data in Fig. 9. It is shown that Eq. (11) accurately predicts thefrictional two-phase flow pressure drop of R-134a for all R-134a data at four pressures at thequality x = 0.71 &0.06.
60
50
40
30
20
10
0
, 1 ,[
, , ! ! ! ! , ,
0 P = 365 kPa ; !—.. w ...................p .............................—
—.. b Pv
—..
............! .................—
. .......................................... .............y ....................................—
0 100 200 300 400 500 600G (kg/m*s)
Fig. 9. Comparison between present correlation and experimental data of R- 134a

14
CONCLUDING REMARKS
● An experimental investigation of flow boiling of three refrigerants in small channelsproduced an extensive data base of two-phase pressure drop information.
● Pressure drop with R-1 34a was compared with R-12 on the basis of both similar mass fluxand heating rate. In both cases, the trends were in reasonable agreement with thoseobserved in comparisons with large-tube data.
● Five state-of-the-art large-tube correlations were evaluated, but they failed to predict thepressure drop of flow boiling in small channels for all test conditions.
● A new correlation for two-phase flow frictional pressure drop in small channels wasdeveloped on the basis of the B-coefllcient method, taking into account the effects ofsurface tension and channel size. The new correlation is applicable for smooth tubes withhydraulic diameters of =3 mm for the three refrigerants tested.
ACKNOWLEDGMENTS
The research was supported by the U.S. Department of Energy, Office of EnergyEfficiency and Renewable Energy, Office of Industrial Technologies, under Contract W-31-109-Eng-38. The authors thank Roger Smith for his contributions in fabricating the test apparatus,instrumenting the test channel, and performing some of the tests; and Joyce Stephens forprocessing much of the data and preparing the figures and overall manuscript for publication.
NOMENCLATURE
B
cD
Dhdp/dz
G
gNm~
PP,
Ap
q“Rexr2
PP
Constant in B-coefficient method (Eq. 1)Constant (Eq. 3)
Channel inside diameter (m)
Channel hydraulic diameter (m)Pressure gradient along test section (R/m)Mass flux (kg/m2s)
Gravitational constant (rrdsz)Confinement number (Eq. 6) (dimensionless)Pressure (Pa)Reduced pressure (= Plpcr)
Pressure drop (Pa)Heat flux (W/mz)
Reynolds number (dimensionless)Equilibrium mass qualityPhysical property coefficient (Eq. 2) (dimensionless)Viscosity (kg/m.s)Density (kg/ins)

(s Surface tension (N/m)
@ Two-phase multiplier (dimensionless)
T Averaged two-phase multiplier (dimensionless)Y Physical property index (Eq. 5)
Subscriptsavg Averaged
cr critical
exit At the exitf Due to fiction
g Gas
w Entire flow as gas only
/ Liquid
to Entire flow as liquid onlypred Predicted
REFERENCES
Chisholm, D., 1983, Two-Phase Flow in Pipelines and Heat Exchangers. New York:Longman Inc.
Cornwell, K., and Kew, P. A., 1993, “Boiling in Small Parallel Channels.” in EnergyEj?ciency in Process Technology, ed. P. A. Pilavachi. New York: Elsevier, 624-638.
Eckels, S. J., and Pate, M. B., 1991, “Evaporation and Condensation of HCFC-134a andCFC-12 in a Smooth Tube and a Micro-Fin Tube.” ASHWE Trans., ~ Part 2,71-81.
Eckels, S. J., Doerr, T. M., and Pate, M. B., 1994, “In-Tube Heat Transfer and PressureDrop of R-134a and Ester Lubricant Mixtures in a Smooth Tube and a Micro-Fin Tube: Part I-Evaporation.’t ASHWE Trans., ~ Part 2,.
Friedel, L., 1979, “Improved Friction Pressure Drop Correlations for Horizontal andVertical Two Phase Pipe Flow.” Paper E2, European Two Phase Flow Group Meeting, Ispr~Italy.
Holman, J. P., and Gajd~ W. J., Jr., 1978, Experimental Methods for Engineers, 3rd Ed.New York: McGraw-HiIl, 44-45.
Jung, D. S., and Raderrnacher, R., 1989, “Prediction of Pressure Drop during HorizontalAnnular Flow Boiling of Pure and Mixed Refrigerants.” Int. J Heat Mass Transfer, =(12),2435-2446.
Kasza, K. E., Didascalou, T., and Wambsganss, M. W., 1997, “Microscale FlowVisualization of Nucleate Boiling in Small Channels: Mechanisms Influencing Heat Transfer.” inProc. Conf on Compact Heat Exchangers for the Process Industries, ed. R. K. Shah. New YorkBegell House, Inc.
Kasza, K, E., and Warnbsganss, M. W., 1995, “Flow Visualization of Microscale ThermalMechanics of Boiling in Small Channels.” in Flow Visualization VII - Proc. 7th InternationalSymposium on Flow Visualization, ed. J. P. Crowder. New York: Begell House, Inc., 262-267.
Kew, P. A., and Cornwell, K., 1995, “Confined Bubble Flow and Boiling in NarrowChannels.” 10th Int. Heat Transfer Con$, Brighton, U.K.

. -*
16
Moffat, R. J., 1988, ''Describing tie Uncefiinties in Experimental Results.'' Exp. ThermalFluid Sci., L 3-17.
Souza, A. L., and Pimenta, M. M., 1995, “Prediction of Pressure Drop during HorizontalTwo-Phase Flow of Pure and Mixed Reiiigerants.” in ASME Cavitation and Multiphase FlowSymposium. FED-VO1. 210, pp. 161-171.
Tr~ T. N., 1998, “Pressure Drop and Heat Transfer Study of Two-Phase Flow in SmallChannels.” Ph.D. Dissertation, Texas Tech University, Lubbock, Texas.
Tran, T. N., Wambsganss, M. W., Chyu, M.-C., and France, D. M., 1997, “A Correlationfor Nucleate Flow Boiling in Small Channels.” in Compact Heat Exchangers for the ProcessIndustries, ed. R. K. Shah. New York Begell House, Inc., 353-363.
Tran, T. N., Wambsganss, M. W., and France, D. M., 1996, “Small Circular andRectangular Channel Boiling with Two Reiligerants.” l’nt.J iMdt@ase Flow, Z(3), 485-498.
Wambsganss, M. W., Jendrzejczyk, J. A., and France, D. M., 1994, “Two-Phase Flow andPressure Drop in Flow Passages of Compact Heat Exchangers.” in Vehicle ThermalManagement, SAE PT-46, ed. A. ,C.Alkidas. Warrendale, PA: Society of Automotive Engineers,257-266.
Wambsganss, M. W., France, D. M., Jendrzejczyk, J. A., and Tran, T. N., 1993, “BoilingHeat Transfer in a Horizontal Small-Diameter Tube.” ASMEJ Heat Transfer, M(4), 963-972;also, Argonne National Laboratory Report ANL-92/12 (1992).