two stage membrane biofilm reactors for nitrification and
TRANSCRIPT

Two Stage Membrane Biofilm Reactors for Nitrification and Hydrogenotrophic Denitrification
by
Jong Hyuk Hwang
A Thesis submitted to the Faculty of Graduate Studies of
The University of Manitoba
in partial fulfilment of the requirements of the degree of
DOCTOR OF PHILOSOPHY
Department of Civil Engineering
University of Manitoba
Winnipeg
Copyright © 2009 by Jong Hyuk Hwang

Acknowledgements
I would first like to thank Dr. Jan Oleszkiewicz for all his help and support
and for giving me the great opportunity to do Ph.D. research in University of
Manitoba. I would also like to thank Dr. Nazim Cicek for all his advice and
guidance throughout this work. This work would not be possible without their
support.
Thank you to the advisory committee: Dr. Richard Sparling for his input on
microbial insight and his encouraging words and to Dr. Yoomin Lee for her
practical aspects in wastewater treatment that made this work more valuable.
Thank you to Dr. Robert Nerenberg for his helpful suggestions and comments.
I would like to thank Victor Wei for his technical expertise and all my
colleagues, including Dr. Dominika Celmer, Qiuyan Yuan, Dr. Wenbo Yang and
Lukasz Jaroszynski, for their help in the lab.
This research was supported by Canadian Water Network, GE Water and
Process Technologies Division, City of Winnipeg – Water and Waste Department
and the University of Manitoba – Faculty of Graduate Studies.

TABLE OF CONTENTS
EXECUTIVE SUMMARY .............................................................................................. 1
1. INTRODUCTION......................................................................................................... 3
1.1 Importance of nitrogen removal ......................................................................................... 3
1.2 Nitrification and hydrogenotrophic denitrification .......................................................... 4
1.2.1 Nitrification ................................................................................................................................... 4
1.2.2 Hydrogenotrophic denitrification .................................................................................................. 5
1.3 Membrane biofilm reactor .................................................................................................. 8
1.4 Objective of this research .................................................................................................. 30
2. LITERATURE REVIEW .......................................................................................... 12
2.1 Chronology and geographical distribution of MBfR studies ......................................... 12
2.2 Classification by research areas........................................................................................ 14
2.2.1 Literature and critical reviews – Category I ................................................................................ 14
2.2.2 Fundamental aspects including modeling – Category II .............................................................. 15
2.2.3 Applications for nitrogen removal – Category III ....................................................................... 18
1) Category III-1 : organic removal and simultaneous nitrification (including heterotrophic
denitrification ................................................................................................................................... 18
2) Category III-2 : nitrification only ................................................................................................. 20
3) Category III-3 : autotrophic denitrification only .......................................................................... 21
4) Category III-4 : total nitrogen removal with autotrophic bacteria only ....................................... 24
2.2.4 Other applications – Category IV ................................................................................................ 26
2.3 Research needs ................................................................................................................... 27
2.3.1 Biofilm control ............................................................................................................................ 27
2.3.2 Pilot- or full- scale operations ...................................................................................................... 29
3. GENERAL OBJECTIVES OF RESEARCH ........................................................... 32
4. MATERIALS AND METHODS ............................................................................... 34
4.1 Reactor configurations ...................................................................................................... 34
4.2 Membrane characteristics ................................................................................................. 36
4.3 Influent characteristics ...................................................................................................... 38
4.4 Reactor operations ............................................................................................................. 40
5. STAND-ALONE NITRIFICATION REACTOR .................................................... 42
5.1 Membrane feasibility test for nitrification ....................................................................... 42
5.2 Acclimation of nitrification for future use ....................................................................... 46
5.3 Effect of ammonia loading rate on nitrification .............................................................. 49

5.3.1 Objectives .................................................................................................................................... 49
5.3.2 Materials and methods ................................................................................................................. 49
5.3.3 Results and discussion ................................................................................................................. 50
5.3.4 Conclusions ................................................................................................................................. 53
5.4 Effect of dissolved oxygen on nitrification ....................................................................... 54
5.4.1 Introduction and specific objectives ............................................................................................ 54
5.4.2 Materials and methods ................................................................................................................. 55
5.4.3 Results and discussion ................................................................................................................. 55
5.4.4 Conclusions ................................................................................................................................. 58
5.5 Batch nitrification tests with effluent from the nitrification reactor............................. 58
5.5.1 Introduction and specific objectives ............................................................................................ 58
5.5.2 Materials and methods ................................................................................................................. 59
5.5.3 Results and discussions................................................................................................................ 61
5.5.4 Conclusions ................................................................................................................................. 64
5.6 Summary of nitrification reactor operation .................................................................... 65
6. STAND-ALONE DENITRIFICATION ................................................................... 66
6.1 Effect of mineral precipitation .......................................................................................... 66
6.1.1 Introduction and objectives .......................................................................................................... 66
6.1.2 Materials and methods ................................................................................................................. 68
6.1.3 Results and discussions................................................................................................................ 71
6.1.4 Conclusions ................................................................................................................................. 82
6.2 Effect of dissolved oxygen ................................................................................................. 83
6.2.1 Introduction and specific objectives ............................................................................................ 83
6.2.2 Materials and methods ................................................................................................................. 85
6.2.3 Results and discussions................................................................................................................ 86
6.2.4 Conclusions ................................................................................................................................. 88
6.3 Effect of temperature ......................................................................................................... 89
6.3.1 Introduction and specific objectives ............................................................................................ 89
6.3.2 Materials and methods ................................................................................................................. 90
6.3.3 Results and discussions................................................................................................................ 91
6.3.4 Conclusions ................................................................................................................................. 93
6.4 Summary of the denitrification reactor operation .......................................................... 94
7. CONSECUTIVE OPERATION OF NITRIFICATION AND
DENITRIFICATION ..................................................................................................... 95
7.1 Long-term operational stability ........................................................................................ 96
7.1.1 Introduction and objectives .......................................................................................................... 96
7.1.2 Materials and methods ................................................................................................................. 98
7.1.3 Results and discussions................................................................................................................ 99
7.1.4 Conclusions ............................................................................................................................... 106
7.2 Biofilm control .................................................................................................................. 107
7.2.1 Introduction and objectives ........................................................................................................ 107
7.2.2 Materials and methods ............................................................................................................... 109

7.2.3 Results and discussions.............................................................................................................. 111
7.2.4 Conclusions ............................................................................................................................... 124
7.3 Effect of bulk dissolved oxygen in consecutive operation............................................. 125
7.3.1 Introduction and objectives ........................................................................................................ 125
7.3.2 Materials and methods ............................................................................................................... 126
7.3.3 Results and discussion ............................................................................................................... 127
7.3.4 Conclusions ............................................................................................................................... 133
7.4 Effect of loading rate on nitrification and denitrification during consecutive operation
................................................................................................................................................. 134
7.4.1 Introduction and objectives ........................................................................................................ 134
7.4.2 Materials and methods ............................................................................................................... 135
7.4.3 Results and discussions.............................................................................................................. 135
7.4.4 Conclusions ............................................................................................................................... 139
8. ENGINEERING SIGNIFICANCE ......................................................................... 141
8.1 Performance comparison with other tertiary treatment options................................. 141
8.2 Cost comparison with existing technology of a denitrification filter ........................... 144
8.2.1 Simulation case .......................................................................................................................... 145
8.2.2 Case study cost data ................................................................................................................... 146
8.2.3 H2-driven MBfR for denitrification ........................................................................................... 149
8.3 Engineering significances ................................................................................................ 152
9. FUTURE WORK ...................................................................................................... 155
9.1 Pilot scale application with a robust membrane ........................................................... 155
9.2 Greenhouse gas emission ................................................................................................. 156
10. REFERENCES ........................................................................................................ 158
11. APPENDIX .............................................................................................................. 176

Table of Figures
Figure 1.1 Comparison of pollutants removal mechanisms in membrane-attached biofilm system
....................................................................................................................................................... 10
Figure 1.2 Comparison between MBfR and conventional biofilm system .................................... 11
Figure 2.1 Chronological distribution of peer-reviewed journal articles ....................................... 13
Figure 2.2 Regional distribution of peer-reviewed journal articles ............................................... 14
Figure 2.3 Distribution of research topics ..................................................................................... 16
Figure 3.1 Timeframe of whole experiments ................................................................................. 33
Figure 4.1 Dimensions for 0.5 L modified polypropylene graduated cylinder .............................. 35
Figure 4.2 Dimensions for 1.6 L custom made reactor .................................................................. 36
Figure 4.3 Reactor configurations for two types of reactors .......................................................... 41
Figure 5.1 Pictures of the nitrification reactor before seeding (left) and after seeding (right) ...... 43
Figure 5.2 Specific nitrification rates during PP membrane test for nitrification .......................... 44
Figure 5.3 Specific nitrification rate during PMP membrane test for nitrification ........................ 45
Figure 5.4 Pictures of the nitrification reactor (PMP) ................................................................... 47
Figure 5.5 NH4-N concentrations and SNR from acclimation stage ............................................. 48
Figure 5.6 Nitrogen concentration and SNR in nitrifying MBfR .................................................. 50
Figure 5.7 Relationship between loading rate and nitrification rate .............................................. 51
Figure 5.8 Relationship between bulk NH4-N and SNR ................................................................ 52
Figure 5.9 Relationship between bulk DO and SNR ..................................................................... 57
Figure 5.10 (a) Change of nitrogen components in batch test with low DO effluent .................... 63
Figure 5.10 (b) Change of nitrogen components in batch test with high DO effluent ................... 63
Figure 6.1 Picture of denitrification reactor with developed biofilm ............................................. 69
Figure 6.2 Effect of HRT ............................................................................................................... 71
Figure 6.3 Effluent NO2-N concentration vs. reactor pH ............................................................... 73
Figure 6.4 SDNR and buffer consumption .................................................................................... 74
Figure 6.5 Increase of SDNR after each scouring ......................................................................... 75
Figure 6.6 Accumulated solids mass from membrane scouring .................................................... 76
Figure 6.7 Relationship between inert fraction and SDNR............................................................ 79
Figure 6.8 Microscopic picture of new and covered membrane fiber with inorganic precipitants.
....................................................................................................................................................... 80
Figure 6.9 Inert fraction vs. Ca and P from sloughed-off solids .................................................... 81
Figure 6.10 Reactor configurations ................................................................................................ 86
Figure 6.11 Relationship between SDNR and incoming DO (a), reactor DO (b) .......................... 88
Figure 6.12 SDNR with temperature change ................................................................................. 92
Figure 7.1 Configuration for consecutive operation ...................................................................... 95
Figure 7.2 Nitrification reactor performance ................................................................................. 99
Figure 7.3 Change of NH4-N and NOx-N concentrations during batch test................................. 103
Figure 7.4 NOx-N concentrations and performance of the denitrification reactor ....................... 104
Figure 7.5 NOx-N concentration and SDNR from failed denitrification reactor ......................... 112
Figure 7.6 Picture of the denitrification reactor in a floated state ................................................ 113
Figure 7.7 Total suspended solids (TSS) and volatile suspended solids (VSS) concentrations in
the effluent from the denitrification reactor ................................................................................. 116
Figure 7.8 Theoretical biomass generation based on stoichiometry and nitrogen removal rate .. 117
Figure 7.9 Theoretical biomass generation and discharged biomass from the denitrifying reactor
(nitrogen sparging started on day 70) .......................................................................................... 119
Figure 7.10 Biofilm thickness in the denitrification reactor after the initiation of periodic sparging
..................................................................................................................................................... 122
Figure 7.11 Reactor configurations .............................................................................................. 128
Figure 7.12 DO concentrations entering and inside the denitrification reactor ........................... 129
Figure 7.13 Relationship between measured reactor DO and SNDR .......................................... 130
Figure 7.14 Change of HRT ......................................................................................................... 136
Figure 7.15 Nitrification reactor performance ............................................................................. 137
Figure 7.16 Denitrification reactor performance as affected by increasing load ......................... 137
Figure 7.17 Relationship between specific loading rate and SNR, SDNR .................................. 138

Table of Tables
Table 2.1 Comparison of MBfR operated for ammonia and organic carbon removal ................... 22
Table 2.2 Summary of hydrogenotrophic in MBfR ....................................................................... 24
Table 4.1 Physical characteristics of two types of membranes used ............................................. 37
Table 4.2 Membrane details ........................................................................................................... 38
Table 4.3 Influent composition for the nitrification reactor ........................................................... 39
Table 4.4 Influent composition for the denitrification reactor ....................................................... 39
Table 5.1 Summary of operational conditions ............................................................................... 51
Table 5.2. Definitions and values in Equation (5.6) ...................................................................... 61
Table 5.3 Results from nitrification batch tests ............................................................................. 62
Table 6.1 Influent composition for denitrification reactor ............................................................. 70
Table 6.2 DO entering and DO inside the reactor and SDNR ....................................................... 87
Table 6.3 Effect of temperature on hydrogenotrophic denitrification ........................................... 92
Table 7.1 Performance comparison of previous nitrification studies with this work .................. 101
Table 7.2 Performance comparison of previous denitrification studies with this work ............... 105
Table 7.3 Equations for estimating biomass generation .............................................................. 118
Table 7.4 Comparison of various reported biofilm thickness in MBfR with this study .............. 123
Table 8.1 Cost comparison table .................................................................................................. 152

ABBREVIATION
BAF Biological aerated filters CSTR Continuous stirred tank reactor DO Dissolved Oxygen
F/M food to microorganisms
HRT Hydraulic retention time ICP-OES Inductively coupled plasma – Optical emission spectrometry IFAS Integrated fixed film activated sludge
LOT Limit of Treatment
MBBR Moving bed biofilm reactors MBfR Membrane biofilm reactor
PMP Polymethylpentene
PP Polypropylene PVA Polyvinyl alcohol SDNR Specific denitrification rate (g N/m2d) SNR Specific nitrification rate (g N/m2d) SS Suspended solids TN Total nitrogen TP Total phosphorous VSS Volatile suspended solids

1 | P a g e
Jong Hyuk Hwang, Ph.D. Thesis
EXECUTIVE SUMMARY
Membrane biofilm reactors (MBfR) utilize membrane fibers for bubble-less
transfer of gas by diffusion and provide a surface for biofilm development. Nitrogen
removal was attempted using MBfR in various configurations - nitrification,
denitrification and consecutive nitrification and denitrification.
Effects of loading rate and dissolved oxygen on nitrification performance were
primarily investigated in a stand-alone nitrifying MBfR. Specific nitrification rate
increased linearly with specific loading rate, up to the load of 3.5 g N/m2d. Beyond
that load, substrate diffusion limitation inhibited further increase of specific
nitrification rate. 100% oxygen utilization was achievable under limited oxygen
supply condition.
Effects of mineral precipitation, dissolved oxygen and temperature on
hydrogenotrophic denitrification were investigated in a stand-alone denitrifying MBfR.
Mineral precipitation, caused by intended pH control, caused the deterioration of
denitrification performance by inhibiting the diffusion of hydrogen and nitrate.
Operating reactor in various dissolved oxygen conditions showed that the
denitrification performance was not affected by dissolved oxygen in MBfR. Optimum
temperature of the hydrogenotrophic denitrification system was around 28 °C.
Total nitrogen removal in a two-step MBfR system incorporating sequential
nitrification and hydrogen-driven autotrophic denitrification was investigated in order
to achieve nitrogen removal by autotrophic bacteria alone. Long-term stable operation,
which proved difficult in previous studies due to excessive biofilm accumulation in
autotrophic denitrification systems, was attempted by biofilm control. Average

2 | P a g e
Jong Hyuk Hwang, Ph.D. Thesis
specific nitrification rate of 1.87 g N/m2d was achieved and the performance was very
stable throughout the experimental periods over 200 days. Performance of autotrophic
denitrification was maintained stably throughout the experimental periods, however
biofilm control by nitrogen sparging was required for process stability. The average
specific denitrification rate increased from 1.50 g N/m2d to 1.92 g N/m2d with
nitrogen sparging, over 190 days thus demonstrating the feasibility of stable long-term
operation. Biofilm thickness was also stably maintained at an average of 270 µm by
the gas sparging biofilm control. Maximum achievable nitrogen removal rate in
consecutive operation turned out to be 6 g N/m2d.
According to the cost analysis of denitrifying MBfR, hydrogenotrophic
denitrification can be an economical tertiary treatment option compared to
conventional denitrifying filter although its economic feasibility highly depends on the
cost of hydrogen gas.
Although this study was conducted in a lab-scale, the findings from this study can
be a valuable stepping stone for larger scale application and open the door for system
modifications in future.
3 | P a g e
Jong Hyuk Hwang, Ph.D. Thesis
1. INTRODUCTION
1.1 Importance of nitrogen removal
The importance of removing nutrients from the effluent of wastewater treatment
plants is continually emphasized by researchers and regulators, as increasingly severe
problems such as eutrophication or hypoxia of lakes, reservoirs, estuaries and the near-
shore ocean are forcing environmental regulators to impose more stringent effluent
requirements on total nitrogen (TN) and total phosphorus (TP) (Toet et al., 2005;
Jeong et al., 2006; Jung et al., 2006; Zhang et al., 2008).
In North America, the limit of treatment technology (LOT) concept has been
defined as the lowest economically achievable effluent quality, which for TN is < 1.5 -
3 mg/L and TP is < 0.07 mg/L. These concentrations are becoming the targets in
fragile eco-regions such as Gulf Dead Zone, Chesapeake Bay, and Las Vegas in North
America. There is a drive towards combining existing biological nutrient removal
process trains with additional new biological or chemical unit operations to meet these
effluent limits (Oleszkiewicz and Barnard, 2006).
The most common forms of nitrogen in wastewater are ammonia (NH3),
ammonium ion (NH4-N), nitrogen gas (N2), nitrite (NO2-N), nitrate (NO3-N), and
organic nitrogen. Municipal wastewater primarily contains ammonium (60%) and
organic nitrogen (40%). Nitrogen can be removed by physical, chemical or biological
means in wastewater treatment streams. However, biological removal of nitrogen is

4 | P a g e
Jong Hyuk Hwang, Ph.D. Thesis
considered as the most economical and applicable way. Nitrogen removal can be
either an integral part of the biological treatment system or an add-on process to an
existing treatment plant (Metcalf and Eddy, 2003). This study is intended to remove
nitrogen by the means of an add-on process.
1.2 Nitrification and hydrogenotrophic denitrification
Biological nitrogen removal usually occurs in two steps. The first step is
nitrification, in which ammonium ion (NH4-N) is oxidized to nitrate (NO3-N) or nitrite
(NO2-N). This is followed by denitrification, a process which converts nitrate (NO3-N)
or nitrite (NO2-N) to nitrogen gas (Metcalf and Eddy, 2003).
1.2.1 Nitrification
Nitrification is a two-step process involving two groups of aerobic autotrophic
bacteria. In the first stage (Equation 1-1), NH4-N is oxidized to NO2-N by autotrophic
bacteria, including Nitrosomonas, Nitrosococcus, Nitrosospira, Nitrosolobus and
Nitrosorobrio (Painter, 1970). In the second stage (Equation 1-2), NO2-N is oxidized
to NO3-N by autotrophic bacteria, including Nitrobacter, Nitrococcus, Nitrospira,
Nitrospina and Nitroeystis (Painter, 1970). Abundance and activity of specific

5 | P a g e
Jong Hyuk Hwang, Ph.D. Thesis
autotrophic bacteria shown above differ from the environmental situation such as DO,
pH and temperature (Daebel, 2007).
The following stoichiometric relationships have been proposed for autotrophic
nitrification.
2NH4+ + 3O2 → 2NO2
- + 2H2O + 4H+ (Equation 1-1)
2NO2- + O2 → 2NO3
- (Equation 1-2)
NH4+ + 1.863O2 + 0.098CO2
→ 0.0196C5H7NO2 + 0.98NO3- + 0.941 H2O + 1.98H+
(Equation 1-3)
According to the above stoichiometric equations, for each g of ammonia nitrogen
(as N) converted, 4.25 g of O2 are utilized, 0.16 g of new cells are formed, 7.07 g of
alkalinity as CaCO3 is removed (only when oxidizing ammonia to nitrite), and 0.08 g
of inorganic carbon is utilized in the formation of new cells.
1.2.2 Hydrogenotrophic denitrification
Biological denitrification is a microbial process that converts nitrate or nitrite to
nitrogen gas. Denitrifiers can be divided into two types, heterotrophs and autotrophs,
based on type of their carbon source needed for growth.

6 | P a g e
Jong Hyuk Hwang, Ph.D. Thesis
Heterotrophic denitrification requires organic substrates for biomass growth and
development. There are a wide range of heterotrophic denitrifiers, which include:
Achromobacter, Acinetobacter, Agrobacterium, Alcaligenes, Bacillus and
Chromobacterium. The process has been applied in conventional wastewater
treatment for decades (WEF and ASCE, 2006). In heterotrophic denitrification,
bacteria use nitrate as the terminal electron acceptor and an organic carbon as the
electron donor in their respiratory processes in the absence of oxygen or under limited
DO concentrations. Usually, an external carbon source such as methanol, ethanol or
starch is being used to enhance denitrification due to lack of sufficient carbon source
in wastewater. Denitrification stoichiometry with methanol, the most common carbon
source used as electron donor, is shown in Equation 1-4 (Metcalf and Eddy, 2003).
5CH3OH + 6NO3- → 3N2 + 5CO2 + 7H2O + 6OH- (Equation 1-4)
Major disadvantages of heterotrophic denitrification include the cost of adding
external carbon source (which might contribute significantly to the overall operating
cost of the plant), high biomass yield, and possible toxicity to final effluent, requiring
further treatment (MacAdam and Judd, 2006). Alternative carbon sources such as
industrial wastewater could help to alleviate the cost impact; however the toxicity of
residual carbon or the costs associated with higher biomass yield, (compared to
autotrophic growth) remain to be resolved (Mansell and Schroeder, 2002).

7 | P a g e
Jong Hyuk Hwang, Ph.D. Thesis
Autotrophic denitrification on the other hand requires inorganic carbon such as
carbon dioxide or bicarbonate as a carbon source, and inorganic compounds, such as
hydrogen (Kurt et al., 1987), thiosulfate (Claus and Kutzner, 1985), sulfide
(Kleerebezem and Mendeza, 2002) and sulfur stone (Flere and Zhang, 1999) as
electron donors. One of the major advantages of autotrophic over heterotrophic
denitrification is low biomass production. Among autotrophic denitrification
processes, hydrogenotrophic denitrification refers to the process that utilizes hydrogen
as an electron donor, which would be better than sulfur which yields sulphuric acid
into the effluent stream.
Advantages of using hydrogen over other electron donors for autotrophic
denitrification include (1) its low solubility in water (1.6 mg/L at 20 °C and 1 atm); (2)
the residual hydrogen that remains in water is harmless and does not interfere with
subsequent treatment (Rittman and Huck, 1989); (3) only inorganic carbon is used and,
therefore, there are no organic residues for further treatment; (4) reaction by-products
are harmless (Water Environment Research Federation, 2003). Therefore, the need for
further treatment, required for other options, could be eliminated. However, the low
solubility of H2 in water can be a drawback as well, hindering the access to hydrogen
by autotrophic denitrifiers. The explosive nature of hydrogen during use,
transportation and storage should be considered as well. Therefore, an efficient and
safe way of delivering hydrogen (minimizing the wastage of hydrogen) needs to be
established to make this alternative competitive.

8 | P a g e
Jong Hyuk Hwang, Ph.D. Thesis
The following stoichiometric relationship has been proposed for hydrogenotrophic
denitrification, which reduces nitrate to nitrite and subsequently to nitrogen gas (Kurt
et al., 1987). Equation 1-7 shows the overall reaction including cell synthesis.
2NO3- + 2H2 → 2NO2
- + 2H2O (Equation 1-5)
2NO2- + 3H2 → N2 + 2H2O + 2OH- (Equation 1-6)
NO3- + H+ + 2.86H2 +0.15CO2 → 0.0286C5H7NO2 + 0.49N2 + 3.14H2O
(Equation 1-7)
According to above equations, 0.41 g of hydrogen gas is required to reduce 1 g of
nitrate to nitrogen gas, while the reduction of nitrite to nitrogen gas generates 3.57 g of
alkalinity as CaCO3 per 1 g NO3-N reduced. The subsequent increase in pH can cause
inorganic precipitation and affect the denitrification performance, which will be
discussed in Chapter 6.1.
1.3 Membrane biofilm reactor
Membrane bioreactor (MBR) technology, involving membranes for solid-liquid
separation, has experienced several breakthroughs over the past 30 years to become
one of the major technologies for wastewater treatment. Beside these most well

9 | P a g e
Jong Hyuk Hwang, Ph.D. Thesis
known applications of membrane in wastewater treatment, there are technologies that
are intended to utilize membranes as biofilm supports, rather than solid-liquid
separators.
Different mechanisms of pollutants removal can be achieved in membrane-attached
biofilm systems, which can be classified below and shown in Figure 1.1 with
concentration profiles.
- Membrane biofilm reactors (MBfR) refer to the systems with biofilm growing
on top of the membrane fiber, where the pressurized gas diffuses through the
membrane lumen, in order to provide the bacteria with the components needed to
oxidize or reduce the soluble constituents present outside the membrane lumen. Air,
oxygen, hydrogen or methane, have been used as the process gas depending on the
treatment objectives.
- Extractive membrane bioreactors refer to systems in which the contaminated
liquid flows inside of the membrane fiber and only selective contaminants are
transported through the membrane for biodegradation on the membrane surface or in
bulk solution (Brookes & Livingston (1994) and Freitas dos Santos et al. (1997)).
- Membrane biofilters refer to systems in which a waste gas diffuses through the
membrane lumen and is biologically removed by the biofilm growing on the
membrane surface (Parvatiyar et al. (1996) and Reij et al. (1996)).
In this study a membrane-attached biofilm system (MBfR) will be implemented for
nitrogen removal in tertiary wastewater treatment.

10 | P a g e
Jong Hyuk Hwang, Ph.D. Thesis
Figure 1.1 Comparison of pollutants removal mechanisms in membrane-attached
biofilm system
The concept of using membranes for gas diffusion has started during the late-1980s
and early-1990s (Essila et al., 2000). Membranes can be used as a means of just
transferring gas or they can be used as means of both supplying gas and supporting
biological growth. By transferring gas through membrane fibers, the biomass attached
to the membrane surface can effectively access the process of gas. Hollow fiber
membranes are particularly attractive because they can provide a large specific surface
area for bacterial attachments.
MBfR became the focus of research as they (1) provide efficient, bubble-less gas
delivery, (2) provide extensive surface area for biofilm attachment and growth, (3)
allow for extended solids retention times and high biomass concentration within the
biofilm, (4) enable high volumetric removal rates, and (5) require a relatively small
reactor footprint.
Membrane Biofilm Reactor
Lumen Biofilm Bulk liquid
Extractive Membrane
Bioreactor Membrane Biofilter
Lumen Biofilm Bulk liquid Lumen Biofilm Bulk liquid
Distance
Concentration
Gas Contaminants
Contaminants in liquid
O2
O2
Contaminants in liquid
Medium Medium Medium
11 | P a g e
Jong Hyuk Hwang, Ph.D. Thesis
MBfR has an advantage of reducing the overall reactor volume. Usually, 50-60% of
reactor volume is occupied by the support medium in conventional biofilm reactors,
such as trickling filters, rotating biological contactors, biological aerated filters and
submerged aerated filters (Goncalves et al., 1996, Fdz-Polanco et al., 1994).
Meanwhile, MBfR occupy only 1-2% of this volume for treating similar substrate
loadings (Brindle et al., 1998).
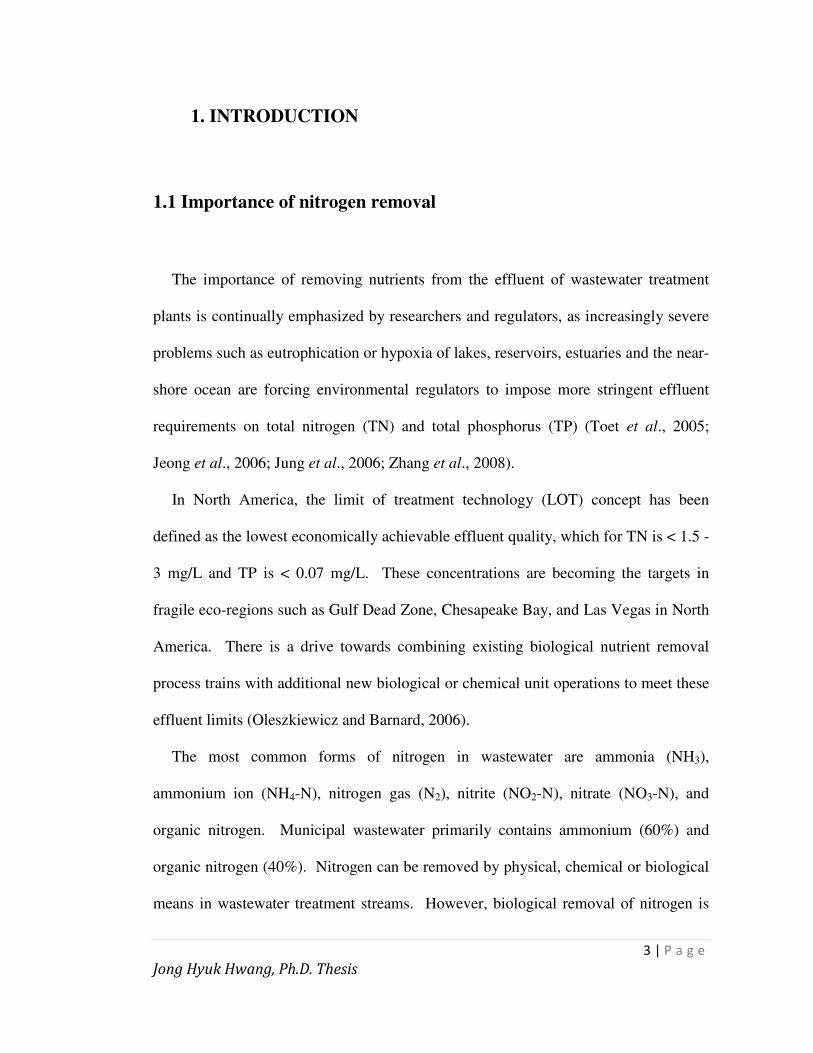
In a conventional biofilm application, both substrate and gas are abundant at the
side of the bulk liquid; therefore anoxic/anaerobic conditions may be induced deep
inside of biofilm. However, in MBfRs, the gas concentration will be highest and
substrate concentration will be lowest at the surface of the membrane. Figure 1.2
shows the difference of substrate and gas profiles in conventional biofilm systems as
compared to MBfR.
Figure 1.2 Comparison between MBfR and conventional biofilm system
Support Biofilm Bulk liquid
Conventional biofilm system
Gas
Medium
Contaminants
Distance
Concentration
Membrane Biofilm Reactor
Lumen Biofilm Bulk liquid
Contaminants
Gas

12 | P a g e
Jong Hyuk Hwang, Ph.D. Thesis
2. LITERATURE REVIEW
This chapter includes the literature review regarding MBfRs and its application for
nitrogen removal.
A database of a 102 research papers published in peer-reviewed international
journals between 1984 and 2008 was analyzed. The literature database was partially
based on the references of a recent review paper (Syron and Casey, 2008), and also
supported by search results from online databases including Web of Science,
ScienceDirect, and PubMed. Extensive literature review regarding MBfR applications
for nitrogen removal was done in terms of reactor configuration and performance.
2.1 Chronology and geographical distribution of MBfR studies
Figure 2.1 shows the chronological distribution of the number of peer-reviewed
journal articles involving studies on MBfR. A linear increase of research papers over
the years can be observed, even though there were only a small number of papers in
1997 and 1998, mainly due to a limited pool of researchers. The overall number of
papers in early periods tends to fluctuate depending on the activity of individual
researchers, becoming more consistent after 2000, when more research groups started
to study MBfR.

13 | P a g e
Jong Hyuk Hwang, Ph.D. Thesis
Figure 2.1 Chronological distribution of peer-reviewed journal articles
Geographically, research studies were conducted in 14 countries: Australia, Canada,
China, Denmark, France, Germany, Japan, Korea, Sweden, Switzerland, Taiwan,
Thailand, UK and USA; i.e. there was at least one peer-reviewed journal paper from
each country. More than three quarters of research projects were conducted in the UK,
USA and Japan.
Figure 2.2 shows the regional and historical distributions of published papers.
Researchers from Asia, Europe and North America account for 24, 29, and 49 peer-
reviewed journal articles, respectively. Most papers before 2000 originated from
Europe, as it was where this technology was initiated. Although countries like USA,
UK and Japan keep publishing papers consistently, more countries, especially in Asia,
(particularly China and Korea) started to conduct MBfR studies after 2000, and this is
0
2
4
6
8
10
12
14
1980 1985 1990 1995 2000 2005 2010
Nu
mb
er
of
pa
pe
rs
Year

14 | P a g e
Jong Hyuk Hwang, Ph.D. Thesis
why the number of papers from Asia has increased substantially after 2000. The trend
of regional distribution from Figure 2-2 is interestingly similar to the trend that can be
found in membrane bioreactors (MBRs) (Yang et al., 2006).
Figure 2.2 Regional distribution of peer-reviewed journal articles
2.2 Classification by research areas
All 102 journal articles were categorized into four main research areas as shown in
Figure 2.3.
2.2.1 Literature and critical reviews – Category I
0
10
20
30
40
50
Asia Europe North America
Nu
mb
er
of
Pap
ers
After 2000 Before 2000

15 | P a g e
Jong Hyuk Hwang, Ph.D. Thesis
There were 5 literature and critical reviews. Research progress of aerated MBfR,
where oxygen or air was supplied through the membrane fiber was reviewed in three
papers (Brindle and Stephenson, 1996; Casey et al., 1999; Syron and Casey, 2008).
MBfR with hydrogen addition were reviewed relatively recently (Rittmann et al., 2004;
2006).
2.2.2 Fundamental aspects including modeling – Category II
There were 38 papers on the fundamental aspects of MBfR. Initially, oxygen
transfer through membrane lumen without biofilm attachment was studied. Research
at that time focused on the feasibility of supplying oxygen and the measurement of
oxygen transfer rate through membrane fibers. Rapid increase of oxygen
concentration in a sequencing batch reactor (SBR) system could be achieved by using
silicone tubing where pure oxygen was pressurized (Wilderer et al., 1985). Oxygen
mass transfer in silicone rubber hollow fibers (Cote et al., 1989) and individually-
sealed hollow fiber membranes (Ahmed et al., 1992) was also investigated. Once the
biofilm growth on the membrane fiber was observed, studies began to evaluate its
potential and its applicability to various cases (See Category III). Wilderer (1995)
suggested that membrane oxygenation and biofilm SBR technology can be favourably
combined to treat wastewater which contain volatile organics, organics in low
concentration or organics which are degraded only by selected, slow growing
microorganisms.

16 | P a g e
Jong Hyuk Hwang, Ph.D. Thesis
Figure 2.3 Distribution of research topics (Category I: literature and critical
reviews; Category II : fundamental aspects including modeling; Category III-1:
organic removal and simultaneous nitrification (including heterotrophic
denitrification); Category III-2: nitrification only; Category III-3: autotrophic
denitrification only; Category III-4 : total nitrogen removal with autotrophic
bacteria only; Category IV: other applications)
Many papers focused on the investigation of diffusion characteristics of gas or
substrate and biofilm stratification by experiments or by modeling. It was shown by
Casey et al. (1999), that greater thicknesses of active biomass can be maintained in
MBfR compared to conventional biofilm reactors. However, some modeling results
showed that even though the performance of MBfR was superior to that of
conventional biofilm systems, when the biofilm thickness was in the range of 450 µm
- 1400 µm, the efficiency deteriorated with a further increase in biofilm thickness
0
10
20
30
40
I II III-1 III-2 III-3 III-4 IV
Nu
mb
er
of
Pap
ers
After 2000
Before 2000

17 | P a g e
Jong Hyuk Hwang, Ph.D. Thesis
(Terada et al., 2007). A modeling study also showed that there were substantial
differences in substrate and oxygen concentration and activity profiles between MBfR
and conventional biofilm systems (Essila et al. 2000). Models predicted that the
oxygen flux can drop to zero resulting in anaerobic conditions at the external regions
of the biofilm, which may facilitate simultaneous nitrification and denitrification
(Semmens and Essila, 2001).
Another modeling study by Matsumoto et al. (2005) showed that even nitrifiers
would be stratified in MBfR, suggesting that ammonia oxidizing bacteria (AOB) and
specific nitrite oxidizing bacteria (NOB) dominated the oxic part of biofilm (at the
surface of membrane fiber), while NOB were abundant at the oxic-anoxic interface.
Cole et al. (2004) analyzed changes in biomass density, respiratory activity, and
bacterial community structure as functions of biofilm depth. Biomass density was
generally highest near the membrane surface where the gas is supplied and declined
with distance from the membrane, while respiratory activity was highest in the middle
of the biofilm.
Community analysis demonstrated substantial stratification of the community
structure across the biofilm. Surface-modified hollow fiber membranes to enhance the
bacterial adhesivity for partial nitrification was tested and showed that the amount of
attached nitrifiers on surface-modified fiber was 3 times greater than those on
unmodified fiber surfaces (Tarada et al., 2004). FISH analysis proved that ammonia-
oxidizing bacteria were located near the surface of membrane, whereas other bacteria
were located throughout the biofilm thickness (Terada et al., 2006). The thickness of
18 | P a g e
Jong Hyuk Hwang, Ph.D. Thesis
biofilm attached to the membrane surface was reported to be 1600 µm; however
oxygen was capable of penetrating only about 300 to 700 µm from the surface of
membrane, according to measurements using a microelectrode. A study with flat-sheet
membranes showed the difference of oxygen transfer in upstream and downstream
sections of the membrane due to biofilm growth, suggesting that reactor configuration
may have a significant influence on oxygen transfer rates (Shanahan and Semmens,
2006).
2.2.3 Applications for nitrogen removal – Category III
Category III includes research articles mainly focusing on applications and case
studies using MBfR. Since many papers reviewed here fall into this category, it was
divided into 4 sub categories, as shown in Figure 2-3, (3-1) organic removal and
nitrification simultaneously (including heterotrophic denitrification); (3-2) only
nitrification; (3-3) only autotrophic denitrification using hydrogen; (3-4) total nitrogen
removal with only autotrophic bacteria. Overall, there were 38 papers (16, 6, 11 and 5
for each sub-category, respectively).
1) Category III-1: organic removal and simultaneous nitrification (including
heterotrophic denitrification
The papers in this sub-category dealt with the heterotrophic activity for organic
removal and denitrification, and/or simultaneous nitrification. Combined

19 | P a g e
Jong Hyuk Hwang, Ph.D. Thesis
heterotrophic oxidation of organics, denitrification and nitrification in MBfR could be
successfully achieved in several studies (Timberlake et al., 1988; Satoh et al., 2004).
A gas-permeable flat sheet membrane with a surface area of 585cm2 for the biofilm
support was tested for combined aerobic heterotrophic oxidation, nitrification and
denitrification (Timberlake et al., 1988). Pure oxygen was supplied through the
membrane and the outer solution was sparged with nitrogen gas to keep the bulk
solution anoxic. The efficiency of organic and nitrogen removal turned out to be 47 %
and 21 % respectively, and only 50-75 % of nitrification was achieved. Even though
the performance of this study was inferior to subsequent studies, it showed that
combined aerobic heterotrophic oxidation, nitrification and denitrification can occur in
MBfR. The potential of microporous hollow fiber membrane for oxygen transfer was
investigated (Ahmed et al., 1992), suggesting that bubble-less transfer of oxygen and
100% transfer efficiency could be achieved.
7.6 kg/m3d of COD removal could be achieved with a hydraulic retention time as
low as 36 min, (Pankhania et al., 1994) with 280 µm diameter polypropylene based,
dead-end hollow fibers, although a daily backwash was necessary to prevent
channelling. Although some simultaneous nitrification and denitrification (SND) was
detected, backwashing also resulted in the deterioration of nitrification by reducing the
biomass retention time and denitrification by removing thick biomass which was
potentially anoxic.
1.9 g/m2d of specific nitrification rate could be achieved during simultaneous
organic carbon removal and nitrification (Yamigawa et al., 1998) with attached
biofilm in a fibrous support woven around hollow membrane fibers. Denitrification

20 | P a g e
Jong Hyuk Hwang, Ph.D. Thesis
was minimal in this study since the concentration of dissolved oxygen was kept above
2 mg/L. Nitrification and denitrification in a single reactor by adding two membrane
modules, supplying oxygen for nitrification and methanol for heterotrophic
denitrification was attempted, showing effective coexistence of nitrifier and denitrifier
cultures in a single tank (Chang et al., 1999). Semmens et al. (2003) tried to control
biofilm growth by an internal gas recycle; however, the performance could not be
sustained due to the excess biofilm accumulation, emphasizing the importance of
biofilm thickness control.
Recently a hybrid system utilizing biofilm on the membrane fibers for nitrification
and suspended biomass for organic removal and denitrification was tested (Downing
and Nerenberg, 2007). Since nitrifiers existed in the biofilm, the system could be
operated with low SRT (5 days). Maximum 75 % of total nitrogen removal, 80 % of
nitrification with a specific nitrification rate of 0.85 g/m2d and 99 % of BOD removal
could be achieved. Biological phosphorus removal was also attempted using
nitrifying biofilm in MBfR and denitrifying polyphosphate-accumulating organisms
(DNPAOs) in a bulk solution (Terada et al., 2006). A sequencing batch reactor was
operated including an anaerobic period for phosphorous release and a subsequent
membrane aeration period for nitrification and phosphorous uptake, resulting in 96%
of total nitrogen removal and 90% of total phosphorus removal.
2) Category III-2 : nitrification only
The papers in this sub-category dealt with the application of MBfR for only
nitrification. Relatively small number of studies was conducted for nitrification only
21 | P a g e
Jong Hyuk Hwang, Ph.D. Thesis
(Brindle et al., 1988; Suzuki et al., 2000), because many researchers intended to
achieve simultaneous removal of organics or denitrification. Brindle et al. reported
that complete nitrification could be achieved throughout the experiment with average
98 % of nitrification efficiency, while backwashing was not conducted as excessive
biomass growth was not observed (Brindle et al., 1998). A maximum nitrification rate
of 0.98 kg NH4-N/m3d was achieved, which corresponded to a specific nitrification rate
of 5.4 g NH4-N/m2d. Up to 100 % of oxygen uptake rates could be achieved as the
oxygen supply balanced out with the oxygen amount used by the nitrifiers. Cell
immobilization techniques were also tested for nitrification purposes in an MBfR
system (Hsieh et al., 2002).
Table 2.1 summarizes the operating parameters and results from previous
nitrification only or both organic removal and nitrification studies in MBfR. Systems
operated with pure oxygen tended to have higher specific nitrification rates (average
SNR of 3.7 g N/m2d) than those with air (average SNR of 1.3 g N/m2d), although only
small number of data was compared. Table 2.1 also includes the nitrification results
from consecutive nitrification and denitrification, which will be discussed later.
3) Category III-3 : autotrophic denitrification only
The papers in this sub-category deal with the application of MBfR in autotrophic
denitrification using hydrogen. The ability to efficiently deliver hydrogen through
membrane fibers, combined with low sludge yield of autotrophic growth, makes
autotrophic denitrification in MBfR an interesting alternative over conventional
heterotrophic denitrification.

22 | P a g e
Jong Hyuk Hwang, Ph.D. Thesis
Do
wn
ing
et
al.
(20
06
)
C +
N
Syn
thetic
12
0
20
99
75
Air
Ho
llow
F
ibe
r
0.1
3
6
3.2
5
-
0.8
5
10
0
Co
wm
an
et
al.
(20
05
)
N
Syn
thetic
- 50
-
ove
r 9
0
Pu
re
oxyg
en
Ho
llow
F
ibe
r
-
1.5
0.0
1
- - 7
Ta
ble
2.1
Co
mp
ari
son
of
MB
fR o
per
ate
d f
or
am
mo
nia
an
d o
rga
nic
ca
rbo
n r
emo
va
l
Sh
in
et
al.
(20
05
)
N
Syn
thetic
-
10
0
-
ove
r 9
5
Air
Ho
llow
F
ibe
r
0.1
3
6
0.0
75
-
1.4
3
26
0
Te
rad
a
et
al.
(20
03
)
C +
N
syn
the
tic
45
00
40
00
96
83
Air
Ho
llow
F
ibe
r
0.0
075
36
0
0.1
5
5.7
6
4.4
8
35
0
Se
mm
en
s
et
al.
(20
03
)
C +
N
Syn
thetic
40
0
90
ove
r 9
5
ove
r 9
0
Air
Ho
llow
F
ibe
r
2.8
2
6
6.6
8
3.6
0.7
67
19
0
Ya
ma
giw
a
et
al.
(19
94
)
C +
N
Syn
thetic
20
0
41
ove
r 9
5
ove
r 9
0
Air
Fib
er
+
su
ppo
rt
0.0
56
12
1.6
3
6.3
2
90
Bri
nd
le
et
al.
(19
98
)
N
Syn
thetic
- 50
-
ove
r 9
5
Pu
re
oxyg
en
Ho
llow
F
ibe
r
0.0
78
4
0.4
3
-
5.4
18
0
Pa
nkha
nia
e
t a
l.
(19
94
)
C +
N
Syn
theti
c
29
0
50
60
76
Pu
re
oxyg
en
Ho
llow
F
ibe
r
0.6
87
2.1
3
1.3
45
3.8
4
0.8
4
15
0
Tim
be
rlake
et
al.
(19
88
)
C +
N
Actu
al
90
50
47
21
Pu
re
oxyg
en
Fla
t S
he
et
0.0
585
25
3.1
5
4.2
8
1.9
2
42
Ta
rge
t
Influe
nt
typ
e
Influe
nt
CO
D o
r T
OC
(m
g/L
)
Influe
nt
nitro
ge
n (
mg
/L)
Org
an
ic r
em
oval (%
)
Nitro
ge
n r
em
ova
l (%
)
Oxyg
en
sou
rce
Me
mb
ran
e t
yp
e
Su
rfa
ce
are
a (
m2)
HR
T (
h)
Re
acto
r volu
me
(L
)
Sp
ecific
re
mo
val ra
te f
or
org
an
ics (
g C
OD
/m2d
)
Sp
ecific
Nitri
fication
Ra
te fo
r n
itro
ge
n (
g N
/m2d
)
Exp
erim
enta
l p
erio
d (
da
ys)

23 | P a g e
Jong Hyuk Hwang, Ph.D. Thesis
Studies regarding this sub-category started to appear after the year 2000.
Application to nitrate removal from contaminated drinking water showed promise
over conventional denitrification (Lee and Rittmann, 2000). Up to 2.2 g N/m2d of
specific denitrification rate could be obtained, however stable operation of reactor
could not be achieved due to excessive biomass growth (Ergas et al., 2001).
Carbon dioxide could be added to neutralize the alkalinity generated in
denitrification in order to inhibit nitrite accumulation (Ho et al., 2001). However, the
effect of pH on autotrophic denitrification is still unclear (Lee and Rittmann, 2003,
Rezania et al., 2005). High rate of denitrification (5.38 g N/m2d) could be achieved;
however the duration of reactor operation (6 days) was not long enough to judge the
system performance.
Performance deterioration by mineral precipitation is another operational concern
and biofilm control is required to maintain reactor performance (Celmer et al., 2008).
Celmer et al. (2006) found that biofilm density rather than thickness was the
determining factor in substrate diffusion and biofilm sloughing in an MBfR system
operated under limited hydrogen supply condition. Celmer et al. (2008) also
evaluated the impact of different shearing strategies, including mixing and nitrogen
sparging to scour off the excessive biomass in MBfR. As high as 0.93 g N/m2d of
specific denitrification rate could be achieved using nitrogen sparging reducing to
maintain the biofilm thickness below 500 µm.
Terada et al. reported that immobilized hydrogenotrophic bacteria in fibrous slag
could achieve higher denitrification rate than other studies when hydrogen was
supplied in excess (Terada et al., 2006). Over supply of hydrogen also allowed
24 | P a g e
Jong Hyuk Hwang, Ph.D. Thesis
autotrophic sulfate reducing bacteria to grow. Therefore, the significance of hydrogen
pressure control for suppressing the occurrence of sulfate reducing bacteria was
emphasized.
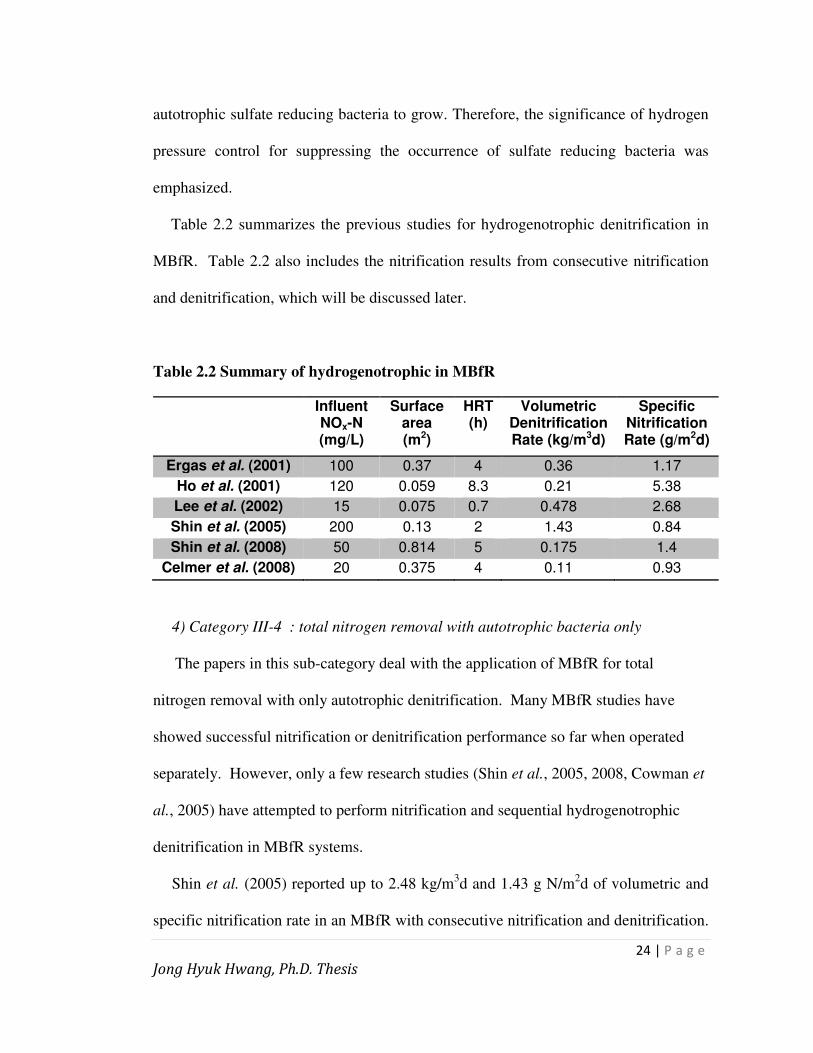
Table 2.2 summarizes the previous studies for hydrogenotrophic denitrification in
MBfR. Table 2.2 also includes the nitrification results from consecutive nitrification
and denitrification, which will be discussed later.
Table 2.2 Summary of hydrogenotrophic in MBfR
Influent NOx-N (mg/L)
Surface area (m2)
HRT (h)
Volumetric Denitrification Rate (kg/m3d)
Specific Nitrification Rate (g/m2d)
Ergas et al. (2001) 100 0.37 4 0.36 1.17
Ho et al. (2001) 120 0.059 8.3 0.21 5.38
Lee et al. (2002) 15 0.075 0.7 0.478 2.68
Shin et al. (2005) 200 0.13 2 1.43 0.84
Shin et al. (2008) 50 0.814 5 0.175 1.4
Celmer et al. (2008) 20 0.375 4 0.11 0.93
4) Category III-4 : total nitrogen removal with autotrophic bacteria only
The papers in this sub-category deal with the application of MBfR for total
nitrogen removal with only autotrophic denitrification. Many MBfR studies have
showed successful nitrification or denitrification performance so far when operated
separately. However, only a few research studies (Shin et al., 2005, 2008, Cowman et
al., 2005) have attempted to perform nitrification and sequential hydrogenotrophic
denitrification in MBfR systems.
Shin et al. (2005) reported up to 2.48 kg/m3d and 1.43 g N/m2d of volumetric and
specific nitrification rate in an MBfR with consecutive nitrification and denitrification.

25 | P a g e
Jong Hyuk Hwang, Ph.D. Thesis
Nitrification could be accomplished almost completely even in low DO conditions of
0.6 mg/L. Slight denitrification in nitrification reactor, which might be induced by the
heterotrophic activity outside of the biofilm, was also reported in the nitrification
reactor. Although up to 1.33 g N/m2d of specific denitrification rate could be achieved,
denitrification efficiency was reduced at pH higher than 8.3. They reported even
higher specific nitrification and denitrification rate up to 2.06 g N/m2d and 1.72 g
N/m2d, respectively, in their CSTR (continuous stirred tank reactor) (Shin et al., 2008).
However, excessive biofilm growth in the denitrification reactor was observed,
leading to manual cleaning at a frequency of 3 times during their 300 days of
operation.
Cowman et al. tested several different O2 pressures in order to determine the
optimal gas pressure in nitrifying and denitrifying MBfRs (Cowman et al., 2005).
Nitrification was greatly inhibited at low O2 pressure, due to the limited O2 supply for
nitrification, causing carry-over of un-oxidized NH4-N to the following denitrification
reactor and final effluent. Meanwhile, nitrate concentration in the final effluent
increased when the O2 pressure was raised, which resulted in the carry-over of excess
dissolved oxygen to the denitrification reactor, emphasizing the need of proper control
of O2 pressure in this type of configuration.
Although some studies showed the potential of consecutive nitrification and
hydrogenotrophic denitrification in MBfR, the accomplishments so far have been
focused on mainly reactor performance with little in-depth information. The impact of
the nitrification reactor on the following denitrification reactor did not get much
attention so far, even though there were controversial results about the role of

26 | P a g e
Jong Hyuk Hwang, Ph.D. Thesis
dissolved oxygen in autotrophic denitrification (Ho et al., 2002; Cowman et al., 2005).
Carried-over components from the nitrification reactor such as NH4-N or washed-out
biomass would also affect the performance of the subsequent autotrophic
denitrification reactor, which differentiates this option from stand-alone reactor
operations.
2.2.4 Other applications – Category IV
19 papers focused on the applications of removing contaminants other than nitrogen.
Oxidation of contaminants such as xylene (Debus et al., 1994) and trichloroethylene
(Clapp et al., 1999; Edstrom et al., 2005), was investigated in MBfR. Limited or
partial aeration with MBfR could be applied to other biological system such as
anaerobic bioreactors (Kappel et al., 2005), and anaerobic ammonium (Annamox)
oxidation (Gong et al., 2008).
Hydrogen-based MBfR is capable of reducing many oxidized pollutants such as
perchlorate (Nerenberg et al., 2002), arsenate (Chung and Rittmann, 2006), selenate
(Chung et al., 2006), and hexavalent chromium (Chung et al., 2006), which are
difficult to remove in conventional biological processes.

27 | P a g e
Jong Hyuk Hwang, Ph.D. Thesis
2.3 Research needs
2.3.1 Biofilm control
Many researchers identified biofilm control as the most challenging aspect of
operating an MBfR (Pankhania et al., 1994, Semmens et al., 2003; Celmer et al.,
2006). Excessive biofilm growth will not only cause non-uniform flow distribution
and channelling, but also the inhibition of substrate or gas diffusion, eventually
deteriorating the system performance. Some past studies suffered from biofilm
overgrowth, which prevented long-term steady operation. Excessive biofilm growth
tends to be more often found in the application for organic removal, which requires
heterotrophic growth. Higher biomass yields of heterotrophic bacteria, combined with
high performance of MBfR, contribute the excessive biofilm growth (Semmens et al.,
2003).
To ensure stable operation, the detachment or sloughing of biomass needs to be
balanced with biomass accumulation. Daily backwashing, which consists of
compressed air scouring and the complete replacement of the bulk liquid to remove
the detached biomass, was required to prevent channelling and remove excessive
biomass in MBfR, at a COD loading of 8.94 kg/m3d (Pankhania et al., 1994). The
absence of backwashing for 6 days resulted in extensive biofilm growth and
performance deterioration. Air scouring, coupled with bulk liquid replacement was
beneficial, causing the increase of biofilm density and its adherence to the membrane

28 | P a g e
Jong Hyuk Hwang, Ph.D. Thesis
surface (Pankhania et al., 1999, Brindle et al., 1999). MBfR system with 5.1 kg
COD/m3d loading (lower than 8.94 kg COD/m3d from above, Semmens et al., 2003)
and generous gas recycle (2 L/min) to mix the reactor and control biofilm, was able to
maintain its performance for 3 months of operation. However, eventually the
excessive biofilm growth inhibited the oxygen transfer and resulted in the
development of anaerobic biomass. Increase in biofilm thickness also reduced the
effective hydraulic retention time (HRT), resulting in the deterioration of reactor
performance.
Excessive biofilm growth was also found in MBfR for nitrogen removal without
organic oxidation, mainly due to overgrowth of heterotrophic denitrifiers, growing at
the outer side of biofilm (Suzuki et al., 2000). Interestingly, no excessive biofilm
growth was reported in only nitrifying MBfR.
Hydrogen-based MBfR is vulnerable to mineral accumulation due to high local pH
generated by high denitrification activity, as well as biomass overgrowth due to higher
cell yield than nitrification. Calcium ions present in water and wastewater could
precipitate with some anions, such as phosphate or carbonate, both of which are
commonly used during the operation of MBfR for pH control or inorganic carbon
supply (Lee and Rittmann, 2003).
Precipitated minerals associated with the biofilm could create a VS/TS ratio of
biofilm lower than 0.25, indicating that the biofilm is carrying unnecessary solids
(Celmer et al., 2006). Increased shear force including faster mixing and nitrogen
sparging could reduce the biofilm thickness, and then ensure higher performance

29 | P a g e
Jong Hyuk Hwang, Ph.D. Thesis
(Celmer et al., 2008a). Ultrasound was also proven to be effective for biofilm control
without damaging the membrane itself (Celmer et al., 2008b). Excessive biofilm
growth was also found during perchlorate removal using hydrogen (Padhye et al.,
2007).
2.3.2 Pilot- or full- scale operations
This sub-chapter addresses the general research needs for MBfR. Pilot- or full-
scale operation of MBfRs was beyond the objectives of this thesis. Unfortunately,
none of the journal papers reported the successful application of MBfR at
demonstration or full-scale so far. Reactor sizes of lab-scale studies vary from 0.2 – 7
L, and most researchers used only one membrane module, while a large number of
membrane modules would be implemented at demonstration or full-scale.
Considering the short history of MBfR, it would be premature to expect full-scale
MBfR applications. However, a few simulation studies have been conducted to
foresee whether MBfR can be a promising alternative to previous technologies.
Thanks to higher biomass concentrations and efficient gas delivery, preliminary
economic analysis reported that MBfR with pure oxygen would require less electricity
for oxidation of designated amount of organics than conventional activated sludge
systems or high purity oxygen activated sludge system (Syron and Casey, 2008).
Very recently, pilot-scale results started to appear backed by promising lab-scale
application results. A 120 L active volume, pilot scale hybrid MBfR for nitrification

30 | P a g e
Jong Hyuk Hwang, Ph.D. Thesis
in the biofilm, and denitrification in the bulk liquid, was reported to achieve
comparable performance as other full scale, attached growth nitrifying systems, such
as IFAS (Integrated fixed film activated sludge). However, the reported nitrification
rates were lower (0.35 g N/m2d) in the pilot-scale system than those from bench scale
study (up to 2 g N/m2d), possibly due to challenges in biofilm control (Downing et al.,
2008). Biofilm control, which was widely reported as the main barrier to sustainable
operation in laboratory scale experiments, would be expected to be more difficult in
pilot- or full-scale systems, where more membrane modules are needed and higher
packing densities can be expected. Although this study focused on lab-scale
experiments, further studies should be conducted to assess whether MBfR can become
a technically and commercially viable alternative to existing technologies. Pilot scale
test by Applied Process Technology, Inc. also reported the problems related to biofilm
overgrowth and mineral precipitation, as well as initial capital cost (Rittmann, 2007).
Studies of reactor design considering biofilm control, membrane packing ratio and
membrane replacement are an essential prerequisite for implementing MBfR in larger
scale.
2.4 Objective of this research
Nitrification and autotrophic denitrification with hydrogen in MBfR were
investigated in this study. Although heterotrophic denitrification can be performed
simultaneously with nitrification in MBfR, depending on the DO and organic supply,

31 | P a g e
Jong Hyuk Hwang, Ph.D. Thesis
autotrophic denitrification was chosen due to its advantages explained previously. The
drawbacks of hydrogenotrophic denitrification, previously mentioned, can be
overcome in MBfR.
Objectives of this research were 1) to demonstrate feasibility of a stable and long-
term operation of MBfRs for consecutive nitrification and autotrophic denitrification, 2)
to investigate the effect of operational parameters such as DO, loading rate, temperature
and mineral precipitation in separate operation or in a consecutive operation, 3) discuss
the engineering challenges and perspectives of such a process.

32 | P a g e
Jong Hyuk Hwang, Ph.D. Thesis
3. GENERAL OBJECTIVES OF RESEARCH
The research comprised experimental preparation, operation of nitrification reactor,
operation of denitrification reactor and operation of consecutive nitrification and
denitrification reactors. Detailed timeframe of the studies undertaken is shown in
Figure 3.1.1. Preparation in Figure 3.1.1 indicates the period when membranes were
tested to decide their feasibility or applicability for nitrification. Feasibility for the
transfer of hydrogen gas for autotrophic denitrification had been confirmed before by
Celmer (2009). Two experimental objectives, the effect of loading rate and dissolved
oxygen, were investigated during the operation of a stand-alone nitrifying MBfR after
proper acclimation of biofilm. During the operation of the stand-alone denitrifying
MBfR, the effect of mineral precipitation and temperature was investigated.
Acclimation of denitrifying biofilm was frequently required to provide the working
biofilm for consecutive nitrification and denitrification reactor, as the denitrification
reactor stopped working due to improper control of biofilm overgrowth. During the
operation of nitrification and subsequent denitrification reactor, which is the major
part of this research, three research objectives were investigated including the effect of
dissolved oxygen, loading rate and biofilm control. Since many previous research
studies on MBfR have failed due to lack of appropriate biofilm control, this study
pursued the proper biofilm control to achieve long-term stable operation of an MBfR
system for total nitrogen removal by only autotrophic bacteria. Detailed research
objectives, results and discussions during 27 months of experiments will be provided
in following chapters.

33 | P a g e
Jong Hyuk Hwang, Ph.D. Thesis
Fig
ure
3.1
Tim
efra
me
of
wh
ole
ex
per
imen
ts
2009
5
Tem
p.
Loadin
g
Acc
li.,
A a
nd
Acc
lim
atio
n m
ean
th
e b
iofi
lm a
ccli
mat
ion
fo
r su
bse
qu
ent
rese
arch
ob
ject
ives
. A
ccli
. :
two
nit
rifi
cati
on
rea
cto
rs w
ere
accl
imat
ed f
or
sep
arat
e an
d c
on
secu
tiv
e n
it-d
en.
op
erat
ion
s.
Acc
lim
atio
n :
th
ree
den
itri
fica
tio
n r
eact
ors
wer
e p
rep
ared
on
e b
y o
ne
for
sep
arat
e an
d c
on
secu
tiv
e n
it-d
en.
op
erat
ion
.
4
3
DO
Bio
film
Co
ntr
ol
2
1
2008
1 2
1 1
1 0
Acclim
ation
9
DO
8
7
Loadin
g
6
5
DO
4
3
2
1
Accli.
2007
1 2
pH
1 1
1 0
PM
P t
est
9
Pre
cip
itation 8
7
6
PP
test 5
4
3
2 A
1
Year
Month
PR
EP
AR
AT
ION
NIT
RIF
ICA
TIO
N
DE
NIT
RIF
ICA
TIO
N
NIT
RIF
ICA
TIO
N -
D
EN
ITR
IFIC
AT
ION

34 | P a g e
Jong Hyuk Hwang, Ph.D. Thesis
4. MATERIALS AND METHODS
This chapter describes the reactor configurations, membrane specification, influent
characteristics and general outline of whole experiments performed for this study.
Detailed materials and methods will be provided later in corresponding chapters about
experimental results and discussions.
4.1 Reactor configurations
Two types of reactors were used, one modified 0.5 L graduate cylinder and the
other custom cylindrical reactor, made by the technicians in Department of
Biosystems, University of Manitoba.
Figure 4.1 shows the dimensions of 0.5 L modified polypropylene graduated
cylinder. Total volume of the reactor is 580 mL and reactor volume to effluent outlet
port is 555 mL. The true working volume when the membrane is submerged in the
reactor is 500 mL (over 55 mL is occupied by membrane fibers and membrane
module). Since there is not enough space for a magnetic bar at the bottom of the
cylinder, internal recirculation was employed to provide reactor mixing. The liquid
was taken from the bottom of the reactor and then recycled with the rate of, at least, 5
times of influent flow rate. The bottom end of the membrane module just is placed on
the reactor bottom and the upper-end is fixed by a rubber cap. This type of reactor
was used for nitrification since December, 2007.

35 | P a g e
Jong Hyuk Hwang, Ph.D. Thesis
Figure 4.1 Dimensions for 0.5 L modified polypropylene graduated cylinder
Custom cylindrical reactors were manufactured in January, 2007 by the technicians
in Department of Biosystems, University of Manitoba. Four reactors were made with
acrylic glass and their detailed dimensions are shown in Figure 4.2. Total volume of
the reactors was 2.01 L and reactor volume to effluent outlet port was 1.65 L. True
working volume when the membrane was submerged in the reactor was 1.595L.
There were three holes on the top of the reactors for gas input to the membrane
module and the other two holes for pH or DO probe. Spacing between two membrane
supports (28 cm) is slightly shorter than membrane fiber length (30 cm) to provide
free movement of membrane fibers. A thin glass plate was placed on the bottom of
the inside of reactor to prevent the plastic surface from wearing out by magnetic bar.
Effluent
Port
Influent
Port
4.6cm
35cm
33.5cm
1cm
Recirculation 27cm

36 | P a g e
Jong Hyuk Hwang, Ph.D. Thesis
Mechanical mixing by magnetic bar was provided for mixing. This type of reactor was
used for nitrification and denitrification studies from March, 2007.
Figure 4.2 Dimensions for 1.6 L custom made reactor
4.2 Membrane characteristics
Membranes were provided by GE Water & Process Technologies (former ZENON
Membrane Solutions) for research purpose. Two types of membrane, PP
(Polypropylene) and PMP (Polymethylpentene), were used for the experiments. Gas
transfer would occur only by diffusion due to non-porous characteristics of the
membrane. Physical characteristics of membrane materials were shown in Table 4.1.
8.1cm
39cm 28cm
12cm
4cm
Influent Port
Effluent
Port Membrane
support
Membrane
support
Port for pH
or DO probe

37 | P a g e
Jong Hyuk Hwang, Ph.D. Thesis
PP membrane had robustness but low diffusivity of gas, while the PMP membrane
was weak but was able to deliver much more gas through the membrane fibers.
Table 4.1 Physical characteristics of two types of membranes used
PP PMP
Tensile Strength (MPa) 220 25.5
Elongation at break (%) 50 15
Diffusivity (mol/m·s·KPa)
H2 13.48 Not available
O2 0.76 8.93
N2 0.13 2.24
CO2 2.70 31.52
The PP membrane modules were initially tested for nitrification and denitrification.
The nitrification study using PP membrane modules was performed from February,
2007 to June 2007, but was not successful due to its inability to deliver oxygen
(experimental results were shown in Chapter 5.1). Therefore, only PMP membrane
modules were used for nitrification studies after July, 2007 when PMP membrane was
first provided from GE.
The PP membrane was used for denitrification at the beginning of the experiment
with the objective of investigating the effect of inorganic precipitation on
hydrogenotrophic denitrification in MBfR. Although the experimental objective could
be achieved, the specific denitrification rate was not comparable to other previous
studies, due to low H2 delivery rates. PP membrane modules were discarded in

38 | P a g e
Jong Hyuk Hwang, Ph.D. Thesis
December, 2007 and only PMP membrane modules were used for denitrification
studies. Table 4.2 provides the details of membranes used for experiments.
Table 4.2 Membrane details
PP PMP
Outer diameter (µm) 60 80
Wall thickness (µm) 12 12
Fiber length (cm) 34.7 30
Number of fiber per Tow 48 48
Number of Tow 42 42
Surface area (m2) 0.114 0.152
Specific surface area (m2/m3) 67000 50000
4.3 Influent characteristics
Different types of synthetic wastewater were used for nitrification and
denitrification, as they need different form of nitrogen as a substrate. Synthetic
wastewater representing non-nitrified secondary effluent from municipal wastewater
treatment plants was fed into the bottom of the nitrification reactors or consecutive
nitrification and denitrification reactors, and its composition throughout the whole
experiments is shown in Table 4.3. Any changes from this composition for specific
tests were addressed in respective chapters describing experimental results. Nitrogen
concentration for nitrification was 34 mg N/L with sufficient alkalinity provided for
complete nitrification. The concentration of each constituent was decided based on
the literature and modified considering the influent nitrogen concentration (Head et al.
2004, Shin et al. 2005, Lee et al. 2003).

39 | P a g e
Jong Hyuk Hwang, Ph.D. Thesis
Table 4.3 Influent composition for the nitrification reactor
Chemical Constituent Concentration (mg/L)
NH4Cl 130 (34 as N)
NaHCO3 600
Na2CO3 100
MgSO4·7H2O 12.5
ZnSO4·7H2O 1.25
CaCl2·2H2O 4
MnSO4·H2O 5
CoCl2·6H2O 0.3
FeSO4·7H2O 2
CuSO4 0.1
Na2MoO4·2H2O 0.35
KCl 7
K2HPO4 7.4
Table 4.4 Influent composition for the denitrification reactor
Chemical Constituent Concentration (mg/L)
NaNO3 200 (33 as N)
NaHCO3 300
MgSO4·7H2O 12.5
ZnSO4·7H2O 1.25
CaCl2·2H2O 4
MnSO4·H2O 5
CoCl2·6H2O 0.3
FeSO4·7H2O 2
CuSO4 0.1
Na2MoO4·2H2O 0.35
KCl 7
K2HPO4 7.4
For stand-alone denitrification reactor operation, synthetic wastewater (See Table
4.4 for its composition), representing nitrified secondary effluent from municipal
wastewater treatment plants or groundwater, was used as feed. Since tap water was
used to prepare the feed, the actual concentration of minerals might be higher than

40 | P a g e
Jong Hyuk Hwang, Ph.D. Thesis
shown in Table 4.3 and 4.4. Stand-alone denitrification reactors were operated in
order to investigate the effect of inorganic mineral precipitation and of the temperature
on the performance of hydrogenotrophic denitrification in MBfR, as well as to prepare
denitrifying biofilm for consecutive nitrification and denitrification.
All influent and effluent samples were filtered through a 0.45 µm glass-fiber filter
before daily water quality analysis. Alkalinity (Standard Methods, APHA, 1998) and
pH were measured. NH4-N, NO3-N and NO2-N were also analyzed daily by flow
injection analysis (LACHAT Quickchem 8500). DO inside the reactor was measured
using a DO selective electrode (Hach SensION378). Suspended solids (SS) and
volatile suspended solids (VSS) in the effluent were also measured twice a week
(Standard Methods, APHA, 1998). Reactors were operated at room temperature, thus
temperature inside of reactors was maintained at 20±1°C throughout the experimental
period unless specific tests on temperature effects where conducted in environmental
chambers.
4.4 Reactor operations
As addressed in Chapter 4.1, two types of reactors were used for this study.
Hollow fiber membrane modules were submerged in the center of the reactors.
Influent was fed into the bottom part of the reactor and the effluent was overflowed
from the top part of the reactor. Necessary gas (Air or O2 or H2) was introduced to the
top of the dead-end configuration membrane module. Air was used as an oxygen

Jong Hyuk Hwang, Ph.D.
source for the nitrification reactor in
for nitrification due to oxygen transfer issue
membrane fibers for denitrification. The configurations of reactor operation for two
types of reactors were shown in Figure
PP membrane and 2.5 psi in PMP membrane.
configurations for specific experiments
Investigation of specific goals, which will be addressed later, was conducted after
steady state operation with
biofilm.
Figure 4.3 Reactor configurations
Jong Hyuk Hwang, Ph.D. Thesis
nitrification reactor in the early stages, but just pure oxygen
for nitrification due to oxygen transfer issues. H2 was fed into the lumen of
for denitrification. The configurations of reactor operation for two
types of reactors were shown in Figure 4.3. Applied gas pressure was up to 5 p
PP membrane and 2.5 psi in PMP membrane. Any modification to the
for specific experiments will be discussed later in respective
Investigation of specific goals, which will be addressed later, was conducted after
with separate reactors was achieved to ensure the acclimation of
.3 Reactor configurations for two types of reactors
41 | P a g e
pure oxygen was used
was fed into the lumen of the
for denitrification. The configurations of reactor operation for two
Applied gas pressure was up to 5 psi in
reactor
respective chapters.
Investigation of specific goals, which will be addressed later, was conducted after
achieved to ensure the acclimation of
for two types of reactors

42 | P a g e
Jong Hyuk Hwang, Ph.D. Thesis
5. STAND-ALONE NITRIFICATION REACTOR
This chapter includes all the experimental results and discussion from the operation
of stand-alone nitrification reactors. It also includes the membrane tests for the
applicability to nitrification.
5.1 Membrane feasibility test for nitrification
Membranes, provided by GE Water & Process Technologies, required testing for
their feasibility for nitrification, as they had never been tested for nitrification before.
The PP membrane module, which was initially provided for denitrification, was tested
for nitrification starting February, 2007. Figure 5.1 shows the pictures of these
reactors before seeding and after seeding.
Since feasibility of nitrification was not confirmed in PP membrane, lower loadings
were attempted at the beginning. Two reactors with HRT of 7 hr and 12 hr were
operated for approximately 4 months. NH4-N concentration of incoming synthetic
wastewater ranged from 10 mg N/L to 20 mg N/L. Initially, air was supplied as an
oxygen source for nitrification. Gas pressure was 5 psi and DO concentration in the
bulk was around 0.5 mg/L. Figure 5.2 shows the specific nitrification rates (SNR)
from two reactors. SNR was calculated based on the NH4-N concentration difference
between influent and effluent, flowrates and provided surface area of membrane fibers
for biofilm development.

43 | P a g e
Jong Hyuk Hwang, Ph.D. Thesis
SNR = ((������ (������� ��������
������� ���� Equation (5.1)
Average SNRs were 0.12 g N/m2d from HRT 7 hr reactor and 0.123 g N/m2d from
HRT 12 hr reactor, showing no difference. Over 0.3 g N/m2d at Day 30 was possible
due to the leak of air. Moreover, SNRs from these two reactor operations were far
below those reported in previous similar studies (Brindle et al., 1998; Shin et al., 2005;
Terada et al., 2006).
Figure 5.1 Pictures of the nitrification reactor before seeding (left) and after
seeding (right)
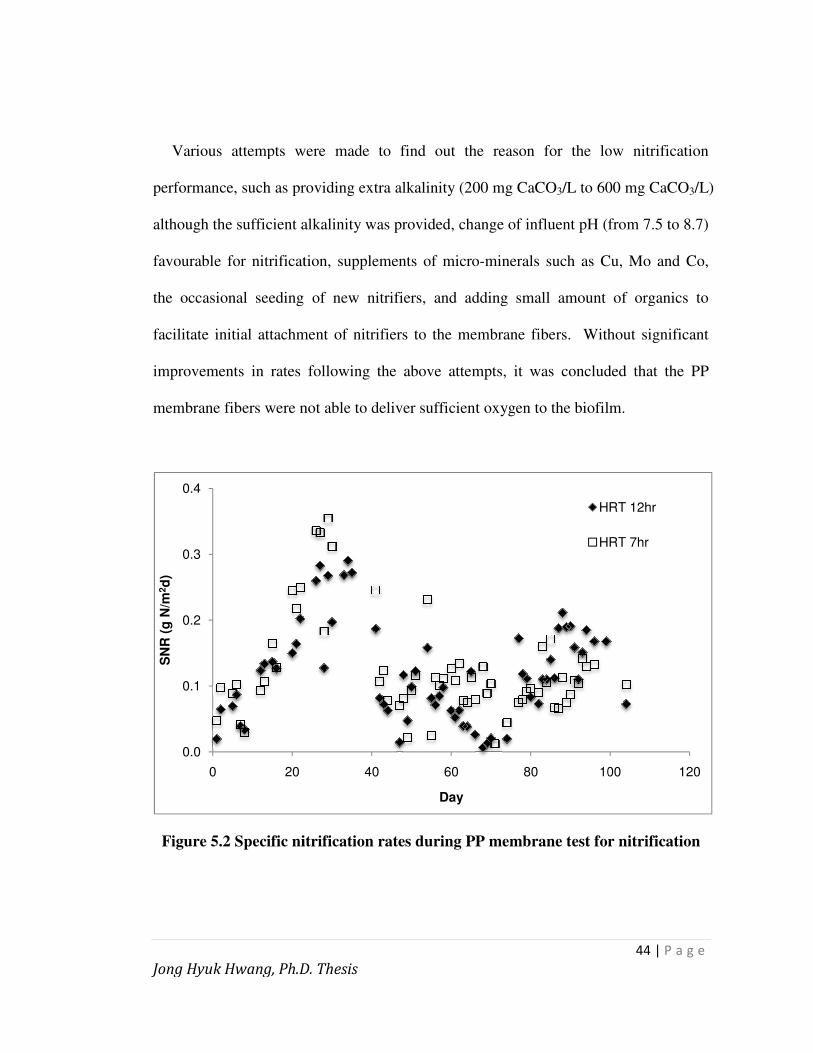
Jong Hyuk Hwang, Ph.D.
Various attempts were
performance, such as providing
although the sufficient alkalinity was provided
favourable for nitrification, supplements of micro
the occasional seeding of new nitrifiers, and adding s
facilitate initial attachment of nitrifier
improvements in rates following the
membrane fibers were not able to deliver
Figure 5.2 Specific nitrification rates during PP membrane test for ni
0.0
0.1
0.2
0.3
0.4
0 20
SN
R (
g N
/m2d
)
Jong Hyuk Hwang, Ph.D. Thesis
Various attempts were made to find out the reason for the low nitrification
performance, such as providing extra alkalinity (200 mg CaCO3/L to 600 mg CaCO
although the sufficient alkalinity was provided, change of influent pH (from 7.5 to 8.7)
favourable for nitrification, supplements of micro-minerals such as Cu, Mo and Co,
the occasional seeding of new nitrifiers, and adding small amount of organics to
attachment of nitrifiers to the membrane fibers. Without significant
improvements in rates following the above attempts, it was concluded that
not able to deliver sufficient oxygen to the biofilm
Specific nitrification rates during PP membrane test for ni
40 60 80 100
Day
HRT 12hr
HRT 7hr
44 | P a g e
low nitrification
/L to 600 mg CaCO3/L)
influent pH (from 7.5 to 8.7)
minerals such as Cu, Mo and Co,
amount of organics to
Without significant
above attempts, it was concluded that the PP
o the biofilm.
Specific nitrification rates during PP membrane test for nitrification
100 120
HRT 12hr
HRT 7hr

Jong Hyuk Hwang, Ph.D.
After communicating with
problems with nitrification
PMP fibers for nitrification.
membranes began after July, 2007. Figure
test.
SNR of 0.2 g N/m2d, which was higher than SNR by PP membrane before, was
easily achieved in PMP membrane
improve nitrification pe
air from the top of the membrane module. Therefore, the oxygen source was changed
from air to pure oxygen
Figure 5.3 Specific nitrification rate
0.0
0.2
0.4
0.6
0.8
1.0
1.2
0 10
SN
R (
g N
/m2d
)
Jong Hyuk Hwang, Ph.D. Thesis
After communicating with GE Water & Process Technologies regarding
problems with nitrification, it was decided to test a new membrane module
for nitrification. The nitrification tests using newly manufactured
n after July, 2007. Figure 5.3 shows SNR from the PMP membrane
d, which was higher than SNR by PP membrane before, was
easily achieved in PMP membrane within 20 days of operation. Further attempt to
improve nitrification performance by increasing the air supply failed due to the leak of
membrane module. Therefore, the oxygen source was changed
from air to pure oxygen starting day 26, as shown in Figure 5.3.
Specific nitrification rate during PMP membrane test for nitrification
20 30 40 50
Day
45 | P a g e
Water & Process Technologies regarding the
module made with
newly manufactured PMP
PMP membrane
d, which was higher than SNR by PP membrane before, was
in 20 days of operation. Further attempt to
rformance by increasing the air supply failed due to the leak of
membrane module. Therefore, the oxygen source was changed
during PMP membrane test for nitrification
50 60

46 | P a g e
Jong Hyuk Hwang, Ph.D. Thesis
Following the introduction of the pure oxygen, SNR increased up to over 0.8 g
N/m2d during an additional 30 days of operation. Although up to 1 g N/m2d of SNR
could be achieved, the membrane had to be replaced due to a leak, which was assumed
to be caused by the testing of higher flowrate with air. Although SNR with PP
membrane was not measured with pure oxygen supply, it would be expected to go up
to 0.6 g N/m2d, as the average was 0.12 g N/m2d with air. And PMP membrane was
able to achieve higher than 0.6 g N/m2d with pure oxygen supply.
PMP membrane tests confirmed that low nitrification rate from PP membrane was
caused by membrane material rather than experimental problems, and PMP
membranes would be appropriate for the nitrification studies.
5.2 Acclimation of nitrification for future use
After preparing additional PMP membrane module for testing, one nitrifying
reactor (0.5 L reactor volume) was prepared for future use as the first part of
consecutive operation. This reactor was operated at an HRT of 1.4 hr for 4 months
from December, 2007 to March, 2008, prior to the connection to a denitrification
reactor. Shorter HRT than Chapter 5.1 was chosen because higher performance was
confirmed with PMP membrane and pure oxygen supply. Figure 5.4 shows the picture
of nitrification reactor with PMP membrane.
Figure 5.5 shows NH4-N concentration of influent and effluent, and SNR. Influent
NH4-N concentration was varied from 27 mg N/L to 50 mg N/L in early 30 days to

47 | P a g e
Jong Hyuk Hwang, Ph.D. Thesis
find out optimal influent concentration for experimental purposes and was set to 32
mg N/L after 35 days of operation. Seeding of biomass was performed only once at
the beginning of the experiment.
As shown in Figure 5.5, it took 40 days for biofilm development and system
stabilization, and the reactor was stably working afterwards. Deterioration of
performance due to excessive biomass growth or major detachment of biomass was
not observed.
Figure 5.4 Pictures of the nitrification reactor (PMP)
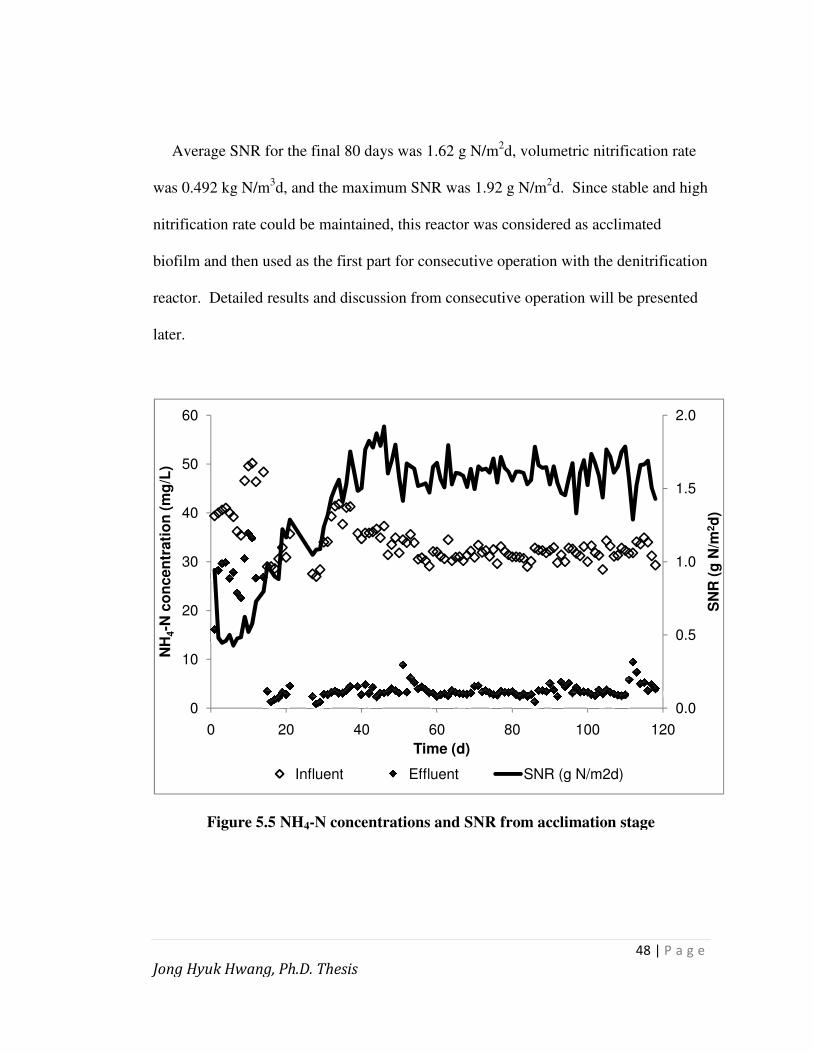
Jong Hyuk Hwang, Ph.D.
Average SNR for the
was 0.492 kg N/m3d, and the maximum SNR was 1.92 g N/m
nitrification rate could be maintained, this reactor was considered as acclimated
biofilm and then used as the first part f
reactor. Detailed results and discussion from consecutive operation will be
later.
Figure 5.5 NH4
0
10
20
30
40
50
60
0 20
NH
4-N
co
ncen
trati
on
(m
g/L
)
Influent
Jong Hyuk Hwang, Ph.D. Thesis
the final 80 days was 1.62 g N/m2d, volumetric nitrification rate
d, and the maximum SNR was 1.92 g N/m2d. Since stable and high
nitrification rate could be maintained, this reactor was considered as acclimated
d then used as the first part for consecutive operation with the denitrification
. Detailed results and discussion from consecutive operation will be
4-N concentrations and SNR from acclimation stage
40 60 80 100
Time (d)
Influent Effluent SNR (g N/m2d)
48 | P a g e
volumetric nitrification rate
Since stable and high
nitrification rate could be maintained, this reactor was considered as acclimated
with the denitrification
. Detailed results and discussion from consecutive operation will be presented
N concentrations and SNR from acclimation stage
0.0
0.5
1.0
1.5
2.0
120S
NR
(g
N/m
2d
)
SNR (g N/m2d)
49 | P a g e
Jong Hyuk Hwang, Ph.D. Thesis
5.3 Effect of ammonia loading rate on nitrification
5.3.1 Objectives
In this study, the effect of ammonia loading rate on the nitrification efficiency in
MBfR was investigated under oxygen-excess conditions, in order to select the
optimum loading rate.
5.3.2 Materials and methods
The working volume, excluding the head space and volume occupied by the
membrane and module, was 1.595 L. Detailed reactor configuration was provided in
Chapter 3.1. The reactor was operated under five different loading conditions by
adjusting the HRT, ranging from 1.4 hours to 3.9 hours. Each test lasted 3 weeks.
The reactor was operated for over 100 days with different ammonia loading conditions.
Synthetic wastewater was prepared, simulating non-nitrifying secondary wastewater
treatment effluent. Gas pressure was 2.5 psi. Detailed composition was shown in
Chapter 3.3. The reactor temperature was maintained at 21±1°C throughout the
experimental period.
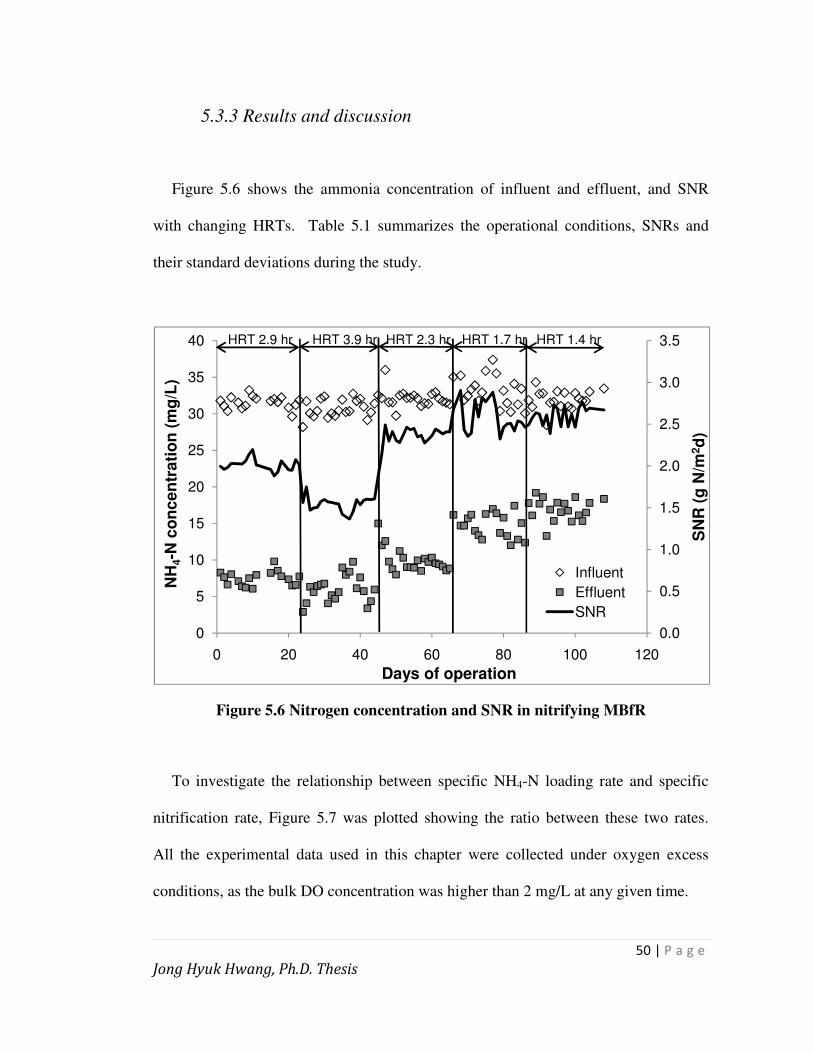
50 | P a g e
Jong Hyuk Hwang, Ph.D. Thesis
5.3.3 Results and discussion
Figure 5.6 shows the ammonia concentration of influent and effluent, and SNR
with changing HRTs. Table 5.1 summarizes the operational conditions, SNRs and
their standard deviations during the study.
Figure 5.6 Nitrogen concentration and SNR in nitrifying MBfR
To investigate the relationship between specific NH4-N loading rate and specific
nitrification rate, Figure 5.7 was plotted showing the ratio between these two rates.
All the experimental data used in this chapter were collected under oxygen excess
conditions, as the bulk DO concentration was higher than 2 mg/L at any given time.
0.0
0.5
1.0
1.5
2.0
2.5
3.0
3.5
0
5
10
15
20
25
30
35
40
0 20 40 60 80 100 120
SN
R (
g N
/m2d
)
NH
4-N
co
nc
en
tra
tio
n (
mg
/L)
Days of operation
Influent
Effluent
SNR
HRT 2.9 hr HRT 1.4 hrHRT 1.7 hrHRT 2.3 hrHRT 3.9 hr

51 | P a g e
Jong Hyuk Hwang, Ph.D. Thesis
Table 5.1 Summary of operational conditions
Averages Days HRT
Influent NH4-N
(mg/L) and
standard
deviation
Effluent NH4-N
(mg/L) and
standard
deviation
SNR (g N/m2d)
and standard
deviation
Days (1-23) 23 2.9 31.5 (0.8) 7.5 (1.0) 2.01 (0.08)
Days (24-44) 21 3.9 30.7 (1.2) 6.0 (1.8) 1.54 (0.09)
Days (45-65) 21 2.3 32.1 (1.2) 9.9 (1.6) 2.35 (0.13)
Days (66-86) 21 1.7 33.1 (2.1) 14.7 (1.7) 2.58 (0.18)
Days (87-108) 22 1.4 32.0 (1.3) 16.9 (1.5) 2.60 (0.11)
Figure 5.7 Relationship between loading rate and nitrification rate
As shown in Figure 5.7, SNR increased linearly with specific loading rate, up to
around 3.5 g N/m2d. Substrate diffusion limitation seemed to occur at loads above 3.5
40
60
80
100
1.4
1.8
2.2
2.6
3.0
1.0 2.0 3.0 4.0 5.0 6.0
Rati
o (
Rem
oval / In
pu
t) (
%)
SN
R (
g N
/m2d
)
Specific NH4-N loading rate (g N/m2d)
SNR Ratio

52 | P a g e
Jong Hyuk Hwang, Ph.D. Thesis
g N/m2d, due to the low HRT of 1.4 hours. Despite that, over 2 g NH4-N/m2d were
nitrified, which is comparable or higher than reported in previous studies (Brindle et
al., 1998, Shin et al., 2005, Cowman et al., 2005).
Figure 5.8 illustrates the role of bulk NH4-N concentration on the nitrification
efficiency in MBfR. The trend in Figure 5.8 was almost identical to that in Figure 5.7,
indicating that bulk NH4-N concentration has a linear relationship with SNR when it
was lower than 10 mg N/L.
Figure 5.8 Relationship between bulk NH4-N and SNR
Figure 5.8 demonstrates that in biofilm systems, the rate of mass transfer is linearly
related to the substrate concentration gradient, and the rate of substrate utilization can
be expressed by a saturation-type reaction (Equation (5.2), Metcalf & Eddy, 2003).
1.4
1.8
2.2
2.6
3.0
0 5 10 15 20
SN
R (
g N
/m2d
)
NH4-N concentration in bulk (mg/L)
SNR Fitting
)(32.8
)(01.4
4
4
NNH
NNHSNR
−+
−×=
93.02 =R

53 | P a g e
Jong Hyuk Hwang, Ph.D. Thesis
NNHS
NNH
SK
SkXSNR
−
−
+
×=
4
4 Equation (5.2)
The constants from the regression, based on the least-square method, were 4.01 for
kX (maximum specific substrate utilization rate × biomass concentration) and 8.32 for
Ks (half-velocity utilization coefficient). Figure 5.8 does not provide a clear fit with
the experimental data which could be attributed to the changing biofilm thickness or
density throughout the experiments.
5.3.4 Conclusions
Nitrifying MBfR was operated over 110 days. Effect of loading rate on the
nitrification efficiency was investigated. Five different loading conditions were used
by adjusting the HRT, ranging from 1.4 hours to 3.9 hours, which resulted in specific
nitrification rate (SNR), ranging from 1.54 to 2.60 g N/m2d. SNR increased linearly
with the specific loading rate, up to approximately 3.5 g N/m2d, as the rate of mass
transfer is linearly related to the bulk ammonia concentration. However, beyond that,
the substrate diffusion limitation inhibited further increase of SNR.
54 | P a g e
Jong Hyuk Hwang, Ph.D. Thesis
5.4 Effect of dissolved oxygen on nitrification
5.4.1 Introduction and specific objectives
Nitrification rates are affected by DO concentration in activated sludge systems.
For nitrification in suspended biomass, DO concentration has little impact when
exceeding 2 mg/L, but at low DO (<0.5 mg/L) inhibition effect has been shown to be
greater for Nitrobacter than for Nitrosomonas, which can cause increased NO2-N
concentration in the effluent (MetCalf and Eddy, 2003).
In conventional biofilm processes, the limitation of DO is one of the most critical
factors affecting nitrification performance (Zhang & Bishop, 1996; Lazarova et al.,
1998). This is more crucial when organic and ammonia oxidiation are simultaneously
attempted, as heterotrophs would outperform autotrophs where DO is mostly present,
and excessive oxygen supply might be required to deliver oxygen to the nitrifiers. It
was reported that liquid DO above 5 mg/L should be maintained for stable nitrification
efficiency in biofilm systems simultaneously oxidizing organic pollutants and
ammonia nitrogen (Park et al., 2008).
Substrate or oxygen transfer mechanisms in MBfR differ from those in
conventional biofilm systems. One of the advantages of nitrifying MBfR is that
nitrifers can easily utilize oxygen, with less competition from heterotrophic bacteria at
the membrane surface, where oxygen is provided. The fraction of heterotrophs would
still be higher even at the membrane surface, however the activity of nitrifiers would

55 | P a g e
Jong Hyuk Hwang, Ph.D. Thesis
be much higher than that of heterotrophs in the system removing organics and
ammonia simultaneously (Shanahan & Semmens, 2004).
In this chapter, the effect of DO concentration, focusing on very low DO levels,
was investigated. Almost 100% of oxygen utilization was possible without sacrificing
nitrification efficiency in MBfR for nitrification (Brindle et al., 1998). Nitrification
efficiency was unaffected in a low bulk DO condition, at levels as low as 0.6 mg/L
(Shin et al., 2005), and Cowman et al. (2005) reported that nitrification was greatly
inhibited by low O2 pressure of 8.6 KPa (1.25 psi), due to the limited O2 supply in the
nitrification reactor.
The effect of oxygen supply was specifically investigated in this research in order
to find out whether the nitrification would be possible under low DO conditions, as the
effluent from the nitrification reactor was intended to be used as feed in the
subsequent denitrification reactor.
5.4.2 Materials and methods
Experimental conditions were the same as in the previous Chapter 5.3 on the effect
of loading rate. Reactor was operated over 80 days with 2.9 hours HRT in various
bulk DO conditions. DO was measured using a DO selective electrode (Hach
SensION378).
5.4.3 Results and discussion

56 | P a g e
Jong Hyuk Hwang, Ph.D. Thesis
Only limited amount of oxygen was supplied during the first 6 weeks of the
experiment in order to keep DO concentration in the bulk liquid below 0.2 mg/L.
Average SNR during this period was 1.08 g N/m2d, which was lower than previous
similar studies (Brindle et al., 1998, Shin et al., 2005, Cowman et al., 2005). Low DO
concentration indicates oxygen-limited conditions for nitrifiers at the outer (bulk
liquid portion) of the biofilm, which caused low specific nitrification efficiency. As
shown in Figure 5.9, a correlation between DO and nitrification efficiency can be
observed at very low DO, ranging from 0.01 to 0.8 mg/L (oxygen-limiting conditions),
while no noticeable difference of nitrification rate in DO ranging from 0.6 to 7.1 mg/L
was observed (Shin et al., 2005).
Low DO (< 0.5 mg/L) usually results in accumulation of nitrite by inhibiting the
activity of nitrite oxidizing bacteria rather than ammonia oxidizing bacteria in
suspended growth biomass (Metcalf and Eddy, 2003). The NO2-N build-up was not
observed in this study due to the different oxygen delivery mechanisms of MBfR. It is
quite difficult to accurately determine whether the system is oxygen-limited by solely
monitoring bulk DO. Having oxygen supplied from the membrane surface, DO
concentration at the surface of membrane fiber could be higher than 3 mg/L, even
though DO was depleted at the bulk liquid (Satoh et al., 2004).

57 | P a g e
Jong Hyuk Hwang, Ph.D. Thesis
Figure 5.9 Relationship between bulk DO and SNR
During 43 to 84 days of operation, the oxygen supply was increased to achieve
higher nitrification rates, and it was still possible to maintain DO concentration at less
than 0.2 mg/L with improved SNR, which means that the oxygen uptake efficiency
was 100% up to this point, as shown in Figure 5.9. Oxygen supply was increased
further to obtain higher efficiency, however it only caused the increase of oxygen
concentration in the bulk liquid, which generated large DO distribution at the SNR
around 2 g NH4-N/m2d, as shown in Figure 5.9. High DO concentration means that
oxygen was not a limiting factor during this period, so additional oxygen supply
would not result in significantly higher nitrification efficiency. However, higher DO
concentration in the bulk liquid would promote the growth of nitrifiers at the outer
side of biofilm, where nitrifiers could not grow due to oxygen diffusion limitations
under low DO conditions. Figure 5.9 shows the slight increase of nitrification rate
R² = 0.4104
R² = 0.2069
0.0
0.5
1.0
1.5
2.0
2.5
0 2 4 6 8 10
SN
R (
g N
/m2d
)
DO (mg/L)

58 | P a g e
Jong Hyuk Hwang, Ph.D. Thesis
from 1.9 to 2.2 g N/m2d in higher bulk DO conditions, which might indicate the
presence of nitrifiers at the outer side of biofilm.
5.4.4 Conclusions
Effect of DO under limited-oxygen-supply conditions was investigated. Operating
the system with 100% oxygen utilization was achievable, however the higher oxygen
supply allowed for higher SNR due to the growth of nitrifiers at the outer side of
biofilm.
5.5 Batch nitrification tests with effluent from the nitrification reactor
5.5.1 Introduction and specific objectives
Nitrification batch tests were performed in order to confirm the growth of nitrifiers
at the outer side of biofilm when the diffusion of oxygen was limiting or sufficient.
The solids escaping into the effluent originated and detached from the outer side of
biofilm, therefore the measurement of nitrifiers from the edge of biofilm for these
batch tests can be facilitated. This batch test was intended to provide evidence to why
nitrification would be possible in the denitrification reactor when consecutive reactors
were operated.

59 | P a g e
Jong Hyuk Hwang, Ph.D. Thesis
5.5.2 Materials and methods
The fractions of nitrifiers was estimated by the high F/M (food to microorganisms)
protocol (WERF, 2003), which is usually used for the determination of maximum
specific growth rate of nitrifiers. This test is to be performed with a relatively low
concentration of nitrifying mixed liquor with spiked ammonia, which should be high
enough to provide a high F/M condition for the maximum and exponential growth of
nitrifiers. Ammonia nitrogen and alkalinity (NaHCO3) adequate for full nitrification
were added to 7 L of reactor effluent (which was collected overnight), mixed and
aerated sufficiently until full oxidation of ammonia nitrogen was measured. pH was
controlled to prevent pH drop and a nitrogen balance was checked by the analysis of
each form of nitrogen components.
Initial NH4-N concentration in the batch test was high enough (relative to the half-
saturation coefficient) to ensure that the nitrification rate is at the maximum, as
expressed in Equation (5.2).
µ = µ��� !"
#!"$ !"≈ µ��� Equation (5.2)
Since the effluent suspended solids were as low as 1 mg/L and the concentration of
initial ammonia nitrogen was at least 18 mg/L, the initial experimental conditions were
similar to the experimental condition, proposed by high F/M method.
In the beginning of the test, the nitrite/nitrate production rate would be:

60 | P a g e
Jong Hyuk Hwang, Ph.D. Thesis
& !'
&�=µ()*
+()*∙ X��� Equation (5.3)
And the change of biomass concentration, XAUT, is the result of growth and decay
of nitrifiers:
&.()*
&�= (µ��� − b��� ∙ dt Equation (5.4)
X���,� = X���,4 ∙ e6µ()*7()*8� Equation (5.5)
Combining and integrating Equation (5.3) and (5.5) would yield:
( )1)(
)(0,
0,, −×−×
×+=
− AUTAUT b
AUTAUTAUT
AUTAUT
NOxtNOx ebY
XSS
µ
µ
µ Equation (5.6)
Exponential increase of nitrite/nitrate concentration in Equation (5.6) can be
estimated by using initial nitrifier concentration (XAUT,0) and nitrifiers’ growth rates
(µAUT and bAUT).
Definitions and used values of each parameter in Equation (5.6) were shown in
Table 5.2. XAUT,0, the initial nitrifier concentration, was estimated using SNOx,t and
SNOx,0, measured from the batch tests, and YAUT, bAUT, and µAUT, assumed from the
simulation model, BIOWIN 3 (Envirosim Associates Ltd., 2008).

61 | P a g e
Jong Hyuk Hwang, Ph.D. Thesis
Table 5.2. Definitions and values in Equation (5.6)
Item Definition Value
SNOx,t oxidized nitrogen concentration at time t
(mg/L)
From water quality
analysis
SNOx,0 oxidized nitrogen concentration at time zero
(mg/L)
From water quality
analysis
YAUT nitrifier yield coefficient (unitless) 0.15
XAUT,0 nitrifier concentration at time zero (mg/L) Values to be estimated
bAUT nitrifier decay rate (/d) 0.17 @ 20°C
µAUT maximum specific nitrifier growth rate (/d) 0.9 @ 20°C
Since no seeding of microorganisms was conducted, the growth of nitrifiers in the
batch test was assumed to originate from the effluent solids, detached from the biofilm.
Tests were performed twice when the reactor was working on different DO
conditions, less than 0.1 mg/L and higher than 7 mg/L.
5.5.3 Results and discussions
Figure 5.10 (a) and 5.10 (b) show the change of nitrogen components during the
batch tests, performed using the effluents from nitrification reactor when operated
under less than 0.1 mg O2/L and higher than 7 mg O2/L, respectively.
Two graphs show similar NOx-N increase trends, except the initial NOx-N, due to
the different SNR when the effluents were taken. More than 3 days were required to
achieve full nitrification due to low initial concentration of nitrifiers. The fitted curves,
plotted in Figure 5.10 (a) and (b), were found using the initial concentration of

62 | P a g e
Jong Hyuk Hwang, Ph.D. Thesis
nitrifiers, calculated by the least-square method. Table 5.3 shows the results from
both batch tests.
Effluent SS concentration was almost the same in both cases, however twice the
amount of nitrifiers was found in the high DO case. Low bulk DO in the MBfR
indicates that most of the nitrifiers exist on the surface of the membrane where oxygen
is supplied, with decreasing population at the outer side of the biofilm. High bulk DO
suggests that nitrifiers can exist at the outer side of biofilm, where both oxygen and
substrate are abundant. Therefore, these results could explain the slightly higher SNR
with increasing DO even at O2 excess conditions as shown in Figure 5.9.
Table 5.3 Results from nitrification batch tests
DO concentration in nitrification reactor (mg/L) 0.1 7
Temperature during the test (°C) 23 24
SS in nitrification reactor effluent (mg/L) 1.7 1.72
VSS in nitrification reactor effluent (mg/L) 1.4 1.33
Nitrifier amount (mg/L) 0.094 0.19
Nitrifier fraction / SS (%) 5.5 11.0
Nitrifier fraction / VSS (%) 6.7 14.2
Even though there are no incoming organics for heterotrophic growth in the
nitrification reactor, the results indicate the existence of heterotrophic bacteria in the
effluent. Earlier studies have clearly shown that the existence of heterotrophs,
growing on nitrifier decay products in autotrophic nitrifying biofilm (Kindaichi et al.,
2004; Okabe et al., 2005; Lackner et al., 2008).

63 | P a g e
Jong Hyuk Hwang, Ph.D. Thesis
Figure 5.10 (a) Change of nitrogen components in batch test with low DO effluent
Figure 5.10 (b) Change of nitrogen components in batch test with high DO
effluent
0
5
10
15
20
25
30
35
0.0 0.5 1.0 1.5 2.0 2.5 3.0 3.5
Nit
rog
en
Co
nc
en
tra
tio
n (
mg
/L)
Day
NH4-N NOx-N
R2=0.994
0
10
20
30
40
50
60
70
0.0 0.5 1.0 1.5 2.0 2.5 3.0 3.5
Nit
rog
en
Co
nc
en
tra
tio
n (
mg
/L)
Day
NH4-N NOx-N
R2=0.990

64 | P a g e
Jong Hyuk Hwang, Ph.D. Thesis
They have shown that up to 50% of the biomass can be heterotrophic in autotrophic
biofilms without any external carbon sources through experimental and modeling
studies. Autotrophic (Ammonia-oxidizing bacteria and nitrite-oxidizing bacteria)
fraction from autotrophic biofilm varies from 5% (out of VSS, Lackner et al., 2008),
50% (out of active cell, Kindaichi et al. 2004), and 70% (out of active cell, Okabe et
al., 2005). The nitrifying bacteria fractions were found in this study ranging from 6.7%
to 14.2%. The fraction was based on volatile solids rather than on active biomass,
which was used in other studies. The results from other studies were from the biomass
throughout the biofilm, while the nitrifying bacteria fractions in this study were
measured with the effluent from the nitrification reactor, rather than the inside of the
biofilm. In membrane-aerated nitrification systems, the nitrifying bacteria are most
abundant on the surface of the membrane where the oxygen is supplied, and its
fraction decreases with biofilm depth away from the membrane surface (Shanahan et
al., 2004).
5.5.4 Conclusions
The nitrifiers’ fraction was measured to assess the existence of nitrifiers in the bulk
liquid or outer portion of the biofilm. Fraction of nitrifiers, detached from the edge of
biofilm and washed with the effluent, was twice as high when oxygen was over-
supplied, compared to oxygen-limited condition.

65 | P a g e
Jong Hyuk Hwang, Ph.D. Thesis
5.6 Summary of nitrification reactor operation
Nitrification in MBfR has been tested since February, 2007. Initial unsuccessful
nitrification performance due to inadequate selection of membrane material
(polyprophylene, PP) for the oxygen delivery led to a change of membrane material
(polymethylpentene, PMP), which eventually ensured adequate oxygen delivery.
Specific nitrification rate, comparable or higher than in other previous studies, could
be finally achieved by the implementation of PMP membranes.
Specific research objectives, investigated during the operation of nitrification
reactor, included the effect of loading rate and DO, and assessing nitrifiers’ presence
in the effluent of the reactor.
Effect of loading rate on the nitrification efficiency was investigated under five
different loading conditions by adjusting the HRT, ranging from 1.4 hours to 3.9 hours.
SNR increased linearly with specific loading rate, up to approximately 3.5 g N/m2d, as
the rate of mass transfer is linearly related to the bulk ammonia concentration.
However, beyond that, substrate diffusion limitation inhibited further increase of SNR.
Effect of DO under limited-oxygen-supply conditions was also investigated.
Operating the system with 100% oxygen utilization was achievable, however the
higher oxygen supply allowed for higher SNR due to the growth of nitrifiers at the
outer side of biofilm. Fraction of nitrifiers, detached from the edge of biofilm and
washed with the effluent, was twice as high when oxygen was over-supplied,
compared to oxygen-limited condition.

66 | P a g e
Jong Hyuk Hwang, Ph.D. Thesis
6. STAND-ALONE DENITRIFICATION
This chapter includes all the experimental results and discussion from the operation
of stand-alone denitrification reactors. Unlike the operation of nitrification reactor, the
membrane test was not required as its diffusivity of hydrogen was proven previously.
Hence, the research was initiated after one month of biofilm acclimation. According
to the timeframe in Figure 4.1.1, almost 10 months in 2008 were spent for biofilm
acclimation due to the preparation of consecutive nitrification and denitrification
reactor operations, and stand-alone denitrification operation for investigating the effect
of DO and temperature. Since one of denitrification reactor failed during the
consecutive operation, the reason of which was addressed in Chapter 7.2.3, longer
acclimation periods were required than planned.
6.1 Effect of mineral precipitation
6.1.1 Introduction and objectives
Membrane fouling mechanisms in MBfR are different from those in conventional
membrane bioreactors. In an MBfR, fouling is usually caused by the precipitation of
minerals at the membrane surface due to local changes of pH or redox potential.
Accumulation of mineral solids on the membrane surface can result in the decrease of
gas and substrate transfer rates, leading to a reduction in overall system performance
67 | P a g e
Jong Hyuk Hwang, Ph.D. Thesis
(Semmens, 2007). For a system treating chlorinated solvents in groundwater using a
hydrogen-driven MBfR, iron sulfide was reported to precipitate on the surface of the
membrane, decreasing the gas transfer coefficient, even though the system had not
failed under a given experimental condition (Roggy et al., 2002).
To prevent prohibitively high pH and maintain the operating pH at an appropriate
working range, carbon dioxide or phosphate buffer is commonly added. However,
these buffers could induce the precipitation of calcium carbonate or calcium phosphate
in the hydrogen-driven MBfR. Here are some of the relevant reactions responsible for
the formation of these precipitants (Snoeyink and Jenkins, 1980).
CaCO3(s) + 2H+ ↔ Ca2+ + H2CO3 KSP=2.2×10⁻⁸ Equation (6.1)
Ca3(PO4)2 ↔ 3Ca2+ + 2PO43- KSP=1×10-27 Equation (6.2)
Ca5(PO4)3OH(s) ↔ 5Ca2+ + 3PO43- +OH-
KSP=8×10-55 Equation (6.3)
Carbonate is known to compete and co-precipitate with phosphate to form calcium
precipitants (Ferguson and McCarty, 1971). This indicates that the precipitation
would be unavoidable, regardless of the type of buffer used in an MBfR for
denitrification. Generally, phosphate precipitation would be more likely than
carbonate precipitation, as the solubility constants of common phosphate precipitants
are much smaller than those of carbonate precipitants. When both buffers were used
for pH control in MBfR for H2-driven denitrification, the inorganic contents stabilized
at levels higher than 60% of total solids, although it decreased when CO2 was used
(Celmer et al, 2007). Chemical control of foulants (in order to dissolve precipitants)

68 | P a g e
Jong Hyuk Hwang, Ph.D. Thesis
using HCl or EDTA can be an option to prevent precipitation. Long-term operation of
a denitrification reactor, dosed with 10 mg/L of EDTA to the influent, did not result in
serious precipitation problem (Shin et al., 2005). However, the use of chemical anti-
scaling agents should be limited since usually it is poorly degradable in conventional
wastewater treatment processes, and MBfR are usually considered as an effluent
polishing or final treatment step option.
The effect of pH on the denitrification performance has not been clarified so far.
Some studies have reported the optimum pH for hydrogenotrophic denitrification
would be 8.4 (Lee and Rittmann, 2003) and 9.5 (Rezania et al., 2006). Conversely,
one study reported that denitrification was inhibited above pH 7.8 and that complete
denitrification could only be achieved below pH 7.6 (Shin et al., 2005).
The objective of this chapter was to investigate the effect of HRT and pH on the
performance of an H2-driven denitrifying MBfR, and address the extent of inorganic
precipitation. The solids, scoured off from the membrane surface were quantified and
identified, and possible mitigation strategies for reducing the inorganic content of the
biofilm were investigated.
6.1.2 Materials and methods
Two denitrifying MBfR were operated with different loading conditions. The first
reactor was operated at an HRT of 7 h for 170 days. The second reactor was operated
at an HRT of 18 h for 90 days and then an HRT of 13.5 h for 60 days. Reactor
configuration and operation were depicted in Chapter 3.1 and 3.4 – 1.6 L reactor. PP

69 | P a g e
Jong Hyuk Hwang, Ph.D. Thesis
membrane was used for this part of the study. Figure 6.1 shows the reactor and
membrane with developed biofilm.
Figure 6.1 Picture of denitrification reactor with developed biofilm
Synthetic wastewater, simulating nitrified secondary effluent (Table 6.1), which
was different from the composition shown in Table 3.4 due to the use of KH2PO4 and
K2HPO4 as a pH buffer, was fed during the operation of the MBfR.

70 | P a g e
Jong Hyuk Hwang, Ph.D. Thesis
Accumulation of solids on the membrane surface due to precipitation of inorganic
matter and growth of biofilm was expected during operation. Once the deterioration
of denitrification performance was detected, the membranes were scoured to remove
solids, loosely attached to the fibers, on a regular basis by mechanical vibration. The
sloughed off solids were collected and analyzed for inorganic and organic content and
particular inorganic precipitants were identified using Inductively Coupled Plasma
Optical Emission Spectrometer (ICP-OES, Varian Liberty 200) analysis.
Scouring was performed at Day 37, 51, 71, 87, 106, 126, 142, 155, 170 (HRT 7 h),
and Day 19, 39, 55, 68, 83 (HRT 13.5 h) and Day 37, 51, 71, 87 (HRT 18 h).
Table 6.1 Influent composition for denitrification reactor
Chemical Constituent Concentration (mg/L)
NaNO3 185 (30 as N)
KH2PO4 325
K2HPO4 225
NaHCO3 300
MgSO4·7H2O 12.5
ZnSO4·7H2O 1.25
CaCl2·2H2O 4
MnSO4·H2O 5
CoCl2·6H2O 0.3
FeSO4·7H2O 2
CuSO4 0.1
Na2MoO4·2H2O 0.35
KCl 7

71 | P a g e
Jong Hyuk Hwang, Ph.D. Thesis
6.1.3 Results and discussions
1) Effect of HRT
Figure 6.2 shows the average specific denitrification rate (SDNR) from three
different HRT periods. SDNR was calculated based on the concentration change
between the influent and effluent nitrogen, and the associated membrane surface area
for biofilm growth (Equation (6.4).
SDNR = ((�:;��� (�:;���� ��������
������� ���� Equation (6.4)
Figure 6.2 Effect of HRT
0.0
0.1
0.2
0.3
0.4
0.5
0.6
0.7
HRT 7 h HRT 13.5 h HRT 18 h
Avera
ge S
DN
R (
g N
/m2d
)

72 | P a g e
Jong Hyuk Hwang, Ph.D. Thesis
Average SDNR was 0.54, 0.46 and 0.32 g N/m2d at HRT of 7 h (170 days of
operation), 13.5 h (60 days of operation) and 18 h (90 days of operation), respectively.
Maximum SDNRs, observed from each HRT case, were 0.84, 0.71 and 0.61 g N/m2d
at HRT of 7 h, 13.5 h and 18 h, respectively. High standard deviation values were
obtained due to highly fluctuating denitrification performance. Denitrification
performance from this experiment was lower than reported earlier (Terada et al., 2006,
Ergas and Reuss, 2001), possibly due to the effect of mineral precipitation.
Average SDNR increased with decreasing HRT, as shown in Figure 6.2. As
mentioned earlier, diffusion of substrate would be the major driving force of pollutants
removal in MBfR. High NO3-N concentration in bulk with lower HRT would
promote more diffusion into biofilm, thus resulting in higher removal rate.
Additionally, added introduction of buffer with influent in the case of lower HRT
would suppress pH increase, which is favorable to mineral precipitation. Average pH
in bulk solution was 7.5, 7.8 and 7.95, at HRT of 7 h, 13.5 h and 18 h, respectively,
however the pH within the biofilm is expected to be higher than that in the bulk
solution.
Despite the increasing SDNR with decreasing HRT, due to extensive accumulation
of solids within the biofilm (which was clearly visible during the experiments), SDNR
values were highly scattered in every HRT case, as can be seen from the standard
deviations in Figure 6.2.
2) Effect of pH

73 | P a g e
Jong Hyuk Hwang, Ph.D. Thesis
Results shown in Figure 6.2 would suggest that higher pH would be unfavourable
in terms of system performance due to mineral precipitation, and higher NO2-N
accumulation was observed under high pH conditions, as shown in Figure 6.3.
These results led to the investigation of the effect of pH on the reactor performance
by controlling pH through directly adding phosphate buffer at designated pH levels to
the reactor.
Figure 6.3 Effluent NO2-N concentration vs. reactor pH
Two pH conditions were tested in two reactors with different HRT. pH was
maintained at 7.5 for the first 20 days and then maintained at pH 8 for the next 20 days.
Shorter HRT (2.7 h and 5.4 h) were tested in order to maximize the effect of
phosphate buffer addition. pH was controlled by adding phosphate buffer and buffer
0
2
4
6
8
10
12
14
16
7 7.5 8 8.5 9
NO
2-N
co
ncen
trati
on
(m
g/L
)
Reactor pH
HRT 7hr
HRT 13.5hr
HRT 18hr

74 | P a g e
Jong Hyuk Hwang, Ph.D. Thesis
consumption was monitored. The tests with the pH control could not be maintained
for extended periods due to the deteriorating performance over time caused by
extensive accumulation of solids. Figure 6.4 shows SDNRs obtained from the two
reactors and their phosphate buffer consumption to maintain the designated pH levels.
As shown in Figure 6.4, the buffer consumption was dependent upon SDNR, as pH
increase would be caused by denitrification activity. Performance worsened over time
in both cases as extensive introduction of phosphate buffer for pH adjustment
accelerated the precipitation of calcium phosphate.
Figure 6.4 SDNR and buffer consumption
3) Membrane scouring
0
100
200
300
400
500
600
0.0
0.1
0.2
0.3
0.4
0.5
0.6
0.7
0 10 20 30 40
Bu
ffer
co
nsu
mp
tio
n (
mL
/d)
SD
NR
(g
N/m
2d
)
Days
SDNR - HRT 2.7 h SDNR - HRT 5.4 h
Buffer - HRT 2.7 h Buffer - HRT 5.4 h
pH 7.5 pH 8.0

75 | P a g e
Jong Hyuk Hwang, Ph.D. Thesis
Since solids accumulation was assumed to be the main reason for the deterioration
of performance, solids attached to the membrane fibers were collected and tested. The
frequency of the mechanical scouring of the membrane surface was initially based on
the drop in SDNR and implemented regularly thereafter. Response to the scouring
was instantaneous, as SDNR jumped up to 220%, compared to that before scouring.
Figure 6.5 shows the typical response of denitrification performance to membrane
scouring in the reactor operated at HRT of 13.5 h. Removing excessive solids from
the biofilm resulted in an immediate increase of SDNR, however continuing solids
accumulation resulted in abrupt decreases of SDNR, resulting in high fluctuations of
performance. These abrupt drops of SDNR were attributed to the precipitated minerals,
which limit substrate and gas transfer efficiencies.
Figure 6.5 Increase of SDNR after each scouring
0.0
0.1
0.2
0.3
0.4
0.5
0.6
0.7
0.8
88 98 108 118 128 138
SD
NR
(g
N/m
2d
)
Days
ScouringScouring Scouring

76 | P a g e
Jong Hyuk Hwang, Ph.D. Thesis
(a) Cumulative volatile solids mass
(b) Cumulative inert solids mass
Figure 6.6 Accumulated solids mass from membrane scouring
0
500
1000
1500
2000
2500
3000
3500
0 20 40 60 80 100 120 140
Rem
ov
ed
vo
lati
le s
olid
s m
ass i
n
accu
mu
lati
on
(m
g)
Days
HRT 7 h
HRT 13.5 h
HRT 18 h
0
500
1000
1500
2000
2500
3000
0 20 40 60 80 100 120 140
Rem
ov
ed
in
ert
so
lid
s m
ass i
n
accu
mu
lati
on
(m
g)
Days
HRT 7 h
HRT 13.5 h
HRT 18 h

77 | P a g e
Jong Hyuk Hwang, Ph.D. Thesis
The sloughed off solids from the scouring operation were collected and analyzed
for volatile and inert components. Since the solids concentrations in the influent and
effluent were below detectable levels, the sloughed-off solids from the membrane
surface were considered to be generated during the long-term operation between
scouring. Figure 6.6 shows net volatile and inert solids generations for each tested
HRT.
The accumulation of volatile solids at the examined HRTs showed a linear trend,
indicating the exerted strength of membrane cleaning was fairly consistent although it
was performed manually. Rates of volatile solids accumulation were 23.2 mg/d (HRT
7 h), 20.8 mg/d (HRT 13.5 h) and 20.7 mg/d (HRT 18h).
The theoretical yield coefficient for autotrophic denitrification can be calculated as
0.23 g cell/g N from the stoichiometric relationship shown in Equation (6.5). Similar
true yield of 0.27 mg active cell/mg N has been reported (Rezania et al., 2006).
NO3- + H+ + 2.86H2 +0.15CO2 → 0.0286C5H7NO2 + 0.49N2 + 3.14H2O
Equation (6.5)
Observed yield, which can be calculated from the VSS generated and nitrogen
reduced, should be higher than the theoretical yield as volatile suspended solids
include active biomass, cell debris, extracellular polymeric substances (EPS) and
possible trapped organics in the microbial aggregates. Reported observed yields for
78 | P a g e
Jong Hyuk Hwang, Ph.D. Thesis
autotrophic denitrification were 1.2 g VSS/g N (Benedict, 1996) and 0.78 g VSS/ g N
(Pierkiel, 2002). Even though the daily volatile solids generation rate was higher at
lower HRT, the observed yields, based on solids accumulation and denitrification rate
from this study were 0.38 g VSS/g N (HRT 7 h), 0.40 g VSS/g N (HRT 13.5 h) and
0.57 g VSS/g N (HRT 18h).
If the fraction of cell synthesis is governed by the theoretical yield coefficient and
the fraction of cell debris is linearly related with cell mass, solids at higher HRTs (and
lower SDNR) can be expected have higher EPS contents. As the membrane surface
area is constant, higher EPS (considered a foulant) in the biofilm attached to the
membrane would result in performance deterioration normalized to the surface area.
As for the inorganic accumulation, at higher HRTs (especially HRT of 18 hrs),
consistently more inorganic solids were generated than at lower HRTs, which was
attributed to higher pH conditions. Mineral precipitation would increase at higher pH,
as the driving force of hydroxyapatite (Ca5(OH)(PO4)3) precipitation, which is the
most common form of calcium phosphate precipitation, and its co-precipitation
product with carbonate (Ca10(PO4)6(CO3)0.5(OH)), would also increase (Lu and Leng,
2005). Added phosphate buffer at high pH due to denitrification activity would result
in extensive mineral precipitation, thus the use of phosphate buffer for pH control in
the autotrophic denitrification system should be avoided.
4) Effect of accumulation of inert matter on SDNR
Since hydrogen gas diffuses from the membrane surface in an MBfR, any deposit
other than active biomass on the membrane surface would limit the gas and substrate

79 | P a g e
Jong Hyuk Hwang, Ph.D. Thesis
transfer rates. As the inert solids fraction from removed solids by membrane scouring
ranges from 26% to 76%, the relationship between SDNR and inert solids fraction can
be established as shown in Figure 6.7. SDNR values used in this graph were the
average values between each membrane scouring. The error bars in Figure 6.7
represent the standard deviations in the measured data.
Figure 6.7 Relationship between inert fraction and SDNR
Even though many parameters may inter-act with each other and affect the system
performance of an MBfR, SDNR appears to be significantly affected by inorganic
precipitation. This indicates that inert precipitation is a major reason for inhibiting the
transfer of gas or substrate in MBfR operation. Figure 6.8 shows the micro-
photograph of inorganic precipitation, which covers the membrane surface and then
0
0.2
0.4
0.6
0.8
0.0 0.2 0.4 0.6 0.8 1.0
SD
NR
(g
N/m
2d
)
Inert Fraction
HRT 7
HRT 13.5
HRT 18
R2=0.7519
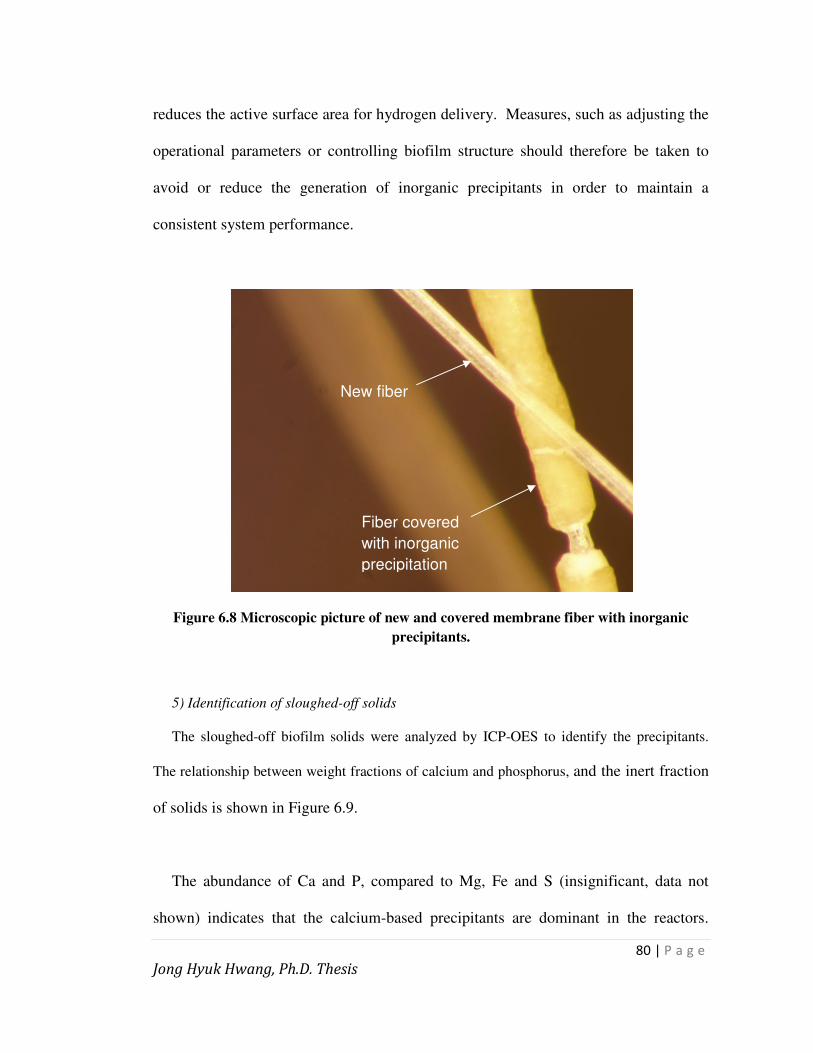
80 | P a g e
Jong Hyuk Hwang, Ph.D. Thesis
reduces the active surface area for hydrogen delivery. Measures, such as adjusting the
operational parameters or controlling biofilm structure should therefore be taken to
avoid or reduce the generation of inorganic precipitants in order to maintain a
consistent system performance.
Figure 6.8 Microscopic picture of new and covered membrane fiber with inorganic
precipitants.
5) Identification of sloughed-off solids
The sloughed-off biofilm solids were analyzed by ICP-OES to identify the precipitants.
The relationship between weight fractions of calcium and phosphorus, and the inert fraction
of solids is shown in Figure 6.9.
The abundance of Ca and P, compared to Mg, Fe and S (insignificant, data not
shown) indicates that the calcium-based precipitants are dominant in the reactors.
New fiber
Fiber covered
with inorganic
precipitation

81 | P a g e
Jong Hyuk Hwang, Ph.D. Thesis
Weight fraction of phosphorous ranged from 6% to 13% of removed solids mass.
Considering 1% organic phosphorous in average biomass by weight, it can be
suggested that most of P in the sloughed-off solids are in an inorganic form.
Figure 6.9 Inert fraction vs. Ca and P from sloughed-off solids
Weight fraction of calcium and phosphorous in sloughed-off solids were linearly
related with the inert fraction from sloughed-off solids, suggesting that the calcium
phosphate component was the major precipitant. Sum of weight fraction of calcium
and phosphate comprised around 50% of the inert fraction. The statistical fit between
calcium and inert fraction was better than that between P and the inert fraction as
calcium results include possible calcium carbonate precipitants. Lower P/Ca ratio in
0
5
10
15
20
25
0.3 0.4 0.5 0.6 0.7 0.8
Fra
cti
on
of
Ca o
r P
(%
)
Inert fraction
Ca (HRT 7 h) Ca (HRT 13.5 h) Ca (HRT 2.7 h) Ca (HRT 5.4 h)
P (HRT 7 h) P (HRT 13.5 h) P (HRT 2.7 h) P (HRT 5.4 h)
R2=0.9786
R2=0.8728

82 | P a g e
Jong Hyuk Hwang, Ph.D. Thesis
higher inert fraction also indicated that more calcium-based precipitants would be
probable in higher inert fraction.
The form of calcium phosphate could be estimated based on the slopes of calcium
and phosphate, shown in Figure 6.9, as the increase of inert fraction indicates the
increase of certain forms of calcium phosphate. Among the three common forms of
calcium phosphate (Ca5(OH)(PO4)3, Ca3(PO4)2, CaPO4, CaHPO4, CaH2PO4), the form
removed in this study, would be Ca5(OH)(PO4)3 (Hydroxyapatite), the most common
form of calcium phosphate as P/Ca ratio (0.477) from the slopes of Figure 6.9 was
very close to that (0.462) of hydroxyapatite.
6.1.4 Conclusions
The effect of inorganic precipitation on the performance of H2-driven MBfR for
autotrophic denitrification was investigated. Operating reactors at different HRTs
revealed that shorter HRT led to higher denitrification rates due to better pH
maintenance at higher flow rates. The performance of reactors with pH control using
phosphate buffer did not improve due to extensive precipitation of calcium phosphate.
The membrane was cleaned periodically to investigate the solids contents generated in
the system. The reactor with long HRT generated more inert solids than the reactor
with short HRT and had exhibited a lower specific denitrification rates (SDNR), even
though the generation of volatile solids was almost identical in both cases. Inorganic
precipitation was strongly and linearly related with specific denitrification rate, which
indicates that inert precipitation is a major cause for inhibiting the transfer of gas or

83 | P a g e
Jong Hyuk Hwang, Ph.D. Thesis
substrate in an MBfR. Characterization of sloughed-off solids revealed an abundance
of calcium phosphate, which showed good relationship with inert solids generation.
6.2 Effect of dissolved oxygen
6.2.1 Introduction and specific objectives
Dissolved oxygen (DO) is one of the major operating parameters for biological
nitrogen removal processes. It could be an especially important operating parameter
for hydrogenotrophic denitrification because it is usually applied to groundwater
treatment, which contains a significant amount of oxygen, or to wastewater treatment
trains after nitrification where oxygen is sufficiently supplied.
Even though some studies reported denitrification under aerobic conditions with
specific microorganisms such as Alcaligenes faecalis (Joo et al., 2005), Thiosphaera
pantotropha (Dalsgaard et al., 1995; Robertson et al., 1995), most of the reported
denitrification studies were conducted by facultative anaerobes in the absence of
oxygen, because organisms capable of performing aerobic denitrification are out-
competed in natural environments. Inhibition of heterotrophic denitrification with the
presence of oxygen is extensively reported (Tiedje, 1988; Henze et al., 1995; Oh and
Silverstein, 1999).

84 | P a g e
Jong Hyuk Hwang, Ph.D. Thesis
So far, the studies regarding the effect of DO on hydrogenotrophic denitrification
reported controversial and conflicting results. Over-supply of hydrogen was required
to remove DO that adversely affected hydrogenotrophic denitrification (Kurt et al.,
1987; Gross et al. 1986). Ho et al. (2002) reported reduced denitrification
performance in saturated DO condition from their denitrification batch tests under
various DO conditions using PVA (Polyvinyl alcohol)-immobilized biofilms on a
silicone tube. Cowman et al. (2005) operated consecutive nitrification and
hydrogenotrophic denitrification in MBfR by changing O2 and H2 pressures and
observed the increase of nitrate concentration in the final effluent due to the carry-over
of excess oxygen, caused by higher O2 pressure.
However, Schnobrich et al. (2007) conducted a field-scale column study for
treating groundwater containing high DO and nitrate. Even though DO concentration
in their feed was over 5.5 mg/L, complete denitrification could be achieved. Sahu et
al. (2007) reported that the presence of DO in the influent did not adversely affect the
denitrification rate in a bench-scale MBfR.
Despite conflicting reports on the effect of oxygen in literature, a shared
observation was that hydrogenotrophic denitrification was not completely inhibited by
the presence of oxygen as was observed in heterotrophic denitrification. Since past
studies were mostly intended for investigating the performance of hydrogenotrophic
denitrification in various situations rather than focusing on the effect of oxygen, the
effect of oxygen on hydrogenotrophic denitrification has not been fully elucidated.
85 | P a g e
Jong Hyuk Hwang, Ph.D. Thesis
The objective of this chapter was to investigate the effect of oxygen on
hydrogenotrophic denitrification in MBfR. Two separate MBfR systems for
consecutive nitrification-denitrification and separate denitrification were operated under
various DO conditions. This chapter describes the results and discussion from the
operation of a stand-alone denitrification reactor.
6.2.2 Materials and methods
Denitrification reactor was inoculated with 200 mL of removed biomass from a lab-
scale MBfR for separate hydrogenotrophic denitrification study. Reactor was
acclimated over 90 days for biofilm development.
Working volume of reactor was 1.6 L (HRT 3.81 h) and its configuration was
shown in Figure 6.10, slightly different from Figure 3.4. PP membrane was no longer
used for denitrification due to its low diffusivity, and PMP membrane was used,
because it was proven that PMP membrane had the ability to deliver more gas. The
composition of synthetic wastewater is shown in Table 3.4.
During 100 days of operation, various DO conditions were tested. From day 1 to
day 14, the DO in the influent and reactor was not controlled. From day 15 to day 54,
air was introduced via a diffuser inside the reactor in order to manually increase the
DO level of the reactor (as shown in Figure 6.10), however the flow rate of air was
carefully controlled not to scour off existing biofilm.

Jong Hyuk Hwang, Ph.D.
From day 55 to day 81, influent was sparged with nitrogen gas to remove DO
the influent. From day 82 to day 95, DO was not controlled again. From day 96 to
day 100, air was introduced to the reactor
6.2.3 Results and discussions
Table 6.2 shows the DO entering and
corresponding to the applied DO control measures.
Jong Hyuk Hwang, Ph.D. Thesis
Figure 6.10 Reactor configurations
From day 55 to day 81, influent was sparged with nitrogen gas to remove DO
influent. From day 82 to day 95, DO was not controlled again. From day 96 to
day 100, air was introduced to the reactor once more to increase the DO concentratio
Results and discussions
.2 shows the DO entering and DO inside the reactor and
applied DO control measures.
86 | P a g e
From day 55 to day 81, influent was sparged with nitrogen gas to remove DO from
influent. From day 82 to day 95, DO was not controlled again. From day 96 to
to increase the DO concentration.
inside the reactor and the SDNR

87 | P a g e
Jong Hyuk Hwang, Ph.D. Thesis
Table 6.2 DO entering and DO inside the reactor and SDNR
Days Feed DO
(mg/L)
Reactor DO
(mg/L)
SDNR
(g N/m2d) DO control
Day 1-14 8.6 0.4 0.82 None
Day 15-54 6.2 4.9 0.87 Reactor aeration
Day 55-81 0.7 0.0 0.86 Feed N2 addition
Day 82-95 6.5 0.8 0.87 None
Day 96-100 4.6 1.6 0.87 Reactor aeration
An average reactor DO concentration of 4.9 mg/L could be maintained by reactor
aeration, and all of the DO entering the reactor could be removed by feed N2 addition.
Identical DO control strategies to the first two stages were tested during Day 82-95
and Day 96-100, respectively, to evaluate the reproducibility of denitrification
performance under changing DO conditions. Figure 6.11 shows the relationship
between SDNR and incoming DO(a), reactor DO(b).
The change of DO neither favourably nor adversely affected the hydrogenotrophic
denitrification as can be seen in Table 6.2 and Figure 6.11. During day 82-100 of
operation, when the previous DO condition was replicated, no considerable
differences were observed. Therefore, it can be concluded that the effect of DO on
hydrogenotrophic denitrification in stand-alone operation was negligible. Detailed
discussion regarding the effect of DO on hydrogenotrophic denitrification will be
addressed in the subsequent Chapter 7.3 with results from the operation of consecutive
nitrification and denitrification reactors.

88 | P a g e
Jong Hyuk Hwang, Ph.D. Thesis
Figure 6.11 Relationship between SDNR and incoming DO (a), reactor DO (b)
6.2.4 Conclusions
0
0.2
0.4
0.6
0.8
1
1.2
0 2 4 6 8
SN
DR
(g
N/m
2d
)
Incoming DO (mg/L)
(a)
0
0.2
0.4
0.6
0.8
1
1.2
0 2 4 6 8
SD
NR
(g
N/m
2d
)
Reactor DO (mg/L)
(b)

89 | P a g e
Jong Hyuk Hwang, Ph.D. Thesis
The effect of oxygen on hydrogenotrophic denitrification in MBfR was investigated.
One stand-alone denitrification reactor, representing the system treating non-nitrified
secondary effluent from domestic wastewater treatment plants, and groundwater or
nitrified secondary effluent from domestic wastewater treatment plants, was operated
under various DO conditions.
A wide range of DO was tested in the stand-alone denitrification reactor. Aeration
was used to increase the level of DO while nitrogen scouring was used to remove any
oxygen from the influent. From the results of 100 days of operation under a variety of
DO conditions (ranging from 0 to 4.9 mg O2/L in the reactor), no noticeable difference
of specific denitrification rate between various DO conditions was found. It was
concluded that the hydrogenotrophic denitrification was not affected by the presence
of DO in our MBfR system.
6.3 Effect of temperature
6.3.1 Introduction and specific objectives
Temperature is one of the major influencing factors in biological wastewater
treatment. The effect of temperature on the reaction rate of biological processes can
be expressed by the Arrhenius equation – shown below – with each type of organism,
e.g. carbon oxidizing heterotrophs, nitrifiers, or denitrifiers having their own
90 | P a g e
Jong Hyuk Hwang, Ph.D. Thesis
temperature correction factor (Tchobanoglous, Burton, and Stensel, 2003;
Oleszkiewicz and Berquist, 1988).
20020max,
−×= T
CT θµµ Equation (6.5)
Nitrification is known as the most temperature-sensitive step among the biological
processes in wastewater treatment. The temperature correction factor for nitrifiers’
maximum growth rate ranging from 1.072 to 1.127 have been found historically,
however 1.072 is recently accepted for designing wastewater treatment plants (WERF,
2003; Painter and Loveless, 1983; Downing and Hopwood, 1964; Oleszkiewicz and
Berquist, 1988; EnviroSim and Associates Ltd., 2006).
The effect of temperature on hydrogenotrophic denitrification has not been reported
so far. Therefore, the objective of this chapter is to investigate the denitrification
performance in stand-alone denitrification reactor with changing temperature.
6.3.2 Materials and methods
After finishing the investigation of the effect of DO in Chapter 6.2, the
denitrification reactor was moved to a temperature-controlled incubator to investigate
the effect of temperature on hydrogenotrophic denitrification. Influent feed, feeding
pump and effluent reservoir were also moved to the incubator. Since NO3-N was the

91 | P a g e
Jong Hyuk Hwang, Ph.D. Thesis
major component of feed, no significant change of feed composition was expected
inside the incubator.
The reactor was operated for 62 days under various temperature conditions, ranging
from 8 °C to 34 °C. Since the denitrification performance was very responsive and
stabilized quickly following the temperature change, the temperature was switched
every week. Detailed temperature profile is shown in Table 6.3 with operating
duration and corresponding SDNRs.
Influent pump setting was unchanged, therefore the expected HRT was 3.81 hrs as
shown in Chapter 6.2. However, the actual flowrate fluctuated slightly with
temperature as the performance of the feed pump, placed inside incubator, was
affected by the temperature change. The actual HRT ranged from 3.47 hr to 3.87 hr.
Although the loading rate was slightly different as HRT changed around 10%, the
effect of loading rate was not considered for data analysis from this phase. The
composition of synthetic wastewater was shown in Table 3.4.
6.3.3 Results and discussions
Table 6.3 shows operational days, HRT, temperature and SDNR. The reactor was
operated at each temperature for about 1 week. Reproducibility of SDNR was
confirmed by operating a reactor in same temperatures couple times (twice (13 °C,
28 °C) and three times (22 °C)). Figure 6.12 also shows the change of SDNR with
operating temperature.

92 | P a g e
Jong Hyuk Hwang, Ph.D. Thesis
Table 6.3 Effect of temperature on hydrogenotrophic denitrification
Days of operation HRT (hr) Temperature (°C) SDNR (g N/m2d)
6 3.71 22.3 1.003
7 3.80 13.0 0.737
7 3.62 8.2 0.316
7 3.48 13.0 0.738
7 3.47 21.7 1.044
8 3.83 28.1 1.088
7 3.74 34.2 1.100
7 3.84 28.4 1.100
6 3.87 23.0 1.049
Figure 6.12 SDNR with temperature change
According to Figure 6.12, the optimum temperature for hydrogenotrophic
denitrification appears to be between 25 °C and 30 °C, which is lower than the
0.0
0.2
0.4
0.6
0.8
1.0
1.2
1.4
0 5 10 15 20 25 30 35 40
SD
NR
(g
N/m
2d
)
Temperatue (°C)

93 | P a g e
Jong Hyuk Hwang, Ph.D. Thesis
optimum temperature for autotrophic nitrification (35 °C) (Tchobanoglous, Burton,
and Stensel, 2003). The result from this operation indicates that the performance of
hydrogenotrophic denitrification can be maximized without temperature control.
Regarding temperature sensitivity, however, the temperature sensitivity below
20 °C was much higher than conventional heterotrophic bacteria and similar to that for
autotrophic nitrifiers (Tchobanoglous, Burton, and Stensel, 2003) – SDNR dropped by
50% from 1 g N/m2d to 0.5 g N/m2d when the temperature dropped from 20 °C to
10 °C.
6.3.4 Conclusions
Effect of temperature on hydrogenotrophic denitrification was investigated in a
stand-alone denitrification reactor with changing temperature.
The optimum temperature for hydrogenotrophic denitrifiers appears to be between
20 °C and 25 °C. No improvement of denitrification performance was observed above
25 °C. Temperature sensitivity below 20 °C was much higher than conventional
heterotrophic bacteria and similar to that for autotrophic nitrifiers.

94 | P a g e
Jong Hyuk Hwang, Ph.D. Thesis
6.4 Summary of the denitrification reactor operation
The denitrification reactor was tested starting in March 2007.
Major findings from the operation of stand-alone denitrification reactor include the
effect of mineral precipitation, DO in bulk solution and temperature. Research
regarding mineral precipitation was done between March 2007 and December 2007.
Research regarding DO and temperature was done between November 2008 and May
2009. There was a gap between December 2007 and November, 2008, when a couple
denitrification reactors were acclimated for the consecutive operations. As one
denitrification reactor failed due to excessive biofilm growth during consecutive
operation, the acclimation period was longer than originally planned. Research
regarding the effect of mineral precipitation on the performance of hydrogenotrophic
denitrification showed that mineral precipitation, caused by intended pH control,
would cause the deterioration of denitrification performance by inhibiting the
diffusion of hydrogen and nitrate. A linear relationship could be achieved between the
inert fraction of the collected biomass from the biofilm and SDNR. ICP confirmed
that more than 50 % of the inert material was CaPO4, which originated from the pH
buffer used. Operating the reactor under various DO conditions showed that the
denitrification performance was not affected by bulk DO in the MBfR. Optimum
temperature of hydrogenotrophic denitrification found to be around 28 °C. This was
much lower than that of nitrification, which is known over 30 °C. The sensitivity to
temperature of denitrifier was similar to that of nitrifier when operating below 20 °C.

Jong Hyuk Hwang, Ph.D.
7. CONSECUTIVE OPERATION OF NITRIFICATION AND
DENITRIFICATION
After the PMP membrane
potential for nitrification and
and denitrification for complete nitrogen removal
initiated. Consecutive operation was conducted by supplying the effluent from
nitrification reactor to th
operation is shown in Figure
Consecutive operation was conducted from March, 2008 to May, 2009.
Figure
Jong Hyuk Hwang, Ph.D. Thesis
7. CONSECUTIVE OPERATION OF NITRIFICATION AND
DENITRIFICATION
PMP membrane module was confirmed to have high gas delivery
potential for nitrification and denitrification, the consecutive operation of nitrification
and denitrification for complete nitrogen removal using only autotrophic bacteria was
. Consecutive operation was conducted by supplying the effluent from
the denitrification reactor. The configuration for consecutive
s shown in Figure 7.1.
Consecutive operation was conducted from March, 2008 to May, 2009.
Figure 7.1 Configuration for consecutive operation
95 | P a g e
7. CONSECUTIVE OPERATION OF NITRIFICATION AND
was confirmed to have high gas delivery
denitrification, the consecutive operation of nitrification
only autotrophic bacteria was
. Consecutive operation was conducted by supplying the effluent from the
denitrification reactor. The configuration for consecutive
Consecutive operation was conducted from March, 2008 to May, 2009.
96 | P a g e
Jong Hyuk Hwang, Ph.D. Thesis
7.1 Long-term operational stability
7.1.1 Introduction and objectives
Although many studies have been reported on MBfR, many focused on the removal
of organics or simultaneous removal of organics and nitrogen. Studies regarding only
nitrogen removal are limited. Brindle et al. (1998) conducted a nitrification study with
artificial wastewater without organic substrate, reporting that almost complete
nitrification could be achieved throughout the experiment with average 98 % of
nitrification efficiency. A maximum nitrification rate of 0.98 kg NH4-N/m3d was
achieved, which corresponds to a specific nitrification rate of 5.4 g NH4-N/m2d at 30°C.
Backwashing was not performed as excessive biomass growth was not observed.
Nitrifying microorganisms, immobilized by polyvinyl-alcohol (PVA) and attached to
the surface of a silicone membrane tube, where O2 was supplied, were used for
nitrification. The immobilized biofilm had a rubber-like elasticity and resisted shear
stress over 5 months of operation (Hsieh et al., 2002).
Shin et al. (2005) studied nitrification, as well as autotrophic denitrification with
hydrogen with artificial wastewater containing nitrogen. Volumetric and specific
removal rate up to 2.48 kg/m3d and 1.43 g N/m2d, respectively were achieved.
Ergas and Reuss (2001) operated an autotrophic denitrifying MBfR for over 4
months. Denitrification rates up to 0.77 kg N/m3d were achieved with an influent NO3-
N concentration of 145 mg/L and HRT of 4.1 hours. Maximum specific
denitrification rate of 2.2 g N/m2d was achieved. However, denitrification rates

97 | P a g e
Jong Hyuk Hwang, Ph.D. Thesis
decreased significantly due to the build up of a thick layer of biofilm on the surface of
the membranes after approximately four months of operation.
Although in these previous studies researchers were able to operate their reactors
for a few months, many cases (especially denitrification reactors) experienced serious
deterioration of performance due to excessive growth of biofilm and lack of proper
biofilm control.
In this study, total nitrogen removal in a two-step MBfR system incorporating
sequential nitrification and hydrogen-driven autotrophic denitrification was
investigated. A particular goal was to achieve long-term stable operation, which was
identified as a problem in previous studies with MBfR, and to investigate total
nitrogen removal using purely autotrophic bacteria. Unlike the nitrification reactor,
the denitrification reactor would receive the complex effluent of the nitrification
reactor during consecutive operation, which would have variable pH, alkalinity, NH4-
N and especially the residual DO. The effects of these components on
hydrogenotrophic denitrification have not been well documented elsewhere.
Performance in this study was also compared with other similar previous studies. This
operation was conducted between July 2008 and March 2009. Consecutive operation
was performed starting March, 2008 however the excessive biofilm growth on the
denitrification reactor caused the failure of the consecutive operation, therefore the
consecutive operation had to be re-started in July, 2009, with newly acclimated
denitrifying biofilm.

98 | P a g e
Jong Hyuk Hwang, Ph.D. Thesis
7.1.2 Materials and methods
Nitrifying and denitrifying MBfR (Figure 7.1) were operated sequentially over 230
days at an HRT of 1.15 h and 3.7 h, respectively. The HRT of the denitrification
reactor was bigger in order to provide more void space as biofilm accumulation was
expected in the denitrification reactor, according to literatures (Lee and Rittmann,
2003, Celmer et al., 2008) and previous experiment regarding mineral precipitation.
Identical membrane surface areas (0.152m2) for gas delivery and biofilm development
were provided. The composition of synthetic wastewater is shown in Table 3.3. HRT
was checked daily by collecting effluent overnight.
Internal liquid recycle at approximately 5 times of influent flowrate was applied in
the nitrification reactor and mechanical stirrer mixing was provided in the
denitrification reactor in order to ensure homogeneous conditions. Oxygen and
hydrogen were introduced to the top of the membrane module in the nitrification and
denitrification reactors, respectively. Operating temperature was maintained at
20±1°C throughout the experimental period.
Nitrification batch tests were also performed in order to confirm the presence of
nitrifiers escaping from the nitrification reactor to the denitrification reactor.
Experimental procedures were same as described in Chapter 5.5.

99 | P a g e
Jong Hyuk Hwang, Ph.D. Thesis
7.1.3 Results and discussions
Figure 7.2 shows the NH4-N concentration in the influent, nitrification reactor
effluent, final effluent and SNR over time. Average NH4-N concentrations in influent,
nitrification reactor effluent and final effluent were 31.5, 4.0 and 0.7 mg/L,
respectively. SNR was steadily maintained over time due to stable biofilm
development up to 240 days of operation. In the ensuing period SNR increased
slightly mainly due to slight increase in influent loading, which in turn induced
diffusion of NH4-N, which is the main driving force in MBfR. Average SNR for the
entire experimental periods was 1.87 g N/m2d.
Figure 7.2 Nitrification reactor performance
0
0.5
1
1.5
2
2.5
0
5
10
15
20
25
30
35
40
0 50 100 150 200 250
SN
R (
g N
/m2d
)
NH
4-N
co
nc
en
tra
tio
n (
mg
/L)
DayInfluent Nitrification reactor effluent Final effluent SNR

100 | P a g e
Jong Hyuk Hwang, Ph.D. Thesis
Nitrification reactor was operated for over 240 days without intentional biomass
removal, which meant that the only biomass removal mechanism was the natural
detachment/washout by the shear force induced by the internal recirculation, from the
nitrification reactor. Solids concentration from the nitrification effluent was not
monitored regularly, because the SS measurement required at least 2 L of nitrification
reactor effluent sample for accurate SS assessment due to its low concentration, which
would have caused the stoppage of feeding to the following denitrification reactor.
However, effluent solids were consistently lower than 5 mg SS/L from occasional SS
measurements and no solids breakthrough were observed during this period.
There were some past studies aimed at achieving nitrification-only in MBfR
(Brindle et al., 1998; Hsieh et al., 2002). Therefore, the nitrification performance
from this study was compared with previous similar studies, shown in Table 7.1.
Nitrification rate (both specific and volumetric) from this study was higher or
comparable to those of other studies; considering it was conducted at the lowest
operating temperature among the results in Table 7.1 and nitrification is one of the
most temperature-sensitive biological activities.
Most of these nitrification studies did not report on the biomass accumulation,
which has been a problem in MBfR studies focussing on organic removal (Pankhania
et al., 1994; Pankhania et al., 1999; Brindle et al., 1999; Semmens et al., 2003). One
nitrifying MBfR study reported a biomass accumulation problem when heterotrophic
denitrification occurred on the outer side of the biofilm (Suzuki et al., 2000).

101 | P a g e
Jong Hyuk Hwang, Ph.D. Thesis
Table 7.1 Performance comparison of previous nitrification studies with this
work
Reference Temp
(°C)
SNR
(g N/m2d)
Volumetric
Rate
(kg N/m3d)
Influent
& Bulk
Conc.
(mg/L)
Operation
periods
(days)
Brindle et al.
(1998) 30 5.4 0.98 50, 1 180
Suzuki et al.
(2000) 30 2.2 0.04 25, 5
Hsieh et al.
(2002) 30 2.3 0.004 50, 5 150
Terada et al.
(2006) 25 0.5 0.30 90, 50 120
Shin et al.
(2005) 24 1.4 2.48 200, 5 260
This study 20 1.87 0.56 32, 5 240
Figure 7.2 also indicates some residual nitrification activity in the denitrification
reactor - equal to the difference between the nitrification reactor effluent and final
effluent (after denitrification reactor). Nitrification in the denitrification reactor would
be possible if the nitrification reactor effluent contains a nitrifier population, which
can reattach itself in the denitrification reactor and grow in the presence of DO. NH4-
N removal in the denitrification reactor was not observed after the start of consecutive
operation. It gradually started after around 10 days since the denitrification reactor
started to receive the influent from the nitrification reactor effluent, suggesting the
transfer of biological activity. Sufficient DO was carried over to the denitrification
reactor since pure oxygen in nitrification reactor was added not to limit the
nitrification activity. Cowman et al. (2005) reported that nitrification was greatly
102 | P a g e
Jong Hyuk Hwang, Ph.D. Thesis
inhibited by low O2 pressure of 1.25 psi, due to the limited O2 supply in the
nitrification reactor, which left ammonium nitrogen un-oxidized.
According to nitrification stoichiometry in Equation (7.1) (Metcalf and Eddy, 2003),
1 mg of ammonia requires 4.26 mg of oxygen for nitrification.
NH4+ + 1.863O2 + 0.098CO2 → 0.0196C5H7NO2 + 0.98NO3
- + 0.941 H2O +
1.98H+ (Equation 7.1)
In terms of oxygen mass balance, the residual DO from the nitrification reactor
effluent (10 -15 mg/L) contained enough oxygen to nitrify the carried-over NH4-N,
which is the NH4-N concentration difference between the nitrification reactor effluent
and final effluent.
As for the presence of nitrifiers, its existence from the nitrification reactor effluent
was tested and confirmed by batch tests using the high F/M test (WERF, 2003).
Figure 7.3 shows the change of nitrogen components during the batch test. Three
days were required to achieve full nitrification due to low initial nitrifiers’
concentration. The fitted curves (using the least-square method) plotted in Figure 7.3,
were used to determine the initial concentration of nitrifiers.
Out of 2.1 mg SS/L (1.5 mg VSS/L) of nitrification reactor effluent, 15.2 % of SS
(21.3 % of VSS) was determined to be active nitrifiers, suggesting the possible
reattachment of nitrifiers and subsequent biological nitrification in the denitrification
reactor.

103 | P a g e
Jong Hyuk Hwang, Ph.D. Thesis
Figure 7.3 Change of NH4-N and NOx-N concentrations during batch test
Figure 7.4 shows the NOx-N concentration of the influent and effluent of the
denitrification reactor, and SDNR. Since some nitrification took place in the
denitrification reactor, the influent in Figure 6.3 was defined as the sum of incoming
NOx-N from the nitrification reactor and the NOx-N converted from NH4-N (NH4-N
concentration difference between nitrification effluent and final effluent) in the
denitrification reactor. The specific denitrification rate (SDNR) was calculated based
on the NH4-N, NO2-N, NO3-N concentration difference between the influent and
effluent of the denitrification reactor, flowrate and provided surface area of membrane
fibers for biofilm development as shown in Equation (7.2).
0
5
10
15
20
25
30
0 0.5 1 1.5 2 2.5
Nit
rog
en
co
ncen
trati
on
(m
g/L
)
Days
NH4-N
NOx-N

104 | P a g e
Jong Hyuk Hwang, Ph.D. Thesis
areasurface
flowrateNNONNONNHNNHNNONNOSDNR
effeffeff
_
)))()(())()(())()((( 324inf4inf3inf2 ×−+−−−−−+−+−=
Equation (7.2)
Figure 7.4 NOx-N concentrations and performance of the denitrification reactor
Increasing SDNR was observed over time. Biofilm control by N2 gas scouring was
carried out after 70 days of operation. Nitrogen gas was introduced inside of the
reactor for 2 minutes every 100 minutes at a flow rate of 15 L/min. Effluent solids
concentration increased due to scoured biofilm. Average SDNRs before and after
biofilm control were 1.50 and 1.91 g N/m2d. Maximum specific denitrification rate
was 2.4 g N/m2d. Solids balance (in Figure 7.8, Chapter 7.2) indicated that the
0
0.5
1
1.5
2
2.5
3
0
5
10
15
20
25
30
35
40
0 50 100 150 200 250
SD
NR
(g
N/m
2d
)
NO
x-N
co
nc
en
tra
tio
n (
mg
/L)
Day
Influent Final effluent SDNR

105 | P a g e
Jong Hyuk Hwang, Ph.D. Thesis
excessive biomass accumulation can be controlled by introducing nitrogen gas for
biofilm control purposes. In terms of system performance, it resulted in improved
denitrification performance, as well as made long-term operation possible.
Detailed analysis and discussion regarding biofilm control were explained in
Chapter 7.2.3.
Denitrification performance of this study was also compared with previous similar
studies in Table 7.2. Comparing Table 7.2 with Table 7.1, operational periods of
autotrophic denitrification from previous studies were relatively shorter than those of
nitrification, indicating that long-term operation of hydrogen-driven denitrification
may have been difficult.
Table 7.2 Performance comparison of previous denitrification studies with this
work
Reference Temp
(°C)
SDNR
(g/m2d)
Volumetric rate
(kg N/m3d)
Operation
periods (days)
Ergas et al. (2001) NA 1.17 0.36
Ho et al. (2001) NA 5.38 0.21 6
Lee et al. (2002) NA 2.68 0.478 0.13
Shin et al. (2005) 24 0.84 1.43 40
Celmer et al. (2008) 20 0.93 0.11 25
This study 20 1.77 0.19 240
It also should be noted that the denitrification reactor in this study was not inhibited
by the carried-over oxygen from the nitrification reactor. Cowman et al. (2005)
suggested that the high O2 pressure caused the carry-over of excess oxygen from the

106 | P a g e
Jong Hyuk Hwang, Ph.D. Thesis
nitrification reactor to following denitrification reactor, resulting in the increase of
nitrate concentration in the final effluent, however nitrate accumulation was not
observed in this study. Effect of DO on hydrogenotrophic denitrification from
consecutive operation was discussed in Chapter 7.3.
7.1.4 Conclusions
Total nitrogen removal in a two-step MBfR system, incorporating sequential
nitrification and hydrogen-driven autotrophic denitrification was investigated, in order
to achieve nitrogen removal by autotrophic bacteria alone. Consecutive operation of
nitrification and autotrophic denitrification was operated for 230 days. Average
specific nitrification rate of 1.87 g N/m2d could be achieved and performance was
very stable throughout the experimental periods. Nitrification performance from this
study was comparable to previous studies, considering this work was conducted at
slightly lower temperature than other studies. Performance of autotrophic
denitrification was maintained stably throughout the experimental periods. Average
specific denitrification rate was 1.77 g N/m2d and maximum specific denitrification
rate was 2.4 g N/m2d. This study showed that, with an appropriate biofilm control,
stable long-term operation of a fully autotrophic MBfR system for total nitrogen
removal was possible without major membrane cleaning procedures.
107 | P a g e
Jong Hyuk Hwang, Ph.D. Thesis
7.2 Biofilm control
7.2.1 Introduction and objectives
One major concern when operating MBfR is the accumulation of excess (waste)
biofilm (Syron and Casey, 2008). Excessive biofilm growth will not only cause non-
uniform flow distribution and channelling, but also inhibit substrate or gas diffusion,
eventually deteriorating the system performance (Semmens et al., 2003). Some
previous studies suffered from biofilm overgrowth, which prevented long-term steady
operation. Excessive biofilm growth is typically found in heterotrophic organic
removal applications where higher growth rates and higher yields lead to generation of
larger mass of excess solids (Semmens et al., 2003). To ensure stable operation, the
detachment or sloughing of waste biomass needs to be balanced with accumulation of
active biomass. Daily backwashing, which consists of compressed air scouring and
the complete replacement of the bulk liquid to remove the detached heterotrophic
biomass, was required to prevent channelling and remove excessive biomass in a
MBfR, at a COD loading of 8.94 kg/m3d (Pankhania et al., 1994). The absence of
backwashing for 6 days resulted in extensive biofilm growth and performance
deterioration. High reactor recirculation with air scouring and bulk liquid replacement
was beneficial, causing the increase of biofilm density and its adherence to the
membrane surface (Pankhania et al., 1999, Brindle et al., 1999). In MBfR with
loading of 5.1 kg COD/m3d (Semmens et al., 2003) which were lower than the 8.94 kg
COD/m3d reported by Pankhania et al. (1994), generous gas recycle (2 L/min) to mix

108 | P a g e
Jong Hyuk Hwang, Ph.D. Thesis
the reactor and control biofilm, was able to maintain performance for 3 months of
operation due to lower biomass generation. Excessive biofilm growth was also found
in MBfR for nitrogen removal without organic oxidation, mainly due to the
overgrowth of heterotrophic denitrifiers, growing at the outer side of biofilm (Suzuki
et al., 2000). No excessive biofilm growth was reported in the nitrification-only
MBfR.
Hydrogen-based autotrophic MBfR are also vulnerable to biomass accumulation,
especially due to the increase in the mineral component of biomass resulting from
increased local pH generated by high denitrification activity (Lee and Rittmann, 2003;
Celmer et al., 2006; Padhye et al., 2007). The precipitated minerals inhibited
hydrogen diffusion by covering portions of the membrane fiber (Chapter 6.1).
Increased shear force including faster mixing and nitrogen sparging could reduce the
biofilm thickness, thus ensuring higher biofilm performance (Celmer et al., 2008a).
Intermittent ultrasound treatment was also proven to be effective for biofilm control
without damaging the membrane itself (Celmer et al., 2008b).
Although autotrophic nitrification and autotrophic denitrification generate less
biomass than heterotrophic denitrification, high removal rates and lack of biomass
withdrawal mechanisms in an MBfR still cause the build-up of excessive biofilm.
Therefore, the use of nitrogen sparging as a means of biofilm control of MBfR was
evaluated for stable operation. This chapter will discuss the suitability of nitrogen
sparging as the biofilm control strategy for stable operation and the detailed
investigation of solids balance and biofilm thickness.

109 | P a g e
Jong Hyuk Hwang, Ph.D. Thesis
7.2.2 Materials and methods
This section was written using the data collected during 240 days of consecutive
operation, which was shown in previous Chapter 7.1.
The denitrifying MBfR was sparged with nitrogen gas for 2 minutes out of every
100 min of operation at a 15 L/min flow-rate, starting at day 70 of operation. The
purpose of sparging was to induce mild biofilm sloughing for biofilm thickness
control. Nitrogen was applied through a coarse bubble diffuser to create shear force.
Nitrogen sparging was specifically chosen (rather than air), because of possible
adverse effect on denitrification due to oxygen in the air. Since sparging was done
just for 2 minutes per every 2 hours, DO condition in denitrification was not changed
by the nitrogen sparging. No biofilm control was conducted on the nitrification
reactor, as no excessive biofilm growth was found during the experimental period.
This chapter aimed to achieve stable operation by removing the excessive biofilm
build-up – defined as accumulation that begins to impact the performance negatively.
A solids mass balance was established. Theoretical solids generation was calculated
from the stoichiometries of each reaction below, and the solids balance was calculated
based on these biomass yields.
- Autotrophic nitrification (Metcalf and Eddy, Equation (7-91), 2003)
NH4+ + 1.863O2 + 0.098CO2 → 0.0196C5H7NO2 + 0.98NO3
- + 0.941 H2O + 1.98H+
- Autotrophic denitrification with hydrogen (WERF, 2003)

110 | P a g e
Jong Hyuk Hwang, Ph.D. Thesis
NO3- + H+ + 2.86H2 +0.15CO2 → 0.0286C5H7NO2 + 0.49N2 + 3.14H2O
Theoretical yield of heterotrophic denitrification was estimated as follows.
- 0.40 g VSS yield/g COD consumed (Metcalf and Eddy, Table (8-18), 2003)
- 2.86 g COD consumed/ g NO3-N (from stoichiometry of methanol)
5CH3OH + 6NO3- → 3N2 + 5CO2 + 7H2O + 6OH-
5CH3OH + 7.5O2 → 5CO2 + 10H2O
Theoretical biomass yields from above equations are 0.16 g VSS/g N for
nitrification and 0.23 g VSS/g N for autotrophic denitrification. Rezania et al. (2006)
reported similar true yield of 0.27 g VSS/g N in autotrophic denitrification. According
to the stoichiometry of heterotrophic denitrification above, its yield can be estimated
as 1.14 g VSS/g N, which is five times higher than that of autotrophic denitrification.
Biofilm thickness was measured to investigate whether nitrogen sparging can
effectively prevent the overgrowth of biofilm. It was not measured before the nitrogen
sparging was initiated as the biofilm was assumed to be still developing. After the
deterioration of system performance was confirmed, the biofilm control and thickness
measurements were started using the method described by Celmer et al. (2008).
Biofilm thickness was measured by removing the membrane module with biofilm
from the denitrifying MBfR and placing it in a vertical position for 20 minutes to
allow excess water to drain. Then, the thickness was calculated based on the liquid
volume displaced by the biomass and the membrane.

111 | P a g e
Jong Hyuk Hwang, Ph.D. Thesis
7.2.3 Results and discussions
1) Failed denitrification reactor case
Before showing the results regarding biofilm control, the case of the failed
denitrification reactor due to improper biofilm control will be addressed. The
denitrification reactor was operated between March 2008 and June 2008 as the second
part of consecutive operation before the operation described in Chapter 7.1.
Figure 7.5 shows NOx-N concentration and SDNR from the failed denitrification
reactor. Denitrification performance was stable for the first 35 days, and then started
to deteriorate over time except some fluctuations around 60 days of operation.
Average specific denitrification rate during 15 to 30 days of operation (when the
performance was steady) was 1.42 g N/m2d and maximum was 1.60 g N/m2d.
Deterioration of denitrification reactor was caused by the excessive growth of
biomass. Biomass generation, lack of proper biofilm control and additional biomass
would accelerate performance deterioration.
Eventually, the membrane module started to float, possibly due to trapped nitrogen,
which was generated from denitrification activity (inside of the membrane fibers)
similarly to the rising sludge issues in conventional settling tanks. It could also have
been caused by hydrogen gas, which could leak from the membrane fiber connections.
Figure 7.6 shows that the bottom part of the membrane module was floated above the
membrane support at the bottom of the reactor.

Jong Hyuk Hwang, Ph.D.
Figure 7.5 NOx-N concentration
This floated membrane reactor had to be removed
operation due to a visually detectable hydrogen leak, possibly caused by pressure
build-up by the excessive biomas
was collected and the solids contents were measured. The amount of solids in
denitrification reactor at 90 days was measured as 4380 mg, which can be translated
into 2740 mg/L, if it was
which indicates that mineral precipitation was not an issue in
reactor, receiving feed from the n
0
5
10
15
20
25
30
35
40
0 20
NO
x-N
Co
nc. (m
g/L
)
Incoming+Converted NOx
Jong Hyuk Hwang, Ph.D. Thesis
N concentration and SDNR from failed denitrification
membrane reactor had to be removed and replaced after 90 days of
visually detectable hydrogen leak, possibly caused by pressure
up by the excessive biomass growth. Biomass from the failed membrane fibers
was collected and the solids contents were measured. The amount of solids in
denitrification reactor at 90 days was measured as 4380 mg, which can be translated
was suspended. Volatile portion of harvested solids was 81%,
mineral precipitation was not an issue in the
receiving feed from the nitrification reactor.
20 40 60 80Day
Incoming+Converted NOx-N Final NOx-N
112 | P a g e
and SDNR from failed denitrification reactor
after 90 days of
visually detectable hydrogen leak, possibly caused by pressure
failed membrane fibers
was collected and the solids contents were measured. The amount of solids in the
denitrification reactor at 90 days was measured as 4380 mg, which can be translated
latile portion of harvested solids was 81%,
the denitrification
0
0.2
0.4
0.6
0.8
1
1.2
1.4
1.6
1.8
100
SD
NR
(g
N/m
2d
)
SDNR

113 | P a g e
Jong Hyuk Hwang, Ph.D. Thesis
Figure 7.6 Picture of the denitrification reactor in a floated state
2) Performance of nitrification and denitrification reactor
Performance of consecutive operation during biofilm control was addressed in
Chapter 7.1.
Nitrification rate reactor did not appear to be adversely affected by excessive
biofilm growth. TSS concentration in the nitrification reactor effluent was measured
only sporadically. In the five measurements done during the whole experiment,
effluent solids were consistently lower than 5 mg TSS/L.
114 | P a g e
Jong Hyuk Hwang, Ph.D. Thesis
An average SNR of 1.87 g N/m2d translates to 4.4 mg VSS/L of biomass generation
according to the theoretical biomass yield and flowrate. The calculations and TSS
measurements point to the phenomenon of the nitrifiers escaping the nitrification
reactor and continuing to be active in the subsequent denitrification reactor. The
presence of nitrifiers in the effluent from the nitrification reactor was confirmed by
batch test – the results were shown in Chapter 7.1.
The denitrification reactor periodically suffered from excessive biofilm growth due
to 30% higher yield (0.23 g VSS/g N) than nitrification (0.16 g VSS/g N), before the
nitrogen sparging was initiated on Day 70. Additional nitrifier growth and perhaps
even heterotrophic growth would further promote biofilm growth in the denitrification
reactor.
No biofilm control was implemented until Day 70 of operation, when the SDNR
stabilized at 1.5 g N/m2d. Excessive biofilm growth was (visually) observed around
Day 60. A sharp decline of SDNR on Day 66 led to the implementation of the biofilm
control measures, which involved nitrogen gas sparging. SDNR increased to 1.92 g
N/m2d and average NOx-N concentration in final effluent decreased from 7.4 mg/L to
3.7 mg/L following biofilm control. This suggested that the long-term stable
operation of MBfR (exceeding 60 days in this study) would not be possible without
proper biofilm control measures.
3) Biofilm control by N2 gas sparging

115 | P a g e
Jong Hyuk Hwang, Ph.D. Thesis
Gas scouring was chosen as a biofilm control measure, as it was tested previously
by other researchers (Pankhania et al., 1994; Pankhania et al., 1999; Brindle et al.,
1999; Semmens et al., 2003). However, air sparging was excluded due to its possible
adverse effect on hydrogenotrophic denitrification, so nitrogen gas was chosen due to
its inertness. Nitrogen gas is generated in the process of denitrification and there may
be an opportunity to re-use it in full scale (Rezania et al., 2007).
Nitrogen sparging resulted in an improved denitrification performance. The
average SDNR increased from 1.50 g N/m2d to 1.92 g N/m2d. Denitrification
performance slightly declined around Day 150 due to local biofilm loss caused by
local excessive shear force. The system did not experience any major performance
deterioration (such as the one observed prior to nitrogen sparging) for over 6 months.
Therefore, it was concluded that long-term stable operation could be achieved.
Since the synthetic influent used in this study did not contain any volatile solids,
the solids in the final effluent originated from the detachment/washout from both
reactors. Solids in the final effluent were measured from the effluent collected
overnight. Figure 7.7 shows TSS and VSS concentration in the final effluent.
Effluent TSS was mostly below 5 mg/L before nitrogen sparging, however it increased
substantially with the shear force induced by nitrogen sparging.

116 | P a g e
Jong Hyuk Hwang, Ph.D. Thesis
Figure 7.7 Total suspended solids (TSS) and volatile suspended solids (VSS)
concentrations in the effluent from the denitrification reactor
Average TSS increased from 2.5 mg/L to 12.7 mg/L by nitrogen sparging. Average
VSS/TSS ratio of 0.88 was higher than those from previous studies (Lee and Rittmann,
2003; Celmer et al., 2007; Chapter 6.1 in this thesis) and indicated that the
denitrification was not affected by inorganic precipitation. Effluent TSS concentration
fluctuated from 2 mg/L to 26 mg/L depending on daily sparging events, which
sometimes exerted only local shear force because of the location of the course-bubble
diffuser.
4) Solids balance and biofilm thickness
0
5
10
15
20
25
30
0 50 100 150 200 250
TS
S a
nd
VS
S (
mg
/L)
Day
TSS
VSS

117 | P a g e
Jong Hyuk Hwang, Ph.D. Thesis
In order to find out how much biomass generation would be expected inside the
system, theoretical biomass generation was estimated – Figure 7.8, comprising of
three biomass-generating reactions; 1) nitrification in the nitrification reactor, 2)
denitrification in the denitrification reactor and 3) nitrification in the denitrification
reactor. Theoretical biomass generation was calculated based on the biomass yield, as
described in the Materials and Methods section of this chapter, the difference in
related nitrogen concentrations, and daily flow-rates. Detailed equations are shown in
Table 7.3.
Figure 7.8 Theoretical biomass generation based on stoichiometry and nitrogen
removal rate
0
10
20
30
40
50
60
70
80
90
100
0 50 100 150 200 250
Th
eo
reti
ca
l b
iom
as
s g
en
era
tio
n (
mg
/d)
Day
Nitrification in nitrification reactor
Nitrification in denitrification reactor

118 | P a g e
Jong Hyuk Hwang, Ph.D. Thesis
Table 7.3 Equations for estimating biomass generation
Biomass-generating
reaction Equation
Nitrification in the
nitrification reactor (NH4-Ninfluent - NH4-Nnitrification effluent) × flowrate × 0.16
Denitrification in the
denitrification reactor
((NO2-Nnitrification effluent + NO3-Nnitrification effluent + (NH4-
Nnitrification effluent - NH4-Nfinal effluent)) – (NO2-Nfinal effluent + NO3-
Nfinal effluent)) × flowrate × 0.23
Nitrification in the
denitrification reactor (NH4-Nnitrification effluent - NH4-Nfinal effluent) × flowrate × 0.16
Figure 7.8 shows a similar trend to that of SNR in Figure 7.2 and SDNR in Figure
7.4. Although SNR was higher than or similar to SDNR, biomass generation by
denitrification was higher than that by nitrification due to its higher yield, as shown
from the stoichiometries. The fraction of biomass generated by nitrification in the
denitrification reactor (dashed line) varied from 0.1 % to 6.4 % and accounted for an
average of 3.0 % of total theoretical biomass generation.
Since no solids accumulation or solids breakthrough was observed in the
nitrification reactor, it could be assumed that the nitrification reactor was balanced in
terms of solids generation and discharge. This also indicated that the subsequent
denitrification reactor would be more vulnerable to excessive solids accumulation. In
summary, all the solids generation depicted in Figure 7.8 would be accumulated in the
denitrification reactor. Therefore, biofilm thickness control would be essential in the
denitrification reactor.

119 | P a g e
Jong Hyuk Hwang, Ph.D. Thesis
It would be desirable to maintain a constant biofilm thickness when operating an
MBfR that achieves an equilibrium between biomass accumulation and
sloughing/endogenous decay. As TSS and VSS concentration in the final effluent
increased by nitrogen sparging as shown in Figure 7.7, theoretical biomass generation
in Figure 7.8 could be compared to measured VSS discharge in order to show that
excessive solids accumulation can be controlled by nitrogen sparging and long-term
stable operation can be achieved. Theoretical biomass generation in Figure 7.9 shows
the sum of all the biomass generation, depicted individually in Figure 7.8. Discharged
biomass in Figure 7.9 was calculated from daily VSS discharge and flowrate from
Figure 7.7.
Figure 7.9 Theoretical biomass generation and discharged biomass from the
denitrifying reactor (nitrogen sparging started on day 70)
0
50
100
150
200
250
300
0 50 100 150 200 250
Bio
ma
ss
ge
ne
rati
on
an
d d
isc
ha
rge
d
VS
S (
mg
/d)
Day
Theoretical biomass generation
discharged biomass

120 | P a g e
Jong Hyuk Hwang, Ph.D. Thesis
Figure 7.9 shows the accumulation of biomass before nitrogen sparging as the
amount of washed out biomass was far lower than the amount of generated biomass.
After the initiation of periodic nitrogen sparging, the amount of discharged biomass
often exceeded the theoretical biomass generation. It should also be noted that the
theoretical solids generation in this study only includes the nitrification and
denitrification reactions. Heterotrophic growth on the organic substrate generated by
biomass decay was not accounted for in the calculation, although it is a very likely
contribution to the total biomass growth. Coexistence of nitrifiers and heterotrophs
has been found in autotrophic nitrifying suspended growth cultures (Rittmann et al.,
1994) and biofilms (Kindaichi et al., 2004; Okabe et al., 2005; Lackner et al., 2008)
maintained without an external organic carbon source. It was also reported that
autotrophic nitrifying systems with long SRT, such as a biofilm systems, would have
significant amount of heterotrophs (Nogueira et al., 2005). Even though complete
solids balance could not be explained in Figure 7.9, the discharged biomass amount
was on a par with the generated biomass amount, in spite of fluctuations.
Average theoretical biomass generation of 112 mg VSS/d could be translated into
10.5 mg/L of effluent VSS concentration, resulting in 11.98 mg TSS/L based on
VSS/TSS ratio of 0.88 from the data in Figure 7.7. Although high amount of biomass
generation is naturally inevitable due to the high nitrogen removal rate, 12 mg/L of
TSS in final effluent can be problematic, considering that this process was intended to
achieve tertiary treatment. Therefore, measures for periodic biofilm thickness control

121 | P a g e
Jong Hyuk Hwang, Ph.D. Thesis
(similar to filter backwashing) are necessary to attain steady-state high-rate operation
of MBfR. Solids analysis in this study was conducted from the samples containing the
final effluent, accumulated over at least 12 hours, constituting a form of composite
sampling. By visual observation, the largest solids discharge occurred within 10
minutes of nitrogen sparging. Therefore, other sparging schemes should also be
explored, varying the sparging strength and interval in order to minimize and/or
equalize the effluent solids discharge.
In order to show that excessive biofilm accumulation could be restrained by
nitrogen sparging, the biofilm thickness was also monitored after the introduction of
sparging. Biofilm thickness was not monitored before the introduction of nitrogen
sparging as the biofilm was assumed to be developing. Figure 7.10 shows the biofilm
thickness measured during the experimental period.
As seen in Figure 7.10, the biofilm thickness ranged from 220 µm to 300 µm with
an average thickness of 270 µm throughout the experimental period. Continuous
removal of accumulating biomass by nitrogen sparging was shown to maintain steady
biofilm thickness, as well as the steady system performance over 190 days of
experiment. However, more studies regarding various sparging rates and biofilm
structure changes would be required to understand the full effect of biofilm control.
Excessive biofilm growth exerts several negative effects on MBfR performance. It
decreases HRT, limits diffusion of substrate and electron donors through the biofilm,
and results in an uncontrolled unloading of biomass from the biofilm.
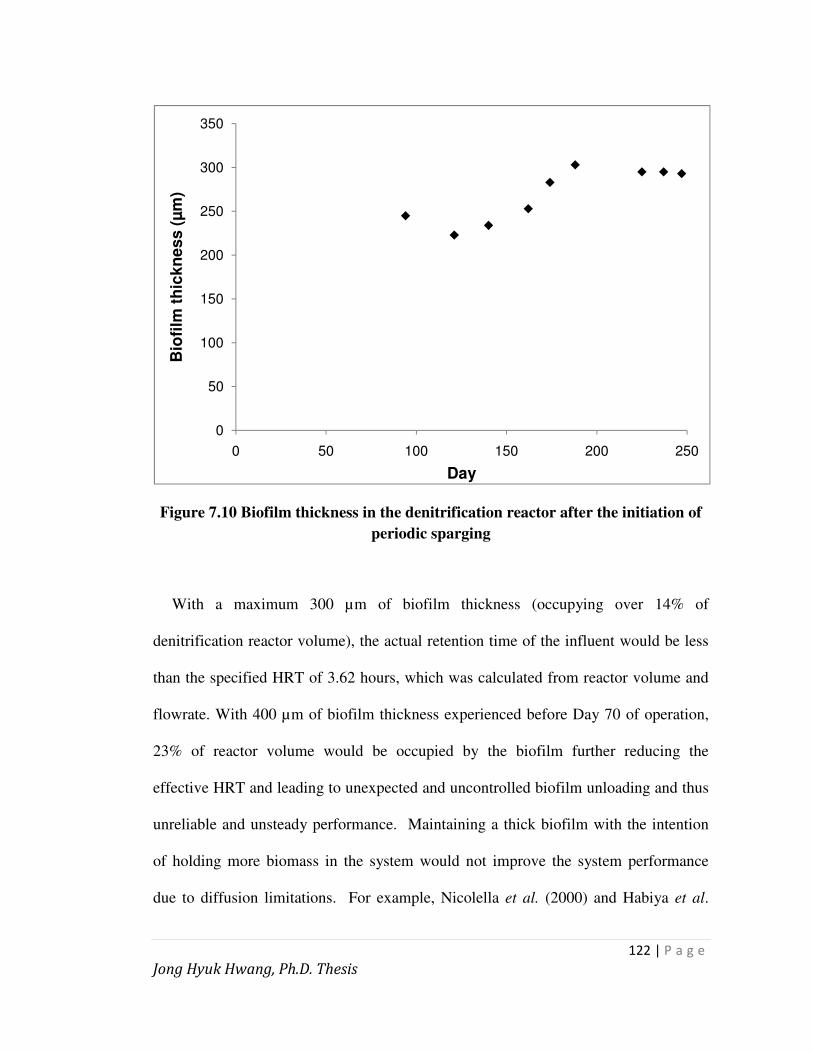
122 | P a g e
Jong Hyuk Hwang, Ph.D. Thesis
Figure 7.10 Biofilm thickness in the denitrification reactor after the initiation of
periodic sparging
With a maximum 300 µm of biofilm thickness (occupying over 14% of
denitrification reactor volume), the actual retention time of the influent would be less
than the specified HRT of 3.62 hours, which was calculated from reactor volume and
flowrate. With 400 µm of biofilm thickness experienced before Day 70 of operation,
23% of reactor volume would be occupied by the biofilm further reducing the
effective HRT and leading to unexpected and uncontrolled biofilm unloading and thus
unreliable and unsteady performance. Maintaining a thick biofilm with the intention
of holding more biomass in the system would not improve the system performance
due to diffusion limitations. For example, Nicolella et al. (2000) and Habiya et al.
0
50
100
150
200
250
300
350
0 50 100 150 200 250
Bio
film
th
ick
ne
ss
(µ
m)
Day
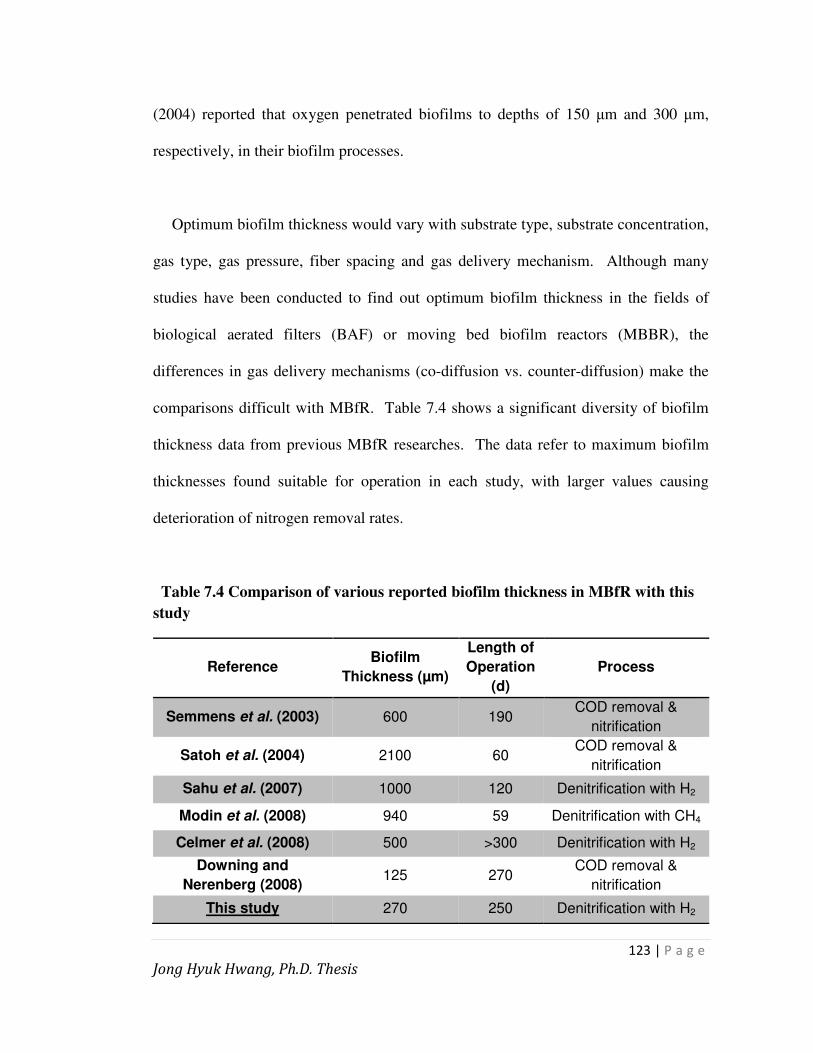
123 | P a g e
Jong Hyuk Hwang, Ph.D. Thesis
(2004) reported that oxygen penetrated biofilms to depths of 150 µm and 300 µm,
respectively, in their biofilm processes.
Optimum biofilm thickness would vary with substrate type, substrate concentration,
gas type, gas pressure, fiber spacing and gas delivery mechanism. Although many
studies have been conducted to find out optimum biofilm thickness in the fields of
biological aerated filters (BAF) or moving bed biofilm reactors (MBBR), the
differences in gas delivery mechanisms (co-diffusion vs. counter-diffusion) make the
comparisons difficult with MBfR. Table 7.4 shows a significant diversity of biofilm
thickness data from previous MBfR researches. The data refer to maximum biofilm
thicknesses found suitable for operation in each study, with larger values causing
deterioration of nitrogen removal rates.
Table 7.4 Comparison of various reported biofilm thickness in MBfR with this
study
Reference Biofilm
Thickness (µm)
Length of
Operation
(d)
Process
Semmens et al. (2003) 600 190 COD removal &
nitrification
Satoh et al. (2004) 2100 60 COD removal &
nitrification
Sahu et al. (2007) 1000 120 Denitrification with H2
Modin et al. (2008) 940 59 Denitrification with CH4
Celmer et al. (2008) 500 >300 Denitrification with H2
Downing and
Nerenberg (2008) 125 270
COD removal &
nitrification
This study 270 250 Denitrification with H2

124 | P a g e
Jong Hyuk Hwang, Ph.D. Thesis
Although nitrogen removal could be improved in thick biofilms designed for COD
and ammonia removal by developing heterotrophic denitrification in the anoxic part of
the biofilm (Semmens et al., 2003; Satoh et al., 2004), system failure was unavoidable
without proper biofilm control due to the increasing volume of biofilm (Semmens et
al., 2003). Downing and Nerenberg (2008) implemented nitrogen sparging
specifically to limit oxygen transfer from the water surface to the bulk liquid in their
reactor and reported the thinnest biofilm. Although the methods for biofilm thickness
measurement varied from previous results shown in Table 7.4, the biofilm thickness of
270 µm found in this study falls into the lower range of the reported biofilm
thicknesses. It has allowed continuous MBfR operation at a steady denitrification rate
which was higher than the rates obtained during the periods with thicker biofilm.
7.2.4 Conclusions
Sequential nitrification and hydrogen-driven autotrophic denitrification was tested
in a series of two MBfRs treating synthetic non-nitrified secondary wastewater, over a
period of 250 days. Biofilm thickness control using nitrogen sparging in the
denitrification reactor was initiated on Day 70, to ensure long-term stable operation.
The nitrification reactor had an average specific nitrification rate of 1.88 g N/m2d
and exhibited consistent performance over 250 days, without excessive biofilm growth.
No biofilm control was found to be necessary.

125 | P a g e
Jong Hyuk Hwang, Ph.D. Thesis
The subsequent denitrification reactor suffered from excessive biofilm growth,
resulting in the decline of the specific denitrification rate (SDNR). Excessive biofilm
accumulation resulted from the higher biomass yield in denitrification and to a much
lesser extent due to the carry-over of solids from the nitrifying reactor.
Biofilm control by nitrogen sparging, started on Day 70, resulted in an improved
denitrification performance and ensured long-term stable operation. The average
specific denitrification rate (SDNR) increased from 1.50 g N/m2d to 1.92 g N/m2d
after sparging.
Biofilm thickness was maintained at an average of 270 µm, indicating biomass
accumulation and nitrogen scouring was balanced and long-term (190 days) stable
operation could be maintained.
Effluent solids concentration increased immediately after sparging. Average long-
term effluent total suspended solids increased from 2.5 mg/L to 12.7 mg/L.
7.3 Effect of bulk dissolved oxygen in consecutive operation
7.3.1 Introduction and objectives
Heterotrophic denitrifying bacteria prefer oxygen as an electron acceptor over
nitrate. It has been known that denitrification is inhibited in the presence of DO
concentrations over 0.2 mg/L (Terai and Mori, 1975, Metcalf and Eddy, 2003). And it

126 | P a g e
Jong Hyuk Hwang, Ph.D. Thesis
also has been reported that the denitrification activity ceases with oxygen
concentrations higher than 1.0 mg/L (Whitmyer et al., 1991).
Even though DO might affect denitrification activity negatively, the mechanisms
inhibiting denitrification differs between heterotrophic denitrification and autotrophic
denitrification by hydrogen. In heterotrophic denitrification, the presence of DO would
switch off the activity of heterotrophic denitrifiers biologically. The inhibition
mechanism of presence of DO on autotrophic denitrification using hydrogen is still
unclear. It is not even clear whether the presence of oxygen actually inhibits
autotrophic denitrification.
There have been conflicting results regarding the effect of DO on the performance of
hydrogen-driven denitrification as shown in Chapter 6.2.
Since the effect of DO on hydrogenotrophic denitrification was investigated in stand-
alone denitrification reactor, the objective of this chapter is to investigate the effect of
bulk DO, carried over from the nitrification reactor, on hydrogenotrophic denitrification
performance during consecutive operation.
7.3.2 Materials and methods
The effect of DO was investigated in consecutive nitrification and denitrification
MBfR for 85 days between June 2008 and September 2008. It was conducted
simultaneously with the experiment, described in Chapter 7.1. Therefore, the
experimental details were already described in Chapter 7.1.

127 | P a g e
Jong Hyuk Hwang, Ph.D. Thesis
Regarding DO control, the effluent from the nitrification reactor was diverted to a
separate (middle) tank (0.3 L) before entering into denitrification reactor in order to
reduce (or completely eliminate) residual DO coming from the nitrification reactor,
during day 55 - 85 of operation. Nitrogen gas was introduced continuously through a
diffuser in the middle tank. The system configuration is shown in Figure 7.11.
7.3.3 Results and discussion
Despite controlling the oxygen supply in the nitrification reactor to limit residual
DO in the denitrification reactor (Brindle et al., 1998), sufficient oxygen was supplied
for effective nitrification (Chapter 5.4), also allowing the investigation of a DO effect
on the denitrification reactor. Average DO from the effluent of the nitrification
reactor was 15.8 mg O2/L, which is higher than the oxygen saturation concentration
(9.1 mg O2/L at 20°C) due to the use of pure oxygen. The average DO inside the
denitrification reactor was 1.0 mg O2/L before DO control was started at day 55 of
operation.
An oxygen balance suggests that most of DO difference was caused by the
nitrification activity within the denitrification reactor. NH4-N concentrations in the
nitrification reactor effluent and final effluent were 4.3 mg NH4-N/L and 0.9 mg NH4-
N/L, respectively. According to the stoichiometry of nitrification - Equation (7.3),
4.25 g of oxygen is required to oxidize 1 g of ammonia nitrogen. Therefore, 3.4 mg
NH4-N/L (difference between above two values) would require 14.5 mg O2/L. The
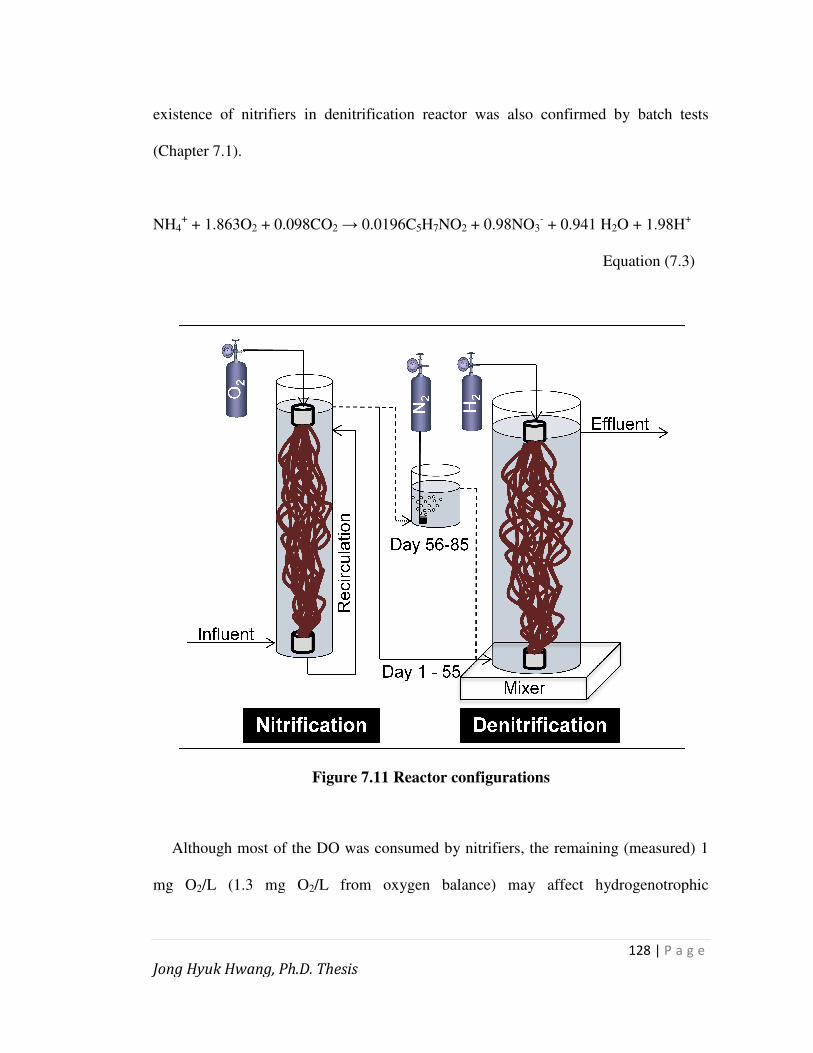
Jong Hyuk Hwang, Ph.D.
existence of nitrifiers in denitrification reactor was
(Chapter 7.1).
NH4+ + 1.863O2 + 0.098CO
Although most of the DO was consumed by nitrifiers, the remaining (measured) 1
mg O2/L (1.3 mg O
Jong Hyuk Hwang, Ph.D. Thesis
existence of nitrifiers in denitrification reactor was also confirmed by batch tests
+ 0.098CO2 → 0.0196C5H7NO2 + 0.98NO3- + 0.941 H
Equation
Figure 7.11 Reactor configurations
Although most of the DO was consumed by nitrifiers, the remaining (measured) 1
/L (1.3 mg O2/L from oxygen balance) may affect hydrogenotrophic
128 | P a g e
ed by batch tests
+ 0.941 H2O + 1.98H+
Equation (7.3)
Although most of the DO was consumed by nitrifiers, the remaining (measured) 1
/L from oxygen balance) may affect hydrogenotrophic

129 | P a g e
Jong Hyuk Hwang, Ph.D. Thesis
denitrification. Therefore, DO entering the denitrification reactor was artificially
controlled to investigate this potential effect.
As explained in the materials and methods section, the effluent from the
nitrification reactor was diverted to a middle tank (0.3 L) before entering the
denitrification reactor in order to eliminate residual DO by nitrogen gas during day 55-
85. Figure 7.12 shows the DO concentration entering the denitrification reactor as
well as inside the denitrification reactor.
Figure 7.12 DO concentrations entering and inside the denitrification reactor
0
0.5
1
1.5
2
2.5
0
5
10
15
20
25
0 20 40 60 80
DO
in
sid
e d
en
itri
fic
ati
on
re
ac
tor
(mg
/L)
DO
en
teri
ng
th
e d
en
itri
fic
ati
on
re
ac
tor
(mg
/L)
Days
DO entering the denitrification reactor
DO inside denitrification reactor

130 | P a g e
Jong Hyuk Hwang, Ph.D. Thesis
Average DO concentrations entering the denitrification reactor from day 1-55 and
day 56-83 were 15.8 mg O2/L and 1.7 mg O2/L, respectively. Average DO
concentrations within the denitrification reactor during the same operating periods were
1.0 mg O2/L and 0.2 mg O2/L, respectively. As shown in Figure 7.12, the DO in the
influent and within the denitrification reactor, was substantially reduced by N2 gas
sparging, so the effect of oxygen on hydrogenotrophic denitrification could be
investigated. Figure 7.13 shows the relationship between reactor DO and SDNR.
Figure 7.13 Relationship between measured reactor DO and SNDR
Although a slight downward trend of SDNR over increasing DO can be observed in
Figure 7.13, the degree of DO effect was not as pronounced as observed in past studies
0
0.5
1
1.5
2
0 0.5 1 1.5 2 2.5
SD
NR
(g
N/m
2d
)
Reactor DO (mg/L)

131 | P a g e
Jong Hyuk Hwang, Ph.D. Thesis
involving heterotrophic denitrification. Average SDNRs before and after DO control
were 1.46 g N/m2d and 1.47 g N/m2d, respectively. Standard deviations were 0.19 and
0.14, respectively.
Based on the experimental data, it can be concluded that the effect of DO on
hydrogenotrophic denitrification in consecutive operation is negligible.
As stated earlier, some previous studies (Kurt et al., 1987, Gross et al. 1986)
suggested the possible adverse effect of DO on hydrogenotrophic denitrification. It
was suggested that the presence of oxygen would inhibit the activity of
hydrogenotrophic denitrification, based on the measurements of 5 % (Kurt et al., 1987)
and up to 15% (Gross et al. 1986) more hydrogen consumption than the stoichiometric
requirement (0.36 g H/g N) from Equation (7.4).
2NO3- + 5H2 → N2 + 4H2O + 2OH- (Equation 7.4)
These studies suggested that the reduction of oxygen with hydrogen, producing
water - Equation 7.5, would demand more hydrogen supply than required for
hydrogenotrophic denitrification.
2H2 + O2 → 2H2O Equation (7.5)
However, there are two additional issues that need to be considered in such an
analysis. Firstly, the stoichiometric equation (Equation (7.4)) used for theoretical

132 | P a g e
Jong Hyuk Hwang, Ph.D. Thesis
hydrogen consumption in these studies did not include cell growth, causing the
underestimation of theoretical hydrogen requirements. A stoichiometric equation for
hydrogenotrophic denitrification including cell growth (Equation (7.6), WERF, 2003)
suggests 0.48 g H/g N of hydrogen is needed, which is 25% higher than the hydrogen
requirement from Equation (7.4).
NO3- + H+ + 2.86H2 +0.15CO2 → 0.0286C5H7NO2 + 0.49N2 + 3.14H2O
(Equation 7.6)
Secondly, although hydrogen-oxidizing bacteria can grow under micro-oxic
conditions, the reaction shown in Equation (7.5) is highly exergonic and needs to be
catalyzed by the specific enzyme, hydrogenase (Madigan et al., 2009). Therefore, it is
highly unlikely that the reaction shown in Equation (7.5) caused the over-requirement
of hydrogen (as some studies claimed) without substantial increases in temperature or
fire-related problem.
Ho et al. (2002) reported that there was an 8 % reduction in denitrification rate under
saturated DO condition compared to 2 mg O2, conditions, while nitrification was highly
inhibited with the decrease of DO. The results, shown in Chapter 6.2 regarding the
effect of DO from stand-alone operation, did not test denitrification under saturated DO
conditions, primarily because achieving saturated DO conditions requires high intensity
of air diffusion, which would cause serious scouring of the biofilm.

133 | P a g e
Jong Hyuk Hwang, Ph.D. Thesis
Cowman et al. (2005) reported that the high O2 pressure for nitrification caused the
carry-over of excess oxygen from the nitrification reactor to the subsequent
denitrification reactor, resulting in the increase of nitrate concentration in the final
effluent. Therefore, they suggested that proper O2 control should be done to avoid
inhibiting denitrification by high oxygen.
The present findings concurred with those of Schnobrich et al. (2007) who reported
successful treatment of groundwater containing high DO in a pilot-scale study, and
those of Sahu et al.(2007) who reported that the steady denitrification efficiency could
be achieved, regardless of the DO in the influent, in a bench-scale MBfR.
7.3.4 Conclusions
The effect of oxygen on hydrogenotrophic denitrification in MBfR was investigated.
The consecutive nitrification-denitrification reactor, representing the system treating
non-nitrified secondary effluent from domestic wastewater treatment plants, was
operated under various DO conditions.
Most of the residual oxygen from the nitrification reactor was consumed by nitrifiers
in the denitrification reactor. Without any DO control, the remaining 1 mg O2/L (during
the first 55 days of experiment) did not result in lower denitrification performance than
when the DO was controlled at 0.2 mg O2/L. SDNR before and after DO control were
1.46 g N/m2d and 1.47 g N/m2d, respectively, suggesting the effect of DO on

134 | P a g e
Jong Hyuk Hwang, Ph.D. Thesis
hydrogenotrophic denitrification was negligible in the consecutive nitrification and
denitrification system. Although this study observed the negligible effect of DO on
hydrogenotrophic denitrification in MBfR configuration, it does not mean that the effect
of DO on hydrogenotrophic denitrification would be negligible because most of
denitrification activity in MBfR would happen at the surface of membrane fiber, where
DO was not measured in this thesis. Therefore, the effect of DO should be confirmed in
suspended biomass.
7.4 Effect of loading rate on nitrification and denitrification during
consecutive operation
7.4.1 Introduction and objectives
Although the nitrification and denitrification performances shown in Table 7.1 and
7.2 were comparable or higher than those from previous similar studies, the reactor was
not operated under substrate diffusion-limited condition and the maximum achievable
removal rates have not been investigated using PMP membrane, which is newly
developed and supposed to have high potential of gas delivery. Since all investigations
regarding the effect of various operating parameters, such as DO (Chapter 7.3, Chapter
6.2, Chapter 5.4), temperature (Chapter 6.3), biofilm control (Chapter 7.2) and mineral

135 | P a g e
Jong Hyuk Hwang, Ph.D. Thesis
precipitation (Chapter 6.1) were completed, the investigation on maximum achievable
nitrogen removal rate was initiated.
7.4.2 Materials and methods
The experimental details were as presented in Chapter 7.1, except the HRT. The
loading rate was increased by increasing influent flowrate during consecutive operation.
Effect of loading rate was investigated for 90 days from March 2009 to May 2009.
7.4.3 Results and discussions
Influent flowrate was raised from 11.6 L/d (HRT 1.03 hr) to 41.4 L/d (HRT 0.29 hr).
Figure 7.14 shows the change of HRT during this test. Figure 7.15 shows the NH4-N
concentration in the influent, nitrification reactor effluent, final effluent and HRT over
time.
The residual NH4-N concentration from the nitrification reactor was low enough to
be completely removed in following denitrification reactor at HRT of 1 hr. With the
decrease of HRT, NH4-N concentration from nitrification reactor started to increase
over 10 mg/L at HRT of 0.3 hr. Even at very low HRT, some nitrification still occurred

136 | P a g e
Jong Hyuk Hwang, Ph.D. Thesis
in the denitrification reactor, indicating that residual oxygen was fed to the
denitrification reactor and that the nitrification reactor was not under oxygen-limited.
Figure 7.16 shows NOx-N concentration of the influent and effluent of the
denitrification reactor, and HRT.
Figure 7.14 Change of HRT
Influent NOx-N concentration decreased with increasing HRT as NH4-N incoming
from the nitrification reactor to the denitrification reactor decreased. However, the
degree of incoming NOx-N reduction was lower than the increase of NH4-N from the
nitrification reactor effluent as shown in Figure 7.15 indicating that nitrification took
place consistently in the denitrification reactor regardless of HRT. Due to the decrease
of incoming NOx-N concentration to the denitrification reactor, the increase of loading
rate to denitrification reactor would be less than anticipated by the HRT decrease.
0.0
0.2
0.4
0.6
0.8
1.0
1.2
0 20 40 60 80 100
HR
T (
hr)
Days

137 | P a g e
Jong Hyuk Hwang, Ph.D. Thesis
Figure 7.15 Nitrification reactor performance
Figure 7.16 Denitrification reactor performance as affected by increasing load
0.0
0.2
0.4
0.6
0.8
1.0
1.2
0
5
10
15
20
25
30
35
40
0 20 40 60 80 100
HR
T (
hr)
NH
4-N
co
ncen
trati
on
(m
g/L
)
Days
Influent Nitrification reactor Effluent Final Effluent HRT
0.0
0.2
0.4
0.6
0.8
1.0
1.2
0
5
10
15
20
25
30
35
0 20 40 60 80 100
HR
T (
hr)
NO
x-N
co
ncen
trati
on
(m
g/L
)
Days
Influent Effluent HRT

138 | P a g e
Jong Hyuk Hwang, Ph.D. Thesis
Figure 7.17 shows the relationship between specific loading rate and both SNR and
SDNR.
Figure 7.17 Relationship between specific loading rate and SNR, SDNR
Nitrification performance : The relationship between loading rate and SNR exhibits
similar trend as in Figure 5.7. SNR increased linearly with specific loading rate, up to
around 6 g N/m2d, which was much higher than the 3.5 g N/m2d shown in Figure 5.7.
Difference of threshold from the two figures might originate from the difference of
membrane used for the experiments. Substrate diffusion limitation seemed to occur at
loads above 6 g NH4-N/m2d.
0
1
2
3
4
5
6
0 2 4 6 8 10
SN
R o
r S
DN
R (
g N
/m2d
)
Specific loading rate (g N/m2d)
SNR
SDNR
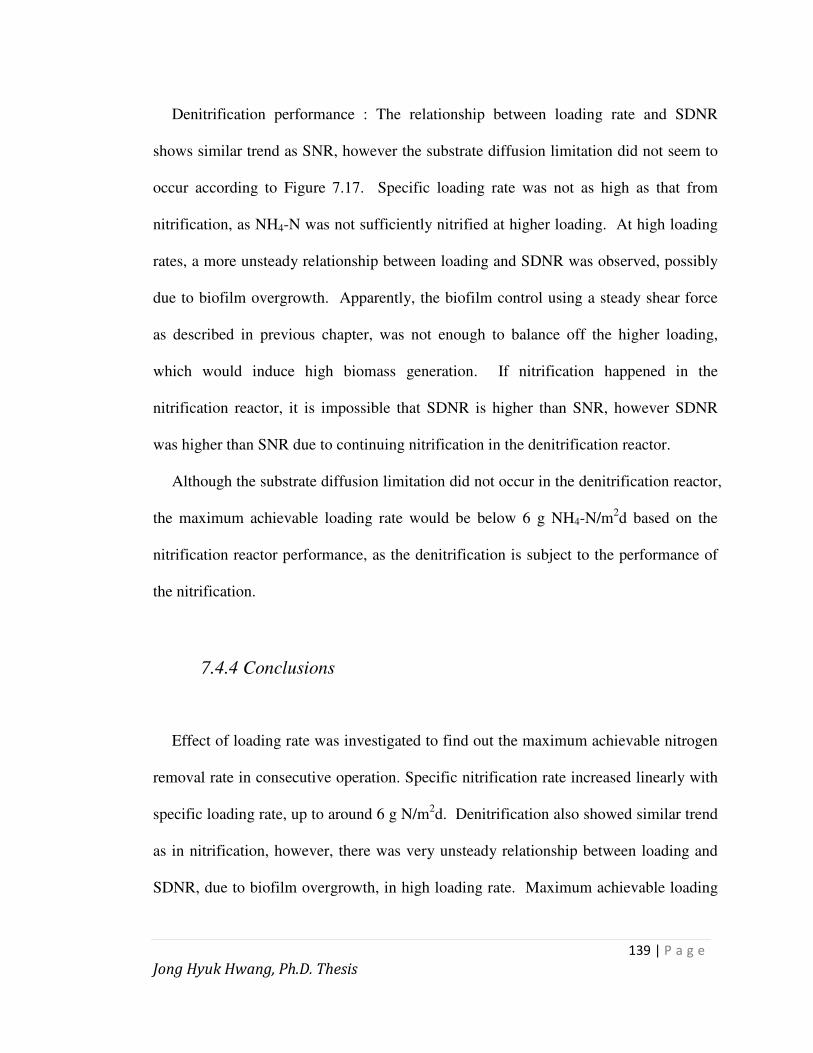
139 | P a g e
Jong Hyuk Hwang, Ph.D. Thesis
Denitrification performance : The relationship between loading rate and SDNR
shows similar trend as SNR, however the substrate diffusion limitation did not seem to
occur according to Figure 7.17. Specific loading rate was not as high as that from
nitrification, as NH4-N was not sufficiently nitrified at higher loading. At high loading
rates, a more unsteady relationship between loading and SDNR was observed, possibly
due to biofilm overgrowth. Apparently, the biofilm control using a steady shear force
as described in previous chapter, was not enough to balance off the higher loading,
which would induce high biomass generation. If nitrification happened in the
nitrification reactor, it is impossible that SDNR is higher than SNR, however SDNR
was higher than SNR due to continuing nitrification in the denitrification reactor.
Although the substrate diffusion limitation did not occur in the denitrification reactor,
the maximum achievable loading rate would be below 6 g NH4-N/m2d based on the
nitrification reactor performance, as the denitrification is subject to the performance of
the nitrification.
7.4.4 Conclusions
Effect of loading rate was investigated to find out the maximum achievable nitrogen
removal rate in consecutive operation. Specific nitrification rate increased linearly with
specific loading rate, up to around 6 g N/m2d. Denitrification also showed similar trend
as in nitrification, however, there was very unsteady relationship between loading and
SDNR, due to biofilm overgrowth, in high loading rate. Maximum achievable loading
140 | P a g e
Jong Hyuk Hwang, Ph.D. Thesis
rate would be below 6 g NH4-N/m2d based on the nitrification reactor performance, as
the denitrification is subject to nitrification.

141 | P a g e
Jong Hyuk Hwang, Ph.D. Thesis
8. ENGINEERING SIGNIFICANCE
8.1 Performance comparison with other tertiary treatment options
There are two ways to meet stringent effluent standards for municipalities, 1)
reconstruct entire facilities or 2) retrofit or upgrade existing facilities. The topic of
upgrading existing facilities has become increasingly important because many
municipalities are considering the implementation of additional nutrient removal steps.
Upgrading existing facilities rather than reconstructing whole plants has advantages of
not incurring huge construction expense allows continuous delivery of service. Some
add-on processes also can be done in smaller footprint.
To meet total nitrogen (TN) criteria near the limit of technology, fixed film post-
denitrification processes are likely to be installed at a number of facilities. These
processes include deep-bed denitrifying filters, fluidized bed reactors, submerged
attached growth filters, and moving bed biofilm reactors (Bill et al., 2008).
Since the technology studied in this research project was intended to be applied as a
tertiary treatment for nitrogen removal from BOD-removal only facilities, this chapter
will evaluate the available technologies and discuss the engineering significance of
this study.
Trickling filters would be the conventional types for tertiary nitrification. Earlier
experiments have shown that nitrification rates for trickling filters lie between 0.01

142 | P a g e
Jong Hyuk Hwang, Ph.D. Thesis
and 0.32 g N/m2d for temperatures between 5 and 15 °C (Bovendeur and Klapwijk et
al., 1989). Experiments with municipal water report between 0.5 and 2 g N/m2d
(Parker et al., 1997). Nitrification rate of 1.6 g N/m2d was measured in an upstream
moving bed bioreactor filled with Kaldnes rings, with temperatures varying from 8 to
16°C (Rusten et al., 1995)
Using an integrated fixed-film activated sludge (IFAS) technology or a moving-bed
biofilm reactor (MBBR) technology offers a small footprint and high performance.
According to a pilot-scale nitrification study for tertiary treatment with an MBBR,
the linear relationship between loading rate and nitrification rate could be achieved up
to the specific loading rate of 1.75 g N/m2d (Kaldate et al., 2008), which is lower than
4 g N/m2d found from this study (Figure 7.17). 0.54 kg N/m3-filter-bed·d (actual
volumetric rate is expected to be lower when it is translated to kg N/m3d)) was
achieved from a laboratory scale MBBR reactor (Jeong et al., 2006), as 1.22 kg N/m3d
(equivalent to 4 g N/m2d) was achieved in this study.
Biological aerated filter (BAF) is more advantageous in terms of space saving over
MBBR. Since more biomass could be packed in a BAF, it can have higher volumetric
removal rates at similar specific nitrification rate with MBBR (Hansen et al., 2006).
The most common add-on option for tertiary treatment removing nitrate would be a
denitrification filter. Denitrification filters require the smallest space requirement as
an add-on process at existing facilities. The technology involves passing nitrified
secondary effluent through a deep-bed filter that contains denitrifying organisms.
Suspended solids can be removed through this process as it would act as a filter. The

143 | P a g e
Jong Hyuk Hwang, Ph.D. Thesis
process requires an external carbon source, typically methanol, for denitrification
which results in a significant chemical cost. Despite some concerns associated with
the required startup time and cold weather performance, methanol is usually the
chemical of choice due to its relatively lower cost and lower yield (Regan et al., 1998).
However, adding methanol could cause toxicity in the final effluent due to the residual
carbon or the build-up of by-products, requiring further treatment. Methanol also
generates high amount of solids, which require backwashing of the filter and further
wastage.
Denitrification rate of about 0.8 kg N/m3d could be attained at temperatures of 12 -
15°C with such filters. The denitrification is reduced significantly after back-washing.
Moreover, frequent back-washings (several times per day) lead to methanol
breakthroughs, which is toxic, due to biofilm loss (Koch and Siegrist, 1997). The
effluent TN concentration from a denitrification filter can be expected to be below 3
mg/L (USEPA, 2008).
MBBR has been implemented as well in a number of full-scale applications for
secondary effluent polishing (Rusten et al., 1997, Taljemark et al., 2004, Odegaard,
2006). In Northern Europe, MBBR, which uses almost identical equipment to IFAS
but has only an attached growth biomass, has proven to be a good nutrient removal
choice for facilities with weak waste strength and low operating temperatures
(Johnson et al., 2007). Up to 1.4 g N/m2d denitrification rate was attained in pilot
scale application (Peric et al., 2008). Using ethanol (2.2 N/m2d) or glycerol (1.9
N/m2d) could boost the denitrification rate up to four times that of methanol (0.49
N/m2d) in pilot-scale MBBR post-denitrification (Bill et al., 2009).

144 | P a g e
Jong Hyuk Hwang, Ph.D. Thesis
According to Figure 7.17 from this thesis, the maximum achievable loading for
nitrification and denitrification was 6 g N/m2d, and the rates were over 4 g N/m2d at
that loading for both nitrification and denitrification. Volumetric loading rates could
be translated to 1.22 kg N/m3d for nitrification and 0.46 kg N/m3d for denitrification.
The difference of volumetric rates stems from the difference of reactor sizes used. In
terms of specific or volumetric nitrification or denitrification rates, the performance
from this thesis was comparable or higher than those from currently available tertiary
options.
8.2 Cost comparison with existing technology of a denitrification filter
Since the performance of MBfR is similar or superior to other options, it is
expected that MBfR can also be an economically feasible option. This chapter will
compare the cost of installation, operation and maintenance of denitrifying H2-driven
MBfR and denitrification filter, the most common options for tertiary denitrification.
Although the reactor construction cost, equipment prices (mixer, blower and piping),
electricity and labour can be calculated by using equations for rough estimation, many
assumptions needed to be made, resulting in some uncertainty of costs. Therefore, the
cost comparison in this study will be conducted based on the reported cost estimation
and case study cost data for denitrification filter by the USEPA (2008). Theoretical
installation (simulation) and case study cost data for denitrification filter were

145 | P a g e
Jong Hyuk Hwang, Ph.D. Thesis
compared with installation and operation of denitrifying H2-driven MBfR for nitrate
removal.
8.2.1 Simulation case
A model denitrification filter system serving the flowrate of 19,000 m3/d (5 MGD)
with a target NO3-N effluent concentration of 3 mg/L was used for cost estimation.
Capital cost for theoretical installation case was simulated in the report, “Municipal
nutrient removal technologies technical document – Volume 1” by USEPA (2008).
Capital cost was estimated by CAPDETWorks software (Version 2.1, Hydromantis
Corporation, 2008). This software uses a database to estimate the capital, labour,
chemical and energy costs that would be incurred based on the input variables, such as
process layout, wastewater characteristics and desired effluent quality. The CAPDET
model provides planning-level costs, which estimates were within ± 20 % of the actual
costs (Wright et al., 1988). The software includes engineering, site preparation,
electrical and control installation and building costs as a capital cost. Land costs were
not included.
O&M (operation and maintenance) costs in the simulation include operations
labour, maintenance labour, maintenance materials, power consumption, chemical
usage (3 g methanol / g N) and additional sludge generation.

146 | P a g e
Jong Hyuk Hwang, Ph.D. Thesis
Life-cycle costs were calculated for the CAPDETWorks results by first annualizing
the capital cost for 20 years at 6 percent interest. The annualized capital cost was
calculated according to Equation 5.1.
]1)1(
[cos_cos__−+
+×=n
i
iitCapitaltcapitalAnnualized Equation (5.1)
The annualized capital cost was then added to the annual O&M cost to obtain a
total annual cost.
The cost obtained from the software, which was based on year 2000 dollar value,
was then converted to year 2007 dollar value using the Engineering News-Record
(ENR) Construction Cost Index, the Marshall & Swift Index, and the Pipe Index.
Capital cost, O&M cost and life-cycle cost from simulation was $4,750,000,
$570,000/yr and $984,000/yr, respectively.
8.2.2 Case study cost data
Cost data from The Fiesta Village Advanced Wastewater Treatment Plant in Lee
County, Florida, USA was used for cost comparison in this study. This plant consists
of an extended aeration oxidation ditch process followed by denitrification filters with
methanol feed. Nitrogen is being removed successfully down to 3 mg/L. Although it
is permitted and designed for 19,000 m3/d (5 MGD) capacity, it processed an average
of 12,000 m3/d (3.16 MGD) in 2006 (USEPA, 2008). Four denitrification filters (3 m

147 | P a g e
Jong Hyuk Hwang, Ph.D. Thesis
×12 m or 10 ft × 40 ft) were installed at the hydraulic loading rate of 133 m3/m2·d (2.2
gpm/ft2). All the cost data were from USEPA report, “Municipal nutrient removal
technologies reference document, Volume 2 – Appendices, USEPA, 2008”.
Denitrification filter was installed at a cost of $930,000 in 1984, when the main
upgrades of the plant for BNR occurred. Capital cost was converted to $1,780,000,
2007 dollar value based on the Engineering News-Record Capital Cost Index (ENR
CCI).
O&M (operation and maintenance) in USEPA report costs include operations
labour, maintenance labour, maintenance materials, the power consumption, methanol
usage and disposal of additional sludge. Unfortunately, USEPA reported O&M costs
associated with overall nitrogen removal, which included denitrification filter as well
as nitrification that consumes lots of electricity. Therefore, $260,000/yr for O&M cost
in the report cannot be used for direct comparison. However, the report states the
costs associated with methanol usage and additional sludge disposal, which are the
major concerns in this thesis.
As for other items, such as maintenance labour, maintenance materials and power
consumption, assumptions which can not be fully verified without existing discrete
data, are used to enable comparison with a model MBfR system.
Assumptions used for power consumption, maintenance labour and maintenance
materials were based on the report, “Nutrient reduction technology cost estimations
for point sources in the Chesapeake Bay Watershed”, prepared by The Nutrient
Reduction Technology Cost Task Force, A Stakehold Group of the Chesapeake Bay
Program (2002).

148 | P a g e
Jong Hyuk Hwang, Ph.D. Thesis
Power consumption was estimated on the basis of pumping and other uses at
$0.05/kWh. Labour was based on 5 hours/day for 19,000 m3/d (5 MGD) plant.
Labour was considered for a 5-day work and $30/hour to cover salary and fringe
benefits. Maintenance costs were developed using 2 % of the capital costs.
Although O&M cost can be compared between denitrification filter and MBfR, the
costs from the above option will not be changed. Therefore, only chemical usage and
sludge production will be compared for O&M costs, assuming other costs will be
same.
Out of $260,000 O&M cost actually spent for nitrogen removal in 2006, only
$20,800 was used for methanol purchase and addition.
Methanol consumption and cost were 21,300 kg/yr (47,000 lb/yr) and $12,500
($ 0.60/kg), respectively. 21,300 kg of methanol expected to generate 14.2 ton of
solids/yr or 710 ton of sludge, based on the heterotrophic yield, 0.4 g VSS/g COD and
2% of solids concentration. Based on the operation data, 710 ton of sludge occupied
2.2% of total sludge generation from plant. At the plant’s average sludge disposal
charge of 4.9 cents/gallon, the total disposal cost of sludge generated from the
denitrification filter was $8,300 per year.
$20,000 of chemical and sludge disposal cost seems too small compared to total
O&M cost. The reasons were the followings. The first reason was the optimal use of
the existing facilities. Some denitrification was achieved in the sludge blanket of the
secondary clarifier. The second reason was the actual flow rate was much lower than
the design flowrate. Average flow rate during the data collection was 12,000 m3/d
rather than 19,000 m3/d. The third reason was the NO3-N concentration incoming to

149 | P a g e
Jong Hyuk Hwang, Ph.D. Thesis
the denitrification filter was already lowered to 3 mg/L, which was further reduced to
1.45 mg/L through the denitrification filter.
If the denitrification filter were to treat 19,000 m3/d of secondary effluent (design
flowrate) from 25 mg NO3-N/L to 3 mg NO3-N/L, the chemical cost and sludge
disposal cost would be $290,000 and $193,000, respectively, based on the actual
chemical cost and hauling cost, incurred during the plant operation and it will
contribute more to O&M costs than before. Based on above estimation, total O&M
cost would be $557,600/yr, which will be close to $570,000/yr from the simulation
case, shown in Chapter 8.2.1.
8.2.3 H2-driven MBfR for denitrification
For the estimation of capital cost for H2-driven MBfR system, the reactor size had
to be assumed since no pilot scale data was available from this thesis. Data from the
thesis of a former student, Dr. Celmer were also referenced. The maximum
achievable specific loading rate of 6 g N/m2d and corresponding volumetric
denitrification rate of 0.46 kg N/m3d (from Figure 7.17) were used for the capital cost
estimation.
As 6 g N/m2d of loading rate was achieved in lab-scale, it was assumed that only 75%
of 6 g N/m2d (4.5 g N/m2d) would be achievable in larger scale. The volumetric
removal rate was unchanged because the value was found from a one-membrane
module system. It was assumed that membrane modules can be more condensely
spaced if multiple modules were used. Even though optimum spacing between

150 | P a g e
Jong Hyuk Hwang, Ph.D. Thesis
membrane modules, which should be close enough to save space but far enough to
avoid biofilm clumping and inhibit the substrate diffusion, can be the topic of further
research, 25% of volume saving by putting multiple membrane modules was assumed.
Thus the assumption for a volumetric loading rate of 0.46 kg N/m3d was not altered.
To treat 19,000 m3/d of design flow rate containing 25 mg NO3-N/L, 106,000 m2
of membrane surface area and 1030 m3 of reactor size (54 m3/ML) were required.
Although the membrane module used for this thesis has a low 0.152 m2 of surface area,
the membrane, which would be used for full-scale, will have higher surface
area/membrane module. A 154 m2 of surface area/membrane was assumed and 690
membrane modules were needed to satisfy the 106,000 m2 of required surface area (36
modules/ML). Due to high diffusivity of GE’s newly developed PMP membrane, the
number of required membrane modules and reactor volume were highly reduced from
that of Dr. Celmer’s work (2009), who reported a minimum 52,500 membrane
modules and 50,300 m3 of reactor size from high ultrasound dosage case to treat
300,000 m3 of wastewater (175 modules/ML and 167 m3/ML).
Same capital cost, $1,780,000, as the case study shown in 5.2.2 was assumed, as the
used volumetric denitrification rate, 0.46 kg N/m3d, was similar to that of the
denitrification filter (Polprasert and Pak, 1986). The membrane cost would contribute
a major portion of the capital cost, as it was difficult to subscribe a cost as the
membrane was not yet commercialized. An estimate of $1,780,000 ($94,000/ML)
would be reasonable if it was compared with around $70,000,000 of capital cost,
which was estimated for flowrate of a 300,000 m3/d ($233,000/ML) by Celmer (2009),
as only one third of membrane modules and reactor size was required in this thesis.

151 | P a g e
Jong Hyuk Hwang, Ph.D. Thesis
Regarding O&M, the expenses associated with labour, power consumption and
maintenance of facilities were assumed to be those from Chapter 8.2.2. Only chemical
(hydrogen) and additional sludge handling costs were compared. Cost, which would
be required for biofilm control, was not included in this calculation.
Based on equation 1-7, in order to reduce 1 g of nitrate to nitrogen gas, 0.41 g of
hydrogen gas would be required and 0.29 g of SS (0.23 g of VSS and VSS/SS ratio of
0.8) would be generated. If MBfR were to treat 19,000 m3/d of secondary effluent
from 25 mg NO3-N/L to 3 mg NO3-N/L, 63,000 kg of hydrogen gas/yr (41% of
153,000 kg of N/yr) would be required and 35,000 kg of dry solids/yr would be
generated. Based on the actual data (2% solids content and 4.9 cent/gallon) from
Chapter 5.2, hauling cost would be $22,700/yr. Cost of hydrogen gas varies from $1
to $20 per kilogram (MSNBC, http://www.msnbc.msn.com/id/4563676/, 2004). It
may go up in the future due to the tight supply or go down due to the mass production,
driven by hydrogen-related industry. Although Celmer used $1.37/kg of hydrogen gas,
this thesis used $5/kg to estimate the cost conservatively. Based on $5/kg, the annual
hydrogen cost would be $315,000. The sum of chemical and sludge disposal cost
would be $337,700 for MBfR case, compared to $483,000 for the denitrification filter.
Therefore, MBfR can be an economically feasible option for tertiary denitrification.
One thing to note in this calculation is that the economic feasibility of MBfR highly
depends on the cost of hydrogen gas. If the cost of hydrogen exceeds $7.5/kg, MBfR
would be more expensive to maintain, compared to denitrification filter.
Finally, Table 8.1 shows the comparison of capital costs, O&M costs and life-cycle
cost for all three cases shown.

152 | P a g e
Jong Hyuk Hwang, Ph.D. Thesis
Table 8.1 Cost comparison table
Simulated
denitrification
filter
Actual
denitrification
filter
MBfR
Capital cost ($) 4,750,000 1,780,000 1,780,000
O&M cost ($/yr) 570,000 557,600 412,300
Life-cycle cost ($/yr) 984,000 712,800 567,500
Table 8.1 shows that MBfR can be an economically viable option for tertiary
treatment. However, it should be noted that the economic feasibility of MBfR is
strongly correlated to the cost of hydrogen gas.
8.3 Engineering significances
Other than performance and cost perspectives found from this thesis, there are
number of findings that would contribute to wide-scale application of MBfR in the
future.
Long-term stable operation of sequential nitrification and denitrification was
achieved in this study. As explained in Chapter 7.2, the accumulation of excess
biofilm is the major concern while operating MBfR, except for nitrification. Some
previous studies suffered from biofilm overgrowth, which prevented long-term steady
operations. By employing proper biofilm control measures (N2 gas sparging in this
study), MBfR was operated over 400 days, combining continuous operations through

153 | P a g e
Jong Hyuk Hwang, Ph.D. Thesis
Chapter 7.4, without any major problems. Biofilm thickness was stably maintained
over the operational days. System stability would be one of the crucial factors during
pilot-or field scale reactor implementation. The long-term stable operation can be then
achieved in pilot scale operation, although more studies regarding the degree of shear
force such as sparging strength or duration should be conducted to ratify the feasibility
of N2 sparging in larger scale.
Effect of dissolved oxygen on hydrogenotrophic denitrification was investigated
in this study and showed no impact on the denitrification performance. It is expected
that this finding would make it possible to modify the system configuration further.
For example, the nitrification biofilm and denitrification biofilm can be put in the
same reactor, avoiding the flow channel or pumping, which would be required in
sequential operation. Since the denitrification performance will not be affected by DO
in MBfR, which might be leaked or left over from the nitrification reactor, a one-
reactor configuration would be worthy of challenging in the future. Another system
modification would be a hybrid biofilm process where the hydrogenotrophic bacteria
grows on top of the membrane fiber with H2 supply from the membrane fiber, and the
nitrifiers grow in bulk liquid where the oxygen is supplied via blower for nitrification.
Although the oxygen is supplied via blower in bulk solution, denitrification within the
biofilm would not be significantly affected. It could be even possible to just put a H2-
driven membrane inside existing aeration tank for boosting denitrification. This setup
would be similar to other hybrid biofilm systems, reported by Nerenberg (2008), who
investigated the nitrification in MBfR and heterotrophic denitrification in bulk liquid,
in one reactor. Biofilm control by air sparging rather than N2 sparging could be

154 | P a g e
Jong Hyuk Hwang, Ph.D. Thesis
investigated as no significant effect by DO on hydrogenotrophic denitrification was
observed.
pH control for denitrification was proven ineffective in this study, as it only
increased the precipitation of minerals, which eventually inhibited the diffusion of gas
and substrate. Denitrification performed well in pH over 8.5 without pH control.
Nitrite accumulation was not observed.
In terms of denitrification performance with changing temperature, the room
temperature of controlled lab condition showed the best denitrification performance,
indicating that intentional control of temperature in order to improve the performance
would be unnecessary. The denitrification would have to be tested at 5 – 20 °C
temperature range, temperatures of conventional wastewater treatment in northern
hemisphere.

155 | P a g e
Jong Hyuk Hwang, Ph.D. Thesis
9. FUTURE WORK
9.1 Pilot scale application with a robust membrane
To become a more viable option for tertiary treatment, MBfR needs to be tested in
pilot scale. Since multiple membrane modules would be placed for operation, studies
regarding optimum spacing between modules and details of biofilm control would be
implemented.
As addressed in Chapter 8.3, a modified system configuration can be tested to save
reactor volume or avoid pumping or piping by placing nitrification and denitrification
membrane biofilm system in a single reactor. A hybrid tertiary system with bulk
nitrification can also be tested. Inserting denitrification biofilm into an existing
aeration tank would eliminate the needs of a separate reactor to achieve denitrification.
An increase in number of fibers per module from that of lab-scale modules should
be tested to provide more surface area in a limited space. In terms of the membrane
itself, more robust membranes need to be developed to sustain the conditions of pilot
scale operation. One of the obstacles during lab-scale operation was the fragility of
the membrane fibers. Once one of fiber was cut by accident, a gas leak from that point
resulted in the replacement of the entire membrane module. Pilot-scale operation
requires more robust membranes than the lab-scale environment. The membrane
manufacturer is aware of this issue, which is expected to be resolved before
commercialization.

156 | P a g e
Jong Hyuk Hwang, Ph.D. Thesis
9.2 Greenhouse gas emission
Heterotrophic denitrification which requires organic carbon inevitably generates
carbon dioxide, which is one of the greenhouse gases (CO2, N2O and CH4) arising
from wastewater treatment. According to Equation 1-4, denitrification of 1 kg of
NO3-N would induce the emission of 2.62 kg of CO2.
5CH3OH + 6NO3- → 3N2 + 5CO2 + 7H2O + 6OH- (Equation 1-4)
Meanwhile, hydrogenotrophic denitrification uses inorganic carbon as a carbon
source for cell growth, therefore it does not generate carbon dioxide, according to
Equation 1-7.
NO3- + H+ + 2.86H2 +0.15CO2 → 0.0286C5H7NO2 + 0.49N2 + 3.14H2O
(Equation 1-7)
Avoiding the greenhouse gas (CO2) generation can be considered as one additional
advantage of autotrophic denitrification over heterotrophic denitrification nowadays,
as it can contribute the reduction of greenhouse gas generation. If the reduction of
greenhouse gas by hydrogenotrophic denitrification were estimated by monetary value,
it can be estimated as $12,000/yr in the MBfR case from Chapter 8.2.3 using a $30/ton
carbon credit (http://en.wikipedia.org/wiki/Carbon_credit).

157 | P a g e
Jong Hyuk Hwang, Ph.D. Thesis
N2O is an important greenhouse gas, having a 300-fold stronger effect than CO2
(IPCC, 2001). Although IPCC guidelines (2006) assume that direct N2O emission
from wastewater treatment plants (WWTPs) is minor compared to large N2O emission
from nitrification and denitrification in estuaries and rivers, the emission from
WWTPs is expected to increase due to wider implementation of BNR systems in the
coming years.
N2O emission potential during hydrogenotrophic denitrification has not been
explored so far, therefore it would be worthy of investigation. It is known that DO
concentration is considered an important parameter controlling N2O emission (Zhang
et al., 1994, Tallec et al., 2006, Kampschreur et al., 2008), with low DO
concentrations leading to higher emissions.
Since hydrogenotrophic denitrification was successfully conducted in high DO
condition, there is a chance of lower N2O emission potential from hydrogenotrophic
denitrification than from heterotrophic one. Nitrite, resulting from incomplete
nitrification or denitrification, is also known to increase the N2O emission (Schulthess
et al., 1995). Nitrite accumulation was not observed in this study.

158 | P a g e
Jong Hyuk Hwang, Ph.D. Thesis
10. REFERENCES
Ahmed, T. and Semmens, M. J. (1992). The use of independently sealed microporous
hollow fiber membranes for oxygenation of water: model development, Journal of
membrane science, 69, 11–20.
APHA, AWWA, WPCF (1998). Standard Methods for the Examination of Water and
Wastewater, 20th Edition. Amer. Public Health Assoc., Amer. Water Works Assoc,
Water Poll. Control Fed., Washington, D.C.
Aziz, C. E., Fitch, M. W., Linquist, L. K., Pressman, J. G., Georgiou, G. and Speitl, G.
E. (1995). Methanotrophic biodegradation of trichloroethylene in a hollow fiber
membrane bioreactor. Environmental Science and Technology, 29, 2574–2583.
Benedict, S. W. (1996). Denitrification with autotrophic hydrogen oxidizing bacteria.
M.S. Thesis, University of Nevada, 61.
Bill, K. A., Bott, C. B., Yi, P. H., Ziobro, C and Murthy, S. N. (2008). Evaluation of
alternative electron donors in anoxic moving bed biofilm reactors (MBBRs)
configured for post-denitrification. Proceedings of WEFTEC. October, 2008,
Chicago, IL.
Bill, K. A., Bott, C. B. and Murthy, S. N. (2009). Evaluation of alternative electron
donors for denitrifying moving bed biofilm reactors (MBBRs). Proceedings of
IWA 2nd
specialized conference on Nutrient management in Wastewater treatment
processes. September 2009, Krakow, Poland.

159 | P a g e
Jong Hyuk Hwang, Ph.D. Thesis
Bovendeur, J. and Klapwijk, A. (1989). Fixed-film reactors in water recirculating
aquaculture systems: nitrification kinetics, design criteria, and expected
performance. Aquaculture — A Biotechnology in Progress EAS, Bredene, Belgium.
Brindle, K. and Stephenson, T. (1996). The application of membrane biological
reactors for the treatment of wastewaters. Biotechnology and Bioengineering, 49,
601–610.
Brindle, K., Stephenson, T. and Semmens, M. J. (1998). Nitrification and oxygen
utilisation in a membrane aeration bioreactor. Journal of membrane science, 144,
197-209.
Brindle, K., Stephenson, T., and Semmens, M. J. (1999). Pilotplant treatment of a
high-strength brewery wastewater using a membrane-aeration bioreactor. Water
Environment Research, 71, 1197-1204.
Brooks, P. R. and Livingston, A. G. (1994). Biotreatment of a point-source industrial
wastewater arising in 3,4-dichloroaniline manufacture using an extractive
membrane bioreactor. Biotechnology Progress, 10, 65–75.
Casey, E., Glennon, B. and Hamer, G. (1999). Oxygen mass transfer characteristics in
a membrane-aerated reactor. Biotechnology and Bioengineering, 62, 183–192.
Casey, E., Glennon, B. and Hamer, G. (1999). Review of Membrane Aerated Biofilm
Reactors. Resources. Conservation and Recycling., 27, 203-215.
Celmer, D., Oleszkiewicz, J. A. and Cicek, N., Husain, H. (2006). Hydrogen limitation
– a method for controlling the performance of the membrane biofilm reactor for
autotrophic denitrification of wastewater. Water Science and Technology, 54(9),
165-172.

160 | P a g e
Jong Hyuk Hwang, Ph.D. Thesis
Celmer, D., Oleszkiewicz, J. and Cicek, N. (2007). High mineral content of biomass:
Implications for advanced wastewater treatment through hydrogen-driven
denitrification. Proceedings of WEF/IWA Specialty conference on nutrient removal.
Mar. 2007, Baltimore, U.S.
Celmer, D., Oleszkiewicz, J. A. and Cicek, N. (2008). Impact of shear force on the
biofilm structure and performance of a membrane biofilm reactor for tertiary
hydrogen-driven denitrification of municipal. Water Research, 42(12), 3057-3065.
Celmer, D., Oleszkiewicz, J.A. and Cicek, N. (2008). Impact of ultrasound treatment
on the biofilm structure and performance of a membrane biofilm reactor for tertiary
hydrogen driven denitrification of wastewater. Proceedings of WEFTEC 2008,
October 18-22, Chicago, IL.
Chang, Y. J. and Tseng, S. K. (1999). A novel double-membrane system for
simultaneous nitrification and denitrification in a single tank. Letters in Applied
Microbiology, 28, 453-456.
Chung, J., Li, X. and Rittmann, B. E. (2006). Bio-reduction of arsenate using a
hydrogen – based membrane biofilm reactor. Chemosphere, 65, 24-34.
Chung, J., Nerenberg, R. and Rittmann, B. E. (2006). Bio-reduction of selenate using a
hydrogen-based membrane biofilm reactor. Environmental Science and Technology,
40, 1664–1671.
Chung, J., Nerenberg, R. and Rittmann, B. E. (2006). Bio-reduction of soluble
chromate using a hydrogen-based membrane biofilm reactor. Water Research,
40(8), 1634-1642.

161 | P a g e
Jong Hyuk Hwang, Ph.D. Thesis
Clapp, L. W., Regan, J. M., Ali, F., Newman, J. D., Park, J. K. and Noguera, D. R.
(1999). Activity, structure, and stratification of membrane-attached methanotrophic
biofilms cometabolically degradation trichloroethylene. Water Science and
Technology, 39 (7), 153-161.
Claus, G. and Kutzner, H. J. (1985). Autotrophic denitrification by thiobacillus
denitricans. Applied Microbiology and Biotechnology, 22 (2), 289–296.
Cole, A. C., Semmens, M. J. and LaPara, T. M. (2004). Stratification of activity and
bacterial community structure in biofilms grown on membranes transferring oxygen.
Applied and Environmental Microbiology, 70 (4), 1982–1989.
Cote´, P., Bersillion, J. L. and Huyard, A. (1989). Bubble-free aeration using
membranes: Mass transfer analysis. Journal of membrane science, 47, 91–106.
Cowman, J., Torres, C. I. and Rittmann, B. E. (2005). Total nitrogen removal in an
aerobic/anoxic membrane biofilm reactor system. Water Science and Technology,
52(7), 115-120.
Daebel, H., Manser, R., Gujer, W. (2007). Exploring temporal variations of oxygen
saturation constants of nitrifying bacteria. Water Research, 41, 1094–1102.
Dalsgaard, T., de Zwart, J., Robertson, L. A., Kuenen, J.G., and Revsbech, N. P.
(1995). Nitrification, denitrification and growth in artificial Thiosphaera
pantotropha biofilms as measured with a combined microsensor for oxygen and
nitrous oxide. FEMS Microbiology Ecology, 17, 137–148.
Debus, Baumgartl, and I. Sekoulov (1994). Influence of fluid velocities on the
degradation of volatile aromatic compounds in membrane bound biofilms. Water
Science and Technology, 29(10-11), 253-262.

162 | P a g e
Jong Hyuk Hwang, Ph.D. Thesis
Downing, L. and Nerenberg, R. (2007). Performance and microbial ecology of a
hybrid membrane biofilm process for concurrent nitrification and denitrification.
Water Science and Technology, 55 (8–9), 355–362.
Downing, L. S., Bibby, K., Esposito, K., Fascianella, T. and Nerenberg, R. (2008).
Pilot-scale testing of the hybrid membrane biofilm process (HMBP) for total
nitrogen removal from municipal wastewater. Proceedings of WEFTEC 2008,
Chicago, IL, October, 2008.
Downing, L. S. and Nerenberg, R. (2008). Total nitrogen removal in a
hybrid, membrane-aerated activated sludge process. Water Research, 42, 3697-
3708.
Edstrom, J. A., Semmens, M. J., Hozalski, R. M., Clapp, L. W. and Novak, P. J.
(2005). Stimulation of dechlorination by membrane-delivered hydrogen: small field
demonstration. Environmental Engineering and Science, 22, 281–293.
EnviroSim Associates Ltd. (2008). BioWin Manual (Version 3); Ontario, Canada,
EnviroSim Associates Ltd.
Ergas, S. J. and Reuss, A. F. (2001). Hydrogenotrophic denitrification of drinking
water using a hollow fibre membrane bioreactor. Journal of Water Supply:
Research and Technology, 50 (3), 161-171.
Essila, N. J., Semmens, M. J. and Voller, V. R. (2000) Modeling biofilms on gas
permeable supports: Concentration and activity profiles. Journal of Environmental
Engineering, 126 (3), 250–257.
Flere, J.M., Zhang, T.C. (1999). Nitrate removal with sulfur–limestone autotrophic
denitrification processes. Journal of Environmental Engineering, 125 (8), 721–729.

163 | P a g e
Jong Hyuk Hwang, Ph.D. Thesis
Freitas dos Santos, L. M., Pavasant, P., Strachan, L. F., Pistikopoulos, E. N. and
Livingston, A.G. (1997). Membrane attached biofilms for waste treatment-
fundamentals and applications. Pure and Applied Chemistry, 69, 2459–2469.
Gong, Z., Liu, S., Yang, F., Bao, H. and Furukawa, K. (2008). Characterization of
functional microbial community in a membrane-aerated biofilm reactor operated
for completely autotrophic nitrogen removal. Bioresource Technology., 99, 2749–
2756.
Gross, H. and Treutler, K. (1986). Biological denitrification process with hydrogen
oxidizing bacteria for drinking water treatment. AQUA, 5, 930-943.
Habiya, K., Nagai, J., Tsuneda, S. and Hirata, A. (2004). Simple predictions of oxygen
penetration depth in biofilms for wastewater treatment. Biochemical Engineering
Journal, 19, 61-68.
Hansen, R., Thogersen, T. and Rogalla, F. (2006). Long-term full scale comparison of
activated sludge with biological aerated filter. Proceedings of WEFTEC. October,
2006, Dallas, TX.
Henze M., Gujer W., Mino T., Matsuo T., Wentzel M. C. and Marais G. v. R. (1995).
Activated Sludge Model No. 2., IAWQ Task Group on Mathematical Modelling for
Design and Operation of Biological Wastewater Treatment Processes. Scientific
and Technical Report No.3. IAWQ, London, England.
Hsieh, Y. L., Tseng, S. K. and Chang, Y. J. (2002). Nitrification using polyvinyl
alcohol-immobilized nitrifying biofilm on an O2-enriching membrane.
Biotechnology Letters, 24, 315–319.

164 | P a g e
Jong Hyuk Hwang, Ph.D. Thesis
Ho, C. M., Tseng, S. K. and Chang, Y. J. (2001). Autotrophic denitrification via a
novel membrane-attached biofilm reactor. Letters in Applied Microbiology, 33,
201-205.
Ho, C. M., Tseng, S. K. and Chang, Y. J. (2002) Simultaneous nitrification and
denitrification using an autotrophic membrane-immobilized biofilm reactor. Letters
in Applied Microbiology, 35, 481–485.
Hwang, J. H., Cicek, N. and Oleszkiewicz, J. A. (2008). Effect of inorganic
precipitation on the performance of H2-driven membrane biofilm reactor for
denitrification. Proceedings of IWA World Water Congress and Exhibition, Vienna,
Austria, September, 2008.
Hwang, J., Cicek, N. and Oleszkiewicz J. A. (2009). Effect of loading rate and oxygen
supply on nitrification in a non-porous membrane biofilm reactor. Water Research,
43, 3301-3307.
Intergovernmental Panel on Climate Change, IPCC, (2001). Climate Change 2001:
The Scientific Basis, Cambridge University Press.
Jeong, J., Hidaka, T., Tsuno, H. and Oda, T. (2006). Development of biological filter
as tertiary treatment for effective nitrogen removal: Biological filter for tertiary
treatment. Water Research, 40 (6), 1127 – 1136.
Johnson, T. L., Shaw, A., Landi, A., Lauro, T., Butler, R. and Radko, L. (2007). A
Pilot-scale comparison of IFAS and MBBR to achieve very low total nitrogen
concentrations. Proceedings of Nutrient removal 2007 : State of the art. March
2007, Baltimore, USA.

165 | P a g e
Jong Hyuk Hwang, Ph.D. Thesis
Jung, Y., Koh, H., Shin, W. and Sung, N. (2006). A novel approach to an advanced
tertiary wastewater treatment: Combination of a membrane bioreactor and an
oyster-zeolite column. Desalination, 190 (1-3), 243-255.
Joo, H.Z., Hirai, M., Shoda, M. (2005). Characteristics of ammonium removal by
heterotrophic nitrification–aerobic denitrification by alcaligenes faecalis no. 4.
Journal of Bioscience and Bioengineering, 100 (2), 184–191.
Kampschreur, M.J., Tan, N.C.G., Kleerebezem, R., Picioreanu, C., Jetten, M.S.M. and
van Loosdrecht, M.C.M. (2008). Effect of dynamic process conditions on nitrogen
oxides emission from a nitrifying culture. Environmental Science & Technology, 42
(2), 429-435.
Kappell, A. S., Semmens, M. J., Novak, P. J. and LaPara, T. M. (2005). Novel
application of oxygen-transferring membranes to improve anaerobic wastewater
treatment. Biotechnology and Bioengineering, 89 (4), 373–380.
Kleerebezem, R. and Mendeza, R. (2002). Autotrophic dentrification for combined
hydrogen sulfide removal from biogas and postdentrification. Water Science and
Technology, 45 (10), 349–356.
Kindaichi, T., Ito, T. and Okabe, S. (2004). Ecophysiological interaction between
nitrifying bacteria and heterotrophic bacteria in autotrophic nitrifying biofilms as
determined by microautoradiography-fluorescence in situ hybridization. Applied
Environmental Microbiology, 70 (3), 1641–1650.
Koch, G. and Siegrist, H. (1997). Denitrification with methanol in tertiary filtration.
Water Research, 31 (12), 3029 – 3038.

166 | P a g e
Jong Hyuk Hwang, Ph.D. Thesis
Kurt, M., Dunn, J., and Bourne, J. R. (1987). Biological denitrification of drinking
water using autotrophic organisms with hydrogen in a fluidized-bed reactor.
Biotechnology and bioengineering. 29, 493-501.
Lackner, S., Terada, A. and Smets, B. F. (2008). Heterotrophic activity compromises
autotrophic nitrogen removal in membrane-aerated biofilms: Results of a modeling
study. Water Research, 42, 1102-1112.
Lazarova, N. R., Manem, J. and Melo, L. (1998). Influence of dissolved oxygen on
nitrification kinetics in a circulating bed reactor. Water Science and Technology, 37
(4), 189-193.
Lee, K. C. and Rittmann, B. E. (2000). A novel hollow-fibre membrane biofilm
reactor for autohydrogenotrophic denitrification of drinking water. Water Science
and Technology, 41 (4-5), 219–226.
Lee, K. C. and Rittmann, B. E. (2002). Applying a novel autohydrogenotrophic
hollow-fiber membrane biofilm reactor for denitrification of drinking water. Water
Research, 36, 2040-2052.
Lee, K. C. and Rittmann, B. E. (2003). Effects of pH and precipitation on
autohydrogenotrophic denitrification using the hollow fiber membrane – biofilm
reactor. Water Research, 37, 1551 – 1556.
Lu, X. and Leng, Y. (2005). Theoretical analysis of calcium phosphate precipitation in
simulated body fluid. Biomaterials. 26, 1097-1108.
Madigan, M.T., Martinko, J.M., Dunlap, P.V. and Clark, D.P. (2009) Brock Biology of
Microorganisms, 12th Edition, Pearson Education, Inc. CA, USA.

167 | P a g e
Jong Hyuk Hwang, Ph.D. Thesis
Metcalf, Eddy (2003). Wastewater engineering, Treatment and reuse, fourth ed.
McGraw-Hill, New York.
Modin, O., Fukushi, K., Nakajima, F. and Yamamoto, K. (2008). Performance of a
membrane biofilm reactor for denitrification with methane. Bioresource
Technology, 99, 8054-8060.
Nerenberg, R., Rittmann, B. E. and Najm, I. (2002). Perchlorate reduction in a
hydrogen – based membrane biofilm reactor. Journal of AWWA, 94(11), 103 -114.
Nicolella, C., van Loosdrecht, M. C. M. and Hiejnen, J. J. (2000). Wastewater
treatment with particle - biofilm reactors. Journal of Biotechnology, 80, 1-33.
Nogueira, R., Elenter, D., Brito, A., Melo, L.F., Wagner, M. and Morgenroth, E.
(2005). Evaluating heterotrophic growth in a nitrifying biofilm reactor using
fluorescence in situ hybridization and mathematical modeling. Water Science and
Technology, 52(7), 135–141.
Odegaard, H. (2006). Innovations in wastewater treatment: the moving bed biofilm
process. Water Science and Technology, 53 (9) 17-33.
Oh, J. and Silverstein, J. (1999) Oxygen inhibition of activated sludge denitrification.
Water Research, 33, 1925–1937.
Okabe, S., Kindaichi, T. and Ito, T. (2005). Fate of 14C-labeled microbial products
derived from nitrifying bacteria in autotrophic nitrifying biofilms. Applied
Environmental Microbiology, 71 (7), 3987–3994.
Oleszkiewicz, J. A. and Barnard, J. L. (2006). Nutrient removal technology in North
America and the European Union: A review. Water Quality Research Journal
Canada, 41(4), 449-462.

168 | P a g e
Jong Hyuk Hwang, Ph.D. Thesis
Padhye, L., Rainwater, K., Jackson, W. and Morse, A. (2007). Kinetics for a
membrane reactor for reducing perchlorate. Water Environment Research, 79(2),
140-146.
Pankhania, M., Stephenson, T. and Semmens M. J. (1994). Hollow fibre bioreactor for
wastewater treatment using bubbleless membrane aeration. Water Research. 28(10),
2233-2236.
Pankhania, M., Brindle, K. and Stephenson, T. (1999). Membrane aeration bioreactors
for wastewater treatment: completely mixed and plug-flow operation. Chemical
Engineering Journal, 73, 131–136.
Park, J. J., Byun, I. G., Yu, J. C., Park, S. R., Ju, D. J., Hur. S. H. and Park, T. J.
(2008). Analysis of nitrifying bacterial communities in aerobic biofilm reactors
with different DO conditions using molecular techniques. Water Science and
Technology, 57 (12), 1889- 1899.
Parker, D. S., Jacobs, T., Bower, E., Stowe, D. W. and Farmer, G. (1997). Maximising
trickling filter nitrification rates through biofilm control: research review and full
scale application. Water Science and Technology, 36, 255–262.
Parvatiyar, M.G., Govind, R. and Bishop, D.F. (1996). Treatment of trichloroethane
(TCE) in a membrane biofilter. Biotechnology and Bioengineering, 50, 57–64.
Peric, M., Neupane, D., Stinson, B., Locke, E., Kharkar, K., Murthy, S., Bailey, W.,
Kharkar, S., Passarelli, N., Carr, J., Minassian, R. D. and Shih, G. (2008). Startup
of post denitrification MBBR pilot to achieve limit of technology at Blue Plains
AWTP. Proceedings of WEFTEC. October, 2008, Chicago, IL.

169 | P a g e
Jong Hyuk Hwang, Ph.D. Thesis
Pierkiel, A. (2002). A novel membrane process for autotrophic denitrification. M.S.
Thesis. Rowan University, 47.
Polprasert, C. and Park, H. S. (1986). Effluent denitrification with anaerobic filters.
Water Research, 20 (8), 1015-1021.
Regan, J., Koopman, B., Svoronos, S. A. and Lee, B. (1998). Full-scale test of
methanol addition for enhanced nitrogen removal in a Ludzack-Ettinger process.
Water Environment Research, 70 (3) 376-381.
Reij, M. W., de Gooijer, K. D., de Bont JAM and Hartmans, S. (1996). Membrane
bioreactor with a porous hydrophobic membrane contactor for waste gas treatment.
Biotechnology and Bioengineering, 45, 107–15.
Rezania, B., Cicek, N. and Oleszkiewicz, J. A. (2005). Kinetics of hydrogen-
dependent denitrification under varying pH and temperature conditions.
Biotechnology and Bioengineering, 92(7), 900-906.
Rezania, B., Oleszkiewicz, J. A. and Cicek, N. (2006). An approach to the
measurement of decay, active fraction of biomass and extracellular polymeric
substances: Applied to hydrogen-driven denitrification. Environmental Technology,
27, 1335-1341.
Rezania, B., Oleszkiewicz, J. A. and Cicek, N. (2007). Hydrogen-dependent
denitrification of water in an anaerobic submerged membrane bioreactor coupled
with a novel hydrogen delivery system. Water Research, 41, 1074-1080.
Rittmann, B. E. and Huck, P. M. (1989). Biological treatment of public water supplies.
CRC Critical Reviews on Environmental Engineering Control. 119(2), 119-184.

170 | P a g e
Jong Hyuk Hwang, Ph.D. Thesis
Rittmann, B. E., Regan, J. M. and Stahl, D. A. (1994). Nitrification as a source of
soluble organic substrate in biological treatment. Water Science and Technology,
30, 1–8.
Rittmann, B. E., Nerenberg, R., Lee, K. C., Najm, I., Gillogly, T. E., Lehman, G.E.,
and Adham, S. S. (2004). Hydrogen-based hollow-fiber membrane biofilm reactor
(MBfR) for removing oxidized contaminants. Water Supply, 4 (1), 127–133.
Rittmann, B. E. (2006). The membrane biofilm reactors: the natural partnership of
membranes and biofilm. Water Science and Technology, 53(3), 219-225.
Rittmann, B. E. (2007). The membrane biofilm reactor is a versatile platform for water
and wastewater treatment. Environmental Engineering Research, 12(4), 157-175.
Robertson, L. A., Dalsgaard, T., Revsbech, N. P., and Kuenen, J. G. (1995).
Confirmation of aerobic denitrification in batch cultures using gas chromatography
and 15N mass spectrometry. FEMS Microbiology Ecology, 18, 113–120.
Roggy, D. K., Novak, P. J., Hozalski, R. M., Clapp, L. W. and Semmens, M. J. (2002).
Membrane gas transfer for groundwater remediation: chemical and biological
fouling. Environmental Engineering Science, 19, 563-574.
Rothemund, C., Camper, A., Wilderer, P. A. (1994). Biofilms growing on gas
permeable membranes. Water Science and Technology, 29 (10-11), 447–454.
Rusten, B., Hem, L. J. and Odegaard, H. (1995). Nitrification of municipal waste
water in moving-bed biofilm reactors. Water Environment Research, 67, 75–86.
Rusten, B., Wien, A., and Skjefstad, J. (1997). Spent aircraft deicing fluid as external
carbon source for denitrification of municipal wastewater: From waste problem to

171 | P a g e
Jong Hyuk Hwang, Ph.D. Thesis
beneficial use. The 51st Purdue Industrial Waste Conference Proceedings, Chelsea,
MI.
Sahu, A. K., Ergas, S. J. and Sengupta, S. (2007) Hydrogenotrophic denitrification of
wastewater using a hollow fiber membrane bioreactor. Proceedings of International
conference on membranes for water and wastewater treatment, May 15-17, 2007,
Harrogate, UK.
Satoh, H., Ono, H., Rulin, B., Kamo, J., Okabe, S. and Fukushi, K.-I. (2004).
Macroscale and microscale analyses of nitrification and denitrification in biofilms
attached on membrane aerated biofilm reactors. Water Research, 36(6), 1633–1641.
Schnobrich, M. R., Chaplin, B. P., Semmens, M. J. and Novak, P. J. (2007).
Stimulating hydrogenotrophic denitrification in simulated groundwater containing
high dissolved oxygen and nitrate concentrations. Water Research, 41, 1869-1876.
Schulthess, R.v., Kuehni, M. and Gujer, W. (1995). Release of nitric and nitrous
oxides from denitrifying activated sludge. Water Research, 29 (1), 215-226.
Shanahan, J. W. and Semmens, M. J. (2004). Multipopulation model of membrane-
aerated biofilms. Environmental Science and Technology, 38, 3176-3183.
Semmens, M. J. and Essila, N. (2001). Modeling Biofilms on Gas-Permeable Supports:
Flux Limitations. Journal of Environmental Engineering, 126-133.
Semmens, M. J., Dahm, K., Shanahan, J. and Christianson, A. (2003). COD and
nitrogen removal by biofilms growing on gas permeable membranes. Water
Research, 37, 4343-4350.

172 | P a g e
Jong Hyuk Hwang, Ph.D. Thesis
Semmens, M. J. (2007). Alternative MBR configurations: using membranes for gas
transfer. In : Proceedings of International conference on membranes for water and
wastewater treatment. May 2007, Harrogate, United Kingdom.
Shanahan, J. W. and Semmens, M. J. (2006). Influence of a nitrifying biofilm on local
oxygen fluxes across a micro-porous flat sheet membrane. Journal of Membrane
Science, 277, 65-74.
Shin, J.-H., Sang, B.-I., Chung, Y.-CH. And Choung, Y.-K. (2005). The removal of
nitrogen using a hybrid hollow fiber membrane biofilm reactor. Desalination, 132,
447-454.
Snoeyink, V. L. and Jenkins, D. (1980). Water chemistry. J. Wiley and Sons, Inc.
Ferguson, J. F. and McCarty, P. L. (1971). Effects of carbonate and magnesium on
calcium phosphate precipitation. Environmental Science and Technology, 5, 534-
540.
Suzuki, Y., Hatano, N., Ito, S. and Ikeda, H. (2000). Performance of nitrogen removal
and biofilm structure of porous gas permeable membrane reactor. Water Science
and Technology, 41 (4-5), 211–217.
Syron, E. and Casey, E. (2008). Membrane-aerated biofilms for high rate biotreatment:
performance appraisal, engineering principles, scale-up, and development
requirements. Environmental Science and Technology, 42 (6), 1833–1844.
Taljemark, K., Aspegren, H., Gruvberger, C., Hanner, N., Nyberg, U. and Andersson,
B. (2004). 10 Years of Experiences of an MBBR Process for Post-Denitrification.
Proceedings of the 77소
Annual Water Environment Federation Technical

173 | P a g e
Jong Hyuk Hwang, Ph.D. Thesis
Exhibition and Conference (WEFTEC–National Conference of the Water
Environment Federation) New Orleans, Louisiana USA.
Tallec, G., Garnier, J., Billen, G. and Gousailles, M. (2006). Nitrous oxide emissions
from secondary activated sludge in nitrifying conditions of urban wastewater
treatment plants: Effect of oxygenation level. Water Research, 40 (15), 2972-2980.
Terada, A., Yamamoto, T., Hibiya, K., Tsuneda, S. and Hirata, A. (2004).
Enhancement of biofilm formation onto surface-modified hollow-fiber membranes
and its application to a membrane-aerated biofilm reactor. Water Science and
Technology, 49(11-12), 263-268.
Terada, A., Yamamoto, T., Igarashi, R. and Hirata, A. (2006). Feasibility of a
membrane-aerated biofilm reactor to achieve controllable nitrification. Biochemical
Engineering Journal, 28, 123–130.
Terada, A., Kaku, S., Matsumoto, S. and Tsuneda, S. (2006). Rapid
autohydrogenotrophic denitrification by a membrane biofilm reactor equipped with
a fibrous support around a gas-permeable membrane. Biochemical Engineering
Journal, 31, 84-91.
Terada, A., Yamamoto, T. and Tsuneda, S. and Hirata, A. (2006). Sequencing batch
membrane biofilm reactor for simultaneous nitrogen and phosphorus removal:
Novel application of membrane-aerated biofilm. Biotechnology and Bioengineering,
94 (4), 730–739.
Tiedje J. M. (1988) Ecology of denitrification and dissimilatory nitrate reduction to
ammonium. In Biology of Anaerobic Microorganisms, ed. A. J. B. Zehnder. John
Wiley & Sons, New York, NY.

174 | P a g e
Jong Hyuk Hwang, Ph.D. Thesis
Timberlake, D. L., Strand, S. E. and Williamson, K. J. (1988). Combined aerobic
heterotrophic oxidation nitrification and denitrification in a permeable-support
biofilm. Water Research, 22(12), 1513-1517.
Toet, S., Logtestijn, R. V., Schreijer, M., Kampf, R. and Verhoeven, J. T. (2005). The
functioning of a wetland system used for polishing effluent from a sewage
treatment plant. Ecological Engineering, 25 (1), 101-124.
Water Environment Research Foundation. (2003) A novel membrane process for
autotrophic denitrification. Project Report No. 00-CTS-14ET; Water Environment
Research Foundation; Alexandria, Virginia.
Water Environment Research Foundation (2003) Standardization and Demonstration
of Methods for Wastewater Characterization for Activated Sludge Modeling;
Project Report No. 99-WWF-3; Water Environment Research Foundation;
Alexandria, Virginia.
Water Environment Federation, American Society of Civil Engineers (2006).
Biological nutrient removal operation in Wastewater treatment plants. McGraw-
Hill.
Wilderer, P. A. Brautigam, J. and Sekoulov, I. (1985). Application of gas permeable
membranes for auxiliary oxygenation of sequencing batch reactors. Conservation
and Recycling, 8, 181-192.
Wilderer, P. A. (1995). Technology of membrane biofilm reactors operated under
periodically changing process conditions. Water Science and Technology, 31(1),
173-183.

175 | P a g e
Jong Hyuk Hwang, Ph.D. Thesis
Wright, D. G., Patry, G. G., Letman, C. E. and Woods, D. R. (1988). A procedures for
estimating the capital cost of Ontario wastewater treatment plant using CAPDET.
Canadian Journal of Civil Engineering, 15, 799–806.
Yamagiwa, K., Yoshida, M., Ito, A. and Ohkawa, A. (1998). A new oxygen supply
method for simultaneous organic carbon removal and nitrification by a one-stage
biofilm process. Water Science and Technology, 37, 117–124.
Yang, W., Cicek, N. and Ilg, J. (2006). State-of-art of membrane bioreactors:
Worldwide research and commercial applications in North America, Journal of
Membrane Science, 270, 201-211.
Zhang, T. C. and Bishop, P. L. (1996). Evaluation of substrate and pH effects in a
nitrifying biofilm. Water Environment Research, 68 (7), 1107-1115.
Zhang, E., Wang, B., Wang, Q., Zhang, S., Zhao, B. (2008). Ammonia-nitrogen and
orthophosphate removal by immobilized Scenedesmus sp. Isolated from municipal
wastewater for potential use in tertiary treatment. Bioresource Technology, 99 (9),
3787-3793.
Zheng, H., Hanaki, K. and Matsuo, T. (1994). Production of nitrous oxide gas during
nitrification of wasterwater. Water Science and Technology, 30 (6), 133-141.

176 | P a g e
Jong Hyuk Hwang, Ph.D. Thesis
11. APPENDIX
Appendix 1. Data for Figure 5.2
Day HRT NH4-N SNR (g N/m2d)
N1 N2 Inf. HRT 12hr HRT 7hr HRT 12hr HRT 7hr
08/02/2007 1 12.4 6.9 8.7 7.9 7.7 0.020 0.047
09/02/2007 2 10.6 7.9 9.1 7.0 6.8 0.065 0.097
12/02/2007 5 10.1 7.7 8.5 6.3 6.4 0.069 0.089
13/02/2007 6 9.7 7.5 9.4 6.8 7.1 0.087 0.102
14/02/2007 7 9.6 7.1 8.6 7.4 7.7 0.039 0.041
15/02/2007 8 10.1 7.8 9.0 7.9 8.3 0.034 0.029
19/02/2007 12 10.0 7.9 10.6 6.8 8.3 0.124 0.093
20/02/2007 13 9.8 7.9 9.4 5.4 6.8 0.134 0.107
22/02/2007 15 8.6 7.2 9.0 5.4 5.3 0.137 0.165
23/02/2007 16 9.1 7.0 8.0 4.5 5.3 0.127 0.128
27/02/2007 20 9.8 7.4 8.6 4.1 3.1 0.150 0.244
28/02/2007 21 9.1 7.0 8.3 3.7 3.6 0.164 0.218
01/03/2007 22 9.2 6.9 8.3 2.6 3.0 0.202 0.250
05/03/2007 26 10.0 7.5 12.4 4.4 4.7 0.260 0.336
06/03/2007 27 9.3 7.2 11.9 3.9 4.6 0.283 0.333
07/03/2007 28 9.2 7.3 10.9 7.3 6.8 0.128 0.184
08/03/2007 29 9.2 7.2 18.5 11.0 10.7 0.268 0.355
09/03/2007 30 9.4 7.4 16.3 10.6 9.2 0.197 0.312
12/03/2007 33 8.8 7.0 16.0 8.7 10.1 0.269 0.287
13/03/2007 34 9.4 7.3 15.9 7.6 12.2 0.290 0.248
14/03/2007 35 12.3 7.3 16.1 5.9 11.8 0.272 0.254
20/03/2007 41 15.1 7.5 17.9 9.2 12.2 0.187 0.246
21/03/2007 42 16.3 7.9 20.7 16.6 18.1 0.082 0.107
22/03/2007 43 15.0 7.2 22.3 18.9 19.5 0.072 0.124
23/03/2007 44 14.0 7.1 21.7 19.0 20.0 0.063 0.078
26/03/2007 47 15.6 8.7 19.9 19.2 18.0 0.015 0.071
27/03/2007 48 15.3 7.2 20.1 14.6 18.3 0.117 0.081
28/03/2007 49 13.6 7.0 17.2 15.2 16.7 0.047 0.022
29/03/2007 50 15.5 6.4 21.6 16.9 19.8 0.099 0.093
30/03/2007 51 15.9 6.7 22.3 16.2 19.9 0.123 0.116
02/04/2007 54 13.0 7.0 23.4 17.1 18.4 0.158 0.231
03/04/2007 55 15.1 7.4 21.1 17.3 20.5 0.081 0.024
04/04/2007 56 16.8 7.6 20.0 16.3 17.3 0.071 0.113
05/04/2007 57 16.6 7.3 20.0 15.6 17.7 0.085 0.101
06/04/2007 58 16.3 7.0 20.2 15.3 17.8 0.098 0.112
08/04/2007 60 16.0 6.7 20.7 17.6 18.1 0.063 0.126
09/04/2007 61 15.6 6.9 20.7 18.2 18.4 0.052 0.109
10/04/2007 62 14.4 7.2 19.8 17.0 16.8 0.063 0.135
11/04/2007 63 14.9 7.1 19.7 17.9 18.0 0.039 0.078
12/04/2007 64 15.1 7.3 19.7 17.9 18.0 0.039 0.075
13/04/2007 65 14.8 7.1 20.6 15.0 18.1 0.122 0.113
14/04/2007 66 15.8 7.3 19.2 18.0 17.5 0.026 0.079
16/04/2007 68 15.6 6.9 21.3 21.0 18.6 0.007 0.129
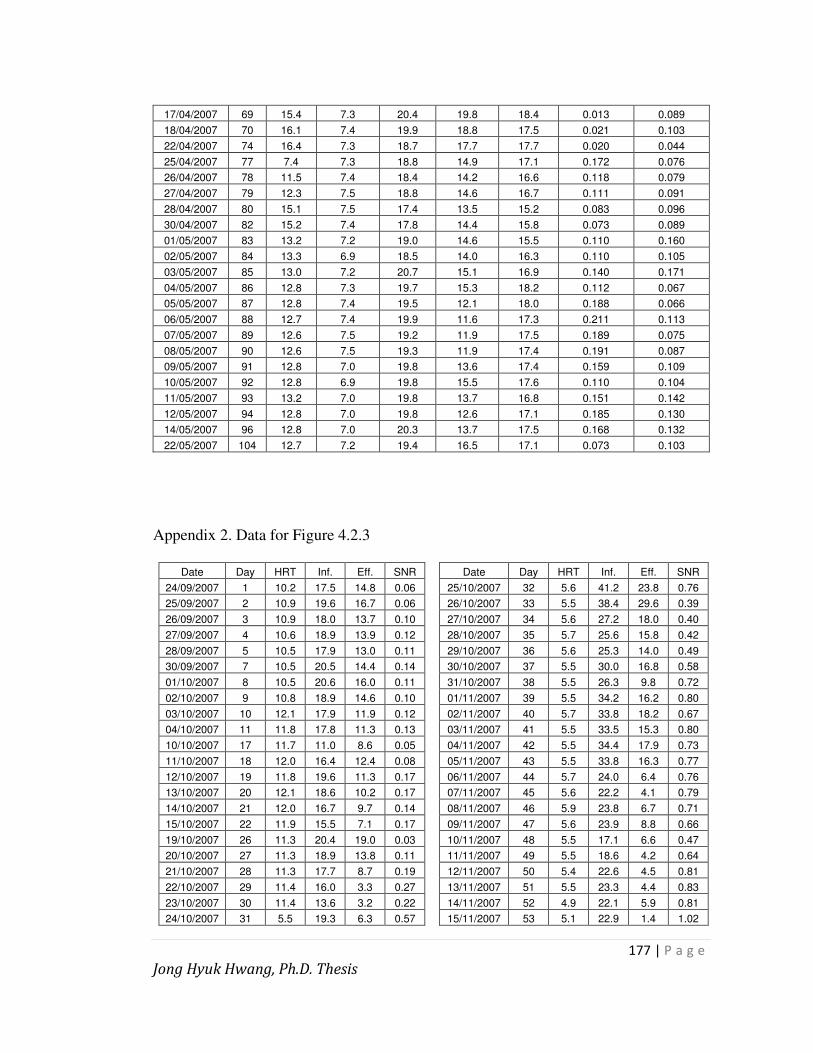
177 | P a g e
Jong Hyuk Hwang, Ph.D. Thesis
17/04/2007 69 15.4 7.3 20.4 19.8 18.4 0.013 0.089
18/04/2007 70 16.1 7.4 19.9 18.8 17.5 0.021 0.103
22/04/2007 74 16.4 7.3 18.7 17.7 17.7 0.020 0.044
25/04/2007 77 7.4 7.3 18.8 14.9 17.1 0.172 0.076
26/04/2007 78 11.5 7.4 18.4 14.2 16.6 0.118 0.079
27/04/2007 79 12.3 7.5 18.8 14.6 16.7 0.111 0.091
28/04/2007 80 15.1 7.5 17.4 13.5 15.2 0.083 0.096
30/04/2007 82 15.2 7.4 17.8 14.4 15.8 0.073 0.089
01/05/2007 83 13.2 7.2 19.0 14.6 15.5 0.110 0.160
02/05/2007 84 13.3 6.9 18.5 14.0 16.3 0.110 0.105
03/05/2007 85 13.0 7.2 20.7 15.1 16.9 0.140 0.171
04/05/2007 86 12.8 7.3 19.7 15.3 18.2 0.112 0.067
05/05/2007 87 12.8 7.4 19.5 12.1 18.0 0.188 0.066
06/05/2007 88 12.7 7.4 19.9 11.6 17.3 0.211 0.113
07/05/2007 89 12.6 7.5 19.2 11.9 17.5 0.189 0.075
08/05/2007 90 12.6 7.5 19.3 11.9 17.4 0.191 0.087
09/05/2007 91 12.8 7.0 19.8 13.6 17.4 0.159 0.109
10/05/2007 92 12.8 6.9 19.8 15.5 17.6 0.110 0.104
11/05/2007 93 13.2 7.0 19.8 13.7 16.8 0.151 0.142
12/05/2007 94 12.8 7.0 19.8 12.6 17.1 0.185 0.130
14/05/2007 96 12.8 7.0 20.3 13.7 17.5 0.168 0.132
22/05/2007 104 12.7 7.2 19.4 16.5 17.1 0.073 0.103
Appendix 2. Data for Figure 4.2.3
Date Day HRT Inf. Eff. SNR Date Day HRT Inf. Eff. SNR
24/09/2007 1 10.2 17.5 14.8 0.06 25/10/2007 32 5.6 41.2 23.8 0.76
25/09/2007 2 10.9 19.6 16.7 0.06 26/10/2007 33 5.5 38.4 29.6 0.39
26/09/2007 3 10.9 18.0 13.7 0.10 27/10/2007 34 5.6 27.2 18.0 0.40
27/09/2007 4 10.6 18.9 13.9 0.12 28/10/2007 35 5.7 25.6 15.8 0.42
28/09/2007 5 10.5 17.9 13.0 0.11 29/10/2007 36 5.6 25.3 14.0 0.49
30/09/2007 7 10.5 20.5 14.4 0.14 30/10/2007 37 5.5 30.0 16.8 0.58
01/10/2007 8 10.5 20.6 16.0 0.11 31/10/2007 38 5.5 26.3 9.8 0.72
02/10/2007 9 10.8 18.9 14.6 0.10 01/11/2007 39 5.5 34.2 16.2 0.80
03/10/2007 10 12.1 17.9 11.9 0.12 02/11/2007 40 5.7 33.8 18.2 0.67
04/10/2007 11 11.8 17.8 11.3 0.13 03/11/2007 41 5.5 33.5 15.3 0.80
10/10/2007 17 11.7 11.0 8.6 0.05 04/11/2007 42 5.5 34.4 17.9 0.73
11/10/2007 18 12.0 16.4 12.4 0.08 05/11/2007 43 5.5 33.8 16.3 0.77
12/10/2007 19 11.8 19.6 11.3 0.17 06/11/2007 44 5.7 24.0 6.4 0.76
13/10/2007 20 12.1 18.6 10.2 0.17 07/11/2007 45 5.6 22.2 4.1 0.79
14/10/2007 21 12.0 16.7 9.7 0.14 08/11/2007 46 5.9 23.8 6.7 0.71
15/10/2007 22 11.9 15.5 7.1 0.17 09/11/2007 47 5.6 23.9 8.8 0.66
19/10/2007 26 11.3 20.4 19.0 0.03 10/11/2007 48 5.5 17.1 6.6 0.47
20/10/2007 27 11.3 18.9 13.8 0.11 11/11/2007 49 5.5 18.6 4.2 0.64
21/10/2007 28 11.3 17.7 8.7 0.19 12/11/2007 50 5.4 22.6 4.5 0.81
22/10/2007 29 11.4 16.0 3.3 0.27 13/11/2007 51 5.5 23.3 4.4 0.83
23/10/2007 30 11.4 13.6 3.2 0.22 14/11/2007 52 4.9 22.1 5.9 0.81
24/10/2007 31 5.5 19.3 6.3 0.57 15/11/2007 53 5.1 22.9 1.4 1.02
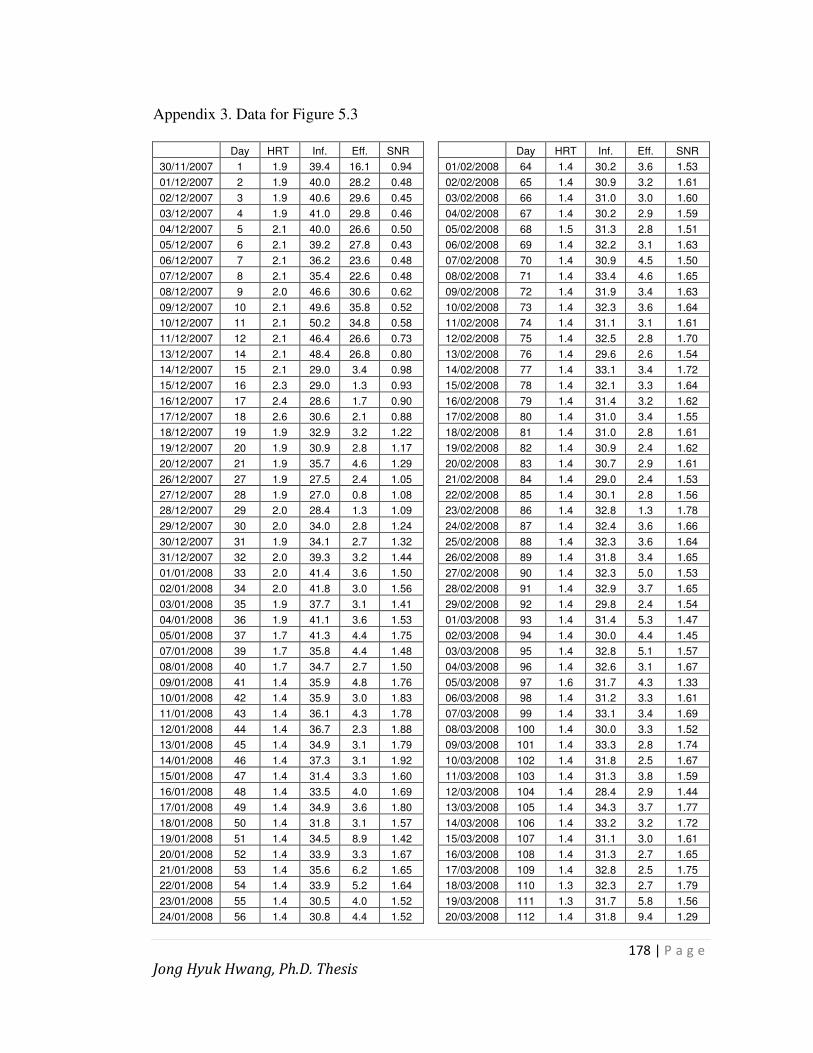
178 | P a g e
Jong Hyuk Hwang, Ph.D. Thesis
Appendix 3. Data for Figure 5.3
Day HRT Inf. Eff. SNR Day HRT Inf. Eff. SNR
30/11/2007 1 1.9 39.4 16.1 0.94 01/02/2008 64 1.4 30.2 3.6 1.53
01/12/2007 2 1.9 40.0 28.2 0.48 02/02/2008 65 1.4 30.9 3.2 1.61
02/12/2007 3 1.9 40.6 29.6 0.45 03/02/2008 66 1.4 31.0 3.0 1.60
03/12/2007 4 1.9 41.0 29.8 0.46 04/02/2008 67 1.4 30.2 2.9 1.59
04/12/2007 5 2.1 40.0 26.6 0.50 05/02/2008 68 1.5 31.3 2.8 1.51
05/12/2007 6 2.1 39.2 27.8 0.43 06/02/2008 69 1.4 32.2 3.1 1.63
06/12/2007 7 2.1 36.2 23.6 0.48 07/02/2008 70 1.4 30.9 4.5 1.50
07/12/2007 8 2.1 35.4 22.6 0.48 08/02/2008 71 1.4 33.4 4.6 1.65
08/12/2007 9 2.0 46.6 30.6 0.62 09/02/2008 72 1.4 31.9 3.4 1.63
09/12/2007 10 2.1 49.6 35.8 0.52 10/02/2008 73 1.4 32.3 3.6 1.64
10/12/2007 11 2.1 50.2 34.8 0.58 11/02/2008 74 1.4 31.1 3.1 1.61
11/12/2007 12 2.1 46.4 26.6 0.73 12/02/2008 75 1.4 32.5 2.8 1.70
13/12/2007 14 2.1 48.4 26.8 0.80 13/02/2008 76 1.4 29.6 2.6 1.54
14/12/2007 15 2.1 29.0 3.4 0.98 14/02/2008 77 1.4 33.1 3.4 1.72
15/12/2007 16 2.3 29.0 1.3 0.93 15/02/2008 78 1.4 32.1 3.3 1.64
16/12/2007 17 2.4 28.6 1.7 0.90 16/02/2008 79 1.4 31.4 3.2 1.62
17/12/2007 18 2.6 30.6 2.1 0.88 17/02/2008 80 1.4 31.0 3.4 1.55
18/12/2007 19 1.9 32.9 3.2 1.22 18/02/2008 81 1.4 31.0 2.8 1.61
19/12/2007 20 1.9 30.9 2.8 1.17 19/02/2008 82 1.4 30.9 2.4 1.62
20/12/2007 21 1.9 35.7 4.6 1.29 20/02/2008 83 1.4 30.7 2.9 1.61
26/12/2007 27 1.9 27.5 2.4 1.05 21/02/2008 84 1.4 29.0 2.4 1.53
27/12/2007 28 1.9 27.0 0.8 1.08 22/02/2008 85 1.4 30.1 2.8 1.56
28/12/2007 29 2.0 28.4 1.3 1.09 23/02/2008 86 1.4 32.8 1.3 1.78
29/12/2007 30 2.0 34.0 2.8 1.24 24/02/2008 87 1.4 32.4 3.6 1.66
30/12/2007 31 1.9 34.1 2.7 1.32 25/02/2008 88 1.4 32.3 3.6 1.64
31/12/2007 32 2.0 39.3 3.2 1.44 26/02/2008 89 1.4 31.8 3.4 1.65
01/01/2008 33 2.0 41.4 3.6 1.50 27/02/2008 90 1.4 32.3 5.0 1.53
02/01/2008 34 2.0 41.8 3.0 1.56 28/02/2008 91 1.4 32.9 3.7 1.65
03/01/2008 35 1.9 37.7 3.1 1.41 29/02/2008 92 1.4 29.8 2.4 1.54
04/01/2008 36 1.9 41.1 3.6 1.53 01/03/2008 93 1.4 31.4 5.3 1.47
05/01/2008 37 1.7 41.3 4.4 1.75 02/03/2008 94 1.4 30.0 4.4 1.45
07/01/2008 39 1.7 35.8 4.4 1.48 03/03/2008 95 1.4 32.8 5.1 1.57
08/01/2008 40 1.7 34.7 2.7 1.50 04/03/2008 96 1.4 32.6 3.1 1.67
09/01/2008 41 1.4 35.9 4.8 1.76 05/03/2008 97 1.6 31.7 4.3 1.33
10/01/2008 42 1.4 35.9 3.0 1.83 06/03/2008 98 1.4 31.2 3.3 1.61
11/01/2008 43 1.4 36.1 4.3 1.78 07/03/2008 99 1.4 33.1 3.4 1.69
12/01/2008 44 1.4 36.7 2.3 1.88 08/03/2008 100 1.4 30.0 3.3 1.52
13/01/2008 45 1.4 34.9 3.1 1.79 09/03/2008 101 1.4 33.3 2.8 1.74
14/01/2008 46 1.4 37.3 3.1 1.92 10/03/2008 102 1.4 31.8 2.5 1.67
15/01/2008 47 1.4 31.4 3.3 1.60 11/03/2008 103 1.4 31.3 3.8 1.59
16/01/2008 48 1.4 33.5 4.0 1.69 12/03/2008 104 1.4 28.4 2.9 1.44
17/01/2008 49 1.4 34.9 3.6 1.80 13/03/2008 105 1.4 34.3 3.7 1.77
18/01/2008 50 1.4 31.8 3.1 1.57 14/03/2008 106 1.4 33.2 3.2 1.72
19/01/2008 51 1.4 34.5 8.9 1.42 15/03/2008 107 1.4 31.1 3.0 1.61
20/01/2008 52 1.4 33.9 3.3 1.67 16/03/2008 108 1.4 31.3 2.7 1.65
21/01/2008 53 1.4 35.6 6.2 1.65 17/03/2008 109 1.4 32.8 2.5 1.75
22/01/2008 54 1.4 33.9 5.2 1.64 18/03/2008 110 1.3 32.3 2.7 1.79
23/01/2008 55 1.4 30.5 4.0 1.52 19/03/2008 111 1.3 31.7 5.8 1.56
24/01/2008 56 1.4 30.8 4.4 1.52 20/03/2008 112 1.4 31.8 9.4 1.29
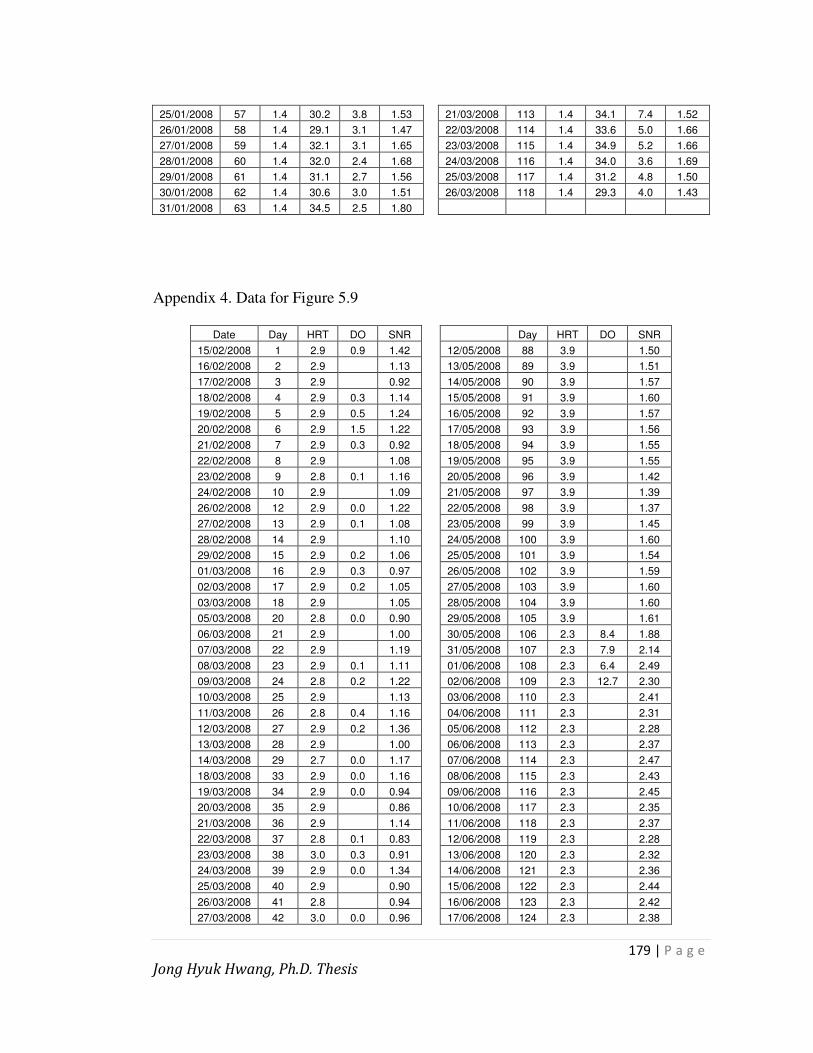
179 | P a g e
Jong Hyuk Hwang, Ph.D. Thesis
25/01/2008 57 1.4 30.2 3.8 1.53 21/03/2008 113 1.4 34.1 7.4 1.52
26/01/2008 58 1.4 29.1 3.1 1.47 22/03/2008 114 1.4 33.6 5.0 1.66
27/01/2008 59 1.4 32.1 3.1 1.65 23/03/2008 115 1.4 34.9 5.2 1.66
28/01/2008 60 1.4 32.0 2.4 1.68 24/03/2008 116 1.4 34.0 3.6 1.69
29/01/2008 61 1.4 31.1 2.7 1.56 25/03/2008 117 1.4 31.2 4.8 1.50
30/01/2008 62 1.4 30.6 3.0 1.51 26/03/2008 118 1.4 29.3 4.0 1.43
31/01/2008 63 1.4 34.5 2.5 1.80
Appendix 4. Data for Figure 5.9
Date Day HRT DO SNR Day HRT DO SNR
15/02/2008 1 2.9 0.9 1.42 12/05/2008 88 3.9 1.50
16/02/2008 2 2.9 1.13 13/05/2008 89 3.9 1.51
17/02/2008 3 2.9 0.92 14/05/2008 90 3.9 1.57
18/02/2008 4 2.9 0.3 1.14 15/05/2008 91 3.9 1.60
19/02/2008 5 2.9 0.5 1.24 16/05/2008 92 3.9 1.57
20/02/2008 6 2.9 1.5 1.22 17/05/2008 93 3.9 1.56
21/02/2008 7 2.9 0.3 0.92 18/05/2008 94 3.9 1.55
22/02/2008 8 2.9 1.08 19/05/2008 95 3.9 1.55
23/02/2008 9 2.8 0.1 1.16 20/05/2008 96 3.9 1.42
24/02/2008 10 2.9 1.09 21/05/2008 97 3.9 1.39
26/02/2008 12 2.9 0.0 1.22 22/05/2008 98 3.9 1.37
27/02/2008 13 2.9 0.1 1.08 23/05/2008 99 3.9 1.45
28/02/2008 14 2.9 1.10 24/05/2008 100 3.9 1.60
29/02/2008 15 2.9 0.2 1.06 25/05/2008 101 3.9 1.54
01/03/2008 16 2.9 0.3 0.97 26/05/2008 102 3.9 1.59
02/03/2008 17 2.9 0.2 1.05 27/05/2008 103 3.9 1.60
03/03/2008 18 2.9 1.05 28/05/2008 104 3.9 1.60
05/03/2008 20 2.8 0.0 0.90 29/05/2008 105 3.9 1.61
06/03/2008 21 2.9 1.00 30/05/2008 106 2.3 8.4 1.88
07/03/2008 22 2.9 1.19 31/05/2008 107 2.3 7.9 2.14
08/03/2008 23 2.9 0.1 1.11 01/06/2008 108 2.3 6.4 2.49
09/03/2008 24 2.8 0.2 1.22 02/06/2008 109 2.3 12.7 2.30
10/03/2008 25 2.9 1.13 03/06/2008 110 2.3 2.41
11/03/2008 26 2.8 0.4 1.16 04/06/2008 111 2.3 2.31
12/03/2008 27 2.9 0.2 1.36 05/06/2008 112 2.3 2.28
13/03/2008 28 2.9 1.00 06/06/2008 113 2.3 2.37
14/03/2008 29 2.7 0.0 1.17 07/06/2008 114 2.3 2.47
18/03/2008 33 2.9 0.0 1.16 08/06/2008 115 2.3 2.43
19/03/2008 34 2.9 0.0 0.94 09/06/2008 116 2.3 2.45
20/03/2008 35 2.9 0.86 10/06/2008 117 2.3 2.35
21/03/2008 36 2.9 1.14 11/06/2008 118 2.3 2.37
22/03/2008 37 2.8 0.1 0.83 12/06/2008 119 2.3 2.28
23/03/2008 38 3.0 0.3 0.91 13/06/2008 120 2.3 2.32
24/03/2008 39 2.9 0.0 1.34 14/06/2008 121 2.3 2.36
25/03/2008 40 2.9 0.90 15/06/2008 122 2.3 2.44
26/03/2008 41 2.8 0.94 16/06/2008 123 2.3 2.42
27/03/2008 42 3.0 0.0 0.96 17/06/2008 124 2.3 2.38

180 | P a g e
Jong Hyuk Hwang, Ph.D. Thesis
28/03/2008 43 2.8 1.84 18/06/2008 125 2.3 2.41
29/03/2008 44 2.9 5.8 1.95 19/06/2008 126 2.3 2.41
30/03/2008 45 2.9 8.0 2.15 20/06/2008 127 1.7 2.67
31/03/2008 46 3.0 0.6 2.12 22/06/2008 129 1.7 6.3 2.90
01/04/2008 47 2.9 0.8 1.89 23/06/2008 130 1.7 15.6 2.43
02/04/2008 48 2.8 0.4 1.99 24/06/2008 131 1.7 14.4 2.36
03/04/2008 49 2.8 1.96 25/06/2008 132 1.7 13.4 2.39
04/04/2008 50 2.9 1.95 26/06/2008 133 1.7 2.80
05/04/2008 51 2.8 0.0 2.01 27/06/2008 134 1.7 2.59
06/04/2008 52 2.9 0.7 1.93 28/06/2008 135 1.7 2.82
07/04/2008 53 2.9 0.3 1.93 29/06/2008 136 1.7 4.2 2.77
08/04/2008 54 2.9 0.2 1.86 01/07/2008 138 1.7 10.8 2.88
09/04/2008 55 2.9 0.3 2.11 02/07/2008 139 1.7 11.4 2.69
10/04/2008 56 2.9 0.8 2.07 03/07/2008 140 1.8 2.32
11/04/2008 57 2.9 0.5 2.04 04/07/2008 141 1.7 2.46
12/04/2008 58 2.9 0.7 1.98 05/07/2008 142 1.8 2.50
13/04/2008 59 2.9 1.95 06/07/2008 143 1.8 2.51
14/04/2008 60 2.9 0.6 2.05 07/07/2008 144 1.7 2.42
15/04/2008 61 2.9 0.6 2.04 08/07/2008 145 1.8 2.54
16/04/2008 62 2.9 0.6 2.00 09/07/2008 146 1.8 2.52
17/04/2008 63 2.9 2.6 1.96 10/07/2008 147 1.8 2.47
18/04/2008 64 2.9 0.5 1.98 11/07/2008 148 1.4 6.4 2.50
19/04/2008 65 2.9 0.4 2.03 12/07/2008 149 1.4 6.2 2.58
21/04/2008 67 2.9 0.4 2.03 13/07/2008 150 1.4 7.4 2.64
22/04/2008 68 2.9 0.5 2.02 14/07/2008 151 1.4 8.5 2.62
23/04/2008 69 2.9 0.7 2.06 15/07/2008 152 1.4 2.48
24/04/2008 70 2.9 4.8 2.14 16/07/2008 153 1.4 9.3 2.61
25/04/2008 71 2.9 7.9 2.20 17/07/2008 154 1.5 12.3 2.39
26/04/2008 72 2.9 5.1 2.01 18/07/2008 155 1.5 2.73
30/04/2008 76 2.9 1.96 19/07/2008 156 1.4 2.69
01/05/2008 77 2.9 1.7 1.88 20/07/2008 157 1.4 2.47
02/05/2008 78 2.9 2.1 1.93 21/07/2008 158 1.4 2.73
03/05/2008 79 2.9 4.3 2.06 22/07/2008 159 1.4 2.47
05/05/2008 81 2.9 1.95 23/07/2008 160 1.4 2.62
06/05/2008 82 2.9 3.7 1.95 24/07/2008 161 1.4 2.46
07/05/2008 83 2.9 3.1 2.07 25/07/2008 162 1.4 2.69
08/05/2008 84 2.9 3.5 2.01 26/07/2008 163 1.5 2.76
09/05/2008 85 3.9 14.0 1.56 27/07/2008 164 1.4 2.66
10/05/2008 86 3.9 1.75 28/07/2008 165 1.4 2.69
11/05/2008 87 3.9 1.47 01/08/2008 169 1.4 2.67

181 | P a g e
Jong Hyuk Hwang, Ph.D. Thesis
Appendix 5. Data for Figure 5.10(a)
Time (hr) Time (d) pH NH4-N NO2-N NO3-N NOx-N TIN Estimated NOx-N
0.00 0.00 7.30 17.70 0.29 13.50 13.79 31.49 13.80
3.00 0.13 7.71 17.00 0.38 13.43 13.81 30.81 13.89
6.13 0.26 7.90 17.60 0.41 13.55 13.96 31.56 14.00
24.10 1.00 8.24 16.90 1.45 13.51 14.96 31.86 14.95
25.60 1.07 8.25 16.80 1.05 13.55 14.60 31.40 15.06
28.50 1.19 8.25 15.50 1.98 13.55 15.53 31.03 15.30
47.00 1.96 8.15 13.60 4.02 14.10 18.12 31.72 17.64
50.70 2.11 8.08 12.90 4.20 14.12 18.32 31.22 18.34
54.70 2.28 7.98 12.50 4.45 14.09 18.54 31.04 19.22
71.30 2.97 7.54 6.60 10.87 14.80 25.67 32.27 24.74
77.00 3.21 7.45 3.20 13.55 15.20 28.75 31.95 27.61
Appendix 6. Data for Figure 5.10(b)
Time (h) Time (d) pH NH4-N NO2-N NO3-N NOx-N TIN Estimated NOx-N
0.00 0.00 8.13 36.50 3.80 22.60 26.40 62.90 26.40
1.83 0.08 8.13 35.95 3.80 22.60 26.40 62.35 26.52
6.17 0.26 8.17 33.94 5.96 22.62 28.58 62.51 26.84
22.50 0.94 8.20 31.36 7.54 22.84 30.38 61.74 28.74
25.83 1.08 8.19 30.69 7.85 22.23 30.08 60.76 29.31
29.67 1.24 8.20 30.19 8.61 22.47 31.08 61.27 30.07
46.50 1.94 8.05 26.10 13.90 22.28 36.18 62.27 35.32
50.50 2.10 7.92 24.64 15.70 21.87 37.57 62.21 37.21
51.92 2.16 7.88 23.98 16.60 21.67 38.27 62.25 37.96
53.33 2.22 7.88 22.62 17.50 21.57 39.07 61.69 38.75
60.25 2.51 7.70 17.70 22.80 20.76 43.56 61.26 43.37
71.33 2.97 7.37 4.18 34.30 20.85 55.15 59.33 54.18
73.67 3.07 7.38 1.06 35.70 20.65 56.35 57.41 57.17
77.02 3.21 7.84 0.11 35.90 21.76 57.66 57.77 61.99

182 | P a g e
Jong Hyuk Hwang, Ph.D. Thesis
Appendix 7. Data for Figure 6.2
Date Day HRT (D1)
HRT (D2)
TIN NO3-N NO2-N SDNR (D1)
SDNR (D2) Inf. DN-1 DN-2 Inf. DN-1 DN-2 Inf. DN-1 DN-2
20/03/2007 1 8.5 17.4 19.4 0.0 0.9 19.4 0.0 0.0 0.0 0.0 0.0 0.76 0.36
21/03/2007 2 9.8 17.8 18.5 0.0 0.0 18.5 0.0 0.0 0.0 0.0 0.0 0.63 0.35
22/03/2007 3 9.9 18.1 29.0 8.1 0.0 29.0 8.1 0.0 0.0 0.71 0.54
23/03/2007 4 9.4 16.1 30.6 8.9 1.5 30.6 8.9 1.5 0.0 0.78 0.61
26/03/2007 7 9.5 18.3 27.1 14.1 5.7 27.1 14.1 5.7 0.0 0.46 0.39
27/03/2007 8 9.1 17.9 29.7 12.8 5.7 29.7 8.7 5.4 0.0 4.1 0.3 0.62 0.45
28/03/2007 9 9.8 16.1 26.3 10.6 7.4 26.3 7.0 6.9 0.0 3.6 0.5 0.54 0.40
29/03/2007 10 12.7 16.9 31.4 14.8 3.9 31.4 9.3 3.7 0.0 5.5 0.2 0.44 0.55
30/03/2007 11 8.1 17.6 30.0 20.0 6.1 30.0 14.4 5.8 0.0 5.6 0.3 0.42 0.46
02/04/2007 14 8.1 17.1 30.6 25.0 8.4 30.6 17.8 7.2 0.0 7.2 1.2 0.23 0.44
03/04/2007 15 7.9 18.4 28.6 20.5 11.4 28.6 14.2 11.4 0.0 6.3 0.0 0.35 0.32
04/04/2007 16 8.2 18.2 31.5 20.5 15.1 31.5 15.3 15.1 0.0 5.2 0.0 0.45 0.30
05/04/2007 17 7.8 18.3 35.1 20.9 19.7 35.1 11.7 19.7 0.0 9.2 0.0 0.61 0.28
06/04/2007 18 7.6 18.1 32.2 19.0 16.1 32.2 12.9 16.1 0.0 6.0 0.0 0.59 0.30
08/04/2007 20 7.3 17.9 31.6 19.0 15.6 31.6 12.9 15.6 0.0 6.0 0.0 0.58 0.30
09/04/2007 21 6.9 17.8 32.0 19.7 16.1 32.0 13.4 16.1 0.0 6.3 0.0 0.60 0.30
10/04/2007 22 6.7 17.4 32.3 20.7 16.8 32.3 14.0 16.8 0.0 6.7 0.0 0.59 0.30
11/04/2007 23 6.6 17.8 26.0 18.2 15.2 26.0 12.1 15.2 0.0 6.1 0.0 0.40 0.21
12/04/2007 24 6.7 18.0 25.4 18.1 13.0 25.4 15.1 11.1 0.0 3.0 1.9 0.37 0.23
13/04/2007 25 6.6 18.0 26.1 20.3 15.7 26.1 18.3 12.7 0.0 1.9 3.0 0.30 0.19
14/04/2007 26 6.6 17.9 24.9 20.0 15.4 24.9 18.1 12.5 0.0 2.0 2.9 0.25 0.18
16/04/2007 28 6.9 17.1 26.5 20.4 17.4 26.5 18.9 14.3 0.0 1.5 3.1 0.30 0.18
17/04/2007 29 7.2 18.0 27.5 20.6 17.8 27.5 17.5 13.0 0.0 3.2 4.8 0.32 0.18
18/04/2007 30 7.7 17.9 28.6 22.4 19.4 28.6 18.5 14.9 0.0 4.0 4.5 0.27 0.17
19/04/2007 31 7.8 17.9 26.3 19.4 20.0 26.3 14.9 14.8 0.0 4.5 5.1 0.30 0.12
22/04/2007 34 7.7 17.9 26.3 19.4 16.1 26.3 14.9 10.8 0.0 4.5 5.3 0.30 0.19
25/04/2007 37 8.5 18.0 26.4 18.4 16.2 29.3 16.6 14.0 0.0 3.8 4.0 0.32 0.19
01/05/2007 43 7.5 17.7 27.0 16.1 12.9 26.0 16.1 6.2 0.0 0.0 6.7 0.49 0.27
02/05/2007 44 8.1 16.8 26.7 16.2 12.8 25.5 16.2 6.2 0.0 0.0 6.5 0.44 0.28
03/05/2007 45 8.4 17.9 31.1 18.4 14.1 31.1 18.4 7.6 0.0 0.0 6.6 0.51 0.32
04/05/2007 46 8.3 17.2 30.6 18.3 14.3 30.6 18.3 7.8 0.0 0.0 6.5 0.50 0.32
05/05/2007 47 7.5 17.7 30.5 19.4 14.1 30.5 19.4 8.1 0.0 0.0 6.0 0.50 0.31
06/05/2007 48 7.4 17.6 29.8 19.3 13.3 29.8 17.8 9.4 0.0 1.5 3.9 0.48 0.32
07/05/2007 49 6.9 17.4 28.6 20.0 16.3 28.6 19.0 15.1 0.0 1.0 1.3 0.42 0.24
08/05/2007 50 8.1 18.0 29.2 20.8 17.3 29.2 20.8 17.3 0.0 0.0 0.0 0.35 0.22
09/05/2007 51 10.2 18.5 27.3 18.5 15.6 27.3 18.5 15.6 0.0 0.0 0.0 0.29 0.21
10/05/2007 52 10.3 18.5 26.7 11.4 14.9 26.7 8.9 14.9 0.0 2.6 0.0 0.50 0.22
11/05/2007 53 6.0 18.4 26.5 19.5 14.8 26.5 18.7 9.8 0.0 0.9 5.0 0.39 0.21
12/05/2007 54 6.0 18.9 27.3 21.7 16.0 27.3 21.2 13.7 0.0 0.5 2.3 0.32 0.20
14/05/2007 56 5.9 18.5 28.1 22.5 17.8 28.1 22.5 15.2 0.0 0.0 2.6 0.32 0.19
15/05/2007 57 5.7 18.6 29.8 24.3 21.0 29.8 24.3 13.2 0.0 0.0 7.8 0.33 0.16
16/05/2007 58 5.4 18.9 29.7 24.7 21.1 29.7 24.7 13.0 0.0 0.0 8.1 0.31 0.15
17/05/2007 59 5.2 18.0 29.5 24.7 20.9 29.5 24.7 12.7 0.0 0.0 8.2 0.31 0.16
18/05/2007 60 5.1 17.9 27.9 24.1 20.0 27.9 24.1 8.8 0.0 0.0 11.2 0.25 0.15
19/05/2007 61 6.0 18.1 29.5 24.0 21.0 29.5 24.0 16.2 0.0 0.0 4.8 0.31 0.16
20/05/2007 62 6.7 18.0 29.5 22.3 19.7 29.5 22.3 19.3 0.0 0.0 0.4 0.36 0.18
22/05/2007 64 6.6 17.7 30.8 22.4 19.4 30.8 22.0 18.8 0.0 0.4 0.5 0.43 0.22
23/05/2007 65 5.9 17.3 26.5 19.1 15.8 26.5 19.1 15.8 0.0 0.0 0.0 0.42 0.21
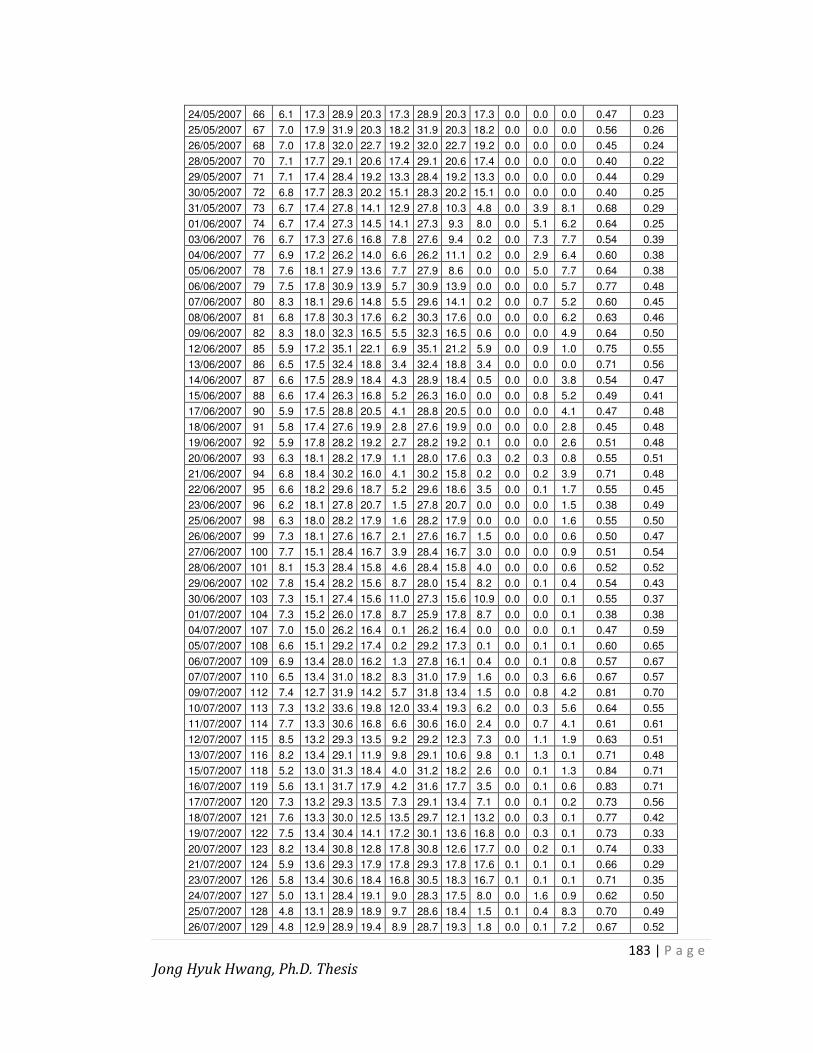
183 | P a g e
Jong Hyuk Hwang, Ph.D. Thesis
24/05/2007 66 6.1 17.3 28.9 20.3 17.3 28.9 20.3 17.3 0.0 0.0 0.0 0.47 0.23
25/05/2007 67 7.0 17.9 31.9 20.3 18.2 31.9 20.3 18.2 0.0 0.0 0.0 0.56 0.26
26/05/2007 68 7.0 17.8 32.0 22.7 19.2 32.0 22.7 19.2 0.0 0.0 0.0 0.45 0.24
28/05/2007 70 7.1 17.7 29.1 20.6 17.4 29.1 20.6 17.4 0.0 0.0 0.0 0.40 0.22
29/05/2007 71 7.1 17.4 28.4 19.2 13.3 28.4 19.2 13.3 0.0 0.0 0.0 0.44 0.29
30/05/2007 72 6.8 17.7 28.3 20.2 15.1 28.3 20.2 15.1 0.0 0.0 0.0 0.40 0.25
31/05/2007 73 6.7 17.4 27.8 14.1 12.9 27.8 10.3 4.8 0.0 3.9 8.1 0.68 0.29
01/06/2007 74 6.7 17.4 27.3 14.5 14.1 27.3 9.3 8.0 0.0 5.1 6.2 0.64 0.25
03/06/2007 76 6.7 17.3 27.6 16.8 7.8 27.6 9.4 0.2 0.0 7.3 7.7 0.54 0.39
04/06/2007 77 6.9 17.2 26.2 14.0 6.6 26.2 11.1 0.2 0.0 2.9 6.4 0.60 0.38
05/06/2007 78 7.6 18.1 27.9 13.6 7.7 27.9 8.6 0.0 0.0 5.0 7.7 0.64 0.38
06/06/2007 79 7.5 17.8 30.9 13.9 5.7 30.9 13.9 0.0 0.0 0.0 5.7 0.77 0.48
07/06/2007 80 8.3 18.1 29.6 14.8 5.5 29.6 14.1 0.2 0.0 0.7 5.2 0.60 0.45
08/06/2007 81 6.8 17.8 30.3 17.6 6.2 30.3 17.6 0.0 0.0 0.0 6.2 0.63 0.46
09/06/2007 82 8.3 18.0 32.3 16.5 5.5 32.3 16.5 0.6 0.0 0.0 4.9 0.64 0.50
12/06/2007 85 5.9 17.2 35.1 22.1 6.9 35.1 21.2 5.9 0.0 0.9 1.0 0.75 0.55
13/06/2007 86 6.5 17.5 32.4 18.8 3.4 32.4 18.8 3.4 0.0 0.0 0.0 0.71 0.56
14/06/2007 87 6.6 17.5 28.9 18.4 4.3 28.9 18.4 0.5 0.0 0.0 3.8 0.54 0.47
15/06/2007 88 6.6 17.4 26.3 16.8 5.2 26.3 16.0 0.0 0.0 0.8 5.2 0.49 0.41
17/06/2007 90 5.9 17.5 28.8 20.5 4.1 28.8 20.5 0.0 0.0 0.0 4.1 0.47 0.48
18/06/2007 91 5.8 17.4 27.6 19.9 2.8 27.6 19.9 0.0 0.0 0.0 2.8 0.45 0.48
19/06/2007 92 5.9 17.8 28.2 19.2 2.7 28.2 19.2 0.1 0.0 0.0 2.6 0.51 0.48
20/06/2007 93 6.3 18.1 28.2 17.9 1.1 28.0 17.6 0.3 0.2 0.3 0.8 0.55 0.51
21/06/2007 94 6.8 18.4 30.2 16.0 4.1 30.2 15.8 0.2 0.0 0.2 3.9 0.71 0.48
22/06/2007 95 6.6 18.2 29.6 18.7 5.2 29.6 18.6 3.5 0.0 0.1 1.7 0.55 0.45
23/06/2007 96 6.2 18.1 27.8 20.7 1.5 27.8 20.7 0.0 0.0 0.0 1.5 0.38 0.49
25/06/2007 98 6.3 18.0 28.2 17.9 1.6 28.2 17.9 0.0 0.0 0.0 1.6 0.55 0.50
26/06/2007 99 7.3 18.1 27.6 16.7 2.1 27.6 16.7 1.5 0.0 0.0 0.6 0.50 0.47
27/06/2007 100 7.7 15.1 28.4 16.7 3.9 28.4 16.7 3.0 0.0 0.0 0.9 0.51 0.54
28/06/2007 101 8.1 15.3 28.4 15.8 4.6 28.4 15.8 4.0 0.0 0.0 0.6 0.52 0.52
29/06/2007 102 7.8 15.4 28.2 15.6 8.7 28.0 15.4 8.2 0.0 0.1 0.4 0.54 0.43
30/06/2007 103 7.3 15.1 27.4 15.6 11.0 27.3 15.6 10.9 0.0 0.0 0.1 0.55 0.37
01/07/2007 104 7.3 15.2 26.0 17.8 8.7 25.9 17.8 8.7 0.0 0.0 0.1 0.38 0.38
04/07/2007 107 7.0 15.0 26.2 16.4 0.1 26.2 16.4 0.0 0.0 0.0 0.1 0.47 0.59
05/07/2007 108 6.6 15.1 29.2 17.4 0.2 29.2 17.3 0.1 0.0 0.1 0.1 0.60 0.65
06/07/2007 109 6.9 13.4 28.0 16.2 1.3 27.8 16.1 0.4 0.0 0.1 0.8 0.57 0.67
07/07/2007 110 6.5 13.4 31.0 18.2 8.3 31.0 17.9 1.6 0.0 0.3 6.6 0.67 0.57
09/07/2007 112 7.4 12.7 31.9 14.2 5.7 31.8 13.4 1.5 0.0 0.8 4.2 0.81 0.70
10/07/2007 113 7.3 13.2 33.6 19.8 12.0 33.4 19.3 6.2 0.0 0.3 5.6 0.64 0.55
11/07/2007 114 7.7 13.3 30.6 16.8 6.6 30.6 16.0 2.4 0.0 0.7 4.1 0.61 0.61
12/07/2007 115 8.5 13.2 29.3 13.5 9.2 29.2 12.3 7.3 0.0 1.1 1.9 0.63 0.51
13/07/2007 116 8.2 13.4 29.1 11.9 9.8 29.1 10.6 9.8 0.1 1.3 0.1 0.71 0.48
15/07/2007 118 5.2 13.0 31.3 18.4 4.0 31.2 18.2 2.6 0.0 0.1 1.3 0.84 0.71
16/07/2007 119 5.6 13.1 31.7 17.9 4.2 31.6 17.7 3.5 0.0 0.1 0.6 0.83 0.71
17/07/2007 120 7.3 13.2 29.3 13.5 7.3 29.1 13.4 7.1 0.0 0.1 0.2 0.73 0.56
18/07/2007 121 7.6 13.3 30.0 12.5 13.5 29.7 12.1 13.2 0.0 0.3 0.1 0.77 0.42
19/07/2007 122 7.5 13.4 30.4 14.1 17.2 30.1 13.6 16.8 0.0 0.3 0.1 0.73 0.33
20/07/2007 123 8.2 13.4 30.8 12.8 17.8 30.8 12.6 17.7 0.0 0.2 0.1 0.74 0.33
21/07/2007 124 5.9 13.6 29.3 17.9 17.8 29.3 17.8 17.6 0.1 0.1 0.1 0.66 0.29
23/07/2007 126 5.8 13.4 30.6 18.4 16.8 30.5 18.3 16.7 0.1 0.1 0.1 0.71 0.35
24/07/2007 127 5.0 13.1 28.4 19.1 9.0 28.3 17.5 8.0 0.0 1.6 0.9 0.62 0.50
25/07/2007 128 4.8 13.1 28.9 18.9 9.7 28.6 18.4 1.5 0.1 0.4 8.3 0.70 0.49
26/07/2007 129 4.8 12.9 28.9 19.4 8.9 28.7 19.3 1.8 0.0 0.1 7.2 0.67 0.52

184 | P a g e
Jong Hyuk Hwang, Ph.D. Thesis
27/07/2007 130 6.7 13.1 28.4 14.1 9.6 28.3 14.0 3.3 0.0 0.1 6.4 0.72 0.48
29/07/2007 132 6.4 13.1 27.8 18.1 11.4 27.7 18.0 8.7 0.1 0.1 2.7 0.51 0.42
30/07/2007 133 6.7 13.1 25.5 17.2 10.3 25.4 17.1 5.8 0.0 0.1 4.5 0.42 0.39
31/07/2007 134 6.0 13.2 31.3 21.0 12.3 31.0 20.8 12.2 0.0 0.0 0.0 0.57 0.48
01/08/2007 135 6.3 13.3 29.1 19.1 11.3 29.1 19.0 5.9 0.0 0.1 5.4 0.54 0.45
02/08/2007 136 6.5 13.4 29.9 18.3 11.5 29.9 18.2 6.7 0.0 0.1 4.8 0.60 0.46
03/08/2007 137 7.0 13.0 29.4 16.4 9.3 29.4 16.4 5.5 0.0 0.0 3.7 0.62 0.52
04/08/2007 138 6.7 13.3 28.5 17.4 6.9 28.4 17.4 6.2 0.0 0.0 0.6 0.56 0.55
06/08/2007 140 6.4 13.2 27.0 18.6 8.1 26.9 18.6 7.6 0.0 0.0 0.5 0.44 0.48
07/08/2007 141 6.6 13.2 28.4 17.1 10.9 28.3 17.1 10.4 0.0 0.0 0.5 0.58 0.45
08/08/2007 142 6.5 13.5 29.3 17.2 9.4 29.3 17.2 8.3 0.0 0.0 1.1 0.63 0.50
09/08/2007 143 6.1 13.0 29.1 14.0 11.7 28.8 13.8 11.1 0.0 0.2 0.6 0.83 0.45
13/08/2007 147 7.2 13.1 27.9 12.8 8.3 27.8 12.7 7.9 0.0 0.1 0.4 0.71 0.51
14/08/2007 148 7.3 13.7 28.6 14.0 12.1 28.3 13.7 11.0 0.0 0.2 1.0 0.67 0.41
15/08/2007 149 7.2 12.7 27.8 13.6 9.2 27.6 13.5 9.0 0.0 0.1 0.1 0.66 0.49
16/08/2007 150 6.9 12.2 28.4 12.1 9.6 28.3 12.0 9.4 0.0 0.1 0.1 0.79 0.52
17/08/2007 151 8.0 13.7 28.9 13.9 12.5 28.8 13.8 12.4 0.1 0.1 0.1 0.63 0.40
19/08/2007 153 7.2 13.4 29.0 21.2 11.3 28.7 21.1 3.7 0.0 0.1 7.6 0.36 0.44
20/08/2007 154 7.4 13.7 29.4 19.9 12.2 29.3 19.5 3.7 0.0 0.3 8.5 0.44 0.43
21/08/2007 155 7.0 13.7 30.6 26.4 18.2 30.2 26.1 8.9 0.0 0.0 8.9 0.20 0.31
22/08/2007 156 6.3 13.7 30.8 18.7 22.6 30.4 16.0 22.3 0.1 2.6 0.2 0.65 0.20
23/08/2007 157 7.3 13.6 29.8 17.0 20.7 29.7 10.0 19.9 0.0 7.0 0.9 0.59 0.23
24/08/2007 158 7.6 13.6 26.9 12.5 15.3 26.9 8.6 6.4 0.0 3.9 8.9 0.64 0.29
25/08/2007 159 7.5 13.6 27.8 17.3 14.6 27.6 10.6 0.2 0.1 6.7 14.3 0.47 0.33
27/08/2007 161 6.3 13.3 28.8 20.3 12.6 28.7 18.0 0.3 0.1 2.3 12.3 0.45 0.41
28/08/2007 162 5.8 13.6 28.4 21.0 12.1 28.2 16.7 0.2 0.2 4.2 11.9 0.43 0.40
29/08/2007 163 8.1 13.6 28.3 19.7 12.3 28.2 11.4 0.2 0.1 8.3 12.1 0.36 0.40
30/08/2007 164 8.1 13.5 29.2 19.8 13.0 28.9 9.8 0.5 0.2 10.0 12.4 0.39 0.41
31/08/2007 165 8.5 13.5 29.2 20.7 13.0 29.1 11.2 0.3 0.0 9.5 12.7 0.34 0.40
02/09/2007 167 7.4 13.3 29.6 22.0 12.4 29.6 18.3 0.7 0.0 3.7 11.7 0.35 0.44
03/09/2007 168 7.9 13.1 29.2 21.9 13.8 29.2 15.1 1.2 0.0 6.8 12.6 0.31 0.40
04/09/2007 169 7.8 13.2 28.9 21.1 12.0 28.9 14.9 0.8 0.0 6.2 11.2 0.34 0.43
05/09/2007 170 7.8 13.1 29.4 21.9 10.9 29.3 19.2 0.0 0.0 2.7 10.9 0.33 0.48
Appendix 8. Data for Figure 6.6
TSS generation (mg) VSS generation (mg) ISS generation (mg)
Day HRT 7
HRT 13.5
HRT 18
HRT 7
HRT 13.5
HRT 18
HRT 7 HRT 13.5
HRT 18
0 0.0
0.0 0.0
0.0 0.0
0.0
30/03/2007 11 N.A
N.A
N.A
25/04/2007 37 1384.8
1391.1 249.3
278.2 1135.5
1112.9
09/05/2007 51 645.7
1419.6 297.0
333.6 348.7
1086.0
29/05/2007 71 712.6
1049.2 407.2
312.7 305.4
736.5
14/06/2007 87 528.6
967.6 389.0
388.0 139.6
579.6
03/07/2007 106 617.0 824.5
393.0 387.5
224.0 437.0
23/07/2007 126 892.9 631.4
523.2 353.6
369.7 277.8
08/08/2007 142 670.9 661.6
387.2 345.2
283.7 316.3
21/08/2007 155 574.0 686.1
342.1 330.7
231.9 355.4

185 | P a g e
Jong Hyuk Hwang, Ph.D. Thesis
06/09/2007 170 871.2 725.2
407.7 254.5
463.5 470.7
Appendix 9. Data for Figure 6.11
Date Day Feed Reactor SDNR Date Day Feed Reactor SDNR
11/11/2008 1 15/01/2009 66 6.5 6.0 0.85
12/11/2008 2 16/01/2009 67 6.3 0.84
13/11/2008 3 5.8 0.0 17/01/2009 68 0.88
14/11/2008 4 6.6 0.1 18/01/2009 69 6.2 0.86
15/11/2008 5 5.6 0.1 0.73 19/01/2009 70 7.1 5.4 0.81
16/11/2008 6 4.9 0.3 0.62 20/01/2009 71 5.5 1.06
17/11/2008 7 6.5 0.5 0.57 21/01/2009 72 6.0 3.7 0.95
18/11/2008 8 6.3 0.2 0.55 22/01/2009 73 6.7 4.8 0.99
19/11/2008 9 5.6 0.1 0.53 23/01/2009 74 0.82
20/11/2008 10 6.6 0.2 0.63 24/01/2009 75 0.87
21/11/2008 11 6.9 0.2 0.70 25/01/2009 76 0.96
22/11/2008 12 6.5 0.2 0.76 26/01/2009 77 0.90
23/11/2008 13 6.2 0.5 0.66 27/01/2009 78 5.4 0.89
24/11/2008 14 0.65 28/01/2009 79 1.4 0.0
25/11/2008 15 7.4 0.58 80 0.7 0.0 0.63
26/11/2008 16 5.6 0.4 0.63 30/01/2009 81 0.1 0.0 0.70
27/11/2008 17 6.9 0.4 0.57 31/01/2009 82 0.7 0.0 0.78
28/11/2008 18 4.8 0.6 0.69 01/02/2009 83 1.02
29/11/2008 19 5.0 0.9 0.70 02/02/2009 84 0.0 0.0 0.75
30/11/2008 20 0.69 04/02/2009 86 1.02
01/12/2008 21 0.68 05/02/2009 87 0.80
02/12/2008 22 0.62 07/02/2009 89 0.84
03/12/2008 23 0.62 08/02/2009 90 0.3 0.0 0.78
04/12/2008 24 0.64 09/02/2009 91 0.82
05/12/2008 25 0.73 10/02/2009 92 0.74
06/12/2008 26 0.75 11/02/2009 93 0.4 0.0 0.79
07/12/2008 27 0.64 12/02/2009 94 0.88
08/12/2008 28 0.85 13/02/2009 95 0.87
09/12/2008 29 0.90 15/02/2009 97 0.88
10/12/2008 30 0.70 16/02/2009 98 0.87
11/12/2008 31 0.81 17/02/2009 99 0.86
12/12/2008 32 0.82 18/02/2009 100 0.92
13/12/2008 33 0.89 19/02/2009 101 0.94
14/12/2008 34 8.6 0.4 0.81 20/02/2009 102 0.94
15/12/2008 35 0.77 21/02/2009 103 1.6 0.0 0.92
17/12/2008 37 0.88 22/02/2009 104 1.1 0.3 0.86
18/12/2008 38 0.90 23/02/2009 105 0.85
23/12/2008 43 5.6 1.0 0.79 24/02/2009 106 5.3 0.6 0.79
25/12/2008 45 8.4 0.9 0.80 25/02/2009 107 6.4 1.2 0.88
27/12/2008 47 6.0 4.4 0.76 26/02/2009 108 0.87
28/12/2008 48 5.2 5.7 0.73 27/02/2009 109 0.90
29/12/2008 49 5.6 5.2 0.65 01/03/2009 111 0.83
30/12/2008 50 6.5 5.6 0.62 02/03/2009 112 0.80
31/12/2008 51 5.6 6.0 0.52 03/03/2009 113 0.95
01/01/2009 52 6.5 4.9 0.74 04/03/2009 114 7.8 0.8 0.92
02/01/2009 53 0.82 05/03/2009 115 0.90

186 | P a g e
Jong Hyuk Hwang, Ph.D. Thesis
03/01/2009 54 0.85 06/03/2009 116 0.88
04/01/2009 55 0.88 07/03/2009 117 0.6 0.87
05/01/2009 56 0.98 08/03/2009 118 0.87
06/01/2009 57 0.90 09/03/2009 119 0.8 0.81
07/01/2009 58 0.88 10/03/2009 120 4.6 1.4 0.89
08/01/2009 59 0.94 11/03/2009 121 0.84
09/01/2009 60 0.96 12/03/2009 122 0.92
10/01/2009 61 5.8 5.4 0.98 13/03/2009 123 2.2 0.81
11/01/2009 62 0.87 14/03/2009 124 1.3 0.87
12/01/2009 63 0.90 15/03/2009 125 3.1 0.76
13/01/2009 64 5.3 5.2 0.94 16/03/2009 126 0.65
14/01/2009 65 5.9 0.94
Appendix 10. Data for Figure 6.12
Date Day HRT Temp.
TIN (mg/L) SDNR (g N/m2d) Date Day HRT Temp.
TIN (mg/L) SDNR (g N/m2d) INF EFF INF EFF
03/04/2009 1 3.6 31.2 17.0 1.00 04/05/2009 32 3.5 22.0 33.3 18.5 1.07
04/04/2009 2 3.6 23.0 31.2 16.4 1.03 05/05/2009 33 3.6 22.0 30.2 16.8 0.95
05/04/2009 3 3.9 25.0 30.3 11.9 1.18 06/05/2009 34 3.9 22.0 31.6 16.3 0.99
06/04/2009 4 3.7 21.5 30.7 15.0 1.06 07/05/2009 35 3.8 27.0 31.0 14.7 1.09
07/04/2009 5 3.7 22.5 30.9 17.1 0.94 08/05/2009 36 3.8 28.5 31.3 14.0 1.14
08/04/2009 6 3.7 22.5 31.6 17.3 0.98 09/05/2009 37 3.8 28.5 30.9 14.0 1.12
09/04/2009 7 3.8 13.0 32.0 20.6 0.77 10/05/2009 38 3.8 28.0 30.8 14.2 1.10
10/04/2009 8 3.8 14.0 32.1 20.8 0.75 11/05/2009 39 3.9 28.0 31.6 15.6 1.05
11/04/2009 9 3.8 13.0 31.9 20.5 0.76 12/05/2009 40 3.9 28.5 32.4 15.6 1.09
12/04/2009 10 3.9 12.0 30.9 20.1 0.71 13/05/2009 41 3.9 28.5 31.8 15.3 1.07
13/04/2009 11 3.8 13.0 30.7 20.0 0.71 14/05/2009 42 3.8 28.0 32.7 17.1 1.05
14/04/2009 12 3.8 13.0 31.0 20.2 0.73 15/05/2009 43 3.7 34.5 31.7 15.8 1.09
15/04/2009 13 3.8 13.0 30.4 19.5 0.73 16/05/2009 44 3.7 34.0 32.3 16.1 1.10
16/04/2009 14 3.9 8.0 31.2 25.2 0.39 17/05/2009 45 3.7 34.0 32.5 16.1 1.11
17/04/2009 15 3.6 9.0 31.4 26.4 0.35 18/05/2009 46 3.8 33.5 32.9 17.3 1.05
18/04/2009 16 3.6 8.0 32.1 27.2 0.35 19/05/2009 47 3.8 35.0 33.0 15.8 1.14
19/04/2009 17 3.6 8.5 30.4 26.2 0.30 20/05/2009 48 3.7 34.5 32.5 16.4 1.09
20/04/2009 18 3.6 8.0 30.4 26.7 0.26 21/05/2009 49 3.7 34.0 32.0 15.5 1.11
21/04/2009 19 3.6 8.0 31.6 27.5 0.29 22/05/2009 50 3.9 29.0 33.1 15.3 1.16
22/04/2009 20 3.6 8.0 31.6 27.8 0.27 23/05/2009 51 3.8 28.0 32.8 16.3 1.10
23/04/2009 21 3.4 13.0 30.4 20.2 0.74 24/05/2009 52 3.8 28.5 32.6 16.6 1.06
24/04/2009 22 3.5 13.5 30.7 20.5 0.74 25/05/2009 53 3.9 28.0 32.7 16.0 1.09
25/04/2009 23 3.5 13.0 31.7 21.2 0.77 26/05/2009 54 3.8 28.5 32.3 15.3 1.12
26/04/2009 24 3.5 13.0 30.4 20.6 0.71 27/05/2009 55 3.9 28.0 31.8 15.5 1.07
27/04/2009 25 3.4 13.0 29.1 19.8 0.68 28/05/2009 56 3.9 28.5 32.1 15.3 1.10
28/04/2009 26 3.6 13.0 31.6 21.0 0.76 29/05/2009 57 3.8 23.0 32.7 16.4 1.08
29/04/2009 27 3.4 12.5 31.2 20.7 0.77 30/05/2009 58 3.9 23.0 34.7 17.9 1.08
30/04/2009 28 3.4 21.0 31.7 17.1 1.10 31/05/2009 59 3.9 23.0 32.5 16.3 1.06
01/05/2009 29 3.3 21.0 32.8 19.0 1.04 01/06/2009 60 3.9 23.0 32.4 16.8 1.02
02/05/2009 30 3.2 22.0 32.1 18.0 1.10 02/06/2009 61 3.9 23.0 31.8 16.3 1.02
03/05/2009 31 3.4 22.0 33.4 19.3 1.05 03/06/2009 62 3.9 23.0 31.8 15.8 1.05

187 | P a g e
Jong Hyuk Hwang, Ph.D. Thesis
Appendix 11. Data for Figure 7.2
Day Inf
Nitrification reactor effluent
Final effluent SNR Day Inf
Nitrification reactor effluent
Final effluent SNR
09/07/2008 1 32.1 3.7 0.3 1.81 08/11/2008 122 3.6 0.9 1.77
10/07/2008 2 6.9 0.5 1.89 09/11/2008 123 32.8 5.8 1.4 1.96
11/07/2008 3 31.6 3.3 0.2 1.83 10/11/2008 124 31.5 4.6 1.3 1.94
12/07/2008 4 31.6 2.9 0.3 1.84 11/11/2008 125 29.0 3.8 0.4 1.81
13/07/2008 5 29.7 2.8 0.2 1.72 12/11/2008 126 33.3 5.4 1.1 2.02
14/07/2008 6 33.6 3.3 0.2 1.96 13/11/2008 127 30.8 4.2 1.5 1.97
15/07/2008 7 31.4 3.7 0.1 1.79 14/11/2008 128 2.8 0.6 1.65
16/07/2008 8 34.9 4.7 0.3 1.97 15/11/2008 129 7.6 0.9 2.04
17/07/2008 9 33.3 3.6 0.1 1.92 16/11/2008 130 30.6 3.4 0.5 1.88
18/07/2008 10 4.0 0.2 2.02 17/11/2008 131 3.1 0.3 1.74
19/07/2008 11 31.5 3.5 0.2 1.82 18/11/2008 132 33.2 3.9 0.3 2.06
20/07/2008 12 4.6 0.4 2.00 20/11/2008 133 31.0 2.9 0.2 1.98
21/07/2008 13 31.9 3.5 0.3 1.85 21/11/2008 134 28.1 3.7 1.2 1.69
22/07/2008 14 32.4 3.9 0.7 1.86 22/11/2008 135 33.0 2.8 0.4 2.12
23/07/2008 15 33.4 3.4 0.2 1.93 23/11/2008 136 32.6 3.3 0.0 2.09
24/07/2008 16 33.9 3.9 0.4 1.95 24/11/2008 137 30.4 3.1 0.6 1.93
25/07/2008 17 31.8 3.3 0.0 1.83 25/11/2008 138 31.9 3.1 1.1 2.08
26/07/2008 18 32.9 3.9 0.7 1.81 26/11/2008 139 31.4 3.1 0.9 1.97
27/07/2008 21 3.8 0.6 2.08 27/11/2008 140 28.1 2.7 0.8 1.79
28/07/2008 22 35.0 5.2 1.2 1.86 28/11/2008 141 32.1 3.0 0.9 2.06
29/07/2008 23 33.2 4.5 0.8 1.78 29/11/2008 142 31.4 3.2 0.6 1.96
01/08/2008 24 34.0 4.3 0.8 1.85 30/11/2008 143 2.5 0.7 1.58
02/08/2008 25 32.2 4.0 0.5 1.73 01/12/2008 144 32.8 3.5 1.4 2.06
03/08/2008 26 31.9 3.9 0.4 1.72 02/12/2008 145 30.6 2.9 1.0 1.91
04/08/2008 28 30.9 3.3 0.6 1.74 03/12/2008 146 28.4 2.8 0.4 1.77
05/08/2008 29 34.3 4.4 0.7 1.84 04/12/2008 147 33.0 3.2 1.1 2.14
06/08/2008 30 32.7 4.0 1.0 1.85 05/12/2008 148 28.8 3.4 1.3 1.75
08/08/2008 31 32.8 4.3 0.9 1.85 06/12/2008 149 2.5 0.6 1.68
09/08/2008 32 28.5 2.7 0.5 1.70 07/12/2008 150 29.3 3.4 0.2 1.86
10/08/2008 33 31.5 3.1 1.0 1.75 08/12/2008 151 30.4 3.3 0.4 1.94
11/08/2008 34 30.5 2.7 0.8 1.90 09/12/2008 152 33.7 3.4 0.1 2.12
12/08/2008 35 32.9 2.9 0.6 1.96 10/12/2008 153 2.8 0.5 1.65
13/08/2008 36 31.8 3.4 0.3 1.84 11/12/2008 154 32.9 3.3 0.0 2.07
14/08/2008 37 33.6 3.7 0.6 1.97 12/12/2008 155 30.0 2.5 0.2 1.93
15/08/2008 38 31.9 2.6 1.6 1.92 13/12/2008 156 2.7 0.3 1.70
16/08/2008 39 34.1 3.8 0.6 1.95 14/12/2008 157 4.6 0.8 2.16
17/08/2008 40 33.9 4.7 0.8 1.94 15/12/2008 159 34.6 4.6 0.8 2.11
18/08/2008 41 30.7 3.0 0.0 1.76 16/12/2008 160 32.0 3.4 0.0 2.00
19/08/2008 42 32.5 4.0 2.1 1.83 17/12/2008 161 29.5 2.1 0.0 1.94
20/08/2008 43 31.8 3.7 1.4 1.80 18/12/2008 162 5.6 1.2 1.83
21/08/2008 44 28.6 3.6 2.2 1.61 19/12/2008 169 32.1 6.0 1.0 1.74
22/08/2008 45 32.9 4.4 0.7 1.86 20/12/2008 170 28.6 5.0 0.5 1.83
23/08/2008 46 32.6 4.0 0.4 1.86 27/12/2008 171 33.1 5.5 0.7 1.90
24/08/2008 47 29.3 3.7 0.2 1.65 28/12/2008 172 31.1 4.9 0.8 1.93
25/08/2008 48 32.6 4.8 1.2 1.81 29/12/2008 173 4.3 0.4 1.62
26/08/2008 49 31.1 4.5 0.7 1.73 30/12/2008 174 32.9 5.1 0.6 2.05

188 | P a g e
Jong Hyuk Hwang, Ph.D. Thesis
27/08/2008 50 29.2 3.7 0.6 1.62 31/12/2008 175 30.6 4.5 0.2 1.94
28/08/2008 51 32.3 4.4 1.7 1.79 01/01/2009 176 4.2 0.4 1.66
29/08/2008 52 31.1 3.6 0.3 1.80 02/01/2009 177 31.1 4.5 0.3 1.98
30/08/2008 53 29.3 3.6 0.2 1.67 03/01/2009 178 29.5 4.0 0.1 1.88
31/08/2008 54 33.9 4.4 0.0 1.91 04/01/2009 179 3.6 0.2 1.63
01/09/2008 55 33.3 5.6 1.1 1.82 05/01/2009 180 29.2 2.7 0.0 1.94
02/09/2008 56 31.4 4.5 0.3 1.72 06/01/2009 181 28.1 2.3 0.9 1.91
03/09/2008 57 33.1 4.0 1.0 1.88 07/01/2009 182 1.3 0.0 1.92
04/09/2008 58 32.2 4.3 0.1 1.81 08/01/2009 183 30.8 4.1 0.1 1.96
05/09/2008 59 29.5 3.0 0.1 1.72 09/01/2009 184 30.2 3.8 0.6 1.95
06/09/2008 60 33.9 4.5 0.4 1.90 10/01/2009 185 2.7 1.71
07/09/2008 61 32.5 3.9 0.0 1.85 11/01/2009 186 30.2 2.9 2.00
08/09/2008 62 30.4 3.7 0.2 1.72 12/01/2009 187 28.1 2.7 1.88
09/09/2008 63 33.2 4.8 0.3 1.83 13/01/2009 188 28.4 3.5 0.3 1.82
10/09/2008 64 31.4 4.6 0.8 1.75 14/01/2009 189 34.0 5.1 0.7 2.14
11/09/2008 65 4.3 1.7 1.54 15/01/2009 190 32.2 3.9 0.4 2.07
12/09/2008 66 32.8 5.2 2.1 1.82 16/01/2009 191 29.8 3.5 0.4 1.92
13/09/2008 67 31.6 4.1 0.3 1.79 17/01/2009 192 34.1 4.6 0.4 2.16
14/09/2008 68 28.6 3.5 0.2 1.61 18/01/2009 193 33.4 4.3 0.4 2.13
15/09/2008 69 32.8 4.7 0.4 1.80 19/01/2009 194 28.9 3.7 0.0 1.88
16/09/2008 70 31.8 4.1 0.3 1.77 20/01/2009 195 32.2 4.9 0.3 2.01
17/09/2008 71 30.2 4.4 0.4 1.63 21/01/2009 196 32.5 6.7 0.2 1.90
18/09/2008 72 32.5 4.3 0.3 1.82 22/01/2009 197 28.4 4.2 0.7 1.75
19/09/2008 73 31.6 4.1 0.5 1.76 23/01/2009 198 32.5 4.5 0.4 2.07
20/09/2008 74 30.1 3.3 0.3 1.75 24/01/2009 199 29.9 4.1 0.1 1.90
21/09/2008 75 33.6 3.7 0.3 2.00 25/01/2009 200 3.4 0.2 1.75
22/09/2008 77 1.9 0.1 1.79 26/01/2009 201 31.0 3.7 1.99
23/09/2008 78 31.8 3.2 0.3 1.86 27/01/2009 202 32.2 5.1 0.5 2.02
26/09/2008 79 30.8 2.5 0.3 1.79 28/01/2009 203 3.6 0.2 1.73
27/09/2008 80 2.6 0.2 1.64 29/01/2009 204 34.5 4.4 0.4 2.20
28/09/2008 81 32.0 4.8 1.3 1.78 30/01/2009 205 32.9 3.1 0.3 2.24
29/09/2008 82 30.5 3.8 1.0 1.64 31/01/2009 206 29.9 3.6 0.2 1.86
30/09/2008 83 3.3 0.6 1.58 01/02/2009 207 33.4 4.3 0.2 2.14
01/10/2008 84 32.0 4.4 0.4 1.81 02/02/2009 208 32.7 4.4 0.2 2.06
02/10/2008 85 30.5 5.7 1.2 1.51 03/02/2009 209 30.2 4.0 0.3 1.92
03/10/2008 86 5.4 1.5 1.61 04/02/2009 210 33.9 4.6 0.3 2.14
04/10/2008 87 30.6 6.8 2.8 1.78 05/02/2009 211 33.8 5.1 0.1 2.12
05/10/2008 89 3.4 0.9 1.77 06/02/2009 212 32.5 3.8 0.2 2.10
06/10/2008 90 31.8 5.6 0.9 1.95 07/02/2009 213 29.8 3.2 0.1 1.94
08/10/2008 91 29.8 4.7 1.0 1.83 08/02/2009 214 32.5 4.5 0.0 2.08
09/10/2008 92 3.7 0.1 1.72 09/02/2009 215 30.4 4.0 0.0 1.95
10/10/2008 93 32.0 5.0 0.6 2.02 10/02/2009 216 28.3 3.4 0.0 1.82
11/10/2008 94 30.3 4.6 0.4 1.90 11/02/2009 217 29.7 3.9 0.0 1.92
12/10/2008 95 3.9 0.5 1.74 12/02/2009 218 30.7 3.8 0.0 1.97
13/10/2008 96 34.0 5.2 0.6 2.12 13/02/2009 220 31.6 3.0 0.3 2.10
14/10/2008 97 31.1 4.3 0.0 2.00 14/02/2009 222 3.5 0.0 1.73
15/10/2008 98 3.7 0.5 1.70 16/02/2009 223 33.0 4.7 1.1 2.19
16/10/2008 99 33.2 4.2 0.4 2.07 17/02/2009 224 30.7 3.7 0.9 2.05
17/10/2008 104 33.1 5.1 1.6 2.01 18/02/2009 225 29.2 5.2 4.5 1.90
18/10/2008 105 33.1 4.4 2.1 2.06 19/02/2009 226 31.5 4.6 3.5 2.01
23/10/2008 106 29.8 4.2 1.9 1.83 20/02/2009 227 30.2 4.5 3.5 1.94
24/10/2008 107 2.5 0.7 1.48 21/02/2009 228 28.6 4.9 0.7 1.79
25/10/2008 108 29.8 3.3 0.5 1.88 22/02/2009 229 32.3 5.8 0.4 2.02

189 | P a g e
Jong Hyuk Hwang, Ph.D. Thesis
26/10/2008 109 30.3 4.0 1.0 1.88 23/02/2009 230 30.7 4.8 3.8 1.99
27/10/2008 110 32.0 5.0 1.5 2.21 24/02/2009 231 28.1 4.5 3.8 1.78
28/10/2008 111 31.8 4.7 2.7 2.23 25/02/2009 233 30.8 4.5 0.1 1.99
29/10/2008 112 30.0 5.0 3.9 2.06 26/02/2009 234 2.8 0.0 2.03
30/10/2008 114 32.2 5.6 0.8 1.95 27/02/2009 235 30.5 3.6 0.0 2.05
31/10/2008 115 30.9 5.1 0.6 1.88 01/03/2009 236 29.8 3.7 0.0 1.99
02/11/2008 116 4.7 3.1 1.52 02/03/2009 237 28.2 3.8 0.0 1.89
03/11/2008 117 34.9 8.1 5.6 1.92 03/03/2009 238 31.1 4.0 0.1 2.07
04/11/2008 118 31.5 5.7 2.3 1.87 04/03/2009 239 28.9 3.5 0.0 1.95
05/11/2008 119 3.7 0.7 1.60 05/03/2009 240 2.6 0.0 1.81
06/11/2008 120 31.7 4.3 1.0 1.99 06/03/2009 241 30.5 3.2 0.0 2.09
07/11/2008 121 31.2 4.6 1.5 1.95
Appendix 12. Data for Figure 7.3
Time (d) NH4-N NOx-N Estimated NOx-N
0.0 21.8 11.6 10.9
0.1 21.2 11.9 11.2
0.3 20.9 12.1 11.7
1.0 19.4 14.4 14.4
1.0 18.9 14.5 14.8
1.1 18.5 15.1 15.3
1.2 18.0 15.6 15.8
1.3 18.0 15.8 16.2
1.3 17.3 16.3 16.5
1.5 15.9 17.8 17.9
2.0 10.1 23.4 23.1
2.0 9.2 24.3 23.6
2.1 7.9 25.4 25.3
2.2 6.2 26.9 27.0
2.3 5.2 27.9 28.1

190 | P a g e
Jong Hyuk Hwang, Ph.D. Thesis
Appendix 13. Data for Figure 7.4
Day Influent Final
effluent SDNR Day Influent Final
effluent SDNR
09/07/2008 1 33.1 9.4 1.51 08/11/2008 122 28.4 3.5 1.84
10/07/2008 2 35.8 8.9 1.74 09/11/2008 123 31.6 3.7 1.96
11/07/2008 3 31.6 8.5 1.50 10/11/2008 124 29.9 3.2 1.93
12/07/2008 4 29.8 9.1 1.32 11/11/2008 125 29.6 4.1 1.81
13/07/2008 5 29.1 8.0 1.35 12/11/2008 126 31.2 8.2 1.67
14/07/2008 6 31.3 8.8 1.45 13/11/2008 127 30.6 7.7 1.64
15/07/2008 7 28.7 7.6 1.36 14/11/2008 128 28.7 6.6 1.65
16/07/2008 8 34.0 10.4 1.54 15/11/2008 129 35.7 7.8 1.73
17/07/2008 9 32.6 9.0 1.52 16/11/2008 130 31.6 6.3 1.80
18/07/2008 10 33.2 9.9 1.51 17/11/2008 131 29.9 7.2 1.65
19/07/2008 11 31.6 9.2 1.45 18/11/2008 132 33.7 7.0 1.91
20/07/2008 12 34.3 12.3 1.44 20/11/2008 133 32.5 7.0 1.90
21/07/2008 13 32.7 10.4 1.45 21/11/2008 134 29.7 8.0 1.85
22/07/2008 14 32.7 6.3 1.72 22/11/2008 135 32.9 7.5 1.75
23/07/2008 15 33.7 5.9 1.79 23/11/2008 136 32.9 8.0 1.75
24/07/2008 16 33.7 7.4 1.72 24/11/2008 137 31.6 7.4 1.68
25/07/2008 17 32.2 8.4 1.52 25/11/2008 138 31.6 10.7 1.54
26/07/2008 18 31.6 9.9 1.35 26/11/2008 139 31.9 10.5 1.48
27/07/2008 21 30.8 9.9 1.34 27/11/2008 140 30.6 6.1 1.74
28/07/2008 22 34.1 9.2 1.54 28/11/2008 141 32.0 3.9 2.05
29/07/2008 23 32.9 10.4 1.39 29/11/2008 142 32.3 3.8 2.07
01/08/2008 24 33.5 12.4 1.31 30/11/2008 143 30.2 1.3 1.82
02/08/2008 25 32.7 17.0 0.96 01/12/2008 144 32.3 3.2 2.08
03/08/2008 26 34.6 9.2 1.57 02/12/2008 145 31.5 3.6 1.95
04/08/2008 28 34.0 10.8 1.47 03/12/2008 146 30.9 2.9 1.95
05/08/2008 29 33.2 8.5 1.52 04/12/2008 147 31.5 5.6 1.90
06/08/2008 30 31.3 6.4 1.53 05/12/2008 148 30.8 5.3 1.75
08/08/2008 31 30.3 10.0 1.25 06/12/2008 149 29.7 7.3 1.69
09/08/2008 32 28.1 6.5 1.36 07/12/2008 150 33.1 10.2 1.74
10/08/2008 33 30.1 9.6 1.20 08/12/2008 151 31.9 9.7 1.66
11/08/2008 34 29.7 9.1 1.34 09/12/2008 152 31.3 10.5 1.46
12/08/2008 35 32.2 8.4 1.48 10/12/2008 153 29.6 8.2 1.58
13/08/2008 36 31.9 6.9 1.54 11/12/2008 154 31.1 1.70
14/08/2008 37 33.3 8.4 1.56 12/12/2008 155 30.0 6.3 1.65
15/08/2008 38 30.6 7.7 1.43 13/12/2008 156 28.9 7.4 1.51
16/08/2008 39 33.4 7.7 1.58 14/12/2008 157 33.9 8.8 1.76
17/08/2008 40 33.4 7.1 1.65 15/12/2008 159 33.9 8.8 1.76
18/08/2008 41 31.2 8.4 1.38 16/12/2008 160 32.0 7.3 1.61
19/08/2008 42 31.4 6.2 1.46 17/12/2008 161 29.9 7.7 1.53
20/08/2008 43 30.4 5.8 1.42 18/12/2008 162 35.2 12.0 1.70
21/08/2008 44 27.4 6.9 1.19 19/12/2008 169 30.0 2.7 1.47
22/08/2008 45 33.5 7.3 1.46 20/12/2008 170 27.1 2.3 1.75
23/08/2008 46 33.4 6.2 1.51 27/12/2008 171 27.8 1.9 1.88
24/08/2008 47 31.0 5.6 1.43 28/12/2008 172 29.7 1.6 2.02
25/08/2008 48 32.6 4.4 1.59 29/12/2008 173 29.4 1.5 1.95
26/08/2008 49 32.4 3.1 1.68 30/12/2008 174 30.8 6.8 1.70
27/08/2008 50 29.5 3.2 1.47 31/12/2008 175 30.3 1.8 2.06
28/08/2008 51 29.8 2.2 1.60 01/01/2009 176 29.5 1.4 1.97
29/08/2008 52 30.4 3.2 1.62 02/01/2009 177 30.6 2.0 2.03

191 | P a g e
Jong Hyuk Hwang, Ph.D. Thesis
30/08/2008 53 29.2 7.1 1.25 03/01/2009 178 29.7 0.9 2.02
31/08/2008 54 35.2 6.3 1.65 04/01/2009 179 29.0 0.9 1.94
01/09/2008 55 34.0 2.8 1.75 05/01/2009 180 29.2 0.9 2.04
02/09/2008 56 32.7 2.8 1.67 06/01/2009 181 27.9 0.5 1.99
03/09/2008 57 32.4 2.2 1.78 07/01/2009 182 27.2 0.5 1.95
04/09/2008 58 34.1 3.9 1.67 08/01/2009 183 31.3 4.9 1.81
05/09/2008 59 30.6 2.9 1.62 09/01/2009 184 29.8 0.6 2.01
06/09/2008 60 35.3 4.4 1.74 10/01/2009 185 28.6 0.4 2.02
07/09/2008 61 35.0 4.0 1.73 11/01/2009 186 29.2 1.1 2.02
08/09/2008 62 33.1 3.1 1.68 12/01/2009 187 28.5 1.9 1.94
09/09/2008 63 34.6 2.8 1.79 13/01/2009 188 31.2 0.4 2.21
10/09/2008 64 30.2 9.1 1.15 14/01/2009 189 33.7 1.8 2.33
11/09/2008 65 27.7 7.5 1.14 15/01/2009 190 32.8 4.2 2.07
12/09/2008 66 29.7 13.2 0.87 16/01/2009 191 31.9 3.9 2.02
13/09/2008 67 31.8 6.6 1.39 17/01/2009 192 34.5 4.8 2.09
14/09/2008 68 30.3 4.9 1.40 18/01/2009 193 34.0 6.0 1.91
15/09/2008 69 33.0 3.7 1.59 19/01/2009 194 32.1 5.9 1.89
16/09/2008 70 32.2 5.9 1.41 20/01/2009 195 32.4 1.7 2.12
17/09/2008 71 31.2 3.6 1.45 21/01/2009 196 33.5 3.0 1.92
18/09/2008 72 32.2 4.8 1.48 22/01/2009 197 30.6 2.3 1.92
19/09/2008 73 30.2 4.6 1.49 23/01/2009 198 32.5 4.1 1.96
20/09/2008 74 31.3 4.1 1.59 24/01/2009 199 31.1 2.8 2.02
21/09/2008 75 33.7 4.2 1.88 25/01/2009 200 30.0 1.9 1.95
22/09/2008 77 29.7 3.3 1.71 26/01/2009 201 31.7 2.4 2.07
23/09/2008 78 30.9 2.2 1.71 27/01/2009 202 33.0 1.8 2.14
26/09/2008 79 29.2 1.5 1.70 28/01/2009 203 30.0 2.1 2.00
27/09/2008 80 28.2 1.6 1.67 29/01/2009 204 34.6 1.1 2.44
28/09/2008 81 29.5 2.7 1.61 30/01/2009 205 34.0 0.9 2.43
29/09/2008 82 28.4 2.6 1.50 31/01/2009 206 33.0 1.3 2.18
30/09/2008 83 28.3 2.0 1.60 01/02/2009 207 33.7 1.1 2.36
01/10/2008 84 31.0 2.8 1.77 02/02/2009 208 33.6 1.1 2.26
02/10/2008 85 29.9 2.1 1.61 03/02/2009 209 32.7 1.0 2.24
03/10/2008 86 28.3 2.7 1.84 04/02/2009 210 34.1 0.6 2.41
04/10/2008 87 28.4 2.1 1.88 05/02/2009 211 34.0 0.7 2.38
05/10/2008 89 29.2 2.3 1.93 06/02/2009 212 32.2 0.4 2.31
06/10/2008 90 31.4 2.2 1.98 07/02/2009 213 31.8 1.1 2.18
08/10/2008 91 29.2 2.2 1.89 08/02/2009 214 34.3 2.5 2.42
09/10/2008 92 30.4 1.7 2.04 09/02/2009 215 34.2 2.7 2.25
10/10/2008 93 32.3 4.1 1.99 10/02/2009 216 30.3 0.4 2.08
11/10/2008 94 31.4 3.6 1.93 11/02/2009 217 32.0 2.2 2.23
12/10/2008 95 29.8 3.2 1.87 12/02/2009 218 32.2 0.1 2.25
13/10/2008 96 33.2 5.4 1.89 13/02/2009 220 31.8 0.4 2.26
14/10/2008 97 33.3 6.3 1.85 14/02/2009 222 30.3 2.1 2.01
15/10/2008 98 31.3 7.0 1.89 16/02/2009 223 31.0 8.1 1.68
16/10/2008 99 32.1 5.1 1.93 17/02/2009 224 30.3 2.6 2.06
17/10/2008 104 28.9 4.0 1.72 18/02/2009 225 27.5 4.6 1.99
18/10/2008 105 30.5 4.0 1.82 19/02/2009 226 28.7 1.7 2.29
23/10/2008 106 29.3 3.4 1.74 20/02/2009 227 28.2 8.1 1.77
24/10/2008 107 28.5 2.4 1.71 21/02/2009 228 30.8 5.8 1.77
25/10/2008 108 31.0 1.7 1.96 22/02/2009 229 32.3 1.6 2.26
26/10/2008 109 30.8 2.6 1.93 23/02/2009 230 28.2 1.6 2.05
27/10/2008 110 30.9 2.3 2.22 24/02/2009 231 27.8 1.3 1.98
28/10/2008 111 29.2 2.9 2.12 25/02/2009 233 31.3 4.6 1.95

192 | P a g e
Jong Hyuk Hwang, Ph.D. Thesis
29/10/2008 112 27.3 1.8 2.05 26/02/2009 234 29.5 3.7 2.03
30/10/2008 114 31.6 1.9 2.13 27/02/2009 235 30.7 6.7 1.80
31/10/2008 115 30.6 1.0 2.10 01/03/2009 236 30.5 5.7 1.86
02/11/2008 116 27.3 0.4 1.93 02/03/2009 237 30.4 3.6 2.02
03/11/2008 117 29.5 3.1 1.69 03/03/2009 238 31.2 3.4 2.21
04/11/2008 118 30.6 0.9 2.04 04/03/2009 239 30.2 1.4 2.17
05/11/2008 119 28.8 0.3 2.05 05/03/2009 240 28.9 2.9 1.99
06/11/2008 120 30.9 2.1 2.00 06/03/2009 241 30.9 4.6 1.99
07/11/2008 121 29.4 2.0 1.95
Appendix 14. Data for Figure 7.7
Date Day TSS VSS Date Day TSS VSS
15/07/2008 4 3.3 2.8 25/11/2008 137
22/07/2008 11 1.5 1.4 26/11/2008 138
29/07/2008 18 1.0 0.8 27/11/2008 139
05/08/2008 25 2.4 2.0 28/11/2008 140
13/08/2008 33 1.5 1.3 29/11/2008 141
19/08/2008 39 1.9 1.5 30/11/2008 142
01/09/2008 52 1.3 1.2 01/12/2008 143
02/09/2008 53 2.6 2.3 02/12/2008 144
03/09/2008 54 3.3 3.0 03/12/2008 145 15.1 12.7
04/09/2008 55 4.2 3.8 04/12/2008 146
05/09/2008 56 2.2 1.9 05/12/2008 147
06/09/2008 57 2.5 2.3 06/12/2008 148
07/09/2008 58 1.8 1.7 07/12/2008 149 8.4 6.9
08/09/2008 59 1.9 1.8 08/12/2008 150
09/09/2008 60 8.3 7.5 09/12/2008 151
10/09/2008 61 3.1 2.8 10/12/2008 152 5.4 4.9
11/09/2008 62 1.1 0.8 11/12/2008 153
12/09/2008 63 0.9 0.7 12/12/2008 154
13/09/2008 64 2.8 2.5 13/12/2008 155
14/09/2008 65 5.0 4.4 14/12/2008 156 14.8 11.1
15/09/2008 66 2.2 1.9 15/12/2008 157
16/09/2008 67 1.8 1.6 16/12/2008 158
17/09/2008 68 1.3 1.1 17/12/2008 159 7.2 6.8
18/09/2008 69 2.1 2.0 18/12/2008 160
19/09/2008 70 1.8 1.7 19/12/2008 161
20/09/2008 71 17.1 15.0 20/12/2008 162 11.5 9.8
21/09/2008 72 15.2 14.2 27/12/2008 169
22/09/2008 73 12.2 11.4 28/12/2008 170
23/09/2008 74 6.2 6.0 29/12/2008 171
24/09/2008 75 6.3 5.7 30/12/2008 172
26/09/2008 77 9.0 7.6 31/12/2008 173
27/09/2008 78 25.2 21.8 01/01/2009 174 26.7 22.3
28/09/2008 79 15.8 14.2 02/01/2009 175
29/09/2008 80 10.4 9.6 03/01/2009 176
30/09/2008 81 13.2 11.8 04/01/2009 177
01/10/2008 82 8.0 7.2 05/01/2009 178 18.3 15.6
02/10/2008 83 5.8 5.4 06/01/2009 179
03/10/2008 84 8.2 7.4 07/01/2009 180

193 | P a g e
Jong Hyuk Hwang, Ph.D. Thesis
04/10/2008 85 15.2 14.0 08/01/2009 181
05/10/2008 86 5.8 5.4 09/01/2009 182
06/10/2008 87 7.3 6.7 10/01/2009 183
08/10/2008 89 10.6 10.2 11/01/2009 184 16.5 12.1
09/10/2008 90 13.8 9.4 12/01/2009 185
10/10/2008 91 6.5 5.7 13/01/2009 186
11/10/2008 92 18.4 16.0 14/01/2009 187
12/10/2008 93 6.0 5.0 15/01/2009 188
13/10/2008 94 7.7 6.0 16/01/2009 189 20.5 15.4
14/10/2008 95 4.4 3.4 17/01/2009 190
15/10/2008 96 4.0 3.7 18/01/2009 191 12.2 10.9
16/10/2008 97 18.4 17.1 19/01/2009 192
17/10/2008 98 8.7 8.0 20/01/2009 193
18/10/2008 99 25.4 23.1 21/01/2009 194 21.4 18.6
23/10/2008 104 7.7 7.0 22/01/2009 195
24/10/2008 105 11.6 11.0 23/01/2009 196
25/10/2008 106 18.3 17.2 24/01/2009 197 13.5 10.2
26/10/2008 107 12.5 11.6 25/01/2009 198
27/10/2008 108 17.5 15.1 26/01/2009 199
28/10/2008 109 6.7 5.7 27/01/2009 200 25.4 20.0
29/10/2008 110 6.0 5.7 28/01/2009 201
30/10/2008 111 12.3 11.7 29/01/2009 202
31/10/2008 112 11.7 11.0 30/01/2009 203
02/11/2008 114 6.6 6.0 31/01/2009 204
03/11/2008 115 12.3 11.7 01/02/2009 205 17.3 14.8
04/11/2008 116 9.3 8.7 02/02/2009 206
05/11/2008 117 18.4 16.2 03/02/2009 207 13.9 12.5
06/11/2008 118 15.7 14.0 04/02/2009 208
07/11/2008 119 7.7 6.3 05/02/2009 209
08/11/2008 120 06/02/2009 210 17.1 13.1
09/11/2008 121 07/02/2009 211
10/11/2008 122 4.5 4.2 08/02/2009 212
11/11/2008 123 09/02/2009 213 21.2 18.6
12/11/2008 124 21.3 18.3 10/02/2009 214
13/11/2008 125 11.0 9.8 11/02/2009 215
14/11/2008 126 11.6 10.4 12/02/2009 216 10.4 8.2
15/11/2008 127 13/02/2009 217
16/11/2008 128 14/02/2009 218
17/11/2008 129 10.2 9.4 16/02/2009 220
18/11/2008 130 6.4 5.4 18/02/2009 222
19/11/2008 131 3.4 3.0 19/02/2009 223 18.6 16.8
20/11/2008 132 22.8 20.4 20/02/2009 224
21/11/2008 133 10.4 9.0 21/02/2009 225
22/11/2008 134 22/02/2009 226
23/11/2008 135 23/02/2009 227
24/11/2008 136 18.6 16.0

194 | P a g e
Jong Hyuk Hwang, Ph.D. Thesis
Appendix 15. Data for Figure 7.8
Date Day
Nitrification in
nitrification reactor
Nitrification in
denitrification reactor
Denitrification in
denitrification reactor Date Day
Nitrification in
nitrification reactor
Nitrification in
denitrification reactor
Denitrification in
denitrification reactor
12/07/2008 1 44.1 5.2 52.9 14/11/2008 126 49.2 3.8 56.8
13/07/2008 2 45.9 10.1 61.0 15/11/2008 127 47.8 2.1 55.7
14/07/2008 3 44.5 4.9 52.5 16/11/2008 128 40.2 2.1 55.9
15/07/2008 4 44.7 4.0 46.3 17/11/2008 129 49.6 2.1 58.8
16/07/2008 5 41.8 4.0 47.1 18/11/2008 130 47.5 2.6 61.0
17/07/2008 6 47.6 4.9 50.7 19/11/2008 131 43.9 1.6 56.1
18/07/2008 7 43.5 5.6 47.7 20/11/2008 132 52.0 1.4 64.7
19/07/2008 8 47.8 7.0 53.8 21/11/2008 133 49.9 1.4 64.5
20/07/2008 9 46.7 5.5 53.3 22/11/2008 134 42.7 2.1 58.8
21/07/2008 10 49.0 6.0 52.9 23/11/2008 135 53.4 1.6 64.9
22/07/2008 11 44.2 5.1 50.9 24/11/2008 136 52.7 1.9 62.7
23/07/2008 12 48.6 6.7 50.3 25/11/2008 137 48.6 1.6 58.8
24/07/2008 13 45.0 5.1 50.8 26/11/2008 138 52.3 1.2 53.8
25/07/2008 14 45.3 5.0 60.1 27/11/2008 139 49.6 1.4 51.7
26/07/2008 15 46.9 5.0 62.7 28/11/2008 140 45.1 1.9 60.7
27/07/2008 16 47.5 5.4 60.0 29/11/2008 141 52.0 2.3 71.7
28/07/2008 17 44.5 5.1 53.3 30/11/2008 142 49.4 4.2 72.2
29/07/2008 18 43.9 5.0 47.3 01/12/2008 143 39.8 2.0 63.8
01/08/2008 21 50.6 5.0 47.0 02/12/2008 144 51.9 2.8 72.8
02/08/2008 22 45.1 6.0 54.0 03/12/2008 145 48.2 1.9 68.2
03/08/2008 23 43.2 5.5 48.6 04/12/2008 146 44.7 2.2 68.2
04/08/2008 24 45.0 5.3 45.9 05/12/2008 147 54.0 1.9 66.6
05/08/2008 25 42.2 5.3 42.3 06/12/2008 148 44.2 1.7 61.3
06/08/2008 26 41.9 5.1 54.9 07/12/2008 149 42.2 2.6 59.0
08/08/2008 28 42.4 4.2 51.2 08/12/2008 150 46.8 4.1 60.9
09/08/2008 29 44.7 5.5 53.2 09/12/2008 151 48.8 2.8 58.0
10/08/2008 30 42.8 4.5 53.3 10/12/2008 152 53.4 2.2 51.0
11/08/2008 31 42.7 5.1 43.8 11/12/2008 153 41.6 4.7 55.4
12/08/2008 32 39.4 3.4 47.4 13/12/2008 155 48.6 2.6 57.7
13/08/2008 33 40.5 2.9 41.8 14/12/2008 156 42.7 2.5 52.7
14/08/2008 34 44.0 3.1 46.7 15/12/2008 157 54.5 3.4 61.6
15/08/2008 35 45.3 3.5 51.6 17/12/2008 159 53.1 3.4 61.4
16/08/2008 36 42.6 4.7 54.0 18/12/2008 160 50.4 1.1 56.2
17/08/2008 37 45.7 4.7 54.4 19/12/2008 161 48.9 0.9 53.6
18/08/2008 38 44.4 1.6 50.0 20/12/2008 162 61.3 5.3 59.3
19/08/2008 39 45.2 4.7 55.1 27/12/2008 169 44.9 3.7 44.4
20/08/2008 40 44.9 6.0 57.8 28/12/2008 170 36.5 3.6 61.1
21/08/2008 41 40.7 4.4 48.2 29/12/2008 171 47.9 3.7 68.4
22/08/2008 42 42.4 0.8 50.9 30/12/2008 172 48.7 4.5 73.7
23/08/2008 43 41.6 1.4 49.7 31/12/2008 173 40.8 4.2 71.1
24/08/2008 44 37.4 0.5 41.7 01/01/2009 174 51.7 5.8 62.4
25/08/2008 45 43.0 1.7 51.2 02/01/2009 175 48.8 5.0 75.2
26/08/2008 46 43.1 1.1 52.7 03/01/2009 176 41.9 3.3 71.7
27/08/2008 47 38.1 2.2 49.9 04/01/2009 177 50.0 5.0 74.0
28/08/2008 48 42.0 1.5 55.6 05/01/2009 178 47.4 4.8 73.7
29/08/2008 49 40.1 2.3 58.6 06/01/2009 179 41.0 2.9 70.7
30/08/2008 50 37.5 1.6 51.4 07/01/2009 180 49.0 2.6 74.4
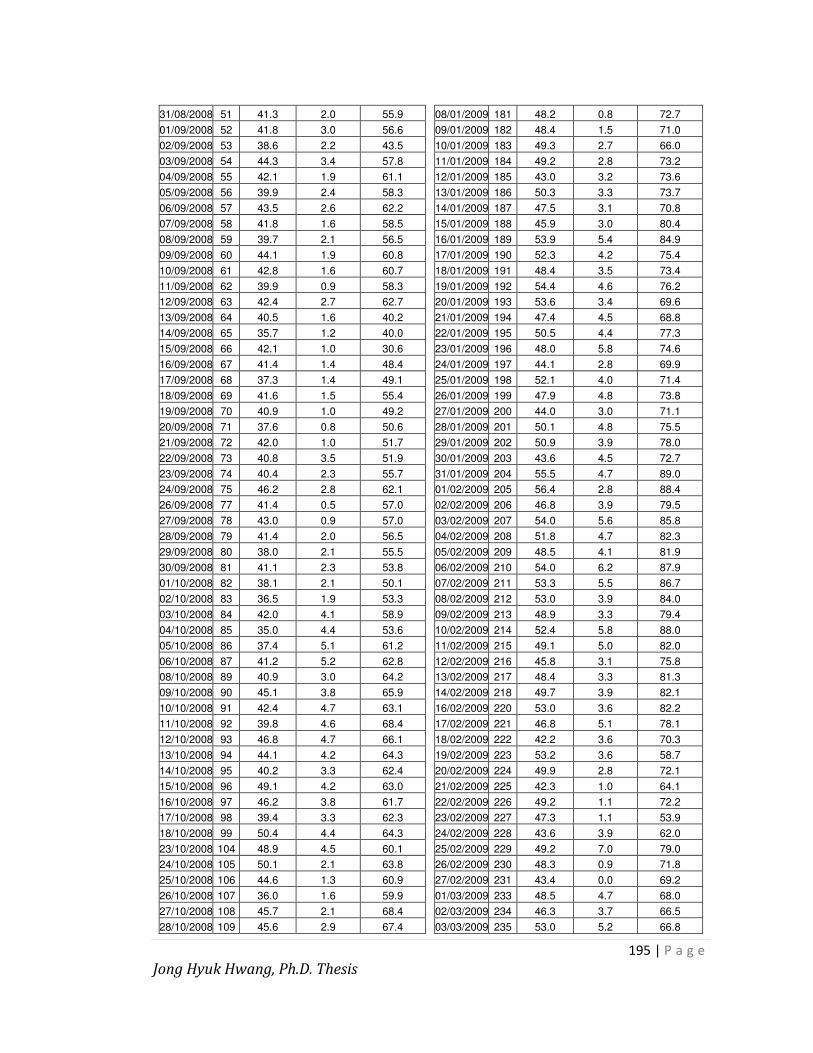
195 | P a g e
Jong Hyuk Hwang, Ph.D. Thesis
31/08/2008 51 41.3 2.0 55.9 08/01/2009 181 48.2 0.8 72.7
01/09/2008 52 41.8 3.0 56.6 09/01/2009 182 48.4 1.5 71.0
02/09/2008 53 38.6 2.2 43.5 10/01/2009 183 49.3 2.7 66.0
03/09/2008 54 44.3 3.4 57.8 11/01/2009 184 49.2 2.8 73.2
04/09/2008 55 42.1 1.9 61.1 12/01/2009 185 43.0 3.2 73.6
05/09/2008 56 39.9 2.4 58.3 13/01/2009 186 50.3 3.3 73.7
06/09/2008 57 43.5 2.6 62.2 14/01/2009 187 47.5 3.1 70.8
07/09/2008 58 41.8 1.6 58.5 15/01/2009 188 45.9 3.0 80.4
08/09/2008 59 39.7 2.1 56.5 16/01/2009 189 53.9 5.4 84.9
09/09/2008 60 44.1 1.9 60.8 17/01/2009 190 52.3 4.2 75.4
10/09/2008 61 42.8 1.6 60.7 18/01/2009 191 48.4 3.5 73.4
11/09/2008 62 39.9 0.9 58.3 19/01/2009 192 54.4 4.6 76.2
12/09/2008 63 42.4 2.7 62.7 20/01/2009 193 53.6 3.4 69.6
13/09/2008 64 40.5 1.6 40.2 21/01/2009 194 47.4 4.5 68.8
14/09/2008 65 35.7 1.2 40.0 22/01/2009 195 50.5 4.4 77.3
15/09/2008 66 42.1 1.0 30.6 23/01/2009 196 48.0 5.8 74.6
16/09/2008 67 41.4 1.4 48.4 24/01/2009 197 44.1 2.8 69.9
17/09/2008 68 37.3 1.4 49.1 25/01/2009 198 52.1 4.0 71.4
18/09/2008 69 41.6 1.5 55.4 26/01/2009 199 47.9 4.8 73.8
19/09/2008 70 40.9 1.0 49.2 27/01/2009 200 44.0 3.0 71.1
20/09/2008 71 37.6 0.8 50.6 28/01/2009 201 50.1 4.8 75.5
21/09/2008 72 42.0 1.0 51.7 29/01/2009 202 50.9 3.9 78.0
22/09/2008 73 40.8 3.5 51.9 30/01/2009 203 43.6 4.5 72.7
23/09/2008 74 40.4 2.3 55.7 31/01/2009 204 55.5 4.7 89.0
24/09/2008 75 46.2 2.8 62.1 01/02/2009 205 56.4 2.8 88.4
26/09/2008 77 41.4 0.5 57.0 02/02/2009 206 46.8 3.9 79.5
27/09/2008 78 43.0 0.9 57.0 03/02/2009 207 54.0 5.6 85.8
28/09/2008 79 41.4 2.0 56.5 04/02/2009 208 51.8 4.7 82.3
29/09/2008 80 38.0 2.1 55.5 05/02/2009 209 48.5 4.1 81.9
30/09/2008 81 41.1 2.3 53.8 06/02/2009 210 54.0 6.2 87.9
01/10/2008 82 38.1 2.1 50.1 07/02/2009 211 53.3 5.5 86.7
02/10/2008 83 36.5 1.9 53.3 08/02/2009 212 53.0 3.9 84.0
03/10/2008 84 42.0 4.1 58.9 09/02/2009 213 48.9 3.3 79.4
04/10/2008 85 35.0 4.4 53.6 10/02/2009 214 52.4 5.8 88.0
05/10/2008 86 37.4 5.1 61.2 11/02/2009 215 49.1 5.0 82.0
06/10/2008 87 41.2 5.2 62.8 12/02/2009 216 45.8 3.1 75.8
08/10/2008 89 40.9 3.0 64.2 13/02/2009 217 48.4 3.3 81.3
09/10/2008 90 45.1 3.8 65.9 14/02/2009 218 49.7 3.9 82.1
10/10/2008 91 42.4 4.7 63.1 16/02/2009 220 53.0 3.6 82.2
11/10/2008 92 39.8 4.6 68.4 17/02/2009 221 46.8 5.1 78.1
12/10/2008 93 46.8 4.7 66.1 18/02/2009 222 42.2 3.6 70.3
13/10/2008 94 44.1 4.2 64.3 19/02/2009 223 53.2 3.6 58.7
14/10/2008 95 40.2 3.3 62.4 20/02/2009 224 49.9 2.8 72.1
15/10/2008 96 49.1 4.2 63.0 21/02/2009 225 42.3 1.0 64.1
16/10/2008 97 46.2 3.8 61.7 22/02/2009 226 49.2 1.1 72.2
17/10/2008 98 39.4 3.3 62.3 23/02/2009 227 47.3 1.1 53.9
18/10/2008 99 50.4 4.4 64.3 24/02/2009 228 43.6 3.9 62.0
23/10/2008 104 48.9 4.5 60.1 25/02/2009 229 49.2 7.0 79.0
24/10/2008 105 50.1 2.1 63.8 26/02/2009 230 48.3 0.9 71.8
25/10/2008 106 44.6 1.3 60.9 27/02/2009 231 43.4 0.0 69.2
26/10/2008 107 36.0 1.6 59.9 01/03/2009 233 48.5 4.7 68.0
27/10/2008 108 45.7 2.1 68.4 02/03/2009 234 46.3 3.7 66.5
28/10/2008 109 45.6 2.9 67.4 03/03/2009 235 53.0 5.2 66.8

196 | P a g e
Jong Hyuk Hwang, Ph.D. Thesis
29/10/2008 110 53.8 4.7 77.8 04/03/2009 236 48.6 5.4 65.2
30/10/2008 111 54.1 2.9 74.2 05/03/2009 237 45.3 4.2 69.7
31/10/2008 112 50.0 3.7 71.8 06/03/2009 238 50.8 6.8 78.0
02/11/2008 114 47.5 6.0 74.6 07/03/2009 239 47.3 4.9 76.0
03/11/2008 115 45.8 5.1 73.4 08/03/2009 240 43.9 4.0 69.7
04/11/2008 116 37.0 4.7 67.6 09/03/2009 241 50.9 4.5 69.5
05/11/2008 117 46.7 1.4 59.1 10/03/2009 242 49.2 4.1 75.2
06/11/2008 118 45.4 3.0 71.4 11/03/2009 243 44.9 3.0 64.3
07/11/2008 119 39.0 3.2 71.7 12/03/2009 244 52.9 4.9 74.6
08/11/2008 120 48.3 2.2 69.9 13/03/2009 245 48.3 3.6 73.1
09/11/2008 121 47.5 3.2 68.2 14/03/2009 246 42.0 6.4 67.4
10/11/2008 122 43.0 2.4 62.6 15/03/2009 247 51.3 4.4 76.3
11/11/2008 123 47.6 2.5 66.4 16/03/2009 248 49.0 3.7 78.9
12/11/2008 124 47.2 3.3 65.5 17/03/2009 249 40.0 2.0 57.7
13/11/2008 125 44.1 2.8 61.4
Appendix 16. Data for Figure 7.9
Date Day
Theoretical biomass
generation discharged
biomass Date Day
Theoretical biomass
generation discharged
biomass
12/07/2008 1 102.1 14/11/2008 126 109.9 114.7
13/07/2008 2 117.1 15/11/2008 127 105.6
14/07/2008 3 101.9 16/11/2008 128 98.2
15/07/2008 4 95.1 27.1 17/11/2008 129 110.5 104.6
16/07/2008 5 92.9 18/11/2008 130 111.0 58.8
17/07/2008 6 103.2 19/11/2008 131 101.5 33.2
18/07/2008 7 96.8 20/11/2008 132 118.1 226.5
19/07/2008 8 108.6 21/11/2008 133 115.8 99.9
20/07/2008 9 105.6 22/11/2008 134 103.6
21/07/2008 10 108.0 23/11/2008 135 119.9
22/07/2008 11 100.2 13.9 24/11/2008 136 117.3 179.7
23/07/2008 12 105.5 25/11/2008 137 109.0
24/07/2008 13 101.0 26/11/2008 138 107.4
25/07/2008 14 110.4 27/11/2008 139 102.7
26/07/2008 15 114.5 28/11/2008 140 107.7
27/07/2008 16 113.0 29/11/2008 141 126.0
28/07/2008 17 102.9 30/11/2008 142 125.7
29/07/2008 18 96.2 7.8 01/12/2008 143 105.5
01/08/2008 21 102.6 02/12/2008 144 127.5
02/08/2008 22 105.1 03/12/2008 145 118.4 138.1
03/08/2008 23 97.3 04/12/2008 146 115.1
04/08/2008 24 96.2 05/12/2008 147 122.4
05/08/2008 25 89.7 18.9 06/12/2008 148 107.2
06/08/2008 26 101.9 07/12/2008 149 103.8 75.4
08/08/2008 28 97.8 08/12/2008 150 111.9
09/08/2008 29 103.4 09/12/2008 151 109.6
10/08/2008 30 100.5 10/12/2008 152 106.5 53.8
11/08/2008 31 91.6 11/12/2008 153 101.7
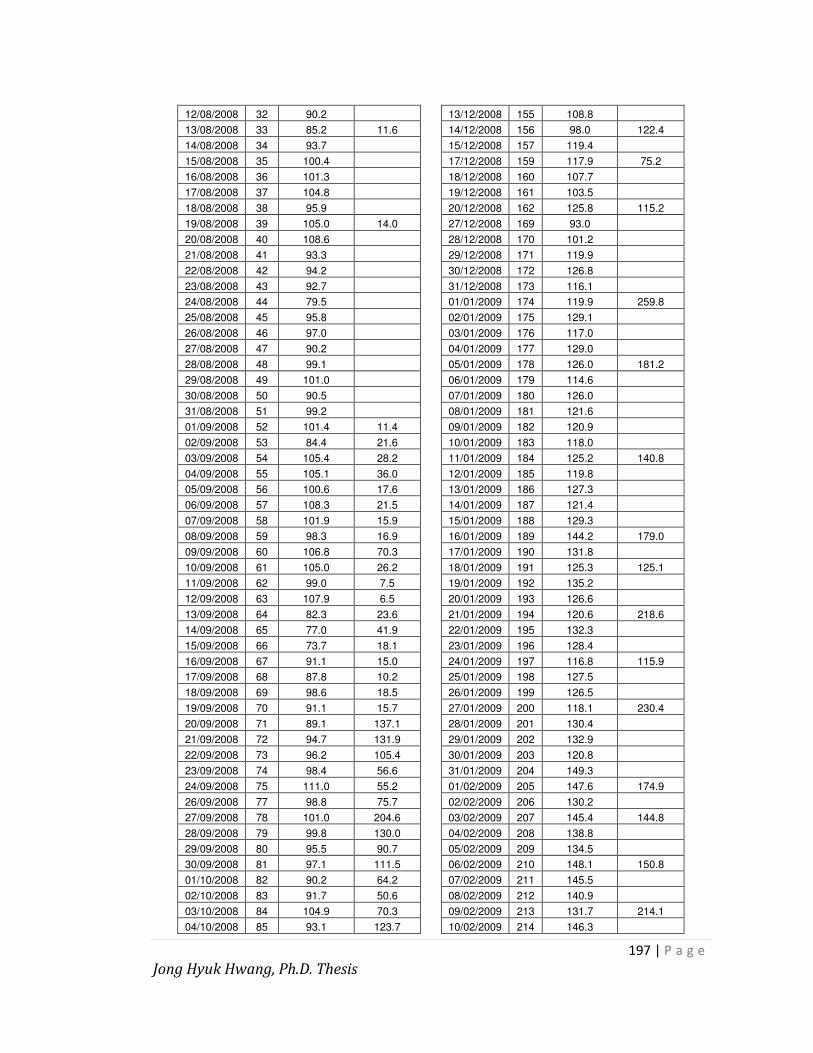
197 | P a g e
Jong Hyuk Hwang, Ph.D. Thesis
12/08/2008 32 90.2 13/12/2008 155 108.8
13/08/2008 33 85.2 11.6 14/12/2008 156 98.0 122.4
14/08/2008 34 93.7 15/12/2008 157 119.4
15/08/2008 35 100.4 17/12/2008 159 117.9 75.2
16/08/2008 36 101.3 18/12/2008 160 107.7
17/08/2008 37 104.8 19/12/2008 161 103.5
18/08/2008 38 95.9 20/12/2008 162 125.8 115.2
19/08/2008 39 105.0 14.0 27/12/2008 169 93.0
20/08/2008 40 108.6 28/12/2008 170 101.2
21/08/2008 41 93.3 29/12/2008 171 119.9
22/08/2008 42 94.2 30/12/2008 172 126.8
23/08/2008 43 92.7 31/12/2008 173 116.1
24/08/2008 44 79.5 01/01/2009 174 119.9 259.8
25/08/2008 45 95.8 02/01/2009 175 129.1
26/08/2008 46 97.0 03/01/2009 176 117.0
27/08/2008 47 90.2 04/01/2009 177 129.0
28/08/2008 48 99.1 05/01/2009 178 126.0 181.2
29/08/2008 49 101.0 06/01/2009 179 114.6
30/08/2008 50 90.5 07/01/2009 180 126.0
31/08/2008 51 99.2 08/01/2009 181 121.6
01/09/2008 52 101.4 11.4 09/01/2009 182 120.9
02/09/2008 53 84.4 21.6 10/01/2009 183 118.0
03/09/2008 54 105.4 28.2 11/01/2009 184 125.2 140.8
04/09/2008 55 105.1 36.0 12/01/2009 185 119.8
05/09/2008 56 100.6 17.6 13/01/2009 186 127.3
06/09/2008 57 108.3 21.5 14/01/2009 187 121.4
07/09/2008 58 101.9 15.9 15/01/2009 188 129.3
08/09/2008 59 98.3 16.9 16/01/2009 189 144.2 179.0
09/09/2008 60 106.8 70.3 17/01/2009 190 131.8
10/09/2008 61 105.0 26.2 18/01/2009 191 125.3 125.1
11/09/2008 62 99.0 7.5 19/01/2009 192 135.2
12/09/2008 63 107.9 6.5 20/01/2009 193 126.6
13/09/2008 64 82.3 23.6 21/01/2009 194 120.6 218.6
14/09/2008 65 77.0 41.9 22/01/2009 195 132.3
15/09/2008 66 73.7 18.1 23/01/2009 196 128.4
16/09/2008 67 91.1 15.0 24/01/2009 197 116.8 115.9
17/09/2008 68 87.8 10.2 25/01/2009 198 127.5
18/09/2008 69 98.6 18.5 26/01/2009 199 126.5
19/09/2008 70 91.1 15.7 27/01/2009 200 118.1 230.4
20/09/2008 71 89.1 137.1 28/01/2009 201 130.4
21/09/2008 72 94.7 131.9 29/01/2009 202 132.9
22/09/2008 73 96.2 105.4 30/01/2009 203 120.8
23/09/2008 74 98.4 56.6 31/01/2009 204 149.3
24/09/2008 75 111.0 55.2 01/02/2009 205 147.6 174.9
26/09/2008 77 98.8 75.7 02/02/2009 206 130.2
27/09/2008 78 101.0 204.6 03/02/2009 207 145.4 144.8
28/09/2008 79 99.8 130.0 04/02/2009 208 138.8
29/09/2008 80 95.5 90.7 05/02/2009 209 134.5
30/09/2008 81 97.1 111.5 06/02/2009 210 148.1 150.8
01/10/2008 82 90.2 64.2 07/02/2009 211 145.5
02/10/2008 83 91.7 50.6 08/02/2009 212 140.9
03/10/2008 84 104.9 70.3 09/02/2009 213 131.7 214.1
04/10/2008 85 93.1 123.7 10/02/2009 214 146.3

198 | P a g e
Jong Hyuk Hwang, Ph.D. Thesis
05/10/2008 86 103.8 58.0 11/02/2009 215 136.1
06/10/2008 87 109.1 72.1 12/02/2009 216 124.7 94.1
08/10/2008 89 108.1 108.9 13/02/2009 217 133.0
09/10/2008 90 114.9 101.0 14/02/2009 218 135.7
10/10/2008 91 110.2 60.7 16/02/2009 220 138.9
11/10/2008 92 112.8 171.4 17/02/2009 221 130.0
12/10/2008 93 117.7 54.3 18/02/2009 222 116.1
13/10/2008 94 112.6 64.3 19/02/2009 223 115.5 197.5
14/10/2008 95 105.8 36.7 20/02/2009 224 124.7
15/10/2008 96 116.2 39.6 21/02/2009 225 107.4
16/10/2008 97 111.7 183.9 22/02/2009 226 122.4
17/10/2008 98 105.0 86.6 23/02/2009 227 102.3
18/10/2008 99 119.1 250.7 24/02/2009 228 109.6
23/10/2008 104 113.4 76.4 25/02/2009 229 135.3
24/10/2008 105 116.0 120.2 26/02/2009 230 121.0
25/10/2008 106 106.8 187.2 27/02/2009 231 112.6
26/10/2008 107 97.5 119.2 01/03/2009 233 121.1
27/10/2008 108 116.3 162.8 02/03/2009 234 116.5
28/10/2008 109 115.8 61.2 03/03/2009 235 125.1
29/10/2008 110 136.3 70.4 04/03/2009 236 119.2
30/10/2008 111 131.2 145.8 05/03/2009 237 119.1
31/10/2008 112 125.6 137.9 06/03/2009 238 135.6
02/11/2008 114 128.0 66.8 07/03/2009 239 128.2
03/11/2008 115 124.2 129.2 08/03/2009 240 117.6
04/11/2008 116 109.3 93.5 09/03/2009 241 124.9
05/11/2008 117 107.3 176.7 10/03/2009 242 128.5
06/11/2008 118 119.8 153.7 11/03/2009 243 112.2
07/11/2008 119 113.8 69.3 12/03/2009 244 132.4
08/11/2008 120 120.4 13/03/2009 245 125.0
09/11/2008 121 119.0 14/03/2009 246 115.8
10/11/2008 122 108.0 47.6 15/03/2009 247 132.0
11/11/2008 123 116.5 16/03/2009 248 131.6
12/11/2008 124 115.9 201.4 17/03/2009 249 99.7
13/11/2008 125 108.3 107.0

199 | P a g e
Jong Hyuk Hwang, Ph.D. Thesis
Appendix 17. Data for Figure 7.12
Date Day
DO entering the
denitrification reactor
DO inside denitrification
reactor SDNR
Date Day
DO entering the
denitrification reactor
DO inside denitrification
reactor SDNR
28/06/2008 1 16.8
1.46
11/08/2008 45 18.5 1.6 1.25
29/06/2008 2 14.8
1.51
12/08/2008 46 13.1 0.6 1.36
01/07/2008 4 15.5
1.29
13/08/2008 47 16.1 0.8 1.20
02/07/2008 5 14.9
0.86
14/08/2008 48 15.8 1.9 1.34
03/07/2008 6 15.4
1.72
15/08/2008 49 18.2 0.9 1.48
04/07/2008 7 15
1.57
16/08/2008 50 18 0.3 1.54
05/07/2008 8 17.1
1.42
17/08/2008 51 19.3 1.3 1.56
06/07/2008 9
1.39
18/08/2008 52 16.8 0.1 1.43
07/07/2008 10 17.1 1.3 1.46
19/08/2008 53 15.2 0.2 1.58
08/07/2008 11
1.56
20/08/2008 54 15.4 0.4 1.65
09/07/2008 12 14.5 1.5 1.36
21/08/2008 55 14.4 0.1 1.38
10/07/2008 13 19
0.95
22/08/2008 56 0.5
1.46
11/07/2008 14 14.3 1 1.51
23/08/2008 57 2.2 0.2 1.42
12/07/2008 15 16 1.2 1.51
24/08/2008 58 2 0.1 1.19
13/07/2008 16 18.5 1.5 1.74
25/08/2008 59 2.3 0.2 1.46
14/07/2008 17 12.5 1.4 1.50
26/08/2008 60 1.9
1.51
15/07/2008 18 15.4 0.9 1.32
27/08/2008 61 2.9 0.4 1.43
16/07/2008 19 14.5 1.4 1.35
28/08/2008 62 1.3 0.2 1.59
17/07/2008 20 16.4 1.4 1.45
29/08/2008 63 1.4
1.68
18/07/2008 21 16.1 2 1.36
30/08/2008 64 1.1
1.47
19/07/2008 22
1.54
31/08/2008 65 0.3
1.60
20/07/2008 23
1.52
01/09/2008 66 2.5 0.3 1.62
21/07/2008 24
1.51
02/09/2008 67 2.2 0.5 1.25
22/07/2008 25
1.45
03/09/2008 68 2.7 0.4 1.65
23/07/2008 26 14.4 0.8 1.44
04/09/2008 69 1.8
1.75
24/07/2008 27 15.9 1.4 1.45
05/09/2008 70 2.2
1.67
25/07/2008 28 17.2 1 1.72
06/09/2008 71 1.7 0.1 1.78
26/07/2008 29 13.2 0.6 1.79
07/09/2008 72 2.9 0.1 1.67
27/07/2008 30
1.72
08/09/2008 73 0.6
1.62
28/07/2008 31
1.52
09/09/2008 74 1.7
1.74
29/07/2008 32
1.35
10/09/2008 75 1.3 0.1 1.73
01/08/2008 35
1.34
11/09/2008 76 2.8
1.68
02/08/2008 36
1.54
12/09/2008 77 2.3
1.79
03/08/2008 37 13.5 0.8 1.39
13/09/2008 78 2.8 0.1 1.15
04/08/2008 38 17.3 0.8 1.31
14/09/2008 79 0.6
1.14
05/08/2008 39 14.2 0.9 0.96
15/09/2008 80 0.1
0.87
06/08/2008 40 13.1 1.1 1.57
16/09/2008 81 1.1 0.1 1.39
08/08/2008 42 17.2 0.9 1.47
17/09/2008 82 0.7
1.40
09/08/2008 43 17.7 0.6 1.52
18/09/2008 83
1.59
10/08/2008 44 12.2 0.3 1.53

200 | P a g e
Jong Hyuk Hwang, Ph.D. Thesis
Appendix 18. Data for Figure 7.15
Date Day HRT Influent
Nitrification reactor Effluent
Final Effluent Date Day HRT Influent
Nitrification reactor Effluent
Final Effluent
01/03/2009 1 1.0 30.8 4.5 0.1 15/04/2009 46 0.6 33.4 9.1 5.0
02/03/2009 2 1.0 27.8 2.8 0.0 16/04/2009 47 0.6 31.0 7.2 3.6
03/03/2009 3 1.0 30.5 3.6 0.0 17/04/2009 48 0.6 29.9 6.1 2.6
04/03/2009 4 1.0 29.8 3.7 0.0 18/04/2009 49 0.5 32.7 9.1 5.4
05/03/2009 5 1.0 28.2 3.8 0.0 19/04/2009 50 0.5 30.6 6.9 3.8
06/03/2009 6 1.0 31.1 4.0 0.1 20/04/2009 51 0.5 28.9 6.6 2.7
07/03/2009 7 1.0 28.9 3.5 0.0 21/04/2009 52 0.5 31.8 7.0
08/03/2009 8 1.0 26.2 2.6 0.0 22/04/2009 53 0.5 29.9 6.1 0.8
09/03/2009 9 1.0 30.5 3.2 0.0 23/04/2009 54 0.5 27.0 4.4 0.1
10/03/2009 10 1.0 29.1 2.6 0.0 24/04/2009 55 0.5 30.8 5.5 0.5
11/03/2009 11 1.1 26.9 2.0 0.0 25/04/2009 56 0.4 33.1 9.0 3.8
12/03/2009 12 1.0 31.6 3.5 0.0 26/04/2009 57 0.4 31.0 7.7 2.2
13/03/2009 13 1.0 29.6 3.3 0.0 27/04/2009 58 0.4
14/03/2009 14 1.1 26.2 2.6 0.0 28/04/2009 59 0.4 30.6 7.5 3.0
15/03/2009 15 1.0 30.7 3.3 0.0 29/04/2009 60 0.4 29.6 7.0 2.1
16/03/2009 16 1.0 29.1 2.9 0.0 30/04/2009 61 0.4 26.3 5.8 1.7
17/03/2009 17 1.0 01/05/2009 62 0.4 29.2 6.5 1.9
18/03/2009 18 1.0 26.4 2.3 0.0 02/05/2009 63 0.4 26.4 6.0 0.9
19/03/2009 19 0.9 28.6 2.8 0.0 03/05/2009 64 0.4 24.3 5.3 0.0
20/03/2009 20 0.9 27.0 2.2 0.0 04/05/2009 65 0.4 29.3 6.0 0.7
21/03/2009 21 0.9 05/05/2009 66 0.4 28.6 6.2 0.6
22/03/2009 22 0.9 06/05/2009 67 0.4 25.1 7.0 0.0
23/03/2009 23 0.9 07/05/2009 68 0.4 30.7 12.8 8.4
24/03/2009 24 0.9 29.3 5.8 1.4 08/05/2009 69 0.3 27.1 15.5 12.5
25/03/2009 25 0.9 26.6 4.0 0.0 09/05/2009 70 0.3 30.0 12.7 9.7
26/03/2009 26 25.8 8.5 3.5 10/05/2009 71 0.3
27/03/2009 27 0.8 11/05/2009 72 0.3 30.3 9.5 6.2
28/03/2009 28 0.8 32.0 6.1 0.7 12/05/2009 73 0.3 27.5 8.8 3.1
29/03/2009 29 0.8 30.4 5.4 0.0 13/05/2009 74 0.3 29.8 9.1 3.1
30/03/2009 30 0.8 28.1 4.2 0.1 14/05/2009 75 0.3 24.1 7.2 2.1
31/03/2009 31 0.8 32.6 5.5 0.0 15/05/2009 76 0.3 29.1 9.7 3.0
01/04/2009 32 0.8 31.9 6.8 0.4 16/05/2009 77 0.3 26.2 11.6 4.2
02/04/2009 33 0.8 27.3 3.9 0.0 17/05/2009 78 0.3 28.6 12.2 6.4
04/04/2009 35 0.8 30.0 4.8 0.5 18/05/2009 79 0.3 24.9 10.7 4.5
05/04/2009 36 0.8 26.0 4.1 1.0 19/05/2009 80 0.3 29.3 14.4 8.3
06/04/2009 37 0.8 32.5 5.1 2.3 20/05/2009 81 0.3 25.6 11.6 4.6
07/04/2009 38 0.8 29.9 4.8 1.0 21/05/2009 82 0.3 29.6 14.8 7.7
08/04/2009 39 0.8 27.8 3.5 0.5 22/05/2009 83 0.3 27.1 12.1 6.3
09/04/2009 40 0.8 31.3 5.6 1.1 23/05/2009 84 0.3 29.9 13.2 5.5
10/04/2009 41 0.8 30.1 4.3 0.7 24/05/2009 85 0.3 26.5 11.4 5.7
11/04/2009 42 0.8 26.5 4.4 1.5 25/05/2009 86 0.3 30.1 13.5 9.0
12/04/2009 43 0.8 32.4 5.6 2.2 26/05/2009 87 0.3 25.5 10.2 5.2
13/04/2009 44 0.8 31.3 6.1 2.0 27/05/2009 88 0.3 30.4 11.9 6.6
14/04/2009 45 0.8 26.9 5.2 1.9
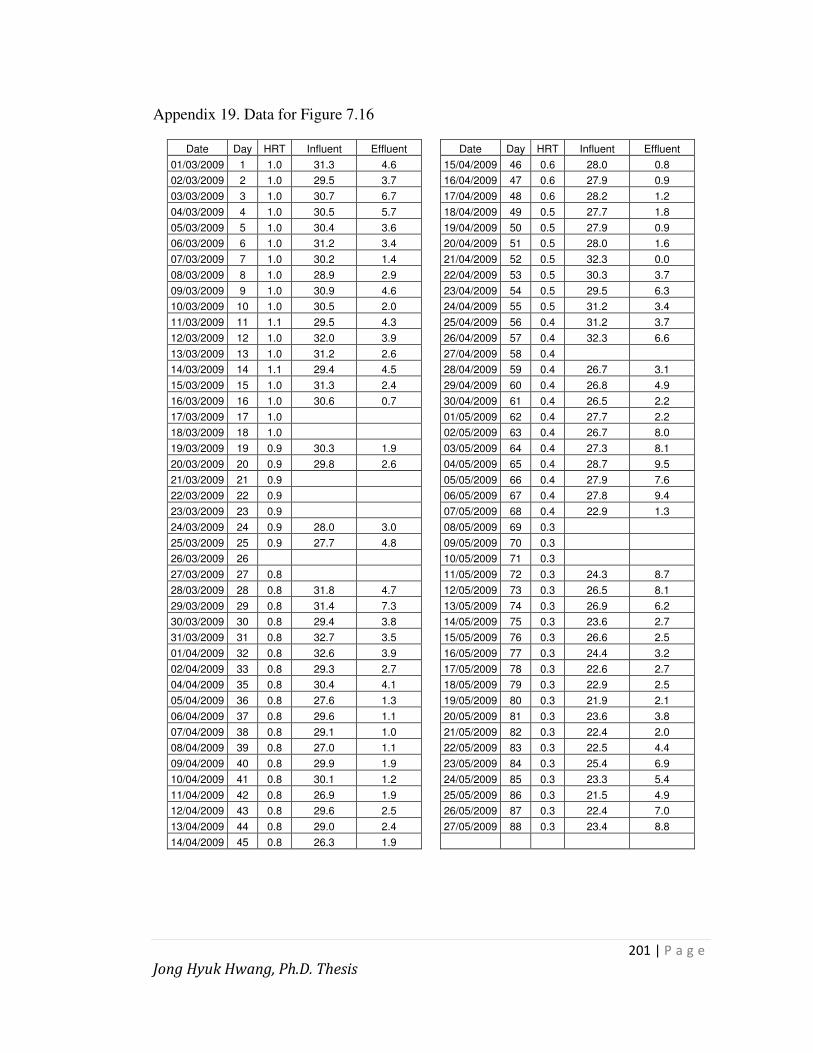
201 | P a g e
Jong Hyuk Hwang, Ph.D. Thesis
Appendix 19. Data for Figure 7.16
Date Day HRT Influent Effluent Date Day HRT Influent Effluent
01/03/2009 1 1.0 31.3 4.6 15/04/2009 46 0.6 28.0 0.8
02/03/2009 2 1.0 29.5 3.7 16/04/2009 47 0.6 27.9 0.9
03/03/2009 3 1.0 30.7 6.7 17/04/2009 48 0.6 28.2 1.2
04/03/2009 4 1.0 30.5 5.7 18/04/2009 49 0.5 27.7 1.8
05/03/2009 5 1.0 30.4 3.6 19/04/2009 50 0.5 27.9 0.9
06/03/2009 6 1.0 31.2 3.4 20/04/2009 51 0.5 28.0 1.6
07/03/2009 7 1.0 30.2 1.4 21/04/2009 52 0.5 32.3 0.0
08/03/2009 8 1.0 28.9 2.9 22/04/2009 53 0.5 30.3 3.7
09/03/2009 9 1.0 30.9 4.6 23/04/2009 54 0.5 29.5 6.3
10/03/2009 10 1.0 30.5 2.0 24/04/2009 55 0.5 31.2 3.4
11/03/2009 11 1.1 29.5 4.3 25/04/2009 56 0.4 31.2 3.7
12/03/2009 12 1.0 32.0 3.9 26/04/2009 57 0.4 32.3 6.6
13/03/2009 13 1.0 31.2 2.6 27/04/2009 58 0.4
14/03/2009 14 1.1 29.4 4.5 28/04/2009 59 0.4 26.7 3.1
15/03/2009 15 1.0 31.3 2.4 29/04/2009 60 0.4 26.8 4.9
16/03/2009 16 1.0 30.6 0.7 30/04/2009 61 0.4 26.5 2.2
17/03/2009 17 1.0 01/05/2009 62 0.4 27.7 2.2
18/03/2009 18 1.0 02/05/2009 63 0.4 26.7 8.0
19/03/2009 19 0.9 30.3 1.9 03/05/2009 64 0.4 27.3 8.1
20/03/2009 20 0.9 29.8 2.6 04/05/2009 65 0.4 28.7 9.5
21/03/2009 21 0.9 05/05/2009 66 0.4 27.9 7.6
22/03/2009 22 0.9 06/05/2009 67 0.4 27.8 9.4
23/03/2009 23 0.9 07/05/2009 68 0.4 22.9 1.3
24/03/2009 24 0.9 28.0 3.0 08/05/2009 69 0.3
25/03/2009 25 0.9 27.7 4.8 09/05/2009 70 0.3
26/03/2009 26 10/05/2009 71 0.3
27/03/2009 27 0.8 11/05/2009 72 0.3 24.3 8.7
28/03/2009 28 0.8 31.8 4.7 12/05/2009 73 0.3 26.5 8.1
29/03/2009 29 0.8 31.4 7.3 13/05/2009 74 0.3 26.9 6.2
30/03/2009 30 0.8 29.4 3.8 14/05/2009 75 0.3 23.6 2.7
31/03/2009 31 0.8 32.7 3.5 15/05/2009 76 0.3 26.6 2.5
01/04/2009 32 0.8 32.6 3.9 16/05/2009 77 0.3 24.4 3.2
02/04/2009 33 0.8 29.3 2.7 17/05/2009 78 0.3 22.6 2.7
04/04/2009 35 0.8 30.4 4.1 18/05/2009 79 0.3 22.9 2.5
05/04/2009 36 0.8 27.6 1.3 19/05/2009 80 0.3 21.9 2.1
06/04/2009 37 0.8 29.6 1.1 20/05/2009 81 0.3 23.6 3.8
07/04/2009 38 0.8 29.1 1.0 21/05/2009 82 0.3 22.4 2.0
08/04/2009 39 0.8 27.0 1.1 22/05/2009 83 0.3 22.5 4.4
09/04/2009 40 0.8 29.9 1.9 23/05/2009 84 0.3 25.4 6.9
10/04/2009 41 0.8 30.1 1.2 24/05/2009 85 0.3 23.3 5.4
11/04/2009 42 0.8 26.9 1.9 25/05/2009 86 0.3 21.5 4.9
12/04/2009 43 0.8 29.6 2.5 26/05/2009 87 0.3 22.4 7.0
13/04/2009 44 0.8 29.0 2.4 27/05/2009 88 0.3 23.4 8.8
14/04/2009 45 0.8 26.3 1.9

202 | P a g e
Jong Hyuk Hwang, Ph.D. Thesis
Appendix 20. Data for Figure 7.17
Loading SNR SDNR
Loading SNR SDNR
Loading SNR SDNR
Loading SNR SDNR
0.96 0.85
2.11 2.03
2.60 2.22
4.25 3.09
1.38 1.10
2.21 1.54
2.61 2.23
4.34 3.35
1.46 1.38
2.22 1.95
2.62 2.28
4.45 3.44
1.47 1.39
2.22 2.03
2.62 2.21
4.54 3.61
1.48 1.30
2.36 1.54
2.62 2.37
4.60 3.99
1.54 1.32
2.36 2.04
2.63 2.55
4.64 3.82
1.65 1.26
2.36 1.78
2.65 2.13
4.65 3.60
1.67 1.43
2.36 2.14
2.67 2.23
4.66 3.64
1.68 1.55
2.36 1.95
2.70 2.28
4.68 4.20
1.69 1.19
2.45 2.08
2.71 2.52
4.70 4.16
1.70 1.39
2.46 2.22
2.71 2.51
4.74 3.74
1.70 1.57
2.46 1.74
2.72 2.50
4.76 4.16
1.71 1.50
2.46 2.26
2.73 2.43
4.80 3.21
1.71 1.51
2.46 1.85
2.74 2.37
4.86 3.79
1.72 1.46
2.46 2.13
2.76 2.68
4.97 3.58
1.72 1.56
2.46 2.02
2.78 2.60
5.01 4.69
1.73 1.36
2.47 2.18
2.79 2.25
5.11 3.99
1.73 1.14
2.47 1.76
2.84 2.49
5.22 3.77
1.74 1.53
2.47 2.05
2.85 2.43
5.24 4.00
1.74 1.47
2.47 2.27
2.87 2.75
5.47 4.13
1.74 1.53
2.47 2.06
2.91 2.48
5.47 4.24
1.75 1.54
2.47 1.76
2.95 2.52
5.53 3.97
1.75 1.59
2.47 2.16
3.02 2.72
5.55 4.87
1.96 1.72
2.48 2.13
3.02 2.88
5.56 4.18
1.96 1.75
2.48 1.97
3.04 2.66
5.74 4.05
1.96 1.72
2.48 2.09
3.06 2.74
5.76 5.30
1.96 1.39
2.49 2.14
3.06 3.00
5.79 4.56
1.96 1.56
2.49 1.80
3.07 2.58
5.80 3.72
1.96 1.68
2.50 2.33
3.09 2.85
5.87 4.12
1.97 1.77
2.50 2.16
3.10 2.66
5.88 4.29
1.97 1.81
2.50 2.19
3.10 2.60
5.93 5.36
1.97 1.77
2.50 1.92
3.11 2.96
6.02 4.79
1.97 1.70
2.51 1.94
3.11 2.56
6.03 5.20
1.97 1.54
2.52 2.13
3.11 2.69
6.28 4.38
1.97 1.48
2.52 2.18
3.11 2.98
6.30 5.01
1.97 1.35
2.53 2.22
3.21 2.46
6.31 4.28
1.98 1.65
2.53 2.21
3.25 2.76
6.32 5.44
1.98 1.34
2.53 2.48
3.26 2.63
6.52 4.89
1.98 1.74
2.54 2.20
3.27 2.68
6.54 4.45
1.98 1.73
2.54 2.45
3.28 2.65
6.55 5.33
1.98 1.81
2.54 2.18
3.33 2.62
6.55 4.39
1.99 1.72
2.55 2.22
3.36 2.83
6.90 4.61
1.99 1.73
2.55 1.97
3.37 2.80
6.90 3.94
1.99 1.78
2.55 2.19
3.38 2.80
7.09 3.88
1.99 1.82
2.55 2.35
3.39 3.11
7.11 4.84
1.99 1.69
2.56 2.08
3.40 2.89
7.15 4.29
1.99 1.73
2.56 2.32
3.46 2.94
7.18 4.13
2.10 1.67
2.56 2.43
3.56 3.42
7.36 4.10
2.11 1.60
2.56 2.51
3.56 3.49
7.42 4.23

203 | P a g e
Jong Hyuk Hwang, Ph.D. Thesis
2.11 1.88
2.57 2.22
3.57 3.37
7.58 4.19
2.11 1.51
2.58 2.24
3.79 3.01
7.82 3.90
2.11 1.84
2.58 2.19
3.95 3.04
8.00 4.59
2.11 1.52
2.59 2.24
4.08 3.41
8.05 4.09
2.11 1.98
2.59 2.02
4.21 4.11
8.38 4.68
2.11 1.89
2.59 2.04
4.22 3.84
8.44 4.66
2.11 1.86
2.60 2.53
4.23 4.12