two-step nucleation mechanism in solid–solid phase · pdf filearticles...
TRANSCRIPT

ARTICLESPUBLISHED ONLINE: 14 SEPTEMBER 2014 | DOI: 10.1038/NMAT4083
Two-step nucleation mechanism in solid–solidphase transitionsYi Peng1, FengWang1, ZirenWang1, AhmedM. Alsayed2, Zexin Zhang3, Arjun G. Yodh4
and Yilong Han1,5*The microscopic kinetics of ubiquitous solid–solid phase transitions remain poorly understood. Here, by using single-particle-resolution video microscopy of colloidal films of diameter-tunable microspheres, we show that transitions between square andtriangular lattices occur via a two-step di�usive nucleation pathway involving liquid nuclei. The nucleation pathway is favouredover the direct one-step nucleation because the energy of the solid/liquid interface is lower than that between solid phases.We also observed that nucleation precursors are particle-swapping loops rather than newly generated structural defects, andthat coherent and incoherent facets of the evolving nuclei exhibit di�erent energies and growth rates that can markedly alterthe nucleation kinetics. Our findings suggest that an intermediate liquid should exist in the nucleation processes of solid–solidtransitions of most metals and alloys, and provide guidance for better control of the kinetics of the transition and for futurerefinements of solid–solid transition theory.
Solid–solid (s–s) transitions between different crystallinestructures are arguably the most numerous of nature’sphase transitions. Among them are common transformations
exhibited by elemental crystals, alloys and minerals1, with broadimplications in earth science2, diamond and steel production3,4,and the synthesis of ceramic materials4. However, despite theirconsiderable technological importance, the microscopic kineticsof s–s transitions remain poorly understood. The mechanismsthat govern s–s phase transitions present substantial challengesfor theory, simulation and experiment. A central question aboutthe nature of s–s transitions, for example, concerns their kineticpathways; in particular, do these pathways follow a diffusionlessmartensitic transformation with particles moving in concert1 ora diffusive nucleation process? So far, s–s transitions in atomicand molecular crystals have mainly been studied by means ofX-ray diffraction5 and electron microscopy6–8—techniques whichrarely reveal the initial stage of the s–s transition and thedynamics at the single-particle level. Nevertheless, in experimentalstudies of graphite–diamond6 and olivine–spinel systems7, diffusivenucleation has been inferred to occur when anisotropic stressesare negligible. Martensitic transformations have been observed insimulations that use small systems9,10, strong superheating11 orexternal anisotropic stresses12. These three conditions are typicallyemployed to speed up sluggish dynamics in simulations, and tend topromote martensitic transformations and suppress the nucleationmechanism6. Consequently, kinetic paths under isotropic stressesremain controversial6. Finally, analytical theories are difficult toformulate and are not definitive because ofmissing group–subgrouprelations between the symmetries of parent and product crystals13.
Stimulated by these open questions and technical difficulties,our experiments sought to observe nucleation processes in the s–stransitions of colloidal crystals with single-particle resolution. Thisclass of model thermodynamic system, composed of micrometre-sized colloidal particles whose thermal motions can be directlyvisualized by video microscopy, has already provided many general
insights about phase transitions14, including the dynamics ofcrystallization15,16, melting17,18, sublimation19, glass formation20 andjamming transitions21. Few such studies, however, have probeds–s transitions, and those that did focused on structure ratherthan kinetics22–25, and the surfaces or grain boundaries of small-sized crystals23,25 and/or external anisotropic fields22 suppressednucleation. In our experiment, the high-quality large crystallinedomains and the local heating technique enable us to studynearly homogeneous nucleation and heterogeneous nucleation at adesired type of defect. We discover a surprising two-step nucleationbehaviour during the transformation between square (�) andtriangular (4) lattices, with an intermediate liquid stage that mightbe expected to occur in crystals with constituents at any length scale,provided that solid–liquid interfacial energies are sufficiently small.Furthermore, the single-particle experimental resolution enabled usto directly identify liquid nucleation precursors, which arise fromparticle-swapping loops rather than from defects, and to study thefacets of evolving nuclei, whose energetics and growth rates exhibitrich phenomenology.
ExperimentTemperature-sensitive poly(N -isopropylacrylamide) (NIPA) mi-crogel colloidal spheres17 were employed to make the volume-fraction-tunable systems needed for these studies. The NIPA sphereeffective diameter, σ , changes linearly from 0.76 µm at 26.4 ◦C to0.67µmat 30.6 ◦C inwater (Supplementary Fig. 1). The spheres haveshort-range repulsive interactions (Supplementary Fig. 1A) andexhibit almost the same phase behaviour as hard spheres17,18. Therefractive index of the NIPA spheres is very close to that of water be-cause watermakes upmore than 90%of themicrogel. Consequently,reasonably clear images of the bulk crystalline layers can be obtainedeven using bright-field microscopy17. They form face-centred cubic(fcc) crystals in three dimensions (3D) and triangular lattices intwo dimensions (2D). To obtain the multiple crystalline phasesneeded to probe the s–s transition, the colloidal spheres were
1Department of Physics, Hong Kong University of Science and Technology, Clear Water Bay, Hong Kong, China, 2Complex Assemblies of Soft Matter(COMPASS), Solvay-CNRS-UPenn UMI 3254, Bristol, Pennsylvania 19007, USA, 3Center for Soft Condensed Matter Physics and InterdisciplinaryResearch, Soochow University, Suzhou 215006, China, 4Department of Physics and Astronomy, University of Pennsylvania, Philadelphia, Pennsylvania19104, USA, 5HKUST Shenzhen Research Institute, Shenzhen 518057, China. *e-mail: [email protected]
NATUREMATERIALS | ADVANCE ONLINE PUBLICATION | www.nature.com/naturematerials 1© 2014 Macmillan Publishers Limited. All rights reserved.

ARTICLES NATUREMATERIALS DOI: 10.1038/NMAT4083
Crystal Liquid
0.02 0.2Lindemann parameter
76 µm
a b c d
e f g
2,100 s 2,400 s
2,830 s 3,040 s 3,400 s
0 s
Figure 1 | 5���→44 two-step nucleation in a crystal with two vacancies in an H=3µm sample at 27.2◦C. a, Steady temperature profile in the xy-plane.The contour spacing is 0.2 ◦C. The temperature di�erence in the π(38µm)2 area of the central circle is less than 0.2 ◦C. The green dashed rectangle is thefull field of view. The red square is the area shown in b–g. b–g, Spatiotemporal evolution of the central region of the crystal during the s–s transition. Thecolours represent di�erent values of the Lindemann parameter for each particle measured during a 4 s time period (Supplementary Fig. 3). Liquid-likeparticles in red are defined as particles with low bond-orientational orders and large Lindemann parameters>0.2 (Supplementary Information). Scalebars, 5 µm. See also Supplementary Movie 2. b, At t=0 s, the heating light was switched on. The temperature increased and stabilized in 3 s. Two vacanciesare labelled by circles. c, At t=2,100 s, particles labelled with white dots are swapping positions with their neighbours, although the overall lattice structureremains intact. d, At t=2,400 s, a liquid nucleus has begun to form near one of the vacancies—that is, a vacancy surrounded by particles that are swappingpositions—even though the sample state (and temperature) is below the melting point. e, By t=2,830 s, the liquid nucleus has grown larger. f, Att=3,040 s, a4-lattice nucleus has developed within a liquid nucleus that exceeds the critical size. g, By t=3,400 s, the4-lattice nucleus has grown larger,well beyond its critical size.
confined between two glass walls. Such samples are well known toexhibit a cascade of crystalline phases as a function of increasingwallseparationH : 14, 2�, 24, 3�, 34, . . . (refs 26–28). Here 14 denotesamonolayer triangular lattice; 2� denotes a two-layer square lattice,and so on. Similar structures have been found in plasmas29 and inelectron bilayers of semiconductors30. The equilibrium state of thesesamples is controlled by two thermodynamic variables: the ratio ofwall separation to particle diameter, H/σ , and the particle volumefraction φ (refs 27,28). When temperature is varied, σ changesand thus both H/σ and φ are varied concurrently to producen�→(n−1)4 transitions. If temperature is varied quasi-statically,then such systems evolve along an angled trajectory in the phasediagram (Supplementary Fig. 2B). Here, we varied temperaturesuddenly to produce a superheated metastable �-lattice, and thenmonitored its evolution towards the equilibrium 4-lattice at a con-stant temperature (that is, at constant H/σ and φ).
When the whole sample was heated, n�→ (n−1)4 transitionsalways occurred without nucleation; transitions began at the inter-faces between n� and (n−1)4 domains (Supplementary Movie 1).Therefore, to prevent invasion from pre-existing (n−1)4 domains,we devised a scheme whereby a beam of light passing throughthe microscope objective lens locally heated the interior of an n�crystalline domain with a typical size of 105 particles per layer18.The heated area equilibrated to a temperature of Tamb+ δT . Theambient temperature, Tamb, was adjustable with 0.1 ◦C resolutionusing temperature controllers on the microscope, and the opticalheating typically induced a local temperature change of δT=1.6 ◦Cnear the centre of the illumination region (Fig. 1a). The temperatureattained its steady-state value ∼3 s after the light was turned on(Supplementary Fig. 1C; ref. 18). The s–s transition is achievedwhenTamb<Ts–s<Tamb+ δT <Tm, where Ts–s and Tm correspond to thes–s and melting (solid–liquid) transitions, respectively.
In our experiments, the incubation time before a nucleus formsranges from 5 to 60min, depending on the degree of superheating.
This incubation time is thus much larger than the temperatureequilibration time of 3 s. The temperature was set to be constant forthe entire duration of the incubation and nucleation processes, andwas measured to be very uniform in the central π (38 µm)2 area ofthe xy-plane (Fig. 1a) and throughout the thickness (z direction)of the thin films. This 76-µm-diameter region of interest is verysmall compared to the 18× 18mm2 sample cell size, and the wallseparation is very uniform (<0.03σ ) in the region of interest. Mostof the nuclei studied were larger than H and had a uniform shapein the z direction; thus we monitored only a fixed layer withinthe thin film. In most experiments we monitored the surface layer,wherein liquid-like particles are more clearly distinguished andcharacterized. The particle motions were recorded with a charge-coupled device (CCD) camera at 10 frames s−1. Particle positionswere tracked using standard image analysis31. Experimental detailsare given in the Methods and Supplementary Information.
Two-step nucleationNucleation near vacancies (Fig. 1 and Supplementary Movie 2),dislocations (Fig. 2 and Supplementary Movie 3) and a grainboundary (Fig. 3 and Supplementary Movie 4) was measuredby choosing heating areas containing these particular defects.All the superheated metastable crystals exhibited an interestingtwo-step nucleation pathway: �-lattice crystal → post-criticalliquid nucleus→4-lattice nucleus (Figs 1–3). This behaviour wasrobust across 50 independent experiments observed inside�-latticecrystal domains and 6 independent experiments observed at grainboundaries. The largest observed liquid area had ∼740 particlesper layer (Supplementary Movie 5). Liquid-like particles swappedpositions in movies, indicating that they are indeed liquid. Notethat the intermediate liquid nucleus is in a metastable supercooledstate which is denser than the equilibrium liquid phase. In fact,the metastable liquid, the superheated �-lattice and the finalequilibrium4-lattice have approximately the same number density
2 NATUREMATERIALS | ADVANCE ONLINE PUBLICATION | www.nature.com/naturematerials© 2014 Macmillan Publishers Limited. All rights reserved.
NATUREMATERIALS DOI: 10.1038/NMAT4083 ARTICLES
I
II
III
IV
VIV I
II
III
IV
VI
V
280 s
730 s 850 s
850800t (s)
d (µ
m)
750
10 IIIIIIIVVVI
Incoherent
Semi-coherent
Coherent
5
0
400 s 680 sa
d
b
e
c
f
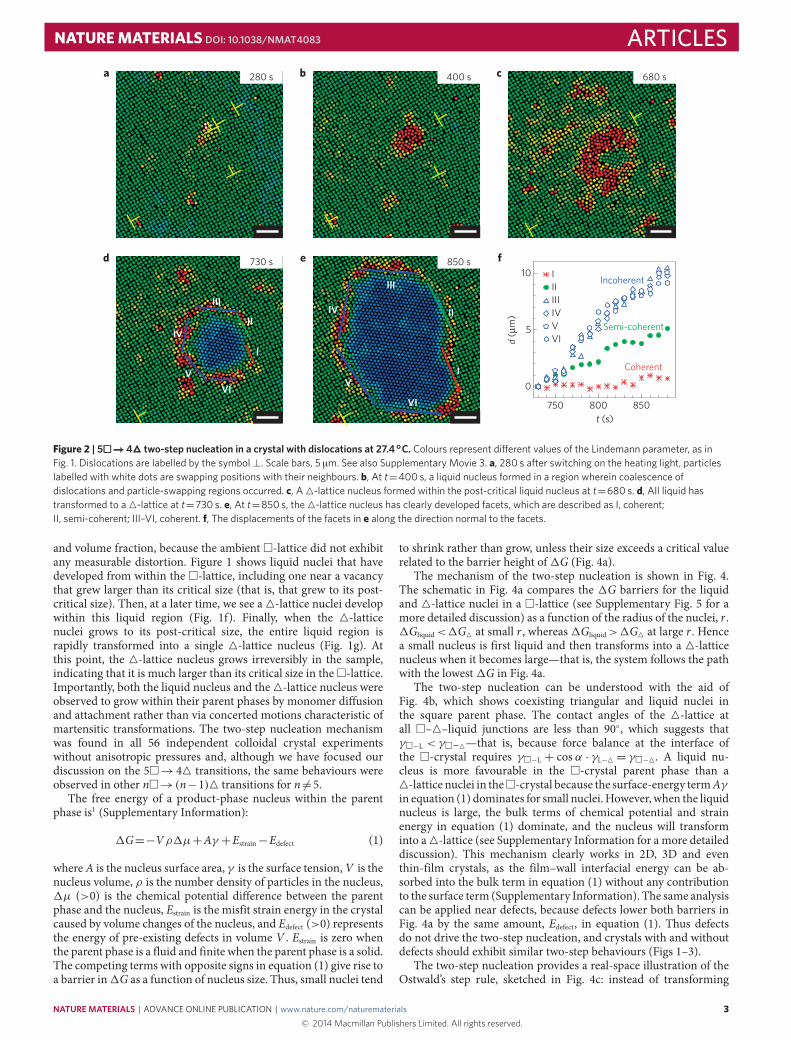
Figure 2 | 5���→44 two-step nucleation in a crystal with dislocations at 27.4◦C. Colours represent di�erent values of the Lindemann parameter, as inFig. 1. Dislocations are labelled by the symbol⊥. Scale bars, 5 µm. See also Supplementary Movie 3. a, 280 s after switching on the heating light, particleslabelled with white dots are swapping positions with their neighbours. b, At t=400 s, a liquid nucleus formed in a region wherein coalescence ofdislocations and particle-swapping regions occurred. c, A4-lattice nucleus formed within the post-critical liquid nucleus at t=680 s. d, All liquid hastransformed to a4-lattice at t=730 s. e, At t=850 s, the4-lattice nucleus has clearly developed facets, which are described as I, coherent;II, semi-coherent; III–VI, coherent. f, The displacements of the facets in e along the direction normal to the facets.
and volume fraction, because the ambient �-lattice did not exhibitany measurable distortion. Figure 1 shows liquid nuclei that havedeveloped from within the �-lattice, including one near a vacancythat grew larger than its critical size (that is, that grew to its post-critical size). Then, at a later time, we see a4-lattice nuclei developwithin this liquid region (Fig. 1f). Finally, when the 4-latticenuclei grows to its post-critical size, the entire liquid region israpidly transformed into a single 4-lattice nucleus (Fig. 1g). Atthis point, the 4-lattice nucleus grows irreversibly in the sample,indicating that it is much larger than its critical size in the�-lattice.Importantly, both the liquid nucleus and the4-lattice nucleus wereobserved to grow within their parent phases by monomer diffusionand attachment rather than via concerted motions characteristic ofmartensitic transformations. The two-step nucleation mechanismwas found in all 56 independent colloidal crystal experimentswithout anisotropic pressures and, although we have focused ourdiscussion on the 5�→44 transitions, the same behaviours wereobserved in other n�→(n−1)4 transitions for n 6=5.
The free energy of a product-phase nucleus within the parentphase is1 (Supplementary Information):
1G=−Vρ1µ+Aγ +Estrain−Edefect (1)
whereA is the nucleus surface area, γ is the surface tension,V is thenucleus volume, ρ is the number density of particles in the nucleus,1µ (>0) is the chemical potential difference between the parentphase and the nucleus, Estrain is the misfit strain energy in the crystalcaused by volume changes of the nucleus, and Edefect (>0) representsthe energy of pre-existing defects in volume V . Estrain is zero whenthe parent phase is a fluid and finite when the parent phase is a solid.The competing terms with opposite signs in equation (1) give rise toa barrier in1G as a function of nucleus size. Thus, small nuclei tend
to shrink rather than grow, unless their size exceeds a critical valuerelated to the barrier height of1G (Fig. 4a).
The mechanism of the two-step nucleation is shown in Fig. 4.The schematic in Fig. 4a compares the 1G barriers for the liquidand 4-lattice nuclei in a �-lattice (see Supplementary Fig. 5 for amore detailed discussion) as a function of the radius of the nuclei, r .1Gliquid<1G4 at small r , whereas1Gliquid>1G4 at large r . Hencea small nucleus is first liquid and then transforms into a 4-latticenucleus when it becomes large—that is, the system follows the pathwith the lowest1G in Fig. 4a.
The two-step nucleation can be understood with the aid ofFig. 4b, which shows coexisting triangular and liquid nuclei inthe square parent phase. The contact angles of the 4-lattice atall �–4–liquid junctions are less than 90◦, which suggests thatγ�−L < γ�–4—that is, because force balance at the interface ofthe �-crystal requires γ�−L + cos α · γL−4 = γ�−4. A liquid nu-cleus is more favourable in the �-crystal parent phase than a4-lattice nuclei in the�-crystal because the surface-energy termAγin equation (1) dominates for small nuclei. However, when the liquidnucleus is large, the bulk terms of chemical potential and strainenergy in equation (1) dominate, and the nucleus will transforminto a4-lattice (see Supplementary Information for a more detaileddiscussion). This mechanism clearly works in 2D, 3D and eventhin-film crystals, as the film–wall interfacial energy can be ab-sorbed into the bulk term in equation (1) without any contributionto the surface term (Supplementary Information). The same analysiscan be applied near defects, because defects lower both barriers inFig. 4a by the same amount, Edefect, in equation (1). Thus defectsdo not drive the two-step nucleation, and crystals with and withoutdefects should exhibit similar two-step behaviours (Figs 1–3).
The two-step nucleation provides a real-space illustration of theOstwald’s step rule, sketched in Fig. 4c: instead of transforming
NATUREMATERIALS | ADVANCE ONLINE PUBLICATION | www.nature.com/naturematerials 3© 2014 Macmillan Publishers Limited. All rights reserved.

ARTICLES NATUREMATERIALS DOI: 10.1038/NMAT4083
800 s
1,950 s 2,020 s 2,100 s
1,300 s 1,760 sa
d
b
e
c
f
Figure 3 | 5���→44 two-step nucleation at a grain boundary at 27.2◦C. Colours represent di�erent values of the Lindemann parameter, as in Fig. 1. Scalebars, 5 µm. See also Supplementary Movie 4. a, Particle swapping (white dots) occurred only at the grain boundary. b, The liquid first coalesced into a largeelongated nucleus. c, The liquid then grew into an asymmetric droplet relative to the grain boundary because the grain boundary has di�erent anglesrelative to the two �-lattices. d, The4-lattice nucleated from within a liquid nucleus. e,f, The nucleated4-lattice rapidly transformed into a4-crystal.All the4/� interfaces were incoherent, with similar growth speeds; hence, the4-lattice nucleus maintained approximately the same shape during growth.
directly into the product phase, the parent phase evolves throughintermediate metastable (for example, liquid) states with lowerfree-energy barriers. However, even in comparison with two-step nucleation during crystallization—for example, ‘liquid →dense liquid droplet→ crystalline nucleus’ (ref. 32) or ‘liquid→low-density crystalline nucleus → crystalline nucleus’ (ref. 16)—the nature of the s–s nucleation process is remarkable becausethe intermediate liquid state has a structure that is qualitativelydifferent from both parent and product phases. Regardless, theeasy formation of liquid nuclei is plausible from symmetryconsiderations. In s–s transition theory, each step of the transition isassumed to follow a group–subgroup relation based on symmetry,and a sequence of intermediate states is needed to bridge theparent and product lattices13. So far, however, liquid intermediatestates have not been considered theoretically13. In fact, liquidis an excellent candidate for the intermediate state because thesymmetries of all lattices are its subgroups. Consequently, itsinterfaces might be expected to cost less energy than s–s interfaces.Experimentally, the fluidic intermediate state has been suggested inthe graphite–diamond transition on the basis of indirect evidence33;direct experimental evidence is difficult to come by owing to thevery small spatial and rapid temporal scales associated with theintermediate liquid nuclei.
The two-step nucleation occurs only in barrier-crossingprocesses. When the heating light was switched off, the 4-latticenucleus was observed to convert directly back to a�-lattice withoutexperiencing an intermediate liquid state (SupplementaryMovie 6).In this case, the ambient �-lattice surrounding the nucleus actseffectively as a huge post-critical nucleus, for which a free-energybarrier does not exist.
Nucleation precursorAs well as real-time visualization of the two-step nature of the s–stransition, the novel experimental system enabled exploration of
the early dynamics that lead to nuclei formation. So far, precursorsof nucleation have attracted substantial interest in the study ofcrystal melting18,34, but they have rarely been explored in solid–solidtransitions. In our colloidal samples, the nucleation kinetics canbe accurately measured because the temperature was fixed duringthe∼10–100min of incubation and nucleation time, which enableseasy observation of the liquid nucleation precursors and avoids thecatastrophic transitions under strong anisotropic stresses or strongsuperheating used in many simulations. In the defect-mediatednucleation theory for crystalmelting, a perfect crystal developsmoreand more defects as temperature increases. They diffuse, coalesceand form nuclei above the phase-transition point. Our observationsrevealed precursors of liquid nuclei in the s–s transition that are notnewly generated defects, as is often assumed; rather, they are loopmotions similar to those that have been recently observed in crystalmelting simulations34 and experiments18. As shown in Figs 1c, 2aand 3a, particles marked in white leave their lattice sites, but thecrystalline structure remains intact; these particles swap positionswith neighbours to form closed loops of moving particles in 3D.Indeed, this should be the easiest way to move particles around in aperfect lattice.
In crystals with vacancies, particle swapping can take place inany region, but has a higher chance of occurring near vacancies(Fig. 1c). In crystals with dislocations and/or grain boundaries,particle swapping occurs near dislocations or grain boundaries,and is suppressed in the neighbouring areas (Figs 2a and 3a).Consequently, liquid nucleation starts from dislocations and grainboundaries (Figs 2a and 3a). Vacancies are much more mobile(Fig. 1c,d) than dislocations, and we observed that liquid nucleiformed at vacancies are mobile, whereas liquid nuclei formedaround dislocations are pinned; pinning is probably caused by theextra half planes of particles that are associated with dislocations.In the present experiments, attraction or repulsion was notapparent among dislocations (Fig. 2), nor between dislocations and
4 NATUREMATERIALS | ADVANCE ONLINE PUBLICATION | www.nature.com/naturematerials© 2014 Macmillan Publishers Limited. All rights reserved.

NATUREMATERIALS DOI: 10.1038/NMAT4083 ARTICLES
α
Liquid
Intermediate state(Metastable liquid)
State
aΔG
ΔG
r
b
c
Initial state( )
Final state( )
Figure 4 | Two-step nucleation mechanism. a, Schematic of1G for the liquid nucleus (red curve) and the4-lattice nucleus (blue curve) forming within the�-lattice. The combined red–blue solid curve corresponds to the evolution path with the lowest1G. r∝
√N is the e�ective radius of a nucleus with N
particles in the xy-plane. The intersection of the red and blue curves corresponds to the liquid–4 transition process. b, The contact angle of the4-lattice atthe �–4–liquid junction α<90◦ (Supplementary Movie 5). The morphology of the nucleus is sketched in the inset, and indicates that the4-lattice doesnot wet the �-lattice. Colours represent di�erent values of the Lindemann parameter, as shown in Fig. 1. c, Ostwald’s step rule for the two-step nucleation:the �-lattice tends to pass through an intermediate metastable liquid state with two lower free-energy barriers, instead of directly transforming into the4-lattice. Note that the horizontal axis represents a direction of motion in multidimensional-state space that is di�erent from the horizontal axis in a. Thecrossing point in a, however, corresponds to the hopping process over the second barrier in c.
liquid nuclei (Figs 2 and 3). Dislocations can diffuse, but theydid not drift towards nuclei; rather, they were simply absorbedby an expanding liquid nucleus. Multiple post-critical liquidnuclei were observed to form in crystals with many dislocations.Eventually, they merge and then transform into a 4-lattice nucleus(Supplementary Movie 5), or transform into 4-lattice nuclei andthen merge.
Growth of nuclei and interface motionFacets begin to develop after the whole liquid nucleus wastransformed into a 4-lattice. The facets developed earlier in Fig. 2than in Figs 1 and 3 because the liquid transformed to a triangularlattice faster in Fig. 2, owing to the weaker degree of superheatingand the stronger lattice deformation caused by the dislocations(that is, rather than a vacancy or a grain boundary). The facetscan be classified into three types according to their structure: acoherent interface with no lattice mismatch (Fig. 2e: I); a semi-coherent interface in which lattice mismatch can be viewed asa chain of dislocations (Fig. 2e: II); and an incoherent interfacewherein lattices do not match (Fig. 2e: III–VI). The facets ofa nucleus within a crystalline domain cannot be all coherentbecause a coherent interface requires precise matching betweenboth lattice constants and angles of the two lattices. The slopesin the plots of Fig. 2f give the propagation speeds, v, of variousinterfaces along the normal (⊥) direction. Notice that the slopesof these lines remain approximately constant during growth, withv⊥coherent< v⊥semi-coherent< v⊥incoherent. Moreover, the disordered structureat the incoherent interfaces seems to transform into a thin layerof ‘liquid’ (red particles in Fig. 2e III–VI), which further enhancesthe mobility of the particles and the interface35. This behaviour isobserved more prominently in the reverse process: after switching
off local heating, the coherent interfaces are pinned, whereas theincoherent interfaces propagate rapidly (Supplementary Movie 6).
The growth of these post-critical 4-lattice nuclei depends oninterface propagation speeds. The propagation speeds of the fourincoherent interfaces were similar, which means that the speedswere not very sensitive to the angles between the interface andthe two lattices. Furthermore, a fast propagation speed along thenormal direction is typically accompanied by a slow propagationspeed along the lateral direction; hence, the coherent and semi-coherent interfaces grew faster in the lateral (‖) direction—that is,v‖coherent>v‖semi-coherent>v‖incoherent. This effect causes the nucleus to elon-gate, as seen in Fig. 2d,e. Such elongation is energetically favourablebecause the coherent and semi-coherent interfaces cost less en-ergy than the incoherent interfaces. These interface-propagation be-haviours are predicted in theory, and have previously been observedin atomic and molecular polycrystals by electron microscopy1,although not during the small-scale nucleation process.
Parameters of nucleiLastly, the data accumulated from the many experiments permitsquantitative determination of a critical-nucleus size, interfacialsurface tension, and the distribution of interface angles between thedifferent crystalline solids. The size of the critical liquid nucleus,N ∗, is estimated in three ways: from the plateau in the sizeevolution plots (Fig. 5a), because a critical nucleus is in unstableequilibrium and tends not to grow or shrink; by fitting the 1G(N )curve (Fig. 5b) obtained from the Boltzmann distribution of thesize of the nuclei36, (Supplementary Information); and from theinflection point of the first-passage time of the nucleus size37(Supplementary Fig. 4). The three methods yield similar values:N ∗ = 50± 20, 50± 10, 56± 20 for the nucleation process shown
NATUREMATERIALS | ADVANCE ONLINE PUBLICATION | www.nature.com/naturematerials 5© 2014 Macmillan Publishers Limited. All rights reserved.

ARTICLES NATUREMATERIALS DOI: 10.1038/NMAT4083
θ
Dislocations
Dislocations
Grain boundary
Grain boundary
Vacancies
Vacancies
3,0002,0001,000t (s)
t (s)3,0002,0001,000
1
10
100
10
8
6
4
0.20
Prob
abili
ty
0.15
0.10
0.05
0.00
0 20 40
0θ (°)
5 10 15
60 8010
100
Nliq
uid
NΔ
ΔG
N0
a b
c d
Figure 5 | Properties of nuclei. a, Size evolution of the liquid nuclei in Figs 1–3. N is the number of particles per layer in the nucleus. The plateaux in the red,blue and black shaded areas correspond to the critical sizes wherein the nuclei were most stable. b, The free energy of the liquid nucleus shown in Fig. 1,and fitted by equation (1) (yellow curve). c, Size evolution of the4-lattice nuclei in Figs 1–3. d, Probability distribution of the angle between the �- and4-lattices (inset) in the 50 experiments carried out inside single domains without grain boundaries. Note that the angle ranges from 0 to 15◦.
in Fig. 1. For nucleation near dislocations and grain boundaries,the probability of forming a liquid nucleus is not uniform inspace. Hence, we estimated the critical size from data in Fig. 5ato be N ∗ = 60± 20 for the case of nucleation near dislocations(Fig. 2) and N ∗ = 90 ± 20 for the case of nucleation near agrain boundary (Fig. 3). 4-lattice nuclei grew rapidly in theparent liquid nuclei without a period of steady nuclei distribution;their critical sizes were roughly estimated from Fig. 5c to beN ∗∼ 5–30. Fitting of equation (1) to the data in Fig. 5b enabledus to derive an estimate for the surface tension between the liquidnucleus and the superheated square lattice of γ ' 0.2 kBT/σ 2, whichis comparable to the value γ ' 0.54–0.58 kBT/σ 2 obtained fromsimulations of a liquid and a three-dimensional fcc crystal of hardspheres at the melting point38 (Supplementary Information).
Figure 5d shows the broad distribution of the angles betweenthe parent and product lattices found in all 50 experiments carriedout inside �-lattice domains. The angle distribution is consistentwith the notion that these transitions are not martensitic, in whichcase the distribution would have been characterized by a fixed anglebetween lattices1. When the 4-lattice nuclei grew from a liquid/�interface, it usually had 0< θ < 4◦ (that is, the interfaces werecoherent or semi-coherent); those that grew from inside the liquidhad 4◦<θ <15◦ (that is, interfaces were incoherent). For a nucleuswith θ=0◦, the 4- and �-lattices are aligned such that it can haveone or two coherent facets, whereas a nucleus with θ 6= 0◦ has nocoherent facet. Consequently, a greater number of nuclei with θ=0◦are seen in Fig. 5d, because coherent interfaces have lower energy.
OutlookTo conclude, we have observed the kinetics of a solid–solidphase transition which very clearly reveals a two-step nucleationprocess with intermediate liquid state nuclei. The kinetic pathwayof a phase transition could involve complicated intermediatestates and is often difficult to predict39. Although intermediate
states have been observed in some s–s transitions of molecularcrystals1, all were crystalline intermediate states in martensitictransformations rather than liquid states in diffusive nucleation.Our model for the two-step nucleation mechanism suggeststhat similar kinetic pathways with an intermediate liquid shouldgenerally occur in 2D, 3D and thin-film single crystals andpolycrystals when the solid–liquid interfacial energy is lowerthan the solid–solid interfacial energy. The key controlling factorin the early stages of s–s transformation processes is surfaceenergy, rather than the bulk energies of chemical potentialand strain assumed in many s–s transition theories. We notethat the interfacial energy in metals and alloys ranges from500 to 1,000mJm−2 for incoherent interfaces and from 200 to500mJm−2 for semi-coherent interfaces, is less than 200mJm−2for coherent interfaces between two crystalline phases, and rangesfrom 30 to 250mJm−2 for solid/liquid interfaces1. Therefore, asthe surface of a nucleus cannot be entirely coherent, a liquidnucleus should form in the early stages of s–s nucleation inboth single and polycrystalline atomic metals and alloys. Theobservations show that the barrier for the s–s transition isessentially the barrier for forming a liquid nucleus. Thus, anyprocessing methodology that reduces the energy barrier forliquid nuclei—for example, doping impurities—might lead to aspeed-up of sluggish s–s transitions that arise in industrial andmetallurgical processes.
In addition, the nucleation precursor of s–s transitions, particle-swapping loops provides a new relaxation mode that makes thes–s transition easier and faster. This new kinetic factor controllingthe s–s transition rate should be incorporated in future s–stransition theories.
Our experiments were carried out under isotropic stress, whereasmany s–s transitions in nature and in industry are under anisotropicpressure, which enhances the barrier-crossing ability and promotescollective motions of particles. How anisotropic pressure affects
6 NATUREMATERIALS | ADVANCE ONLINE PUBLICATION | www.nature.com/naturematerials© 2014 Macmillan Publishers Limited. All rights reserved.

NATUREMATERIALS DOI: 10.1038/NMAT4083 ARTICLESthe intermediate liquid and the nucleation precursor is a questionworth exploring.
MethodsWe synthesized poly(N -isopropylacrylamide) (NIPA, pNIPA or pNIPAM)microgel spheres with less than 3% polydispersity and dispersed them in anaqueous buffer solution with 1 mM acetic acid17. Their pair interactions aremeasured from the liquid structure of a dilute monolayer of NIPA spheres40.The colloidal-sample preparation was the same as that for our thin-film meltingexperiments in refs 41,42. Briefly, a droplet of the colloidal suspension was placedon a glass slide, then a glass coverslip was placed on the droplet. The glasssurfaces were rigorously cleaned to prevent particles sticking to them. Thecolloidal suspension spread out over most of the 18×18mm2 area of the coverslipby capillary force. By adding an appropriate volume of the colloidal suspensionbefore we sealed the sample, we could control the sample cell thickness H . Forexample, a 1.0 µl colloid usually formed four layers at the centre and six layers atthe edges in the 18×18mm2 sample area. Therefore, there was little wallbending, and the local thickness can be taken as uniform over a ∼100 µm field ofview. After the droplet spread out over most of the coverslip, the coverslip andthe glass slide were glued together with epoxy so that the wall separation H wasfixed. The cell was filled with colloids and a small amount of air at the edge, sothat the viscous epoxy cannot flow into it and affect the wall separation. Theepoxy was hardened in air in 5min. The colloidal spheres formed polycrystalswith typical domain sizes ranging from 10 to 100 µm in a freshly made sample.Before the experiment, we used a temperature controller to cycle the temperatureto remove small defects and release any pressure that might have built up duringspreading out of the droplet before sealing the sample. After annealing near thetransition temperature, some domains grew larger than 300 µm in size.
We superheated the interior of the crystal with a beam of light from a 100Wmercury lamp while retaining the ambient temperature below the s–s transitionpoint (Supplementary Fig. 2A). The area under heating in the focal plane can beset anywhere between 20 µm and 5mm in diameter by adjusting the iris. Weusually set it to 76 µm. We observed the sample in the transmission mode of anupright microscope to avoid direct exposure of the camera to the heating light. Asmall amount of non-fluorescent black dye (Chromatech-Chromatint black 2232liquid), 0.6% by volume, was added to the sample to absorb the heating light. Thedye seemed to have minor effects on the particle interaction and the phasebehaviour. The heating effect can be conveniently measured from δT=Tm−T h
m,where T h
m and Tm are the melting temperatures at a grain boundary with andwithout the optical heating, respectively. δT depends on the light intensity andthe dye concentration, and was usually set to 1.6 ◦C. A paraffin film was placed inthe light path to ensure the optical heating was sufficiently uniform18. Theheating profile shown in Fig. 1a was measured from an aqueous solution ofyellow fluorescein (0.01% by weight) in a cell of thickness 5 µm. The brightness ofthis fluorescent solution is proportional to the light intensity and the heatingeffect43. The light from the mercury lamp was focused by a ×100 objective, hencethe focal plane experienced the strongest heating. In 3D NIPA colloidal crystals18,the temperature changes by less than 0.2 ◦C (that is, 0.46% volume fraction) in±25 layers along the z direction, hence the temperature is sufficiently uniformalong the z direction in a five-layer-thick sample. Indeed, the nucleationbehaviours at the top and bottom walls were indistinguishable. SupplementaryFig. 1C shows that the effect of heating stabilized just 3 s after the light wasswitched on. The lattice constant in the heated region changed by less than 2%and was stabilized in 5 s. Hence sphere diameter and pressure remained constantthroughout the entire duration of the incubation and nucleation processes. Thetemperature gradient in Fig. 1a could induce a small pressure gradient, but it wasoutside the field of view. Moreover, it reached a steady state 5 s after the light wasswitched on. Indeed, we observed no flow in the region of interest. Therefore,there was no temperature gradient or pressure gradient in the region of interest.Note that the 0.1 ◦C resolution of the temperature controller limits slowtemperature fluctuations over a timescale of several minutes and that the spatialtemperature distribution in the small region of interest is uniform.
Received 2 April 2014; accepted 8 August 2014;published online 14 September 2014
References1. Porter, D. A., Easterling, K. E. & Sherif, M. Y. Phase Transformations in Metals
and Alloys (CRC Press, 2008).2. Kirby, S. H., Durham, W. B. & Stern, L. A. Mantle phase changes and
deep-earthquake faulting in subducting lithosphere. Science 252,216–225 (1991).
3. Irifune, T., Kurio, A., Sakamoto, S., Inoue, T. & Sumiya, H. Ultrahardpolycrystalline diamond from graphite. Nature 421, 599–600 (2003).
4. Smith, W. F. Principles of Materials Science and Engineering(McGraw-Hill, 1996).
5. Erskine, D. J. & Nellis, W. J. Shock-induced martensitic phase transformation oforiented graphite to diamond. Nature 349, 317–319 (1991).
6. Khaliullin, R. Z., Eshet, H., Kühne, T. D., Behler, J. & Parrinello, M. Nucleationmechanism for the direct graphite-to-diamond phase transition. Nature Mater.10, 693–697 (2011).
7. Burnley, P. C. & Green, H. W. Stress dependence of the mechanism of theolivine–spinel transformation. Nature 338, 753–756 (1989).
8. Jacobs, K., Zaziski, D., Scher, E. C., Herhold, A. B. & Alivisatos, A. P.Activation volumes for solid–solid transformations in nanocrystals. Science293, 1803–1806 (2001).
9. Scandolo, S., Bernasconi, M., Chiarotti, G., Focher, P. & Tosatti, E.Pressure-induced transformation path of graphite to diamond. Phys. Rev. Lett.74, 4015–4018 (1995).
10. Zipoli, F., Bernasconi, M. & Martoňák, R. Constant pressure reactive moleculardynamics simulations of phase transitions under pressure: The graphite todiamond conversion revisited. Eur. Phys. J. B 39, 41–47 (2004).
11. Zahn, D. & Leoni, S. Nucleation and growth in pressure-induced phasetransitions from molecular dynamics simulations: Mechanism of thereconstructive transformation of NaCl to the CsCl-type structure. Phys. Rev.Lett. 92, 250201 (2004).
12. Mundy, C. J. et al. Ultrafast transformation of graphite to diamond: Anab initio study of graphite under shock compression. J. Chem. Phys. 128,184701 (2008).
13. Toledano, P. & Dmitriew, V. Reconstructive Phase Transitions in Crystals andQuasicrystals (World Scientific, 1996).
14. Anderson, V. J. & Lekkerkerker, H. N. W. Insights into phase transition kineticsfrom colloid science. Nature 416, 811–815 (2002).
15. Gasser, U., Weeks, E. R., Schofield, A., Pusey, P. N. &Weitz, D. A. Real-spaceimaging of nucleation and growth in colloidal crystallization. Science 292,258–262 (2001).
16. Tan, P., Xu, N. & Xu, L. Visualizing kinetic pathways of homogeneousnucleation in colloidal crystallization. Nature Phys. 10,73–79 (2014).
17. Alsayed, A. M., Islam, M. F., Zhang, J., Collings, P. J. & Yodh, A. G.Premelting at defects within bulk colloidal crystals. Science 309,1207–1210 (2005).
18. Wang, Z., Wang, F., Peng, Y., Zheng, Z. & Han, Y. Imaging the homogeneousnucleation during the melting of superheated colloidal crystals. Science 338,87–90 (2012).
19. Savage, J. R., Blair, D. W., Levine, A. J., Guyer, R. A. & Dinsmore, A. D.Imaging the sublimation dynamics of colloidal crystallites. Science 314,795–798 (2006).
20. Weeks, E. R., Crocker, J. C., Levitt, A. C., Schofield, A. & Weitz, D. A.Three-dimensional direct imaging of structural relaxation near the colloidalglass transition. Science 287, 627–631 (2000).
21. Zhang, Z. et al. Thermal vestige of the zero-temperature jamming transition.Nature 459, 230–233 (2009).
22. Yethiraj, A., Wouterse, A., Groh, B. & van Blaaderen, A. Nature of anelectric-field-induced colloidal martensitic transition. Phys. Rev. Lett. 92,058301 (2004).
23. Weiss, J. A., Oxtoby, D. W., Grier, D. G. & Murray, C. A. Martensitic transitionin a confined colloidal suspension. J. Chem. Phys. 103, 1180–1190 (1995).
24. Bolhuis, P. & Frenkel, D. Prediction of an expanded-to-condensed transition incolloidal crystals. Phys. Rev. Lett. 72, 2211–2214 (1994).
25. Casey, M. T. et al. Driving diffusionless transformations in colloidal crystalsusing DNA handshaking. Nature Commun. 3, 1209 (2012).
26. Pieranski, P., Strzelecki, L. & Pansu, B. Thin colloidal crystals. Phys. Rev. Lett.50, 900–903 (1983).
27. Schmidt, M. & Löwen, H. Freezing between two and three dimensions. Phys.Rev. Lett. 76, 4552–4555 (1996).
28. Fortini, A. & Dijkstra, M. Phase behaviour of hard spheres confined betweenparallel hard plates. J. Phys. Condens. Matter 18, L371–L378 (2006).
29. Mitchell, T. B. et al.Direct observations of structural phase transitions in planarcrystallized ion plasmas. Science 282, 1290–1293 (1998).
30. Narasimhan, S. & Ho, T-L. Wigner-crystal phases in bilayer quantum Hallsystems. Phys. Rev. B 52, 12291–12306 (1995).
31. Crocker, J. C. & Grier, D. G. Methods of digital video microscopy for colloidalstudies. J. Colloid Interf. Sci. 179, 298–310 (1996).
32. Ten Wolde, P. R. & Frenkel, D. Enhancement of protein crystal nucleation bycritical density fluctuations. Science 277, 1975–1978 (1997).
33. Shekar, N. C. & Rajan, K. G. Kinetics of pressure induced structural phasetransitions. Bull. Mater. Sci. 24, 1–21 (2001).
34. Bai, X-M. & Li, M. Ring-diffusion mediated homogeneous melting in thesuperheating regime. Phys. Rev. B 77, 134109 (2008).
35. Levitas, V. I., Henson, B. F., Smilowitz, L. B. & Asay, B. W. Solid–solid phasetransformation via virtual melting significantly below the melting temperature.Phys. Rev. Lett. 92, 235702 (2004).
NATUREMATERIALS | ADVANCE ONLINE PUBLICATION | www.nature.com/naturematerials 7© 2014 Macmillan Publishers Limited. All rights reserved.

ARTICLES NATUREMATERIALS DOI: 10.1038/NMAT4083
36. Auer, S. & Frenkel, D. Prediction of absolute crystal-nucleation rate inhard-sphere colloids. Nature 409, 1020–1023 (2001).
37. Lundrigan, S. E. & Saika-Voivod, I. Test of classical nucleation theory and meanfirst-passage time formalism on crystallization in the Lennard-Jones liquid.J. Chem. Phys. 131, 104503 (2009).
38. Davidchack, R. L. Hard spheres revisited: Accurate calculation of thesolid–liquid interfacial free energy. J. Chem. Phys. 133, 234701 (2010).
39. Evans, R. M. L., Poon, W. C. K. & Renth, F. Classification of ordering kinetics inthree-phase systems. Phys. Rev. E 64, 031403 (2001).
40. Polin, M., Grier, D. G. & Han, Y. Colloidal electrostatic interactions near aconducting surface. Phys. Rev. E 76, 041406 (2007).
41. Peng, Y., Wang, Z., Alsayed, A. M., Yodh, A. G. & Han, Y. Melting of colloidalcrystal films. Phys. Rev. Lett. 104, 205703 (2010).
42. Peng, Y., Wang, Z., Alsayed, A. M., Yodh, A. G. & Han, Y. Melting of multilayercolloidal crystals confined between two walls. Phys. Rev. E 83,011404 (2011).
43. Jiang, H., Wada, H., Yoshinaga, N. & Sano, M. Manipulation of colloids by anonequilibrium depletion force in a temperature gradient. Phys. Rev. Lett. 102,208301 (2009).
AcknowledgementsThis work was supported by Chinese grants NSFC11374248 (Y.H.), NSFC11004143,NSFC21174101, NSFC91027040 and NBRPC.2012CB821500 (Z.Z.), and by US grantsNSF DMR12-05463, NSF-MRSEC DMR11-20901 and NASA NNX08AO0G (A.G.Y.).
Author contributionsY.P. and Y.H. conceived and designed the research plan. Y.P. carried out the experimentand data analysis with help from Z.W. F.W., Y.P. and Y.H. carried out the theoreticalmodelling. A.M.A. and Z.Z. synthesized the particles. Y.H., Y.P. and A.G.Y. wrote thepaper. Y.H. and A.G.Y. supervised and supported the work. All authors discussedthe results.
Additional informationSupplementary information is available in the online version of the paper. Reprints andpermissions information is available online at www.nature.com/reprints.Correspondence and requests for materials should be addressed to Y.H.
Competing financial interestsThe authors declare no competing financial interests.
8 NATUREMATERIALS | ADVANCE ONLINE PUBLICATION | www.nature.com/naturematerials© 2014 Macmillan Publishers Limited. All rights reserved.