two- to three-dimensional hecker transitions in the interfacial electrodeposition of silver
TRANSCRIPT

Two- to Three-Dimensional Hecker Transitions in theInterfacial Electrodeposition of Silver
O. Younes, L. Zeiri, and S. Efrima*
Department of Chemistry, Ben Gurion University, P.O. Box 653, Beer Sheva 84105, Israel
M. Deutsch
Department of Physics, Bar Ilan University, Ramat Gan 52900, Israel
Received July 11, 1996. In Final Form: October 29, 1996X
A drastic transition from fast-forming, 2D, ramified and bright deposits to slow-forming, 3D, compactand dark ones is observed during the electrodeposition of silver at the air-water interface, using a silvercathode and a nickel anode. This topological Hecker transition is shown to be caused by ions that dissolvefrom the anode, migrate through the liquid, and poison the growing deposit towards further reaction. Foriron and silver anodes no dimensional transition is observed, only amorphological one, leaving the growthtwo-dimensional. The spatial position of the Hecker transition in the deposition cell in our geometry isshown to be determined by the ionic concentrations and not only by the mobilities, as is the case in thethin-cell geometry. The transitions are related to the electrochemical properties of the ions and areinterpreted in terms of a dimensionless characteristic parameter, the Wagner number. By introducinga variety of ions directly into the solution, we developed a scale for the relative strength of the effect forthe ionic species studied.
Introduction
Electrodeposition of metal ions at interfaces or in thincells has been studied in the past few years, often as aconvenient model system for pattern formation. Most ofthese studies involved the electrodeposition of zinc1-5
though some involved copper6,7 and a few involved silver.8A large variety of two-dimensional deposit morphologieswere observed: dendritic, stringy, densely branched(DBM), and ramified structures reminiscent of diffusionlimited aggregation (DLA), as well as compact deposits.Of special interest for this report are transitions in the
morphology of the deposit, which occur at well-definedstages in the electrodeposition process. These Heckertransitions are generally attributed to a change in thelocal chemical environment at the edge of the growingdeposit, caused by a migrating front of impurity cationsproduced at the anode or by a migrating pH gradient.They were first reported by Hecker who observed atransition between two DBM forms of copper in a thin-cell configuration9 and were named after her. Fleury etal.10-12 demonstrated the importance of the cell geometryand the intimate relation of the effect to the dissolutionof theanode. Although initially observed inCudeposition,
subsequent studies demonstrated its occurrence in Zndeposits as well1,11 and it is now believed to be commonto a variety of metals. In other studies the role of thesupporting electrolyte was investigated.13 The positionof the transition was quantitatively related to the mobili-ties of the ions in the cell.7,12 In a series of papers, Kuhnand Argoul14-17 confirmed these conclusions for zinc andcopper electrodes and studied the effect of oxygen andelectrochemically “inert” alkali ions. Up to five differenttransitions were reported in definite locations in the cell.They also mention the formation of quasi three-dimen-sional depositswhen the growing cathode approaches theanode.15 Simulations of the growth process pointed to achange in the sign of the electric field near the deposit asone of the causes of the Hecker transition.18 A recentstudy of Zn deposition in a thin-cell geometry by Zik andMoses19 identifies the depletion of the depositing ion fromthe electrolyte as amajor cause for these transitions, andemphasizes the role played by convection flow in the cell.Thus,Hecker transitions reported to date are, essentially,morphological transitions which do not change the 2Dcharacter of the deposit.We report here a striking transition in the dimension-
alityandmorphologyof silverelectrodeposits fromahighlyramified, DLA-like, shiny, two-dimensional structure toa compact, black, three-dimensional one. Several uniquefeatures distinguish our study from previous studies oftheHecker effect. First, all previouswork employed thin-cell geometry, thus constraining the growth to be quasi-2D. The geometry employed here, deposition at thewater-air interface, does not,apriori, confine the growthto two dimensions and allows, therefore, dimensionalitytransitions when these are dictated by the physics andchemistry underlying the deposition process. Further-
X Abstract published in Advance ACS Abstracts,March 1, 1997.(1) Garik, P.; Barkey, D.; Ben-Jacob, E.; Bochner, E.; Broxholm, N.;
Miller, B.; Orr, B.; Zamir, R. Phys. Rev. Lett. 1989, 62, 2703.(2) Sawada, Y.; Dougherty, A.; Gollub, J. P. Phys. Rev. Lett. 1986,
56, 1260.(3) Fleury, V.; Chazalviel, J. N.; Rosso, M. Phys. Rev. Lett. 1992, 68,
2492; 86, 2493.(4) Matsushita, M.; Sano, M.; Hayakawa, Y.; Honjo, H.; Sawada, Y.
Phys. Rev. Lett. 1984, 53, 286.(5) Tamamushi, R.; Kaneko, H. Electrochem. Acta 1980, 25, 39.(6) Hibbert, D. B.; Melrose, J. R. Phys. Rev. 1988, A38, 1036.(7) Melrose, J. R.; Hibbert, D. B.; Ball, R. C. Phys. Rev. Lett. 1990,
65, 3009.(8) Zhao, X. K.; Fendler, J. H. J. Phys. Chem. 1990, 94, 3384.(9) Hecker, N.; Grier, D. G.; Sander, L. M. In Fractal Aspects of
Materials; Laibowitz, R. B., Mandelbrodt, B. B., Passoja, D. E., Eds.;MRS: University Park, PA, 1995; p 17.
(10) Fleury,V.;Rosso,M.;Chazalviel, J.-N.;Sapoval,B.J.Electroanal.Chem. 1990, 290, 249.
(11) Fleury, V.; Rosso, M.; Chazalviel, J.-N. Phys. Rev. A. 1991, 43,6908.
(12) Fleury, V.; Rosso, M.; Chazalviel, J.-N.; Sapoval, B. Phys. Rev.A. 1991, 44, 6693.
(13) Trigueros, P. P.; Sagues, F.; Claret, J. Phys. Rev. E. 1994, 49,4328.
(14) Kuhn, A.; Argoul, F. J. Electroanal. Chem. 1994, 371, 93.(15) Kuhn, A.; Argoul, F. Phys. Rev. E. 1994, 49, 4298.(16) Kuhn, A.; Argoul, F. Physica A 1995, 213, 209.(17) Kuhn, A.; Argoul, F. J. Chem. Educ. 1995, 71, A273.(18) Louis, E.; Guinea, F.; Pla, O.; Sander, L. M. Phys. Rev. Lett.
1992, 68, 209.(19) Zik, O.; Moses, E. Phys. Rev. E. 1996, 53, 1760.
1767Langmuir 1997, 13, 1767-1772
S0743-7463(96)00682-8 CCC: $14.00 © 1997 American Chemical Society
more, due to the large volume of the solution, depletionof the supply of depositing ions, characteristics of small-volume, thin-cell configurations, does not occur. Whileprevious studies showed that a Hecker transition can becaused by ions originating at the dissolving anode, ourstudy explores this point for a range of different ions.Mostimportantly, by observing the response to poisoning ionsaddeddirectly into thesolution,andbyAugerspectroscopicmeasurements on the dried deposit, we were able toidentify the reacting ion unambiguously. Through varia-tion of its concentration we establish a strength scale forthe various ionic species, based on the minimum concen-tration required for inducing a transition from two- tothree-dimensional growth. Finally, we relate the resultsto the electrochemical behavior of the system and discussthem in terms of the Wagner number,20 which character-izes whether the process is controlled by the primary orthe secondary current distributions.
Experimental Section
A three-electrode, potentiostatic (EG&G PAR 173) electro-chemical setupwasemployed. Theelectrodepositionwas carriedout in a circular cell with a radius of 2.5 cm. The silver wireworking electrode was placed at the center of the cell, with itstip just touching the aqueous solution-air interface. The circularcounter electrode was placed at the cell’s circumference. Thereference was a saturated calomel electrode separated from thesolution with a luggin capillary. The deposition voltage was -5V versus the reference calomel electrode in the potentiostaticsetup.A Sony SSC-M370CE video camera and a Sony SLV383 VCR
were used to monitor and record the progress of the electro-deposition. The time-dependent currentwasmeasuredbyadataacquisition Advantech 812PG board installed in an IBM PCcomputer.The aqueous solution contained 0.05M silver nitrate (Merck),
0.1% anisic acid (Aldrich Chemicals, Inc.) and 0.03% FC413 (aperfluoroalkyl anionic surfactant, predominately ammoniumperfluoroctate salt, made by 3M). Without these additives theeffect was smaller, and the results were much more sensitive tothe precise alignment of the cathode tip at the interface. Thesolution was made basic by the addition of ammonia until thesilver oxide just dissolved (pH ≈ 9). All materials were used asreceived. Water was Barnsted E-Pure quality, with a specificresistivity of ∼18 MΩ cm.The Auger measurements were performed with a Physical
Electronics model 549 XPS/AES scanner with a CMA detector.The beam parameters were Ep ) 3 KeV and Ip ) 2 µA. Thepressure was ∼1 × 10⁻¹⁰ Torr during measurements and 1.5 ×10⁻⁵ Torr during Argon sputtering.
Results
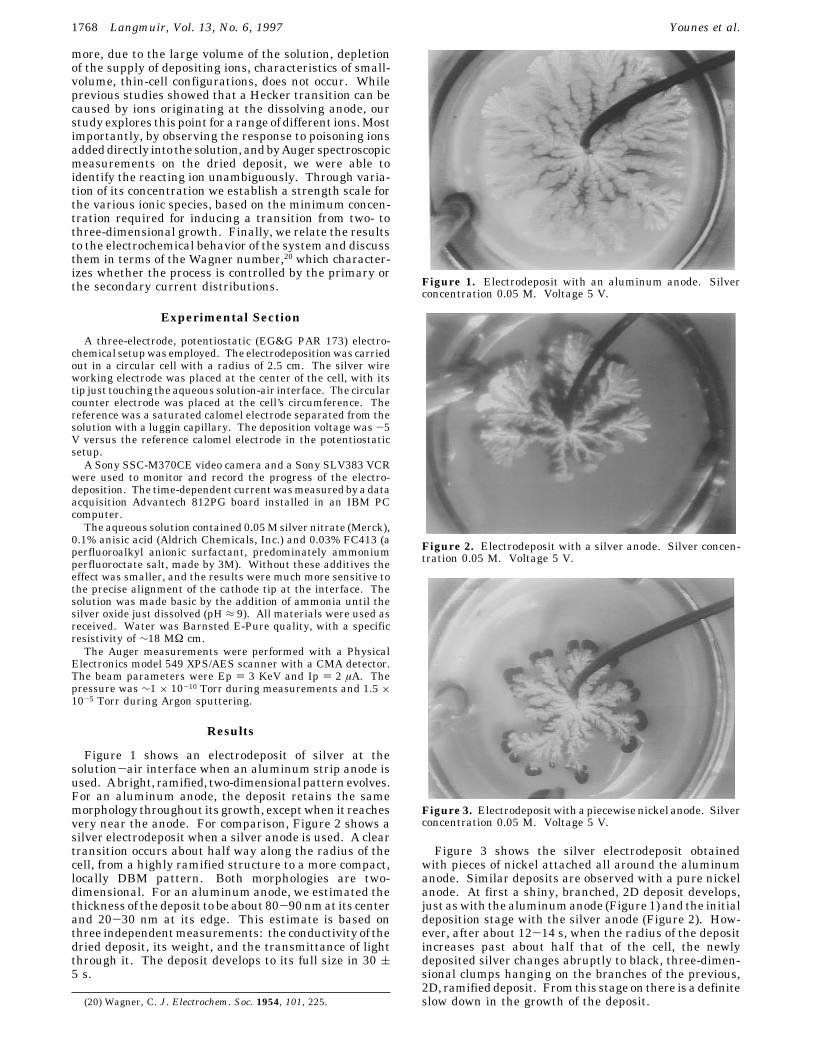
Figure 1 shows an electrodeposit of silver at thesolution-air interface when an aluminum strip anode isused. Abright, ramified, two-dimensionalpatternevolves.For an aluminum anode, the deposit retains the samemorphology throughout its growth, exceptwhen it reachesvery near the anode. For comparison, Figure 2 shows asilver electrodeposit when a silver anode is used. A cleartransition occurs about half way along the radius of thecell, from a highly ramified structure to a more compact,locally DBM pattern. Both morphologies are two-dimensional. For an aluminum anode, we estimated thethickness of the deposit to be about 80-90nmat its centerand 20-30 nm at its edge. This estimate is based onthree independentmeasurements: the conductivity of thedried deposit, its weight, and the transmittance of lightthrough it. The deposit develops to its full size in 30 (5 s.
Figure 3 shows the silver electrodeposit obtainedwith pieces of nickel attached all around the aluminumanode. Similar deposits are observed with a pure nickelanode. At first a shiny, branched, 2D deposit develops,just aswith the aluminumanode (Figure 1) and the initialdeposition stage with the silver anode (Figure 2). How-ever, after about 12-14 s, when the radius of the depositincreases past about half that of the cell, the newlydeposited silver changes abruptly to black, three-dimen-sional clumps hanging on the branches of the previous,2D, ramifieddeposit. Fromthis stageon there is adefiniteslow down in the growth of the deposit.(20) Wagner, C. J. Electrochem. Soc. 1954, 101, 225.
Figure 1. Electrodeposit with an aluminum anode. Silverconcentration 0.05 M. Voltage 5 V.
Figure 2. Electrodeposit with a silver anode. Silver concen-tration 0.05 M. Voltage 5 V.
Figure3. Electrodepositwithapiecewisenickel anode. Silverconcentration 0.05 M. Voltage 5 V.
1768 Langmuir, Vol. 13, No. 6, 1997 Younes et al.

Figure 4a shows the current measured during thedeposition in the cases of aluminum and nickel counterelectrodes. The time derivatives are shown in Figure 4b.For the aluminum anode, the current, as well as itsderivative, are characterized by a steady increase at anaccelerated rate. With nickel there is a clear break inthis behavior at 12 s, and the current increases at amuchslower rate than for aluminum.In order to verify the role of the nickel ions, we added
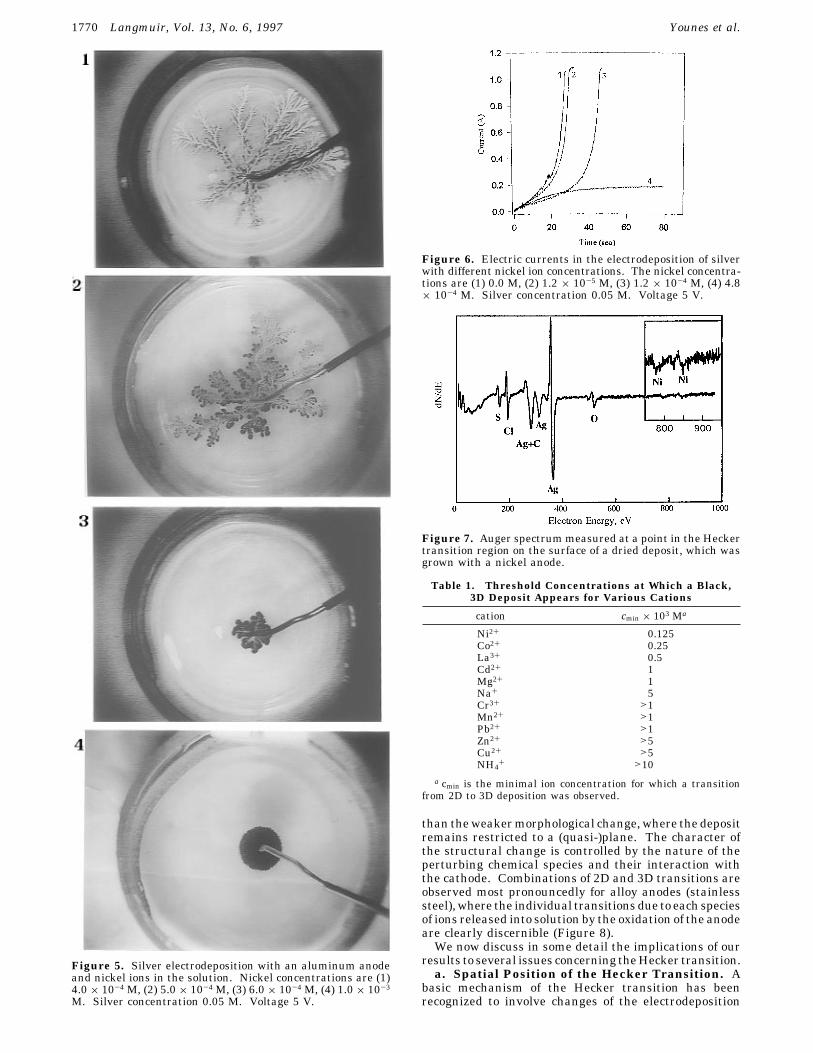
different concentrations of nickel ions directly into thesolution, before initiating the electrodeposition processwith an aluminum anode. Figure 5 shows that in thepresence of nickel ions the morphology of the silverbecomes amixed structure of two-dimensional and three-dimensional growths. As the nickel ion concentrationincreases the morphology of the growth becomes morethree-dimensional, and black, compact patches appear.The dependence on the nickel ion concentration is verysteep: At 4× 10⁻⁴ M the deposit still grows as a ramifiedDLA-like structure, whereas at 6 × 10⁻⁴ M it turns intoa very slowly developing three-dimensional, black clump.At 1 × 10⁻³ M the growth is fully three-dimensional andcompact.In Figure 6we show current-time curves for the growth
in the presence of different nickel ion concentrations. Theslow down of the processes even at the intermediateconcentration of 1.2×10⁻⁴M isapparent, and the extremeeffect of the 4.8× 10⁻⁴M solution is very pronounced. Thetime required for full growth of the deposit is 25, 27, and43s for0, 1.2×10⁻⁵M,and1.2×10-4MNi2+, respectively.For the high nickel concentration the growth is at least10-fold slower.We have carried out similar measurements for various
other ionswhichwere introduceddirectly into the solution.Table 1 gives the concentration at which the depositbecameessentially three-dimensional for each ionstudied.Cobalt ions show an effect similar to that of nickel,although at a 2-fold higher concentration. La+3, Cd+2,
and Mg+2 require 4-10 times higher concentrations forthe same apparent effect. All the other ions we investi-gated affect the deposit only at significantly higherconcentrations,well above the impurity level, as comparedto the reacting silver ion concentration.The influence of the anode material was further
investigated first with a nickel anode at our, otherwise,standard conditions. Then a new cathode was insertedand the anode was replaced by an aluminum strip. Thedeposition was about three times slower than with thealuminum anode and the deposit’s structure changed tothick silver branches with a black envelope. Silver, iron,tin, and lead anodes caused a pronounced morphologicaltransition from a ramified structure to a more compactanddense one. A transition to a black, three-dimensionalstructure was observed for nickel and nickel-containinganodes (stainless steel).The composition of the deposit before and after the
topological transition was studied by Auger electronspectroscopy (AES) for deposition with a nickel anode.After the transition, a clear nickel peak was observed ontopof that of the silver (Figure7). A relativenickel surfaceconcentration of 4.4% was obtained from the intensityratio of the nickel peak to the sum of all other peaksobserved (Ag,O,C,S, andCl), if the intrinsic cross sectionsare taken into account. If oneassumes that thedepositionrates are proportional to the bulk concentrations of theions, this value yields a ∼(2-4) × 10-3 M concentrationfornickel ion. This value is close to thebulk concentrationof nickel at which the deposit was observed to growextremely slowly and to yield a black 3D structure in theexperiments,mentionedabove,where the ionswereaddeddirectly to thesolution (Figure5). Measuring thespectrumafter removing a predetermined layer from the surface byAr sputtering we observed a 30% reduction in the nickelconcentration at a depth of 5 nm, relative to that at thesurface.In the next section we discuss these results in detail
and suggest a quantification of the behavior observed interms of the corresponding Wagner numbers.
DiscussionThereareseveraluniqueaspectsof theresultspresented
here as compared to the previous studies of the Heckereffect. First, noteaminorpoint thatpreviously theHeckereffect was reported mostly for zinc and copper, and thepresent work generalizes the previous findings.An important newaspect is thatwehave demonstrated
that the morphological transitions occur even when thesystem is not artificially confined to a quasi-two-dimensional configuration by retaining walls. The avail-ability of a 3D bulk liquid for ionic migration does notdilute completely the effect of the ions dissolving from theanode. Furthermore, our configuration allows the de-velopment of a richer variety of morphologies than in thethin-cell systems. Specifically, we observe the formationof fully developed three-dimensional structures, whichcannot form in thin cells.In the aqueous solution-air interface employed here,
we observe two types of Hecker transitions. The first ofthese, observed for silver (Figure 2) and iron (Figure 8b)anodes, retains the quasi-two-dimensional nature of thedeposit, and is similar to thosereported inpreviousstudies.Withbothof theseanodes the transitionchangesadelicate,ramifiedpattern intoamore compactdepositwithbroaderfeatures. Thus, the availability of the third dimensiondoesnotnecessarily impose three-dimensional structures.Thesecond typeof transition, observed fornickel (Figure
3) and reported here for the first time, is a much moredrastic transition, adimensionalHecker transition, rather
Figure 4. a. Current-deposition time curve. b. The timederivative of the current versus deposition time. (Dots) nickelanode, (open circles) aluminum anode. Silver concentration0.05 M. Voltage 5 V.
Interfacial Electrodeposition of Silver Langmuir, Vol. 13, No. 6, 1997 1769
than theweakermorphological change,where the depositremains restricted to a (quasi-)plane. The character ofthe structural change is controlled by the nature of theperturbing chemical species and their interaction withthe cathode. Combinations of 2D and 3D transitions areobserved most pronouncedly for alloy anodes (stainlesssteel),where the individual transitionsdue to each speciesof ions released into solution by the oxidation of the anodeare clearly discernible (Figure 8).We now discuss in some detail the implications of our
results to several issues concerning theHecker transition.a. Spatial Position of the Hecker Transition. A
basic mechanism of the Hecker transition has beenrecognized to involve changes of the electrodeposition
Figure 5. Silver electrodeposition with an aluminum anodeand nickel ions in the solution. Nickel concentrations are (1)4.0 × 10⁻⁴ M, (2) 5.0 × 10⁻⁴ M, (3) 6.0 × 10⁻⁴ M, (4) 1.0 × 10⁻³
M. Silver concentration 0.05 M. Voltage 5 V.
Figure 6. Electric currents in the electrodeposition of silverwith different nickel ion concentrations. The nickel concentra-tions are (1) 0.0 M, (2) 1.2 × 10⁻⁵ M, (3) 1.2 × 10⁻⁴ M, (4) 4.8× 10⁻⁴ M. Silver concentration 0.05 M. Voltage 5 V.
Figure 7. Auger spectrummeasured at a point in the Heckertransition region on the surface of a dried deposit, which wasgrown with a nickel anode.
Table 1. Threshold Concentrations at Which a Black,3D Deposit Appears for Various Cations
cation cmin × 103 Ma
Ni2+ 0.125Co2+ 0.25La3+ 0.5Cd2+ 1Mg2+ 1Na+ 5Cr3+ >1Mn2+ >1Pb2+ >1Zn2+ >5Cu2+ >5NH4
+ >10a cmin is the minimal ion concentration for which a transition
from 2D to 3D deposition was observed.
1770 Langmuir, Vol. 13, No. 6, 1997 Younes et al.

process brought about by ionsmigrating inward from theanode. Previous studies indeed established that thetransition occurs at the position where the growing edgeof the depositmeets the front of the ion cloud propagatingfromtheanode. This, in turn, entails a strongdependenceof the spatial position of the transition on the mobilitiesof the anions and cations, which was confirmed andexplained inprevious thin-cell studies.11-13,16 Applicationof the same rationale to the present results is, however,not straightforward, as our cell geometry is significantlydifferent from the that of the thin cells used previously.The possibility of vertical migration, not available in thincells, may change significantly the transport character-istics of the ions and the velocity of the growing edge.Indeed, the deposit rates of growth we observe are about0.2 cm/s, significantly different from the lateral ionmigration velocity expected in a thin cell. In fact, thisvalue is more than two orders of magnitude larger thanthe lateral anionicmigration velocity v, given by v) µV/d,where µ is the anionic mobility and V is the voltage dropacross the cell, and d is the cell radius. For typical valuesof µ ) 5× 10⁻⁴ cm2/V s, V ) 5 V and d ) 3 cm, the anionicdrift velocity is calculated to be only v ≈ 8 × 10⁻⁴ cm/s.In our case this large difference does not allow one tointerpret the position of the Hecker transitions in termsof a simple model based on mobilities only.Furthermore, the position observed for the 2D to 3D
transition due to nickel, when a nickel containing steelanode is used, is different from that observedwhenapurenickel electrode is employed. With the latter the transitionoccursatanearlier stage. Since theconcentrationofnickelions is higher with the pure nickel anode, though the ionvelocities are the same, the different positions of the
transitions clearly indicate a concentration dependenceand not an anion-migration-velocity dependence only.The strong effect of the ion concentration on the strengthof the transition is shown in Figure 5. This demonstratesthat the concentration is an important factor in deter-mining the position of the transition, in addition to ionicmobilities. Khun15 showed a similar dependance on theconcentration of H2O2.b. Nature of the 2D to 3DHecker Transition. We
now proceed to discuss the new, dimensional Heckertransition observed for our geometry. Nickel anodesprovide the most prominent transition of this type. Bychanging the anode material and adding nickel ionsdirectly into the solution, we clearly identified the nickelion as the agent responsible for the transition. AESconfirms this conclusion. Naturally, when nickel ionicsolutions are used, the effect is distributed throughoutthegrowthprocess and isnot confined to thedefinite stagewhen the growing deposit meets an ion front propagatingfrom the anode.Integrating the current-time curve during electro-
deposition with a nickel anode, and assuming that theanodic reaction is 100% nickel dissolution, one cancalculate theamountofnickel ionsproduced in the system.From that we estimate the concentration of the nickelions in the solution, when theirmigrating frontmeets thegrowing cathode, to be in the range (2-8)× 10-4 M. Thisis in very good agreement with the concentration of thenickel ions in solution which were found to cause similartransitions. It is also in good agreement with the valueof (2-4)×10-3Mobtained from theAugermeasurementsat the deposit’s surface, though this value decreasessignificantlywhen deeper layers are probed. It should beemphasized that the effect of nickel is indeed an impurityeffect, as the concentration of the silver ions is about 2orders of magnitude higher.The strong effect observed for the nickel anode cannot
be attributed solely to a simple depletion of the silver ionconcentrationnear thedeposit. Withanaluminumanode,which, like nickel, does not regenerate the silver ionsdepleted by the deposition process, the behavior isaltogether different: the deposit remains fast growingand two-dimensional. Similarly, with iron the 2Dnatureof the deposit is preserved. Even with a silver anode,which does replenish the silver deposited on the cathode,still a transition is observed to a compact pattern, thoughthe 2D nature of the deposit is preserved. The effectobservedwith a silver anodemaybedue to oxygen releasenear the anode, and a low pH front moving away from it.We offer this explanation tentatively, and further workis clearly warranted on this issue.The behavior observed for a nickel anode is related to
its electrochemical properties. It is well-known that theelectrochemical deposition of nickel is a slow irreversibleprocess, characterizedbyexchangecurrentsas lowas10-10
A/cm2, many orders of magnitude smaller than that ofsilver deposition.21 Nickel was consequently categorizedby Piontelli as an ‘inert metal’.22 This suggests that theHecker effect causedbynickel is, in fact, a simple electrodepoisoning: upon contact with the migrating ion frontcoming from the anode, nickel ions adsorb or deposit ontothe cathode, blocking or slowing down any furtherdeposition of either nickel or, by inference, silver. Thepresence of nickel atoms on the silver surface is evidentfrom Auger measurements. This effect can be con-veniently described as a sudden change in the value of the
(21) Bard,A. J.,Ed.Encyclopedia ofElectrochemistry of theElements;Marcel Dekker: New York, 1973.
(22) Tajima, S.; Ogata, M. Electrochim. Acta. 1968, 13, 184.
Figure 8. Electrodeposition of silver with (a) stainless steeland (b) iron anodes. Silver concentration 0.05 M. Voltage 5V.
Interfacial Electrodeposition of Silver Langmuir, Vol. 13, No. 6, 1997 1771

Wagner number20 controlling the electrodeposition proc-ess. We will now discuss the transition in terms of thisnumber.The morphology of a deposit in an electrodeposition
process is determined, in general, by the value of theWagner number20,23 appropriate to the process:
Here Rf is the resistance of the Faradaic reaction and Rsis the ohmic resistance of the solution across a charac-teristic distance of interest.A small Wagner number corresponds to a primary
current distribution.23 Under the conditions of primarycurrent distributions, controlled by the differences in theelectrical resistance in the solution between the variouspoints on the growing cathode, protrusions are amplified,instabilities set in, and the deposits tend to be ramified.The ramification develops over length scales that givesignificant changes in the value of the ohmic resistance.Theprocessesare fast, especially indirectionshaving largeelectric-field gradients. In the absence of a supportingelectrolyte, theyare governedessentially by themigrationof the reacting species toward the electrode.Large Wagner numbers are associated with current
distributions that are controlled by the electrochemicalprocess itself. The process tends to be rather slow, andnot all of the silver ions availablewithin reaction distanceof the cathode fully react at any given time. The depositstend to be rather compact, without any preference for aparticulardirectionover theothers. Whennickelmoietiessettle on the cathode and decrease its reactivity towardsfurther deposition, Rf becomes suddenly very large, dueto the poisoning effect of nickel on the electrodeposition.As judged from the exchange currents for the electro-deposition of silver and nickel, Rf may change by manyorders of magnitude. Rs retains its value, because of thevery low concentrations of nickel ion involved comparedto those of the other ions in the system, so that theWagnernumber becomes large. This change is manifested in thestructural transition from a 2D, ramified, fast and shinydeposit, to a 3D, compact, slow and dark growth. Thechanges in the electrochemical rates are seen very clearlyin the current-time curves and their derivatives (Figure4). At the transition there is a definite slow down in therate of current increase. The change is much moreapparent in the time derivative of the current, which hasa smaller contribution fromtheelectrochemical depositionnormal to the surface. With solutions of nickel thedecrease in the electric currents is evenmore pronounced(Figure 6), as the adsorption of nickel occurs all over thedeposit affecting the whole current distribution and notalmost exclusively at the edges. Thus,we find the conceptof the Wagner number useful in this context also, as itwas for rationalizing various other phenomena in inter-facial deposition of silver, suchas in the effect ofwetting.24
c. The Dependence on the Ion Species. Cobalt isknown to behave electrochemically similar to nickel, andto have a correspondingly small exchange current inelectrodeposition: 10-15-10-11 A/cm2.21 In agreementwith that,we findhere that cobaltbehaves rather similarlyto nickel, though its concentration has to be about twicehigher. Iron ions too exhibit similar electrochemicaldeposition behavior.22 Though we do observe here atransition fromramified tomore compact deposits for ironions, no 2D to 3D transition is observed.Most of the other ions we studied do not show any
significant effect when used at impurity level concentra-tions. This is in contrast with Argoul and Kuhn15,17 whoreport significant effects of alkali ions, at impurity levels,on the electrodeposition of zinc in a rectangular thin cell.In particular we did not observe any effect of alkali metalcations on the deposition of silver.d. Liquid-Liquid Interfaces. Wehave also studied
the electrodeposition of silver at anorganic solvent-waterinterface rather than the air-water interface discussedup to this point. We still observe the nickel-induced 2Dto3DHecker transitionalthough it isnowlesspronounced.There is a darkening of the deposit accompanied by adecreaseof thegrowthvelocityandcurrent. Thedifferencecan be understood by considering the influence of thewetting of the deposit’s edge by the organic phase on thedeposition process.24 With dichloromethane the wettingof the growing edge of the deposit is less efficient, the 2Dprocess is slower, and the thicker and more compactpatterns of a darker color evolve.24 Therefore, the transi-tion under the influence of the nickel ions is less observ-able. They also have less access to the deposit at its edge,due to the reduced wetting. In terms of the Wagnernumber, the process already starts with a larger Rf, i.e.,a large W, than at the water-air interface. Hence thechanges inW and in the appearance of the deposit are lesspronounced.
ConclusionsWe have observed the appearence of a drastic Hecker
transition in the electrodeposition of silver at a 3D bulkinterface, rather than inaquasi-2Dthin cell configuration.The transition involves a topological-dimensional changefrom a 2D, ramified and bright deposit to a 3D, compactand dark one, due to the poisoning of the electrochemicalreactionbynickel ions. Cobalt ions exhibit the sameeffectthough at an increased concentration. The effect isinterpreted in terms of the relevant Wagner number. Aweaker transition from a ramified to a more dense 2Dpattern is observedwith ironandsilver anodes. Theeffectof the concentration on the location of the transition hasbeen discussed. The results suggest that a thresholdconcentration is required for a transition to occur.
Acknowledgment. Wegratefullyacknowledgepartialsupport by the Israel Research Fund administered by theIsraeli Academy of Sciences and Humanities. We thankProf. M. Polak and Dr. N. Froumin for the AESmeasurements.
LA960682X(23) Ibl, N. In Comprehensive Treatise of Electrochemistry; Yeager,E., Bockris, J., Conway, B. E., Sarangapani, S., Eds.; Plenum Press:New York, 1983; Vol. 6, p 239. (24) Zeiri, L.; Efrima, S.; Deutsch, M. Langmuir 1996, 12, 5180.
W ) Rf/Rs
1772 Langmuir, Vol. 13, No. 6, 1997 Younes et al.