two-volume dynamic ct pulmonary perfusion: contrast timing
TRANSCRIPT
Two-volume Dynamic CT Pulmonary Perfusion:Contrast Timing Optimization Yixiao Zhao
University of California, IrvineLogan Hubbard
University of California, IrvineShant Malkasian
University of California, IrvinePablo Abbona
University of California, IrvineSabee Molloi ( [email protected] )
University of California, Irvine
Research Article
Keywords: Tomography, X-Ray Computed, Lung, Perfusion, Contrast Media
Posted Date: April 5th, 2021
DOI: https://doi.org/10.21203/rs.3.rs-158655/v2
License: This work is licensed under a Creative Commons Attribution 4.0 International License. Read Full License

1
Two-Volume Dynamic CT Pulmonary Perfusion: Contrast
Timing Optimization
Yixiao Zhao, M.S. , Logan Hubbard, Ph.D., Shant Malkasian,B.S., Pablo Abbona, M.D.,
Sabee Molloi, Ph.D.*
Department of Radiological Sciencesa, University of California, Irvine,
Irvine, California, 92697, USA
Manuscript Type: Original Research
Total Word Count: 3,000
Address for Correspondence:
Sabee Molloi, Ph.D.
Department of Radiological Sciences, Medical Sciences I, B-140
University of California, Irvine, CA 92697
Telephone: (949) 824-5904, Fax: (949) 824-8115
E-mail: [email protected]

2
Abstract
Purpose: To develop and validate an optimal timing protocol for a low-radiation-dose CT pulmonary perfusion
technique using only two volume scans.
Methods: A total of 24 swine (48.5±14.3 kg) underwent contrast-enhanced dynamic CT. Multiple contrast
injections were made under different pulmonary perfusion conditions, resulting in a total of 147 complete
pulmonary arterial input functions(AIFs). Using all the AIF curves, an optimal contrast timing protocol was
developed for a first-pass, two-volume dynamic CT perfusion technique (one at the base and the other at the peak of
AIF curve). A subset of 14 swine with 70 CT acquisitions were used to validate the prospective timing protocol. The
prospective two-volume perfusion measurements were quantitatively compared to the previously validated
retrospective perfusion measurements with t-test, linear regression and Bland-Altman analysis.
Results: The pulmonary artery time-to-peak ( 𝑇𝑃𝐴) was related to one-half of the contrast injection duration( 𝑇𝐼𝑛𝑗2 )
by 𝑇𝑃𝐴 = 1.06 𝑇𝐼𝑛𝑗2 + 0.90 (r=0.97). The prospective two-volume perfusion measurements (PPRO) were related to the
retrospective measurements (PRETRO) by PPRO=0.87PRETRO+0.56 (r=0.88). The CT dose index and size-specific dose
estimate of the two-volume CT technique were estimated to be 28.4 and 47.0mGy, respectively.
Conclusion: The optimal timing protocol can enable an accurate, low-radiation-dose two-volume dynamic CT
perfusion technique.
Keywords: Tomography, X-Ray Computed; Lung; Perfusion; Contrast Media

3
Introduction
Computed tomography (CT) has enabled the non-invasive quantification of pulmonary perfusion allowing
for the assessment of pulmonary embolism and pulmonary hypertension 1-5. Existing dynamic CT perfusion
techniques require the entire contrast pass curve over many cardiac cycles for perfusion measurement, resulting in
high radiation dose 2,3,6-8. Moreover, the pulmonary perfusion measured by such techniques is known to be
underestimated due to the use of small tissue volumes for measurement 9-11. Although dual-energy CT iodine map is
also used to depict pulmonary perfusion defects, it has limited contrast-to-noise ratio and cannot provide absolute
pulmonary blood flow 12-15. Hence, an accurate, low-dose dynamic CT perfusion technique is necessary for
improved physiological assessment of pulmonary disease.
Fortunately, previous studies have demonstrated that accurate cardiac and pulmonary perfusion measurement
is feasible with a first-pass analysis (FPA) technique using only two volume scans9,10,16: one at the base (V1) and
one at the peak (V2) of the arterial input function (AIF). Nevertheless, these prior validations required the entire AIF
curve and retrospectively down-sampled to two volume scans for blood flow measurement. Hence, a timing protocol
for the true prospective implementation of two-volume FPA technique remains necessary, where such protocol can
also account for different hemodynamic conditions and cardiac outputs 17,18.
Thus, the purpose of this study is to develop an optimal timing protocol for the prospective two-volume FPA
dynamic CT pulmonary perfusion technique. The central hypothesis is that the time interval between the two volume
scans can be pre-determined using the contrast injection parameters and an empirical time constant. Finally, using
the proposed timing protocol, the accuracy of the two-volume prospective FPA dynamic CT perfusion technique
was assessed and compared to the previously validated retrospective FPA perfusion technique 16.

4
Methods
General Method: The study was approved by the Institutional Animal Care and Use Committee (IACUC, Protocol
Number: AUP-18-191) at University of Irvine, California. A total of 24 male Yorkshire swine (48.5±14.3 kg) were
used with 154 contrast injections, where seven were excluded due to injection failures (Fig 1). In total, 147
successful contrast injections were used to retrospectively develop an optimal timing protocol for the two-volume
perfusion technique (Fig 1). The time-to-peak delay between V1 and V2 was predicted using the contrast injection
duration and a dispersion time constant. Finally, using the predicted time-to-peak, prospective acquisition of V1 and
V2 was simulated in a subset of fourteen swine with 70 contrast injections, where 77 injections were excluded for
the lack of pre-contrast images to emulate bolus-tracking in the right ventricle. The accuracy of the two-volume
prospective technique was compared to the previously validated retrospective perfusion measurement 16. All
experimental data was prospectively acquired by all authors between March 2016 and December 2017 and was
retrospectively analyzed between June 2018 and July 2019. Y.Z., L.H. and Sh.M. conducted the data analysis, and a
radiologist with more than 15 years of clinical experience (P.A.) conducted the surgical and interventional
procedures.
Animal Preparation: All 24 swine were premedicated with Telazol (4.4 mg/kg), Ketamine (2.2 mg/kg) and
Xylazine (2.2 mg/kg) then intubated (Mallinckrodt, tube 6.0 - 8.0 mm, Covidien, Mansfield, MA). Anesthesia was
maintained with 1.5% - 2.5% Isoflurane (Baxter, Deerfield, IL) in oxygen via mechanical ventilation (Surgivet,
Norwell, MA, and Highland Medical Equipment, Temecula, CA). Two femoral venous and one femoral arterial
introducer sheaths (5-Fr AVANTIR, Cordis Corporation, Miami Lakes, FL) were placed for intravenous contrast
medium injection, fluid administration, and arterial pressure monitoring, respectively. An introducer sheath and
Swan-Ganz catheter were then placed into a distal pulmonary arterial branch, via the jugular vein, under
fluoroscopic guidance for the eventual induction of balloon occlusion. The cardiac output was varied by producing
balloon occlusion in the left caudal lobe at different locations of the pulmonary artery. On average six pulmonary
perfusion studies were performed during each experiment. At the conclusion of each experiment, all animals were
euthanized with saturated KCI.
CT Imaging Protocol: Contrast material (Isovue 370, Bracco Diagnostics, Princeton, NJ) was injected followed by a
saline flush (Empower CTA, Acist Medical Systems, Eden Prairie, MN). Different injection rates and volumes were

5
used as shown in Table 1. ECG-gated dynamic scanning was then performed with a 320-slice CT scanner (Aquilion
One, Canon America Medical Systems, Tustin, CA) for approximately 30 cardiac cycles during a ventilator-
controlled inspiratory breath hold. The following scan parameters were used: tube voltage, 100 kVp; tube current,
200mA; detector collimation, 320 x 0.5 mm; volume scanning mode; gantry rotation time, 0.35 seconds; slice
thickness, 0.5 mm; scan field-of-view, 240-400 mm; voxel raster, 512×512; and a FC07 soft tissue reconstruction
kernel with AIDR3D iterative reconstruction. A 20-minute time delay was used between all acquisitions to allow
for adequate contrast material recirculation and redistribution.
Bolus Characterization and Time-to-Peak Delay Estimation: Bolus tracking is commonly used to detect the
contrast arrival time within a region of interest in a monitoring artery. A fixed time delay is then used to estimate the
time to peak of the contrast bolus. In this study, we will use a patient-specific time to peak estimation. Prior to
recirculation phase of the contrast agent bolus passage, the geometry of the arterial input function (AIF) is
predominantly determined by the contrast bolus injection geometry and the bolus dispersion within the circulatory
system, given a short contrast injection duration(< 15 seconds) 18,19. Specifically, the initial approximate rectangular
geometry of an undiluted contrast bolus injection will dilute and disperse into a contrast pass curve, where the area
under the curve remains conserved and the width of the curve remains proportional to the amount of the contrast
volume injected at a fixed rate20,21. Moreover, despite contrast mixing and hemodynamic perturbation, the dispersion
of the bolus primarily occurs at its temporal edges or tails; hence, the center of the AIF has the maximal contrast
attenuation. As such, we investigated the possibility of relating one-half the contrast bolus injection time (𝑻𝑰𝒏𝒋 𝟐⁄ )
and the time-to-peak delay (𝑻𝑷) of the AIF (Fig 2). In this study, such a relation was derived using the known
contrast injection duration and the time-to-peak delay from the AIF, as described in Eq 1. An empirically derived
dispersion delay (𝐷𝑥) time constant was also introduced to describe the degree of the contrast bolus mixing. Such a
factor is proportional to the physical distance between the contrast injection site and vessel of interest used for the
AIF generation (Eq 1)
𝑇𝑃 = 𝛼 × 𝑻𝒊𝒏𝒋2 + 𝐷𝑥 (1)
where 𝜶 is the coefficient of the relation between one-half the injection time (𝑻𝑰𝒏𝒋 𝟐⁄ ) and the time-to-peak (𝑻𝑷), 𝑫𝒙 is the dispersion delay time constant.

6
Data Pre-Processing: The images from each contrast-enhanced CT acquisition were first registered using a non-
rigid algorithm22. Regions-of-interest were placed in the right ventricle, pulmonary artery, and descending aorta to
generate arterial input functions (AIFs, Fig 2). Next, a gamma-variate fitting (LSQCurveFit; Matlab 2013a,
MathWorks) was performed on each dataset to generate smooth continuous AIF curves. Next, the 3D lung
parenchyma was semi-automatically segmented using a standard commercial software (ViTAL Images, Lung CT,
Pulmonary Analysis Workflow; Canon Medical Systems) and was used for the whole-lung FPA perfusion
measurement. Further, 3D-segmentted binary masks of approximately 800-1400 mm3 were generated to measure
regional perfusion. In summary, nine segments were assessed for each animal, including one segment for the left
cranial lobe, left lingula lobe, right cranial lobe, right middle lobe, and accessory lobe; two segments for the left and
right caudal lobes.
Optimal Retrospective Protocol: Using the continuous AIF curve by the gamma variate fitting, the optimal
acquisition timing for the baseline volume scan (V1) was defined as the peak of the second derivative, indicating the
AIF curve starts to rise (Fig 2). The optimal acquisition timing for the second volume scan (V2) was then defined as
the true peak of the gamma variate fit. The time-to-peak delay between V1 and V2 was then computed and then
averaged over multiple acquisitions in each animal. The average time-to-peak delay was related to one-half of the
contrast injection time through regression analysis for both pulmonary artery and descending aorta.
Prospective Protocol Simulation: Bolus-tracking (SureStart, Aquilion One, Canon Medical Systems, Tustin, CA)
was simulated for the prospective acquisition of the first volume scan (V1) at the base of the pulmonary artery AIF.
There is a minimal time delay of approximately 2 seconds between trigger during bolus-tracking and acquisition of
the first volume scan 18. Therefore, in order to acquire V1 early during pulmonary artery contrast enhancement, the
monitoring region-of-interest was placed in the right ventricle (RV) instead of the pulmonary artery to acquire V1 at
low contrast enhancement in pulmonary artery (Fig 2). Further, in order to define the baseline enhancement of the
blood pool, a minimum of three pre-contrast images were used to emulate bolus-tracking. Multiple offset thresholds
above the baseline, e.g. 40, 60, 80, 100, 120 and 140 HU, were compared to optimize the acquisition of V1. In
addition, the second volume scan (V2) was automatically chosen using the predicted time-to-peak delay that was
defined in Eq1. Hence, the prospective timing protocol simulation is summarized in Eq2 and Eq3 as: 𝑡𝑉1 = 𝑡𝑡𝑟𝑖𝑔𝑔𝑒𝑟 + 𝑇𝐷 (2)

7
𝑡𝑉2 = 𝑡𝑉1 + 𝑇𝑃 (3)
where 𝒕𝑽𝟏 and 𝒕𝑽𝟐 are the acquisition time of the V1 and V2, 𝒕𝒕𝒓𝒊𝒈𝒈𝒆𝒓 is the triggering time determined by bolus-
tracking in RV, 𝑻𝑫 is the transition delay between the trigger of bolus-tracking and the acquisition of V1, and 𝑻𝑷 is
the predicted time-to-peak between the trigger and the peak of the AIF (Fig 2).
Two-volume FPA CT Perfusion Measurement: First-pass analysis has previously been used for blood flow
measurement 23,24. Assuming no contrast leakage over the measurement period ([𝑡𝑉1, 𝑡𝑉2]), the whole-lobe
compartment is used to calculate the integrated contrast mass change in the perfusion bed (𝜟𝑴𝒄/∆𝒕) between V1 and
V2 9,16. The average input contrast concentration (𝑪𝒊𝒏) of the pulmonary artery is also calculated between V1 and V2
(Fig 3). Thus, the blood flow (𝑸𝒂𝒗𝒆) measurement is represented by 9,16:
𝑸𝒂𝒗𝒆 = 𝟏𝑪𝒊𝒏 𝜟𝑴𝒄∆𝑡 (4)
where 𝐶𝑖𝑛 is the average input concentration, 𝜟𝑴𝒄/∆𝒕 is the rate of contrast mass change between 𝑡𝑉1 and 𝑡𝑉2, ∆𝑡 = 𝑡𝑉2 − 𝑡𝑉1. Finally, the regional perfusion of each 3D-segment is calculated and compared between the prospective
and the reference retrospective FPA perfusion techniques, where the retrospective FPA was previously validated
against fluorescent microspheres16.
Cardiac Output Estimation: : Since the pulmonary circulation carries the entire cardiac output (CO) from the right
ventricle to the supply the lung, CO can be approximately estimated by the total pulmonary blood flow 25 (Eq.6).
Based on Eq.4, the average contrast concentration change (𝜟𝑴𝒄) within the entire compartment is proportional to
the average pulmonary blood flow ( 𝑸𝒂𝒗𝒆), the contrast concentration change per voxel (𝜟𝑴𝒙,𝒚,𝒛) can be used to
define pulmonary blood flow on a voxel-by-voxel basis (𝑸𝒙,𝒚,𝒛) as: 𝑸𝒙,𝒚,𝒛 = 𝑸𝒂𝒗𝒆 ∆𝑴𝒙,𝒚,𝒛𝜟𝑴𝒄 (5)
Thus, the total pulmonary blood flow ( 𝑸𝒑𝒂), which is also the cardiac output (CO), is the summation of blood flow
into the segmented voxels in the lung tissue::
𝑪𝑶 ≈ 𝑸𝒑𝒂 = ∑ 𝑸𝒙,𝒚,𝒛𝑛𝑘=0 (6)

8
Radiation Dose: The CT dose index (CTDIvol32 , mGy) and the dose-length product (DLP, mGy ∙ cm) were recorded
for each two-volume acquisition. Size-specific dose estimates(SSDE, mGy) were also calculated to account for the
effective diameter of each swine26.
Statistical Approach: For the time-to-peak estimation, the empirical time-to-peak delays in the pulmonary artery
and descending aorta were related to one-half the contrast injection time through linear regression analysis, where
the root-mean-square-error (RMSE) and root-mean-square-deviation (RMSD) of the function were also calculated.
The V2 acquisition time and contrast enhancement determined by the prospective protocol simulation were then
compared with the actual peak time and the actual peak enhancement using paired sample t-testing (SPSS, version
22, IBM, Armonk, NY). Finally, simulated prospective two-volume perfusion measurements were quantitatively
compared to the corresponding retrospective perfusion measurements through regression, Bland-Altman, RMSE,
RMSD, and Lin’s concordance correlation coefficient (CCC).

9
Results
General Data and Radiation Dose Exposure: A total of 24 swine with an average weight of 48.5±14.3kg (25–91kg)
and an average heart rate of 89.5±15.0 bpm were used for this study. In total, 147 successful injections were
included for the time-to-peak prediction study (Fig 1). Overall, the contrast injection durations ranged from 2 to 15
seconds and the cardiac outputs ranged from 1.4 to 5.1 L/min. The average CTDIvol32 and SSDE for each dynamic
perfusion CT acquisition were 258.2 and 427.3mGy, respectively. For prospective perfusion measurement using
only two volumes, the average CTDIvol32 and SSDE were estimated to be 28.4 and 47.0mGy, respectively.
Time-to-Peak Validation: The time-to-peak in the pulmonary artery (TPA) and descending aorta (TA) were related to
one-half the contrast injection time by 𝑇𝑃𝐴 = 1.06 𝑇𝐼𝑛𝑗2 + 0.90 (r=0.97, RMSE=0.44s, RMSD=0.41s) and 𝑇𝐴 =1.14 𝑇𝐼𝑛𝑗2 + 1.91 (r=0.96, RMSE=0.82s, RMSD=0.59s), respectively (Fig 4) . The intercepts correspond to organ-
specific dispersion delay time constants (𝐷𝑥 in Eq1).
Prospective Protocol Simulation: A total of 70 CT acquisitions from 14 swine were used for the prospective
perfusion measurements with bolus-tracking simulation. For each of the triggering offsets, the pulmonary artery
enhancement and acquisition time of the simulated volume scans were compared to the optimal volume scans, as
shown in Table 2 and Table 3. To acquire V1 at a relatively low contrast enhancement, the triggering offset of
60HU in the RV was used in this prospective perfusion validation.
Two-Volume FPA CT Perfusion Measurement: The perfusion assessments were based on a 9-segment model with
a total of 540 lung segments. The mean perfusion of the retrospective and the simulated prospective measurements
were 8.43±4.54 ml/min/g and 7.84±4.47 ml/min/g (p<0.001), respectively. The simulated prospective FPA
perfusion (PPRO) were related to reference retrospective perfusion (PRETRO) measurements by PPRO=0.87PRETRO +0.56
(Pearson’s r=0.88, RMSD=0.85 ml/min/g, RMSE=2.29 ml/min/g), with a concordance correlation coefficient of
0.87 (Fig 5a). The corresponding Bland-Altman analyses is also displayed in Fig 5b. The linear regression results of
perfusion measurements for individual lobes are shown in Table 4. There is no evident bias between lobes except
for a larger error in the accessory lobe caused by the highly attenuating iodine in the vena cava. Representative
examples of prospective two-volume FPA perfusion maps and the V2 image for one acquisition are shown in Fig 6.
The perfusion defect by the balloon occlusion can be found in the distal left caudal lobe.

10
Discussion
In this study, the time-to-peak delay of the pulmonary and aortic AIFs were evaluated in animals with a range
of body weights (25–91 kg), contrast doses (20-100mL), injection durations (2-15 seconds), and cardiac outputs
(1.4-5.1 L/min). The results indicate that the injection duration is the most significant injection-related parameter
impacting the bolus time-to-peak, particularly in the case of short contrast injection duration. Furthermore, the
regional perfusion results show good correlation between the simulated prospective FPA measurements and the
optimal retrospective FPA measurements. Such findings indicate that the proposed prospective timing protocol can
potentially be used for accurate, prospective, two-volume FPA perfusion measurement.
Existing dynamic CT perfusion techniques, such as the maximum slope model and the deconvolution
model, require the entire contrast pass curve for perfusion measurement resulting in a high effective radiation dose
3,7,27-31. Previous reports have shown that the reduction of temporal sampling frequency reduces the accuracies of
these current techniques32. Although previous reports have shown that the FPA technique can accurately measure
the perfusion using only two volume scans as validated using microspheres 9,16, the prospective acquisition of the
two volume scans is challenging. With the knowledge of contrast timing information in advance, the prospective
implementation of the two-volume perfusion technique can accurately measure the pulmonary perfusion while
substantially reducing the radiation dose.
In addition, our results demonstrate that the injection duration can be used to predict the time-to-peak for
different injection rates and volumes, and are therefore in agreement with a previous report indicating that the
scanning delay for the aortic peak is primarily affected by the injection duration18. To generalize our timing
prediction theory to clinical patients with different cardiac outputs, different levels of pulmonary arterial occlusions
were generated in our swine model, resulting in a substantial decrease of cardiac outputs. Fortunately, the time-to-
peak delays under different scenarios were all closely related to one-half of the injection duration (Pearson’s
r=0.97), indicating the robustness of the timing theory. Such results may also have important implications for
optimal CT pulmonary angiography (CTPA), as the optimal time-to-peak delay can be predicted using the contrast
injection time interval. Although further validation remains necessary, the proposed time-to-peak prediction may
result in an improved contrast opacification in CTPA and visualization of the vasculature.
Finally, previous studies have shown that pulmonary perfusion assessed with dual-energy CT (DECT) iodine
density maps can be used for the clinical risk stratification of patients with acute pulmonary embolism12,33. Another

11
study reported that the use of DECT perfusion can be a better indicator for balloon pulmonary angioplasty in
patients with chronic thromboembolic pulmonary hypertension 15. A different study has shown that subtraction CT
has comparable diagnostic performance to DECT in detection of pulmonary embolism13. However, both subtraction
CT and DECT do not measure absolute perfusion. On the other hand, the proposed two-volume perfusion quantifies
absolute perfusion (in ml/min/g). Quantitative absolute perfusion has the potential for improved assessment of the
degree of perfusion defect. Hence, the dynamic two-volume perfusion technique can potentially be an alternative to
the standard dynamic perfusion CT by providing functional assessment of pulmonary diseases, such as pulmonary
embolism and chronic thromboembolic pulmonary hypertension, at a reduced radiation dose.
This study has several limitations. First, most of the swine used in the study were relatively small as
compared to the average size of a patient. Additional studies may be necessary for larger patient sizes (> 90kg) to
further validate the dispersion delay time constant robustness. Second, only 70 contrast injections were used for the
two-volume prospective perfusion validation due to the insufficient pre-contrast images to emulate bolus-tracking.
This is due to the fact that the study was initially designed to investigate the time-to-peak delay in the pulmonary
artery and aorta; hence, the scan was started 5s later after the contrast injection, which was too late to acquire pre-
contrast images for some of the studies. With the proposed prospective acquisition protocol, this issue can be easily
addressed by starting the bolus-tracking and contrast injection simultaneously and triggering in the right ventricle.
Third, retrospective FPA perfusion measurement was used for validation of the simulated prospective two-volume
perfusion measurement. However, the accuracy of the retrospective FPA perfusion technique has previously been
validated using fluorescent microspheres as the reference standard16. Fourth, although the time-to-peak prediction
has not been validated in patients with various cardiopulmonary conditions (such as acute pulmonary embolism,
pulmonary hypertension, and heart failure), the prediction was tested following different levels of occlusion in the
pulmonary artery of a swine model. Additionally, such timing protocol remained robust over a wide range of cardiac
outputs. Fourth, since the scanner transition delay time is manufacturer-specific, the bolus tracking trigger location
and threshold have not been optimized for other CT scanners. A longer scanner transition delay after triggering may
result in a late acquisition of V1. This could be a potential reason for the slight underestimation of perfusion using
the simulated prospective two-volume protocol. Alternatively, the contrast arrival time can be pre-determined using
a diluted test bolus acquisition 34, although the contrast and radiation dose will be slightly increased. The simulated
pharmacokinetic global circulation models can also be helpful in prediction of contrast timing 35. Finally, the

12
optimal prospective timing protocol was developed and assessed empirically; hence, the diagnostic performance of
the two-volume FPA pulmonary perfusion technique with simultaneous CTPA (using the V2 volume scan), will
require further studies.
In conclusion, an optimal timing protocol for a low-dose, two-volume dynamic CT pulmonary perfusion
technique was retrospectively validated in 24 swine using pulmonary arterial AIF characterization and a first-pass
analysis perfusion technique. Using dynamic bolus-tracking and time-to-peak delay estimation, the optimal timing
protocol resulting in robust acquisition of the first volume scan at the base of the AIF and the second volume scan at
the peak of AIF. Such finding enables a practical, low-dose, two-volume dynamic CT perfusion technique that may
potentially act as a perfusion-based biomarker for stratifying the severity, prognosis, and follow-up in patients with
pulmonary embolism and other pulmonary pathologies.

13
References
1 Ippolito, D. et al. Feasibility of perfusion CT technique integrated into conventional 18FDG/PET-
CT studies in lung cancer patients: clinical staging and functional information in a single study.
Eur J Nucl Med Mol Imaging 40, 156-165, doi:10.1007/s00259-012-2273-y (2013).
2 Dakin, J. H., Evans, T. W., Hansell, D. M. & Hoffman, E. A. Regional Pulmonary Blood Flow in
Humans and Dogs by 4D Computed Tomography. Academic Radiology 15, 844-852,
doi:https://doi.org/10.1016/j.acra.2007.12.019 (2008).
3 Lossnitzer, D., Baumann, S. & Henzler, T. Dynamic four-dimensional CT angiography for the
assessment of pulmonary perfusion in an adult patient with pulmonary artery occlusion and
major aortopulmonary collateral after multistage repair of Fallot's Pentalogy. Cardiology in the
young 27, 1212-1213, doi:10.1017/s1047951117000610 (2017).
4 Moradi, F., Morris, T. A. & Hoh, C. K. Perfusion Scintigraphy in Diagnosis and Management of
Thromboembolic Pulmonary Hypertension. Radiographics 39, 169-185,
doi:10.1148/rg.2019180074 (2019).
5 Mirsadraee, S. et al. Dynamic (4D) CT perfusion offers simultaneous functional and anatomical
insights into pulmonary embolism resolution. Eur J Radiol 85, 1883-1890,
doi:10.1016/j.ejrad.2016.08.018 (2016).
6 Chon, D., Beck, K. C., Larsen, R. L., Shikata, H. & Hoffman, E. A. Regional pulmonary blood flow in
dogs by 4D-X-ray CT. J Appl Physiol (1985) 101, 1451-1465, doi:10.1152/japplphysiol.01131.2005
(2006).
7 Fuld, M. K. et al. Pulmonary perfused blood volume with dual-energy CT as surrogate for
pulmonary perfusion assessed with dynamic multidetector CT. Radiology 267, 747-756,
doi:10.1148/radiol.12112789 (2013).
8 Larici, A. R. et al. First-pass perfusion of non-small-cell lung cancer (NSCLC) with 64-detector-row
CT: a study of technique repeatability and intra- and interobserver variability. La radiologia
medica 119, 4-12, doi:10.1007/s11547-013-0300-0 (2014).
9 Hubbard, L. et al. Comprehensive Assessment of Coronary Artery Disease by Using First-Pass
Analysis Dynamic CT Perfusion: Validation in a Swine Model. Radiology 286, 93-102,
doi:10.1148/radiol.2017162821 (2018).
10 Hubbard, L. et al. Functional assessment of coronary artery disease using whole-heart dynamic
computed tomographic perfusion. Circ Cardiovasc Imaging 9, 1-8,
doi:10.1161/circimaging.116.005325 (2016).
11 Berrington de Gonzalez, A. & Darby, S. Risk of cancer from diagnostic X-rays: estimates for the
UK and 14 other countries. Lancet 363, 345-351 (2004).
12 Kay, F. U. et al. Quantitative Dual-Energy Computed Tomography Predicts Regional Perfusion
Heterogeneity in a Model of Acute Lung Injury. J Comput Assist Tomogr 42, 866-872,
doi:10.1097/rct.0000000000000815 (2018).
13 Grob, D. et al. Iodine Maps from Subtraction CT or Dual-Energy CT to Detect Pulmonary Emboli
with CT Angiography: A Multiple-Observer Study. Radiology 292, 197-205,
doi:10.1148/radiol.2019182666 (2019).
14 Hoey, E. T. et al. Dual-energy CT angiography for assessment of regional pulmonary perfusion in
patients with chronic thromboembolic pulmonary hypertension: initial experience. AJR Am J
Roentgenol 196, 524-532, doi:10.2214/ajr.10.4842 (2011).
15 Koike, H. et al. Quantification of lung perfusion blood volume (lung PBV) by dual-energy CT in
patients with chronic thromboembolic pulmonary hypertension (CTEPH) before and after
balloon pulmonary angioplasty (BPA): Preliminary results. Eur J Radiol 85, 1607-1612,
doi:10.1016/j.ejrad.2016.06.016 (2016).
14
16 Zhao, Y., Hubbard, L., Malkasian, S., Abbona, P. & Molloi, S. Dynamic pulmonary CT perfusion
using first-pass analysis technique with only two volume scans: Validation in a swine model. Plos
One 15, e0228110, doi:10.1371/journal.pone.0228110 (2020).
17 Bae, K. T. et al. Contrast enhancement in cardiovascular MDCT: effect of body weight, height,
body surface area, body mass index, and obesity. AJR Am J Roentgenol 190, 777-784,
doi:10.2214/ajr.07.2765 (2008).
18 Bae, K. T. Intravenous contrast medium administration and scan timing at CT: considerations
and approaches. Radiology 256, 32-61, doi:10.1148/radiol.10090908 (2010).
19 Cademartiri, F., van der Lugt, A., Luccichenti, G., Pavone, P. & Krestin, G. P. Parameters affecting
bolus geometry in CTA: a review. J Comput Assist Tomogr 26, 598-607 (2002).
20 Garcia, P. et al. Hepatic CT enhancement: effect of the rate and volume of contrast medium
injection in an animal model. Abdom Imaging 24, 597-603, doi:1680 [pii] (1999).
21 Han, J. K. et al. Factors influencing vascular and hepatic enhancement at CT: experimental study
on injection protocol using a canine model. J Comput Assist Tomogr 24, 400-406, doi:00004728-
200005000-00008 [pii] (2000).
22 Modat, M. et al. Fast free-form deformation using graphics processing units. Comput Methods
Programs Biomed 98, 278-284, doi:10.1016/j.cmpb.2009.09.002 (2010).
23 Molloi, S., Bednarz, G., Tang, J., Zhou, Y. & Mathur, T. Absolute volumetric coronary blood flow
measurement with digital subtraction angiography. Int J Cardiovasc Imaging 14, 137-145 (1998).
24 Molloi, S., Zhou, Y. & Kassab, G. S. Regional volumetric coronary blood flow measurement by
digital angiography: in vivo validation. Acad Radiol 11, 757-766, doi:10.1016/j.acra.2004.04.002
(2004).
25 Levitzky, M. G. in Pulmonary Physiology, 8e (The McGraw-Hill Companies, 2013).
26 Boone, J. et al. Size-specific dose estimates (SSDE) in pediatric and adult body CT examinations:
report of AAPM task group 204. College Park, Md: American Association of Physicists in Medicine
(2011).
27 Ohno, Y. et al. Differentiation of Malignant and Benign Pulmonary Nodules with Quantitative
First-Pass 320-Detector Row Perfusion CT versus FDG PET/CT. Radiology 258, 599-609 (2011).
28 Ohno, Y. et al. Solitary pulmonary nodules: Comparison of dynamic first-pass contrast-enhanced
perfusion area-detector CT, dynamic first-pass contrast-enhanced MR imaging, and FDG PET/CT.
Radiology 274, 563-575, doi:10.1148/radiol.14132289 (2015).
29 Nguyen-Kim, T. D., Frauenfelder, T., Strobel, K., Veit-Haibach, P. & Huellner, M. W. Assessment
of bronchial and pulmonary blood supply in non-small cell lung cancer subtypes using computed
tomography perfusion. Invest Radiol 50, 179-186, doi:10.1097/rli.0000000000000124 (2015).
30 Yuan, X. et al. Differentiation of malignant and benign pulmonary nodules with first-pass dual-
input perfusion CT. Eur Radiol 23, 2469-2474, doi:10.1007/s00330-013-2842-x (2013).
31 Shan, F. et al. Differentiation between malignant and benign solitary pulmonary nodules: use of
volume first-pass perfusion and combined with routine computed tomography. Eur J Radiol 81,
3598-3605, doi:10.1016/j.ejrad.2012.04.003 (2012).
32 Ng, C. S. et al. Effect of Sampling Frequency on Perfusion Values in Perfusion CT of Lung Tumors.
American Journal of Roentgenology 200, W155-W162, doi:10.2214/ajr.12.8664 (2013).
33 Kong, W. F., Wang, Y. T., Yin, L. L., Pu, H. & Tao, K. Y. Clinical risk stratification of acute
pulmonary embolism: comparing the usefulness of CTA obstruction score and pulmonary
perfusion defect score with dual-energy CT. Int J Cardiovasc Imaging 33, 2039-2047,
doi:10.1007/s10554-017-1188-x (2017).
34 Hubbard, L., Malkasian, S., Zhao, Y., Abbona, P. & Molloi, S. Contrast-to-Noise Ratio
Optimization in Coronary Computed Tomography Angiography: Validation in a Swine Model.
Acad Radiol, doi:S1076-6332(18)30340-4 [pii]

15
10.1016/j.acra.2018.06.026 (2018).
35 Higaki, T. et al. Effect of contrast material injection duration on arterial enhancement at CT in
patients with various cardiac indices: Analysis using computer simulation. Plos One 13,
e0191347, doi:10.1371/journal.pone.0191347 (2018).

16
Author Contribution Statement
All experimental data was prospectively acquired by all authors between March 2016 and December 2017 and was
retrospectively analyzed between June 2018 and July 2019. All authors conducted the experiments and data
acquisition. Three authors (Y.Z., L.H., S. Malkasian.) with more than 3 years of medical imaging research
experience conducted the data analysis. One author (P.A.), with more than 19 years of clinical experience, helped
with the surgical and interventional procedures. S.M. conceived the original idea. Y.Z. wrote the manuscript and all
authors provided critical feedback and helped shape the research, analysis and manuscript.

17
Table and Figure Legends
Fig 1: Flowchart of the study. N = number of swine.
Fig 2: Prospective imaging protocol and the corresponding arterial input functions. Top, imaging protocol. 𝐓𝐢𝐧𝐣 is the contrast injection duration, 𝐓𝐃 is the scanner-specific transition delay (2s), and 𝐓𝐏 is the pre-defined time-to-
peak delay. Bottom, right ventricle (RV) and pulmonary artery (PA) arterial input functions (AIF). 𝐭𝐕𝟏 and 𝐭𝐕𝟐 are
the acquisition time of the first volume scan (V1) and the second volume scan (V2). The baseline volumes used to
emulate the bolus-tracking are shown in blue circles.
Fig 3: Two-volume FPA perfusion protocol. The integrated contrast enhancement change (∆Mc/∆t) within the
lung compartment is measured by the tissue time attenuation curve (TAC, blue line). The average input
concentration (Cin) is estimated from the pulmonary arterial input function (AIF, black line) at V1 and V2. Tp is the
time-to-peak delay.
Fig 4: Time-to-peak delays in the pulmonary artery and descending aorta. Gamma-fit ideal time-to-peak delays
were compared to the one-half injection time in all experimental animal data. Pulmonary arterial time-to-peak
(black) and the aortic time-to-peak (red) are paralleled with different interceptions (dispersion factor). Gamma fit
time-to-peak (TPA, TA) is defined as the time between the peak of the second derivative of the gamma fit and the true
peak of the gamma fit, respectively. TInj: contrast injection time; RMSE: root-mean-square-error; RMSD: root-
mean-square-deviation; r: Pearson correlation coefficient.
Fig 5: (a) Regression analysis comparing the result of simulated two-volume prospective perfusion measurements
(PPRO) to the corresponding reference retrospective perfusion measurements (PRETRO). Each data point represents a
3D perfusion segment from the swine. For the retrospective assessment, the optimal V1 and V2 were selected at the
base and peak of the AIF from the gamma fitting curve. For the prospective measurement, bolus-tracking simulation
was conducted in the right ventricle within triggering threshold at 60 HU above the blood pool enhancement. (b)
Bland-Altman analysis was performed with the limits of agreement.
CCC = concordance correlation coefficient, RMSD = root-mean-square deviation, RMSE = root-mean-square error,
SD = standard deviation.
Fig 6: Representative CT perfusion maps and the prospectively predicted V2 image. Top row: Axial, coronal,
and 3D posterior views in the presence of balloon occlusions are shown. The color bar on the right indicates the

18
perfusion in the range from 0 to 20 ml/min/g. Bottom row: Axial, oblique-coronal CT angiography using maximum
intensity projection reconstruction with 20mm thickness and 3D pulmonary arteries extraction (Using V2). Red
arrows point at the angioplasty balloon.
Table 1. Contrast injection protocols
Table 2. Simulated Prospective Acquisition Time versus Optimal Acquisition Time
Table 3. Simulated Prospective Enhancement versus Optimal Enhancement in the Pulmonary Artery
Table 4. Regression of Simulated Two-Volume Prospective FPA Perfusion versus Retrospective FPA
Perfusion

19
Figures:
Fig 1: Flowchart of the study. N = number of swine.

20
Fig 2: Prospective imaging protocol and the corresponding arterial input functions. Top, imaging protocol. 𝑻𝒊𝒏𝒋 is the contrast injection duration, 𝑻𝑫 is the scanner-specific transition delay (2s), and 𝑻𝑷 is
the pre-defined time-to-peak delay. Bottom, right ventricle(RV) and pulmonary artery (PA) arterial input functions (AIF). 𝒕𝑽𝟏 and 𝒕𝑽𝟐 are the acquisition time of the first volume scan (V1) and the second volume scan ( V2). The baseline volumes used to emulate the bolus-tracking are shown in blue circles.

21
Fig 3: Two-volume FPA perfusion protocol. The integrated contrast enhancement change (∆𝑀𝑐/∆𝑡) within the lung compartment is measured by the tissue time attenuation curve (TAC, blue line). The average input concentration (𝑪𝒊𝒏) is estimated from the pulmonary arterial input function (AIF, black line) at V1 and V2. 𝑻𝒑 is the time-to-peak delay.

22
0.0 2.5 5.0 7.5 10.0 12.5 15.00.0
2.5
5.0
7.5
10.0
12.5
15.0
Pulmonary Artery:r=0.97
RMSD=0.41s, RMSE=0.44s
Aorta: r=0.96
RMSD=0.59s, RMSE=0.82s
TPA
=1.06TInj
/2+0.90
TA=1.14T
Inj/2+1.91
Ideal
Tim
e-t
o-P
eak D
ela
y (
s)
Half Injection Time (TInj
/2) (s)
Fig 4: Time-to-peak delays in the pulmonary artery and descending aorta. Gamma-fit ideal time-to-peak delays were compared to the one-half injection time. Pulmonary arterial time-to-peak (black) and the aortic time-to-peak (red) are shown with different interceptions (dispersion factor). Gamma fit time-to-peak (TPA, TA ) is defined as the time between the peak of the second derivative of the gamma fit and the true peak of the gamma fit, respectively. TInj: contrast injection time; RMSE: root-mean-square-error; RMSD: root-mean-square-deviation; r: Pearson correlation coefficient.

23
Fig 5: (a) Regression analysis comparing the result of simulated two-volume prospective perfusion measurements (𝑃𝑃𝑅𝑂) to the corresponding reference retrospective perfusion measurements (𝑃𝑅𝐸𝑇𝑅𝑂). Each data point represents an average of 3D perfusion region. For the retrospective assessment, the optimal V1 and V2 were selected at the base and peak of the AIF from the gamma fitting curve. For the prospective measurement, bolus-tracking simulation was conducted in the right ventricle within triggering threshold at 60 HU above the blood pool enhancement. (b) Bland-Altman analysis was performed with the limits of agreement. CCC = concordance correlation coefficient, RMSD = root-mean-square deviation, RMSE = root-mean-square error, SD = standard deviation.
0 5 10 15 20 25 30
0
5
10
15
20
25
30
PRRO
=0.87PRETRO
+0.56
Pearson's r=0.88 CCC=0.87
RMSD=0.85 ml/min/g
RMSE=2.29 ml/min/g
PP
RO (
ml/m
in/g
)
PRETRO
(ml/min/g)
0 5 10 15 20 25 30-20
-15
-10
-5
0
5
10
15
20
Mean-1.96SD
Mean
Mean+1.96SD
-4.93
3.75
PP
RO-
PR
ET
RO(m
l/m
in/g
)
Average Ppro
and PRETRO
(ml/min/g)
-0.59
(a) (b)

24
CT Perfusion (ml/min/g)
Simulated Prospective V2 image
Fig 6. Two-volume dynamic CT perfusion maps and the corresponding CT pulmonary angiogram. Top row: Axial, coronal, and 3D posterior views in the presence of balloon occlusions are shown. The color bar on the right indicates the perfusion in the range from 0 to 20 ml/min/g. Bottom row: Axial, oblique-corona, and 3D CT pulmonary angiogram generated from the corresponding V2 volume scan, displayed with a maximum intensity projection with slice thickness of 20mm. Red arrows indicate the angioplasty balloon.

25
Table 1. Contrast injection protocols.
Injection Protocols
(N = Number of swine)
Iodine dose per body weight
(ml/kg)
Saline Flush
(ml/kg)
Injection rate
(ml/s)
Protocol A (N = 20) 1 0.5 5
Protocol B (N = 10) 0.5 0.25 5
Protocol C (N = 5) 0.5 0.25 10
Protocol D (N = 5) 0.25 0.125 10

26
Table 2. Simulated Prospective Acquisition Time versus Optimal Acquisition Time
Note-: The “Time Difference” shows the time difference between each bolus-tracking simulation and the optimal acquisition
timing. The optimal acquisition timing is obtained from the gamma variate fitting AIF curve, where V1 at the second derivative peak of AIF and V2 at the AIF peak. RMSE: Root mean square error.
Triggering
Offsets (HU)
V1 V2
Time Difference (s) RMSE P-value Time Difference (s) RMSE P-value
40 0.61 ± 0.61 0.86 <0.05 -0.61 ± 0.98 1.16 <0.05
60 0.87 ± 0.66 1.03 <0.05 -0.34 ± 0.96 1.02 <0.05
80 1.05 ± 0.66 1.24 <0.05 -0.17 ± 0.90 0.91 0.252
100 1.20 ± 0.69 1.37 <0.05 -0.03 ± 0.85 0.85 0.921
120 1.38 ± 0.72 1.56 <0.05 0.16 ± 0.83 0.84 0.056
140 1.53 ± 0.77 1.70 <0.05 0.31 ± 0.82 0.88 <0.05

27
Table 3. Simulated Prospective Enhancement versus Optimal Enhancement in the Pulmonary Artery
Note-: The "Optimal Enhancement” in the pulmonary artery is the simulated result from the gamma variate fitting curve. Specifically, CV1 was calculated as the average enhancement within the PA region at the time of the second derivative peak, CV2 was the average enhancement within the PA region at the time of peak enhancement. The root-mean-square-error (RMSE) between each triggering protocol and the ideal enhancement was also calculated.
The change in contrast enhancements (∆HU) between CV1 and CV2 is shown in the last column. P-values in all comparisons are
less than 0.001. Blood flow is measured based on ∆HU. Therefore, it is best for CV1 to be as low as possible and CV2 to be as high as possible.
Triggering Offsets
(HU) CV1 CV2 CV2 – CV1
Enhancement (HU) RMSE Enhancement (HU) RMSE Difference (∆HU)
Optimal 228.8 ± 92.5 / 963.1 ± 294.4 / 735.1 ± 240.0
40 340.1 ± 151.9 161.0 923.1 ± 302.8 77.8 583.0 ± 295.5
60 389.1 ± 173.4 214.9 914.6 ±311.2 96.4 525.6 ± 337.8
80 422. 5 ± 172.4 237.7 915.3 ±316.2 97.8 493.6 ± 332.9
100 446.3 ± 183.2 255.9 914.9 ± 319.9 98.3 468.4 ± 334.5
120 486. 3 ± 187.4 300.0 900.0 ± 332.5 122.3 413.5 ± 357.5
140 514. 5 ± 190.5 325.3 891.4 ± 330.5 134.6 377.3 ± 364.0

28
Table 4. Regression of Simulated Two-Volume Prospective FPA Perfusion versus Retrospective FPA
Perfusion
Note.—Data in parentheses are 95% confidence intervals. P-value less than 0.05 indicate significant difference. CCC: concordance correlation coefficient, RMSD: root-mean-square deviation, RMSE: root-mean-square error. AL: Accessory Lobe, R: right lung, L: left lung.
Segments (n) Slope Intercept Pearson r CCC RMSE
(ml/min/g)
RMSD
(ml/min/g)
P-value
All (540) 0.87
(0.83, 0.90)
0.56
(0.18, 0.93)
0.88
(0.85, 0.89)
0.87
(0.85, 0.89) 2.29 0.85 <0.001
R_Cranial (60) 0.82
(0.66, 0.98) 1.13
(-0.42, 2.68) 0.81
(0.77, 0.83) 0.80
(0.77, 0.83) 2.23 0.83 0.051
R_Middle (60) 0.77
(0.62, 0.93) 0.91
(-0.26, 2.07) 0.80
(0.77, 0.83) 0.78
(0.75, 0.81) 2.19 0.90 0.019
R_Caudal (120) 0.91
(0.91, 1.00)
0.49
(-0.69, 1.66)
0.86
(0.83, 0.88)
0.85
(0.82, 0.87) 2.56 0.68 0.022
AL (60) 0.69
(0.53, 0.84) 1.90
(0.65, 3.16) 0.76
(0.72, 0.79) 0.74
(0.71, 0.78) 2.20 1.09 0.150
L_Cranial (60) 0.84
(0.69, 0.99) 0.87
(-0.69, 2.42) 0.82
(0.81, 0.86) 0.81
(0.78, 0.84) 1.87 0.85 0.036
L_Lingula (60) 0.80
(0.66, 0.93) 0.63
(-0.37, 1.64) 0.82
(0.79, 0.85) 0.81
(0.78, 0.84) 1.87 1.00 0.001
L_Caudal (120) 0.84
(0.77, 0.91)
0.50
(-0.10, 1.08)
0.92
(0.90, 0.93)
0.91
(0.89, 0.92) 2.31 1.08 0.003

Figures
Figure 1
Flowchart of the study. N = number of swine.

Figure 2
Prospective imaging protocol and the corresponding arterial input functions. Top, imaging protocol. T_injis the contrast injection duration, TD is the scanner-speci�c transition delay (2s), and T_P is the pre-de�ned time-to-peak delay. Bottom, right ventricle (RV) and pulmonary artery (PA) arterial input functions(AIF). t_V1 and t_V2 are the acquisition time of the �rst volume scan (V1) and the second volume scan(V2). The baseline volumes used to emulate the bolus-tracking are shown in blue circles.

Figure 3
Two-volume FPA perfusion protocol. The integrated contrast enhancement change (∆M_c/∆t) withinthe lung compartment is measured by the tissue time attenuation curve (TAC, blue line). The averageinput concentration (C_in) is estimated from the pulmonary arterial input function (AIF, black line) at V1and V2. T_p is the time-to-peak delay.

Figure 4
please see the manuscript �le for the full caption

Figure 5
(a) Regression analysis comparing the result of simulated two-volume prospective perfusionmeasurements (P_PRO) to the corresponding reference retrospective perfusion measurements (P_RETRO). Each data point represents a 3D perfusion segment from the swine. For the retrospectiveassessment, the optimal V1 and V2 were selected at the base and peak of the AIF from the gamma �ttingcurve. For the prospective measurement, bolus-tracking simulation was conducted in the right ventriclewithin triggering threshold at 60 HU above the blood pool enhancement. (b) Bland-Altman analysis wasperformed with the limits of agreement. CCC = concordance correlation coe�cient, RMSD = root-mean-square deviation, RMSE = root-mean-square error, SD = standard deviation.
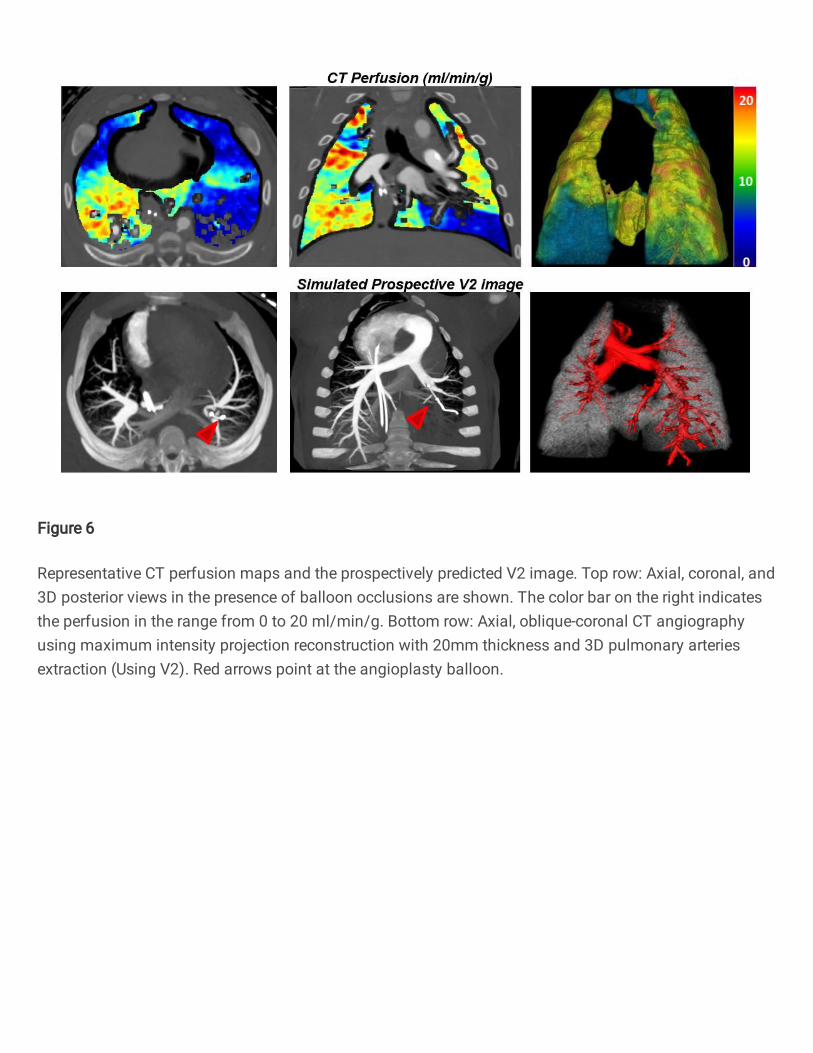
Figure 6
Representative CT perfusion maps and the prospectively predicted V2 image. Top row: Axial, coronal, and3D posterior views in the presence of balloon occlusions are shown. The color bar on the right indicatesthe perfusion in the range from 0 to 20 ml/min/g. Bottom row: Axial, oblique-coronal CT angiographyusing maximum intensity projection reconstruction with 20mm thickness and 3D pulmonary arteriesextraction (Using V2). Red arrows point at the angioplasty balloon.