two-way street: 2021 update us-china investment trends
TRANSCRIPT
Two-Way Street: 2021 UpdateUS-China Investment Trends Thilo Hanemann, Daniel H. Rosen, Mark Witzke, Steve Bennion, and Emma Smith
With a Foreword by Stephen A. Orlins
A Report by the US-China Investment Project May 2021


More background on the US-China Investment Project and interactive visuals are available at:www.us-china-investment.org
MAY 2021
© 2021 Rhodium Group and National Committee on U.S.-China Relations
Thilo Hanemann, Daniel H. Rosen, Mark Witzke, Steve Bennion and Emma Smith
With a Foreword by Stephen A. Orlins
Two-Way Street:2021Update US-China Investment Trends
A Report by the US-China Investment Project

ABOUT THE AUTHORS
Thilo HanemannThilo Hanemann is a partner at Rhodium Group and leads the firm’s cross-border investment practice. His research assesses the new trends in global trade and capital flows, related policy developments, and the political and commercial dynamics of specific transactions. Mr. Hanemann’s most recent work focusses on the evolution of China’s international investment position and the economic and policy implications of this new trend. He is a frequent speaker and commentator on China’s outward investment and has published numerous reports and articles on the topic. He is also a Senior Policy Fellow at the Mercator Institute for China Studies, Europe’s biggest China think tank, located in Berlin.
Daniel H. RosenDaniel H. Rosen is a founding partner of Rhodium Group and leads the firm’s work on China. Mr. Rosen has more than two decades of experience analyzing China’s economy, corporate sector and US-China economic and commercial relations. He is affiliated with several American think tanks focused on international economics and is an Adjunct Associate Professor at Columbia University. From 2000-2001, Mr. Rosen was Senior Adviser for International Economic Policy at the White House National Economic Council and National Security Council. He is a member of the Council on Foreign Relations, and board member of the National Committee on US-China Relations.
Mark WitzkeMark Witzke is a research analyst at Rhodium Group focusing on China’s international outbound investment. He graduated from UC San Diego School of Global Policy and Strategy with a Master's Degree in International Affairs where he was the editor in chief of the school's China Focus blog.
Steve BennionSteve Bennion is a resarch analyst at Rhodium Group. Prior to joining Rhodium, Steve held internships and externships in business validation roles for different cybersecurity and asset man-agement companies. Steve holds a Bachelor’s degree from Brigham Young University with a major in Finance and minor in Political Science.
Emma SmithEmma Smith is a research analyst at Rhodium Group, focusing on cross-border investment pat-terns. Her research focuses on the policy and market dynamics shaping China's internaitonal outbound investment. Prior to joining Rhodium, Emma graduated from Brigham Young University with a Bachelor’s Degree in Economics.
This report represents the 2021 issue of the annual update of the US-China Investment Project, a multi-year research initiative to provide greater transparency on investment flows between China and the United States.
ABOUT THIS REPORT

ABOUT THE US-CHINA INVESTMENT PROJECT The US-China investment Project is a multi-year research initiative to provide greater transparency
on investment flows between China and the United States.
LEAD ORGANIZATIONS
Rhodium Group
Rhodium Group (RHG) is an independent research firm dedicated to using policy experience, quan-titative tools and on-the-ground research to analyze disruptive global trends. Our work supports leadership and other professionals in the financial, corporate, non-profit and government sectors. RHG analysis is used in commercial and investment management, strategic planning and policy analysis. Rhodium Group is headquartered in New York City, with offices in California, Hong Kong, and Paris. RHG’s cross-border investment practice analyzes the rise of China and other emerging markets as trans-national investors. RHG senior staff publish frequently on the growth and impact of Chinese outbound investment in the United States, Europe, and other economies.
National Committee on US-China Relations The National Committee on United States-China Relations is an American nonprofit, nonpartisan educational organization that encourages understanding and cooperation between the United States and Greater China in the belief that constructive Sino-American relations serve the interests of both countries and the global community. Since 1966, the National Committee has conducted programs on politics and security, governance and civil society, economics and finance, education, and trans-national issues such as energy and environment. It carries out its mission via confer-ences and forums, public education programs, professional exchanges, and collaborative projects. The National Committee’s corporate and individual members represent many viewpoints, but share the belief that productive US-China relations require public education, face-to-face contact, and the forthright exchange of ideas
2021 SUPPORTERS
Steven and Roberta Denning
Mac McQuown
Gary Rieschel
Jack Wadsworth

An interactive web application with updated data through the end of 2020 is available at: www.us-china-investment.org

Foreword 8
EXECUTIVE SUMMARY 9INTRODUCTION 12
1 DIRECT INVESTMENT 13
1.1 US Direct Investment in China 13 Overview 14 Industry Trends 15 Outlook 18
1.2 Chinese Direct Investment in the US 18 Overview 19 Industry Trends 20 Outlook 23
2 VENTURE CAPITAL 24
2.1 US Venture Investment in China 24 Overview 24 Industry and Technology Trends 26 Outlook 28
2.2 Chinese Venture Investment in the US 29 Overview 29 Industry and Technology Trends 30 Outlook 31
3 CONCLUSIONS AND OUTLOOK 33
References 35Appendix: Datasets and Compilation Methodology 36
CONTENTS
8
FOREWORD
I am delighted to be writing the foreword to the sixth annual Two-Way Street report, a resource created by the National Committee on U.S.-China Relations and Rhodium Group that provides unparalleled data and analysis of two-way capital flows.
When we launched this project in late 2016, in the National Committee’s 50th anniversary year, much of the emphasis was on the new wave of Chinese direct investment entering the United States and the continued importance of U.S. investment in China. As the data documented, bilateral investment ties were deeper than thought, benefiting both countries’ economic activity and serving as important, if underappreciated, ballast for the relationship.
How times have changed. In 2021, with both nations recovering from the COVID-19 pandemic, the complexion of the relationship has changed dramatically. Bilateral investment has not continued along the trajectory we saw years earlier and, arguably, neither nation’s economic interests have been particularly well served.
At the time of writing, President Biden’s team is undertaking a thorough review of the previous administration’s China policies, looking to undo policies that unnecessarily curbed Chinese trade and investment. But even after President Biden’s first hundred days, tariffs that hurt the American consumer have been left in place; executive orders that force the delisting of Chinese companies from U.S. exchanges have not been reversed, sending busi-ness to other countries and costing America jobs. Congress, too, has a role, finding opportunities to speak and act in ways that actively discourage a Chinese presence—especially an investment presence—in the United States.
China's actions have contributed to the badly deteriorated bilateral investment environment as well. Maintaining strict capital outflow controls, cracking down on some of the country’s main private outbound investors, deep-ening industrial policies to promote self-reliance and independence from foreign markets, and continuing reprehensible policies in Xinjiang and Hong Kong, for example, have greatly reduced investment that might have otherwise taken place.
As the post-pandemic recovery continues—and after a volatile 2020—many investors have begun taking stock to make decisions that will shape global value chains for the coming decade. That is why this year’s report is more important than ever. By making bilateral investment data transparent, it provides thought leaders in the business and policy world in both the United States and China with ample food for thought and encourages pol-icy that is well informed and data driven, rather than the product of emotions or politics.
As no one is better or more thoughtful at collecting, analyzing, and presenting this two-way investment data than Rhodium, it is a great pleasure to be working with the firm once again. It is our hope that our joint report will serve as a public good in both countries, providing a more complete picture of U.S.-China investment flows, their value to both countries, and their impacts on the bilateral relationship.
Stephen A. OrlinsPresident, National Committee on U.S.-China Relations

9
Source: Rhodium Group. *See Appendix for data description.
Figure ES-1: Annual Value of FDI Transactions between the US and China, 2000-2020USD billion
EXECUTIVE SUMMARY
The US-China Investment Project tracks and analyzes investment flows between the world’s two largest economies. This report summarizes key developments in 2020, an unusually volatile year due to the COVID-19 pandemic, and analyzes the outlook for 2021 as the world slowly emerges from this period of crisis and a new US administration settles in.
The key findings of the report are:
(1) Foreign direct investment (FDI) between the US and China fell to $15.9 billion in 2020 amid pandemic related disruptions and rising tensions in the US-China relationship. This was the lowest level for two-way flows since 2009.
• Completed Chinese FDI in the United States reached $7.2 billion in 2020, a slight increase from $6.3 billion in 2019. This was driven by a handful of large acquisitions, including Tencent’s purchase of a share in Universal Music Group and Harbin Pharmaceutical Group’s acquisition of GNC Holdings. M&A transaction volumes remained low, and acquisitions were mostly confined to consumer-oriented sectors. Greenfield investments did not see a meaningful uptick.
• US FDI in China dropped to $8.7 billion in 2020, a fall of roughly a third from the previous year, and the lowest level since 2004. Greenfield investment was disrupted by the pandemic in the first half of the year but picked up strongly in the second half as China’s economy stabilized and COVID-19 related restrictions eased. Compared to previous years, US investors launched fewer significant greenfield projects. The slowdown in acquisitions was more acute, with only a handful of medium-sized takeovers in consumer products and finan-cial services.

10
Figure ES-2: Annual Pro-Rata Value of VC Transactions between the US and China, 2000-2020*USD billion
(2) Two-way venture capital (VC) investments also declined slightly in terms of both total value and number of funding rounds. Chinese VC in the US increased slightly and exceeded flows in the other direction for the first time ever, but only marginally so. In contrast, US VC in China dropped to the lowest level in five years.
• Chinese venture capital investment in the US increased to $3.2 billion in 2020, from $2.3 billion in 2019, despite stricter regulatory scrutiny tied to FIRRMA. Chinese venture investors participated in 249 unique funding rounds for US startups, which was lower than the previous year (305). But investment totals were larger due to several later stage transactions with high valuations. More than half of all transactions (132) occurred in the Health, Pharmaceuticals and Biotechnology sector, followed by Financial and Business Services (43) and Information and Communications Technology (26).
• US to China venture capital deals dropped in terms of value and deal count. In 2020 there were 247 unique funding rounds, down from last year’s total of 306. Total investment value dropped more sharply to $2.5 billion, just half of last year’s total and a fraction of the almost $20 billion recorded in 2018. Financial and Business Services and Health, Pharmaceuticals and Biotech were the most common targets for US VC investors, with 54 and 52 transactions each. Consumer Products and Services deals fell from 52 to 31. from the record $19.6 billion in 2018. The 2017-2018 boom in US venture capital investment into China was in line with a broader expansion and growth of the Chinese technology market and especially later-stage technology firms. In 2019, there was a slowdown in the Chinese VC market as investors became more selective in the face of increasing economic uncertainty and the view took hold that parts of China’s tech ecosystem had become overheated after years of rapid growth.
Source: Rhodium Group based on Bloomberg, Pitchbook and other databases. *Pro-rata value determined as US or Chinese proportional share of each funding round’s value based on the number of participating investors. See Appendix for data description.

11
(3) The post-pandemic recovery could lead to a rebound in two-way flows but policy developments in Washington and Beijing are a wild card.
• In China, the balance that leaders strike between domestic financial stability and openness to the outside world will shape the investment landscape. Throughout the pandemic, Beijing prioritized stability, refusing to loosen restrictions on outbound investment by private companies despite a massive trade surplus and upward pressure on its currency. On the inflow side, the outlook hinges on whether Beijing delivers on its promises to level the playing field for foreign firms and how its “dual circulation” strategy and industrial policy push to replace foreign technology suppliers with domestic firms progresses. A more challenging environment for traditional FDI could also encourage foreign investors in certain sectors to seek greater exposure to Chinese assets through portfolio investment.
• In the United States, the Biden administration has signaled that it will maintain key elements of the restrictive policies deployed in past years. But a change in style, that seeks to restore confidence in due process, transparency and non-discriminatory openness to foreign investment, seems likely. A shift away from aggressive decoupling rhetoric could also help instill confidence. Among the key questions are how US officials will implement and enforce new rules for foreign investment reviews (FIRRMA) and export controls (ECRA). Supply chain safety rules, next generation antitrust policies, and new initiatives to protect personal data could all have a profound effect on Chinese companies and investors
• Aside from national policies, broader geopolitical dynamics will likely shape the environment for bilat-eral investment. The arrival of a new US administration that is prioritizing cooperation with allies could lead to more coordinated action among advanced economies in areas like investment screening, export con-trols and human rights. If such convergence brings more transparency and predictability around national security-related concerns, then it could support US-China investment in non-sensitive areas. But greater market economy convergence could also trigger a broader rethink that incentivizes US and Chinese inves-tors to shift their focus.
12
INTRODUCTION
The global COVID-19 pandemic has had a profound impact on global capital flows. The virus shut down local econ-omies and halted cross-border travel, complicating deal making. As a result, total foreign direct investment (FDI) flows dropped an estimated 40% in 2020. Toward the end of the year, however, the pendulum began to swing back in the other direction, with M&A levels bouncing back to pre-crisis levels as central banks flooded the mar-ket with liquidity.
Capital flows between the US and China had been volatile even before the pandemic outbreak: direct investment and VC flows grew rapidly after 2010, reaching a peak of over $70 billion in 2016, as Chinese outbound invest-ments accelerated. Since 2017, however, Chinese investment in the US has slowed dramatically due to domestic restrictions imposed by the Chinese government and regulatory pushback from the US side. US investment in China, by contrast, remained flat in recent years as China’s growth and economic reform momentum slowed.
The pandemic has reinforced some of the drivers of the volatile bilateral investment environment. In China, an acute focus on domestic recovery and risk mitigation has reduced the appetite for outbound investment among Chinese regulators. Asset prices in the US have recovered quickly, with valuations surging to their highest lev-els in a decade. The pandemic exacerbated tensions in the US-China relationship in the final year of the Trump administration. At the same time, China’s successful containment of the pandemic and early economic recovery have made its market more attractive to many American companies. Furthermore, high yields increased the appetite of international investors for passive portfolio holdings in China.
As the world slowly emerges from crisis mode, policymakers will have to grapple with the longer-term implica-tions of these trends and navigate a series of related policy questions. In times of volatility, it is doubly important that decisions be guided by objective information that provides context around the short-term movements that we have been witnessing.
The US-China Investment Project fulfills this need by providing clear and objective data on US-China investment flows through the traditional direct investment lens and via insights into new types of capital flows that reflect the growing complexities of US-China investment dynamics. While direct investment has played by far the larg-est role in capital flows in and out of China to date, indirect flows, including venture capital and other private equity investments, are likely to account for a larger share of two-way flows in the future.
This report summarizes the most important trends in US-China two-way investment in 2020. The first part of the report reviews US-China trends in direct investment. The second part analyzes trends in bilateral venture capital investment. The report concludes with a summary of key findings and outlook for businesses and policymakers.
An interactive data visualization with detailed industry profiles and additional research is available on our project website (www.us-china-investment.org).
13
1. DIRECT INVESTMENT
Two-way foreign direct investment (FDI) has been a critical component of the US-China economic relationship. Direct investment transactions give foreign investors control and long-term influence over local businesses. These transactions typically involve investments resulting in at least 10% ownership of a company’s voting shares. This contrasts with portfolio investment, which involves shorter-term, financially motivated transactions that generally result in smaller ownership stakes (usually less than 10% of voting rights) and no meaningful control.
Long-standing methodological challenges complicate the task of assessing direct investment flows between China and the United States. Most government statistics measure financial flows based on Balance of Payments (BOP) principles, which are greatly distorted by complex global financing structures, tax optimization, intra-com-pany transfers and other factors. Government statistics based on BOP principles collect FDI data based on the immediate source or destination country, and do not trace flows back to the country of ultimate origin or the ultimate destination. Finally, there is often a significant time lag in most official statistics for bilateral FDI.
This section presents an analysis of US-China bilateral FDI trends based on an alternative Rhodium Group data-set that identifies, values and aggregates individual FDI transactions. The database covers direct investment transactions including the establishment of subsidiaries, factories, research and development (R&D) centers, and offices (greenfield investments), the expansion of existing facilities, and the acquisition of existing com-panies (mergers and acquisitions, or M&A). This bottom-up dataset is not comparable to BOP data but offers a valuable and real-time perspective on two-way flows without some of the distortions in official statistics. A detailed explanation of the database and underlying methodologies is available in the appendix.
1.1 US DIRECT INVESTMENT IN CHINA
The People’s Republic of China remained largely closed to US direct investment in the three decades following its creation in 1949, and only began to open up in the 1980s. Investment flows were modest at first (less than $1 billion per year) but grew to several billion dollars per year in the 1990s and early 2000s. Following China’s accession to the World Trade Organization (WTO) in 2001, US FDI in China jumped to over $20 billion in 2008, before dropping during the global financial crisis in 2009. Since then, annual US direct investment in China has climbed back, hovering between $13 billion and $16 billion per year. As was the case during the global financial crisis, the global recession caused by the COVID-19 pandemic in 2020 led to a drop in headline investment com-pared to the average seen in previous years.

14
OVERVIEWIn 2020, US firms invested $8.7 billion in China, a 33% fall from the $13.1 billion seen in 2019 and the lowest level since 2004, according to our data. This is far below the average of the last 10 years (Figure 1).
Greenfield investment was disrupted by the pandemic in the first half of the year but picked up strongly in the second half as lockdowns eased and multi-year projects started up again. The biggest of these ongoing projects were expansions by Walmart and Tesla, which began the phase two extension of its Shanghai Gigafactory in May 2020. Compared to previous years, however, US investors started fewer new greenfield projects.
The most important new projects were the establishment of Ford Blue Mach Technology in Nanjing ($500 million) by US carmaker Ford, and of Core Source Semiconductor in Hebei ($337 million) by semiconductor technology company Nex Gen Power Systems.
The pace of acquisitions slowed significantly, with only a handful of medium-sized takeovers in consumer prod-ucts and financial services. The biggest acquisitions were PepsiCo’s purchase of Be and Cheery for $750 million and Cabot’s $115 million acquisition of Shenzhen Sansun Nano Materials.
The geographic distribution of US FDI in China did not change much in 2020 compared to previous years, with the majority of activity occurring in large cities near China’s coast (Figure 2). Shanghai, Hebei, Zhejiang, and Fujian were the most common targets.
Source: Rhodium Group.
Figure 1: Value of US FDI Transactions in China, 2000-2020USD million

15
INDUSTRY TRENDSThe industry mix of US FDI in China has shifted over the past three decades along with the maturation of China’s economy. Whereas the earliest investments focused on labor-intensive manufacturing, interest in the 2000s and early 2010s shifted towards Chinese consumer-oriented sectors like food and autos. Over the past five years, American investors have increasingly targeted high-tech and advanced services sectors.
Source: Rhodium Group.
Figure 2: Geographic Distribution of US FDI in China, 2020
Figure 3: US FDI in China by Industry, 2010-2020USD million
Source: Rhodium Group.

16
Geopolitical tensions and pandemic-related disruptions led to additional changes in the make-up of US FDI in China in 2020. ICT investment declined as US-China technology frictions grew and other industries, such as automotive, saw lower investment due to COVID-19 restrictions and temporary cuts in capital expenditures in response to the crisis. The big winners were food, real estate and hospitality and basic materials.
Major 2020 industry trends include:
• The top sector for US investment in China in 2020 was Automotive ($2 billion). Investment was down $2 billion from 2019, but roughly in line with 2017 and 2018 levels. Prominent deals in the industry included Ford’s new greenfield project in Nanjing ($500 million) and Tesla’s expansion of its Shanghai Gigafactory.
• Agriculture and Food was the second biggest recipient of US investment, with $1.4 billion. This was driven by larger acquisitions such as PepsiCo’s purchase of Be & Cheery ($750 million) and Sequoia Capital’s purchase of Shijiazhuang Junlebao Dairy ($171 million). Smaller greenfield investments from Beyond Meat, Yum China, Starbucks, and Popeye Restaurants also contributed
• Entertainment ($1.2 billion) was third and featured Platinum Fortune’s acquisition of Hongtou Network ($265 million).
• The Basic Materials ($761 million) industry saw several smaller deals in 2020, including Cabot’s acquisition of Shenzhen Sanshun Nano New Materials ($115 million) and the establishment by Corning of a Pharmaceutical Glass plant in Anhui ($20 million).
• The ICT ($722 million) industry saw a large decline in investment in 2020 (down more than $1 billion from 2019). There were several semiconductor-related transactions, including the establishment of two new subsidiaries by Nex Gen Power Systems: Core Source Semiconductor ($336 million) and Maikexin Semiconductor ($65 million). Other deals included acquisitions by Clarivate Analytics (IncoPat) and Red Cat (Fat Shark), both for an undisclosed amount.
• Consumer Products ($644 million) was on the lower end but still featured prominent investments like Costco’s greenfield establishments in Zhejiang and Guangdong ($260 million).
• Investment in Health and Biotech ($580 million) fell by more than $2 billion compared to 2019. Acquisitions included Pfizer’s purchase of Cstone Pharmaceuticals ($200 million) and GGV Capital’s pur-chase of Shenzhen Hepalink Pharmaceutical Group ($50 million)

17
Figure 4: US FDI Transactions in China by Industry, 2010-2020USD million
Source: Rhodium Group.

18
OUTLOOK
The short-term outlook continues to be positive, given China’s resilience compared to other markets. Our prelim-inary data shows that investment levels in 1Q 2021 have begun to bounce back towards pre-pandemic levels, with US companies completed over $1 billion in direct investment and announcing another billion in new direct investment projects in China. Major new investments include JP Morgan’s pending acquisition of China Merchant’s Bank ($410 million), and Dow’s announced South China Specialties Hub ($250 million). Tesla has started another expansion of its Shanghai facilities and ExxonMobil signed a construction contract for its planned chemical complex in Huizhou in April, which could add $10 billion in greenfield FDI over the coming years.
Policies that offer foreign firms greater market access could serve as an additional driver of growth, but evidence of that remains mixed. China’s decision to allow wholly owned foreign companies in automotive manufacturing and chemicals has propelled some of the biggest US greenfield investments in recent history, including Tesla’s Gigafactory in Shanghai and ExxonMobil’s petrochemical complex in Huizhou.
Progress in other areas, including financial services, remains slow. For example, one year after Beijing announced an opening of China’s mutual fund industry to foreign firms, only one foreign company (BlackRock) has obtained a license and many of the biggest US fund companies are either sitting on the sidelines or have given up on plans (Vanguard) to run wholly owned operations on the mainland, given their laggard position in a crowded market.
Survey data confirm that Beijing’s latest efforts to modernize its FDI regime have been positive but not suffi-cient: In its 2021 White Paper, the American Chamber of Commerce in China says that only 24% of its members felt a clear positive impact from China’s new Foreign Investment Law. More than 65% of US companies surveyed continue to feel treated unfairly in terms of market access.
In addition to market access in China, US companies in China face several longer-term headwinds.
First, despite the spectacular growth in 1H 2021 thanks in part to favorable pandemic-related base effects, China’s long-term economic outlook faces serious challenges. High debt levels, unfavorable demographics and other structural challenges are increasing uncertainty over the long -term growth outlook, which is a key driver of FDI.
Second, supply chain diversification is likely to shift manufacturing capacity out of China over the coming decade. The pandemic has aggravated concerns about dependence on Chinese raw materials and manufactured products. Once immediate bottlenecks are resolved, firms are expected to take a deeper look at how best to diversify their supply chains.
Finally, US multinationals in China find themselves in the crosshairs of geopolitical tensions between China and the US – including disputes over human rights, territorial claims, trade and technology – which could affect long-term investment plans.

19
1.2 CHINESE DIRECT INVESTMENT IN THE US
Chinese investment in the US was modest before 2010, averaging well below $1 billion annually. Annual invest-ment accelerated quickly after that, reaching nearly $5 billion in 2010 and $14 billion in 2013. Chinese investment in the US peaked at $45 billion in 2016 thanks to several multi-billion-dollar acquisitions that were fueled by ram-pant liquidity in the Chinese market and loose outbound investment controls. Since then, annual investment has dropped sharply, reaching $29 billion in 2017, $5.4 billion in 2018, and $6.3 billion in 2019. Despite the pandemic and growing strains in the US-China relationship, Chinese FDI in the US rose slightly in 2020.
OVERVIEW
In 2020, Chinese FDI in the US was resilient despite turbulence associated with the COVID-19 pandemic and continued US-China tensions. In total, we recorded $7.2 billion in completed deals in the US in 2020, up slightly from the $6.3 billion registered in 2019. This marks the third year in a row in which investment was below the double-digit billions, with annual investment averaging $7 billion since 2018. That represents just 15% of the investment total registered in 2016 and just half of the annual average flows seen in the pre-boom period of 2013-2015.
In 2020, investment was also heavily concentrated. Most of it came from just a handful of large acquisitions. The top transactions were Tencent’s purchase of a share in Universal Music Group for $3.3 billion, Harbin Pharmaceutical Group’s acquisition of GNC for $770 million, and Binance’s acquisition of CoinMarketCap for $400 million.
On top of the low investment totals, we continued to register several high-profile asset divestitures by Chinese investors in the US. The biggest were now-bankrupt HNA’s sale of Ingram Micro to Platinum Equity ($7.2 billion); Wanda’s divestiture of AMC equity (with a further cut to less than a 30% stake in 2020). We also saw Oceanwide’s attempt to acquire US insurer Genworth for $2.7 billion unravel when the Chinese firm failed to close the deal despite 16 extensions over four years.
Source: Rhodium Group.
Figure 5: Value of Chinese FDI Transactions in the US, 2000-2020USD million

20
Source: Rhodium Group.
Figure 6: Geographic Distribution of Chinese FDI in US, 2020
As in most previous years, California ($3.9 billion) was the most common state targeted by Chinese investors (Figure 6). The state hosted large acquisitions like the Tencent-UMG deal as well as several mid-sized greenfield deals. Pennsylvania ($950 million) and Delaware ($465 million) formed the rest of the top three due to the GNC and CoinMarketCap deals. Massachusetts ($177 million) and Missouri ($163 million) rounded out the rest of the top five with greenfield investment by Geely Auto in the former and the purchase of Solid Gold, a pet food company, in the latter.
INDUSTRY TRENDS
During the Chinese outbound FDI boom in 2016-2017, Chinese investments in the US were concentrated in just a few industries like real estate and hospitality, transport and infrastructure. This industry mix has changed substantially in recent years, with investors gravitating toward less sensitive areas.
Industry patterns in 2020 continued to reflect that trend. Chinese FDI in the US was largely concentrated in three sectors: entertainment; consumer products and services; and health and biotech. Investment in sectors that are subject to high regulatory scrutiny, such as semiconductors, aviation or infrastructure, has largely disappeared. Sectors that drew regulatory scrutiny in China—such as real estate—have also experienced a sharp drop in investment compared to the previous decade.
21
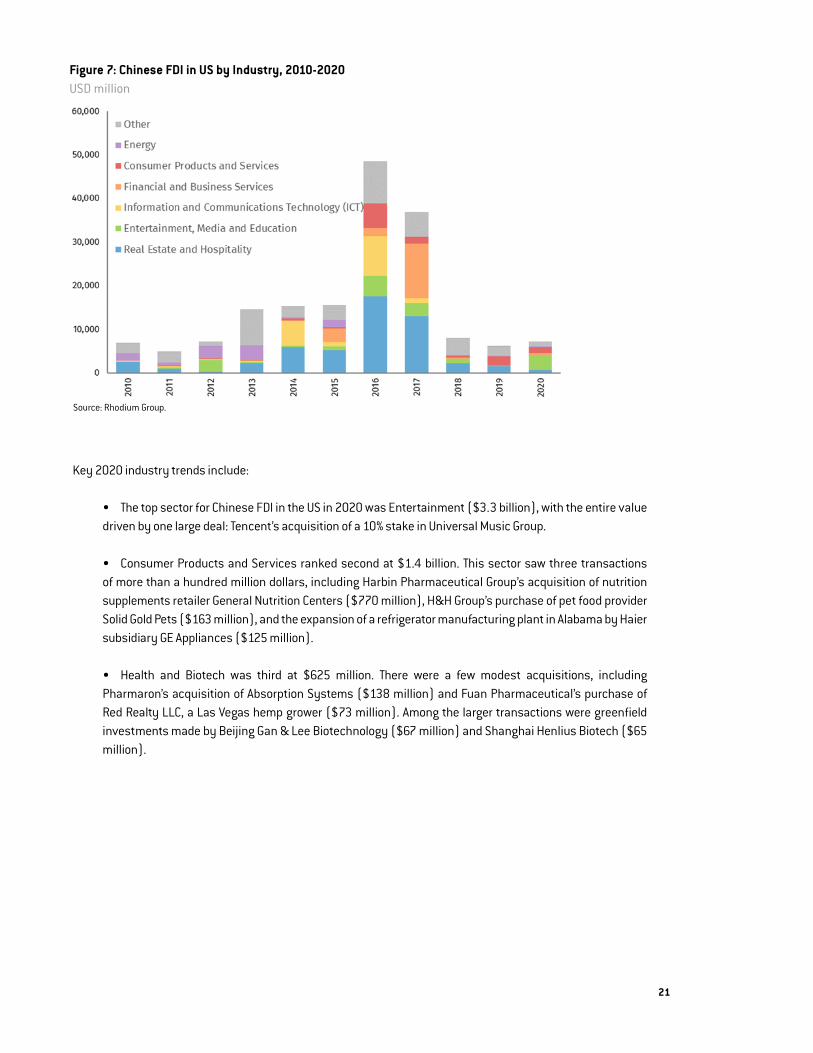
Key 2020 industry trends include:
• The top sector for Chinese FDI in the US in 2020 was Entertainment ($3.3 billion), with the entire value driven by one large deal: Tencent’s acquisition of a 10% stake in Universal Music Group.
• Consumer Products and Services ranked second at $1.4 billion. This sector saw three transactions of more than a hundred million dollars, including Harbin Pharmaceutical Group’s acquisition of nutrition supplements retailer General Nutrition Centers ($770 million), H&H Group’s purchase of pet food provider Solid Gold Pets ($163 million), and the expansion of a refrigerator manufacturing plant in Alabama by Haier subsidiary GE Appliances ($125 million).
• Health and Biotech was third at $625 million. There were a few modest acquisitions, including Pharmaron’s acquisition of Absorption Systems ($138 million) and Fuan Pharmaceutical’s purchase of Red Realty LLC, a Las Vegas hemp grower ($73 million). Among the larger transactions were greenfield investments made by Beijing Gan & Lee Biotechnology ($67 million) and Shanghai Henlius Biotech ($65 million).
Source: Rhodium Group.
Figure 7: Chinese FDI in US by Industry, 2010-2020USD million

22
Figure 8: Chinese FDI Transactions in the US by Industry, 2010-2020USD million
Source: Rhodium Group.

23
OUTLOOK
The momentum behind Chinese FDI in the US remained weak in the first months of the Biden administration. In 1Q 2021, we record just $800 million of newly announced Chinese direct investments in the US. Such deals include Shandong Xinchao Energy’s acquisition of Texas oil and gas assets from Grenadier Energy Partners ($420 million) and Asia Green Fund Management’s acquisition of Dupont Clean Technologies Business ($170 million).
China’s restrictive policies toward outbound investment, driven by a renewed focus on domestic stability, remain a major constraint. Despite a record trade surplus and a significant upswing in capital inflows since 2H 2020, Beijing has not meaningfully loosened its tight leash on capital outflows from households and private com-panies. Most of the outflows are facilitated through state-owned banks, while total outbound FDI has stagnated at the same level ($30-35 billion per quarter) since 2017. Another important variable for 2021 is how China’s regulatory approach to specific industries – such as its antitrust crackdown on domestic technology giants – impacts outbound investment by these firms.
However, several factors point to a rebound of Chinese FDI in the US over the course of 2021. First, the US economy is projected to enter a period of significant growth. The IMF projects that the US economy will grow 6.4% in 2021 and the Biden administration’s new infrastructure program and clean energy buildout may offer unique investment opportunities. Survey data indicates that the US remains one of the most attractive markets for foreign companies, despite its initial mishandling of the pandemic.
Second, while the US-China rivalry is poised to continue, the Biden administration is likely to introduce a more predictable regulatory approach. Despite increasing political frictions in recent years, less than 20% of Chinese companies operating in the US were dissatisfied with the overall investment and business environment (Figure 9). A continued shift towards more transparent due process and greater predictability could revitalize Chinese investments in non-sensitive areas that were put on ice due to the previous administration’s aggressive and erratic decoupling approach.
Source: China General Chamber of Commerce-USA Survey Data
Figure 9: Chinese Companies’ Satisfaction with US Overall Business Environment % of respondents

24
Third, the realization that US tariffs on Chinese goods could remain in place for a long period of time may trigger more greenfield investment in local US manufacturing by Chinese companies seeking to circumvent trade barriers. The Biden administration has made clear that it has no plans to remove tariffs for the foreseeable future and will instead build upon the Trump administration’s “Phase 1” agreement to evaluate whether tariffs can be removed.
2. VENTURE CAPITAL
Direct investment has been the most prominent channel of US-China investment flows over the past three decades but other types of investment have also gained traction in recent years. One such channel is venture capital (VC). A subset of private equity, VC refers to early-stage equity investment in nascent enterprises with growth potential. VC investments typically take place in successive funding rounds comprised of multiple investors. Venture-backed start-ups often operate in cutting-edge industries with novel technologies.
In most cases these are small, minority stakes. However, in some cases, VC stakes in sensitive sectors can raise concerns about foreign ownership. Rising Chinese venture interest in the US was one of the key drivers of the Foreign Investment Risk Review Modernization Act (FIRRMA), which expanded the US investment screening regime to cover foreign investment stakes below the traditional 10% threshold.
This section presents a summary of US-China venture capital investment trends. It is based on a proprietary Rhodium Group dataset that tracks the cross-border investment activities of corporations and their dedicated venture subsid-iaries, the general partners of professional venture funds, and angel investors. We assign VC investor nationality on an “ultimate ownership” basis. This is determined by the domicile of the ultimate owner of corporate venture organiza-tions; by the domicile of the ultimate corporate owner or the nationality and home country of the ultimate shareholder for general partners; and by nationality and home country for angel investors. We do not count the full value of each investment round with Chinese participants, but estimate the pro-rata share of total fundraising round values attrib-utable to the Chinese investor(s). More details on the dataset and methodology can be found in the appendix.
2.1 US VENTURE INVESTMENT IN CHINA
Venture capital has a much shorter history in China than it does in the United States. The first modern govern-ment-backed venture funds were not established until the 1980s, and before the 2000s China lacked the institutions and financial development needed to foster a thriving private venture capital ecosystem. US venture investors have been active in the Chinese VC landscape for most of its comparatively short life, with the first US venture firms entering the Chinese market by the early 2000s.
Experienced US venture investors have since played a key role in the development of China’s modern technology sec-tor, participating in funding rounds for at least one third of all Chinese venture-backed startups. Investment took off after 2014, reaching a high of $19.6 billion in 2018. In 2019, US VC in China dropped to only $5 billion, or about a quarter of the previous year’s value. In 2020 the downward trajectory continued, with only $2.5 billion of capital invested.

25
OVERVIEWIn 2020, US-owned venture investors participated in 247 unique venture funding rounds for Chinese startups, investing an estimated $2.5 billion. This represents a 50% drop from 2019 and a far cry from the nearly $20 billion seen in 2018 and $11 billion in 2017. It marks the lowest level of US capital deployment in Chinese startup compa-nies since 2013.
The boom in US venture capital investment in China during 2017-2018 was largely driven by US participation in massive later-stage fundraising rounds for Chinese technology firms like Ant Financial ($14 billion Series C round), Pinduoduo ($3 billion Series C round) and Bytedance ($3 billion Series D round). The declines in recent years mirror a broader slowdown in China’s technology and venture capital markets. The total number of fundrais-ing rounds by Chinese technology companies dropped from more than 15,000 in 2017 and 2018 to barely 8,000 in 2019 and 4,000 in 2020.
This slowdown reflects a cooling of investor sentiment after disappointing IPOs and “down rounds” (fundraising rounds with company valuations below those of previous fundraising rounds) reminded investors of the risks. Another factor is that Beijing has not been able to create a viable domestic alternative for technology company listings. The shutdown of the Ant Financial IPO has especially called into question whether larger tech firms will be able to successfully go public without having to drastically reduce their valuations due to government inter-vention. China’s tech-focused STAR market was met with much fanfare and an initial surge of IPOs and invest-ment but has slowed recently as oversight has increased. The termination rate of IPOs has also climbed steadily through the latter half of 2020.
In 2020, these pressures further intensified. The COVID-19 pandemic injected a tremendous amount of commer-cial uncertainty for companies in the first half of the year. Liquidity remained relatively tight as Beijing did not respond with significant monetary stimulus. In the second half of the year, the political risks linked to Chinese technology companies increased tremendously after Beijing intervened in the listing of Ant Financial in Hong Kong, raising questions about the balance between Communist Party control and the ability of private technology companies to scale their products in the Chinese economy.
Source: Rhodium Group based on Bloomberg, Pitchbook and other databases. *Includes China-headquartered venture capital fundraising transactions involving at least one investor ultimately owned by a US entity. Pro-rata value determined as US proportional share of each funding round’s value based on the number of participating investors.
Figure 10: Annual US Venture Capital Investment in China, 2000 to 2020USD million, count
Source: Rhodium Group based on Bloomberg, Pitchbook and other databases. *Includes US-headquartered venture capital fundraising transactions involving at least one investor ultimately owned by a mainland Chinese entity.

26
INDUSTRY AND TECHNOLOGY TRENDS
We break down our venture investment transactions data by industry and technology schemes. For industries, we assign mutually exclusive sector classifications to each investment target based on the Rhodium Group industry category—there are 14—that the company operates in. These industries are assigned based on the use case of a startup’s product or technology, not simply the product or technology itself. For example, a firm developing a soft-ware tool for managing human resources processes is coded with Financial and Business Services as the primary industry instead of Information and Communications Technology, which might be suggested by software develop-ment activities.
The top sector for US VC in China in 2020 was again Financial and Business Services with 54 unique funding rounds. One of the most prominent deals was investment in BOSS Zhipin, a recruitment application platform, which had a Series F funding round worth $270 million featuring GGV Capital.
• The top sector for US venture investment in China in 2020 was again Financial and Business Services with 54 unique funding rounds. One of the most prominent deals was investment in BOSS Zhipin, a recruitment application platform, which had a Series F funding round worth $270 million featuring GGV Capital.
• Health, Pharmaceuticals and Biotechnology was the second highest sector for US VC investment (52 unique funding rounds). Carsgen Therapeutics, MGI Tech, and Adagene all had funding rounds of close to $70 million, featuring US VC investors like GGV Capital, OrbiMed, and Y Combinator.
• Information and Communications Technology (ICT); Entertainment, Media and Education; and Consumer Products and Services were the next most important Chinese sectors for US venture investment, draw-ing around 39, 33, and 31 unique investments, respectively, in 2020. While funding rounds were down, Entertainment featured one of the largest deals, a nearly $2 billion funding round for ByteDance featuring the Carlyle Group.
Figure 11: Annual US Venture Capital Investment in China by Target Sector*Number of transactions
Source: Rhodium Group based on Bloomberg, Pitchbook and other databases. *Includes China-headquartered venture capital fundraising transactions involving at least one investor ultimately owned by a US entity.

27
In addition to mutually exclusive industry categories, we also code for around 50 unique technologies in con-nection with each transaction. These technologies are based on the specific methods and tools powering a firm’s products and services. Unlike industries that depend on mutually exclusive use cases, these technologies are not mutually exclusive, and firms may employ multiple technologies simultaneously. For example, a startup developing autonomous driving technology may be coded both as a developer of Autonomous Vehicles and of Artificial Intelligence technologies. Moreover, individual technologies commonly span multiple industries. For example, Artificial Intelligence has broad applications in sectors like automotive (e.g. self-driving technology), pharmaceuticals (e.g. drug discovery) and logistics (e.g. logistics network and route management), to name just a few.
This coding offers a unique perspective on which technology areas US venture investors in China have targeted more or less between the boom period (2017-2018) and the past two years (2019-2020). The transition between these two eras saw a 47% drop across all technologies.
The fall was felt more strongly in some technology areas than others. Figure 11 shows the changes among the top 10 most common technologies as well as the average fall felt across all transactions. Technology, Media, and Telecom (TMT), Fintech, Industrial, and Mobile all fell by over 60%, far above the average. E-commerce and “Software as a Service” (SaaS) participation fell closer to the average range. Big Data, AI and manufacturing tech-nology startups fell less than the average. The only positive outlier among the top 10 most commonly invested in technologies was Life Sciences, which saw a strong 55% increase between the two periods.
Source: Rhodium Group based on Pitchbook, Crunchbase, Bloomberg and proprietary research. Transactions count includes all funding rounds with at least one participating US-controlled venture fund (usually determined by general partner nationality) or other entity. One fundraising round can include multiple technology verticals.
Figure 12: US Participation in Chinese VC Funding Rounds, Selected Technologies, 2017-2018 vs. 2019-2020Percent change of funding round participation for Chinese startups involving each technology

28
OUTLOOK
China’s domestic VC industry is off to a strong start in 2021 as the economic recovery and relatively low valu-ations attract investment. Xingsheng Selected ($3b total), Lalamove ($1.5b total), and JD Property ($350m total) kicked off the first quarter with significant funding rounds. These large funding rounds were led by Chinese investors but US investment has also recovered. We estimate that China saw nearly $2 billion in new US venture investment in the first quarter of 2021—already close to the $2.5 billion total for all of 2020. US investors have participated in at least 65 funding rounds in the first three months of 2021, above the quarterly average during 2020 but still below the nearly 100 rounds per quarter seen in 2017-2018.
Still, the outlook remains clouded for several reasons.
For one, the recent crackdown on private technology firms has cast doubt on Beijing’s readiness to allow such firms play a prominent role in the economy. Previously rosy prospects for upcoming tech firms have now been called into question by investors as anti-monopoly measures and competition policy adjustments dampen enthusiasm for Chinese tech firms more broadly. While US tech firms have soared through the pandemic, Chinese firm valuations have lagged.
Two, the brute force intervention to halt Ant Group’s Hong Kong listing illustrates the risks associated with tech-nology assets in an environment where there is no real rule of law. While Ant Group is now projected to be able to IPO again, it will come at a much smaller valuation. All tech companies in China face the risk of swift political problems with little to no legal recourse.
Third, the renewed focus on nurturing a domestic technology ecosystem in key sectors like semiconductors is likely to tilt the playing field in favor of domestic players, especially in technologies with potentially sensitive applications. The emphasis on specific sectors limits the opportunities for US investors as Chinese companies may prefer to work with government funds with deeper pockets and fewer questions.

29
2.2 CHINESE VENTURE INVESTMENT IN THE US
Chinese venture investment abroad was limited until the late 2000s by the same structural issues hampering the development of China’s domestic venture capital ecosystem. A lack of experienced homegrown Chinese venture capital investors, as well as capital controls and other impediments to overseas investment, further suppressed activity. The US VC ecosystem is also much more developed and has less need for potentially politically sensitive Chinese investment.
However, since the late 2000s, Chinese venture investment abroad has increased substantially from a very low base. Chinese VC investment in the US took off after 2014, climbing above the $1 billion per year mark and hitting a peak of $4.7 billion in 2018. Investment dropped by almost half to $2.3 billion in 2019 after the enactment of FIRRMA, which made certain venture transactions subject to CFIUS review. Defying the pandemic and US-China tech-nology frictions, investment grew again in 2020 to $3.2 billion
OVERVIEWIn 2020, Chinese venture investors participated in 249 unique funding rounds for US startups, investing an esti-mated $3.2 billion. This represents a drop of 50 from the number of funding rounds in 2019 but an increase of $900 million in investment value.
While increased regulatory restrictions and the halt to global travel due to the pandemic made deal making more difficult and may have reduced the overall number of funding rounds, several large rounds kept the total higher than in any of the past six years other than 2018.
Figure 13: Annual Chinese Venture Capital Investment in the United States, 2010-2020*USD million, count
Source: Rhodium Group based on Pitchbook, Crunchbase, Bloomberg and proprietary research. Chinese transactions include all funding rounds with at least one participating Chinese-controlled venture fund (usually determined by general partner nationality) or other entity.

30
Figure 14: Annual Chinese Venture Capital Investment in the US by Target Sector*Number of transactions
Source: Rhodium Group based on Bloomberg, Pitchbook and other databases. *Includes US-headquartered venture capital fundraising transactions involving at least one investor ultimately owned by a mainland Chinese entity.
INDUSTRY AND TECHNOLOGY TRENDS
As described in Section 2.1, we assign mutually exclusive industry classifications to each investment target based on which of the 14 Rhodium Group industry categories the company primarily services or operates in.
• In 2020 the number of VC rounds per industry fell in most industries. The exception was Health, Pharmaceuticals and Biotechnology, which was by far the top target for Chinese venture capital in the US by the number of venture capital transactions (132 individual rounds). This industry also saw one of the largest deals, a Series C funding round for Lyell for nearly a half billion dollars, featuring Sequoia Capital China. Other major deals featuring Chinese investors included funding rounds for XtalPi, Apollomics, and Belief Biomed.
• Financial and Business Services investments dropped by over 30 rounds but remained in second (43 rounds). ICT came in third with 26 rounds, a slight decrease from 2019. The largest deal for Financial Services was an approximately $90 million funding round for Forge, a financial software company. The largest ICT deal was for Ambiq Micro, a Texas semiconductor firm.
• Consumer Products and Services investments fell significantly to 7 rounds from 22. There were no deals greater than $10 million. The largest deal was a series B funding round for Weee, a grocery delivery sales platform.

31
As with US venture investment in China, we track Chinese activity in the United States across more than 50 non-mutually exclusive technology areas. This coding offers unique insight into which trans-industry technol-ogy areas Chinese venture investors in the US are disproportionately targeting or avoiding.
As was the case in the other direction, the number of funding rounds for these technologies fell significantly between the two periods, dropping by %60. The drop was felt particularly hard in several sectors. Investments in SaaS, TMT, and Mobile oriented tech firms all fell by over 64% (Figure 15). While funding rounds for almost all technology areas fell significantly, HealthTech, Life Sciences, and Oncology were more resilient, showing continued strengths for areas related to biotechnology.
Source: Rhodium Group based on Pitchbook, Crunchbase, Bloomberg and proprietary research. Transactions count includes all funding rounds with at least one participating Chinese-controlled venture fund (usually determined by general partner nationality) or other entity. One fundraising round can include multiple technology verticals.
OUTLOOK
Preliminary data points to continued strength for Chinese VC activity in the US in the first quarter of 2021, with 92 transactions totaling $1.3 billion. These were mostly later stage investments in companies like self-driving cars firm PlusAI (Manbang Group, $243 million), pharmaceutical technology firm Neurelis (Cormorant and Decheng Capital, $76 million), and social media platform Reddit (Tencent, $90 million).
For the remainder of the year, we see several risks for Chinese VC in the US.
Figure 15: US Participation in Chinese VC Funding Rounds, Selected Technologies, 2017-2018 vs. 2019-2020 Percent change of total funding rounds for US startups involving each technology

32
First, valuations have become frothy in the US technology sector, reducing the relative attractiveness of these assets compared to those in China. Asset bubbles in the US mean there is abundant capital, limiting the need for Chinese VC unless the US company has specific interests in China.
Second, US startups already have good access to local investors without regulatory risk. A bifurcation of the US-China technology spheres has reduced incentives to bring on board Chinese VC investors for the sake of future Chinese market expansion.
Third, regulatory risks remain elevated—both from stepped-up CFIUS enforcement under the new FIRRMA statutes (CFIUS asking investors to submit VC transactions that were not voluntarily submitted since 2018) as well as possible new restrictions arising from the US government’s review of the “Emerging and Foundation-al Technologies” list. Greater regulatory scrutiny could reduce the synergies between US and Chinese markets for certain technologies, making it less attractive to seek Chinese capital for fundraising rounds.

33
Figure 16: Official and Rhodium Estimates for US-China Bilateral Holdings of Bond and Equity Securities
Source: Rhodium Group estimates are based on the inclusion of holdings through offshore locations and other adjustments. Official Figures taken from US Treasury TIC dataset as of December 31, 2020. See Full report appendix for more details
3. CONCLUSIONS AND OUTLOOK
The data presented in this report shows that the disruptions from the global pandemic have amplified existing geopolitical and regulatory headwinds to knock US-China direct and venture investment to the lowest level since the global financial crisis in 2009. However, the drop in bilateral investment was less than the global drop in FDI (-38%), in part due to the low base and in part due to an early recovery of the Chinese economy that helped stabilize US FDI flows to China.
It would be wrong to celebrate 2020 as a strong year in terms of two-way investment. Combined FDI and VC flows between the US and Chinese economies totaled $21.6 billion. That is a shockingly low number for two economies that in 2020 registered $560 billion in bilateral goods trade and $99 billion in services trade.
While traditional FDI flows remained low, shorter-term investments in stocks and bonds boomed in 2020. Official statistics put US-China portfolio holdings at $1.7 trillion at the end of last year, but our analysis has shown that actual holdings are at least twice that amount if one takes investments through offshore entities and other dis-tortions into account. These “passive” flows rose sharply as China opened the door wider to foreign investment in onshore debt markets, and as Chinese investors continued to leverage US capital markets for listings and other offshore fundraising.
34
Looking forward, two-way investment will be shaped by policy decisions taken in Washington and Beijing.
In China, the balance that leaders strike between domestic financial stability and openness to the outside world will shape the outbound investment landscape. Throughout the pandemic, Beijing prioritized stability, refus-ing to loosen restrictions on outbound investment by private companies despite a massive trade surplus and upward pressure on its currency. On the inflow side, the outlook is likely to hinge on whether Beijing delivers on its promises to level the playing field for foreign firms, its “dual circulation” strategy and its industrial policy push to replace foreign technology suppliers with domestic firms. A more challenging environment for traditional FDI could encourage foreign investors to seek greater exposure to Chinese assets through portfolio investment.
In the United States, the Biden administration has made clear that it will keep many core elements of the Trump administration’s China policy in place. But a change in style, that seeks to restore confidence in due process, transparency and non-discriminatory openness to foreign investment, seems likely. A shift away from aggres-sive decoupling rhetoric could help instill confidence in a joint future for industries that do not raise national security concerns. Aside from these broader questions, US leaders and lawmakers are exploring regulatory approaches that will directly or indirectly impact Chinese investors. Among the key questions are how US offi-cials will implement and enforce new rules for foreign investment reviews (FIRRMA) and export controls (ECRA). Supply chain safety rules, next generation antitrust policies, and new initiatives to protect personal data could all have a profound effect on Chinese companies and investors.
Aside from national policies, it will be important to keep an eye on broader geopolitical dynamics that could affect US-China technology flows. The arrival of a new US administration that is prioritizing cooperation with allies could promote more coordinated action among advanced countries in areas like investment screening, export controls and human rights. If such convergence brings more transparency and predictability around national security-related concerns, then it could support US-China investment in non-sensitive areas. But it could also trigger a broader rethink that incentivizes US and Chinese investors to shift their focus..
35
REFERENCES
American Chamber of Commerce in South China. White Paper on the Business Environment in China. (February 2021). http://www.amcham-southchina.org/amcham/static/publications/whitepaper.jsp
Bureau of Economic Analysis. Activities of Multinational Enterprises. (Washington DC, 1997-2021). http://bit.ly/2aPKtgs.
Bureau of Economic Analysis. New Foreign Direct Investment in the United States. (Washington DC, 2014-2021). http://bit.ly/2aPKtgs.
Bureau of Economic Analysis. United States Direct Investment Abroad. (Washington DC, 1982-2021). http://bit.ly/2aPKtgs.
China General Chamber of Commerce. Annual Business Survey Report on Chinese Enterprises in the United States. (August 2020). https://www.cgccusa.org/en/cgcc-2020-annual-business-survey-report-chinese-enterprises-in-the-united-states/
Enright, Michael J. Developing China. The Remarkable Impact of Foreign Direct Investment (Abingdon-on-Thames: Routledge, 2016).
Graham, Edward M., and Paul R. Krugman. 1995. Foreign Direct Investment in the United States. (Washington, DC: Peterson Institute for International Economics, 1995).
International Monetary Fund (IMF). Balance of Payments and International Investment Position Manual. (Washington, DC, 2009). http://www.imf.org/external/pubs/ft/ bop/2007/pdf/bpm6.pdf.
Kearney. The 2021 Foreign Direct Investment (FDI) Confidence Index. 2021. https://www.kearney.com/foreign-direct-investment-confidence-index/2021-full-report
Ministry of Commerce. 2021 Chinese Outward Direct Investment Statistical Yearbook]. (Beijing: China Statistics Press, 2019).
Moran, Theodore H., and Lindsay Oldenski. Foreign Direct Investment in the United States: Benefits, Suspicions, and Risks with Special Attention to FDI from China. (Washington, DC: Peterson Institute for International Economics, 2013).
Organisation for Economic Co-operation and Development. Benchmark Definition of Foreign Direct Investment—4th Edition. (Paris, 2008). http://www.oecd.org/document/33/0,3343, en_2649_33763_33742497_1_1_1_1,00.html.
Rhodium Group, National Committee on U.S.-China Relation. US-China Financial Investment: Current Scope and Future Potential. (January 2021). https://rhg.com/wp-content/uploads/2021/01/US-China-Financial-Investment_25Jan2021-2.pdf
Rhodium Group, National Committee on U.S.-China Relations. New Neighbors: 2017 Update. (New York, 2017). http://rhg.com/wp-content/uploads/2017/04/RHG_New-Neighbors_2017-Update_Reduced.pdf.
Rhodium Group, National Committee on U.S.-China Relations. Two-Way Street: 25 Years of US-China Direct Investment. (New York, 2016). www.us-china-fdi.com.
Rhodium Group, National Committee on U.S.-China Relations. Two-Way Street: 1H 2020 Update. (September 2020). https://publications-research.s3-us-west-2.amazonaws.com/RHG_TWS+1H+2020+Report_25Sept2020.pdf
State Administration of Foreign Exchange. China’s Balance of Payments. (Beijing, 2021). http://www.safe.gov.cn/.Stratford, Timothy P. Measures and Practices Restraining Foreign Investment in China. (Washington: Covington, 2014).
http://bit.ly/2aGneGT.
U.S.-China Economic and Security Review Commission, Rhodium Group. Chinese Investment in the United States: Recent Trends and the Policy Agenda. (Washington DC, 2016). http://bit.ly/2gQozPO.

36
APPENDIX: DATASETS AND COMPILATION METHODOLOGY
Direct Investment
Foreign Direct Investment (FDI) is a specific category of cross-border capital flows within the system of National Accounts, which is an internationally agreed upon standard set of principles for measuring economic activity used by the International Monetary Fund (IMF), the Organisation for Economic Co-operation and Devel-opment (OECD) and other international organizations. By definition, FDI entails cross-border capital flows that achieve significant influence over the management of an invested entity and a long-term investment relation-ship. The common threshold for a direct investment is 10% of equity or voting shares. The other four catego-ries of cross-border investment flows are portfolio investment, derivatives, other investments and reserves.
Most countries maintain official statistics on both FDI flows (the value of cross-border investments made during a specific period) and stocks (the total value of aggregate direct investment at a given time adjusted for valuation changes and exchange rate movements). Several international organizations also compile FDI data, including the IMF, United Nations Conference on Trade and Development (UNCTAD) and the OECD.
Traditional FDI data are known to be subject to a number of distortions, which makes them problematic to use for policy analysis. FDI data are not only released with a significant time lag, they may also be distorted by companies’ usage of holding companies, offshore vehicles and other complex accounting structures to take advantage of favorable tax policies. The extent of “round-tripping” and “trans-shipping” investments through a third location makes it increasingly difficult to track flows accurately. Those practices and complicated deal structures with “indirect” holdings also make it difficult for statistical agencies to correctly separate FDI from portfolio investment stakes.
This situation has encouraged economists and other analysts to find ways of working around existing gaps and distortions. One way of doing so is to compile alternative datasets that are based on tracking FDI trans-actions for specific countries or industries. The US-China Investment Project is based on proprietary datasets compiled by Rhodium Group based on such a transactional approach. The dataset includes FDI transactions that lead to significant ownership of assets of a long-term nature by US companies in Mainland China and vice versa.
Specifically, the dataset captures three types of transactions: (1) acquisitions of existing assets that results in at least 10% ownership stakes; (2) greenfield projects with at least 10% ownership stake (newly built facil-ities such as factories, warehouses, offices and R&D centers); (3) the expansion of existing FDI operations. The general threshold for transactions to be included in the two-way databases is $1 million. The US-China In-vestment Project’s data on direct investment only counts completed acquisitions and greenfield projects and expansions that have broken ground. Announced, rumored or pending transactions are not included. Similarly, we do not include portfolio investment transactions (debt or equity stakes of less than 10%). Reverse merger transactions, flows related to Chinese firms listing their assets in US securities markets, cooperation agree-ments and procurement contracts are not recorded.

37
Venture Capital
The venture capital data presented in this report come from a second proprietary Rhodium dataset on venture capital investments made by Chinese nationals, corporations and other entities in US-headquartered startups.
This dataset covers equity investments from the angel and seed stages through all later-stage, pre-IPO funding rounds. It includes direct transactions involving mainland Chinese investors as well as investments through mainland Chinese-owned subsidiary firms domiciled elsewhere. Where partnership structures are used as investment vehicles, investments are counted based on the ownership of the general partner, which is the entity with the decision-making authority over fund capital deployment.
Venture capital investments are recorded at the closing date of the relevant investment or fundraising round, with each fundraising round comprising a single transaction having potentially multiple investors. Where only total fundraising round values are publicly disclosed and individual investment sizes are unknown, a Chinese investment total is estimated by assigning a pro-rata share of the total fundraising round value to all Chinese participants based on the total number of known fundraising round investors. Transactions with no known investment totals are included in the dataset at zero value.
The dataset does not include venture investments made by entities domiciled in mainland China that are ultimately non-Chinese owned. It does also not include investments in firms headquartered in other countries that have operations in the United States.
While venture investments sometimes include stakes of more than 10 percent in a target company and may therefore qualify as direct investments, to avoid double counting all venture capital investments are confined to this data set regardless of stake size.
Data Visualization
The US-China Investment Project database is constantly updated, even for previous time periods. More details on the data methodology, research reports and an interactive data visualization are available on the US-China Investment Project website (www.us-china-investment.org).

38

WWW.US-CHINA-INVESTMENT.ORG