type 1390-b random noise generator - iet labs noise generator.pdf · phone tests, psychoacoustic...
TRANSCRIPT
OPERATING INSTRUCTIONS
TYPE 1390-B
RANDOM-NOISE GENERATOR
GENERAL RADIO COMPANY
K
-(...) ~ 0 I
G"
OPERATING INSTRUCTIONS
TYPE 1390-8
RANDOM-NOISE GENERA TOR
Form 1390-0100-K November, 1965
GENERAL RADIO COMPANY WEST CONCORD, MASSACHUSETTS, USA

SPECIFICATIONS
Frequency Range: 5 c/s to 5 Mc/s. Output Voltage: Maximum open-circuit output is at least 3 V for 20-kc range, 2 V for 500-kc range, and 1 V for 5-Mc range. Output Impedance: Source impedance for maximum output is approximately 900 fl. Output is taken from a 2500-fl potentiometer. Source impedance for attenuated output is 200 fl. One output terminal is grounded.
Typical Spectrum Level Range with 1-V, rrns, output)
20 kc/s 5 mV for 1-cycle band 500 kc/s 1.2 mV for 1-cycle band 5 Me/ s 0.6 mV for 1-cycle band
Spectrum Level Uniformity*
within ± 1 dB, 20 c/s to 20 kc/s within ± 3 dB, 20 c/s to 500 kc/s within ± 3 dB, 20 c/ s to 500 kc/s; within ± 8 dB, 500 kc/s to 5 Mc/s
• Noise energy also present beyond these limits. Level is down 3 dB at 5 cfs. See plot.
Waveform: Noise source has good normal, or Gaussian, distribution of amplitudes for ranges of the frequency spectrum that are
5
~ 0 UJ aJ u -5 UJ 0
I r
I
narrow compared to the band selected. Over wide ranges the distribution is less symmetrical because of dissymmetry introduced by the gas tube. Some clipping occurs on the 500-kc and 5-Mc ranges. Voltmeter: Rectifier-type averaging meter measures output. It is calibrated to read rms value of noise. Attenuator: Multiplying factors of 1.0, 0.1, 0.01, 0.001, and 0.0001. Accurate to ±3% to 100 kc/s, within ± 10% to 5 Mc/s. Power Required: 105 to 125 or 210 to 250 V, 50 to 400 c/s, 50 W. Accessories Supplied: TYPE CAP-22 Power Cord, spare fuses. Accessories Available: Rack-adaptor panel (panel height 7 in).
Mechanical Data: Convertible-Bench Cabinet Net
Width Height Depth Weight Shipping
Weight
kg
7.5
For additional information, ask for General Radio Reprint E-110.
5Mc l RANGE'\
\ ./
~ ; \ ~fOkc '~500kc
RANGE ~RANGE ,\ -10
lc 5c IOc IOOc Ike IOkc IOOkc I Me lOMe FREQUENCY
TABLE
Section 1 INTRODUCTION
1. 1 Purpose . . . . 1.2 Description . . .
OF
Section 2 THEORY OF OPERATION
2. 1 General . . . . . . . . 2.2 Output Voltage . . . . . . 2.3 Characteristics of Noise Output
CONTENTS
2.4 Departures of Output from True Randomness 2.5 Frequency Spectrum of Noise . . . . . 2.6 Analysis of Noise by Constant-Percentage Analyzers 2.7 Type 1390-P2 Pink-Noise Filter
Section 3 INSTALLATION .
3. 1 Bench Mounting 3.2 Relay-Rack Mounting . 3.3 Power Supply Connection
Section 4 OPERATING PROCEDURE
4. 1 Start-Up . . . . 4.2 Frequency Control 4.3 Output Control 4.4 Voltmeter 4.5 Load . . . 4.6 Hum . . . 4.7 Applications
Section 5 SERVICE AND MAINTENANCE
5. 1 General . . . . 5.2 Access to Components 5.3 Preliminary Checks . 5.4 Meter Does Not Read . 5.5 Tube Replacement 5.6 Hearer Voltage of Type 6D4 Gas Tube 5.7 Voltage Measurements
PARTS LIST. . . . . . .
1 1
2 2 2 2 4 4 4 4
6
6 6 6
6
6 6 6 6 7 7 7
11
11 11 11 11 11 11 11
13
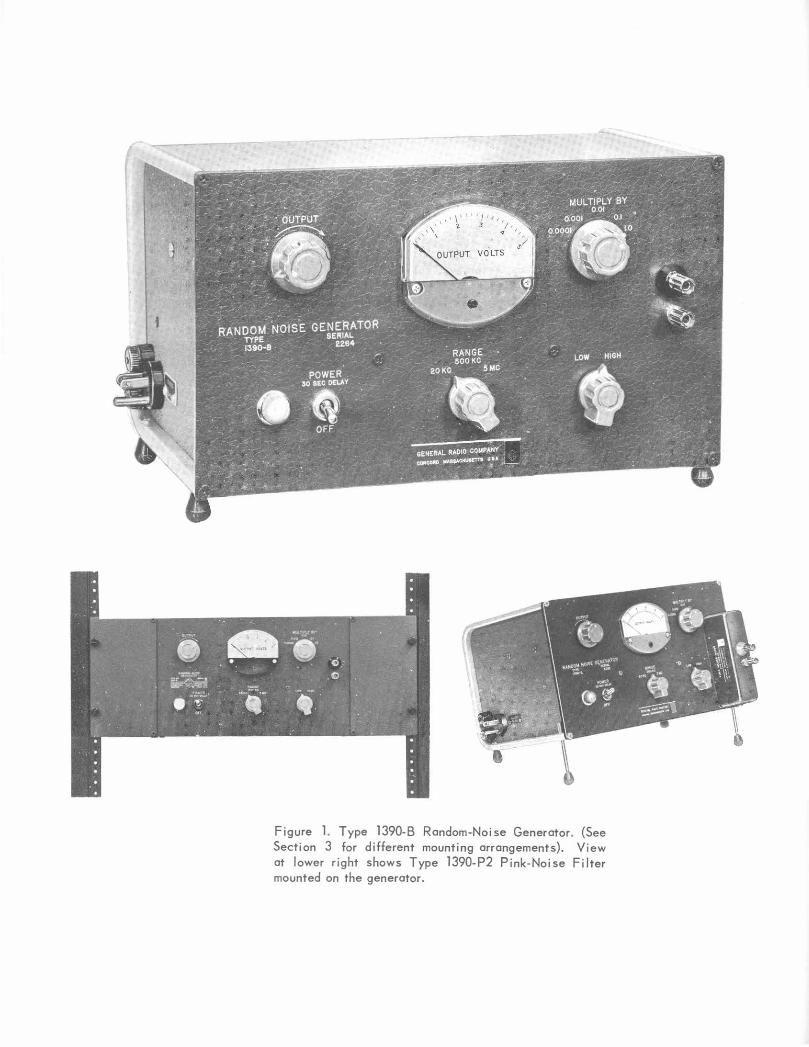
Figure 1. Type 1390-B Random-Noise Generator. (See Section 3 for different mounting arrangements). View at lower right shows Type 1390-P2 Pink-Noise Filter mounted on the generator.
TYPE 1390-B
RANDOM-NOISE GENERATOR
Section 1
INTRODUCTION
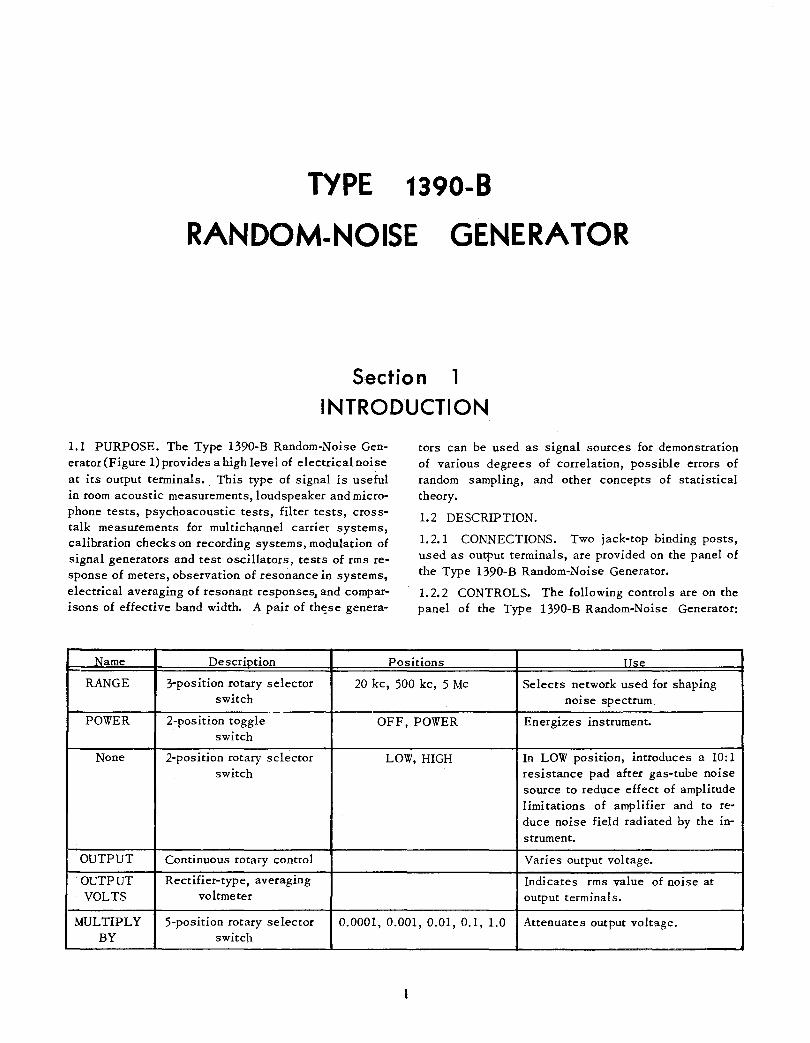
1.1 PURPOSE. The Type 1390-B Random-Noise Generator (Figure 1) provides a high level of electrical noise
at its output terminals. This type 'of signal is useful in room acoustic measurements, loudspeaker and microphone tests, psychoacoustic tests, filter tests, crosstalk measurements for multichannel carrier systems, calibration checks on recording systems, modulation of signal generators and test oscillators, tests of rms response of meters, observation of resonance in systems, electrical averaging of resonant responses, and comparisons of effective band width. A pair of th~se genera-
tors can be used as signal sourc.es for demonstration of various degrees of correlation, possible errors of random sampling, and other concepts of statistical theory.
1.2 DESCRIPTION.
1. 2.1 CONNECTIONS. Two jack-top binding posts, used as output terminals, are provided on the panel of the Type 1390-B Random-Noise Generator.
1. 2. 2 CONTROLS. The following controls are on the panel of the Type 1390-B Random-Noise Generator:
Name Descriotion Positions _lls_e_
RANGE 3-position rotary selector 20 kc, 500 kc, 5 Me Selects network used for shaping switch noise spectrum
POWER 2-position toggle OFF, POWER Energizes instrument. switch
None 2-position rotary selector LOW, HIGH In LOW position, introduces a 10:1 switch resistance pad after gas-tube noise
source to reduce effect of amplitude limitations of amplifier and to re-duce noise field radiated by the in-strument.
OUTPUT Continuous rotary control Varies output voltage.
OUTPUT Rectifier-type, averaging Indicates rms value of noise at VOLTS voltmeter output terminals.
MULTIPLY 5-position rotary selector 0.0001, 0.001, 0.01, 0.1, 1.0 Attenuates output voltage. BY switch
GENERAL RADIO COMPANY
Section 2
THEORY OF
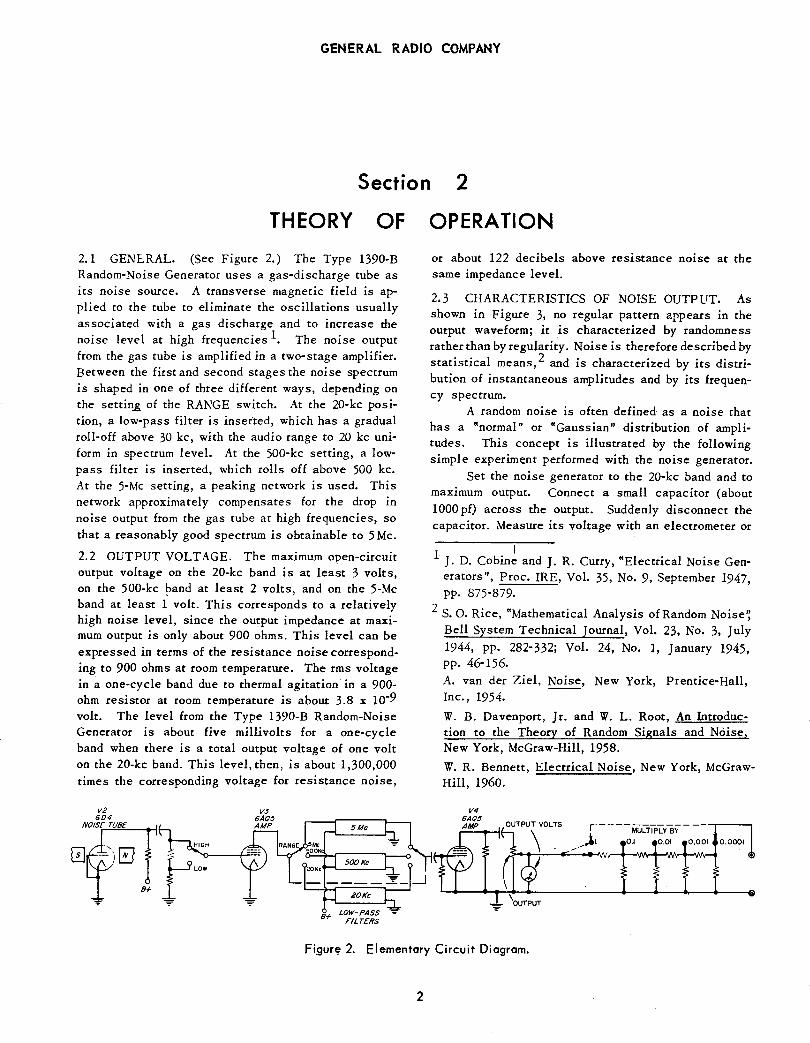
2.1 GENERAL (See Figure 2.) The Type 1390-B Random-Noise Generator uses a gas-discharge tube as its noise source. A transverse magnetic field is applied to the tube to eliminate the oscillations usually associated with a gas discharge and to increase the noise level at high frequencies 1• The noise output from the gas tube is amplified in a two-stage amplifier. Between the first and second stages the noise spectrum is shaped in one of three different ways, depending on the setting of the RANGE switch. At the 20-kc position, a low-pass filter is inserted, which has a gradual roll-off above 30 kc, with the audio range to 20 kc uniform in spectrum level. At the 500-kc setting, a lowpass filter is inserted, which rolls off above 500 kc. At the 5-Mc setting, a peaking network is used. This network approximately compensates for the drop in noise output from the gas tube at high frequencies, so
that a reasonably good spectrum is obtainable to 5 Me.
2.2 OUTPUT VOLTAGE. The maximum open-circuit output voltage on the 20-kc band is at least 3 volts, on the 500-kc band at least 2 volts, and on the 5-Mc band at least i volt. This corresponds to a relatively high noise level, since the output impedance at maximum output is only about 900 ohms. This level can be expressed in terms of the resistance noise corresponding to 900 ohms at room temperature. The rms voltage in a one-cycle band due to thermal agitation in a 900-ohm resistor at room temperature is about 3.8 x 10⁻⁹ volt. The level from the Type 1390-B Random-Noise Generator is about five millivolts for a one-cycle band when there is a total output voltage of one volt on the 20-kc band. This level, then, is about 1,300,000 umes the corresponding voltage for resistance noise,
LOW-PASS "'!!' B+ FILTERS
OPERATION
or about 122 decibels above resistance noise at the same impedance level.
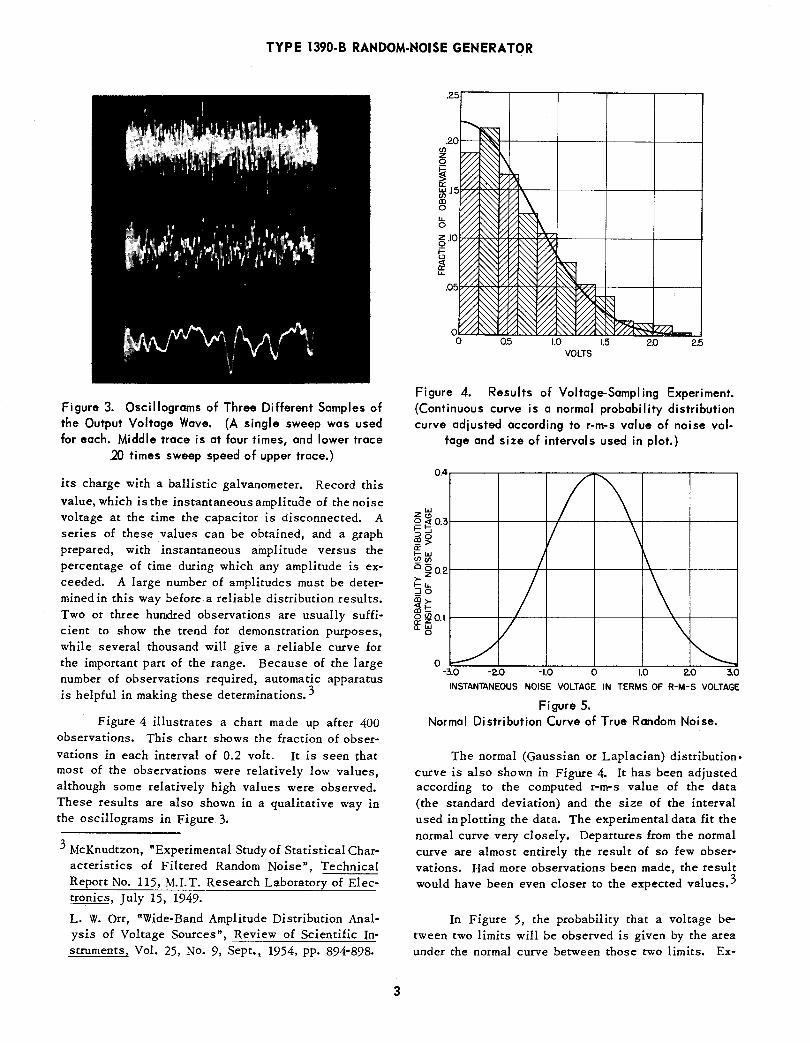
2.3 CHARACTERISTICS OF NOISE OUTPUT. As shown in Figure 3, no regular pattern appears in the output waveform; it is characterized by randomness rather than by regularity. Noise is therefore described by statistical means, 2 and is characterized by its distribution of instantaneous amplitudes and by its frequency spectrum.
A random noise is often defined as a noise that has a "normal" or "Gaussian" distribution of amplitudes. This concept is illustrated by the following simple experiment performed with the noise generator.
Set the noise generator to the 20-kc band and to maximum output. Connect a small capacitor (about 1000 pf) across the output. Suddenly disconnect the capacitor. Measure its voltage with an electrometer or
I 1 J. D. Cobine and J. R. Curry, "Electrical Noise Gen-
erators", Proc. IRE, Vol. 35, No. 9, September 1947, pp. 875-879.
2 S. 0. Rice, "Mathematical Analysis of Random Noise'; Bell System Technical Journal, Vol. 23, No. 3, July
1944, pp. 282-332; Vol. 24, No. 1, January 1945, pp. 46-156.
A. van der Ziel, Noise, New York, Prentice-Hall, Inc., 1954.
W. B. Davenport, Jr. and W. L. Root, An Introduction to the Theory of Random Signals and Noise, New York, McGraw-Hill, 1958.
W. R. Bennett, Electrical Noise, New York, McGrawHill, 1960.
Fi_gur~ 2. Elementary Circuit Diagram.
2
TYPE 1390-B RANDOM-NOISE GENERATOR
Figure 3. Oscillograms of Three Different Samples of the Output Voltage Wave. (A single sweep was used for each. Middle trace is at four times, and lower trace
20 times sweep speed of upper trace.)
its charge with a ballistic galvanometer. Record this
value, which is the instantaneous amplituae of the noise voltage at the time the capacitor is disconnected. A series of these values can be obtained, and a graph prepared, with instantaneous amplitude versus the percentage of time during which any amplitude is exceeded. A large number of amplitudes must be determined in this way before a reliable distribution results. Two or three hundred observations are usually sufficient to show the trend for demonstration purposes, while several thousand will give a reliable curve for the important part of the range. Because of the large number of observations required, automatic apparatus is helpful in making these determinations. 3
Figure 4 illustrates a chart made up after 400 observations. This chart shows the fraction of observations in each interval of 0.2 volt. It is seen that most of the observations were relatively low values, although some relatively high values were observed. These results are also shown in a qualitative way in the oscillograms in Figure 3.
3 McKnudtzon, "Experimental Study of Statistical Characteristics of Filtered Random Noise", Technical Report No. 115, M.I. T. Research Laboratory of Electronics, July 15, 1949.
L. W. Orr, "Wide-Band Amplitude Distribution Analysis of Voltage Sources", Review of Scientific Instruments, Vol. 25, No. 9, Sept., 1954, pp. 894-898.
3
.2sr----,------,r---..... -----.-----,
~ 0
~ ~ ~ .15W.71":~17+?1\---+----I---+---l Ill 0 u. 0
~ .IOV7'7fo.~f7t,"*~'A-'71-----f---+---1
§ g
2.0 2.5
Figure 4. Results of Voltage-Sampling Experiment. (Continuous curve is a normal probability distribution curve adjusted according to r-m-s value of noise vol-
tage and size of intervals used in plot.)
0.4
zw Q~0.3 1-:.J =>o ~> tr 1-UJ en en 0 ~0.2 )-1-u. :Jo ii'i)<(1-ID-
~~0.1 0
j
I
I \ 1/ \
1\
\ \ v 0
-3.0
v ~
-2.0 -1.0 0 1.0 2.0 3.0 INSTANTANEOUS NOISE VOLTAGE IN TERMS OF R-M-S VOLTAGE
Figure 5. Normal Distribution Curve of True Random Noise.
The normal (Gaussian or Laplacian) distribution• curve is also shown in Figure 4. It has been adjusted according to the computed r-m·s value of the data (the standard deviation) and the size of the interval used in plotting the data. The experimental data fit the normal curve very closely. Departures from the normal curve are almost entirely the result of so few observations. Had more observations been made, the result would have been even closer to the expected values. 3
In Figure 5, the probability that a voltage between two limits will be observed is given by the area under the normal curve between those two limits. Ex-
GENERAL RADIO COMPA~Y
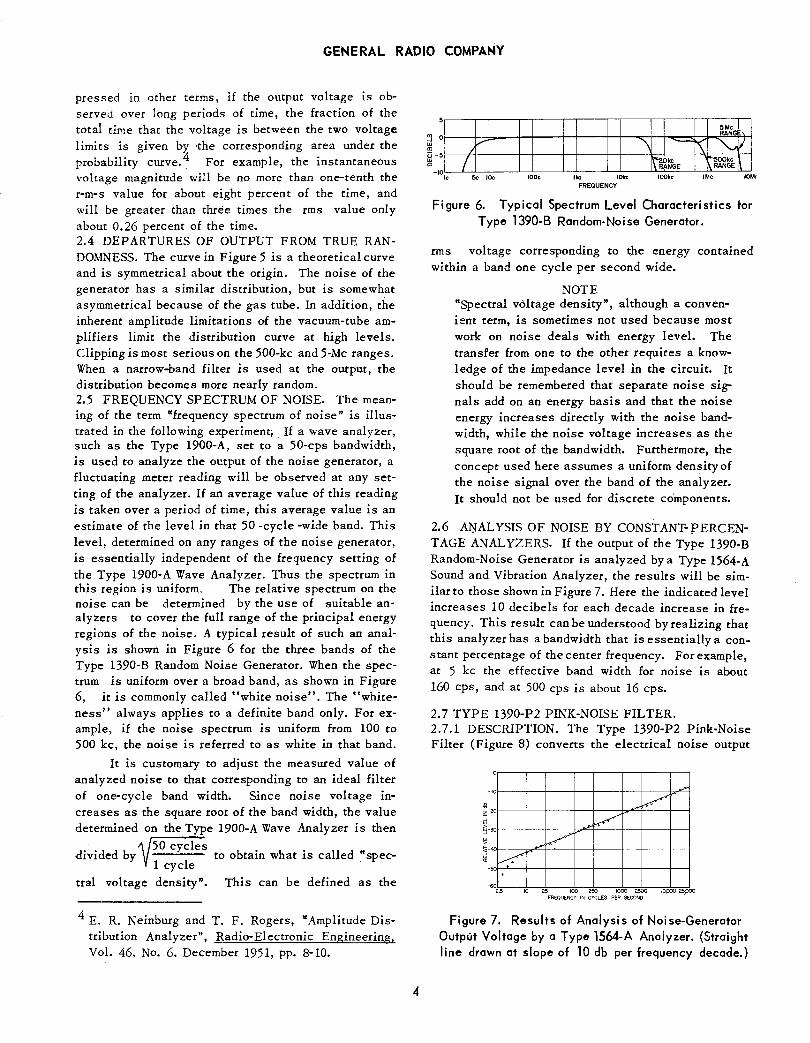
pressed in other terms, if the output voltage is observed over long periods of time, the fraction of the total time that the voltage is between the two voltage limits is given by ·the corresponding area under the probability cutve. 4 For example, the instantaneous voltage magnitude will be no more than one-tenth the r-m-s value for about eight percent of the time, and will be greater than three times the rms value only about 0. 26 percent of the time. 2.4 DEPARTURES OF OUTPUT FROM TRUE RANDOMNESS. The cutve in Figure 5 is a theoretical curve and is symmetrical about the origin. The noise of the generator has a similar distribution, but is somewhat asymmetrical because of the gas tube. In addition, the inherent amplitude limitations of the vacuum-tube amplifiers limit the distribution cutve at high levels. Clipping is most serious on the 500-kc and 5-Mc ranges. When a narrow-band filter is used at the output, the distribution becomes more nearly random. 2.5 FREQUENCY SPECTRUM OF NOISE. The meaning of the term "frequency spectrum of noise" is illustrated in the following experiment; . If a wave analyzer, such as the Type 1900-A, set to a 50-cps bandwidth, is used to analyze the output of the noise generator, a fluctuating meter reading will be observed at any setting of the analyzer. If an average value of this reading is taken over a period of time, this average value is an estimate of the level in that 50 -cycle -wide band. This level, determined on any ranges of the noise generator, is essentially independent of the frequency setting of the Type 1900-A Wave Analyzer. Thus the spectrum in this region is uniform. The relative spectrum on the noise can be determined by the use of suitable analyzers to cover the full range of the principal energy regions of the noise. A typical result of such an analysis is shown in Figure 6 for the three bands of the Type 1390-B Random Noise Generator. When the spectrum is uniform over a broad band, as shown in Figute 6, it is commonly called "white noise". The "whiteness" always applies to a definite band only. For example, if the noise spectrum is uniform from 100 to 500 kc, the noise is referred to as white in that band.
It is customary to adjust the measuted value of analyzed noise to that corresponding to an ideal filter of one-cycle band width. Since noise voltage increases as the square root of the band width, the value determined on the Type 1900-A Wave Analyzer is then
Y50 cycles divided by to obtain what is called "spec-
1 cycle
tral voltage density". This can be defined as the
4 E. R. Neinburg and T. F. Rogers, "Amplitude Distribution Analyzer", Radio-Electronic Engineering, Vol. 46, No. 6. December 1951, pp. 8-10.
4
I I ~~~G~ ,.... '(I~ \ ~ ~ 0
"' "' u -5
I ~Okc l'1~0kc ~ "' 0
-10 lc 5c JOe IOOc Ike JOke
FREQUENCY
RANGE RANGE
/OOkc I Me I OM<
Figure 6. Typical Spectrum Level Characteristics tor Type 1390-B Random-Noise Generator.
rms voltage corresponding to ~he energy contained within a band one cycle per second wide.
NOTE "Spectral voltage densiry", although a convenient term, is sometimes not used because most work on noise deals with energy level. The transfer from one to the other requires a knowledge of the impedance level in the circuit. It should be remembered that separate noise signals add on an energy basis and that the noise energy increases directly with the noise bandwidth, while the noise voltage increases as the square root of the bandwidth. Furthermore, the concept used here assumes a uniform densiryof the noise signal over the band of the analyzer. It should not be used for discrete co'mponents.
2.6 AJ':lALYSIS OF NOISE BY CONSTANT-PERCENTAGE ANALYZERS. If the ou~ut of the Type 1390-B Random-Noise Generator is analyzed by a Type 1564-A Sound and Vibration Analyzer, the results will be similar to those shown in Figure 7. Here the indicated level increases 10 decibels for each decade increase in frequency. This result can be understood by realizing that this analyzer has a bandwidth that is essentially a constant percentage of the center frequency. For example, at 5 kc the effective band width for noise is about 160 cps, and at 500 cps is about 16 cps.
2.7 TYPE 1390-P2 PINK-NOISE FILTER. 2.7.1 DESCRIPTION. The Type 1390-P2 Pink-Noise Filter (Figute 8) converts the electrical noise output
0
-I 0 ,?'
0 v ~
0 v ~
-5 0 • . -6 0
25 JO 25 100 250 1000 2500 10,000 25f>OO FREQUENCY IN CYCLES PER SECOND
Figure 7. Results of Analysis of Noise-Generator Output Voltage by a Type 1564-A Analyzer. {Straight line drawn at slope of 10 db per frequency decade.)

TYPE 1390-B RANDOM-NOISE GENERATOR
of the Type 1390-B Random-Noise Generator to "pink noise" (constant energy per octave) which facilitates measurements with constant-percentage-bandwidth analyzers. It is designed to plug into the output binding posts of the Type 1390-B Random-Noise Generator, but can also be used at any point in a system where this filter characteristic is needed. The filter is an RC low-pass filter with a slope of -3 db per octave from 20 cycles to 20 kc and a slope of -6 db at higher frequencies (See Figure 9). For shielding, the case of the filter is grounded to the LO input and output terminals. Figure 10 is a schematic diagram of the filtP.r. The input terminals of the Type 1390 -P2 Filter are recessed plugs at the rear and the output terminals are binding posts on the front .
Figure 8. Type 1390-P2 Pink-Noise Filter.
2.7.2 USE WITH THE TYPE 1390-B RANDOM-NOISE GENERATOR. Plug the Type 1390-P2 Pink-Noise Filter into the output terminals of the Type 1390-B Random-Noise Generator. The impedance of the load connected to the output terminals of the filter should not be less than 20 kilohms.
On the Random-Noise Generator, set the RANGE switch to 20 kc, the LOW-HIGH switch to HIGH, and the MULTIPLY BY switch to 1.0. The output of the Pink-Noise Filter will be approximately 30 db below its input and the level in each one-third-octave band will be approximately 17 db below that. Thus, when the output meter of the Random-Noise Generator indicates 3 volts, the output of the filter will be approximately 0.1 volt and the level in each one- third- octave band will be approximately 15 millivolts.
2.7.3 USE IN OTHER APPLICATIONS. When the Type 1390-P2 Pink-Noise Filter is used in a system at some point other than the output terminals of the RandomNoise Generator, the input source to the filter should have an impedance of less than 1 kilohm. Input connections can be made with clip leads or Type 274-MB Double Plugs to the recessed input terminals. The impedance of the load connected to the output terminals should not be less than 20 kilohms.
2 .7.4 FREQUENCY-RESPONSE MEASUREMENTS. In many acoustical systems, frequency response measurements made with a sine-wave tone source are difficult to interpret because of the large amplitude flue-
5
· 10
r""-I' r-....
I' r-....
~
' ~ '\
\ ·00 \
1\ IOe IOOe llr.c IOII.c 100 • •
f"AEEU!NCY
Figure 9. Typical frequency response of the Type 1390-P2 Pink-Noise Filter.
tuations that may occur. When the measurements are made by effectively averaging the data over a narrow range of frequencies, response curve is considerably smoother and much easier to use. In the past, "warble tones" have been used for this purpose. A more convenient method, however, is to use pink-noise as the tone source and a constant-percentage-bandwidth . analyzer (such as the Type 1564-A Sound and Vibration Analyzer) with one-third octave bandwidth as the frequency-determining element in the receiving system. 5
Theresults of these frequency-response measurements can be conveniently recorded on the Type 1521 Graphic Level Recorder. 6
2.7.5 USE AS A NOISE SIMULATOR. Some noises that occur in nature are closer in spectral characteristics to pink noise than to white noise. This is true, for instance, of the low-frequency noise in semiconductors and of some acoustical background noises. To simulate electrical signals generated in such cases, it is convenient to use pink noise. r-- ---------- - - --- -l I /",:C / 0/ I c//0/
I @ I I I I I
HI
I so I
URC£
I I I I LO
I IP. '1: / 02
AVO/ 6.49K
.eto% .3.09K
:: C / 01 J
I .R/ 0.3 ~~0~ I !JS3 309 I
I :: t.~J
I I
:: CI OZ :: ~ C / 03 I (7.287 0.08Gfl I I I
..,~ I L _______ -------- ---- -- _ _j
'"
L OAD 20K )
LO
Figure 10. Schematic diagram of the Pink-Noise Filter.
5 .. A New Analyzer for Sound and Vibration" , General Radio Experimenter, Volume 33 , Number 12, December, J959.
"A Graphic Level Recorder with High Sensitivity and Wide Ranges" , General Radio Experimenter, Volume 33, Number 6 , June, 1959.
GENERAL RADIO COMPANY
Section 3
INSTALLATION
3.1 BENCH MOUNTING. To set the instrument in a tilted position (shown in inset of Figure 1), simply pull each front leg down as far as possible and then turn the leg so that its notch faces the back of the instrument.
To restore the leg to its retracted position, turn it to release the catch and push the leg up.
3.2 RELAY-RACK MOUNTING. Type 480-P412 Panel Extensions are available to adapt the Type 1390-B Random-Noise Generator for relay-rack mounting. To mount the Type 1390-B Random-Noise Generator in a relay rack, first attach the two panel extensions to the instrument. Remove the two screws in the upper and lower corners on one side of the panel. These screws fasten the panel to the aluminum end frames. Place one of the extensions in the front of the panel so that the corner holes on the plate line up with those on the instrument and replace the two screws.
Attach the second extension on the other side of
the instrument panel in the same manner. The instrument can then be mounted in a standard 19-inch relay rack.
3.3 CONNECTION- TO POWER SUPPLY. Connect the Type 1390-B to a source of power as indicated by the legend at the input socket at the rear of the instrument, using the power cord provided. While instruments are normally supplied for 115-volt operation, the power transformer can be reconnected for 230-volt service (see schematic diagram, Figure 12). When changing connections, be sure to replace line fuses with those of current rating for the new input voltage (refer to Parts List). Appropriate measures should be taken so that the legend indicates the new input voltage. On instruments changed from 230 to 115 volts, this simply means removal of the 230-v nameplate; a 115-v legend is marked beneath. For instruments changed to 230 volts, a nameplate {Type 5590-1664) may be ordered from General Radio.
Section 4
OPERATING
4.1 START-UP. Turn the POWER switch on. After 30 seconds, when the heater of the Type 6D4 thyratron tube has warmed up, plate voltage is applied by an internal time-delay relay. (Simultaneous application of heater and plate voltage would shorten the useful life of the thyratron tube and increase the drift in noiseoutput level on warm-up.)
4.2 FREQUENCY CONTROL The RANGE switch selects the network used for shaping the noise spec· trum. Markings indicate the upper frequency limits for which the noise spectrum is reasonably uniform.
4.3 OUTPUT CONTROL. Output controls are a switch for selecting LOW or HIGH output, an OUTPUT level control, and an output attenuator. In the LOW position, the switch introduces a 10:1 resistance pad after the gas-tube noise source. This reduces the effect of the
6
PROCEDURE
unavoidable amplitude limitations of the vacuum-tube amplifier and also reduces the noise field radiated externally by the instrument. To keep hum and microphonics to a minimum, however, it is generally advisable to operate the instrument in the HIGH position.
The OUTPUT level control is a continuous-type control that is used to vary the output voltage from a very low value to maximum for either setting of the output switch.
The MULTIPLY BY switch is used to provide low output levels. It has multiplying factors of 1.0, 0.1, 0.01, 0.001, and 0.0001.
4.4 VOLTMETER. A rectifier-type, averaging meter measures the output voltage. It is calibrated to indi
cate the rms value of the noise. When the MULTIPLY BY switch is at 1.0, the meter indicates directly the open-circuit voltage at the output terminals. In the other positions of the MULTIPLY BY switch, the open-
TYPE 1390·8 RANDOM-NOISE GENERATOR
circuit output voltage is the product of the meter reading and the multiplier reading.
The spectral voltage density of the noise at a given frequency is the r·m·s voltage corresponding to the energy contained within a band 1-cps wide centered on that frequency. The typical spectral voltage density at 1 kc with one volt output is approximately as follows:
(a) 20-kc band: 5 millivolts for one-cycle band. (b) 500-kc band: 1.2 millivolts for one-cycle band. (c) 5··MC: band: 0.6 millivolt for one-cycle band.
When an accurate value is quency, it should be measured. are intended only as a guide.
desired at any freThe values given
4.5 LOAD. The output is taken from a 2500-ohm potentiometer, and one output terminal is grounded. For a truly resistive load with the MULTIPLY BY switch at 1.0, the apparent source impedance is zero when a reading of the voltmeter is taken with the load connected, since the voltmeter reads the voltage across the load. As the output control is varied from the maximum to the minimum setting, the actual source impedance varies from about 900 ohms to nearly zero. When the MULTIPLY BY switch is in any position other than 1.0, the source impedance is 200 ohms.
A load that is not independent of frequency will affect the frequency spectrum of the output noise. For example, a capacitor shunted across the output terminals will decrease the level of the high-frequency noise more than it decreases the level of the noise at low frequencies. The voltmeter is then less indicative of the spectrum level than it is for a resistive load.
4.6 HUM. The hum level is u&ually more than 40 db below the over-all noise level in the HIGH output po· sltwn. This hum level is sufficiently low so that for most applications there is no effect from hum, even when an analyzer with a narrow band is used for analysis. The relative hum level in the HIGH output position is lower than that in the LOW position.
4. 7 APPLICATIONS.
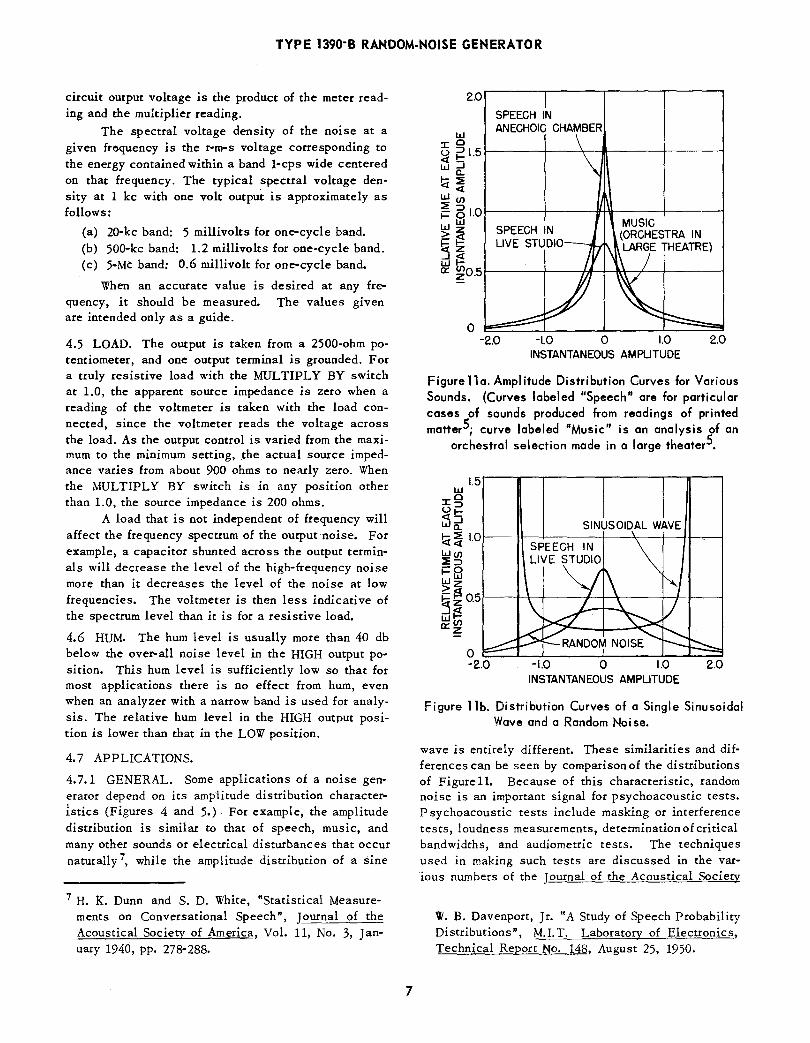
4. 7.1 GENERAL. Some applications of a noise generator depend on its amplitude distribution characteristics (Figures 4 and 5.) For example, the amplitude distribution is similar to that of speech, music, and many other sounds or electrical disturbances that occur naturally 7, while the amplitude distribution of a sine
7 H. K. Dunn and S. D. White, "Statistical Measurements on Conversational Speech", Journal of the Acoustical Society of America, Vol. 11, No. 3, January 1940, pp. 278·288.
7
2.0
0
SPEECH IN ANECHOIC CHAMBER
-2.0 -1.0 0 1.0 INSTANTANEOUS AMPLITUDE
2.0
Figure lla. Amplitude Distribution Curves for Various Sounds. (Curves labeled "Speech" are for particular cases of sounds produced from readings of printed matterS; curve labeled "Music" is an analysis of an
orchestral selection made in a large theaterS.
1.5
SINUSOIDAL WAVE
INSTANTANEOUS AMPLITUDE
Figure llb. Distribution Curves of a Single Sinusoidal Wave and a Random Noise.
wave is entirely different. These similarities and differences can be seen by comparison of the distributions of Figure 11. Because of this characteristic, random noise is an important signal for psychoacoustic tests. Psychoacoustic tests include masking or interference tests, loudness measurements, determination of critical bandwidths, and audiometric tests. The techniques used in making such tests are discussed in the various numbers of the Journal of the Acoustical Society
W. B. Davenport, Jr. "A Study of Speech Probability Distributions", M.I. T. Laboratory of Electronics, Technical Report No. 148, August 25, 1950.
GENERAL RADIO COMPANY
of America (for which there are two comprehensive indexes available) and in various psychological journals. A useful bibliography for these applications is S. S. Stevens, J. G. S. Loring, and Dorothy Cohen, Bibliography on Hearing, Harvard University Press, Cambridge, 1955, particularly those references listed in Sections 139 (p. 571), 157 (p. 573) and 222-228
(pp. 579 f). Other applications depend on the various pos
sible frequency spectra of noise. The frequency spectrum is independent of the amplitude distribution, in the sense that a normal distribution of amplitudes is possible with any frequency spectrum - flat, broad,
narrow, sloping, or peaked. Systems that affect one characteristic, however, may also affect the other. For example, nonlinear clipping affects both the amplitude distribution and the frequency spectrum. Linear filter networks used on purely random noise do not affect the randomness but alter the frequency characteristic and correspondingly the time scale. Linear filter networks used after clipped noise alter the frequency spectrum and also tend to make the noise more nearly random.
4.7.2 ELECTROACOUSTIC TESTS. The Type 1390-B Random-Noise Generator is a useful signal source for many types of electroacoustic tests, including loudspeaker-response tests. Some useful discussions of these tests using a noise source are given in the following: Leo. L Beranek, Acoustic Measurementsr New York, John Wiley and Sons, 1949, pp. 639-640, 665 f, 697-702; and RMA Standard SE-103, Speakers for Sound Equipment, April 1949, p. 6, Standard Test Signal BA.
Other General Radio instruments useful in electroacoustic tests are the Type 1551 Sound-Level Meter, the Type 1551-P1 Condenser Microphone System, the Types 1550-A and 1558 Octave-Band Noise Analyzers, the Type 1564-A Sound and Vibration Analyzer, and the Type 1521 Graphic Level Recorder.
4. 7. 3 ROOM ACOUSTICS TESTS. The noise generator is a useful signal source for many types of tests in room acoustics. These include reverberation tests, panel (wall and floor) transmission measurements, measurement of space irregularities, and measurement of steady-state signal transmission. For details, con
sult the following: Leo. L Beranek, Acoustic Mea· surements, New York, John Wiley and Sons, 1949, pp. 804ff, 826f, 831 and 883.
The Type 1551-B Sound-Level Meter,the Types 1550-A and 1558-A Octave-Band Analyzers, the Type 1564-A Sound and Vibration Analyzer, and the Type
8
1521 Graphic Level Recorder are useful elements in the over-all set-up for these tests.
4.7.4 STATISTICAL DEMONSTRATIONS. The properties o( noise that concern the amplitude-time relationship are usually described by statistical means 2. (Refer to paragraph 2. 3.)
Random-noise generators can be used to demonstrate some concepts of statistical theory. The equipment and methods for demonstrating various degrees of correlation and possible errors of random sampling are described by J. C. R. Licklider and E. Dzendolet, "Oscillographic Scatterplots Illustrating Various Degree~ of Correlation", Science, January 30, 1948, Vol. 107, No. 2770, pp. 121-124.
4. 7.5 NOISE AT HIGH FREQUENCIES. The noise generator can be used to modulate an r-f car:ier when a noise signal is desired at a frequency above 5Mc. The Type 1000-P6 Crystal Diode Modulator 8 is a suitable instrument for wide-band modulation, and the Type 1208-B VHF Unit0scillators 9and the Type 1209-B UHF Unit Oscillators are suitable rf oscillators covering the range from 65 to 920 Me.
Because of the two sidebands that result from the standard modulation techniques, the noise band can
be made to extend over a 10•Mc range, 5 Me on each side of the carrier. For some applications it may be desuable to use a suppressed-carrier or balanced-type modulator (see Terman, Radio Engineering Handbook, New York, McGraw-Hill Book Co., 1943, pp. 551-553). It is also possible to use a series of carriers and modulators to combine to give a much broader band of noise than 10 Me.
Some signal generators and oscillators include modulating circuits, so that an external source such as the Type l390-B Random-Noise Generator can be used to modulate the signal. Instruments of this type are the Types 1001-A, 1021-AU, and 1021-AV Standard Signal Generators. For these generators the modulation produced is limited to the audio range and to about 5 to 10 percent rms noise modulation, with peaks much higher. When a wider frequency band is desired, the Type 1000-P6 or some other external modulator should be used as described above.
8 Byers, W. F., ~An Amplitude Modulator for Video Frequencies", General Radio Experimenter, March 1950, Vol. 24, No. 10, pp. 6-8.
9 E. Karplus, "V-H-F and U-H-F Unit Oscillators", General Radio Experimenter, May 1950, Vol. 24, No. 12, pp. 7-11.
TYPE 1390-B RANDOM-NOISE GENERATOR
4.7.6 VERY HIGH NOISE LEVELS. When noise levels even higher than those provided by the Type 1390-B
Random-Noise Generator are desired, an amplifier should be used, such as the Type 1206-B Unit Amplifier. The Type 1233-A Power Amplifier is useful when
a wide frequency range is desired.
4. 7. 7 INTERFERENCE TESTS. Since noise is a common form of interfering or disturbing signal or signal that limits the threshold of detectability, the noise generator can be used to check receivers, communication systems, and detection systems for susceptibility to interference. It can also be used as a training aid for operators who must communicate through interference.
4.7.8 OVER-ALL CALIBRATION TESTS. The noise generator can be used as an over-all calibration device because of the wide frequency range available at the output. This calibration signal can be particularly useful in audio systems th_at involve a recording technique, and its use can frequently simplify the calibration procedure when an analyzer forms part of the system.1°
For example, when a magnetic tape recorder is used to record a signal to be measured on playback, reference signals must be recorded before and after the unknown signal is recorded. These reference signals permit one to fix levels and to determine response characteristics, which can vary from time to time depending on the condition of the tape and the machine. These reference signals are usually a series of tones at var· ious points in the frequency range of interest. The noise generator, due to the broad frequency band, permits the use of a more versatile reference signal. Thus a useful set of reference signals would be a burst of noise of about one-half minute duration and a burst of a 400-cycle tone of about the same length. These two signals would permit the determination of frequency response, signal-to-noise ratio, harmonic distortion (at one level and one frequency), and flutter.
To determine the frequency response by use of a noise signal, perform the following operations:
1. Set the noise generator to the 20-kc range. Conne~t it to the 'input of the system under test, at such a level that the r-rn-s input is at least 14 decibels below the sine-wav'e overload point.
2. Make a frequency spectrum analysis of the input noise signal and of the output noise signal from the device under test. The relative level of input and output as a fuaction of frequency is then the frequency
10s. S. Stevens, J. P. Egan, and G. A. Miller, "Methods of Measuring Speech Spectra", Journal of the Acoustical Society of America, Vol. 19, No. 5, Sep· tember 1947, pp. 771·780.
9
response of the device under test, unless spurious sig· nals are present in the output of the device.
3. Test for spurious signals by making an analysis of the output with no input signal applied.
When these measurements are made, the input and output must be analyzed by analyzers of the same effective bandwidth. The bandwidth of the analyzer should also be appreciably smaller than the bandwidth of the device under test. Furthermore, the ultimate attenuation of the analyzer should be much greater than variation in response that one expects to measure, so that it will not limit the observed response. Distortion and background noise in the device under test will also limit the range of variation in response that can be measured by this method, and it is therefore important to select the proper level for input signal.
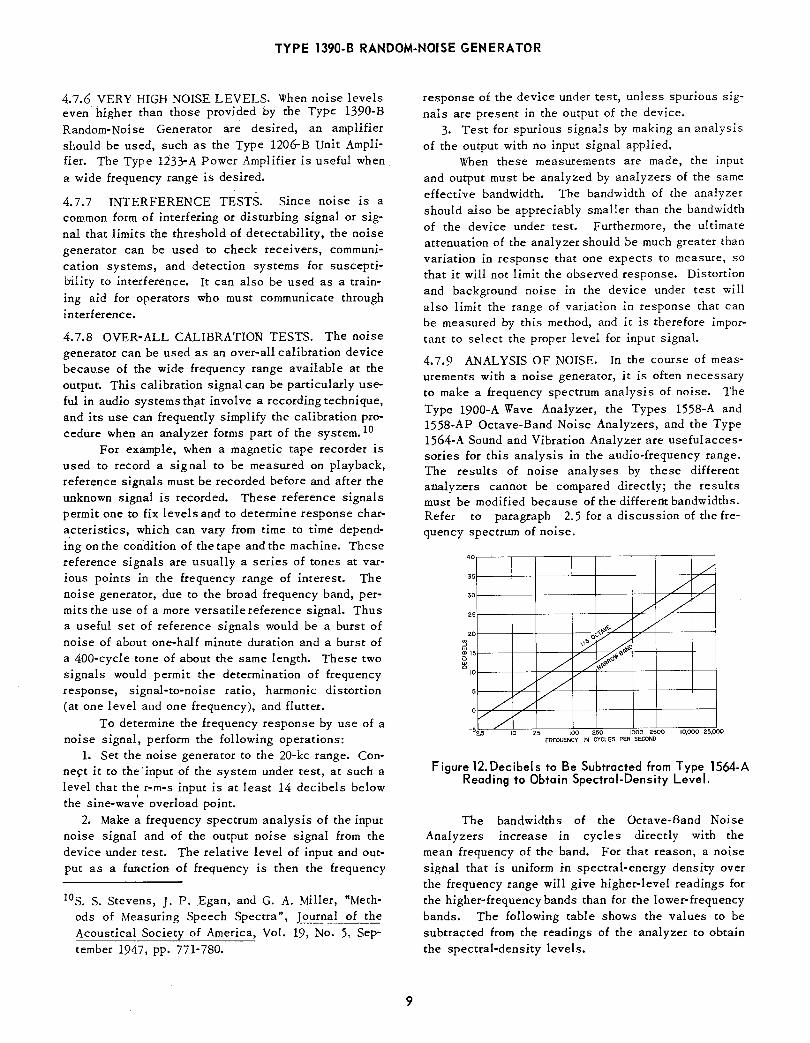
4. 7.9 ANALYSIS OF NOISE. In the course of measurements with a noise generator, it is often necessary to make a frequency spectrum analysis of noise. The
Type 1900-A Wave Analyzer, the Types 1558-A and 1558-AP Octave-Band Noise Analyzers, and the Type 1564-A Sound and Vibration Analyzer are usefulacces· sories for this analysis in the audio-frequency range. The results of noise analyses by these different analyzers cannot be compared directly; the results must be modified because of the different bandwidths. Refer to paragraph 2.5 for a discussion of the frequency spectrum of noise.
40
m -' w
35
30
5
20
"'' 5
~ 0
10
5
5
/
/ L
/ v/ ~~/ /
v ~ \
~" »o"'<> / ~
/ //
/ / /
// 50 2..5 10 25 100 250 1000 2500 10,000 2 • 00
FREQUENCY IN CYCLES PEA SECOND
Figure 12. Decibels to Be Subtracted from Type 1564-A Reading to Obtain Spectral-Density Level.
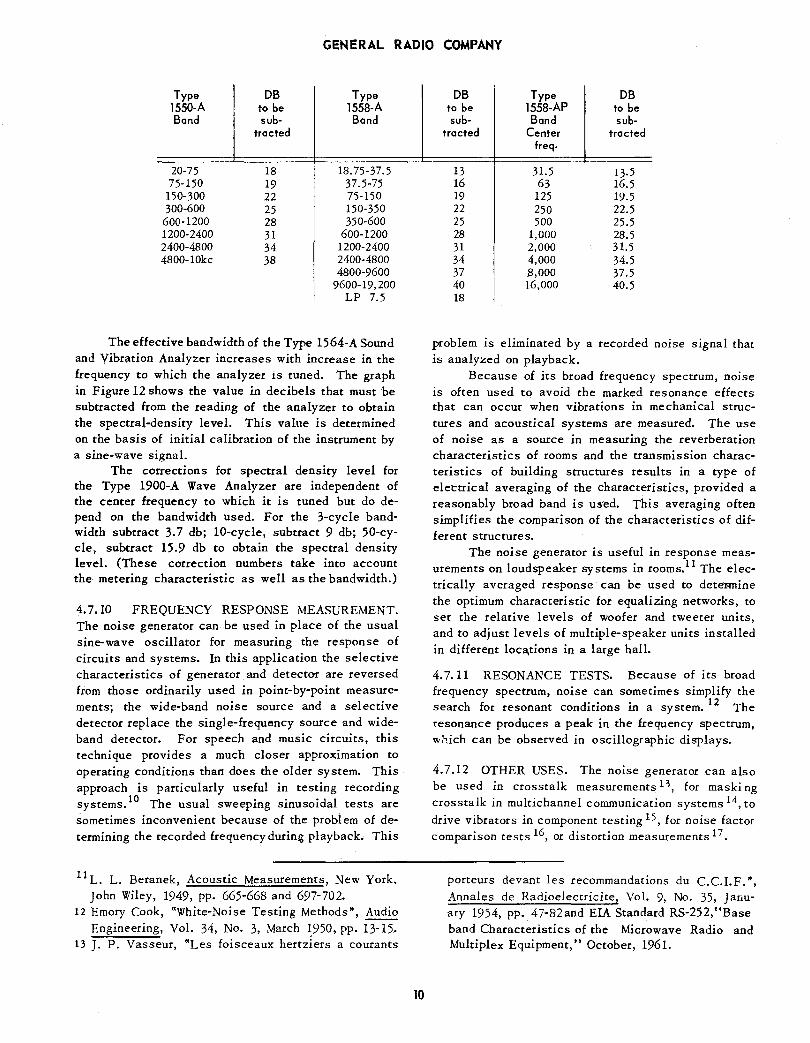
The bandwidths of the Octave-Band Noise Analyzers increase in cycles directly with the mean frequency of the band. For that reason, a noise signal that is uniform in spectral-energy density over the frequency range will give higher-level readings for the higher-frequency bands than for the lower-frequency bands. The following table shows the values to be subtracted from the readings of the analyzer to obtain the spectral-density levels.
GENERAL RADIO COMPANY
Type DB Type 1550-A to be 1558-A Band sub- Band
tracted
20-75 18 18.75-37.5 75-150 19 37.5-75
150-300 22 75-150 300-600 25 150-350
600-1200 28 350-600 1200-2400 31 600-1200 2400-4800 34 1200-2400 4800-10kc 38 2400-4800
4800-9600 9600-19,200
LP 7.5
The effective bandwidth of the Type 1564-A Sound and Vibration Analyzer increases with increase in the frequency to which the analyzer is tuned. The graph in Figure 12 shows the value in decibels that must be subtracted from the reading of the analyzer to obtain the spectral-density level. This value is determined on the basis of initial calibration of the instrument by a sine-wave signal.
The corrections for spectral density level for the Type 1900-A Wave Analyzer are independent of the center frequency to which it is tuned but do depend on the bandwidth used. For the 3-cycle bandwidth subtract 3. 7 db; 10-cycle, subtract 9 db; 50-cycle, subtract 15.9 db to obtain the spectral density level. (These correction numbers take into account the metering characteristic as well as the bandwidth.)
4. 7.10 FREQUENCY RESPONSE MEASUREMENT. The noise generator can be used in place of the usual sine-wave oscillator for measuring the response of circuits and systems. In this application the selective characteristics of generator and detector are reversed from those ordinarily used in point-by-point measurements; the wide-band noise source and a selective detector replace the single-frequency source and wideband detector. For speech and music circuits, this technique provides a much closer approximation to operating conditions than does the older system. This approach is particularly useful in testing recording systems. 10 The usual sweeping sinusoidal tests are sometimes inconvenient because of the problem of determining the recorded frequency during playback. This
11 L. L. Beranek, Acoustic Measurements, New York. John Wiley, 1949, pp. 665-668 and 697-702.
12 Emory Cook, "White-Noise Testing Methods", Audio Engineering, Vol. 34, No. 3, March ~950, pp. 13-15.
13 J. P. Vasseur, "Les foisceaux hertziers a courants
10
DB Type DB to be 1558-AP to be sub- Band sub-
tracted Center tracted freq.
13 31.5 13.5 16 63 16.5 19 125 19.5 22 250 22.5 25 500 25.5 28 1,000 28.5 31 2,000 31.5 34 4,000 34.5 37 B,OOO 37.5 40 16,000 40.5 18 I
problem is eliminated by a recorded n01se signal that is analyzed on playback.
Because of its broad frequency spectrum, noise is often used to avoid the marked resonance effects that can occur when vibrations in mechanical structures and acoustical systems are measured. The use of noise as a source in measuring the reverberation characteristics of rooms and the transmission characteristics of building structures results in a type of elettrical averaging of the characteristics, provided a reasonably broad band is us·ed. This averaging often simplifies the comparison of the characteristics of different structures.
The noise generator is useful in response measurements on loudspeaker systems in rooms.11 The electrically averaged response can be used to detet:mine the optimum characteristic for equalizing networks, to set the relative levels of woofer and tweeter units, and to adjust levels of multiple-speaker units installed in different loca,tions in a large hall.
4. 7.11 RESONANCE TESTS. Because of its broad frequency spectrum, noise can sometimes simplify the
h f d. . . 12 h searc or resonant con ttwns 1n a system. T e resonance produces a peak in the frequency spectrum, v.-hich can be observed in oscillographic displays.
4.7.12 OTHER USES. The noise generator can also be used in crosstalk measurements 13, for masking crosstalk in multichannel communication systems 14, to
drive vibrators in component testing 15, for noise factor comparison tests 16, or distortion measurements 17•
porteurs devant les recommandations du C.C.I. F.", Annales de Radioelectricite, Vol. 9, No. 35, January 1954, pp. 47-82and EIA Standard RS-252,"Base band Characteristics of the Microwave Radio and Multiplex Equipment," October, 1961.
TYPE 1390-B RANDOM-NOISE GENERATOR
14 A. J. Aikens and C. S. Thaeler, "Noise and Crosstalk on N1 Carrier Systems", Electrical Engineering,
Vol. 72, No. 12, December 1953, pp. 1075-1080. 15 J. Robbins. "Standardized White Noise Tests", Elec·
tronic Industries & Tele-Tech, Vol16, No. 2, February, 1957' pp. 68-69.
S. H. Crandall, ed., Random Vibration, Cambridge, Massachusetts, The Technology Press of MIT, 1958.
16 IRE "Standards on Electron Devices: Methods of Measuring Noise", Proceedings of the IRE, Vol. 41, No. 7, July 1953, pp. 891-896.
17 A. P. G. Peterson, "Intermodulation Distortion," 1957 IRE National Convention Record, Vol. 5, Part 7, March, 1957, pp 51·58.
J. S. Murray and J. M. Richards, "Non-linearity Distortion Measurements," Wireless World, Vol. 69, No.4, April, 1963, pp 161-165.
Section 5
SERVICE AND MAINTENANCE
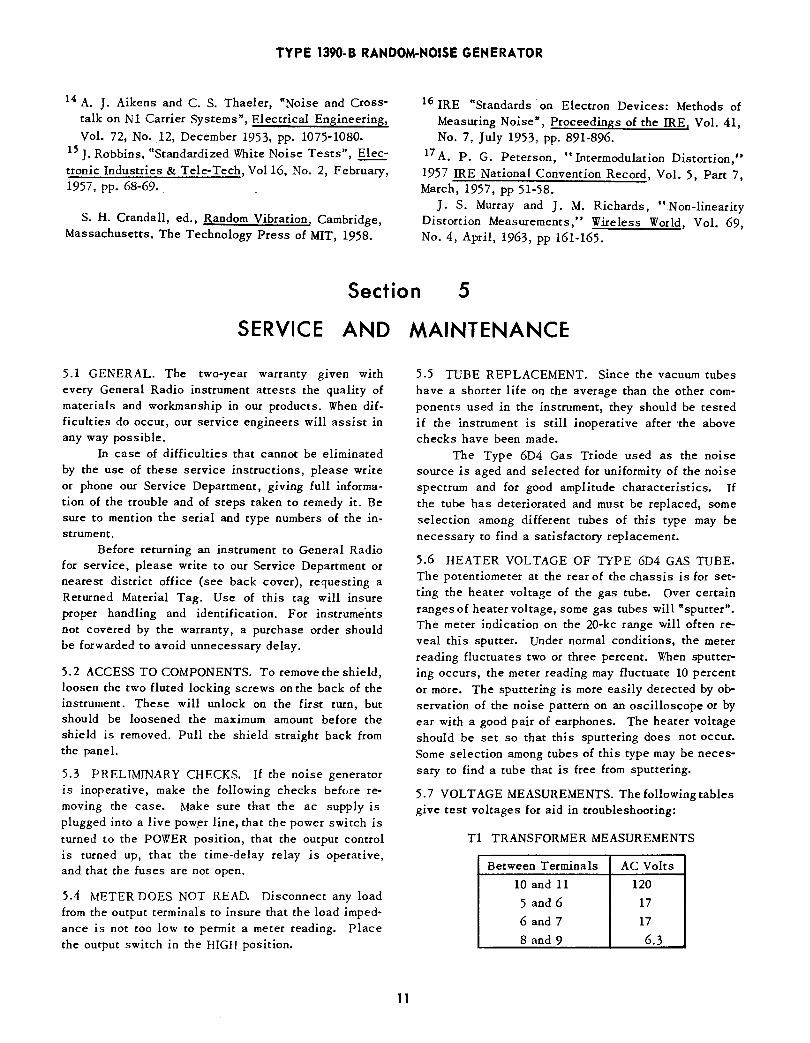
5.1 GENERAL. The two-year warranty given with every General Radio instrument attests the quality of materials and workmanship in our products. When difficulties do occur, our service engineers will assist in any way possible.
In case of difficulties that cannot be eliminated by the use of these service instructions, please write or phone our Service Department, giving full information of the trouble and of steps taken to remedy it. Be sure to mention the serial and type numbers of the instrument.
Before returning an instrument to General Radio for service, please write to our Service Department or nearest district office (see back cover), requesdng a Returned Material Tag. Use of this tag will insure proper handling and identification. For instruments not covered by the warranty, a purchase order should be forwarded to avoid unnecessary delay.
5.2 ACCESS TO COMPONENTS. To remove the shield, loosen the two fluted locking screws on the back of the instrument. These will unlock on the first turn, but should be loosened the maximum amount before the shield is removed. Pull the shield straight back from the panel.
5.3 PRELIMINARY CHECKS. If the noise generator is inoperative, make the following checks before removing the case. Make sure that the ac supply is plugged into a live pow.er line, that the power switch is turned to the POWER position, that the output control is turned up, that the time-delay relay is operative, and that the fuses are not open.
5.4 METER DOES NOT READ. Disconnect any load from the output terminals to insure that the load imped· ance is not too low to permit a meter reading. Place the output switch in the HIGH position.
11
5.5 TUBE REPLACEMENT. Since the vacuum tubes have a shorter life on the average than the other com· ponents used in the instrument, they should be tested if the instrument is still inoperative after ·the above checks have been made.
The Type 6D4 Gas Triode used as the noise source is aged and selected for uniformity of the noise spectrum and for good amplitude characteristics. If the tube has deteriorated and must be replaced, some selection among different tubes of this type may be necessary to find a satisfactory replacement.
5.6 HEATER VOLTAGE OF TYPE 6D4 GAS TUBE. The potentiometer at the rear of the chassis is for set· ting the heater voltage of the gas tube. Over certain ranges of heater voltage, some gas tubes will "sputter". The meter indication on the 20-kc range will often re· veal this sputter. Under normal conditions, the meter reading fluctuates two or three percent. When sputtering occurs, the meter reading may fluctuate 10 percent or more. The sputtering is more easily detected by ob· servation of the noise pattern on an oscilloscope or by ear with a good pair of earphones. The heater voltage should be set so that this sputtering does not occur. Some selection among tubes of this type may be neces· sary to find a tube that is free from sputtering.
5.7 VOLTAGE MEASUREMENTS. Thefollowingtables give test voltages for aid in troubleshooting:
T1 TRANSFORMER MEASUREMENTS
Between Terminals AC Volts
10 and 11 120
5 and 6 17
6 and 7 17
8 and 9 6.3

TUBE
V1 (3-4)
V2 (6D4)
V3 (6AQ5)
GENERAL RADIO COMPANY
TABLE OF VOLTAGES
PIN VOLTS TUBE PIN
2 13.4 V3 6 7 6.3 (6AQ5)
(cont.) 3 6.3 4 0 V4 1 7 16.0 (6AQ5) 2
3 to 4 1 0 5 2 5.5 6 3 20 4 13.4 5 230 (A) V5 4
215 (B) (115N030T) 9 45 (C)
NOTES Voltages are measured with a 20,000-ohms-per-volt voltmeter
and are de with respect to ground unless otherwise stated. (A) S3 = 5 Me (B) S3 ·= 500 kc (C) S3 = 20 kc * Voltages are measured with a 1000.0/volt rectifier meter,
and are with respect to terminal 11 on transformer Tl.
12
VOLTS
150 (A) 150 (B) 110 (C)
0 13 6.3 ac
165 245
120 ac* 120 ac*

TYPE 1390-B RANDOM-NOISE GENERATOR
PARTS LIST
PART NO. (NOTE A)
RESISTORS (NOTE B) CAPACITORS (NOTE C)
R1 470 ± 5% 5w REP0-22 C1A 25} 200 dcwv COE-51 R2 330 ± 5% 5w REP0-22 C1B 25 R3 220 ± 5% 5w REP0-22 C2A 50} R4 5.1 k ±10% 1 w REC-30BF C2B 25 450 dcwv COE-10 R5 10 k ±10% 2w REC-41BF C2C 25 R6 10k ±10% 2w REC-41BF C3A 50} R7 56 ± 5% 1!2w REC-20BF C3B 25 450 dcwv COE-10 R8 250 ±10% POSW-3 C3C 25 R9 150 k ± 5% 1!2w REC-20BF C4A 800} R10 16 k ± 5% 1!2w REC-20BF C4B 400 25 dcwv COE-39 Rll 330 ± 5% 1!2w REC-20BF C4C 400 R12 100 ± 5% 5w REP0-22 C5 1.0 j.J.pJ ±10% COC-1 R13 2.2 k ± 5% 1/2w REC-20BF C6 0,47 ±10% 600 dcwv COP-19 R14 56 ± 5% 1!2w REC-20B.F C7 15 300 dcwv COE-27 R15 56 k ± 5% 1/2w REC-20BF CSA 50} R16 330 ± 5% 1/2w REC-20BF CSB 25 450 dcwv COE-10 R17 68 ± 5% 1/2w REC-20BF esc 25 R18 22 k ± 5% 1/2w REC-20BF C9 680 f.Lf.Lf ±10% COM-20B R19 2.2 k ± 5% 5w REP0-22 C10 470 f.Lf.Lf ±10% COM-20B R20 470 k ± 5% 1/2w REC-20BF Cll 0.0022 ±10% 600 dcwv COL-71 R21 56 ± 5% 1!2w REC-20BF C12 300 f.Lf.Lf ±1 0% COM-20B R22 180 ± 5% 1/2w REC-20BF C13 0.01 ±20% 500 dcwv COC-62 R23 150 ± 5% 1/2w REC-20BF C14 5-20 f.Lf.Lf ±10% COT-18 R24 15 k ± 5% 5w REP0-43 C15 0.33 ±10% 600 dcwv COP-19 R25 1 k ± 5% 1 w REC-30BF C16A 1500} R26 1 k ± 5% 1!2w REC-20BF C16B 750 10 dcwv COE-9 R27 220 ± 5% 1/2w REC-20BF C16C 750 R28 5.1 k ±10% 1 w REC-30BF C17 0.01 ±20% 500 dcwv COC-62 R32 1.5 ± 5% 5w REP0-22 C18 50 f.Lf.Lf ±10% COC-21 R33 2.5 k ±10% POSC-7 C19 50 f.Lf.Lf ±10% COC-21 R34 15 ±10% 2w REW-3C C20 so f.Lf.Lf ±10% COC-21 R35 2 k ± 1% 1/4w REF-65 C21 4 70 f.Lf.Lf ±1 0% COM-20B R36 2 k ± 1% 1!4w REF-65 R37 2k ± 1% 1/4w REF-65 C100 6.8f.Lf.Lf ± 5% COC-1 R38 2 k ± 1% 1/4w REF-65 C101 100 3 dcwv COE-46 R39 246.9 :±0.25% 700-352 C102 100 3 dcwv COE-46 R40 246.9 :±0.25% 700-352 DIODES R41 246.9 :±0.25% 700-352 R42 222.2 :±0.25% 700-351 0100 1N995 0101 1N995
FUSES
R100 2.7 k ± 5% 1!2w REC-20BF F1 (for 115 v) 0.6 amp Slo-Bio R101 4.3 k ± 5% 1/2 w REC-20BF 3AG FUF-1 R102 5.1 k ± 5% 1/2w REC-20BF Fl (for 230 v) 0.3 amp Slo-Bio R103 5 k ±20% POSC-22 3AG FUF-1
Continued
13
F2
F2
L1 L2 L3
Ml
Pl
GENERAL RADIO COMPANY
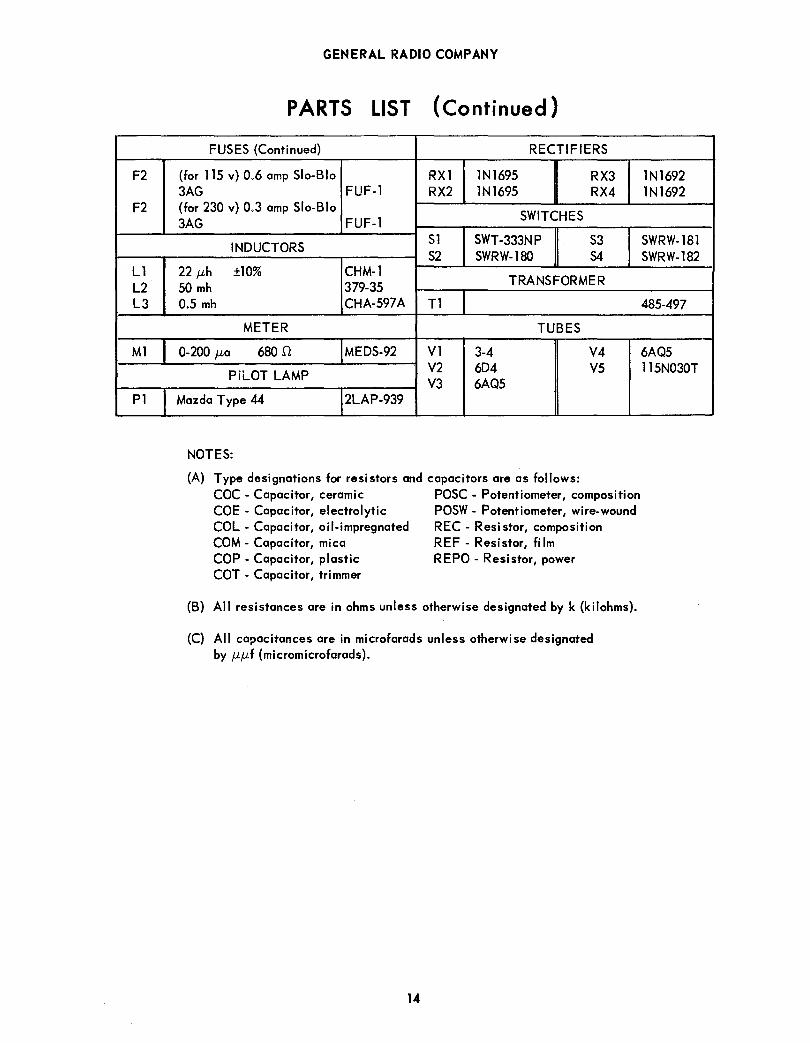
PARTS LIST (Continued)
FUSES (Continued) RECTIFIERS
{for 115 v) 0.6 amp Slo-Bio RXl 1Nl695 RX3 3AG FUF-1 RX2 1N1695 RX4 (for 230 v) 0.3 amp Slo-Blo
SWITCHES 3AG FUF-1
INDUCTORS 51 SWT-333NP 53 52 SWRW-180 54
22 jLh ±10% CHM-1 TRANSFORMER 50 mh 379-35
0.5 mh CHA-597A Tl
METER TUBES
0-200 JLa 680 n MEDS-92 Vl 3-4 V4
PiLOT LAMP V2 6D4 V5 V3 6AQ5
Mazda Type 44 2LAP-939
NOTES:
(A) Type designations for resistors and capacitors are as follows: COC- Capacitor, ceramic POSC- Potentiometer, composition COE - Capacitor, electrolytic POSW- Potentiometer, wire-wound COL - Capacitor, oil-impregnated REC - Resistor, composition COM- Capacitor, mica REF- Resistor, film COP- Capacitor, plastic REPO- Resistor, power COT -Capacitor, trimmer
(B) All resistances are in ohms unless otherwise designated by k (kilohms).
(C) All ca:>acitances are in microfarads unless otherwise designated by JLJLf (micromicrofarads).
14
1N1692 1N1692
SWRW-181 SWRW-182
485-497
6AQ5 115N030T
TYPE 1390-B RANDOM-NOISE GENERATOR
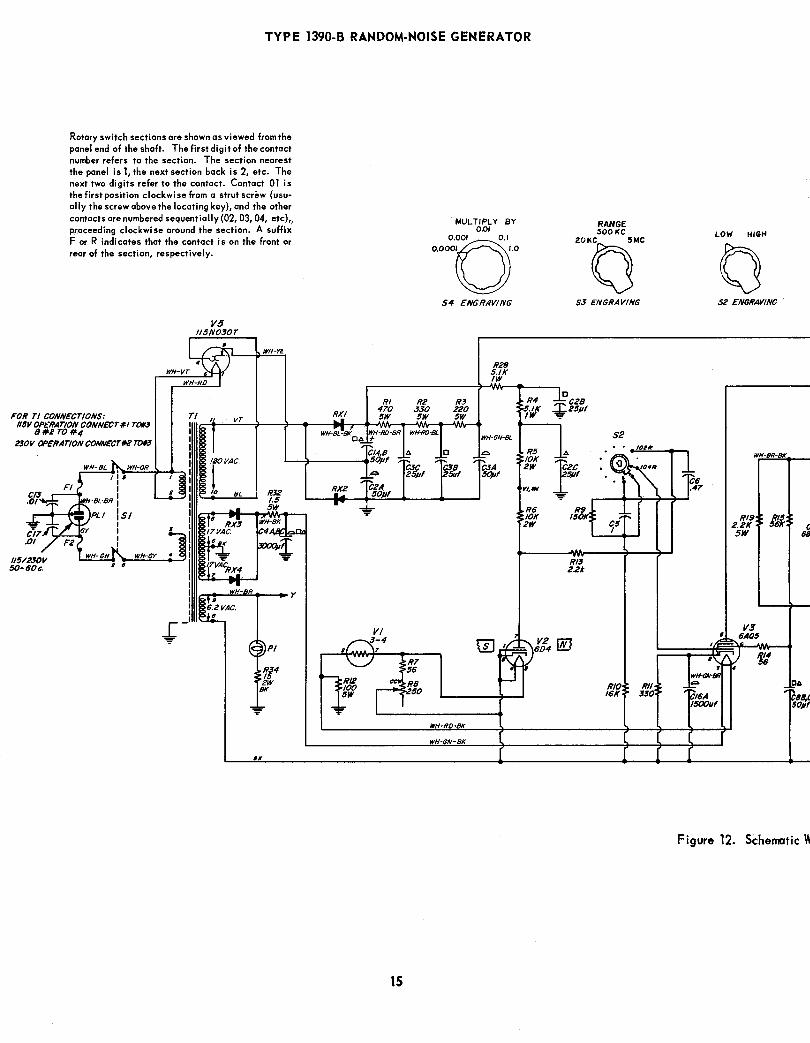
Rotary switch sections are shown as viewed from the panel end of the shaft. The first digit of the contact number refers to the section. The section nearest the panel is 1, the next section back is 2, etc. The next two digits refer to the contact. Contact 01 is the first position clockwise from a strut screw (usually the screw above the locating key), and the other contacts are numbered sequentially (02, 03, 04, etc),, proceeding clockwise around the section. A suffi~ F or R indicates that the contact is on the front or rear of the section, respectively.
WH-Y£
FOR Tl CONNECTIONS: rt VT 1/SV OPt:RATION CONNECT #I TO#.J
8#2T0#4 230V OPERATION CONNECTN TO#iJ
115/230V 50-60c.
IlK
Rl
RXI 470 5W
WH-RO-BR WH-BL-BK OAr
.....
15
R2 $$0 5W
MULTIPLY BY O.ol
··~o· 54 ENGRAVING
R3 220 5W
R28 5./K IW
WH-HO-BL WH-GN-BL
A 0 = C:JC C$8 C:JA 25)Jf 5ul 50)Jf
WH-RO-BK
WH-GN-BK
RANGE SOOKC
"'tf 5:1 ENGRAVING
Rl3 2.2k
RIO l6K
Rll 330
LOW HIGH
C6 .47
16A 1500uf
a 52 ENGRAVING
WH-BR-BK
Rl9 R/5 2.2K 56K c 5W 68
Figure 12. Schematic W

LOW HIGH
S2 ENGRAVING
--- WH·8fi-8K
-
-~:::: C9
680
POWER DELAYED ON
OFF
Sf ENGRAVING
:::::::: cil R17
.0022ut._4 ..-I\68Nr--.
$3
·~
o--r----.. ~ 1 T R/8 22K
Rl6 330
R24
R26 IK
R25 IK IW
~mh
GN
R27 220
RESISTORS 1/2 WATT UNLESS OTHERWISE SPECIFIED RESISTANCE IN OHMS UNLESS OTHERWISE SPECIFIED
k=IOOO OHMS M•l MEGOHM CAPACITANCE VALUES ON£ AND OVER IN MICRO-MICROFARADS LESS THAN ON£ IN MICROFARDS UNLESS OTHERWISE 1ffj1FIED R41
.t:f 246.9
IL
54 "'~'~..::."+......;r--, .. 1 '•.!. 1
'?/~~ ... ~ ,.,( ~
1 r1Ji.e '----r-...11
L--~--------------.-------------~-~~--17
V3
1~6AQ5
''iA{ 'f/ =:GN·I*I
~C~6A /500uf
-:: DA
'~8s,c 50pf
H20 470K
C21 470;.
DA R2.1 CI6B,C ::::!50 /500pl
Figure 12. Schematic Wiring Diagram.
R21 ~6
C8A 50pf
.;,.. cf'
15pl •
R.J3~ 2.5K '"ccw '-ouTPUT
,Dtoo ,;'" ~~ hRtaJ ~5K
""
0ta I ~~ I
R.- I 5./K' I
I t I
~,O.tl
cto2 r-. I /()()# +
I ~.t2 L ________ _j I•
L-------~+~ r------~ Ml
V2
ca---L __ _
Cl6 4
V4-~~(Ck-:--,' -~ n
CIOI
~ ~
~8 RI03
~
~
G Cl02
Tl
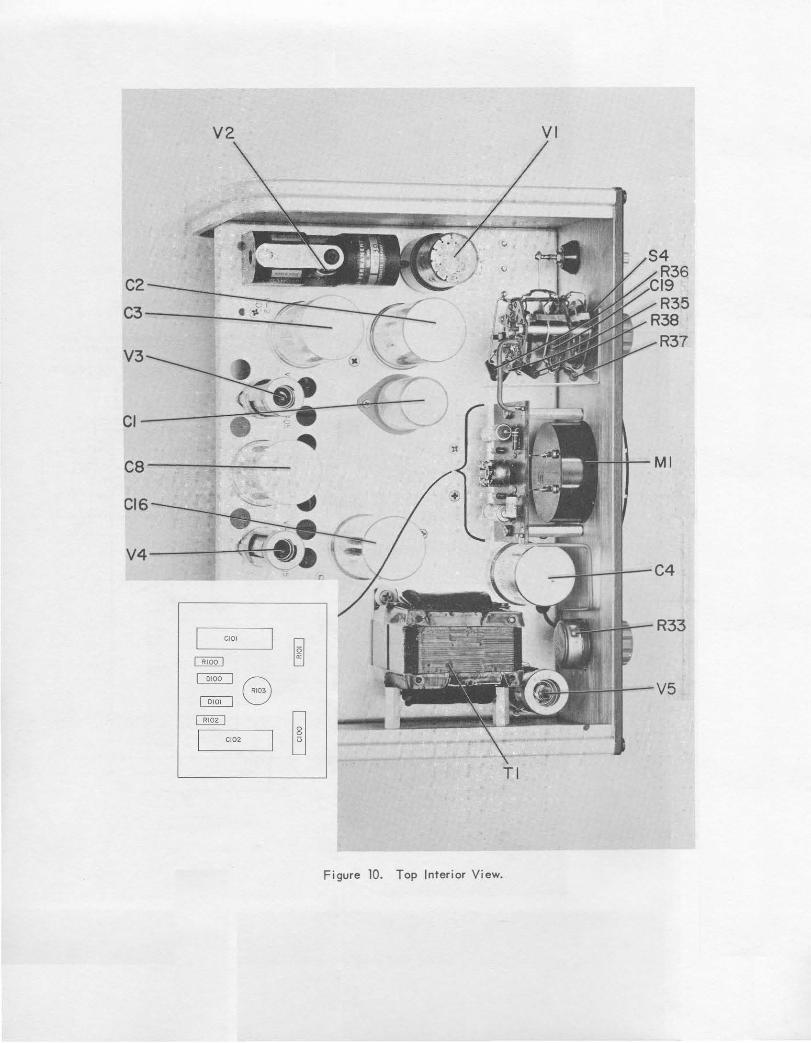
Figure 10. Top Interior View.
VI
R37
R33
V5
R34
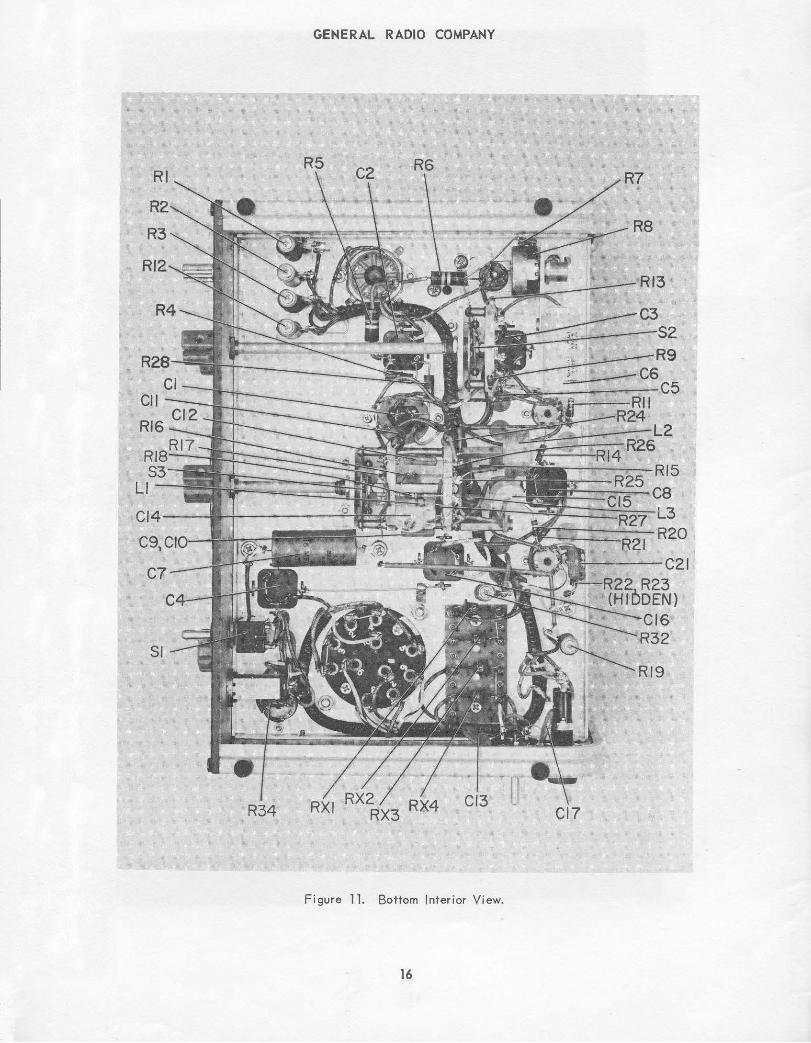
GENERAL RADIO COMPANY
R5 R6
RXI
~~~~::::::~::;-L3 ~----R20
Cl3 l Cl?
Figure 11. Bottom Interior View.
16
GENERAL RADIO COMPANY WEST CONCORD, MASSACHUSETTS 01781
617 369-4400 617 646-7400
SALES ENGINEERING OFFICES
NEW ENGLAND* 22 Baker Avenue West Concord, Massachusetts 017B1 Telephone 617 646-0550
METROPOLITAN NEW YORK*
Broad Avenue at Linden Ridgefield, New Jersey 07657 Telephone N.Y. 212 964-2722
N .J.201943-3140
SYRACUSE Pickard Building East Molloy Road Syracuse, New York 13217 Telephone 315 454-9323
PHILADELPHIA Fort Washington Industrial Park Fort Washington, Pennsylvania 19034 Telephone 215 646-B030
WASHINGTON* and BALTIMORE
11420 Rockville Pike Rockville, Maryland 20B52 Telephone 301 946-1600
ORLANDO 113 East Colonial Drive Orlando, Florida 32B01 Telephone 305 425-4671
• Repair services are available at these offices.
CHICAGO* 6605 West North Avenue Oak Park, Illinois 60302 Telephone 312 B4B-9400
CLEVELAND 5579 Pearl Road Cleveland, Ohio 44129 Telephone 216 BB6-0150
LOS ANGELES* 1 000 North Seward Street Los Angeles, California 9003B Telephone 213 469-6201
SAN FRANCISCO 11B6 Los Altos Avenue Los Altos, California 94022 Telephone 415 94B-B233
DALLAS* 2600 Stemmons Freeway, Suite 210 Dallas, Texas 75207 Telephone 214 637-2240
TORONTO* 99 Floral Parkway Toronto 15, Ontario, Canada Telephone 416 247-2171
MONTREAL 1255 Laird Boulevard Town of Mount Royal, Quebec, .Canada Telephone 514 737-3673
General Radio Company (Overseas), BOOB Zurich, Switzerland General Radio Company (U.K.) Limited, Bourne End, Buckinghamshire, England
Representatives in Principal Overseas Countries
Printed in USA