type ia sne along redshift: the r(si ii) ratio and the
TRANSCRIPT
The Astrophysical Journal, 695:135–148, 2009 April 10 doi:10.1088/0004-637X/695/1/135C© 2009. The American Astronomical Society. All rights reserved. Printed in the U.S.A.
TYPE Ia SNe ALONG REDSHIFT: THE R(Si ii) RATIO AND THE EXPANSION VELOCITIES ININTERMEDIATE-z SUPERNOVAE
G. Altavilla1, P. Ruiz-Lapuente
1,2, A. Balastegui
1, J. Mendez
1,3, M. Irwin
4, C. Espana-Bonet
1, R. S. Ellis
4,5,
G. Folatelli6, A. Goobar
6, W. Hillebrandt
2, R. M. McMahon
4, S. Nobili
6, V. Stanishev
6, and N. A. Walton
41 Department of Astronomy, University of Barcelona, Diagonal 647, E-08028 Barcelona, Spain
2 Max-Planck Institut fur Astrophysik, Karl Schwarzschildstrasse 1, D-85741 Garching, Germany3 Isaac Newton Group of Telescopes, 38700 Santa Cruz de La Palma, Islas Canarias, Spain
4 Institute of Astronomy, University of Cambridge, Madingley Road, Cambridge CB3 0HA, UK5 California Institute of Technology, Pasadena, CA 91125, USA
6 Department of Physics, Stockholm University, SE-10691 Stockholm, SwedenReceived 2006 October 4; accepted 2009 January 12; published 2009 March 27
ABSTRACT
We present a study of intermediate-z Type Ia supernovae (SNe Ia) using empirical physical diagrams whichpermit the investigation of those SNe explosions. This information can be very useful to reduce systematicuncertainties of the Hubble diagram of SNe Ia up to high z. The study of the expansion velocities and themeasurement of the ratio R(Si ii) allow subtyping of SNe Ia as done in nearby samples. The evolution ofthis ratio as seen in the diagram R(Si ii)–(t) together with R(Si ii)max versus (B−V)0 indicates consistency ofthe properties at intermediate-z compared with the nearby SNe Ia. At intermediate-z, expansion velocities ofCa ii and Si ii are found similar to those of the nearby sample. This is found in a sample of six SNe Ia inthe range 0.033 � z � 0.329 discovered within the International Time Programme of SNe Ia for Cosmologyand Physics in the spring run of 2002.7 Two SNe Ia at intermediate-z were of the cool FAINT type, onebeing an SN1986G-like object highly reddened. The R(Si ii) ratio as well as subclassification of the SNe Iabeyond templates help to place SNe Ia in their sequence of brightness and to distinguish between reddenedand intrinsically red supernovae. This test can be done with very high z SNe Ia and it will help to reducesystematic uncertainties due to extinction by dust. It should allow to map the high-z sample into the nearby one.
Key words: cosmology: observations – supernovae: general – supernovae: individual (2002li, 2002lj, 2002lk,2002ln, 2002lo, 2002lp, 2002lq, 2002lr)
Online-only material: color figures
1. INTRODUCTION
The measurements using Type Ia supernovae (SNe Ia) ofthe expansion rate of the universe led to the discovery of itsacceleration (Riess et al. 1998; Perlmutter et al. 1999) andhave opened a new field in the identification of the drivingforce of the accelerated expansion, the so-called dark energy.A large local supernova sample was first studied in the Calan–Tololo survey (Hamuy et al. 1996) and nowadays in a series ofcampaigns at low redshift by various collaborations. At high-z, the first supernova samples were gathered by the SupernovaCosmology Project (Perlmutter et al. 1999; Knop et al. 2003;Hook et al. 2005; Kowalski et al. 2008) and the High-z SNTeam/ESSENCE (Riess et al. 1998; Tonry et al. 2003; Barriset al. 2004; Krisciunas et al. 2005; Clocchiatti et al. 2006;Wood-Vasey et al. 2007). In recent years, the high-z redshiftrange has been targeted as well by the Supernova Legacy Survey(Astier et al. 2006). The combination of the discoveries madeby all these collaborations will provide hundreds of SNe Ia atz > 0.2. At very high redshift, the Higher-z Team using theHubble Space Telescope (HST) concentrates in the discoveryof supernovae at z > 1 to better constraint dark energy (Riesset al. 2004, 2007). This is also the target of the latest runs ofthe Supernova Cosmology Project, which is presently studyingSNe Ia in galaxy clusters at very high z.
7 The program run under Omega and Lambda from Supernovae and thePhysics of Supernova Explosions within the International Time Programme atthe telescopes of the European Northern Observatory (ENO) at La Palma(Canary Islands, Spain).
While the low- and high-redshift intervals are often targeted,the intermediate-redshift (0.1 � z � 0.4) region is still analmost unexplored zone. We started a programme to have a well-covered sample of SNe Ia in that redshift range. In this paper,we present the spectroscopic results of the observations donein spring 2002, as part of the International Time Programme(ITP) project on supernovae for their physics and cosmology(PI: Ruiz-Lapuente).8 These supernovae were identified usingthe 4.2 m William Herschel Telescope. We discuss where thesesupernovae belong in the empirical physical diagrams used todescribe the supernova density profile and temperature. Theresults of the photometric follow-up and their cosmologicalimplications will be presented in a forthcoming paper. Thereare prospects that Sloan Digital Sky Survey (SDSS-II; Sakoet al. 2005) will provide a large sample of SNe Ia at those z,while the SNFactory (Aldering et al. 2004) will concentrate insupernovae at z ∼ 0.1. At ENO, our own collaboration plans tomove to very high z to carry out campaigns that will explore thephysics of SNe Ia in detail at these high z in a similar way asdone for the nearby sample. Physical properties of SNe Ia canbe better studied within the intensive supernova campaigns bycollecting a large database of spectra and photometry for eachindividual supernova. This task has been the aim of the RTN onPhysics of Type Ia supernovae which compares each single SNIa with model spectra to better understand SNe Ia explosions
8 The program run in 2002 under Omega and Lambda from Supernovae andthe Physics of Supernova Explosions within the International TimeProgramme at the telescopes of the European Northern Observatory (ENO) atLa Palma (Canary Islands, Spain).
135

136 ALTAVILLA ET AL. Vol. 695
(Hillebrandt et al. 2005). Detailed spectral evolution providesa complete probe of the SNe Ia ejecta: chemical composition,velocity, and other physical characteristics of the layers thatsuccessively become transparent.
At high z, the observing time per supernova has to beoptimized. Long exposure times are needed to obtain goodsignal-to-noise ratio (S/N) spectra for the large number ofcandidates in the supernova searches. Limited telescope accessprevents the program from having a complete sequence ofspectra. However, as we will show here, one can go a step beyondwhat has been done up to now with high-z SN spectra and do afiner classification. In this intermediate-z campaign (see Ruiz-Lapuente 2006 for a review), we have shown how informationsimilar to the one gathered in nearby SNe Ia can be gathered at allredshifts. This is a progress study of the possibilities offered byspectroscopy to better constrain the luminosity of intermediate-and high-z supernovae within the SN Ia family. The sampleused here is limited, but the same analysis could be used inlarge samples collected by the various collaborations.
Spectral studies of intermediate-z supernovae have started toincorporate the study of expansion velocities of the materialwithin the ejecta (Altavilla et al. 2005; Balastegui et al. 2005;Mendez et al. 2005; Balland et al. 2006). The intermediate-redshift spectra gathered here offer the possibility of investi-gating where the SNe Ia stand in terms of the distribution ofchemical elements in velocity space and the temperature withinthe ejecta (Branch et al. 1993, 2006; Hatano et al. 2000; Benettiet al. 2004, 2005). This opens a new window to the inside of thesupernova ejecta and allows testing for the existence of continu-ity in the temperature and spatial gradient characteristics of SNeIa. Ultimately, these intermediate-redshift SNe Ia will help tofill the gap between the local and high-z SN samples, reducingthe statistical uncertainties by means of an evenly sampled Hub-ble diagram. These supernovae are to be used for cosmology inconjunction with those gathered in other surveys.
The outline of this paper is as follows. In Section 2, wepresent the observations and the data reduction procedure, andin Section 3, the SN candidates’ classification. In Section 4,we comment upon the results for individual objects and bringthem into comparison with the nearby sample. Matches of thespectra to nearby SNe Ia are examined. In Section 5, the physicaldiagrams for intermediate-z SNe Ia are first built up in a waysimilar to what is done in nearby SNe Ia. The prospects of the useof these diagrams to reduce systematic uncertainties are shown.Further discussion is presented in Section 6. A brief summaryof the run and conclusions are reported in Section 7.
2. OBSERVATIONS AND DATA REDUCTIONS
Spectra of the SN candidates were obtained using the 4.2m William Herschel Telescope (WHT).9 Observations weredone using the spectrograph ISIS on 2002 June 10th and 11th(Table 1). A dichroic allowed simultaneous observations in theblue and red channels, which are optimized for their respectivewavelength ranges (∼3000–6000 Å, ∼5000–10000 Å). In theblue, the R158B grating was used in conjunction with the EEV12detector. In the red, we used the R158R grating + GG495 filter10
and the MARCONI2 detector. In the red channel, fringing begins
9 The WHT is operated by the Isaac Newton Group of Telescopes (ING),located at the Roque de Los Muchachos Observatory, La Palma, Spain.10 An order-separation filter designed to filter out second order blue from thefirst order red in usual applications, in the case of ISIS, where a dichroic splitsthe beam into red and blue channels, it helps define the “red” channel shortwavelength.
Table 1Journal of Spectroscopic Observations
SN Date JD Telescope Exposure Time (s) Slit
(UT) −2,400,000 Instrument Blue Arm Red Arm (arcsec)
2002li 2002 Jun 10 52,436.6 WHT+ISIS 900 900 1.202002 Jun 10 52,436.7 WHT+ISIS 900 900 1.202002 Jun 10 52,436.7 WHT+ISIS 900 900 1.20
2002lj 2002 Jun 11 52,437.4 WHT+ISIS 900 900 1.202002 Jun 11 52,437.4 WHT+ISIS 900 900 1.03
2002lp 2002 Jun 10 52,436.5 WHT+ISIS 900 900 1.202002 Jun 10 52,436.5 WHT+ISIS 900 900 1.20
2002lq 2002 Jun 10 52,436.4 WHT+ISIS 900 900 1.202002 Jun 10 52,436.5 WHT+ISIS 900 900 1.20
2002lr 2002 Jun 10 52,436.7 WHT+ISIS 900 900 1.202002 Jun 10 52,436.7 WHT+ISIS 900 900 1.20
2002lk 2002 Jun 10 52,436.4 WHT+ISIS 300 300 1.202002 Jun 10 52,436.4 WHT+ISIS 600 600 1.202002 Jun 11 52,437.4 WHT+ISIS 600 600 1.20
2002ln 2002 Jun 10 52,436.6 WHT+ISIS 900 900 1.202002 Jun 10 52,436.6 WHT+ISIS 900 900 1.20
2002lo 2002 Jun 11 52,437.6 WHT+ISIS 900 900 1.032002 Jun 11 52,437.6 WHT+ISIS 900 900 1.03
at about 8000 Å and increases to ∼10% at 9000 Å. A long slit of1.′′2 was used in the first night, under good weather conditions,and a long slit of 1.′′03 was adopted in the second night, underexcellent weather conditions (except for SN 2002lk and onespectrum of SN 2002lj, which were observed at the beginningof the night with a 1.′′2 slit). A journal of the spectral observationsis given in Table 1.
Spectra were reduced following standard IRAF11 procedures.All images were bias subtracted and then flat fielded using domeflats. The one-dimensional spectrum extractions were weightedby variance based on the data values and a Poisson/CCD modelusing the gain and read noise parameters. The background wasinterpolated by fitting two regions beside the spectra and thensubtracted. Reference spectra of Cu–Ne–Ar lamps were used forthe wavelength calibration. The results were checked measuringthe position of bright [O i] sky lines at 5577 Å and 6300 Å and,when necessary, a rigid shift was applied to the spectrum to beconsistent with these values. The spectra were flux calibratedusing spectrophotometric standard stars observed at the start andat the end of each night. Correction for atmospheric absorptionwas applied to the red arm spectra. The blue and the red sectionswere joined in a single spectrum and multiple spectra of the sameobject were then combined in order to improve the S/N. Spectrawith different exposure times were weighted accordingly.
3. CLASSIFICATION
3.1. Object, Redshift, and Phase Determination
Spectra can be inspected visually in order to give a roughclassification of the SN candidate, where the main feature usedto discriminate between Type Ia, Type II SNe, or “other” sources(typically quasi-stellar objects (QSOs) or active galactic nuclei(AGNs)) is the presence/absence of the strong Si ii absorption at∼6150 Å (rest frame) and the typical Si ii ∼5400 Å (rest frame)“W” feature for SNe Ia. Type II SNe show the characteristic
11 http://iraf.noao.edu/; IRAF is distributed by the National OpticalAstronomy Observatories (NOAO), which are operated by the Association ofUniversities for Research in Astronomy (AURA), Inc., under cooperativeagreement with the National Science Foundation.

No. 1, 2009 TYPE Ia SNe ALONG REDSHIFT 137
Balmer series P Cygni profiles, most noticeably the Hα spectralfeature. For a correct classification, one has to be aware of thepossible confusion between SNe Ia and SNe Ic. This ambiguityincreases its chances for cool SN Ia events when only onespectrum is available. As it will be shown in this paper, suchambiguity can be reduced if one uses the physical diagrams(expansion velocity andR(Si ii)) in intermediate and high-z SNeIa. For all those reasons and to find the best match in a libraryof SNe Ia, it is required to follow an automated procedure thatwill enable to quantify the difference of the spectra of the SNeIa with those of an archive from a large sample of nearby SNeIa at all phases.
The redshift of each supernova is obtained from the redshiftof the host galaxy lines. In the case of no emission lines, itcan be obtained by an algorithm that searches for the redshiftthat provides the best fit of the spectrum with a template.In our sample, the spectra were inspected looking for typicalnarrow galaxy lines: Balmer lines, [O ii] λ3727, [O iii] λ5007,[N ii] λ6583, [S ii] λ6716, 6731. The supernova spectra withthe emission lines of the underlying host galaxy are shownin Figures 1–6 (top panels). The lines used for the redshiftdetermination (when present) are shown. Uncertainties on theredshifts are of the order of 0.001 and they have been estimatedby measuring the dispersion of the redshift determinationsobtained from each identified galaxy line.
The following step was taken to refine the Type Ia SNclassification by means of two different classification algorithmsdeveloped toward this aim. The first classification programtransforms the spectra into the rest frame and compares it to a setof Type Ia supernovae spectral templates originally prepared byNugent et al. (2002), and later adapted by Nobili et al. (2003).These spectral templates range from 19 days before maximumto 70 days after maximum, and the wavelength coverage isfrom 2500 Å to 25000 Å. Both the spectra and the templates arenormalized in the wavelength range selected for the comparison,and then the spectra are again rescaled and shifted in the flux axisuntil the best match is found, see Figures 1–6 (middle panels).This procedure uses the whole spectrum and the result is notbased on a few key features only.
In an interactive mode, the algorithm asks for a smoothinglength and a sigma (σ ) level to clean spikes in the observedspectrum. In this second mode, the procedure allows the user tospecify the wavelength interval or to reject wavelength intervalsof the comparison spectrum. This can be useful to reject aregion of the spectrum highly contaminated with atmosphericabsorption lines. Finally, the user can select the interval ofredshifts and epochs used in the comparison.
Mathematically, the algorithm works by finding the minimumχ2 of the observed spectrum compared with spectra of all thepossible values of the epoch, j, and the redshift, z,
χ2j (z) =
n∑
i=1
[f (λi) − Fj (λi, z)]2
σi2
, (1)
where n is the total number of data points of the observed SNspectrum, f (λi) is the SN-normalized flux at wavelength λi ,and Fj (λi, z) is the template-normalized flux at wavelength λi ,epoch j, and redshift z. The algorithm delivers rest-frame epoch,flux scale, and redshift as parameters. If the redshift is knownfrom the narrow galaxy lines, the algorithm takes it as given andthe redshift is not used in the minimization.
Once the first classification is obtained based on templates,a second analysis is done using an algorithm that compares
4000 4500 5000 5500 6000 6500
Rest frame wavelength (Å)
0e+00
Flu
x(e
rgcm
sÅ
)
[OII]
Hα
Hδ
Hβ
[OIII][NII]
[SII]
[SII]
3000 3500 4000 4500 5000 5500 6000 6500
Rest frame wavelength (Å)
0
0.5
1
1.5
2
Flu
x(a
rbit
rary
un
its
)
3000 3500 4000 4500 5000 5500 6000 6500 7000
Rest frame wavelentgh (Å)
0
0.5
1
1.5
2
2.5
3
3.5
Flu
x(a
rbit
rary
un
its
)
SN 2002li
SN 2000E
Figure 1. Top: spectrum of SN 2002li, including galaxy lines for the redshiftdetermination. Middle: template fitting of SN 2002li spectrum. Template epochis 2 days before maximum. SN 2002li spectrum has been dereddened andsmoothed. Bottom: comparison of SN 2002li smoothed spectrum with that ofSN 2000E 4 days before maximum. Both SN 2002li and SN 2000E spectra havebeen dereddened and smoothed.
(A color version of this figure is available in the online journal.)
the SNe Ia with those of the Padova SN Catalogue and otherspectra available in the literature (we also made use of the

138 ALTAVILLA ET AL. Vol. 695
4000 5000 6000 7000 8000
Rest frame wavelength (Å)
0e+00
Flu
x(e
rgcm
sÅ
)
3500 4000 4500 5000 5500 6000 6500 7000 7500
Rest frame wavelength (Å)
0
0.5
1
1.5
2
2.5
3
Flu
x(a
rbit
rary
un
its
)
3500 4000 4500 5000 5500 6000 6500 7000
Rest frame wavelength (Å)
0
0.5
1
1.5
2
2.5
3
Flu
x(a
rbit
rary
un
its
)
SN 2002lj
SN 1994D
Figure 2. Top: Spectrum of SN 2002lj. No galaxy lines have been found.Redshift determined from supernovae features. Middle: Template fitting ofSN 2002lj smoothed spectrum. Template epoch is 7 days past maximum.Bottom: Comparison of SN 2002lj spectrum with that of SN 1994D 7 dayspast maximum. Both spectra have been smoothed.
(A color version of this figure is available in the online journal.)
SUSPECT database12). This allows us to find a real templatewhich best fits the SN Ia (Figures 1–5, lower panel). The twoalgorithms Genspecphase and Genspecsubtype were developedfor this programme and can be used in campaigns at all redshifts.
12 http://bruford.nhn.ou.edu/∼suspect/index1.html
3500 4000 4500 5000 5500 6000 6500
Rest frame wavelength (Å)
0e+00
Flu
x(e
rgs
cm
sÅ
)
[OII]
Hα
Hθ
Hγ
3500 4000 4500 5000 5500 6000 6500 7000 7500
Rest frame wavelength (Å)
0
0.5
1
1.5
2
2.5
3
3.5
Flu
x(a
rbit
rary
un
its)
3500 4000 4500 5000 5500 6000 6500 7000 7500 8000
Rest frame wavelentgh (Å)
0
1
2
3
4
Flu
x(a
rbit
rary
un
its
)
SN 2002lp
SN 1989B
Figure 3. Top: spectrum of SN 2002lp, including galaxy lines for the redshiftdetermination. Middle: template fitting of SN 2002lp spectrum. Templateepoch is 3 days past maximum. SN 2002lp spectrum has been smoothed anddereddened. Bottom: comparison of SN 2002lp spectrum with that of SN 1989Bat maximum. SN 2002lp spectrum has been dereddened. Both spectra have beensmoothed.
(A color version of this figure is available in the online journal.)
Results with the redshift z and phase determination can be seenin Table 2.
We estimated the spectral epoch and its uncertainty bycomparing the phases obtained matching the spectra with thesynthetic and real templates. We assumed a minimum error of

No. 1, 2009 TYPE Ia SNe ALONG REDSHIFT 139
3500 4000 4500 5000 5500 6000 6500
Rest frame wavelength (Å)
0e+00
Flu
x(e
rgs
cm
sÅ
)
Hη
Hα
Hθ
Hγ
Hβ
HζHδ
[SII][OIII]
3000 3500 4000 4500 5000 5500 6000 6500 7000
Rest frame wavelength (Å)
0
0.5
1
1.5
2
2.5
3
3.5
4
Flu
x(a
rbit
rary
un
its
)
3000 3500 4000 4500 5000 5500 6000 6500 7000
Rest frame wavelentgh (Å)
0
0.5
1
1.5
2
2.5
3
3.5
Flu
x(a
rbit
rary
un
its
)
SN 2002lq
SN 1990N
Figure 4. Top: spectrum of SN 2002lq, including galaxy lines for the redshiftdetermination. Middle: template fitting of SN 2002lq spectrum. Template epochis 7 days before maximum. SN 2002lq spectrum has been smoothed anddereddened. Bottom: comparison of SN 2002lq spectrum with that of SN1990N 7 days before maximum. SN 2002lq spectrum has been smoothed anddereddened.
(A color version of this figure is available in the online journal.)
±2 days (see also Riess et al. 1997). The comparison of thespectral phase τspec with the phases τpho determined from thephotometric data (see Table 2) shows that the spectral epochs
3500 4000 4500 5000 5500 6000 6500 7000
Rest frame wavelength (Å)
0e+00
Flu
x(e
rgs
cm
sÅ
)
[NeV]
[NII]Hβ
[SII]
[SII]
3000 3500 4000 4500 5000 5500 6000 6500 7000
Rest frame wavelength (Å)
0
0.5
1
1.5
2
2.5
3
Flu
x(a
rbit
rary
un
its
)
4000 4500 5000 5500 6000 6500 7000 7500
Rest frame wavelength (Å)
0
0.5
1
1.5
2
2.5
3
3.5
Flu
x(a
rbit
rary
un
its)
SN 2002lr
SN 1994D
Figure 5. Top: spectrum of SN 2002lr, including galaxy lines for the redshiftdetermination. Middle: template fitting of SN 2002lr smoothed spectrum.Template epoch is 10 days past maximum. Bottom: comparison of SN 2002lrspectrum with that of SN 1994D 10 days past maximum. Both spectra havebeen smoothed.
(A color version of this figure is available in the online journal.)
are correct within a few days, with a scatter of σ = 3.5days (Figure 7). This value is consistent with the adoptedspectroscopic phase error bars.

140 ALTAVILLA ET AL. Vol. 695
5000 5500 6000 6500 7000
Rest frame wavelength (Å)
0e+00
Flu
x(e
rgc
ms
Å)
Hα
NaD
[NII]
[SII]
[SII]
4000 5000 6000 7000 8000 9000 10000
Rest frame wavelength (Å)
0e+00
Flu
x(e
rgc
ms
Å)
+C
on
st
4000 5000 6000 7000 8000 9000
Rest frame wavelentgh (Å)
0
0.5
1
1.5
Flu
x(a
rbit
rary
un
its)
SN 2002lk
SN 1986G
Figure 6. Top: spectrum of SN 2002lk on June 10, including galaxy lines for theredshift determination. Middle: spectra of SN 2002lk on June 10 and June 11(−2 × 10⁻¹⁶ erg cm−2 s−1 Å−1). Bottom: comparison of SN 2002lk spectrumon June 11 with that of SN 1986G 2 days before maximum. SN 1986G spectrumhas been smoothed.
(A color version of this figure is available in the online journal.)
SN 2002lk presented an interesting test for classification. Itwas an intrinsically red (cool) SN Ia and in addition to that, itwas highly reddened. A rough approach might have mistakenit for a SN Ic at another phase. We included a number of in-trinsically red (cool) SNe Ia in our database as well as Type Icsupernovae to increase the quality of the classification. Consis-tency is found between the color light curves and the spectralclassification.
Figure 7. Comparison of the spectrum epochs as determined from the spectrumfits (τspec) and the light-curve fits (τpho). Filled dots: τpho corrected for timedilation; empty dots: τpho not corrected for time dilation. Epochs are relative tothe B band maximum. The dispersion σ is relative to the corrected points. Thedotted line corresponds to τspec = τpho.
(A color version of this figure is available in the online journal.)
Observed and template spectra have been smoothed andtilted with an absorption amount derived empirically withinthe classifying procedure. This “reddening factor” may not betotally due to absorption, as it is also intended to correct for lightlosses due to observations with the slit out of the parallacticangle and/or to take into account different colors betweentargets and templates, and/or to take into account reddenedtemplates. In some cases, the spectral templates have beenslightly red- or blueshifted to account for the small differences inthe expansion velocities between the template and the observedSNe.
The peculiar Type Ia SN 2002lk and Type II SNe have beencompared with real templates only (Figures 6, 8, and 9).
Table 3 summarizes the results of the classification of the hostgalaxies of all SN candidates.
3.2. Host Galaxy Morphology
Host galaxy morphology identification is usually accom-plished by exploiting good imaging and spectra (Sullivan et al.2003). In our sample, the visual identification of the host galaxymorphology is feasible for two objects only: SN 2002lq and SN2002lk. The latter is a Type Ia SN similar to the underluminousSN 1986G, which exploded in a spiral galaxy (for a discus-sion on the host galaxies of SNe, see Howell 2001). The hostgalaxy of SN 2002lk has been classified as spiral since its el-lipticity, larger than 7, is not consistent with an elliptical galaxyand, although it is observed almost edge on, the existence ofsome structure, as a dust lane, can be detected. An image of thegalaxy about one year after explosion reveals also the bulge ofthe galaxy.
The rest of the galaxy images do not give hints of thegalaxy morphology, being compatible with both elliptical andspiral galaxies (in the latter case the possible spiral structure is
No. 1, 2009 TYPE Ia SNe ALONG REDSHIFT 141
4000 4500 5000 5500 6000 6500
Rest frame wavelength (Å)
0e+00
Flu
x(e
rgc
ms
Å)
Hζ
Hα
Hθ [SII]
[SII]
Hβ
4000 4500 5000 5500 6000 6500 7000 7500 8000
Rest frame wavelentgh (Å)
0.5
1.5
2.5
3.5
4.5
Flu
x(a
rbit
rary
un
its
)+
co
ns
t
SN 2002lnSN 1999em
+9
+14
+24
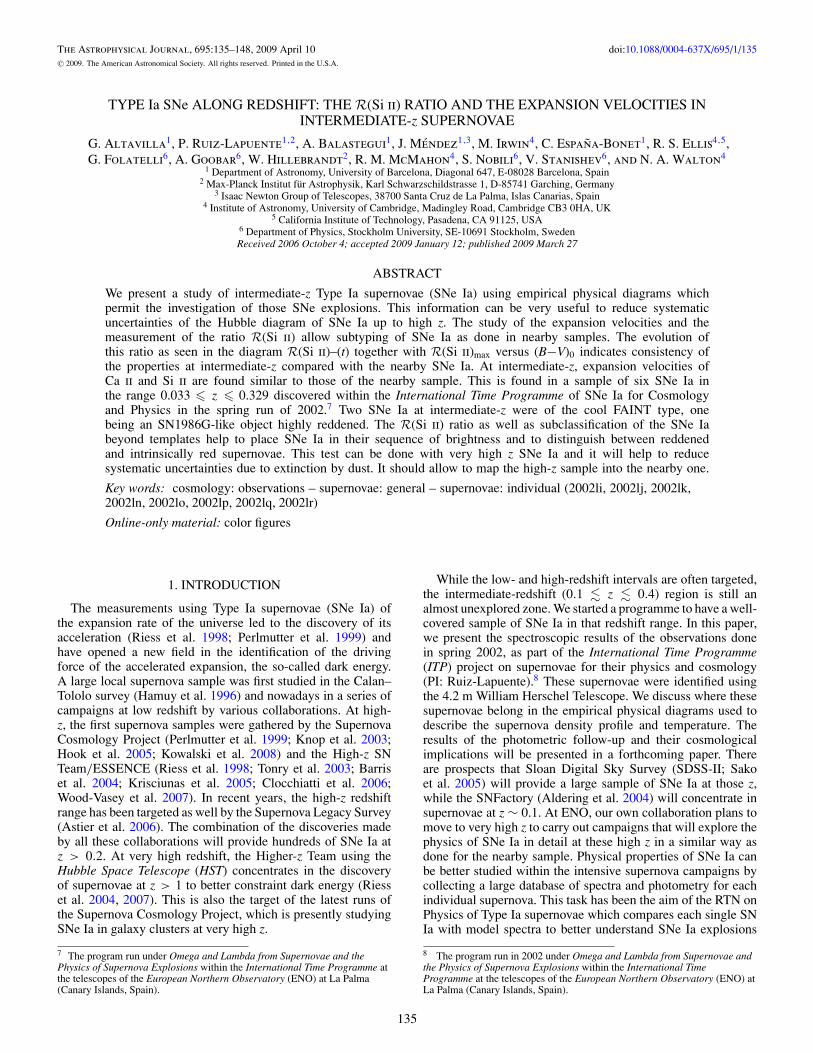
Figure 8. Left panel: spectrum of the Type II supernova SN 2002ln, including galaxy lines for the redshift determination. Right panel: comparison of SN 2002lnspectrum with that of SN 1999em about 9, 14, and 24 since B maximum. Both SN 2002ln and SN 1999em spectra have been smoothed.
(A color version of this figure is available in the online journal.)
Table 2Summary of Observations
Object Date R.A.(2000.0) δ(2000.0) Redshift Object Notes
Name (UT) (hh mm ss) (◦ ′ ′′) Type τ aspec τ b
pho Numberc
SN 2002li 2002 Jun 10 15:59:03.08 +54:18:16.0 0.329 SN Ia −3 ± 2 −3.31 ± 1.0 5SN 2002lj 2002 Jun 11 16:19:19.65 +53:09:54.2 0.180 SN Ia +7 ± 2 +11.95 ± 0.9 8SN 2002lp 2002 Jun 10 16:40:11.45 +42:28:30.2 0.144 SN Ia +1 ± 3 −2.45 ± 0.1 8SN 2002lq 2002 Jun 10 16:40:28.83 +41:14:09.1 0.269 SN Ia −7 ± 2 −10.56 ± 1.3 6SN 2002lr 2002 Jun 10 22:33:12.59 +01:05:56.7 0.255 SN Ia +10 ± 2 +13.47 ± 3.5 5SN 2002lk 2002 Jun 11 16:06:55.92 +55:28:18.2 0.033 SN Ia. −2 ± 2 −2.90 ± 0.1 14SN 2002ln 2002 Jun 10 16:39:24.93 +41:47:29.0 0.138 SN II ∼+14 . . .
SN 2002lo 2002 Jun 11 16:39:56.42 +42:19:20.5 0.136 SN II ∼+35 . . . . . .
Notes.a Spectral epoch from the spectroscopic analysis.b Spectral epoch (rest-frame) from the photometric analysis.c Number of epochs of photometry.
unresolved). Since we have no spectra of the host galaxies alone,the identifications given are made exclusively on the basis of thegalaxy lines contaminating the SNe spectra (Kennicutt 1992).Thus, we will only distinguish between spheroidal galaxies(ellipticals and lenticulars) and spiral galaxies.
SN 2002li and SN 2002lq have host galaxies that are classifiedas spiral galaxies, since they have a good number of lines fromthe Balmer series. The host galaxy morphology of the host ofSN 2002lq can be also inferred from visual inspection, whilethe structure of the host galaxy of SN 2002li is not as clear asfor the previous case.
SN 2002lj lacks galaxy lines. Without any clear Balmeremission line, we have classified it as a spheroidal galaxy.
SN 2002lp has Hα, Hγ , and Hθ in emission, but very faint.Its host galaxy is possibly spiral. The spectrum of SN 2002lralso presents narrow emission lines.
The Type II SNe, SN 2002ln, and SN 2002lo, show narrowemission lines of the Balmer series. Their host galaxies havebeen classified as spirals (Table 3).
4. SPECTROSCOPIC CLASSIFICATION
4.1. Type Ia Supernovae
SN 2002li: This is the farthest supernova discovered inthis search (z = 0.329). Figure 1 (bottom panel) shows thecomparison with SN 2000E (Valentini et al. 2003), an SNwhich is almost identical spectroscopically to SN 1990N, i.e.,a typical Type Ia SN. Both the comparisons with SN 2000Eand Nobili’s spectral templates (Figure 1, middle panel) suggestthat the SN 2002li phase corresponds to a few days beforemaximum.
The blueshifted H and K lines at 3950 Å indicate that theexpansion velocity of Ca ii in SN 2002li is ∼17,200 km s−1,lower than for SN 2000E (∼21,000 km s−1). The S/N doesnot allow a reliable determination of the expansion velocity ofSi ii at ∼6150 Å. Photometric data suggest that SN 2002li isa slow decliner object (Δm15(B) ∼ 0.79 ± 0.22), but beingspectroscopically normal. In the local sample, slow declinersare often normal spectroscopically (Hamuy et al. 2002).

142 ALTAVILLA ET AL. Vol. 695
4000 4500 5000 5500 6000 6500
Rest frame wavelength (Å)
0e+00
Flu
x(e
rgcm
sÅ
)
[OII]
Hα
Hθ
Hβ
[OIII]
[NII]
[OIII]
3500 4000 4500 5000 5500 6000 6500 7000 7500 8000
Rest frame wavelength (Å)
0
0.5
1
1.5
2
2.5
Flu
x(a
rbit
rary
un
its
)
SN 2002lo
SN 1999em
Figure 9. Left panel: spectrum of the Type II supernova SN 2002lo, including galaxy lines for the redshift determination. Right panel: comparison of SN 2002lospectrum with that of SN 1999em ∼35 days since B maximum. Both SN 2002lo and SN 1999em spectra have been smoothed.
(A color version of this figure is available in the online journal.)Table 3
Host Galaxy Morphology
SN Ia z Galaxy Type Offset Identified Lines Imaginga
2002li 0.329 Spiral 0.′′1 W 0.′′2 S Hα , Hβ , Hδ , [S ii], [N ii], [O iii], [O ii] y2002lj 0.180 Spheroidal 0.′′2 W . . . . . . n2002lp 0.144 Spiral? 0.′′2 E 2.′′0 N Hα , Hγ , Hθ , [O ii] n2002lq 0.269 Spiral 4.′′5 E 0.′′7 S Hα , Hβ , Hγ , Hδ , Hζ , Hη , Hθ , [S ii], [O iii] y2002lr 0.255 Spiral? 3.′′0 S . . . Hβ , [S ii], [N ii], [Ne v] n2002lk 0.033 Spiral (Sb) 0.′′7 W 0.′′2 N Hα , [S ii], [N ii], Na D y2002ln 0.138 Spiral 1.′′1 W 8.′′3 S Hα , Hβ , Hζ , Hθ , [S ii] n2002lo 0.136 Spiral 0.′′6 E 1.′′3 S Hα , Hβ , Hθ , [N ii], [O iii], [O ii] y
Note.a Host galaxy morphology can be inferred (y) or not (n) from visual inspection.
SN 2002lj: The redshift of SN 2002lj has been derived fromSNe features due to the absence of measurable galaxy emissionlines. Both the matches with a real SN (SN 1994D; Patatet al. 1996; Figure 2, bottom panel) and a template spectrum(Figure 2, middle panel) suggest that the observed epoch forSN 2002lj is about a week past maximum. Since SNe Ia stillshow S ii features between 5500 Å and 5700 Å as late as 7 daysafter maximum, the absence of these features in the SN 2002ljspectrum suggests a phase out to roughly a week past maximum.The redshift was found by comparison with the template SNfeatures, thus most of them have the same expansion velocity,except Si ii at 6355 Å, whose expansion velocity for SN 2002ljis lower (∼8900 km s−1) than that measured for SN 1994D(∼9800 km s−1).
SN 2002lp: The comparison of the spectra of SN 2002lp withthat of 1989B at maximum (Barbon et al. 1990; Wells et al. 1994)shows that they are quite similar events (Figure 3, bottom panel).The match with a template at day 3 after maximum (Figure 3,middle panel) confirms that the spectrum of SN 2002lp wastaken close to maximum. The expansion velocity measured fromthe Si ii unresolved doublet 6355 Å (∼10,400 km s−1) is almostcoincident with that measured for SN 1989B (∼10,000 km s−1).The absorption dip at ∼5800 Å, identified as Si ii 5972 Å, isstronger than that in SN 1989B. This is quantified by the R(Si ii)parameter or ratio of the two Si ii absorptions dips, i.e., the one
at ∼5800 Å and the one at ∼ 6150 Å (Nugent et al. 1995). InSN 2002lp, R(Si ii) is 0.50 ± 0.05 and in SN 1989B it is 0.29± 0.05 for the same period.
The match with a template at day 3 after maximum confirmsthat the spectrum of SN 2002lp was taken near maximum.The expansion velocities measured from the Si ii unresolveddoublet (6355 Å) and Ca ii lines (3950 Å) (∼10,400 km s−1,∼13,800 km s−1, respectively) are almost coincident with thethose measured for SN 1981B (∼10,400 km s−1, ∼14,000 kms−1). While the velocities for SN 2002lp are in the range of thosefound in SN1981B, the absorption dip at ∼5800 Å, identified asSi ii 5972 Å, is stronger than that in SN 1981B. In SN 1981B,R(Si ii) is 0.16 ± 0.05 near maximum, a value which is typicalfor normal SNe Ia. The spectral comparison with the completeSNe Ia library finds that SN 1989B is the best match for thissupernova (Figure 3, bottom panel).
SN 2002lq: The comparison with SN 1990N, a typical SN Iawith good spectral coverage (Leibundgut et al. 1991), suggeststhat SN 2002lq is a Type Ia SN observed about one week beforemaximum (Figure 4, bottom panel). This is true despite the factthat the Si ii (6355 Å) feature, if existent, is very faint. Matchingsynthetic templates gives a phase of 7 days before maximum forthis supernova (Figure 4, middle panel). The only clearly visiblefeature in this low S/N spectrum is Ca ii line at 3950 Å, andits expansion velocity (∼18,900 km s−1), measured with large

No. 1, 2009 TYPE Ia SNe ALONG REDSHIFT 143
uncertainty, appears somewhat lower than that of SN 1990N(∼21,000 km s−1).
SN 2002lr: This Type Ia supernova was observed about 10 daysafter maximum, as derived from fitting the templates and fittingto real SNe Ia (Figure 5, middle and bottom panels). SN 2002lrspectrum is similar to that of SN 1994D (Patat et al. 1996)10 days past maximum. The expansion velocity derived fromSi ii (6355 Å; ∼8600 km s−1) is similar to that derived for SN1994D (∼9500 km s−1). The expansion velocity measured fromthe Ca ii line at 3950 Å is ∼12,800 km s−1 but it is not possibleto compare this value with the corresponding one in SN 1994Dbecause the limited spectral range of the template does not allowthe measurement of the Ca ii line.
SN 2002lk: For SN 2002lk two different spectra are availablesince it was observed in two consecutive nights (Figure 6). Thestrong similarities between the spectra of SN 2002lk and SN1986G (Phillips et al. 1987; Padova SN Catalogue) suggest thatSN 2002lk is an SN 1986G-like event observed a few days beforemaximum. Due to the supernova’s peculiarities, a comparisonwith Nobili’s spectral templates is not appropriate. In Figure 6,the spectra of SN 1986G have been shifted in wavelength inorder to match better that of SN 2002lk. This small shift takesinto account the different expansion velocities of the two objects.For SN 2002lk the velocity determined from the Si ii line at 6355Å is ∼14,500 km s−1, while for SN 1986G it is ∼10,800 kms−1. The significant difference between the two values mightbe attributable to different explosion energies. SN 2002lk ischaracterized by a higher expansion velocity, slower declinerate in the B light curve (Δm15(B) ∼ 1.23 ± 0.02), and similarR(Si ii) values with respect to SN 1986G. Thus, SN 2002lk, inits turn, can be considered a less extreme object with respect toSN 1986G (Δm15(B) is 1.69 ±0.05 for SN 1986G), suggesting acontinuous transition from object to object. We note that similarhigh expansion velocity was found for SN 1998de, a 1991bg-like SN (Modjaz et al. 2001), whose expansion velocity (6 daysbefore maximum) derived from the Si ii (6355 Å) minimum was13,300 km s−1 (Garnavich et al. 1998).
As far as reddening is concerned, the detection of the Na i
D (λλ5890, 5896 Å) allows us to estimate the host galaxycomponent of the color excess E(B − V ). The host galaxyis a spiral galaxy, and the supernova is highly reddened by thegalaxy dust lane. By means of an empirical relation betweenthe equivalent width (EW) of the Na i D lines and E(B − V )(Barbon et al. 1990; Richmond et al. 1994; Turatto et al. 2003)we estimated 0.15 � E(B − V ) � 0.5 (0.46 � AV � 1.55),where the two values correspond to two different slopes ofthe relation found by Turatto et al. (2003). The color excessE(B − V ) = 0.56 ± 0.04 derived from the photometric data isconsistent with the higher value obtained from the spectroscopicanalysis. The Galactic component of the absorption is quitenegligible: AV = 0.025 (Schlegel et al. 1998). The spectrumof SN2002lk has a very flat bottom Ca ii and Si ii absorptiontroughs. The shape of these absorption features suggests thatthis is a highly asymmetric supernova, like SN 2004dt (Altavillaet al. 2007).
4.2. Type II Supernovae
SN 2002ln and SN 2002lo: Both Type II SNe are matched withSN 1999em as template, a normal Type II plateau (Elmhamdiet al. 2003). The phase is not so well defined for SN 2002ln sincethe blue part of the spectrum has a low S/N. A comparison ofSN 2002ln with SN 1999em at 9, 14 (Hamuy et al. 2001),
Figure 10. Expansion velocity for Hα (6562.8 Å) as deduced from its minimum,in SN 2002lo, compared with those of SN 1999em (Elmhamdi et al. 2003),1991G (Blanton et al. 1995), 1987A (Phillips et al. 1989), and 1998A (Pastorelloet al. 2005).
(A color version of this figure is available in the online journal.)
and 24 (Leonard et al. 2002) days since B maximum, shown inFigure 8, suggests a phase of about two weeks. The Hα minimumis not measurable, and the peak of the P Cygni profile, inprinciple expected to be at null velocity, is slower in SN 2002ln(∼220 km s−1 for SN 2002ln, ∼2500 km s−1 for SN 1999em).
A comparison with SN 1999em at ∼35 days since B maxi-mum (Leonard et al. 2002) shows that SN 2002lo is about onemonth old (Figure 9). The expansion velocity measured from theHα minimum in SN 2002lo (∼8980 km s−1) is slightly higherthan that measured for SN 1999em (∼6100 km s−1; Figure 10),while the peak of the P Cygni profile is faster for SN 2002lo(∼1500 km s−1) with respect to SN 1999em (∼950 km s−1).Uncertainties for our measurements are of the order of 500 kms−1. However, Type II plateau SNe, and Type II SNe in gen-eral, are a very heterogeneous class, showing a wide range inthe photometric and spectroscopic properties (Patat et al. 1994;Filippenko 1997).
5. R(Si ii) PARAMETER AND EXPANSION VELOCITIES
Several diagrams can help us to learn about theseintermediate-z SNe Ia as stellar explosions and allow a com-parison with the nearby sample. Expansion velocities for Ca ii
(3950 Å) and Si ii (6355 Å) lines have been measured from theblueshift of the lines, as in the local sample. The ratio of thetwo Si ii lines, i.e., Si ii (6355 Å) and Si ii (5890 Å) defines theR(Si ii) parameter as introduced by Nugent et al. (1995). Wemeasure the R(Si ii) parameter following the same procedure asthese authors: drawing segments between adjacent continuumpoints of the absorption lines and measuring the difference influx between the higher excitation transition of the two (thosetransitions are the 4P–5S and the 4S–4P). If the photosphere has
144 ALTAVILLA ET AL. Vol. 695
Figure 11. R(Si ii) parameter for SN 2002lk, SN 2002lp, and SN 2002li, andfor a sample of nearby SNe shown as comparison. Filled symbols refer to highvelocity gradient SNe, open symbols to low velocity gradient SNe as defined inBenetti et al. (2005). FAINT SNe, listed in the box, are also shown.
(A color version of this figure is available in the online journal.)
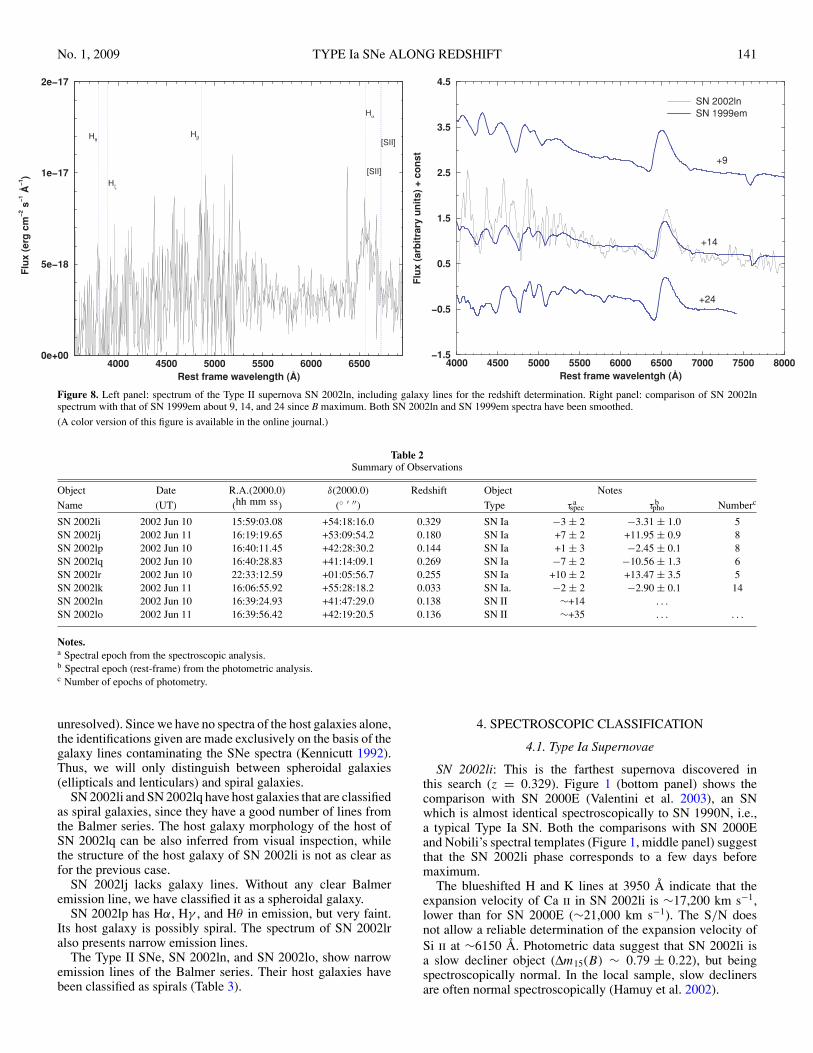
a higher effective temperature Teff, one would expect that the5800 Å trough would increase toward higher Teff and a lowervalue of R(Si ii). The behavior in SNe Ia is, however, twofoldat very early phases (Figure 11). In one group, R(Si ii) is seento decrease significantly from the premaximum hotter phase to-ward the maximum. This is found in SNe Ia like SN2002bo andSN2004dt which present significant 5800 Å troughs comparedto the one at 6150 Å in this premaximum phase, while in anothergroup it is the opposite: R(Si ii) increases from the premaxi-mum hotter phase toward the maximum phase in SNe Ia likeSN 1990N or stays constant like in SN2003du. Such diversityof behaviors could be linked to the presence of Fe and Co in theouter layers. According to Nugent et al (1995), the Si ii lines in-teract with line blanketing from Fe iii and Co iii at premaximumwhen the temperature is high and Fe and Co are substantiallypresent in the outer layers. This effect washes out the 5800 Åtrough. The decrease of R(Si ii) at premaximum in SN 1990Ncould be due to Fe and Co in the outer layers, as this supernovashowed these elements in the premaximum spectra. The super-novae which behave like SN 2004dt and SN2002bo do not havesubstantial Fe in the outer layers (Altavilla et al. 2007). In SN2002bo, intermediate-mass elements were most abundant in theouter layers (Stehle et al. 2004). The high R(Si ii) is consistentwith the expectation of minor line blanketing by Fe iii and Co iii.
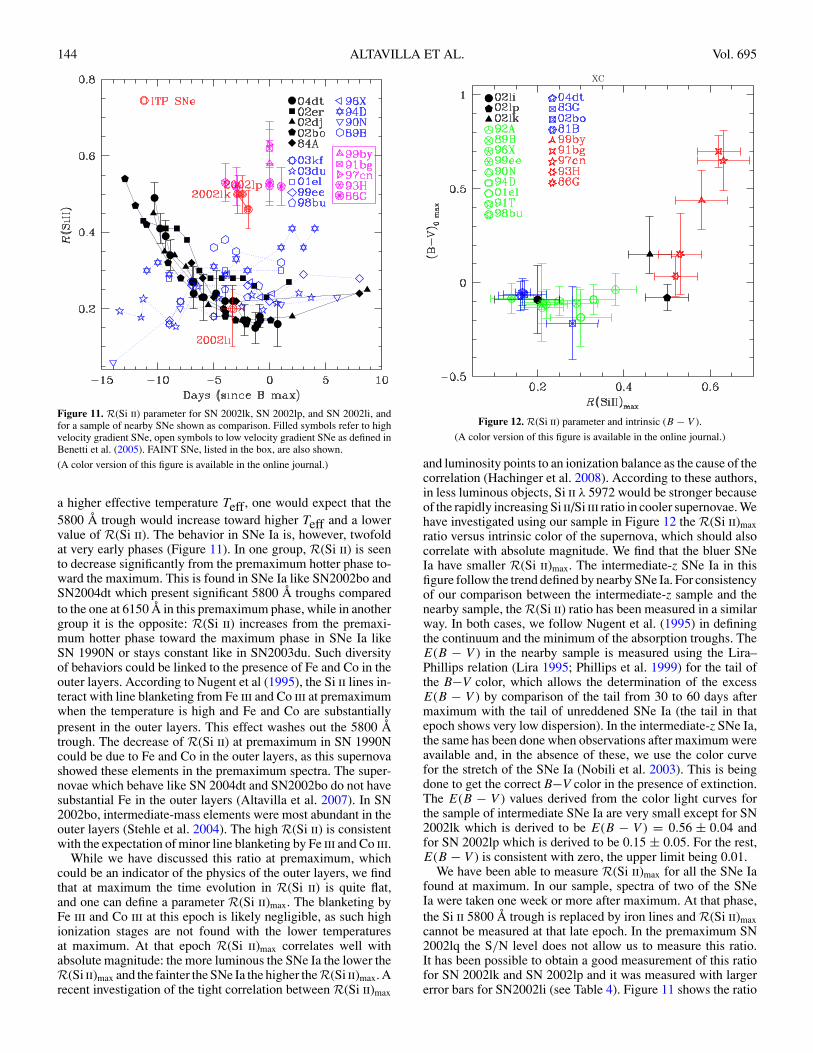
While we have discussed this ratio at premaximum, whichcould be an indicator of the physics of the outer layers, we findthat at maximum the time evolution in R(Si ii) is quite flat,and one can define a parameter R(Si ii)max. The blanketing byFe iii and Co iii at this epoch is likely negligible, as such highionization stages are not found with the lower temperaturesat maximum. At that epoch R(Si ii)max correlates well withabsolute magnitude: the more luminous the SNe Ia the lower theR(Si ii)max and the fainter the SNe Ia the higher theR(Si ii)max. Arecent investigation of the tight correlation between R(Si ii)max
XC
Figure 12. R(Si ii) parameter and intrinsic (B − V ).
(A color version of this figure is available in the online journal.)
and luminosity points to an ionization balance as the cause of thecorrelation (Hachinger et al. 2008). According to these authors,in less luminous objects, Si ii λ 5972 would be stronger becauseof the rapidly increasing Si ii/Si iii ratio in cooler supernovae. Wehave investigated using our sample in Figure 12 the R(Si ii)maxratio versus intrinsic color of the supernova, which should alsocorrelate with absolute magnitude. We find that the bluer SNeIa have smaller R(Si ii)max. The intermediate-z SNe Ia in thisfigure follow the trend defined by nearby SNe Ia. For consistencyof our comparison between the intermediate-z sample and thenearby sample, the R(Si ii) ratio has been measured in a similarway. In both cases, we follow Nugent et al. (1995) in definingthe continuum and the minimum of the absorption troughs. TheE(B − V ) in the nearby sample is measured using the Lira–Phillips relation (Lira 1995; Phillips et al. 1999) for the tail ofthe B−V color, which allows the determination of the excessE(B − V ) by comparison of the tail from 30 to 60 days aftermaximum with the tail of unreddened SNe Ia (the tail in thatepoch shows very low dispersion). In the intermediate-z SNe Ia,the same has been done when observations after maximum wereavailable and, in the absence of these, we use the color curvefor the stretch of the SNe Ia (Nobili et al. 2003). This is beingdone to get the correct B−V color in the presence of extinction.The E(B − V ) values derived from the color light curves forthe sample of intermediate SNe Ia are very small except for SN2002lk which is derived to be E(B − V ) = 0.56 ± 0.04 andfor SN 2002lp which is derived to be 0.15 ± 0.05. For the rest,E(B − V ) is consistent with zero, the upper limit being 0.01.
We have been able to measure R(Si ii)max for all the SNe Iafound at maximum. In our sample, spectra of two of the SNeIa were taken one week or more after maximum. At that phase,the Si ii 5800 Å trough is replaced by iron lines and R(Si ii)maxcannot be measured at that late epoch. In the premaximum SN2002lq the S/N level does not allow us to measure this ratio.It has been possible to obtain a good measurement of this ratiofor SN 2002lk and SN 2002lp and it was measured with largererror bars for SN2002li (see Table 4). Figure 11 shows the ratio
No. 1, 2009 TYPE Ia SNe ALONG REDSHIFT 145
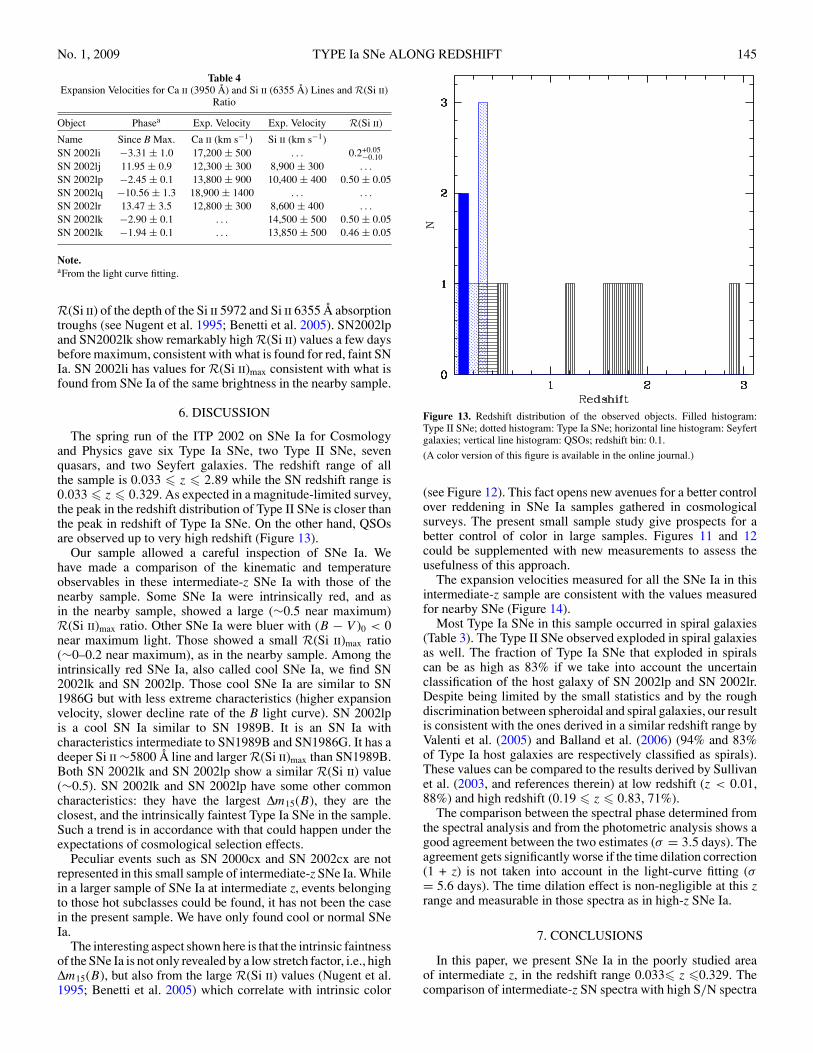
Table 4Expansion Velocities for Ca ii (3950 Å) and Si ii (6355 Å) Lines and R(Si ii)
Ratio
Object Phasea Exp. Velocity Exp. Velocity R(Si ii)
Name Since B Max. Ca ii (km s−1) Si ii (km s−1)SN 2002li −3.31 ± 1.0 17,200 ± 500 . . . 0.2+0.05
−0.10SN 2002lj 11.95 ± 0.9 12,300 ± 300 8,900 ± 300 . . .
SN 2002lp −2.45 ± 0.1 13,800 ± 900 10,400 ± 400 0.50 ± 0.05SN 2002lq −10.56 ± 1.3 18,900 ± 1400 . . . . . .
SN 2002lr 13.47 ± 3.5 12,800 ± 300 8,600 ± 400 . . .
SN 2002lk −2.90 ± 0.1 . . . 14,500 ± 500 0.50 ± 0.05SN 2002lk −1.94 ± 0.1 . . . 13,850 ± 500 0.46 ± 0.05
Note.aFrom the light curve fitting.
R(Si ii) of the depth of the Si ii 5972 and Si ii 6355 Å absorptiontroughs (see Nugent et al. 1995; Benetti et al. 2005). SN2002lpand SN2002lk show remarkably high R(Si ii) values a few daysbefore maximum, consistent with what is found for red, faint SNIa. SN 2002li has values for R(Si ii)max consistent with what isfound from SNe Ia of the same brightness in the nearby sample.
6. DISCUSSION
The spring run of the ITP 2002 on SNe Ia for Cosmologyand Physics gave six Type Ia SNe, two Type II SNe, sevenquasars, and two Seyfert galaxies. The redshift range of allthe sample is 0.033 � z � 2.89 while the SN redshift range is0.033 � z � 0.329. As expected in a magnitude-limited survey,the peak in the redshift distribution of Type II SNe is closer thanthe peak in redshift of Type Ia SNe. On the other hand, QSOsare observed up to very high redshift (Figure 13).
Our sample allowed a careful inspection of SNe Ia. Wehave made a comparison of the kinematic and temperatureobservables in these intermediate-z SNe Ia with those of thenearby sample. Some SNe Ia were intrinsically red, and asin the nearby sample, showed a large (∼0.5 near maximum)R(Si ii)max ratio. Other SNe Ia were bluer with (B − V )0 < 0near maximum light. Those showed a small R(Si ii)max ratio(∼0–0.2 near maximum), as in the nearby sample. Among theintrinsically red SNe Ia, also called cool SNe Ia, we find SN2002lk and SN 2002lp. Those cool SNe Ia are similar to SN1986G but with less extreme characteristics (higher expansionvelocity, slower decline rate of the B light curve). SN 2002lpis a cool SN Ia similar to SN 1989B. It is an SN Ia withcharacteristics intermediate to SN1989B and SN1986G. It has adeeper Si ii ∼5800 Å line and larger R(Si ii)max than SN1989B.Both SN 2002lk and SN 2002lp show a similar R(Si ii) value(∼0.5). SN 2002lk and SN 2002lp have some other commoncharacteristics: they have the largest Δm15(B), they are theclosest, and the intrinsically faintest Type Ia SNe in the sample.Such a trend is in accordance with that could happen under theexpectations of cosmological selection effects.
Peculiar events such as SN 2000cx and SN 2002cx are notrepresented in this small sample of intermediate-z SNe Ia. Whilein a larger sample of SNe Ia at intermediate z, events belongingto those hot subclasses could be found, it has not been the casein the present sample. We have only found cool or normal SNeIa.
The interesting aspect shown here is that the intrinsic faintnessof the SNe Ia is not only revealed by a low stretch factor, i.e., highΔm15(B), but also from the large R(Si ii) values (Nugent et al.1995; Benetti et al. 2005) which correlate with intrinsic color
Figure 13. Redshift distribution of the observed objects. Filled histogram:Type II SNe; dotted histogram: Type Ia SNe; horizontal line histogram: Seyfertgalaxies; vertical line histogram: QSOs; redshift bin: 0.1.
(A color version of this figure is available in the online journal.)
(see Figure 12). This fact opens new avenues for a better controlover reddening in SNe Ia samples gathered in cosmologicalsurveys. The present small sample study give prospects for abetter control of color in large samples. Figures 11 and 12could be supplemented with new measurements to assess theusefulness of this approach.
The expansion velocities measured for all the SNe Ia in thisintermediate-z sample are consistent with the values measuredfor nearby SNe (Figure 14).
Most Type Ia SNe in this sample occurred in spiral galaxies(Table 3). The Type II SNe observed exploded in spiral galaxiesas well. The fraction of Type Ia SNe that exploded in spiralscan be as high as 83% if we take into account the uncertainclassification of the host galaxy of SN 2002lp and SN 2002lr.Despite being limited by the small statistics and by the roughdiscrimination between spheroidal and spiral galaxies, our resultis consistent with the ones derived in a similar redshift range byValenti et al. (2005) and Balland et al. (2006) (94% and 83%of Type Ia host galaxies are respectively classified as spirals).These values can be compared to the results derived by Sullivanet al. (2003, and references therein) at low redshift (z < 0.01,88%) and high redshift (0.19 � z � 0.83, 71%).
The comparison between the spectral phase determined fromthe spectral analysis and from the photometric analysis shows agood agreement between the two estimates (σ = 3.5 days). Theagreement gets significantly worse if the time dilation correction(1 + z) is not taken into account in the light-curve fitting (σ= 5.6 days). The time dilation effect is non-negligible at this zrange and measurable in those spectra as in high-z SNe Ia.
7. CONCLUSIONS
In this paper, we present SNe Ia in the poorly studied areaof intermediate z, in the redshift range 0.033� z �0.329. Thecomparison of intermediate-z SN spectra with high S/N spectra

146 ALTAVILLA ET AL. Vol. 695
Figure 14. Expansion velocities for Si ii (6355 Å; upper panel) and Ca ii (3950Å; lower panel) as deduced from their minima, compared with those of otherSNe. The Si ii evolution expected for different metallicities (solid line, top: ×10solar metallicity; middle: ×1; bottom: ×0.1) is also shown (Lentz et al. 2000).The phase has been determined from the light-curve fitting.
(A color version of this figure is available in the online journal.)
of nearby SNe has not revealed significant differences in thespectral features and kinematics. In particular, for all the TypeIa SNe of our sample, including a peculiar one, it has alwaysbeen possible to find a nearby Type Ia SN counterpart, and theexpansion velocities derived from the Si ii and Ca ii lines arewithin the range observed for nearby Type Ia SNe. The spectralconcordance seems to correspond as well with trends seen inthe peak color and decline of the light curve. The comparisonbetween the epochs determined for each spectrum from thespectral analysis and the photometric epochs derived from fitsof the light curves shows values in agreement within a few days.
The main conclusion of this research is that the R(Si ii)parameter is useful for investigating the physics of SNe Ia
Figure 15. Phase distribution of the normal SN Ia templates listed in Table 5(limited to 35 days since B maximum). The dotted area shows the phase rangeof our SN Ia sample.
explosions at high redshift and serves as meaningful comparisonwith the nearby SNe Ia sample. It can help to place individualsupernova in the sequence of bright–faint SNe Ia (sequencecorrelated with slow–fast decline and with bluer–redder atmaximum). It provides a control over reddening that can be veryuseful to reduce systematic uncertainties. While the category oflarge R(Si ii)max contains faint and intrinsically redder SNe Ia,in the side of lowR(Si ii)max one finds the intrinsically bluer SNeIa. We have found that intermediate and nearby SNe Ia followa similar R(Si ii)max–(B − V )0 behavior and the intermediate-z SNe Ia occupy the same space in the evolution of R(Si ii)along time than nearby ones. Similar results are found for theexpansion velocity, though a larger sample of SNe Ia at allepochs needs to be investigated.
While the behavior of R(Si ii) with epoch can be linked toluminosity and color properties, there is no trend correlatingR(Si ii)max with the expansion velocities of Si ii or Ca II. Inthe side of large R(Si ii)max one can have SNe Ia with a largeSi ii velocity or with a lower one. Therefore, velocity of theintermediate-mass elements is not a tracer of the luminosityaccording to the present sample. We also have some doubtsabout the correlation of asymmetries in the ejecta with overallluminosity of the SN Ia. SN2002lk is a faint and red SN Iawhich shows high asymmetries in the Si and Ca lines, while SN2004dt, a normally luminous SN Ia, has those asymmetries aswell.
The R(Si ii) at epochs well before maximum is an observ-able quantity of great value and accessible to high-z SNe Iasearches. While R(Si ii)max correlates well with intrinsic color,R(Si ii)premax can identify the composition of the outer layers ofthe SNe Ia observed in cosmological searches. Thus, with thesame spectra obtained in the discovery runs one can investigatethe nature of those explosions.
This research was carried through the International TimeProgramme Omega and Lambda from Supernovae and the

No. 1, 2009 TYPE Ia SNe ALONG REDSHIFT 147
Table 5SN Ia Templates
SN Type N. Time Δm15(B) Reference(s)Spectra Coveragea
1986G Ia pec. 39 −4..+324 1.69(0.05) Phillips et al. (1987) Pd-As Cat.-SUSPECT1989B Ia 8 0..+52 1.28(0.05) Barbon et al. (1990) Pd-As Cat.-SUSPECT1990N Ia 6 +2..+333 1.05(0.05) Leibundgut et al. (1991) Pd-As Cat.-SUSPECT. . . . . . . . . . . . . . . Mazzali et al. (1993) . . .
1994D Ia 31 −11..+106 1.31(0.05) Patat et al. (1996) Pd-As Cat.-SUSPECT1999em II P 40 −1..+515 . . . Hamuy et al. (2001) Pd-As Cat.-SUSPECT. . . . . . . . . . . . . . . Leonard et al. (2002) . . .
2000E Ia 7 −6..+124 0.94(0.05) Valentini et al. (2003) Pd-As Cat.-SUSPECT
Note.aSince B maximum.
Physics of Supernova Explosions at the ENO Observatory and itis based on observations made with the 4.2 m William HerschelTelescope, operated on the island of La Palma by the IsaacNewton Group in the Spanish Observatorio del Roque de losMuchachos of the Instituto de Astrofisica de Canarias. Thanksare given to the scientific staff of the Observatory in Padova,and specially to Stefano Benetti. This work is supported in partby the European Community’s Human Potential Programmeunder contract HPRN-CT-2002-00303, The Physics of Type IaSupernovae.
APPENDIX
SPECTRAL TEMPLATES
The spectral analysis has been performed using bothsynthetic and real spectra. In particular we used 90 syn-thetic SN Ia spectra by Nobili et al. (2003), basedon Nugent’s spectral templates (Nugent et al. 2002;http://supernova.lbl.gov/∼nugent/nugent_templates.html).Phases range from −19 to +70 days since B maximum, with1 day step. Wavelength coverage is from 2500 Å to 25000 Å,but in our analysis the useful range is limited up to ∼10000 Å.
We also made use of real spectral templates, mainly col-lected from the Padova-Asiago SN Catalogue (Pd-As Cat.)(http://web.pd.astro.it/supern/snean.txt; Barbon et al. 1990)and SUSPECT database (http://bruford.nhn.ou.edu/∼suspect/),spanning a wide range in the decline rates (Δm15(B)) of thecorresponding B band light curves. In particular, we used thespectra listed in Table 5. Table 5 shows the spectra available ofthe comparison SNe Ia that best match our intermediate-z ones,while Figure 15 shows their phase distribution.
REFERENCES
Aldering, G., et al. 2004, Proc. SPIE, 4836, 61Altavilla, G., et al. 2005, in ASP Conf. Ser. 342, 1604–2004: Supernovae as
Cosmological Lighthouses, ed. M. Turatto, S. Benetti, L. Zampieri, & W.Shea (San Francisco, CA: ASP), 486
Altavilla, G., et al. 2007, A&A, 475, 585Astier, P., et al. (The SNLS Collaboration) 2006, A&A, 447, 31ABalastegui, A., et al. 2005, in ASP Conf. Ser. 342, 1604–2004: Supernovae as
Cosmological Lighthouses, ed. M. Turatto, S. Benetti, L. Zampieri, & W.Shea (San Francisco, CA: ASP), 490
Balland, C., et al. 2006, A&A, 445, 387Barbon, R., Benetti, S., Cappellaro, E., Rosino, L., & Turatto, M. 1990, A&A,
237, 79Barris, B. J., et al. 2004, ApJ, 602, 571Benetti, S., et al. 2004, MNRAS, 348, 261Benetti, S., et al. 2005, ApJ, 623, 1011
Blanton, E. L., Schmidt, B. P., Kirshner, R. P., Ford, C. H., Chromey, F. R., &Herbst, W. 1995, AJ, 110, 2868
Branch, D., Fisher, A., & Nugent, P. 1993, AJ, 106, 2383Branch, D., et al. 2006, PASP, 118, 560BClocchiatti, A., et al. 2006, ApJ, 642, 1Elmhamdi, A., et al. 2003, MNRAS, 338, 939Filippenko, A. V. 1997, ARA&A, 35, 309Garnavich, P., Jha, S., & Kirshner, R. 1998, IAU Circ. 6980Hachinger, S., Mazzali, P., Tanaka, M., Hillebrandt, W., & Benetti, S. 2008,
MNRAS, 389, 1087Hamuy, M., Phillips, M. M., Suntzeff, N. B., Nicholas, B., Schommer, R. A.,
Maza, J., & Aviles, R. 1996, AJ, 112, 2398Hamuy, M., et al. 2001, ApJ, 558, 615Hamuy, M., et al. 2002, AJ, 124, 417Hatano, K., Branch, D., Lentz, E. J., Baron, E., Filippenko, A. V., & Garnavich,
P. M. 2000, ApJ, 543, 49Hillebrandt, W., et al. 2005, http://www.mpa-garching.mpg.de/ rtnHook, I. M., et al. 2005, AJ, 130, 2788Howell, D. A. 2001, ApJ, 554, 193Kennicutt, R. C. 1992, ApJSS, 79, 255Knop, R. A., et al. 2003, ApJ, 598, 102Kowalski, M., et al. 2008, ApJ, 686, 1087Krisciunas, K., et al. 2005, AJ, 130, 2453Leibundgut, B., Kirshner, R. P., Filippenko, A. V., Shields, J. C., Foltz, C. B.,
Phillips, M. M., & Sonneborn, G. 1991, ApJ, 371, 23Lentz, E. J., Baron, E., Branch, D., Hauschildt, P. H., & Nugent, P. E. 2000, ApJ,
530, 966Leonard, D. C., et al. 2002, PASP, 114, 35Lira, P. 1995, Master thesis, Univ. ChileMazzali, P. A., Lucy, L. B., Danziger, I. J., Gouiffes, C., Cappellaro, E., &
Turatto, M. 1993, A&A, 269, 423Mendez, J., et al. 2005, in ASP Conf. Ser. 342, 1604–2004: Supernovae as
Cosmological Lighthouses, ed. M. Turatto, S. Benetti, L. Zampieri, & W.Shea (San Francisco, CA: ASP), 488
Modjaz, M., Li, W., Filippenko, A. V., King, J. Y., Leonard, D. C., Matheson,T., Treffers, R. R., & Riess, A. G. 2001, PASP, 113, 308
Nobili, S., Goobar, A., Knop, R., & Nugent, P. 2003, A&A, 404,901
Nugent, P., Kim, A., & Perlmutter, S. 2002, PASP, 114, 803Nugent, P., Phillips, M., Baron, E., Branch, D., & Hauschildt, P. 1995, ApJ, 455,
147Pastorello, A., et al. 2005, MNRAS, 360, 950Patat, F., Barbon, R., Cappellaro, E., & Turatto, M. 1994, A&A, 282, 731Patat, F., Benetti, S., Cappellaro, E., Danziger, I. J., della Valle, M., Mazzali, P.
A., & Turatto, M. 1996, MNRAS, 278, 111Perlmutter, S., et al. 1999, ApJ, 517, 565Phillips, M. M., Heathcote, S. R., Hamuy, M., & Navarrete, M. 1989, AJ, 95,
1087Phillips, M. M., et al. 1987, PASP, 99, 592Phillips, M. M., et al. 1999, ApJ, 118, 1766Richmond, M. W., Treffers, R. R., Filippenko, A. V., Paik, Y., Leibundgut, B.,
Schulman, E., & Cox, C. V. 1994, AJ, 107, 1022Riess, A. G., et al. 1997, ApJ, 114, 722Riess, A. G., et al. 1998, AJ, 116, 1009Riess, A. G., et al. 2004, ApJ, 607, 665Riess, A. G., et al. 2007, ApJ, 659, 98

148 ALTAVILLA ET AL. Vol. 695
Ruiz-Lapuente, P. 2006, in Proc. of Bernard’s Cosmic Stories(http://www.astro.rug.nl/∼bernard60)
Sako, M., et al. 2005, AAS, 207, 15002Schlegel, D. J., Finkbeiner, D. P., & Davis, M. 1998, ApJ, 500,
525Stehle, M., Mazzali, P. A., Benetti, S., & Hillebrandt, W. 2004, MNRAS, 360,
1231Sullivan, M., et al. 2003, MNRAS, 340, 1057Tonry, J. L., et al. 2003, ApJ, 594, 1
Turatto, M., Benetti, S., & Cappellaro, E. 2003, in Proc. ESO/MPA/MPEWorkshop: From Twilight to Highlight—The Physics of Supernovae, ed.B. Leibundgut & W. Hillebrandt (Berlin: Springer), 200
Valentini, G., et al. 2003, ApJ, 595, 779Valenti, S., et al. 2005, in ASP Conf. Ser. 342, 1604–2004: Supernovae as
Cosmological Lighthouses, ed. M. Turatto, S. Benetti, L. Zampieri, & W.Shea (San Francisco, CA: ASP), 505
Wells, L. A., et al. 1994, AJ, 108, 2233Wood-Vasey, W. M., et al. 2007, ApJ, 666, 694