types of taxes personal income tax (all types of income) payroll tax (15.3 % of wage and salary...
TRANSCRIPT


Types of Taxes
• personal income tax (all types of income)
• payroll tax (15.3 % of wage and salary income)
• corporate income tax (corporate profits)
• excise tax (gasoline, liquor, sales)
• estate and gift tax
• tariffs on imports
• property taxes

Federal Taxes14_01
PERCENT OFFEDERAL TAXREVENUE
50
Personal income taxes
Payroll taxes
Corporate income taxes
Excise taxes
Tariffs Estate and gift taxes
40
30
20
10
0

Income Tax Terminology
• taxable income = income less• exemptions ($2550 per person)
• deductions (e.g. $4000 for single taxpayer
• marginal tax rate– tax paid on an additional dollar earned
• average tax rate– total taxes as a percent of total income
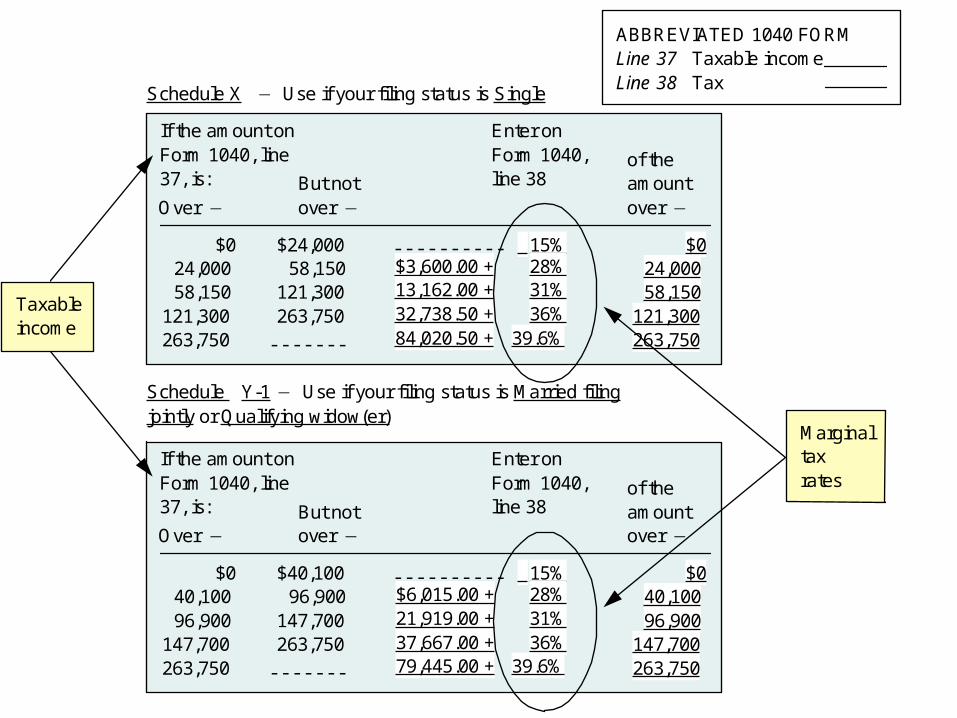
14_02ABBREVIATED 1040 FORMLine 37 Taxable incomeLine 38 Tax
Schedule X Use if your filing status is Single
If the amount onForm 1040, line37, is:
Over
$024,00058,150
121,300263,750
But notover
$24,00058,150
121,300263,750
- - - - - - -
Enter onForm 1040,line 38
of theamountover
- - - - - - - - - - 15%28%31%36%
39.6%
$3,600.00 +13,162.00 +32,738.50 +84,020.50 +
$024,00058,150
121,300263,750
Schedule Y-1 Use if your filing status is Married filingjointly or Qualifying widow(er)
If the amount onForm 1040, line37, is:
Over
$040,10096,900
147,700263,750
But notover
$40,10096,900
147,700263,750
- - - - - - -
Enter onForm 1040,line 38
of theamountover
- - - - - - - - - - 15%28%31%36%
39.6%
$6,015.00 +21,919.00 +37,667.00 +79,445.00 +
$040,10096,900
147,700263,750
Taxableincome
Marginaltaxrates

Progressive, Regressive, or Proportional?
14_03
MARGINAL
TAX RATE
(PERCENT)
40
30
20
10
50,000 100,000 150,000 200,000 250,000
TAXABLE INCOME (DOLLARS)
300,0000

What is the Flat Tax?
• Big exemption – $35000 would be the “zero-bracket” amount for
a family of four
• Flat rate for all income above
• Hall-Rabushka version: – Tax wage and salary income at the household
level– Interest, dividends taxed at the firm level

Review of the Effect of Putting a Tax on a Commodity
• Price rises, but by less than the tax
• Quantity declines
• Deadweight loss – size depends on how much quantity declines
• Incidence of the Tax– who bears more of the burden of the tax
• consumers or firms?
– Depends on how much the price rises

14_04A
Large change in price
Low Elasticity of Demand
Supply
with tax
Supply
without
tax
Q
P
Demand
Deadweight loss is small.
Small change in quantity

14_04B
P
High Elasticity of Demand
Q
Supply with tax
Supply without tax
Demand
Deadweight loss is large.
Large change in quantity
Small change in price

14_04C
Deadweight loss is small.
P
Low Elasticity of Supply
Q
Demand
Supply with tax
Supply without tax
Small change in price
Small change in quantity

14_04D
P
High Elasticity of Supply
Q
Supply with tax
Supply without tax
Demand
Deadweight loss is large.
Large change in quantity
Large change in price

Effect of a Tax on Labor Income
14_05WAGE PAID TO WORKER
HOURS OF WORK
Labor demand
New labor supply
Old labor supply
Labor supply shifts up because of the tax increase.
Quantity of labor reduced by this amount

Payroll Tax: Firm versus Worker14_06 WAGE PAID
TO WORKER
HOURS OF WORK
Old demand
Supply
Wage paid to worker falls.
New demand
Old supply
Demand
New supply
Here the employer pays the tax: the labor demand curve shifts down.
Here the worker pays the tax: the labor supply curve shifts up.
But the eventual impact is the same: the length of the black arrows are the same on the left and the right.
WAGE PAID TO WORKER
HOURS OF WORK
Tax
Decline in after- tax wage
Wage paid to the workerrises slightly, but afterthe tax is paid, thedecline in the after-tax wage is the same as when the employer pays the tax.

Effects of Tax Rate Changes on Tax Revenues (T14.1 Modified)
TaxRevenuesT = twL
TaxRate(t)
WagePer hour(w)
HoursWorked(L)
$8000 .4 $20 1000
$8400 .6 $20 700
$6400 .8 $20 400

The Laffer Curve14_07
TAX REVENUE0
TAX RATE (PERCENT)
Revenue first increases as the tax rate increases and then declines.
100

The Dynamic Scoring Debate
• Consider cutting the tax rate from .6 to .4
• Before the tax cut, L = 700 hours– thus: 0.6 times $14000 = $8400
• Static scoring, L stays at 700 hours– thus: 0.4 times $14000 = $5400
• Dynamic scoring, L rises to 1000 hours– thus: 0.4 times $20000 = $8000

The Equality-Efficiency Trade-Off:
As tax rates get higher (in an effort to improve equity) there is less production (less efficiency)
and perhaps less revenue to redistribute

Transfer Payments
• Means-tested programs– family support programs (formerly AFDC until
welfare reform of 1996)– medicaid– food stamps– Earned Income Tax Credit (EITC)
• Social Insurance Programs– social security– medicare– unemployment insurance

Two Welfare Reform Options
14_08
Incomefrom work
HOURS OF WORK
TOTAL INCOME
HOURS OF WORK
HOURS OF WORK
Reform by phasing out payments more slowly
Reform by paying less welfare
TOTAL INCOME
TOTAL INCOME
Welfare is paid to those with high incomes.
Welfare payment is small to the very poor.
Welfarepayment

Income Distribution in the U.S.
HouseholdQuintile
Percent ofIncome
CumulativePercent
Lower 20% 5 5
Second 20% 11 16
Third 20% 17 33
Fourth 20% 24 57
Top 20% 43 100

Lorenz Curve14_11
CUMULATIVE PERCENT OF HOUSEHOLDS
CUMULATIVE PERCENT OF INCOME100
80
60
40
20
20 40 60 80 100
Curve of perfect equality
Lorenz curve for United States, 1990
Curve of complete inequality
B
A
Area representing deviation from perfect equality
0

Recent increase in income inequality (Gini Coefficient)
• But why? – return to education is
rising?
– international trade?
– productivity growth?
14_12
GINI
COEFFICIENT
0.4
0.3
0.2
0.1
0.01950 1960 1970 1980 1990
0.5

Poverty Rate in the United States
14_13
20
15
10
5
01970 1980 1990 1994
25
30
35
40
PERCENT
1960
Poverty rate
for aged
Poverty rate
for children
Overall poverty rate

A View of World Income Inequality
14A
CUMULATIVE PERCENT OF HOUSEHOLDS
CUMULATIVEPERCENTOF INCOME
100
80
60
40
20
20 40 60 80 1000
People Moving from Quintile to Quintile
• About 60 percent of households move from one quintile to another quintile over a ten year span– About one-half of those in the bottom quintile
move out of the bottom quintile – About one-half of those in the top quintile
move out of the top quintile

1000 Points of Light?
