u. s. department of energy’s solid state energy conversion
TRANSCRIPT
U. S. Department of Energy’s Solid State Energy Conversion Alliance (SECA) Program – 2010 Progress and PlansDecember 3, 2010
Dr. Shailesh D. VoraTechnology Manager, Fuel Cells National Energy Technology LaboratoryUnited States Department of Energy

2
Fuel Cells
Types of Fuel Cells Fuel cells are electrochemical devices that convert the chemical energy of the fuel directly into electricity and heat (by bypassing thermal and mechanical conversion processes), and do so more efficiently than conventional combustion-based technologies.
Fuel cells can be thought of as batteries that, when provided with fuel and air, will not run down.
Characterized by the electrolyte Proton Exchange Membrane (PEM) Phosphoric Acid (PAFC) Molten Carbonate (MCFC) Solid Oxide (SOFC)
All are modular and serve as building blocks for a variety of power needs
Stationary (5 to hundreds of kW) Transportation (25 to 150 kW) Portable power (1 - 50 kW) Micro (watts)
3
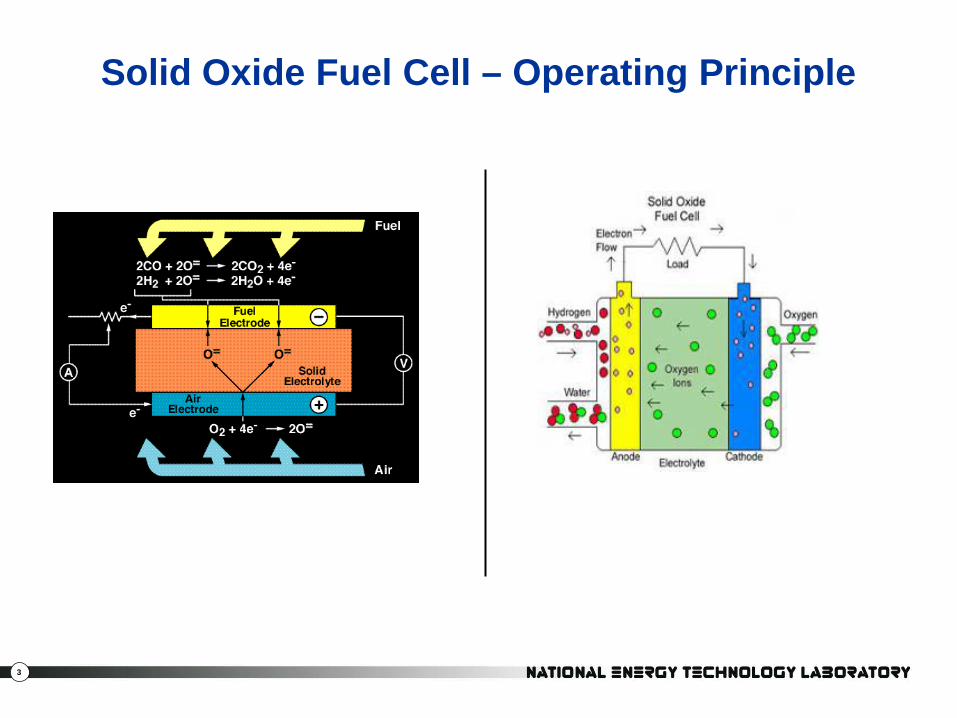
Solid Oxide Fuel Cell – Operating Principle
4
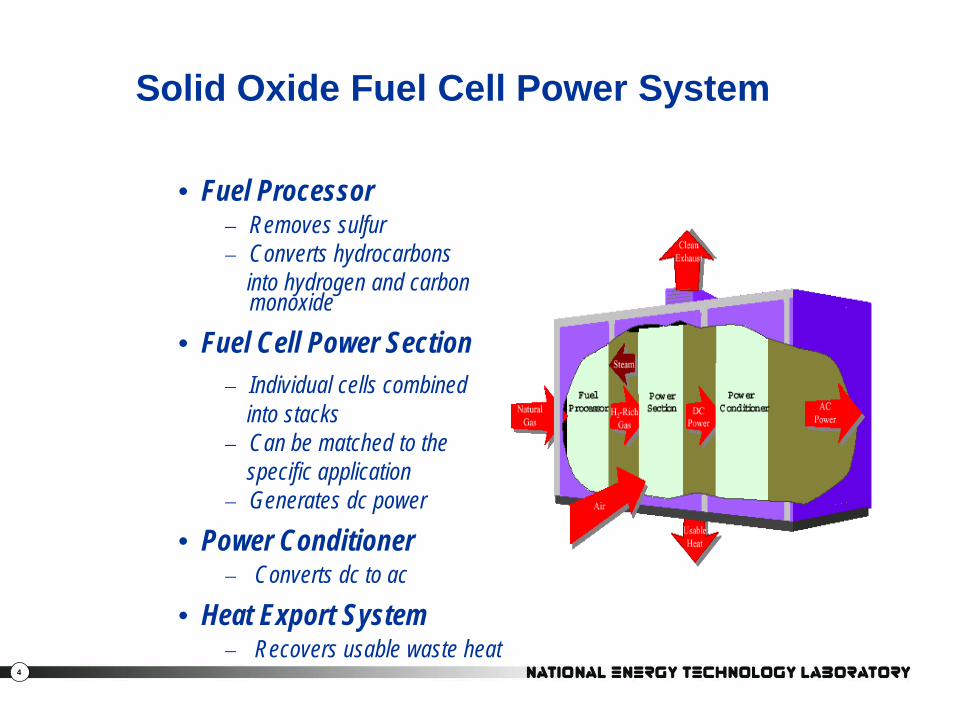
Solid Oxide Fuel Cell Power System
Fuel Processor− Removes sulfur− Converts hydrocarbons
into hydrogen and carbon monoxide
Fuel Cell Power Section− Individual cells combined
into stacks− Can be matched to the
specific application − Generates dc power
Power Conditioner− Converts dc to ac
Heat Export System− Recovers usable waste heat
5
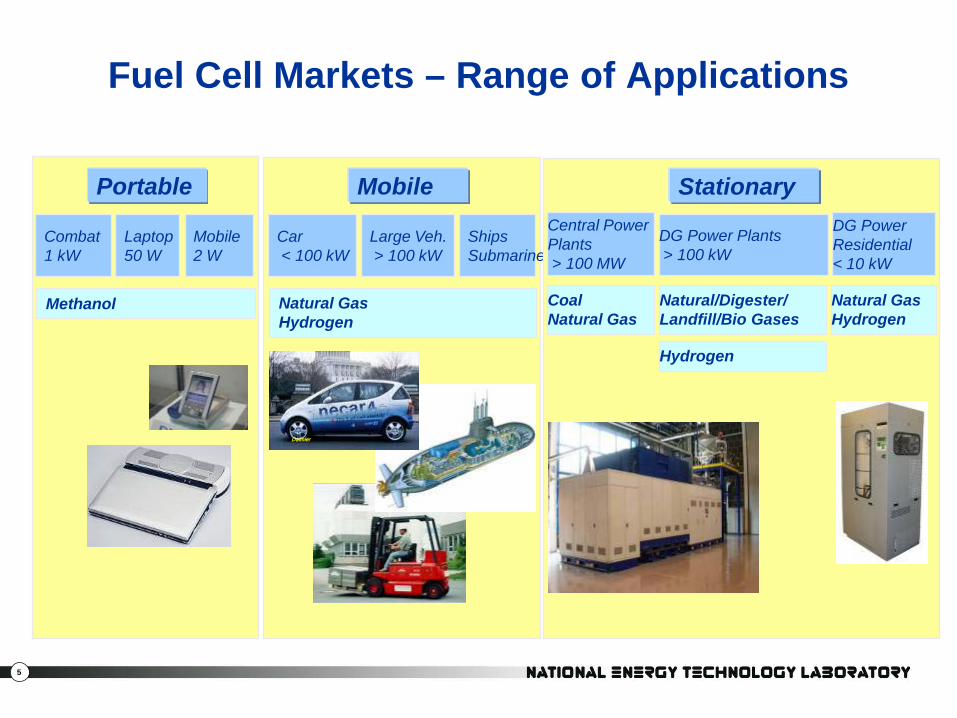
Fuel Cell Markets – Range of Applications
Portable
Combat1 kW
Laptop50 W
Mobile2 W
Methanol
ShipsSubmarine
Mobile
Car< 100 kW
Large Veh.> 100 kW
Natural GasHydrogen
Daimler
DG Power Plants> 100 kW
StationaryDG PowerResidential< 10 kW
CoalNatural Gas
Central PowerPlants> 100 MW
Natural GasHydrogen
Hydrogen
Natural/Digester/Landfill/Bio Gases
6
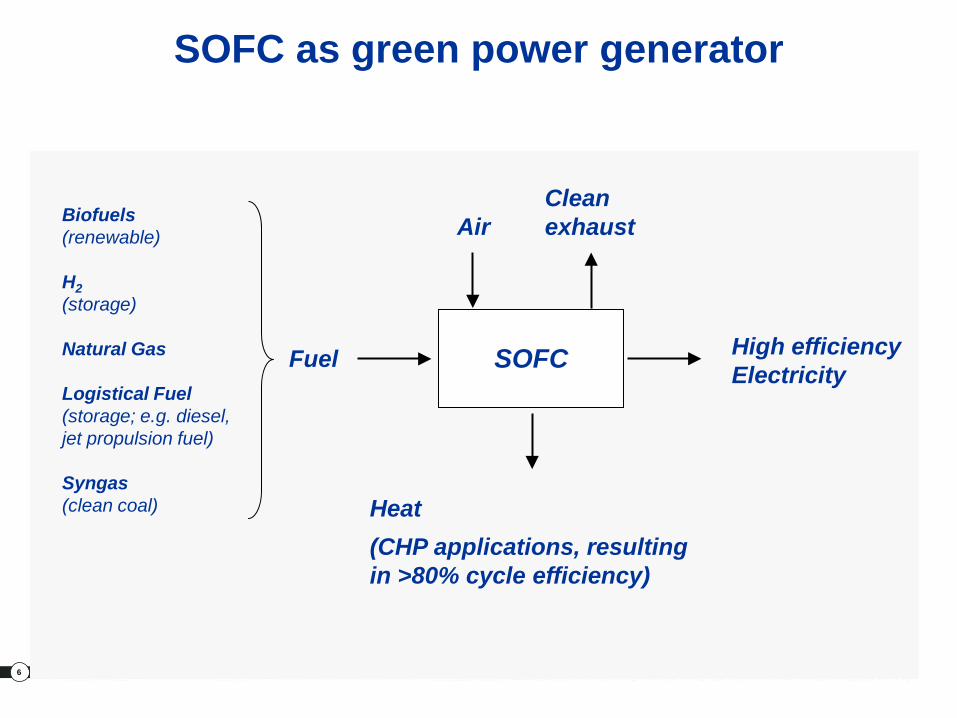
SOFC as green power generator
SOFC
AirCleanexhaust
High efficiencyElectricity
Heat(CHP applications, resulting in >80% cycle efficiency)
Fuel
Biofuels(renewable)
H2(storage)
Natural Gas
Logistical Fuel(storage; e.g. diesel, jet propulsion fuel)
Syngas(clean coal)
7
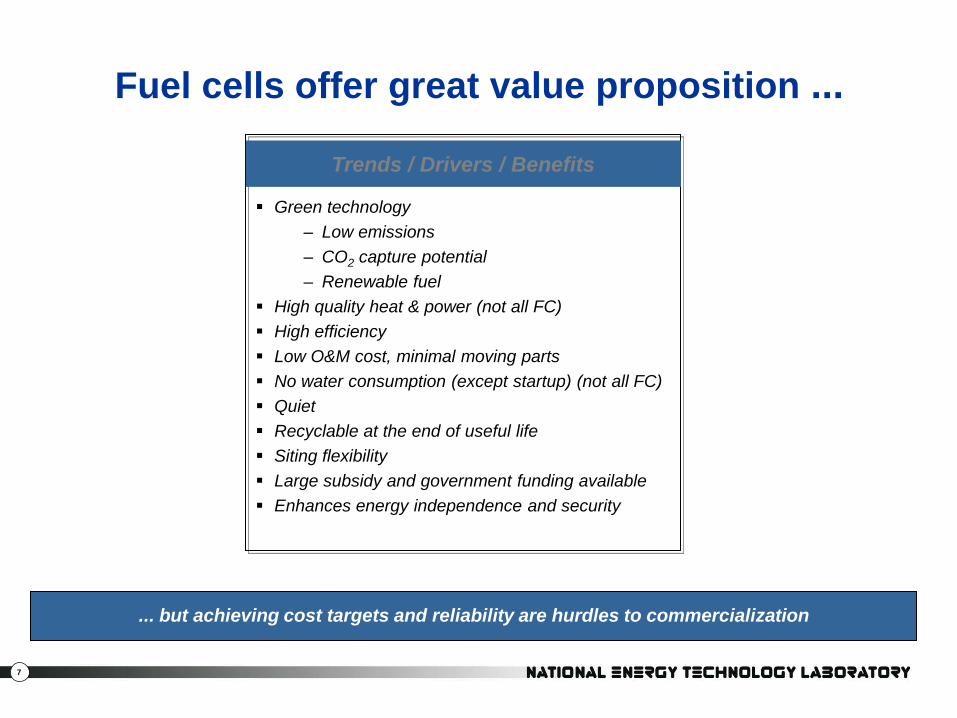
Fuel cells offer great value proposition ...
Green technology– Low emissions– CO2 capture potential– Renewable fuel
High quality heat & power (not all FC) High efficiency Low O&M cost, minimal moving parts No water consumption (except startup) (not all FC) Quiet Recyclable at the end of useful life Siting flexibility Large subsidy and government funding available Enhances energy independence and security
... but achieving cost targets and reliability are hurdles to commercialization
Trends / Drivers / Benefits

8
SECA Mission
• Enable the generation of efficient, cost-effectiveelectricity from domestic coal with near-zero atmosphericemissions of CO2 and air pollutants (99% CO2 capture)and minimal use of water in central power generationapplications.• Provide the technology base to permit grid-independentdistributed generation applications.
60% Efficiency
(Coal HHV)
Environmental:<0.5ppm NOx,low H2O use
Low Cost, similar footprint
to IGCC
Fuel-Flexible: Syngas, NG, H2, Diesel,
etc.
≥ 99% CO2Capture
Modular Technology
9
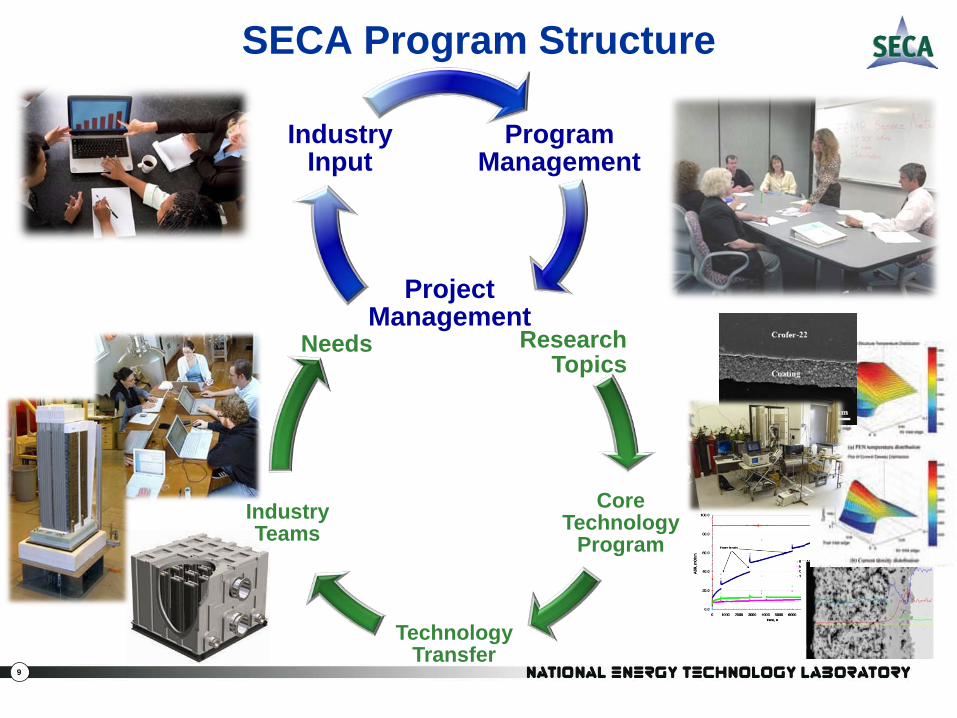
Research Topics
Core Technology
Program
Technology Transfer
Industry Teams
Needs
Program Management
Project Management
Industry Input
SECA Program Structure

10
Intellectual PropertyCornerstone of the Alliance
Exceptional Circumstance to Bayh-Dole Act
Industry Teams Develop Proprietary Technologies
VersaPowerSystems
SECA Core Technology R&D
Non-Exclusive Licenses
- Promotes collaboration- Limits research redundancy- Technology solution not “locked up”
11
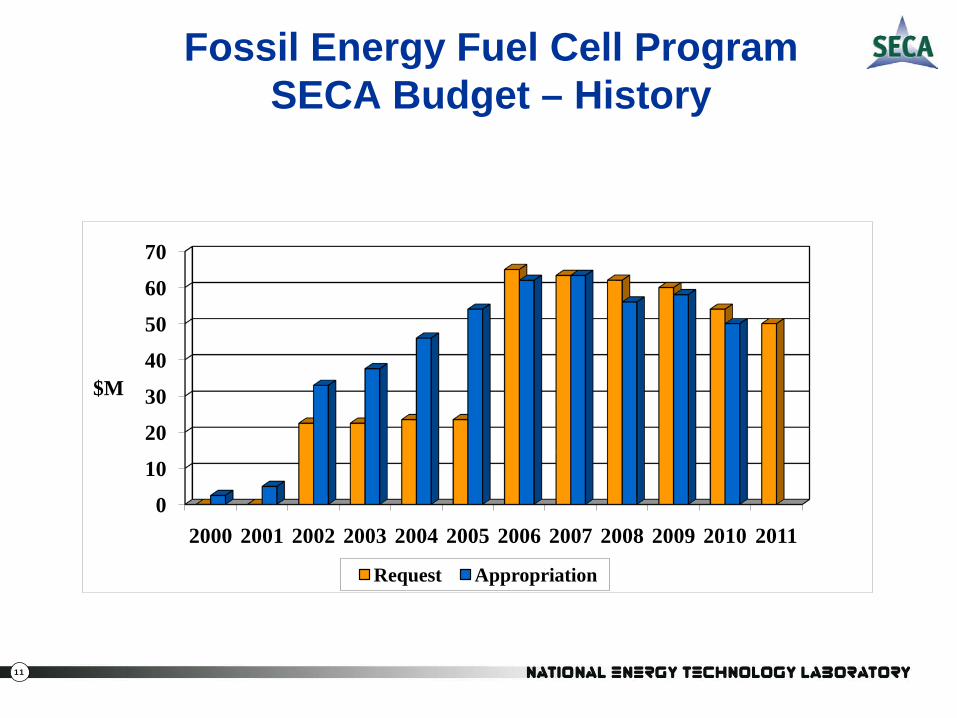
Fossil Energy Fuel Cell Program SECA Budget – History
0
10
20
30
40
50
60
70
2000 2001 2002 2003 2004 2005 2006 2007 2008 2009 2010 2011
Request Appropriation
$M
12
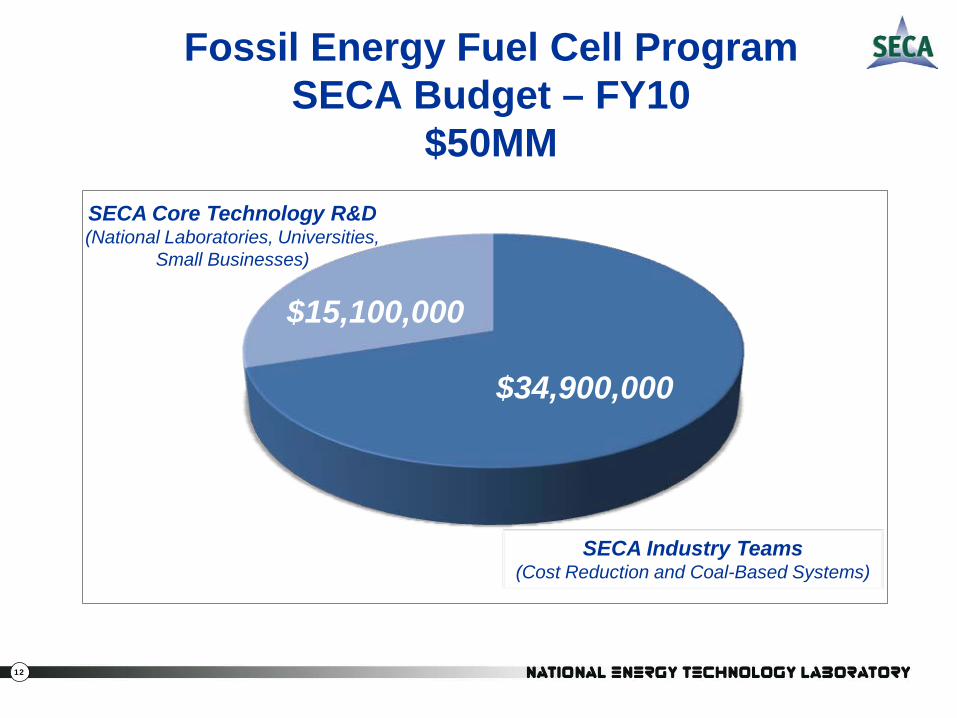
Fossil Energy Fuel Cell Program SECA Budget – FY10
$50MM
$34,900,000
$15,100,000
SECA Core Technology R&D(National Laboratories, Universities,
Small Businesses)
SECA Industry Teams(Cost Reduction and Coal-Based Systems)

13
Industry Teams & Major Subcontractors
VersaPowerSystems
00076A 10-22-08 WAS
Calgary

14
2010 SECA Core Technology & Other Partners
NEXTECH
MATERIALS
NEXTECH
MATERIALS
ANL
15
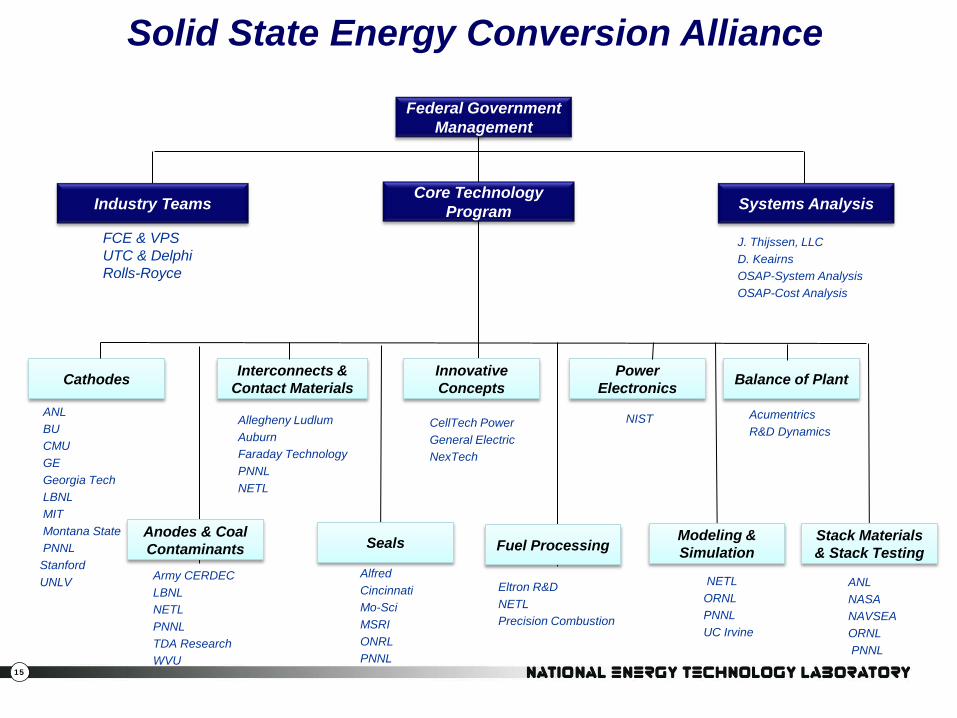
Solid State Energy Conversion Alliance
Industry Teams Systems Analysis
FCE & VPSUTC & DelphiRolls-Royce
Cathodes
Anodes & Coal Contaminants
Interconnects & Contact Materials
Seals
InnovativeConcepts
Fuel Processing
Power Electronics
Modeling & Simulation
Balance of Plant
ANLBUCMUGE Georgia TechLBNLMITMontana StatePNNLStanfordUNLV
Allegheny LudlumAuburn Faraday Technology PNNLNETL
Army CERDECLBNLNETLPNNLTDA ResearchWVU
AlfredCincinnatiMo-SciMSRIONRLPNNL
CellTech PowerGeneral ElectricNexTech
Eltron R&DNETLPrecision Combustion
NIST
NETLORNLPNNLUC Irvine
AcumentricsR&D Dynamics
Core Technology Program
Federal Government Management
J. Thijssen, LLCD. KeairnsOSAP-System AnalysisOSAP-Cost Analysis
Stack Materials & Stack Testing
ANLNASANAVSEAORNLPNNL

16
DOE’s Office of Fossil EnergyAdvanced (Coal) Power Systems Goals
• 2010: – 45-47% Efficiency (HHV)– 99% SO2 removal– NOx< 0.01 lb/MM Btu– 90% Hg removal
• 2015:– 90% CO2 capture– <10% increase in COE with
carbon sequestration– Multi-product capability (e.g, power + H2)– 60% efficiency (measured without carbon capture)
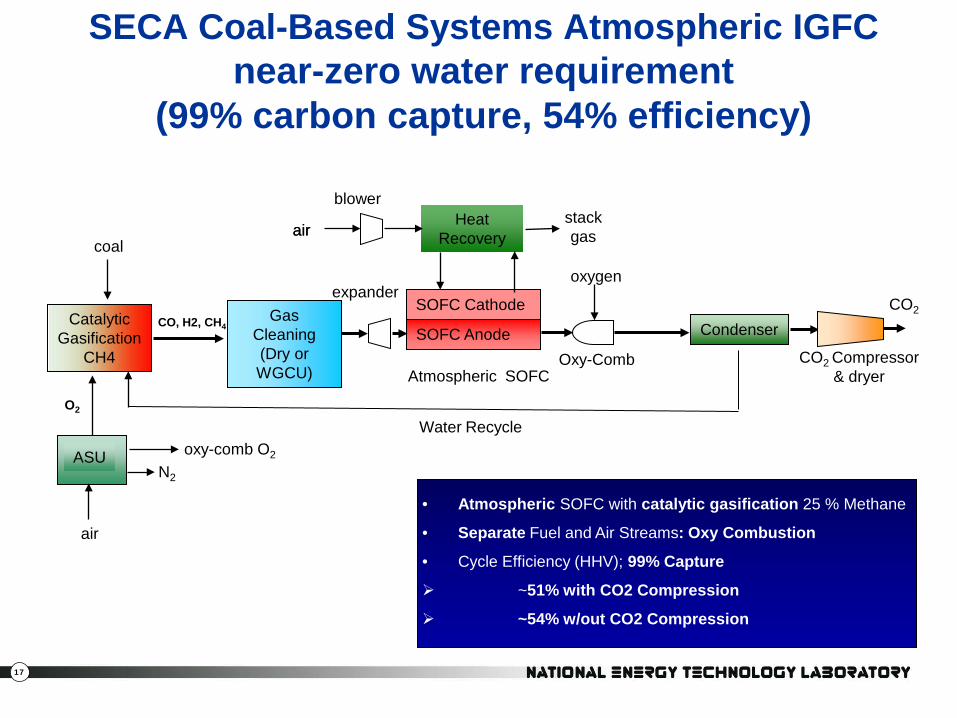
17
SOFC Anode
SOFC Cathode
air
Atmospheric SOFCOxy-Comb
HeatRecovery
oxygen
CO2
Condenser
CO2 Compressor& dryer
stackgas
Water Recycle
SECA Coal-Based Systems Atmospheric IGFC near-zero water requirement
(99% carbon capture, 54% efficiency)
blower
• Atmospheric SOFC with catalytic gasification 25 % Methane
• Separate Fuel and Air Streams: Oxy Combustion
• Cycle Efficiency (HHV); 99% Capture
~51% with CO2 Compression
~54% w/out CO2 Compression
air
ASU
GasCleaning(Dry or WGCU)
air
N2
coal
oxy-comb O2
Catalytic Gasification
CH4
O2
CO, H2, CH4
expander

18
ASU
GasCleaning(Dry or WGCU)
air
N2
coal
SOFC Anode
SOFC Cathode
air
Pressurized SOFCOxy-Comb
HeatRecovery
oxygen
CO2
Condenser
CO2 Compressor& dryer
oxy-comb O2
stackgas
expander
expanderCatalytic
GasificationCH4
Water Recycle
SECA Coal-Based Systems Pressurized IGFC near-zero water requirement
(99% carbon capture, 61% efficiency)
compressor
• Pressurized SOFC with catalytic gasification 25% Methane
• Separate Fuel and Air Streams: Oxy Combustion
• No steam cycle – minimal external water requirement
• Cycle Efficiency (HHV); 99% Capture
~57% with CO2 Compression
~61% w/out CO2 Compression
expander
O2
CO, H2, CH4

19
Impact of Efficiency on COEAdvanced Power Systems
With CO2 Capture, Compression and Storage
PC Baseline
IGCC Baseline
IGFCAtm
IGFC Pressure
EfficiencyHHV (%)
28.4 32.6 51.1 57.0
Capital Cost$/kW
3,570 3,330 2,150 2,100
Water Withdrawalgpm/MWnet
10.7 18.3 2.5 1.8
LevelizedCost-of-Electricity
¢/kW-hr15.0 15.1 10.8 10.3
Sources: Cost and Performance Baseline for Fossil Energy Plants, Volume 1, Revision 2 DRAFT, 2010 Anticipated ReleaseAnalysis of Integrated Gasification Fuel Cell Plant Configurations, DRAFT, 2010 Anticipated Release

20
IGFC – 53 Acres IGCC – 55 Acres
Representative Foot Print Comparison: IGFC & IGCC
• A similarly sized IGCC and IGFC will be comparable in real estate requirement.
Provided by:
21
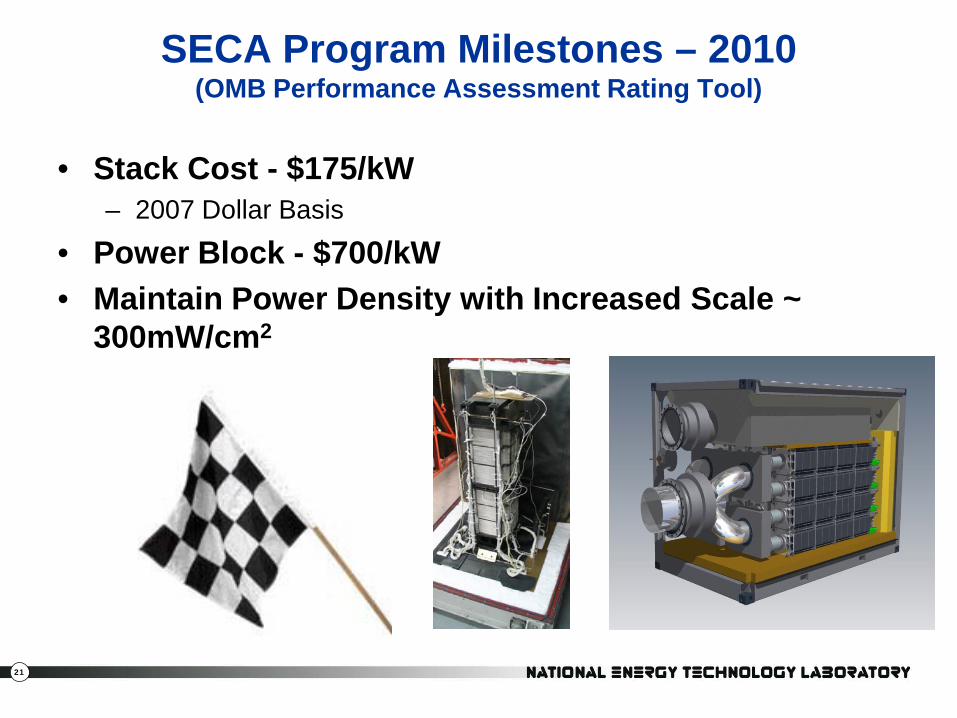
SECA Program Milestones – 2010(OMB Performance Assessment Rating Tool)
• Stack Cost - $175/kW– 2007 Dollar Basis
• Power Block - $700/kW• Maintain Power Density with Increased Scale ~
300mW/cm2
22
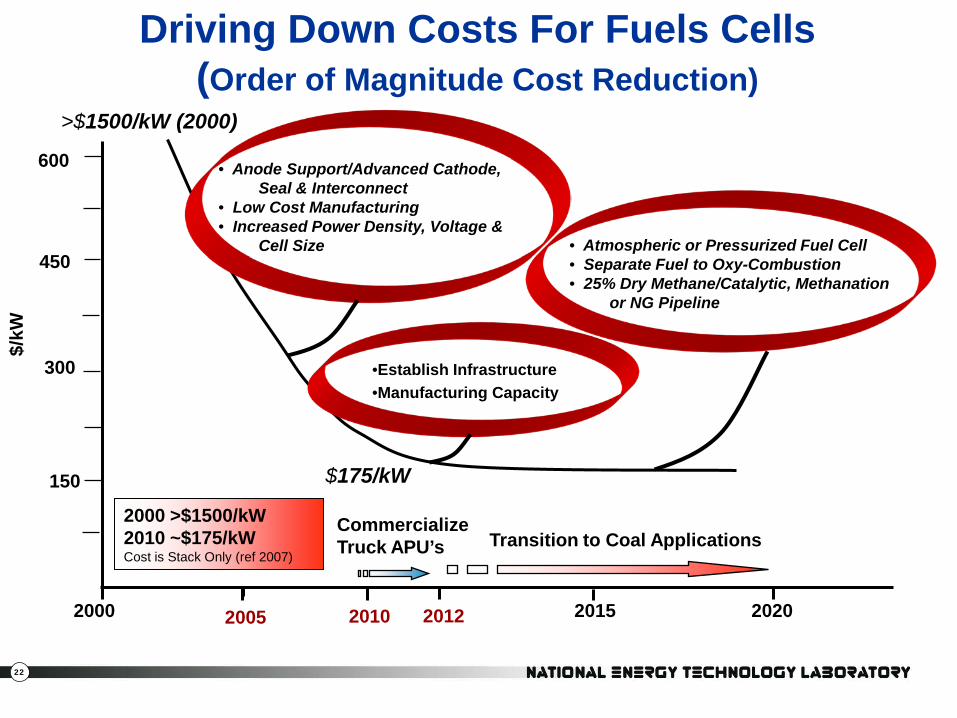
Driving Down Costs For Fuels Cells(Order of Magnitude Cost Reduction)
$175/kW
Commercialize Truck APU’s Transition to Coal Applications
2000 2015 2020
450
300
150
$/kW
2000 >$1500/kW2010 ~$175/kWCost is Stack Only (ref 2007)
>$1500/kW (2000)
20122005
600
2010
• Atmospheric or Pressurized Fuel Cell• Separate Fuel to Oxy-Combustion• 25% Dry Methane/Catalytic, Methanation
or NG Pipeline
• Anode Support/Advanced Cathode, Seal & Interconnect
• Low Cost Manufacturing• Increased Power Density, Voltage &
Cell Size
•Establish Infrastructure•Manufacturing Capacity
23
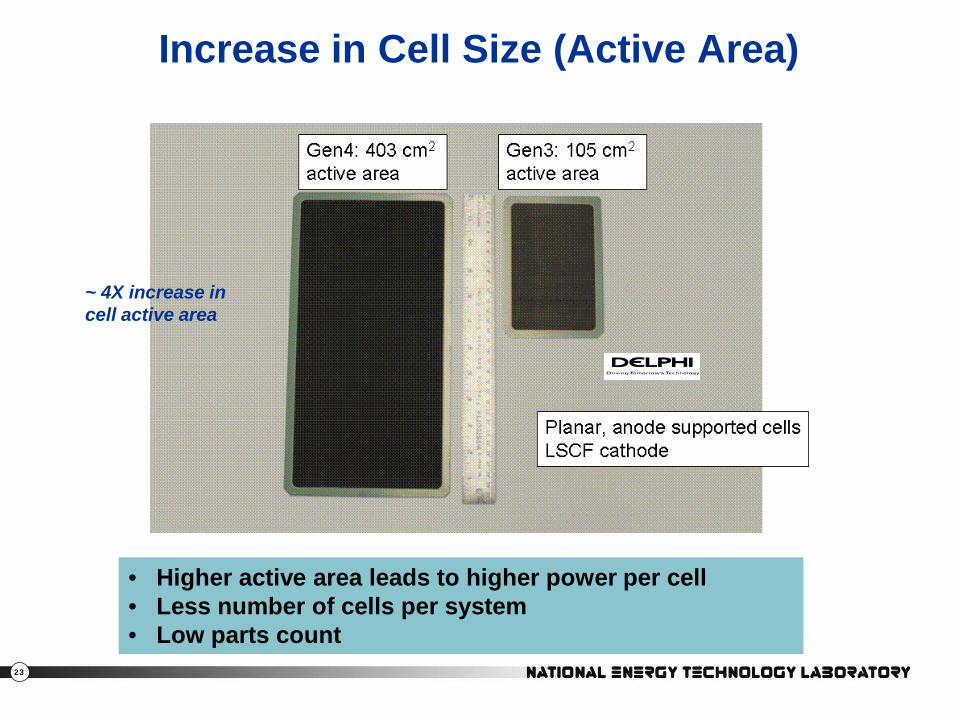
Increase in Cell Size (Active Area)
• Higher active area leads to higher power per cell • Less number of cells per system• Low parts count
~ 4X increase in cell active area
24
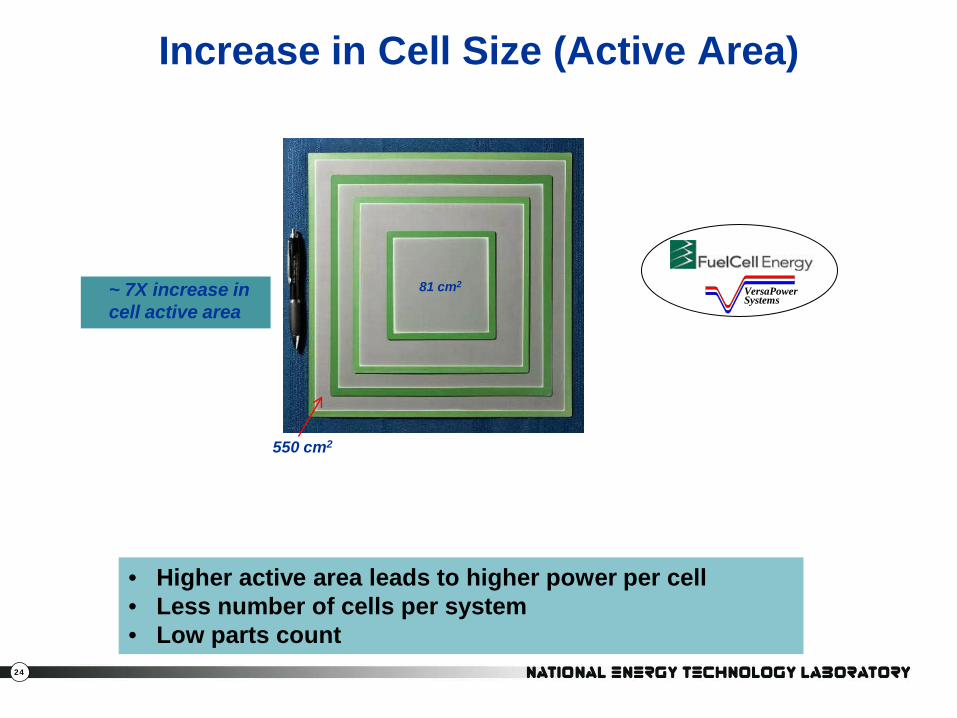
Increase in Cell Size (Active Area)
• Higher active area leads to higher power per cell • Less number of cells per system• Low parts count
81 cm2
550 cm2
VersaPowerSystems
~ 7X increase in cell active area

25
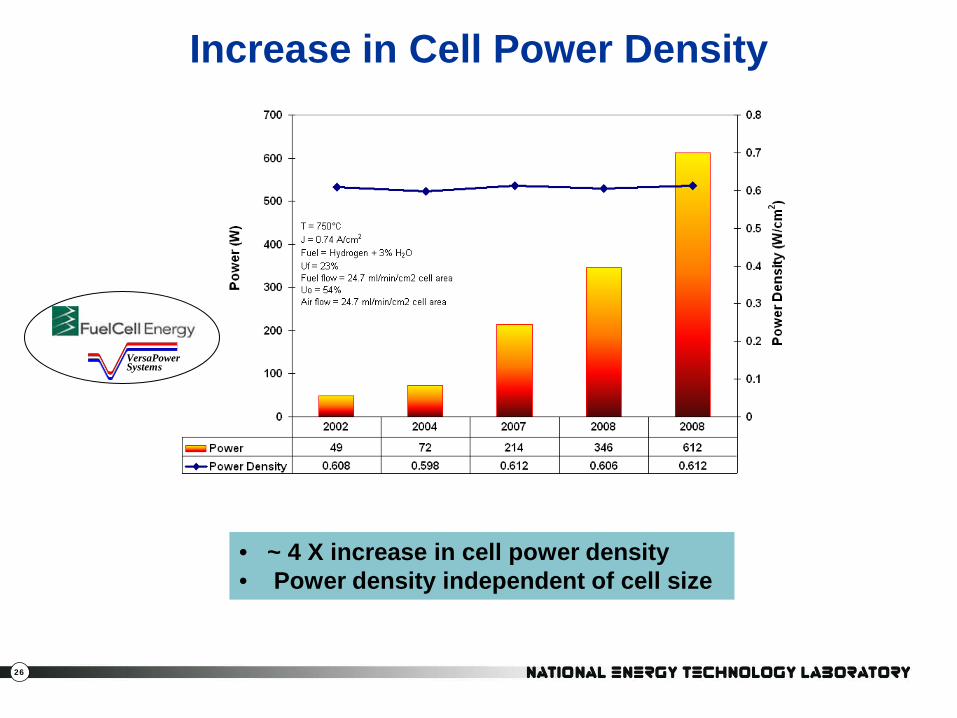
• ~ 4 X increase in cell power density• Power density independent of cell size
Increase in Cell Power Density
0
100
200
300
400
500
600
700
800
900
2002 2003 2004 2005 2006 2007 2008 2009 2010 2011 2012Year
Pow
er D
ensi
ty a
t 0.8
V/ce
ll (m
W/c
m2)
26
• ~ 4 X increase in cell power density• Power density independent of cell size
Increase in Cell Power Density
VersaPowerSystems
27
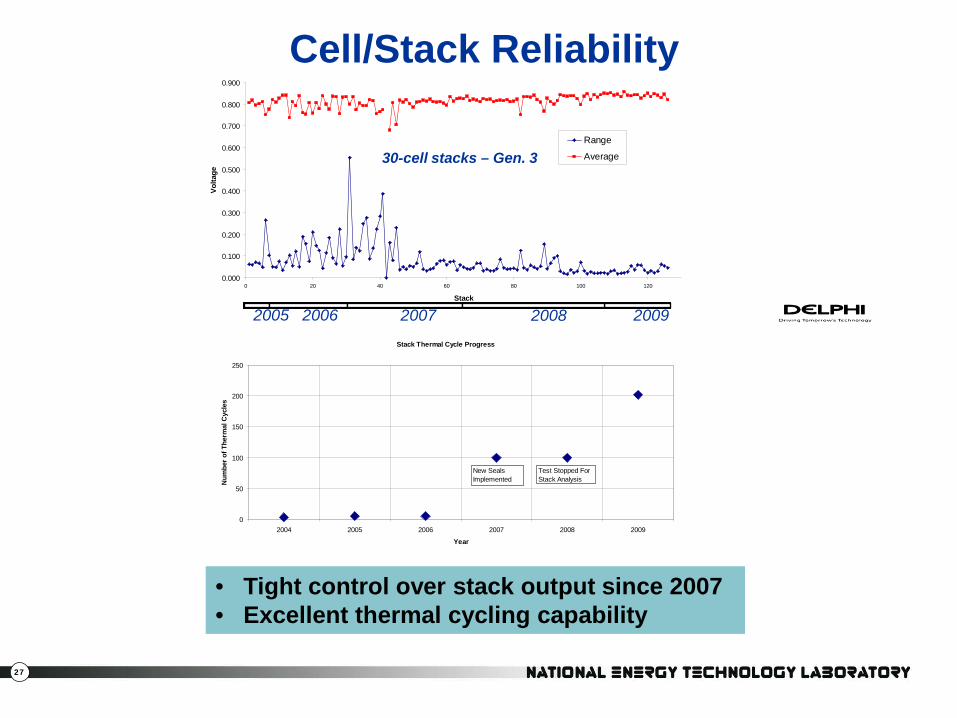
• Tight control over stack output since 2007 • Excellent thermal cycling capability
Cell/Stack Reliability
0.000
0.100
0.200
0.300
0.400
0.500
0.600
0.700
0.800
0.900
0 20 40 60 80 100 120
Stack
Volta
ge
Range
Average
2005 2006 2007 2008 2009
30-cell stacks – Gen. 3
Stack Thermal Cycle Progress
0
50
100
150
200
250
2004 2005 2006 2007 2008 2009
Year
Num
ber o
f The
rmal
Cyc
les
Test Stopped For Stack Analysis
New Seals Implemented
28
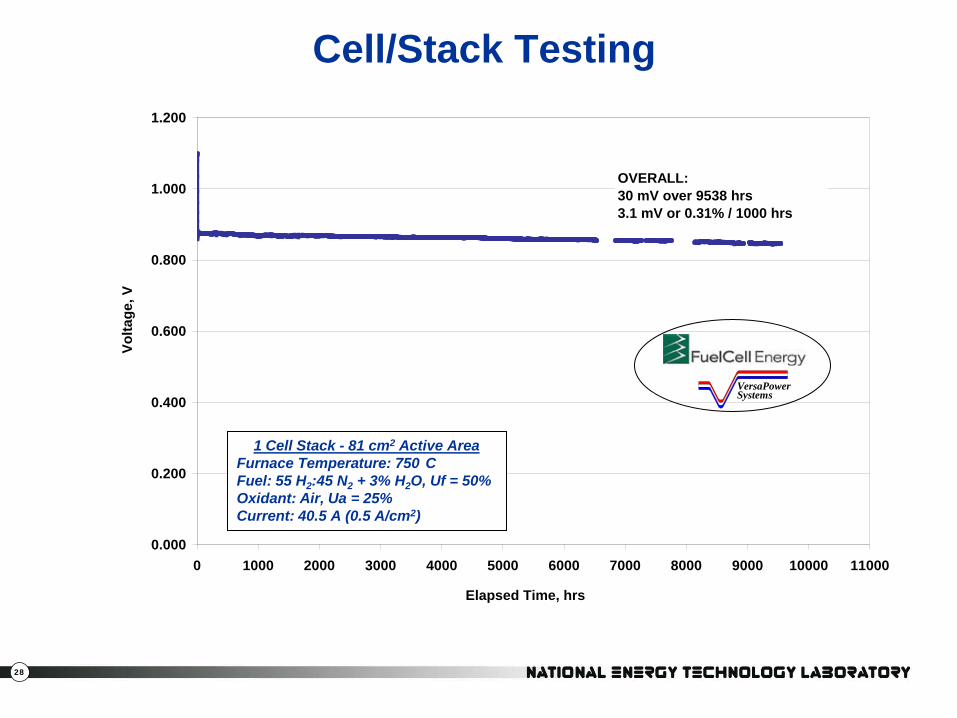
Cell/Stack Testing
0.000
0.200
0.400
0.600
0.800
1.000
1.200
0 1000 2000 3000 4000 5000 6000 7000 8000 9000 10000 11000
Elapsed Time, hrs
Volta
ge, V
OVERALL:30 mV over 9538 hrs3.1 mV or 0.31% / 1000 hrs
1 Cell Stack - 81 cm2 Active AreaFurnace Temperature: 750 CFuel: 55 H2:45 N2 + 3% H2O, Uf = 50%Oxidant: Air, Ua = 25%Current: 40.5 A (0.5 A/cm2)
VersaPowerSystems

29
Cell/Stack Testing
VersaPowerSystems
GT058027-0001120-Cell Stack
Cell Active Area: 550 cm2
0
0.2
0.4
0.6
0.8
1
1.2
0 250 500 750 1000 1250 1500 1750
Test Duration (hours)
Ave
rage
Cel
l Vol
tage
(V)
0
5
10
15
20
25
30
Stac
k Po
wer
(kW
)
Average Cell Voltage
Stack Power
Normal Operating Conditions (NOC)Furnace Temperature: 715 CFuel: 25.2% H2, 22.4% N2, 14.5% NG, 37.8% H2OIn-stack reforming = 70%, Uf = 68%Oxidant: Air, Ua = 15%Current: 200 A (0.364 A/cm2)
Stack conditioning
Peak power testing (24 h)
Test stand repair(full thermal cycle)
30
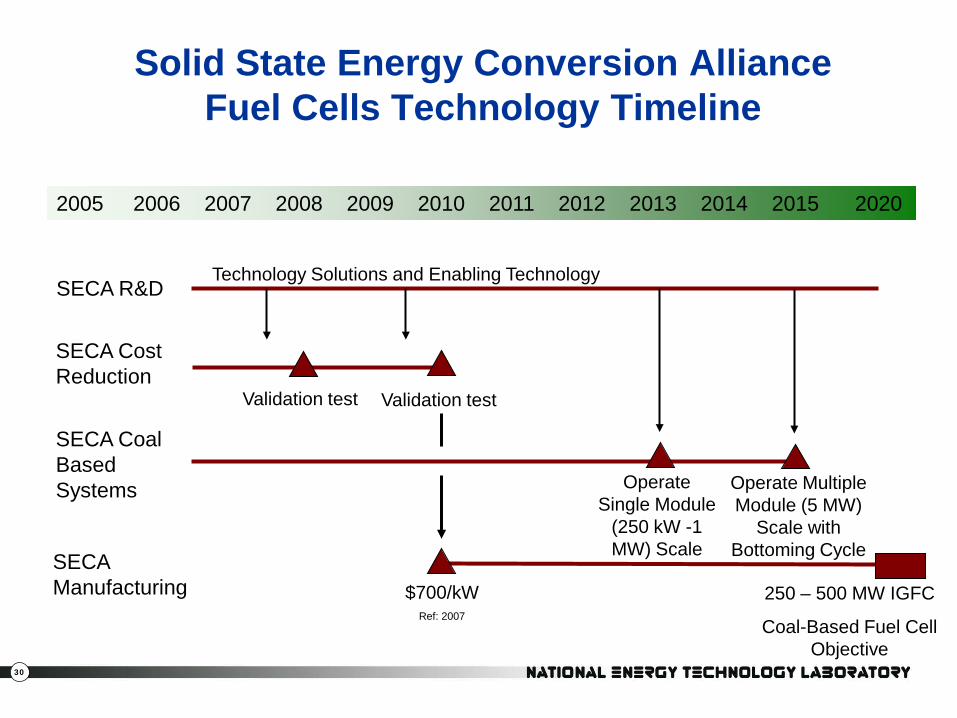
Solid State Energy Conversion Alliance Fuel Cells Technology Timeline
2005 2006 2007 2008 2009 2010 2011 2012 2013 2014 2015 2020
SECA R&D
SECA Cost Reduction
SECA Coal Based Systems
SECA Manufacturing
Validation test Validation test
Operate Single Module
(250 kW -1 MW) Scale
Operate Multiple Module (5 MW)
Scale with Bottoming Cycle
$700/kWRef: 2007
250 – 500 MW IGFC
Coal-Based Fuel Cell Objective
Technology Solutions and Enabling Technology

31
SECA Fuel FlexibilitySOFC Systems can produce power from many fuels
Coal Natural Gas
Gasification Anaerobic Digestion Reforming
Fuel Gas (mainly CH4, CO, H2)
Electric Power60% Electrical Efficiency
SOFC
Biomass / Waste
32
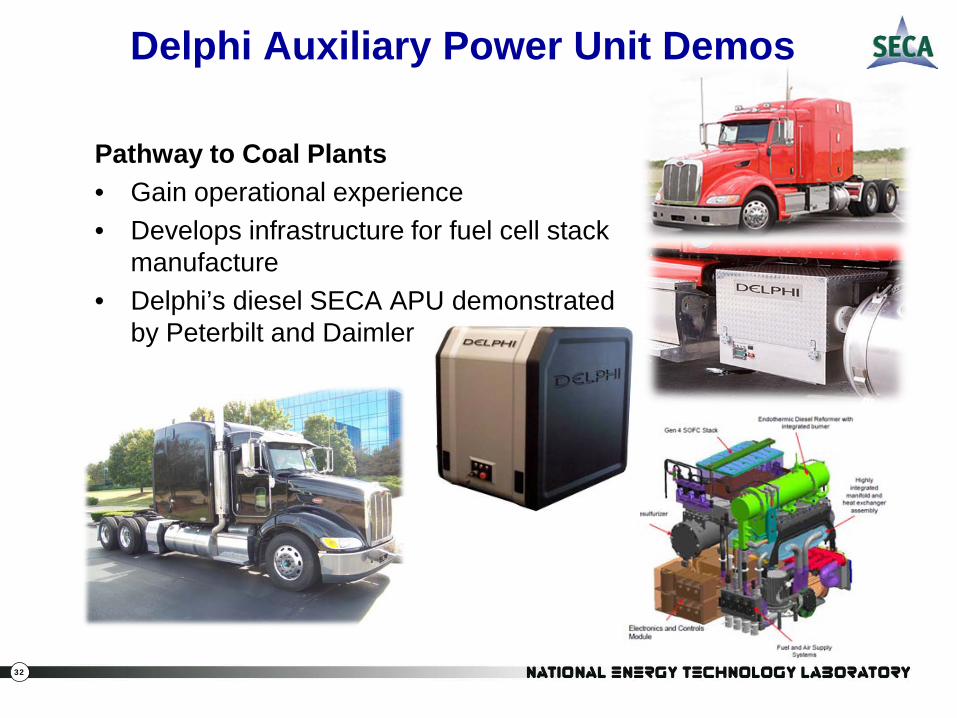
Delphi Auxiliary Power Unit Demos
Pathway to Coal Plants• Gain operational experience• Develops infrastructure for fuel cell stack
manufacture• Delphi’s diesel SECA APU demonstrated
by Peterbilt and Daimler

33
SOFCs in Unmanned Undersea Vehicles (UUVs)
• Naval Undersea Warfare Center, Division Newport, (NUWCDIVNPT) successfully tested SECA SOFCs in extreme conditions. Used SECA Stacks (2 Developers) and SECA developed High Temperature Blower.
• SOFC technology has the potential to greatly increase UUV mission time compared with current battery technology.
• Although SECA has a coal-based, central generation focus, spin-off applications are encouraged. Military applications like UUVs provide operating experience and independent validation for SECA.
• Cost and operational lifetime are not necessarily major concerns for military applications, as long as new mission capability can be delivered.
21UUV (2-5 kW) Fisher-Tropsch & Logistics Fuels SECA Stacks and Blower
34
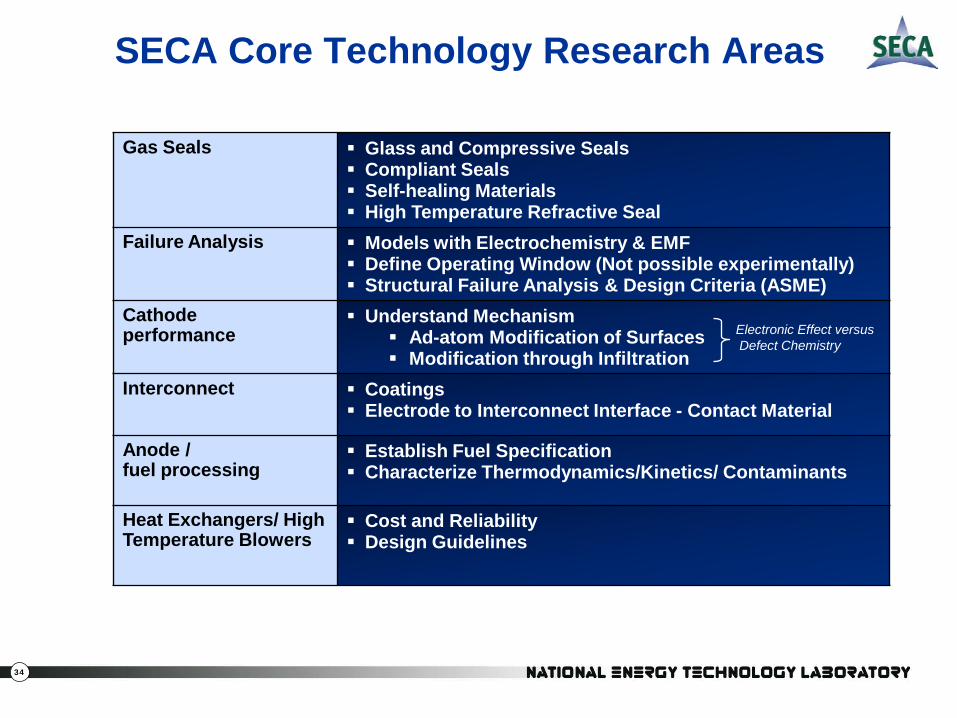
SECA Core Technology Research Areas
Gas Seals Glass and Compressive Seals Compliant Seals Self-healing Materials High Temperature Refractive Seal
Failure Analysis Models with Electrochemistry & EMF Define Operating Window (Not possible experimentally) Structural Failure Analysis & Design Criteria (ASME)
Cathodeperformance
Understand Mechanism Ad-atom Modification of Surfaces Modification through Infiltration
Interconnect Coatings Electrode to Interconnect Interface - Contact Material
Anode /fuel processing
Establish Fuel Specification Characterize Thermodynamics/Kinetics/ Contaminants
Heat Exchangers/ High Temperature Blowers
Cost and Reliability Design Guidelines
Electronic Effect versusDefect Chemistry

35
Websites:www.netl.doe.govwww.fe.doe.govwww.grants.gov
Dr. Shailesh D. VoraTechnology Manager, Fuel CellsNational Energy Technology LaboratoryU. S. Department of Energy(Tel) 412-386-7515(Fax) [email protected]
CDs available from the website•11th Annual SECA Workshop
Proceedings•Fuel Cell Handbook (7th ed.)
For More Information on SECA…