uber might buy me a mercedes benz: an empirical ... · uber might buy me a mercedes benz: an...
TRANSCRIPT
0
Uber Might Buy Me a Mercedes Benz: An Empirical Investigation of the
Sharing Economy and Durable Goods Purchase
Jing Gong Brad N Greenwood
Temple University
Yiping Song Fudan University
Abstract In this work, we examine how the introduction of sharing-economy platforms (e.g., Uber, Lift, and Airbnb) affects durable goods purchase. On the one hand, the introduction of such platforms may cannibalize durable goods sales, as they may change the decision making calculus of consumers by offering a lower cost “rental” option in lieu of purchase. On the other hand, such platforms may stimulate purchase, as the presence of these platforms may enhance the value of ownership (because participants may seek to capture the rents associated with participating in the sharing economy). In this study, we resolve this tension using a unique dataset of new vehicle registrations in China. In particular, we exploit a natural experiment, the variation in timing of Uber entry across different locations, to estimate the effect on vehicle purchase. Findings suggest that Uber entry is associated with a considerable increase (8%) in new vehicle ownership, suggesting that consumers are actively changing their stock of held resources in order to capture excess rents offered by these platforms. Further, results indicate that the effect of Uber entry varies considerably across gender, age, and vehicle types. Keywords: Sharing economy, platform, ridesharing, car sales, durable goods purchase, difference in difference
1
1. Introduction Although the rise of the sharing economy has dramatically changed the way consumers and producers of
services interact, researchers are scrambling to determine how these platform-enabled businesses (e.g., Uber,
Lift, and Airbnb), are affecting behavior at the macro (societal), mezzo (firm), and micro (individual) levels. A
host of recent research attests to such changes, including increased access to goods (Einav et al. 2016),
strategic changes in the behavior of incumbent firms (Seamans and Zhu 2013, Wallsten 2015, Zervas et al.
2017), increased efficiency and asset utilization (Cramer and Krueger 2016), improved public safety
(Greenwood and Wattal 2017, Park et al. 2016), and changing access to job opportunities (Burtch et al. 2017).
Yet, within this expanding corpus of work, scholars have predominantly focused on the demand side of the
economy, i.e. those who leverage or utilize such services, instead of the supply side, i.e., those who provide
such services (with the notable exceptions of Burtch et al. (2017), Hall and Krueger (2016), and Edelman et
al. (2017)). And scholars have hitherto not considered how consumers may be updating their behavior to
capture the rents offered by this economy (even within these exceptions), which is projected to grow to
$335B by 2025.1 While these platforms often label themselves as intermediaries for individuals to share
existing or at rest resources, opponents argue that individuals who participate on such platforms may be
making capital investments to capture rents as professional workers (thereby circumventing regulations that
govern traditional businesses (Malhotra and Van Alstyne 2014)). In this study, we investigate such possibilities
by asking: how does the introduction of ridesharing platforms affect new vehicle ownership?
Interestingly, the a priori relationship between the presence of sharing platforms and durable goods
purchase is far from clear. Unlike traditional markets for durable goods, a key feature of sharing platforms is
that both the demand side and supply side are consumers of the durable good (e.g. a home in the case of
Airbnb or an automobile in the case of Uber), meaning that both may be actively changing their stocks of the
good to capture the benefits of the platform. In the case of the demand side, consumers who utilize these
platforms may jettison ownership as alternative ways to consume the product, i.e. “rental” or “temporary
ownership,” become available. In the case of the supply side, this means that suppliers of the good may have
1 http://www.pwc.co.uk/issues/megatrends/collisions/sharingeconomy/the-sharing-economy-sizing-the-revenue-opportunity.html
2
an incentive to acquire more of the product in order to capture the excess rents.
The implication of this unique consumption behavior forms the basis for our question. On the one
hand, the presence of sharing platforms may lead to a cannibalization effect on product sales (Jiang and Tian
2016). If ridesharing platforms provide efficient and low-cost transportation options (Cramer and Krueger
2016, Greenwood and Wattal 2017), and freedom from the financial, social, and emotional burdens of
ownership (Eckhardt and Bardhi 2015, Schaefers et al. 2016), these platforms may reduce a consumers’
propensity to own a car (Abhishek et al. 2016, Fraiberger and Sundararajan 2015, Horton and Zeckhauser
2016, Jiang and Tian 2016); the reason being that the individual no longer needs to subsidize the entire cost
of vehicle ownership when cheaper transportation options are available. Indeed, the popular press has
identified several such cases of people opting out of vehicle ownership as a result of ridesharing availability
(Manjoo 2014). On the other hand, the presence of sharing platforms may lead to a value enhancement effect on
ownership (Abhishek et al. 2016, Jiang and Tian 2016). As such platforms imbue owners the possibility of
sharing excess capacity with others to earn additional income (Burtch et al. 2017), as well as access flexible
working schedules (Hall and Krueger 2016), consumers may adjust their valuation of the ownership, and
make additional durable goods purchases while defraying the cost through the platform (Abhishek et al. 2016,
Fraiberger and Sundararajan 2015, Horton and Zeckhauser 2016, Jiang and Tian 2016).
To resolve this tension, we exploit a natural experiment, the variation in the timing of Uber’s entry
into different cities in China between 2010 and 2015.2 We estimate the effect of Uber entry on vehicle
purchases using a unique dataset on new car registrations. Importantly, because the platform entered different
cities at different times, i.e. implementation is both geographically and temporally dispersed, we are able to
leverage a difference-in-difference estimation technique, as well as an extensive set of robustness and
falsification checks (Autor 2003, Burtch et al. 2017, Greenwood and Wattal 2017), including alternative model
specifications, the inclusion of additional controls, and a variety of placebo tests.
Results indicate several notable findings. First, estimates suggest that Uber entry is strongly correlated
2 Uber was introduced in China in August 2013 and started to offer peer-to-peer ridesharing service, e.g., People’s Uber, in August 2014.
3
with an increase in new car ownership, indicating that the prospect of value enhancement (i.e., flexible work
schedule or earning additional income) through sharing excess capacity dominates any cannibalization. The
magnitude of the estimated effect is also pronounced. Results indicate that the entry of Uber’s ridesharing
service into cities in China, on average, yields an 8% increase in new car ownership. These results are robust
to a host of alternative specifications (e.g., additional control variables) and estimators (e.g., OLS and pseudo
Poisson maximum likelihood), with no pre-entry trend detected (indicating that the parallel trend assumption
required for the difference-in-difference model is not violated (Angrist and Pischke 2008)).
To better identify the underlying mechanism of the effect, we extend these analyses by considering
conditions under which the effect of platform entry may vary. Specifically, we decompose the effect by
vehicle type, gender, and age. Results consistently indicate that platform entry leads to a significant increase in
new vehicle purchases, but the effect varies across vehicle types and buyers. First, results indicate a stronger
effect of platform entry on smaller cars than larger cars. This corroborates value enhancement as the key
mechanism, suggesting that the presence of sharing platforms incentivizes individuals to make investment in
vehicles that are more likely to be utilized by suppliers on these platforms, viz. vehicles that are lighter and
have smaller engines (and hence superior fuel economy). Second, we examine the heterogeneous effect by
gender, finding that women are less affected than men. This corroborates recent surveys which suggest that
female drivers are disproportionally less likely to become Uber drivers (Hall and Krueger 2016). However,
women are still (positively) affected in a non-trivial manner, underscoring recent claims that the gig-economy
helps to ameliorate traditional gender biases (Galluzzo 2016, Wright 2017). Third, we find a differential
impact of platform entry on different age groups, with middle-aged adults being less affected than buyers in
other age groups. Theoretically, given that younger and older people have higher income volatility (Clark and
Summers 1981, Gundersen and Ziliak 2008, Jaimovich and Siu 2009, Ríos-Rull 1996), this supports the
notion that such platforms are incentivizing labor market participation on the part of traditionally
marginalized groups.
Several contributions stem from this work. First, we contribute to the emerging stream of literature
on sharing economy by empirically examining whether and how the introduction of sharing platforms affects
4
durable goods purchase. While researchers have begun to broach this subject analytically (Abhishek et al.
2016, Jiang and Tian 2016), this work is the first to provide empirical evidence of an impact of sharing
platforms on ownership in the context of ridesharing platforms. Our findings also underscore a key feature of
the sharing platforms. That is, as both the demand side and supply side consist of consumers of the durable
goods, the introduction of sharing platforms may affect the consumers on both sides. While the consumers
on the demand side may utilize these platforms as an alternative way to consume the product temporarily
without owning one, this work concludes that the consumers on the supply side are actively changing their
stock of the product to take advantage of the opportunity to capture excess rents offered by these platforms.
In this same vein, our work extends extant research on the societal impacts of the sharing economy (Burtch
et al. 2017, Cohen et al. 2016, Greenwood and Wattal 2017, Li et al. 2016, Park et al. 2016). Contrary to
claims made by platforms managers that individuals working on such platforms are simply exploiting existing
assets, our findings suggest that a considerable group of suppliers make active capital investments.
Second, this study provides implications for manufacturers. Despite consistent claims in the popular
press that platforms may cannibalize sales (Newberg 2015), our results suggest that such concerns are
unfounded. Though the introduction of these sharing platforms may reduce a consumers’ propensity to own
a car (Abhishek et al. 2016, Fraiberger and Sundararajan 2015, Horton and Zeckhauser 2016, Jiang and Tian
2016) as cheaper transportation options are available, our empirical examination suggests that vehicle
purchases do rise. In particular, results provide evidence that manufacturers may benefit from the emergence
of the sharing economy, as sharing platforms provide a venue to enhance the value of product ownership,
which in turn increase product sales. This is notably true for manufacturers whose products are more likely to
be utilized by platform participants, such as smaller vehicles with superior fuel economy. Thus, for
manufacturers, there are significant incentives to support the entry of sharing platforms, and to target
consumers who are more likely to participate in the supply side of sharing economy.
Finally, notable policy implications extend from this study. With respect to the current policy debate
on the legality of sharing platforms (Malhotra and Van Alstyne 2014), our finding suggests that the sharing
economy may create positive externality to local markets in the form of durable goods purchase. Coupled
5
with evidence of other benefits of the sharing economy, e.g. higher efficiency and productivity (Cramer and
Krueger 2016), improved public safety (Greenwood and Wattal 2017, Park et al. 2016), improved traffic
condition (Li et al. 2016), and higher consumer surplus (Cohen et al. 2016), the externality is non-trivial. It is
worth noting, however, that our findings undercut the claims made by platforms that individuals working on
them are simply exploiting already existing resources. It is clear that some platform workers are making
capital investments to exploit these platforms (in the form of accelerated vehicle purchase), suggesting some
form of nascent professionalism on the part of platform workers who are actively changing their stock of
resources in order to capture excess rents offered by these platforms. In other words, consumers are making
purchases in order to participate in the sharing economy instead of simply sharing existing, spare resources.
This buoys recent claims made by critics of ridesharing services, who allege that platform participants are
engaging in regulatory arbitrage to bypass the bureaucratic red tape surrounding transportation services
(Baker 2014, Malhotra and Van Alstyne 2014).
2. Related Literature 2.1 Sharing Economy The sharing economy has received considerable attention from researchers since its emergence (Abhishek et
al. 2016, Edelman et al. 2017, Horton and Zeckhauser 2016, Malhotra and Van Alstyne 2014, Sundararajan
2013, Sundararajan 2014, Zervas et al. 2017). And, as a number of technology-enabled sharing platforms (e.g.,
Uber, Lyft, TaskRabbit, Airbnb) have proliferated, so has interest in these platforms that facilitate access-
based utilization of durable goods (Sundararajan 2013). Broadly speaking, prior literature on the sharing
economy can, generally, be grouped into three distinct but related streams: platform design (Einav et al. 2016,
Fradkin 2015, Fradkin et al. 2015, Zervas et al. 2015), the impacts on incumbent industries (Abhishek et al.
2016, Benjaafar et al. 2015, Seamans and Zhu 2013, Wallsten 2015, Zervas et al. 2017), and the societal
impacts of these platforms (Burtch et al. 2017, Cheng et al. 2016, Edelman et al. 2017, Ge et al. 2016,
Greenwood and Wattal 2017, Horton and Zeckhauser 2016, Li et al. 2016, Park et al. 2016, Rhue and Clark
2016). We describe each of these briefly below.
Focus within the body of literature that has examined the design of sharing platforms, to date, has
primarily been on the means by which the utility derived by customers might be increased (Einav et al. 2016,
6
Fradkin et al. 2015, Zervas et al. 2015). Einav et al. (2016), for example, discuss various aspects of platform
design, including algorithm design to facilitate search and matching between buyers and sellers, pricing
mechanisms, and design of reputation systems to gauge trust. Other studies have examined more specific
aspects of platform design. For example, Fradkin (2015) finds that the current ranking algorithm utilized by
Airbnb results in substantial search frictions for Airbnb users, and proposes several alternative algorithms to
reduce such frictions. Edelman et al. (2017) and Cui et al. (2016) find that the current matching mechanism of
Airbnb results in racial discrimination (a finding echoed by Rhue and Clark (2016) in the context of
Kickstarter). Zervas et al. (2015) document that in the case of Airbnb, nearly 95% of the properties listed on
Airbnb have an average rating of 4.5 stars or higher. Fradkin et al. (2017) also use the context of Airbnb to
study how the design of reputation systems affects the ability to solicit unbiased ratings and reviews, and
potential ways to reduce review bias. A small number of studies analyze Uber’s platform design and find that
the surge pricing mechanism utilized by Uber significantly increased labor supply (Chen and Sheldon 2015)
and generated substantial consumer surplus (Cohen et al. 2016).
When considering the impact that digital platforms have on incumbent industries and their business
models, results are equally rich. Within this stream of literature, two broad questions have been examined.
First, how does the emergence of platforms influence market dynamics (Abhishek et al. 2016, Horton and
Zeckhauser 2016)? Second, are there direct implications for competitors (Seamans and Zhu 2013, Wallsten
2015, Zervas et al. 2017)? Zervas et al. (2017), for example, investigate the effect of Airbnb on the hotel
industry, and find that an increase in the supply of Airbnb listings is associated with a significant decrease in
hotel revenue. Alternatively, Wallsten (2015) studies the effect of Uber entry on the taxi industry, and finds
that an increase in the popularity of Uber is associated with a decline in the number of complaints about taxi
services. In each case, results underscore the potential disruptive capability of sharing economy platforms.
Interestingly, however, findings continually highlight the fact that it is lower quality vendors that are displaced
by the entrance of these platforms, indicating a significant price sensitivity on the part of participants in these
marketplaces (Greenwood and Wattal 2017, Zervas et al. 2017).
The third stream, which is most closely related to this research, examines societal impacts of the
7
sharing economy. Strikingly, despite significant concerns about the negative impacts of the sharing economy
expressed by both academics (Horton 2015, Malhotra and Van Alstyne 2014) and the popular press (Baker
2014), recent research has expressed a more balanced view of the sharing economy, with numerous benefits
and drawbacks emerging. For example, Greenwood and Wattal (2017) find that Uber entry is associated with
a significant decline in drunk driving related fatality rate in California (a finding echoed by others at the
national level (Martin-Buck 2017)). Further, scholars have highlighted the ability of platforms to ease traffic
congestion (Li et al. 2016), minimize sexual assault (Dills and Mulholland 2016, Park et al. 2016), and generate
non-trivial levels of consumer welfare in a dramatically more efficient fashion (Cohen et al. 2016, Cramer and
Krueger 2016). Alarmingly, negative repercussions have also been observed, such as those in the form of
gender and racial discrimination (Cui et al. 2016, Edelman et al. 2017, Ge et al. 2016, Rhue and Clark 2016).
And, while research has yet to address whether or not such prejudices are stronger or weaker than the ones
observed in the traditional economy, their presence is nonetheless troubling.
Interestingly, while this wide stream of research considering both consumption behavior and
competitive dynamics has extensively documented the effects wrought on the demand side of the sharing
economy, i.e. users of such services, research considering the supply side is considerably more sparse (with
notable exceptions (Burtch et al. 2017, Chen and Sheldon 2015, Hall and Krueger 2016)). And within the
body of work that does examine the supply side of the economy, focus has primarily been on the
characteristics of likely participants (Hall and Krueger 2016), or how temporal micro-dynamics influence the
marginal decision to participate more or participate less (Chen and Sheldon 2015), rather than what steps a
decision maker might take in order to gain access to the sharing economy. This is particularly problematic,
because, as discussed previously, it is not clear whether the suppliers are purely utilizing existing owners of
durable goods in order to participate in those platforms, or making new investments in durable goods to
exploit these platforms as professional workers (Malhotra and Van Alstyne 2014).
2.2 Sharing Platforms and Durable Goods Purchase We examine how the presence of sharing platforms may affect durable goods purchase. While several
analytical papers have provided theoretical predictions of either a positive or negative impact of sharing
platforms on durable goods purchase (Abhishek et al. 2016, Benjaafar et al. 2015, Fraiberger and Sundararajan
8
2015, Horton and Zeckhauser 2016, Jiang and Tian 2016), empirical study remains conspicuously absent.
As discussed, the a priori relationship between the presence of sharing platforms and durable goods
purchase is far from clear. Unlike traditional markets, sharing platforms are unique in that both the demand
side and supply side are consumers of the durable good (Fraiberger and Sundararajan 2015, Horton and
Zeckhauser 2016). The demand side consists of consumers who utilize these platforms as an alternative way
to consume the product, i.e. “rental” (Abhishek et al. 2016, Fraiberger and Sundararajan 2015, Horton and
Zeckhauser 2016) or “access-based consumption” (Bardhi and Eckhardt 2012). The supply side consists of
owners of the product who may participate in the sharing economy in order to capture the excess rents
offered by these platforms. This key feature of sharing platforms offers two opposing effects of sharing
platforms on durable goods purchase. On the one hand, the presence of sharing platforms may lead to a
cannibalization effect on product sales (Jiang and Tian 2016). On the other hand, the presence of sharing
platforms may lead to a value enhancement effect (Abhishek et al. 2016, Jiang and Tian 2016), which may alter
consumers’ incentives to invest in assets and induce new ownership (Fraiberger and Sundararajan 2015).
2.3 Cannibalization Effect Cannibalization effects occur when consumers who would buy a product no longer make such a purchase
after an alternative product or service is introduced (Copulsky 1976, Mason and Milne 1994); in this case, the
introduction of the sharing platform. For example, illegal sharing of information goods may cannibalize legal
sales (Danaher et al. 2014, Oberholzer-Gee and Strumpf 2007); the introduction of online channels may
cannibalize the sales of offline channels (Brynjolfsson and Smith 2000, Seamans and Zhu 2013); the
secondary market of durable goods may cannibalize the sales of new products (Coase 1972, Ghose et al.
2006); and the availability of a rental option may cannibalize the sales of the purchase option (Knox and
Eliashberg 2009). Sharing platforms, similarly, provide a low-cost “rental” option to consume the products,
which may reduce the probability of purchase and ownership (Abhishek et al. 2016, Fraiberger and
Sundararajan 2015, Horton and Zeckhauser 2016, Jiang and Tian 2016).
Why might such an effect manifest? Received research indicates that ridesharing platforms, e.g., Uber
and Lyft, provide efficient and low-cost transportation options for consumers (Belk 2014, Cramer and
9
Krueger 2016, Greenwood and Wattal 2017).3 As a result, it is plausible that some consumers may no longer
need to subsidize the entire cost of vehicle ownership for at least three reasons.
First, there may be significant economic and social cost savings from exclusively leveraging
ridesharing services. In addition to jettisoning the continual costs of upkeep, insurance, and parking/storage
(Bardhi and Eckhardt 2012, Belk 2014, Sundararajan 2013), ridesharing services may be more attractive for
consumers who do not want to curtail their social activities as a result of needing to drive, i.e. drinking (Rayle
et al. 2014). Second, in addition to lower cost, such access-based sharing also provides a more transient mode
of consumption than ownership, and offers convenience, flexibility and adaptability (Bardhi and Eckhardt
2012). Third, this access-based consumption allows consumers to experiment with different products and
increase the diversity of goods consumed (Bardhi and Eckhardt 2012, Horton and Zeckhauser 2016,
Sundararajan 2013), and may be perceived as a trendy and environmentally friendly consumption alternative
to ownership (Belk 2014, Bardhi and Eckhardt 2012, Li et al 2016). Indeed, the popular press has identified
several cases of people opting out of vehicle ownership as a result of ridesharing availability (Manjoo 2014). A
recent survey by the Shared-Use Mobility Center also find that people who use more shared transportation
modes, including bike sharing, car sharing (e.g., Zipcar), and ridesharing (e.g., Uber), are less likely to own a
car and spend less on transportation (Murphy 2016).
2.4 Value Enhancement Effect The presence of sharing platforms may also lead to a value enhancement effect on product ownership; wherein a
change in the market may significantly increase the value of ownership to consumers (Abhishek et al. 2016,
Jiang and Tian 2016). In the case of the sharing economy, such an effect may alter consumers’ incentives to
invest in assets and induce new ownership (Fraiberger and Sundararajan 2015), thereby leading to additional
durable goods purchase (Chevalier and Goolsbee 2009). Prior literature has shown, for example, that the
presence of a secondary market may enhance the value of ownership, as forward-looking consumers may
adjust their valuation of the product by taking into account the product’s resale value in the secondary market
(Chevalier and Goolsbee 2009, Ghose et al. 2005, Miller 1974, Rust 1986). Sharing platforms could have a
3 Uber often markets itself as a low-cost alternative to car ownership—https://newsroom.uber.com/economics-of-car-ownership/
10
similar effect on ownership, because consumers may adjust their valuation of the product by taking into
account the rents that can be captured on the platform. In turn, such a valuation may increase the probability
of purchase and ownership (Abhishek et al. 2016, Fraiberger and Sundararajan 2015, Horton and Zeckhauser
2016, Jiang and Tian 2016). To the extent that ridesharing platforms imbue owners with the possibility of
sharing excess capacity with others, all the while earning additional income (Hall and Krueger 2016) on a
flexible schedule (Chen and Sheldon 2015, Hall and Krueger 2016), such an effect is not implausible.
Empirical evidence lends support for such a possibility. For example, a recent survey by Hall and
Krueger (2016) found that eight percent of the Uber drivers in the United States were unemployed before
they started working through Uber, and 20 percent of the Uber drivers have Uber as the only source of
income. Moreover, most of the drivers who participated in contingent work through Uber choose the
platform as an additional source of income (91 percent), for flexible work schedule (87 percent), and as a way
to maintain stable income (74 percent). Burtch et al. (2017), who find that the entry of Uber has a negative
effect on local entrepreneurship by providing stable employment opportunity for the un- and under-
employed individuals, corroborate such conclusions. If this is the case, then it follows that participants may
be willing to make capital investments in durable goods in order to access such markets.4
It should be noted, that these theoretical mechanisms are not mutually exclusive, inasmuch as some
consumers may have their purchases cannibalized and others may seek value enhancement. However, taken
together, the two opposing theoretical arguments introduce a natural tension. On the one hand, the presence
of sharing platforms, as an alternative consumption mode to ownership, may decrease the sales of durable
goods (i.e., the cannibalization effect). On the other hand, the presence of sharing platforms may enhance the
value of ownership of durable goods, thereby increasing the sales of durable goods. In absence of a
compelling a priori expectation, we empirically resolve this tension to identify the dominant effect.
3. Context and Data
4 The flexible work schedule provided by such platforms only serves to underscore such an effect, by smoothing pay variability during job transitions (Farrell and Greig 2016, Hall and Krueger 2016) and allowing workers to redeploy resources (Burtch et al. 2017), e.g., time, and experiment with other potential opportunities (Greve 2007, Kerr et al. 2014, Shah and Tripsas 2007). The surge pricing algorithm of the Uber platform, in particular, serves as a mechanism to incentivize drivers’ supply of rides on the platform, resulting in drivers dynamically adjusting their hours and number of trips depending on the changes in price (Chen and Sheldon 2015).
11
3.1 Context To examine the effect of the presence of sharing platforms on durable goods purchase, we leverage the entry
of Uber, an app-based ridesharing service, into different markets in China between 2010 and 2015. Founded
in 2009 in San Francisco, California, Uber is currently the largest ridesharing service in the world by both
valuation and footprint ($66 billion and servicing more than 545 cities / 66 countries as of 2016). Further, the
platform offers a wide selection of transportation options, ranging from ultra-premium luxury services such
as Uber Lux and Uber Chopper, to discount services such as Uber X.
In this study, we focus on the Chinese counterpart of the discount Uber X service, People’s Uber.5
Until its purchase by DiDi Chuxing in August of 2016, People’s Uber was Uber’s low-cost ridesharing service
in China. To use this service, passengers can submit a trip request through Uber’s smartphone application,
and Uber then assign drivers who use their own car to fulfill the request. People’s Uber was first introduced
in Beijing in August 2014. By December 2015, People’s Uber had entered 21 cities in China. Data on the
entry of People’s Uber are collected from Uber’s official blog and social media accounts (e.g., Weibo).
We focus on People’s Uber for several reasons. First, as seen in Table 1, the introduction of People’s
Uber in China is geographically and temporally dispersed, thereby allowing us to estimate the effect of Uber
entry using a difference-in-difference design. Intuitively, with such a design, we can leverage cities where
People’s Uber has not yet entered, i.e. cities that have not yet received the treatment, as a control group.
Second, when Uber enters a new city, the company makes announcements on its official blog and social
media platforms. This creates the added benefit of cleanly identifying the entry timing for each city. It also
stands in stark contrast to other ride-hailing platforms, such as DiDi Chuxing6 (formerly Didi Kuaidi from
the merger of Didi Dache and Kuaidi Dache), which do not consistently make formal announcements when
entering into new regions. Third, Uber was the first platform to offer peer-to-peer ridesharing services in
China, and was the dominant ridesharing service in China during the sample period. Again, this separates it
from other domestic platforms that mainly offered taxi-hailing services (viz. DiDi Chuxing), or black car
5 Consistent with prior studies (e.g., Burtch et al. 2017, Greenwood and Wattal 2017), we focus on discount services, as opposed to premium services (e.g. Uber Black), due to their significantly larger networks of drivers and significantly smaller barriers to entry. While People’s Uber allows drivers to utilize a broader range of low-cost vehicles, other premium services require drivers to have a higher-cost vehicle. 6 http://www.xiaojukeji.com/
12
services (e.g., DiDi Zhuanche as offered by DiDi Chuxing, ShenZhouZhuanChe, and Yidao Yongche),
during the sample.
Before discussing our data, we make note of three potential complicating factors. First, among the 21
cities that launched People’s Uber by December 2015, three cities (Wuhan, Tianjin, and Nanjing) first
launched the service unofficially, during which the service was only available in limited areas of these cities
(Table 1). We discuss our empirical strategy for resolving this concern below. Second, in our sample, seven
cities imposed ownership lotteries or auctions to limit the number of passenger cars that can be registered
each year. Shanghai is the first city that implemented such a license auction, the policy becoming effective in
1994. After Shanghai, Beijing adopted a lottery mechanism by setting an annual quota of vehicle registrations.
Five other cities then followed (viz. Guiyang, Guangzhou, Tianjin, Hangzhou, and Shenzhen). Because these
annual quotas may influence the number of vehicles purchased annually, we exclude these cities from our
analysis. Finally, near the end of our sample (May 2015), DiDi Chuxing introduced a competing peer-to-peer
ridesharing service, DiDi Kuaiche. While People’s Uber remained the dominant discount ridesharing service
(recall that DiDi focused exclusively on taxi’s and black car services prior to this time), this is nevertheless
worth noting. Further, although the appearance of an additional ridesharing service does not undermine our
theoretical arguments regarding the effect of the sharing economy, since DiDi is subject to the same
theoretical mechanisms as People’s Uber, we do control for the potential effect of the introduction of DiDi
Kuaiche on car purchase. To do so, we collected the Baidu Index of DiDi Chuxing (on which we elaborate
below) for each city during each month and included this as a control variable.
3.2 Data To estimate the effect of the introduction of People’s Uber on new car ownership, we construct a unique
longitudinal data set that contains new car registrations in China from 2010 to 2015. These data give us
information on the number of new passenger cars registered for personal use in each prefecture-level city7 by
month. Passenger cars refer to “motor vehicles with at least four wheels, used for the transport of passengers,
7 In China, provinces (the first-level divisions) are divided into prefecture-level cities (the second-level divisions), which are similar to the function of counties in the United States.
13
and comprising no more than eight seats in addition to the driver’s seat.”8 Our data only include domestic
passenger cars which are manufactured in China (regardless of where the headquarters of the manufacturer
are located). For example, BMW sedans or SUVs manufactured in China (e.g., the 3 series or X3) are
considered as domestic passenger cars. Imported cars, i.e. cars manufactured outside China, are not included.
Empirically, this is of little concern. In the six-year observation window of our study, newly imported
passenger cars constituted less than 7.5% of the passenger car market, and were mostly comprised of super
high-end luxury vehicles (e.g., Aston Martin, Bentley, Ferrari, Porsche, etc.)(Wagner et al. 2009). In total, our
sample includes monthly data on 14 cities over 6 years.
3.3 Variable Definitions 3.3.1 Dependent Variable - The dependent variable, ln(NumCars)it, is the natural log of the number of new
vehicles registered in city i during month t.9 The log transformation allows us to interpret the effect as a
percentage change, and resolves the issue of right-skewed distribution.
3.3.2 Independent Variables –Because People’s Uber rolls out in a two-phased manner, i.e. the unofficial and
then official launch, we leverage two dichotomous indicators as our primary independent variables of interest
in our initial analysis. The first variable, UnofficialUberEntryit, indicates the soft entry of the People’s Uber
ridesharing service in city i in month t. The second variable, OfficialUberEntryit, indicates the official entry of
the People’s Uber ridesharing service in city i in month t. It should be noted that UnofficialUberEntry always
occurs before OfficialUberEntry (if at all). A list of treated cities and entry is available in Table 1.10
3.3.3 Controls - In addition to the above variables, we include a robust set of controls. First, we obtain annual
city-level demographic data from China City Statistical Yearbook, which has been widely used in prior
research (Glaeser et al. 2017, Jia 2014, Wu et al. 2016, Zheng and Kahn 2017). In particular, we include three
types of demographic data, i.e., economic characteristics, mobile and internet access, and transportation and
traffic related characteristics. For economic characteristics, we include the log-transformed population, the
number of employed workers, the number of registered unemployed citizens, average wage of employed
8 http://oica.net/wp-content/uploads/stats-definition1.pdf. 9 A value of one is added before the log transformation. 10 We manually collected the entry dates from multiple sources, including Uber Newsroom, the official Weibo accounts of each local Uber office, and news articles. Weibo is a Chinese microblog platform similar to Twitter.
14
workers, and gross region production (GRP) per capita. Second, because Uber is a mobile-based platform
that requires mobile and internet access, we include the log-transformed number of mobile subscribers and
internet subscribers. Third, we control for factors related to other transportation methods and traffic
conditions, including the log transformed highway passenger traffic, the number of buses, bus passenger
volume, the number of taxis, road area per capita, and metro length.
Next, we collected data from the Baidu Index, which is a search volume index provided by Baidu, the
largest Chinese search engine. Conceptually, this is the Chinese equivalent of the US-based Google Trends
data that has been widely used in prior literature as a proxy for demand (Ghose 2009, Li et al. 2016, Wallsten
2015). We include these controls to measure the search volume of search terms related to other domestic
ride-hailing platforms in China.11 The Baidu Index data were collected for each search term in each
prefecture-level city for each month. It well reflects the popularity of a platform after it entered into each
local market. Specifically, ln(Didi) is the natural log of the Baidu index of search terms related to Didi Chuxing
(including Didi Chuxing, Didi Dache, Kuaidi Dache, and Didi Kuaiche); ln(Shenzhou) is the natural log of the
Baidu index of the search term ShenZhouZhuanChe; and ln(Yidao) is the natural log of the Baidu index of the
search term YiDao YongChe. 12 Finally, we apply time and location fixed effects. Summary statistics of the
variables are in Table 2 and a correlation matrix of the variables is presented in Appendix A.
4. Empirical Strategy and Results 4.1 Difference-in-Difference Model To estimate the effect of Uber entry on durable goods purchase in the form of new car ownership, we use a
difference-in-difference (DID) model (Angrist and Pischke 2008, Bertrand et al. 2004). The DID model
offers us several advantages, chief among them being that we can exploit the fact that People’s Uber entered
different locations at different times. In doing so, we leverage cities where Uber has not yet entered as the
control group for cities where Uber is currently active. In particular, we estimate the DID model using only
cities that eventually introduced Uber, thereby dramatically increasing the homogeneity of the sample on both
observables and unobservables (Bapna et al. 2015). Our unit of analysis is the city-month. We model
11 All search terms are in Chinese. 12 Note that Lyft, Sidecar, and other dominant US competitors to Uber did not operate in China during the period of the sample.
15
ln(NumCars)it, the log-transformed number of new domestic passenger cars registered for personal use in city i
during month t, using the following specification:
ln(NumCars)it =αi+γt+β1UnofficialUberEntryit+β2OfficialUberEntryit+εit, ⑴
where αi represents city fixed effect, and γt represents month fixed effect. As noted earlier, UnofficialUberEntryit
is a dummy indicating whether Uber had unofficially launched People’s Uber in city i by month t (1 for yes,
and 0 for no). OfficialUberEntryit is an dummy indicating whether Uber had officially announced the launch of
People’s Uber in city i by month t (1 for yes, and 0 for no). The specification above allows us to estimate the
effect of unofficial entry (as captured by β1) and the effect of official entry (as captured by β2) separately. To
reduce concerns about heteroscedasticity and within-city serial correlation, we use robust standard errors
clustered at the city level. Results are reported in Column 1 of Table 3.
As can be seen, the official introduction of People’s Uber into is significantly positively correlated
with the number of new car registrations (β2 = 0.217, p < 0.05), suggesting that the introduction of People’s
Uber is associated with a 22% increase in the number of new car registrations. This indicates that the
prospect of value enhancement effect (i.e., flexible work schedule or earning additional income) through
sharing excess capacity encourages consumers to own a car. With limited observations that experienced
unofficial entry of People’s Uber, we find no significant effect of unofficial Uber entry on the number of new
car registrations (β1 = 0.180, p > 0.1).
One potential issue with Equation (1) is that it does not account for idiosyncratic time trends in each
city. To address this issue, we next include city-specific linear time trends by estimating the following
equation:
ln(NumCars)it =αi+γt+β1UnofficialUberEntryit+β2OfficialUberEntryit+θit + εit, ⑵
where θi captures the linear time trend of city i. That is, we allow each city to have a different time trend, even
after controlling for time invariant city specific heterogeneity (through city fixed effects) as well as general
trends that are city invariant (through month fixed effects). Results are in Column 2 of Table 3.
The coefficient from Column 2 of Table 3 suggests that the entry of People’s Uber is associated with
16
an average of 8% increase in car sales in China, which is smaller than the effect estimated based Equation (1).
Again, the positive coefficient provides evidence of the value enhancement effect that increases consumers
propensity to own a car. Furthermore, anecdotal accounts lend credence the size of such an estimate. Almost
100,000 drivers and 800,000 passengers registered for the service within the first month of its availability in
Hefei, a city with a population of seven million.13
4.2 Relative Time Model One critical assumption required for the validity of the DID estimation is that the pre-treatment trends of the
dependent variable, i.e. changes in the rate of new vehicle registration, must be parallel prior to treatment,
conditional upon controls (Angrist and Pischke 2008, Bertrand et al. 2004). Practically, this means that there
should be no difference in pre-treatment trends in the dependent variable across cities prior to Uber entry
once controls are applied. To validate this assumption, we execute the leads and lags model proposed by
Autor (2003), i.e. a relative time model, which has been widely used in extant literature (Bapna et al. 2015,
Burtch et al. 2017, Carnahan 2013). The model is implemented by including a series of dummy variables that
indicate the relative temporal distance (in three-month intervals) between an observation period, t, and the
timing of Uber entry in city i, in addition to the absolute month fixed effects. Conceptually, the relative time
model allows us not only to test whether there is a difference in pre-treatment trends, but also to estimate
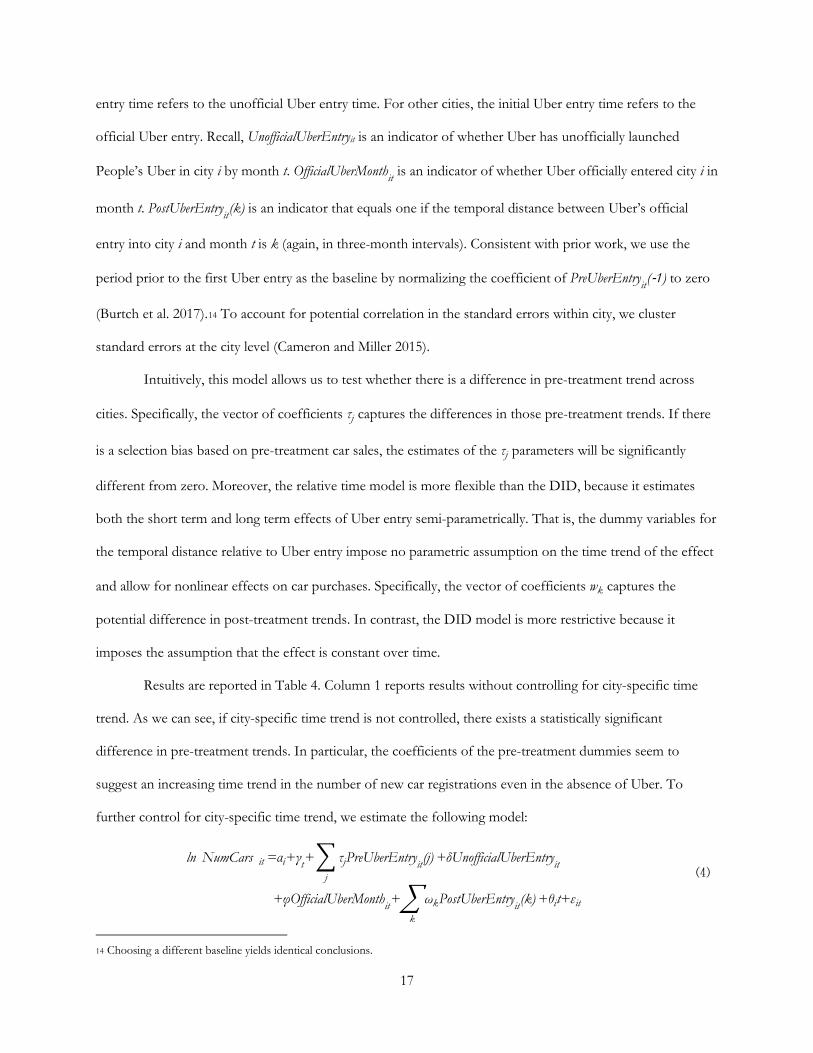
treatment effects that may vary offer time. We specify the relative time model as follows:
ln(NumCars)it =αi+γt+� τjPreUberEntryit(j)
j
+δUnofficialUberEntryit
+φOfficialUberMonthit+�ωkPostUberEntryit(k)k
+εit
⑶
Again, ln(NumCars)it is the log-transformed number of domestic passenger cars registered for personal use in
city i during month t, αi represents city fixed effects, and γt represents month fixed effects. PreUberEntryit(j) is
an indicator equal to one if the temporal distance between Uber’s initial entry into city i and month t is j (in
three-month intervals to increase interpretability (Burtch et al. 2017)). Results are identical using month
dummies and are available upon request. For cities that experienced unofficial Uber entry, the initial Uber
13 http://news.hf365.com/system/2016/04/01/014920520.shtml (original article in Chinese).
17
entry time refers to the unofficial Uber entry time. For other cities, the initial Uber entry time refers to the
official Uber entry. Recall, UnofficialUberEntryit is an indicator of whether Uber has unofficially launched
People’s Uber in city i by month t. OfficialUberMonthit is an indicator of whether Uber officially entered city i in
month t. PostUberEntryit(k) is an indicator that equals one if the temporal distance between Uber’s official
entry into city i and month t is k (again, in three-month intervals). Consistent with prior work, we use the
period prior to the first Uber entry as the baseline by normalizing the coefficient of PreUberEntryit(-1) to zero
(Burtch et al. 2017).14 To account for potential correlation in the standard errors within city, we cluster
standard errors at the city level (Cameron and Miller 2015).
Intuitively, this model allows us to test whether there is a difference in pre-treatment trend across
cities. Specifically, the vector of coefficients τj captures the differences in those pre-treatment trends. If there
is a selection bias based on pre-treatment car sales, the estimates of the τj parameters will be significantly
different from zero. Moreover, the relative time model is more flexible than the DID, because it estimates
both the short term and long term effects of Uber entry semi-parametrically. That is, the dummy variables for
the temporal distance relative to Uber entry impose no parametric assumption on the time trend of the effect
and allow for nonlinear effects on car purchases. Specifically, the vector of coefficients wk captures the
potential difference in post-treatment trends. In contrast, the DID model is more restrictive because it
imposes the assumption that the effect is constant over time.
Results are reported in Table 4. Column 1 reports results without controlling for city-specific time
trend. As we can see, if city-specific time trend is not controlled, there exists a statistically significant
difference in pre-treatment trends. In particular, the coefficients of the pre-treatment dummies seem to
suggest an increasing time trend in the number of new car registrations even in the absence of Uber. To
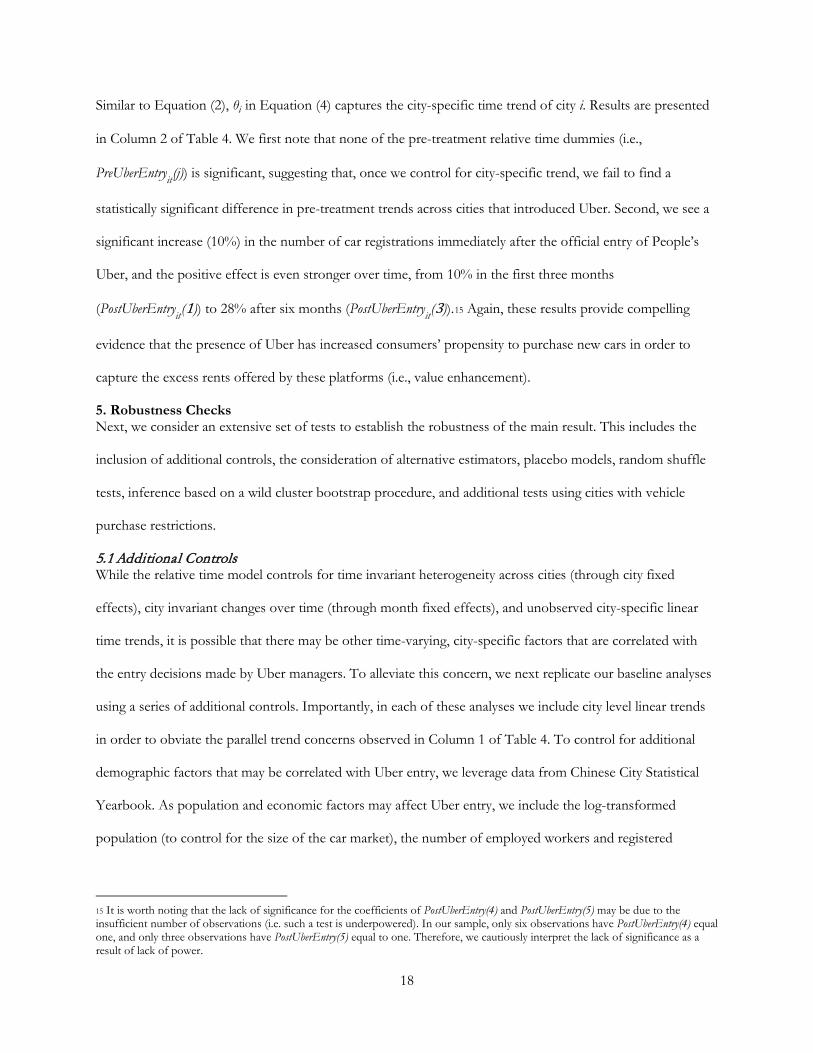
further control for city-specific time trend, we estimate the following model:
ln(NumCars)it =αi+γt+� τjPreUberEntryit(j)
j
+δUnofficialUberEntryit
+φOfficialUberMonthit+�ωkPostUberEntryit(k)k
+θit+εit
⑷
14 Choosing a different baseline yields identical conclusions.
18
Similar to Equation (2), θi in Equation (4) captures the city-specific time trend of city i. Results are presented
in Column 2 of Table 4. We first note that none of the pre-treatment relative time dummies (i.e.,
PreUberEntryit(j)) is significant, suggesting that, once we control for city-specific trend, we fail to find a
statistically significant difference in pre-treatment trends across cities that introduced Uber. Second, we see a
significant increase (10%) in the number of car registrations immediately after the official entry of People’s
Uber, and the positive effect is even stronger over time, from 10% in the first three months
(PostUberEntryit(1)) to 28% after six months (PostUberEntryit(3)).15 Again, these results provide compelling
evidence that the presence of Uber has increased consumers’ propensity to purchase new cars in order to
capture the excess rents offered by these platforms (i.e., value enhancement).
5. Robustness Checks Next, we consider an extensive set of tests to establish the robustness of the main result. This includes the
inclusion of additional controls, the consideration of alternative estimators, placebo models, random shuffle
tests, inference based on a wild cluster bootstrap procedure, and additional tests using cities with vehicle
purchase restrictions.
5.1 Additional Controls While the relative time model controls for time invariant heterogeneity across cities (through city fixed
effects), city invariant changes over time (through month fixed effects), and unobserved city-specific linear
time trends, it is possible that there may be other time-varying, city-specific factors that are correlated with
the entry decisions made by Uber managers. To alleviate this concern, we next replicate our baseline analyses
using a series of additional controls. Importantly, in each of these analyses we include city level linear trends
in order to obviate the parallel trend concerns observed in Column 1 of Table 4. To control for additional
demographic factors that may be correlated with Uber entry, we leverage data from Chinese City Statistical
Yearbook. As population and economic factors may affect Uber entry, we include the log-transformed
population (to control for the size of the car market), the number of employed workers and registered
15 It is worth noting that the lack of significance for the coefficients of PostUberEntry(4) and PostUberEntry(5) may be due to the insufficient number of observations (i.e. such a test is underpowered). In our sample, only six observations have PostUberEntry(4) equal one, and only three observations have PostUberEntry(5) equal to one. Therefore, we cautiously interpret the lack of significance as a result of lack of power.
19
unemployed citizens (to control for employment status), average wage of employed workers, and gross region
production (GRP) per capita (to control for local economic growth). Second, access to mobile and internet
technologies may also affect Uber entry, because Uber is a smartphone-based service that requires mobile and
internet access. We thus include the log-transformed number of mobile subscribers and internet subscribers.
Third, we control for factors related to other transportation methods and traffic conditions that may affect
Uber’s entry decision. Specifically, we included the log transformed highway passenger traffic, number of
buses, bus passenger volume, number of taxis, road area per capita, and metro length.
Finally, it is reasonable to be concerned with the presence of other ride-hailing services. Insofar as it
is difficult to identify the entry timing of other services into each city, we collect data on the search volumes
of these services from Baidu, the largest search engine in China, to control for the popularity of these
services. Specifically, we included the log of the Baidu index of search terms related to DiDi Chuxing, the
search term ShenZhouZhuanChe, and the search term YiDao YongChe.
We then re-estimate the relative time model by including different combinations of demographic
variables and Baidu indexes as controls. Results are in Table 5. After including additional controls, results
remain consistent. That is, we find a statistically significant effect of the post-entry dummies, suggesting that
vehicle purchases rise significantly post Uber entry, with little evidence of a pre-treatment effect. Again, we
see that a significant increase in the number of car registrations immediately after the official entry of People’s
Uber, and the estimated effect manifests over time, from 10% in the first three months (PostUberEntryit(1)) to
28% after six months (PostUberEntryit(3)). The fact that the estimates remain similar after the inclusion of
different control variables suggest the robustness of the main results.
5.2 Count Model In our main analysis, we have thus far used the log-transformed number of cars as the dependent variable. As
the count variable, i.e. the number of cars registered, is highly skewed, the log transformation allows us to
make the distribution closer to a normal distribution so as to estimate the linear regression models using an
ordinary least squares (OLS) estimator. Moreover, using the log number of cars as the dependent variable
allows us to estimate the coefficient of an independent variable as a percentage change in the number of cars
20
when the independent variable increases by one unit.
In light of concerns raised by O’Hara and Kotze (2010), Silva and Tenreyro (2006), Silva and
Tenreyro (2011), we next replicate the estimations using a traditional count estimator, as opposed to a log-
transformed dependent variable with an OLS. We re-estimate the relative time model using the number of
cars (NumCars) as the dependent variable, both with and without control variables, using a Poisson pseudo-
maximum likelihood (PPML) estimator (Simcoe 2007). Such an approach has been widely used in recently
studies with count data (Burtch et al. 2017, Burtch et al. 2014, Greenwood and Wattal 2017), and offers
several benefits over other estimators such as a fixed effect negative binomial (Allison and Christakis 2006).
The use of PPML also allows us to estimate clustered standard errors, even in the presence of over-dispersion
(Wooldridge 1997). Results with and without controls are presented in Columns 1 and 2 of Table 6,
respectively, and remain consistent. Again, we do not find evidence of significant differences in pre-treatment
trends, which support the parallel trends assumption. Further, we see that the entry of People’s Uber
significantly increases the number of new cars registered. Economically, estimates suggest that the number of
new cars registrations increases by 14%-22% after Uber entry.
5.3 Placebo Test Using Data on Prior Years While results thus far have shown remarkable consistency, it remains plausible that the results are an artifact
of an idiosyncrasy associated with cities in China that receive the Uber treatment, as opposed a result of Uber
entry. We therefore next execute a placebo test using data on prior years, wherein we attempt to calculate the
probability of such an effect manifesting purely by chance. Further, such a test allows us not only to check
whether the observed effect is driven by chance, but provides a reasonable check against outliers.
To run the placebo test, we re-estimated the DID and relative time models by regressing the log-
transformed number of cars purchases of month t on placebo treatments, i.e., the treatment variables of
month t+24 (i.e. 2 years later). Ideally, the placebo treatments should have no effect on the outcome variable.
The results of the DID model are presented in Table 7, and the results of the relative time model are
presented in Table 8. As we can see, using both DID and relative time models, the estimated coefficients of
the placebo treatment variables are statistically insignificant, suggesting that the observed real effect of Uber
entry) is unlikely to be driven by random chance or outliers.
21
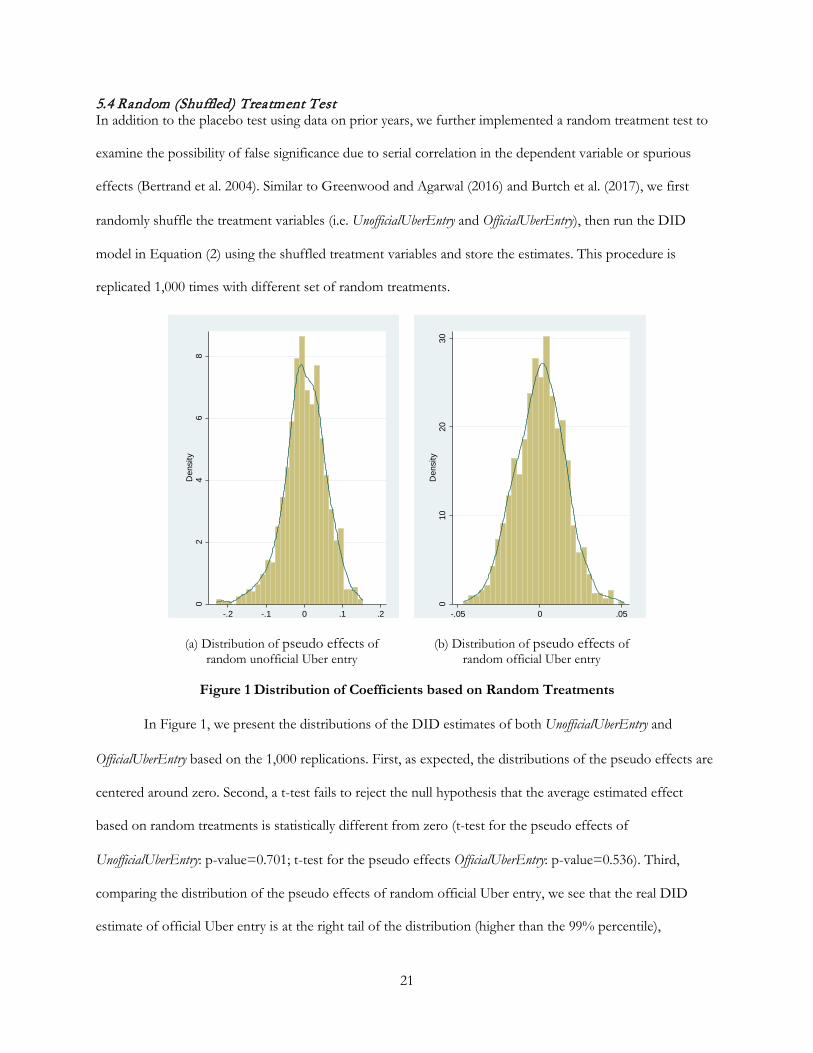
5.4 Random (Shuffled) Treatment Test In addition to the placebo test using data on prior years, we further implemented a random treatment test to
examine the possibility of false significance due to serial correlation in the dependent variable or spurious
effects (Bertrand et al. 2004). Similar to Greenwood and Agarwal (2016) and Burtch et al. (2017), we first
randomly shuffle the treatment variables (i.e. UnofficialUberEntry and OfficialUberEntry), then run the DID
model in Equation (2) using the shuffled treatment variables and store the estimates. This procedure is
replicated 1,000 times with different set of random treatments.
(a) Distribution of pseudo effects of random unofficial Uber entry
(b) Distribution of pseudo effects of random official Uber entry
Figure 1 Distribution of Coefficients based on Random Treatments
In Figure 1, we present the distributions of the DID estimates of both UnofficialUberEntry and
OfficialUberEntry based on the 1,000 replications. First, as expected, the distributions of the pseudo effects are
centered around zero. Second, a t-test fails to reject the null hypothesis that the average estimated effect
based on random treatments is statistically different from zero (t-test for the pseudo effects of
UnofficialUberEntry: p-value=0.701; t-test for the pseudo effects OfficialUberEntry: p-value=0.536). Third,
comparing the distribution of the pseudo effects of random official Uber entry, we see that the real DID
estimate of official Uber entry is at the right tail of the distribution (higher than the 99% percentile),
02
46
8D
ensi
ty
-.2 -.1 0 .1 .2
010
2030
Den
sity
-.05 0 .05
22
suggesting that the probability of obtaining a similar estimate by random chance is extremely low (p-
value<0.001).
5.5 Wild Cluster Bootstrap Based Inference In our main analyses, we cluster robust standard errors by city to allow for serial correlation and ensure
correct inference. However, when there are only a small number of clusters, the cluster robust standard error
may generate p-values that are too small, which may result in over-rejection (Bertrand et al. 2004). As
suggested by Cameron et al. (2008) and Cameron and Miller (2015), a common correction for this problem is
to use a wild cluster bootstrap procedure, which allows for serial correlation when there are only a few
clusters. In Appendix B, we report the p-values obtained from the wild cluster bootstrap procedure.
Specifically, Table B1 presents the wild cluster bootstrap based p-values of the DID model in addition to the
coefficients and cluster robust standard errors that are reported in Table 3, and Table B2 presents the wild
cluster bootstrap based p-values of the relative time model in addition to the coefficients and cluster robust
standard errors that are reported in Table 4. As can be seen, the results remain consistent, suggesting that our
inference is not affected by the issue of few clusters.
5.6 Additional Test Using Cities with Vehicle Purchase Quota Restriction As noted earlier, seven cities that imposed quotas on the number of passenger car registrations issued per year
during our sample period are excluded from our main analysis. Among the seven cities, six cities16 introduced
the restriction policy prior to the entry of People’s Uber. To the extent that such restrictions should preclude
a concomitant rise in vehicle purchases, the existence of such quotas offers us a powerful falsification test (in
as much as a significant increase in vehicle purchases post Uber entry would call our results into question).
We therefore repeat our analysis using these six cities, with the inclusion of PostPurchaseRestrictionit,
i.e., a dummy indicating whether a vehicle purchase restriction policy is effective in city i by month t. Ideally,
after we control for the implementation of vehicle purchase restriction, the entry of People’s Uber should
have no impact on the number of car registrations in these cities. The results of the DID model are presented
in Table 9. Column 1 presents the results of the simple DID model (similar to Equation 2) without controls.
16 The only exception is Shenzhen, where People’s Uber was introduced prior to the implementation of the vehicle purchase restriction.
23
Column 2 includes additional controls. Because the introduction of vehicle purchase restriction may change
the time trend within each city, we allow each city to have different time trends before and after the
implementation of vehicle purchase restriction in Columns 3 and 4. Consistent with our expectation, results
indicate across each of the specifications that Uber does not have a significant impact on the number of cars
registered in the presence of an annual purchase quota. In addition, we find a significant decline in vehicle
registrations following the implementation of annual purchase quota.
6. Empirical Extensions Our analyses thus far have consistently shown a positive average effect of official Uber entry on new vehicle
registrations across multiple model specifications and estimations, and results are robust to a stringent series
of falsification checks. We next consider heterogeneity in the observed effect, to better identify the underlying
mechanism driving the realized change.
6.1 Effect by Vehicle Type Thus far, results consistently suggest that a value enhancement effect is dominating any cannibalization effect.
However, some vehicles may not be as cost efficient as others when being used by drivers to garner rents.
Intuitively, if the value enhancement effect is valid, we expect the effect may be stronger for smaller cars than
larger cars. To the degree that larger and heavier vehicles, which often have larger engine displacement,
possess significantly worse fuel economy, it stands to reason that rent-seeking individuals on the platform
would be more likely to avoid these vehicles. Moreover, to the extent that individuals driving on the platform
are often capital constrained (Burtch et al. 2017), and inasmuch as extent literature suggests that vehicles with
larger engines are more likely to be purchased by wealthier individuals (Wagner et al. 2009), it follows that
potential drivers would be more likely to purchase smaller, more fuel-efficient vehicles.
We therefore decompose our data along two dimensions: engine size and vehicle size. Regarding
engine size, we decompose car registrations by engine displacement into four displacement tiers: 1-1.5 L, 1.5-
2 L, 2-2.5 L, and above 2.5 L. If our proposed mechanism, i.e. a value enhancement effect, is correct, a
stronger effect should manifest with vehicles with smaller engines. Results are reported in Table 10 (without
controls) and Table 11 (with controls). Consistent with our expectation, results suggest that the effect of Uber
entry is positive and significant for vehicles with engine displacement below 2 L, but not significant for those
24
above 2 L. Intuitively, this corroborates our intuition that vehicles with larger engines may not be cost
efficient means to garner rents from the platform.
To proxy our effect based on vehicle size, we replicate the relative time model by running separate
regressions for vans and non-van vehicles, as vans represent significantly larger and heavier vehicles than
standard passenger vehicles (and with inferior fuel economy as a result). Results are reported in Table 12.
Columns 1 and 2 present results without controls, and Columns 3 and 4 present results with controls. As we
can see in Columns 1 and 3, the effect of Uber entry on van sales is only significant during the month of
official entry, and disappears once controls are included. Meanwhile, for non-vans (Columns 2 and 4),
estimates indicate that the effect of Uber entry is consistently positive and significant, in both the presence
and absence of controls. In sum, these results support the explanation that the presence of Uber as a sharing
platform enhances the value of owning a car by offering owners the option to share excess capacity with
others to earn additional income, which incentivizes individuals to actively invest in personal cars that are
more likely to be operated in order to participate in the Uber platform as drivers.
6.2 Effect by Gender Earlier results suggest that Uber entry positively affected the number of new car registrations, which indicates
that the presence of Uber generated a value enhancement effect on car ownership. It is interesting to
consider, however, whether or not men and women vary in the degree to which they exploit the platform to
accumulate rents. On the one hand, it is possible that the introduction of Uber may have a stronger effect on
women than men, as prior literature has documented that women are more likely than men to engage in an
alternative work arrangements (including temporary help agency workers, on-call workers, contract workers,
and independent contractors/freelancers, as defined by the Bureau of Labor Statistics17) (Katz and Krueger
2016). Alternative employment arrangements are different from permanent employment arrangements and
perceived as a better employment option for individuals with family responsibilities (Albert and Bradley
1997). In particular, women prefer job opportunities, on the margin, with flexible schedule, variety, and
freedom (Ellingson et al. 1998), and they may be forced to work around family demands (Loscocco 1997) or
17 https://www.bls.gov/news.release/conemp.nr0.htm
25
to balance the demands between work and family roles (Frone et al. 1992). Working on the platform is one
such alternative work arrangements, and provides benefits such as flexible work schedules and the potential
to work shorter hours (Chen and Sheldon 2015, Hall and Krueger 2016).
On the other hand, it is possible that the introduction of Uber may have a weaker effect on women
than men, as women driving a vehicle professionally is often seen as a violation of workplace gender roles
(Eagly 2013). One recent survey, for example, indicates that only 9% of the drivers for ridesharing services
are women.18 Another survey based on Uber drivers in the U.S. also finds that the percentage of female Uber
drivers (14%) is much lower than the percentage of female workers in the workforce (47%) (Hall and
Krueger 2016). As pointed out by Nick Allen, the confounder and former CEO of SideCar, “this economic
opportunity has excluded women–not purposefully, but women have self-selected out of it,” with one of the
main reasons being “the perception of safety or lack thereof.”19 As women may be less likely to drive
professionally, it may be that women’s car purchase decisions are less likely to be affected by Uber entry.
To estimate the differential impact of Uber entry on women versus men, we decompose our data by
gender, and replicate the relative time model by running separate regressions for each gender. The results are
reported in Table 14. Columns 1 and 2 present results without controls, and Columns 3 and 4 present results
with controls. As we can see in Columns 1 and 3, the effect of Uber entry on the number of cars purchased
by female are positive significant, both with and without including additional control variables. Meanwhile,
the results in Columns 2 and 4 suggest that the effect of Uber entry on the number of cars purchased by male
are also consistently positive and significant. However, when comparing Column 1 with Column 2, and
Column 3 with Column 4, we find that the magnitude of the effect is larger for male than female.20 Two key
takeaways stem from these results. First, they bolster our claim that ridesharing services are driving the effect.
To the degree that men, overwhelmingly, make up the population of drivers, the finding that women make up
the lion’s share of additional purchases would significantly undercut the credibility of our results. Second,
18 http://yuqing.people.com.cn/n/2015/1020/c212888-27719709.html 19 http://www.forbes.com/sites/ellenhuet/2015/04/09/female-uber-lyft-drivers/#2751ef625298 20 Results from a Wald Chi-square test after a seemingly unrelated regression indicates that differences in the coefficients across gender are statistically significant.
26
these results are encouraging as a signal of decreasing levels of gender inequality in a traditionally male-
dominated field. Inasmuch as women are still impacted in a non-trivial manner, our findings underscore
recent claims in the popular press that the gig-economy helps to ameliorate traditional gender biases
(Galluzzo 2016, Wright 2017), even if it does not resolve them entirely.
6.3 Effect by Age Next, we investigate the heterogeneous effect of Uber entry, based on buyer age. If the introduction of Uber
positively affects a consumer’s propensity of purchasing cars by providing them a means to earn additional
income or access flexible employment, we would expect that the effect is stronger for certain age groups that
are in higher need of such employment opportunities. Prior literature on income volatility has documented a
U-shaped relationship between income volatility and age; suggesting higher income volatility among young
adults and elderly compared to middle-aged adults (Clark and Summers 1981, Gundersen and Ziliak 2008,
Jaimovich and Siu 2009, Ríos-Rull 1996). The reasons for such a relationship are multifaceted, including an
unstable attachment to the labor force (Topel and Ward 1992), a higher propensity to engage in hourly (as
opposed to salaried) work, and more frequent transitions between jobs (Gundersen and Ziliak 2008).
Conversely, middle-aged adults tend to have more stable employment.
We therefore re-estimate the relative time model on five different age groups: individuals aged 18-24
years, 25-34, 35-44, 45-54, and above 55 years of age. Results are reported in Table 14 (without controls) and
Table 15 (with controls). Consistent with our expectation, results suggest a U-shaped pattern between the
estimated effects and age. That is, middle-aged adults (35-44, as shown in Column 3) are less likely to affected
by the introduction of Uber that young adults and people above the age of 45, which support the idea that
the presence of Uber has a higher impact on those who are more likely to participate in the Uber platform as
drivers in order to capture the employment benefits provided by the platform. Interestingly, much like the
effect for women, this finding also suggests that the gig-economy is opening up labor opportunities for
traditionally marginalized workers, i.e. younger and older workers who are less likely to be capturing stable
rents from the market (Clark and Summers 1981, Gundersen and Ziliak 2008, Jaimovich and Siu 2009, Ríos-
Rull 1996). To the degree that these results suggest the gig-economy may be incentivizing additional labor
force participation, our results corroborate the findings of Burtch et al. (2017), who argue that the gig-
27
economy often offers viable employment for the un- and under-employed.
7. Discussion and Conclusion Internet-based sharing platforms have emerged as a means of product sharing among owners with excess
capacity and consumers with temporary needs. In this study, we examine the effect of sharing platforms on
durable goods purchase. As such platforms imbue the owners of such goods both with the possibility of
extracting rents from their durable goods, as well as the possibility of consuming goods at a discounted rate,
the effect on purchase is far from clear. On the one hand, the presence of sharing platforms may cannibalize
durable goods purchase by providing consumers an alternative way of temporarily consuming the product.
Rather than owning the product, the consumers can now consume the product through the sharing platform,
thus reducing their likelihood of purchasing the product. On the other hand, these platforms may enhance
the value of ownership by providing owners of durable goods a way to share excess capacity and an
employment alternative, thus increasing their likelihood of purchasing the product to capture the benefits
provided by these platforms. Using the context of Uber’s entry in China, we utilize a different-in-difference
approach to analyze how People’s Uber, a peer-to-peer ridesharing service, affects new vehicle purchase.
Results suggest that the entry of People’s Uber has a significant and positive effect on new car purchases.
Intuitively, this indicates that consumers are strategically changing their stock of held resources in order to
capture the excess rents offered by these platforms. Interestingly, results further suggest that while there is a
stronger effect for male owners than female owners, the effect on female purchasing is non-trivial. Moreover,
findings indicate that there are stronger effects for those below 35 or above 55, as compared with people who
are middle-aged. Each of these empirical extensions suggest that gig-economy platforms like Uber are
facilitating labor market participation among traditionally marginalized groups.
Our study makes the following contributions. First, it contributes to the emerging literature on
sharing economy by empirically examining how the presence of sharing platforms affects durable goods
market. While recent theoretical work has provided competing views on how sharing platforms may affect
the ownership of durable goods (Abhishek et al. 2016, Jiang and Tian 2016), this paper is the first to provide
empirical evidence of the impact on ownership. This finding provides evidence of a value enhancement effect
on product ownership, suggesting that individuals on the supply side may actively change their stock of the
28
product to participate on such platforms instead of using existing, at rest resources. Our work also
contributes to the stream of literature on the societal impacts of the sharing economy by showing that the
introduction of these sharing platforms creates positive externality to local markets by stimulating durable
goods purchase and offering employment opportunity to traditionally marginalized groups.
Second, this study provides implications for both manufacturers and sharing platforms. Despite
concerns that sharing platforms might cannibalize sales, our results suggest the opposite effect dominates,
and sales rise significantly. Interestingly, results suggest manufacturers may benefit from the presence of such
platforms, in that these platforms may enhance to value of product ownership and stimulate purchases. In
particular, results regarding the heterogeneous effects across vehicle types suggest that manufacturers who
offer products that are more likely to be utilized (e.g., smaller cars with higher fuel economy) are more likely
to benefit from the emergence of these platforms. Manufacturers, therefore, should embrace the
opportunities offered by the emergence of the sharing economy by targeting consumers who are more likely
to participate in the sharing economy as suppliers, and advertising vehicle models that are more likely to be
utilized by them. Sharing platforms may also consider collaborating with manufacturers to further incentivize
consumers to purchase durable goods in order to participate on these platforms.
Finally, our study yields notable policy implications. Despite the current policy debate regarding the
legality issue of sharing platforms such as Uber and Airbnb and concerns about the potential negative impacts
of these platforms, our finding suggests that the sharing economy may create positive societal benefits to local
markets by stimulating durable goods purchase and providing opportunities for owners of durable goods to
earn additional income and have flexible work schedule. And, while our study considers only a portion of the
effect the sharing economy may have on overall public welfare, considering these benefits in the presence of
other observed benefits, e.g. higher efficiency, productivity, and public safety, as suggested by prior research,
indicates that these effects may be substantial. As a result, policy makers may take into account these positive
effects on sharing platforms when designing policies and regulations.
It should also be noted, however, that such active investments on the part of platform participants in
order to capture rents does fly in the face of claims made by platforms that individuals are simply exploiting
29
at rest resources. And this creates certain regulatory challenges, e.g., how to ensure that the market is
competitive for both incumbent, as well as emergent, players. While some innovations of the ridesharing
market could easily be enacted by industry incumbents (e.g. digital solicitation and billing), it is worth noting
that these markets are still heavily regulated compared to their upstart counterparts. As a result, policy makers
should certainly consider reducing the degree of regulation to which taxi and licensed livery services (e.g. caps
on medallions, onerous insurance minimums, etc.), in order to ensure fair market competition.
Our study is subject to several limitations. First, our empirical analysis focuses on People’s Uber, a
ridesharing service introduced by Uber in China, due to data availability. While China is a large market with a
population of 1.37 billion and 17 million new car registrations in 2015, further to ensure that these results
generalize to other markets will be critical. Relatedly, because sharing economy is a recent phenomenon, we
are unable to examine the long-term impact on durable goods purchase. It is worth noting that, while
People’s Uber remained the dominant peer-to-peer ridesharing service during our sample period, DiDi
Chuxing introduced a competing peer-to-peer ridesharing service, DiDi Kuaiche, near the end of our sample.
While DiDi is subject to the same theoretical mechanisms as People’s Uber, we do attempt to control for the
potential effect of the introduction of DiDi Kuaiche on car purchase by using search volume data to proxy
for the popularity of DiDi. Nevertheless, future work may examine the effect of DiDi to ensure the
robustness of the results when data are available. Second, while Uber is a dominant ridesharing platform in
the ridesharing market, future research may focus on a different type of sharing platforms (such as Airbnb) to
examine whether and how the presence of those platforms may affect the durable goods market (such as the
housing market). Third, our identification of the effect of Uber entry is based on the variation in timing of
Uber entry across different locations using archival data. Although we have included city fixed effects (to
control for city-invariant heterogeneity), time fixed effects (to control for seasonality), city-specific time
trends (to control for city-specific sales trends), and an extensive set of controls, future research may consider
other potential factors that may affect car sales to increase the efficiency of estimation. Fourth, the coefficient
estimates we obtained from the empirical analysis capture the net effect of the opposing mechanisms, and the
sign of the coefficient estimates helps us identify the dominant mechanism. Nevertheless, it remains possible
30
that the introduction of sharing platforms may cannibalize the sales of durable goods under some conditions.
Finally, it is important to note that this research addresses only part of the overall effect of the entry of
ridesharing services. It would be inappropriate, therefore, to draw any conclusions about the totality of the
public welfare loss or gain which emerges from these platforms. Instead, we hope that the sharing economy
continues to evolve as an interesting area, and future work can build on our work to develop an integrated,
comprehensive understanding of both the demand side and supply side of the sharing economy.
References V. Abhishek, Guajardo, J.A., Zhang, Z. 2016. Business Models in the Sharing Economy: Manufacturing
Durable Goods in the Presence of Peer-to-Peer Rental Markets. Working Paper. P.D. Allison, Christakis, N.A. 2006. Fixed-Effects Methods for the Analysis of Non-Repeated Events.
Sociological Methodology. 36(1) 155-172. J.D. Angrist, Pischke, J.-S. 2008. Mostly Harmless Econometrics: An Empiricist's Companion. Princeton university
press. D.H. Autor. 2003. Outsourcing at Will: The Contribution of Unjust Dismissal Doctrine to the Growth of
Employment Outsourcing. Journal of Labor Economics. 21(1) 1-42. D. Baker. 2014. Don't Buy the 'Sharing Economy' Hype: Airbnb and Uber Are Facilitating Rip-offs.
https://www.theguardian.com/commentisfree/2014/may/27/airbnb-uber-taxes-regulation. R. Bapna, Ramaprasad, J., Umyarov, A. 2015. Completing the Virtuous Cycle between Payment and Social
Engagement in Freemium Social Communities. University of Minnesota Working Paper. F. Bardhi, Eckhardt, G.M. 2012. Access-Based Consumption: The Case of Car Sharing. Journal of Consumer
Research. 39(4) 881-898. R. Belk. 2014. You Are What You Can Access: Sharing and Collaborative Consumption Online. Journal of
Business Research. 67(8) 1595-1600. S. Benjaafar, Kong, G., Li, X., Courcoubetis, C. 2015. Peer-to-Peer Product Sharing: Implications for
Ownership, Usage and Social Welfare in the Sharing Economy. Working Paper. M. Bertrand, Duflo, E., Mullainathan, S. 2004. How Much Should We Trust Differences-in-Differences
Estimates? The Quarterly Journal of Economics 249-275. E. Brynjolfsson, Smith, M.D. 2000. Frictionless Commerce? A Comparison of Internet and Conventional
Retailers. Management Science. 46(4) 563-585. G. Burtch, Carnahan, S., Greenwood, B.N. 2017. Can You Gig it? An Empirical Examination of the Gig-
Economy and Entrepreneurial Activity. Working Paper. G. Burtch, Ghose, A., Wattal, S. 2014. Cultural Differences and Geography as Determinants of Online
Prosocial Lending. MIS Quarterly. 38(3) 773–794. A.C. Cameron, Gelbach, J.B., Miller, D.L. 2008. Bootstrap-Based Improvements for Inference with Clustered
Errors. The Review of Economics and Statistics. 90(3) 414-427. A.C. Cameron, Miller, D.L. 2015. A Practitioner s Guide to Cluster-Robust Inference. Journal of Human
Resources. 50(2) 317--372. S. Carnahan. 2013. New Firm Creation following Dissolution of Rival Organizations. Academy of Management
Proceedings. 2013(1) 13104. M.K. Chen, Sheldon, M. 2015. Dynamic pricing in a labor market: Surge pricing and flexible work on the
Uber platform. Working Paper. A. Cheng, Pang, M.-S., Pavlou, P. 2016. On Intelligent Transportation Systems and Road Congestion. J. Chevalier, Goolsbee, A. 2009. Are Durable Goods Consumers Forward-Looking? Evidence from College
Textbooks. The Quarterly Journal of Economics. 124(4) 1853-1884. K.B. Clark, Summers, L.H. 1981. Demographic Differences in Cyclical Employment Variation. Journal of
Human Resources. 16(1) 61-79.
31
R.H. Coase. 1972. Durability and Monopoly. The Journal of Law and Economics. 15(1) 143-149. P. Cohen, Hahn, R., Hall, J., Levitt, S., Metcalfe, R. 2016. Using Big Data to Estimate Consumer Surplus: The Case
of Uber. National Bureau of Economic Research. W. Copulsky. 1976. Cannibalism in the Marketplace. The Journal of Marketing 103-105. J. Cramer, Krueger, A.B. 2016. Disruptive Change in the Taxi Business: The Case of Uber. American Economic
Review. 106(5) 177--182. R. Cui, Li, J., Zhang, D.J. 2016. Discrimination with Incomplete Information in the Sharing Economy: Field
Evidence from Airbnb. B. Danaher, Smith, M.D., Telang, R., Chen, S. 2014. The Effect of Graduated Response Anti‐Piracy Laws
on Music Sales: Evidence from an Event Study in France. The Journal of Industrial Economics. 62(3) 541-553.
A.K. Dills, Mulholland, S.E. 2016. Ride-Sharing, Fatal Crashes, and Crime. A.H. Eagly. 2013. Sex Differences in Social Behavior: A Social-Role Interpretation. Psychology Press. G.M. Eckhardt, Bardhi, F. 2015. The Sharing Economy Isn’t about Sharing at All. Harvard Business Review.
39(4) 881-898. B.G. Edelman, Luca, M., Svirsky, D. 2017. Racial Discrimination in the Sharing Economy: Evidence from a
Field Experiment. American Economic Journal: Applied Economics. 9(2) 1-22. L. Einav, Farronato, C., Levin, J. 2016. Peer-to-Peer Markets. Annual Review of Economics. 8 615--635. J.E. Ellingson, Gruys, M.L., Sackett, P.R. 1998. Factors Related to the Satisfaction and Performance of
Temporary Employees. Journal of Applied Psychology. 83(6) 913. D. Farrell, Greig, F. 2016. Paychecks, Paydays, and the Online Platform Economy: Big Data on Income
Volatility. JP Morgan Chase Institute. A. Fradkin. 2015. Search Frictions and the Design of Online Marketplaces. Working Paper. A. Fradkin, Grewal, E., Holtz, D. 2017. The Determinants of Online Review Informativeness: Evidence from
Field Experiments on Airbnb. Working Paper. A. Fradkin, Grewal, E., Holtz, D., Pearson, M. 2015. Bias and Reciprocity in Online Reviews: Evidence from Field
Experiments on Airbnb. ACM. S.P. Fraiberger, Sundararajan, A. 2015. Peer-to-Peer Rental Markets in the Sharing Economy. Working Paper. M.R. Frone, Russell, M., Cooper, M.L. 1992. Antecedents and Outcomes of Work-Family Conflict: Testing a
Model of the Work-Family Interface. Journal of Applied Psychology. 77(1) 65-78. J. Galluzzo. 2016. How the Gig Economy Is Changing Work for Women.
https://www.entrepreneur.com/article/282693. Y. Ge, Knittel, C.R., MacKenzie, D., Zoepf, S. 2016. Racial and Gender Discrimination in Transportation Network
Companies. National Bureau of Economic Research. A. Ghose. 2009. Internet Exchanges for Used Goods: An Empirical Analysis of Trade Patterns and Adverse
Selection. MIS Quarterly 263-291. A. Ghose, Smith, M.D., Telang, R. 2006. Internet Exchanges for Used Books: An Empirical Analysis of
Product Cannibalization and Welfare Impact. Information Systems Research. 17(1) 3-19. A. Ghose, Telang, R., Krishnan, R. 2005. Effect of Electronic Secondary Markets on the Supply Chain.
Journal of Management Information Systems. 22(2) 91-120. E. Glaeser, Huang, W., Ma, Y., Shleifer, A. 2017. A Real Estate Boom with Chinese Characteristics. Journal of
Economic Perspectives. 31(1) 93-116. B. Greenwood, Agarwal, R. 2016. Matching Platforms and HIV Incidence: An Empirical Investigation of
Race, Gender, and Socio-Economic Status. Management Science. 62(8) 2281-2303. B.N. Greenwood, Wattal, S. 2017. Show Me the Way to Go Home: An Empirical Investigation of Ride
Sharing and Alcohol Related Motor Vehicle Fatalities. MIS Quarterly. 41(1) 163-187. H.R. Greve. 2007. Exploration and Exploitation in Product Innovation. Industrial and Corporate Change. 16(5)
945-975. C. Gundersen, Ziliak, J.P. 2008. The Age Gradient in Food Stamp Program Participation: Does Income
Volatility Matter? Income Volatility and Food Assistance in the United States 171-214. J.V. Hall, Krueger, A.B. 2016. An Analysis of the Labor Market for Uber's Driver-Partners in the United
States. Working Paper.
32
J.J. Horton. 2015. The Tragedy of Your Upstairs Neighbors: Is the Airbnb Negative Externality Internalized? J.J. Horton, Zeckhauser, R.J. 2016. Owning, Using and Renting: Some Simple Economics of the Sharing
Economy. Working Paper. N. Jaimovich, Siu, H.E. 2009. The Young, the Old, and the Restless: Demographics and Business Cycle
Volatility. American Economic Review. 99(3) 804-826. R. Jia. 2014. The Legacies of Forced Freedom: China's Treaty Ports. Review of Economics and Statistics. 96(4)
596-608. B. Jiang, Tian, L. 2016. Collaborative Consumption: Strategic and Economic Implications of Product Sharing.
Management Science. Forthcoming. L.F. Katz, Krueger, A.B. 2016. The Rise and Nature of Alternative Work Arrangements in the United States,
1995-2015. Working Paper. W.R. Kerr, Nanda, R., Rhodes-Kropf, M. 2014. Entrepreneurship as Experimentation. Journal of Economic
Perspectives. 28(3) 25-48. G. Knox, Eliashberg, J. 2009. The Consumer's Rent Vs. Buy Decision in the Rentailer. International Journal of
Research in Marketing. 26(2) 125-135. Z. Li, Hong, Y., Zhang, Z. 2016. An Empirical Analysis of On-Demand Ride Sharing and Traffic Congestion. K.A. Loscocco. 1997. Work-Family Linkages among Self-Employed Women and Men. Journal of Vocational
Behavior. 50(2) 204-226. A. Malhotra, Van Alstyne, M. 2014. The Dark Side of the Sharing Economy… and How to Lighten It.
Communications of the ACM. 57(11) 24-27. F. Manjoo. 2014. With Uber, Less Reason to Own a Car.
https://www.nytimes.com/2014/06/12/technology/personaltech/with-ubers-cars-maybe-we-dont-need-our-own.html.
F. Martin-Buck. 2017. Driving Safety: An Empirical Analysis of Ridesharing’s Impact on Drunk Driving and Alcohol-Related Crime. University of Texas at Austin Working Paper.
C.H. Mason, Milne, G.R. 1994. An Approach for Identifying Cannibalization within Product Line Extensions and Multi-Brand Strategies. Journal of Business Research. 31(2-3) 163-170.
H.L. Miller. 1974. On Killing off the Market for Used Textbooks and the Relationship between Markets for New and Secondhand Goods. Journal of Political Economy. 82(3) 612-619.
C. Murphy. 2016. Shared Mobility and the Transformation of Public Transit. Shared-Use Mobility Center M. Newberg. 2015. Uber May Be Encouraging Delay of Car Purchases: Survey.
http://www.cnbc.com/2015/10/03/uber-may-be-encouraging-delay-of-car-purchases-survey.html. R.B. O’Hara, Kotze, D.J. 2010. Do Not Log‐Transform Count Data. Methods in Ecology and Evolution. 1(2)
118-122. F. Oberholzer-Gee, Strumpf, K. 2007. The Effect of File Sharing on Record Sales An Empirical Analysis.
Journal of Political Economy. 115(1) 1-42. J. Park, Kim, J., Lee, B. 2016. Are Uber Really to Blame for Sexual Assault? Evidence from New York City. ACM. L. Rhue, Clark, J. 2016. Who Gets Started on Kickstarter? Racial Disparities in Crowdfunding Success.
Working Paper. J.-V. Ríos-Rull. 1996. Life-Cycle Economies and Aggregate Fluctuations. The Review of Economic Studies. 63(3)
465-489. J. Rust. 1986. When Is It Optimal to Kill Off the Market for Used Durable Goods? Econometrica. 54(1) 65-86. T. Schaefers, Lawson, S.J., Kukar-Kinney, M. 2016. How the Burdens of Ownership Promote Consumer
Usage of Access-based Services. Marketing Letters. 27(3) 569-577. R. Seamans, Zhu, F. 2013. Responses to Entry in Multi-Sided Markets: The Impact of Craigslist on Local
Newspapers. Management Science. 60(2) 476-493. S.K. Shah, Tripsas, M. 2007. The Accidental Entrepreneur: The Emergent and Collective Process of User
Entrepreneurship. Strategic Entrepreneurship Journal. 1(1‐2) 123-140. J.S. Silva, Tenreyro, S. 2006. The Log of Gravity. The Review of Economics and Statistics. 88(4) 641-658. J.S. Silva, Tenreyro, S. 2011. Further Simulation Evidence on the Performance of the Poisson Pseudo-
Maximum Likelihood Estimator. Economics Letters. 112(2) 220-222.
33
T. Simcoe. 2007. Stata Code for Robust Standard Errors in the Fixed Effects Poisson, June 15, 2012, University.
A. Sundararajan. 2013. From Zipcar to the Sharing Economy. Harvard Business Review. 1. A. Sundararajan. 2014. Peer-to-Peer Businesses and the Sharing (Collaborative) Economy: Overview, Economic Effects and
Regulatory Issues. Available at: http://smallbusiness.house.gov/uploadedfiles/1-15-2014_revised_sundararajan_testimony.pdf.
R.H. Topel, Ward, M.P. 1992. Job Mobility and the Careers of Young Men. The Quarterly Journal of Economics. 107(2) 439-479.
D.V. Wagner, An, F., Wang, C. 2009. Structure and Impacts of Fuel Economy Standards for Passenger Cars in China. Energy Policy. 37(10) 3803-3811.
S. Wallsten. 2015. The Competitive Effects of the Sharing Economy: How is Uber Changing Taxis? Technology Policy Institute. 22.
J. Wooldridge. 1997. Quasi-Likelihood Methods for Count Data. Oxford: Blackwell. M. Wright. 2017. The Gig Economy - A Helpful Spur for Female Entrepreneurs? ,
http://www.huffingtonpost.co.uk/michellewright/the-gig-economy-_b_9235512.html. N. Wu, Zhao, S., Zhang, Q. 2016. A Study on the Determinants of Private Car Ownership in China: Findings
from the Panel Data. Transportation Research Part A: Policy and Practice. 85 186-195. G. Zervas, Proserpio, D., Byers, J.W. 2015. A First Look at Online Reputation on Airbnb, Where Every Stay
is Above Average. Working Paper. G. Zervas, Proserpio, D., Byers, J.W. 2017. The Rise of the Sharing Economy: Estimating the Impact of
Airbnb on the Hotel Industry. Journal of Marketing Research. Forthcoming. S. Zheng, Kahn, M.E. 2017. A New Era of Pollution Progress in Urban China? The Journal of Economic
Perspectives. 31(1) 71-92.
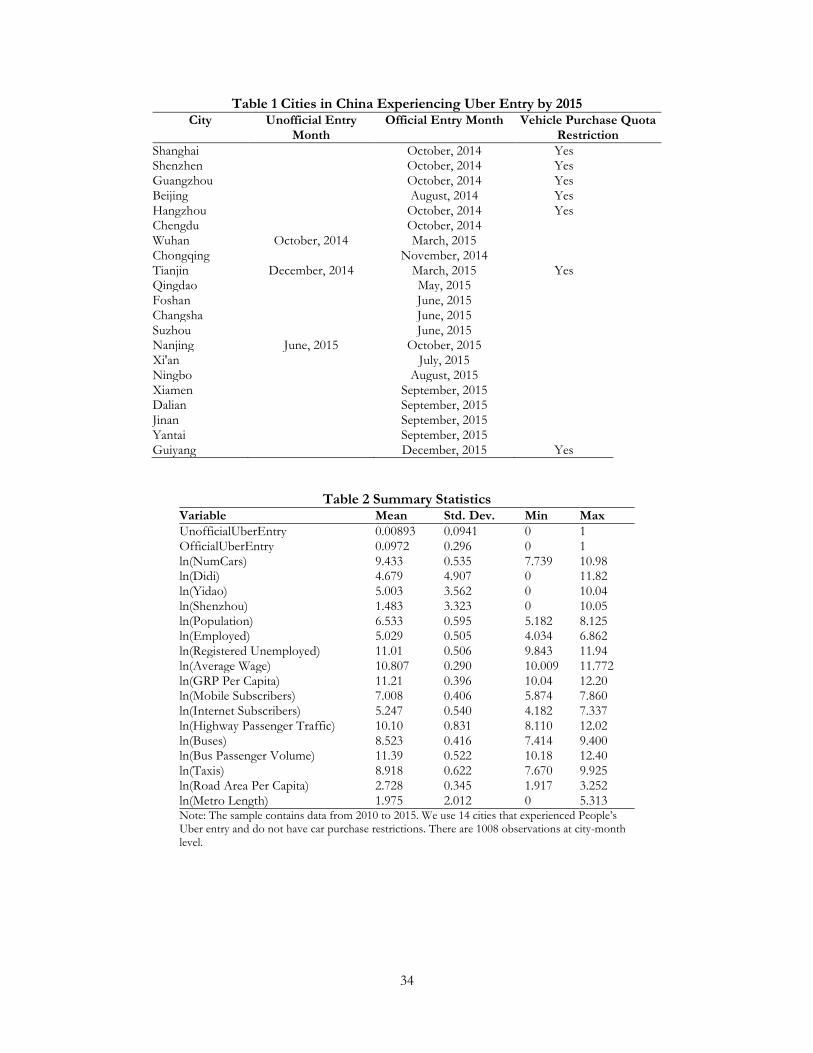
34
Table 1 Cities in China Experiencing Uber Entry by 2015 City Unofficial Entry
Month Official Entry Month Vehicle Purchase Quota
Restriction Shanghai October, 2014 Yes Shenzhen October, 2014 Yes Guangzhou October, 2014 Yes Beijing August, 2014 Yes Hangzhou October, 2014 Yes Chengdu October, 2014 Wuhan October, 2014 March, 2015 Chongqing November, 2014 Tianjin December, 2014 March, 2015 Yes Qingdao May, 2015 Foshan June, 2015 Changsha June, 2015 Suzhou June, 2015 Nanjing June, 2015 October, 2015 Xi'an July, 2015 Ningbo August, 2015 Xiamen September, 2015 Dalian September, 2015 Jinan September, 2015 Yantai September, 2015 Guiyang December, 2015 Yes
Table 2 Summary Statistics Variable Mean Std. Dev. Min Max UnofficialUberEntry 0.00893 0.0941 0 1 OfficialUberEntry 0.0972 0.296 0 1 ln(NumCars) 9.433 0.535 7.739 10.98 ln(Didi) 4.679 4.907 0 11.82 ln(Yidao) 5.003 3.562 0 10.04 ln(Shenzhou) 1.483 3.323 0 10.05 ln(Population) 6.533 0.595 5.182 8.125 ln(Employed) 5.029 0.505 4.034 6.862 ln(Registered Unemployed) 11.01 0.506 9.843 11.94 ln(Average Wage) 10.807 0.290 10.009 11.772 ln(GRP Per Capita) 11.21 0.396 10.04 12.20 ln(Mobile Subscribers) 7.008 0.406 5.874 7.860 ln(Internet Subscribers) 5.247 0.540 4.182 7.337 ln(Highway Passenger Traffic) 10.10 0.831 8.110 12.02 ln(Buses) 8.523 0.416 7.414 9.400 ln(Bus Passenger Volume) 11.39 0.522 10.18 12.40 ln(Taxis) 8.918 0.622 7.670 9.925 ln(Road Area Per Capita) 2.728 0.345 1.917 3.252 ln(Metro Length) 1.975 2.012 0 5.313 Note: The sample contains data from 2010 to 2015. We use 14 cities that experienced People’s Uber entry and do not have car purchase restrictions. There are 1008 observations at city-month level.
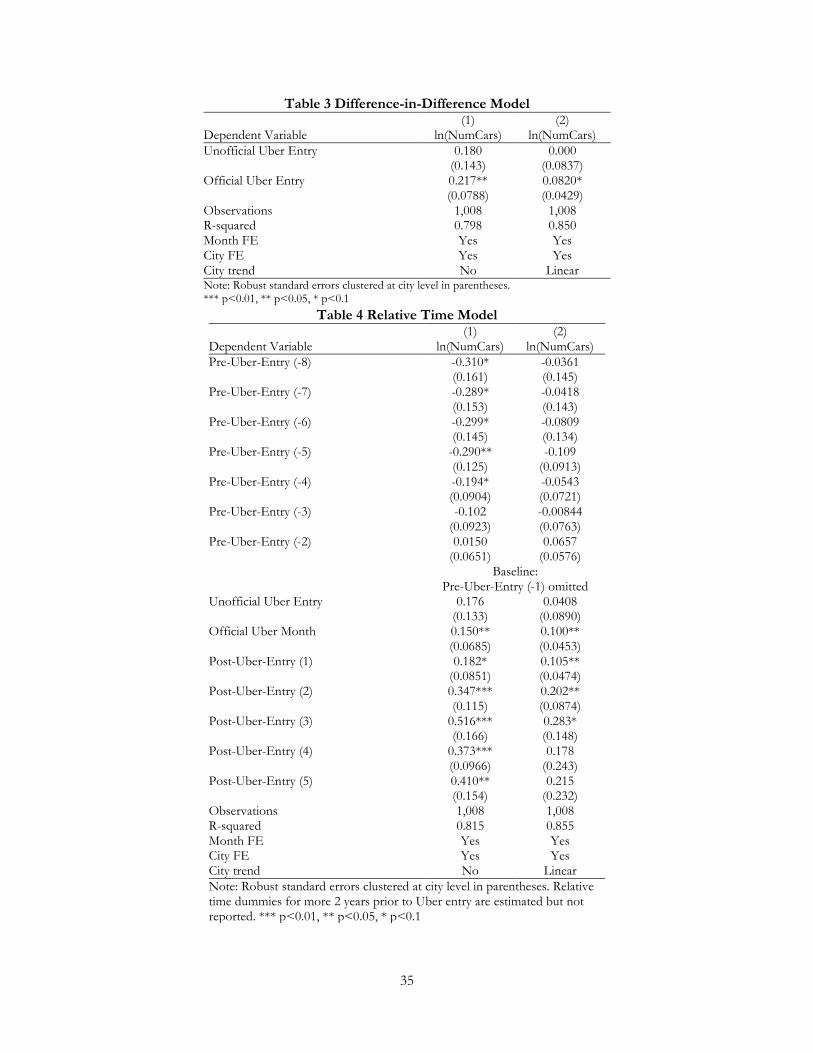
35
Table 3 Difference-in-Difference Model (1) (2) Dependent Variable ln(NumCars) ln(NumCars) Unofficial Uber Entry 0.180 0.000 (0.143) (0.0837) Official Uber Entry 0.217** 0.0820* (0.0788) (0.0429) Observations 1,008 1,008 R-squared 0.798 0.850 Month FE Yes Yes City FE Yes Yes City trend No Linear Note: Robust standard errors clustered at city level in parentheses. *** p<0.01, ** p<0.05, * p<0.1
Table 4 Relative Time Model (1) (2) Dependent Variable ln(NumCars) ln(NumCars) Pre-Uber-Entry (-8) -0.310* -0.0361 (0.161) (0.145) Pre-Uber-Entry (-7) -0.289* -0.0418 (0.153) (0.143) Pre-Uber-Entry (-6) -0.299* -0.0809 (0.145) (0.134) Pre-Uber-Entry (-5) -0.290** -0.109 (0.125) (0.0913) Pre-Uber-Entry (-4) -0.194* -0.0543 (0.0904) (0.0721) Pre-Uber-Entry (-3) -0.102 -0.00844 (0.0923) (0.0763) Pre-Uber-Entry (-2) 0.0150 0.0657 (0.0651) (0.0576)
Baseline:
Pre-Uber-Entry (-1) omitted Unofficial Uber Entry 0.176 0.0408 (0.133) (0.0890) Official Uber Month 0.150** 0.100** (0.0685) (0.0453) Post-Uber-Entry (1) 0.182* 0.105** (0.0851) (0.0474) Post-Uber-Entry (2) 0.347*** 0.202** (0.115) (0.0874) Post-Uber-Entry (3) 0.516*** 0.283* (0.166) (0.148) Post-Uber-Entry (4) 0.373*** 0.178 (0.0966) (0.243) Post-Uber-Entry (5) 0.410** 0.215 (0.154) (0.232) Observations 1,008 1,008 R-squared 0.815 0.855 Month FE Yes Yes City FE Yes Yes City trend No Linear Note: Robust standard errors clustered at city level in parentheses. Relative time dummies for more 2 years prior to Uber entry are estimated but not reported. *** p<0.01, ** p<0.05, * p<0.1
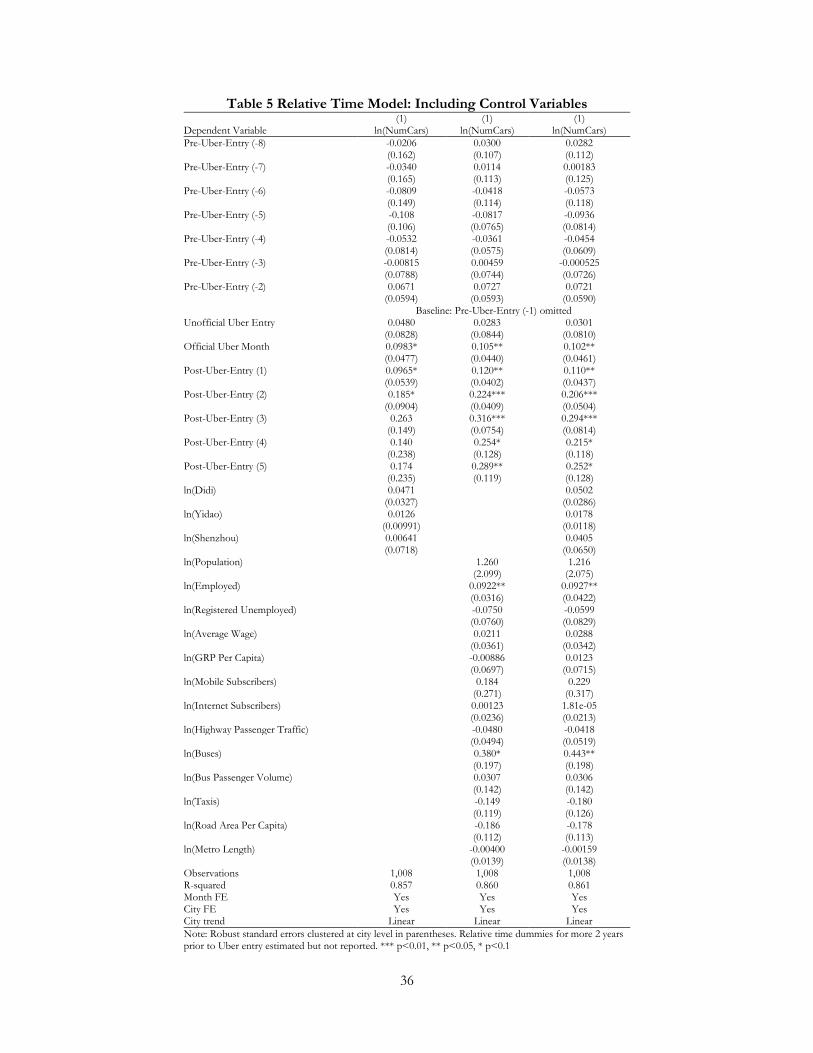
36
Table 5 Relative Time Model: Including Control Variables (1) (1) (1) Dependent Variable ln(NumCars) ln(NumCars) ln(NumCars) Pre-Uber-Entry (-8) -0.0206 0.0300 0.0282 (0.162) (0.107) (0.112) Pre-Uber-Entry (-7) -0.0340 0.0114 0.00183 (0.165) (0.113) (0.125) Pre-Uber-Entry (-6) -0.0809 -0.0418 -0.0573 (0.149) (0.114) (0.118) Pre-Uber-Entry (-5) -0.108 -0.0817 -0.0936 (0.106) (0.0765) (0.0814) Pre-Uber-Entry (-4) -0.0532 -0.0361 -0.0454 (0.0814) (0.0575) (0.0609) Pre-Uber-Entry (-3) -0.00815 0.00459 -0.000525 (0.0788) (0.0744) (0.0726) Pre-Uber-Entry (-2) 0.0671 0.0727 0.0721 (0.0594) (0.0593) (0.0590) Baseline: Pre-Uber-Entry (-1) omitted Unofficial Uber Entry 0.0480 0.0283 0.0301 (0.0828) (0.0844) (0.0810) Official Uber Month 0.0983* 0.105** 0.102** (0.0477) (0.0440) (0.0461) Post-Uber-Entry (1) 0.0965* 0.120** 0.110** (0.0539) (0.0402) (0.0437) Post-Uber-Entry (2) 0.185* 0.224*** 0.206*** (0.0904) (0.0409) (0.0504) Post-Uber-Entry (3) 0.263 0.316*** 0.294*** (0.149) (0.0754) (0.0814) Post-Uber-Entry (4) 0.140 0.254* 0.215* (0.238) (0.128) (0.118) Post-Uber-Entry (5) 0.174 0.289** 0.252* (0.235) (0.119) (0.128) ln(Didi) 0.0471 0.0502 (0.0327) (0.0286) ln(Yidao) 0.0126 0.0178 (0.00991) (0.0118) ln(Shenzhou) 0.00641 0.0405 (0.0718) (0.0650) ln(Population) 1.260 1.216 (2.099) (2.075) ln(Employed) 0.0922** 0.0927** (0.0316) (0.0422) ln(Registered Unemployed) -0.0750 -0.0599 (0.0760) (0.0829) ln(Average Wage) 0.0211 0.0288 (0.0361) (0.0342) ln(GRP Per Capita) -0.00886 0.0123 (0.0697) (0.0715) ln(Mobile Subscribers) 0.184 0.229 (0.271) (0.317) ln(Internet Subscribers) 0.00123 1.81e-05 (0.0236) (0.0213) ln(Highway Passenger Traffic) -0.0480 -0.0418 (0.0494) (0.0519) ln(Buses) 0.380* 0.443** (0.197) (0.198) ln(Bus Passenger Volume) 0.0307 0.0306 (0.142) (0.142) ln(Taxis) -0.149 -0.180 (0.119) (0.126) ln(Road Area Per Capita) -0.186 -0.178 (0.112) (0.113) ln(Metro Length) -0.00400 -0.00159 (0.0139) (0.0138) Observations 1,008 1,008 1,008 R-squared 0.857 0.860 0.861 Month FE Yes Yes Yes City FE Yes Yes Yes City trend Linear Linear Linear Note: Robust standard errors clustered at city level in parentheses. Relative time dummies for more 2 years prior to Uber entry estimated but not reported. *** p<0.01, ** p<0.05, * p<0.1
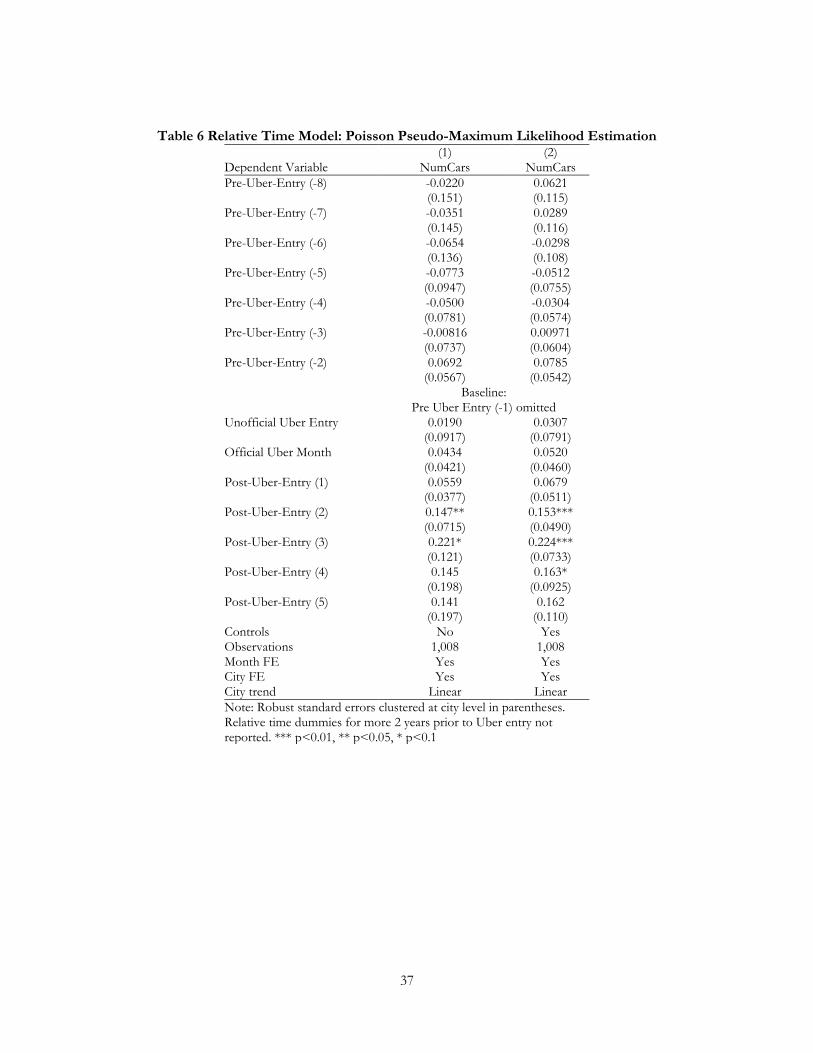
37
Table 6 Relative Time Model: Poisson Pseudo-Maximum Likelihood Estimation (1) (2) Dependent Variable NumCars NumCars Pre-Uber-Entry (-8) -0.0220 0.0621 (0.151) (0.115) Pre-Uber-Entry (-7) -0.0351 0.0289 (0.145) (0.116) Pre-Uber-Entry (-6) -0.0654 -0.0298 (0.136) (0.108) Pre-Uber-Entry (-5) -0.0773 -0.0512 (0.0947) (0.0755) Pre-Uber-Entry (-4) -0.0500 -0.0304 (0.0781) (0.0574) Pre-Uber-Entry (-3) -0.00816 0.00971 (0.0737) (0.0604) Pre-Uber-Entry (-2) 0.0692 0.0785 (0.0567) (0.0542)
Baseline:
Pre Uber Entry (-1) omitted Unofficial Uber Entry 0.0190 0.0307 (0.0917) (0.0791) Official Uber Month 0.0434 0.0520 (0.0421) (0.0460) Post-Uber-Entry (1) 0.0559 0.0679 (0.0377) (0.0511) Post-Uber-Entry (2) 0.147** 0.153*** (0.0715) (0.0490) Post-Uber-Entry (3) 0.221* 0.224*** (0.121) (0.0733) Post-Uber-Entry (4) 0.145 0.163* (0.198) (0.0925) Post-Uber-Entry (5) 0.141 0.162 (0.197) (0.110) Controls No Yes Observations 1,008 1,008 Month FE Yes Yes City FE Yes Yes City trend Linear Linear Note: Robust standard errors clustered at city level in parentheses. Relative time dummies for more 2 years prior to Uber entry not reported. *** p<0.01, ** p<0.05, * p<0.1
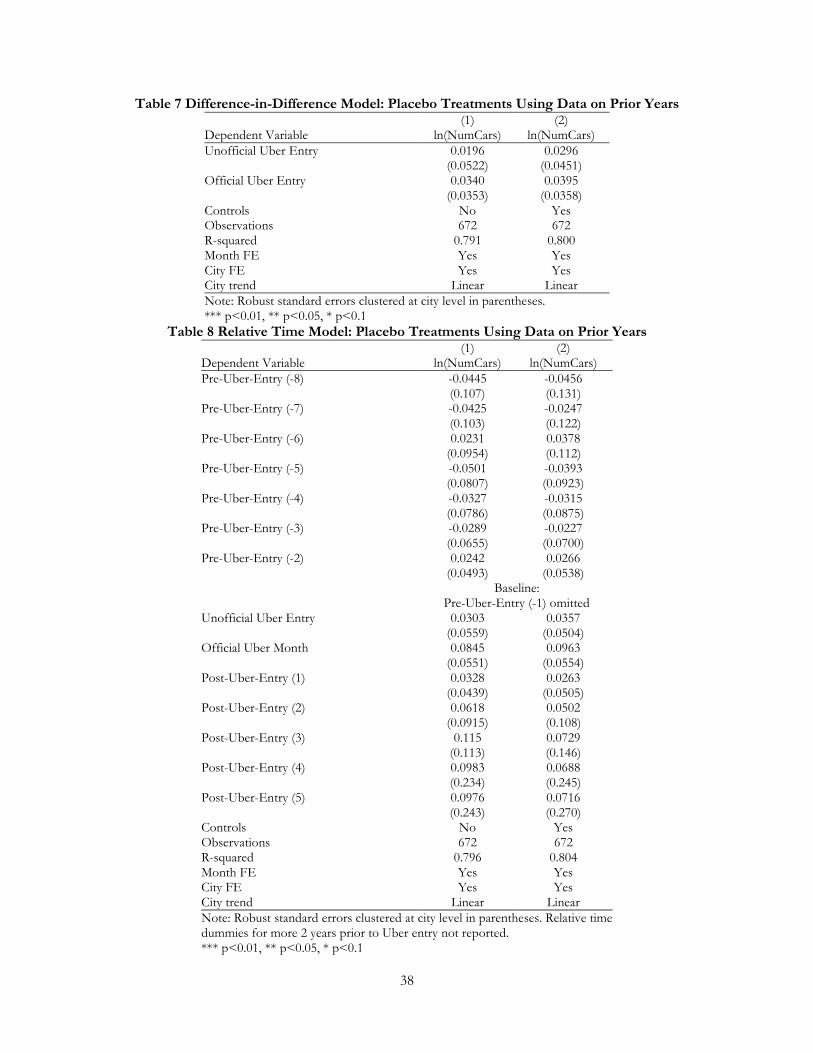
38
Table 7 Difference-in-Difference Model: Placebo Treatments Using Data on Prior Years (1) (2) Dependent Variable ln(NumCars) ln(NumCars) Unofficial Uber Entry 0.0196 0.0296 (0.0522) (0.0451) Official Uber Entry 0.0340 0.0395 (0.0353) (0.0358) Controls No Yes Observations 672 672 R-squared 0.791 0.800 Month FE Yes Yes City FE Yes Yes City trend Linear Linear Note: Robust standard errors clustered at city level in parentheses. *** p<0.01, ** p<0.05, * p<0.1
Table 8 Relative Time Model: Placebo Treatments Using Data on Prior Years (1) (2) Dependent Variable ln(NumCars) ln(NumCars) Pre-Uber-Entry (-8) -0.0445 -0.0456 (0.107) (0.131) Pre-Uber-Entry (-7) -0.0425 -0.0247 (0.103) (0.122) Pre-Uber-Entry (-6) 0.0231 0.0378 (0.0954) (0.112) Pre-Uber-Entry (-5) -0.0501 -0.0393 (0.0807) (0.0923) Pre-Uber-Entry (-4) -0.0327 -0.0315 (0.0786) (0.0875) Pre-Uber-Entry (-3) -0.0289 -0.0227 (0.0655) (0.0700) Pre-Uber-Entry (-2) 0.0242 0.0266 (0.0493) (0.0538)
Baseline:
Pre-Uber-Entry (-1) omitted Unofficial Uber Entry 0.0303 0.0357 (0.0559) (0.0504) Official Uber Month 0.0845 0.0963 (0.0551) (0.0554) Post-Uber-Entry (1) 0.0328 0.0263 (0.0439) (0.0505) Post-Uber-Entry (2) 0.0618 0.0502 (0.0915) (0.108) Post-Uber-Entry (3) 0.115 0.0729 (0.113) (0.146) Post-Uber-Entry (4) 0.0983 0.0688 (0.234) (0.245) Post-Uber-Entry (5) 0.0976 0.0716 (0.243) (0.270) Controls No Yes Observations 672 672 R-squared 0.796 0.804 Month FE Yes Yes City FE Yes Yes City trend Linear Linear Note: Robust standard errors clustered at city level in parentheses. Relative time dummies for more 2 years prior to Uber entry not reported. *** p<0.01, ** p<0.05, * p<0.1
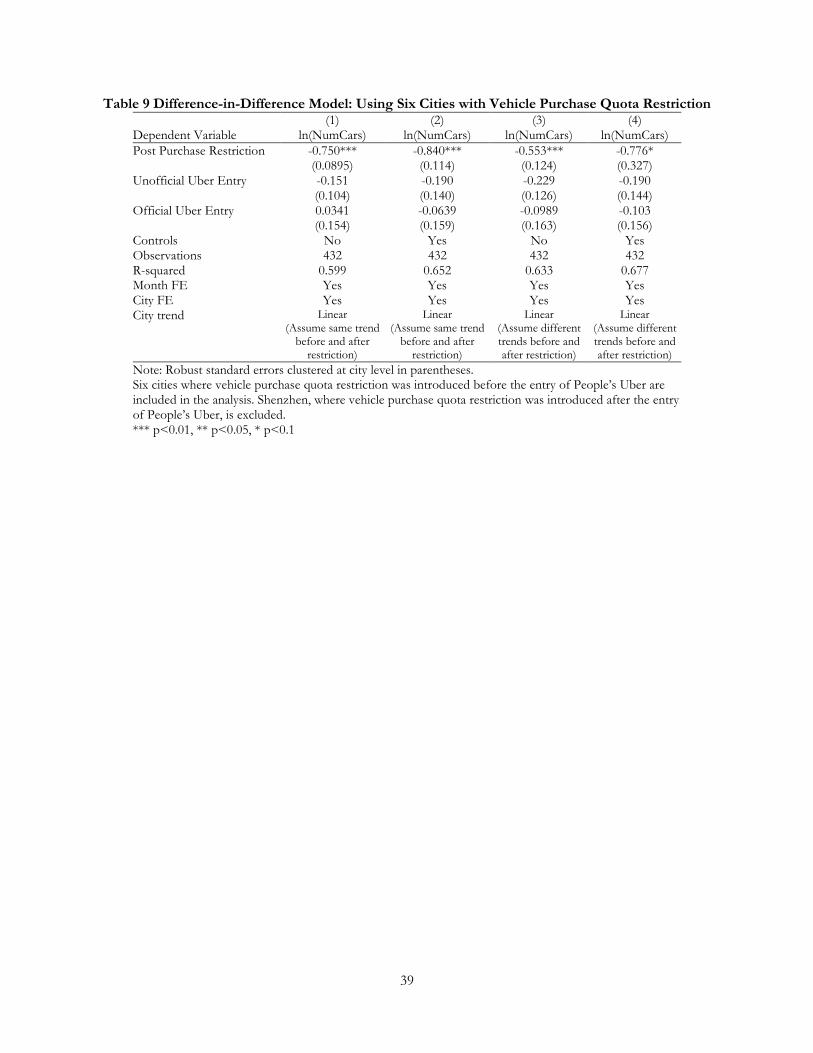
39
Table 9 Difference-in-Difference Model: Using Six Cities with Vehicle Purchase Quota Restriction (1) (2) (3) (4) Dependent Variable ln(NumCars) ln(NumCars) ln(NumCars) ln(NumCars) Post Purchase Restriction -0.750*** -0.840*** -0.553*** -0.776* (0.0895) (0.114) (0.124) (0.327) Unofficial Uber Entry -0.151 -0.190 -0.229 -0.190 (0.104) (0.140) (0.126) (0.144) Official Uber Entry 0.0341 -0.0639 -0.0989 -0.103 (0.154) (0.159) (0.163) (0.156) Controls No Yes No Yes Observations 432 432 432 432 R-squared 0.599 0.652 0.633 0.677 Month FE Yes Yes Yes Yes City FE Yes Yes Yes Yes City trend Linear
(Assume same trend before and after
restriction)
Linear (Assume same trend
before and after restriction)
Linear (Assume different trends before and after restriction)
Linear (Assume different trends before and after restriction)
Note: Robust standard errors clustered at city level in parentheses. Six cities where vehicle purchase quota restriction was introduced before the entry of People’s Uber are included in the analysis. Shenzhen, where vehicle purchase quota restriction was introduced after the entry of People’s Uber, is excluded. *** p<0.01, ** p<0.05, * p<0.1
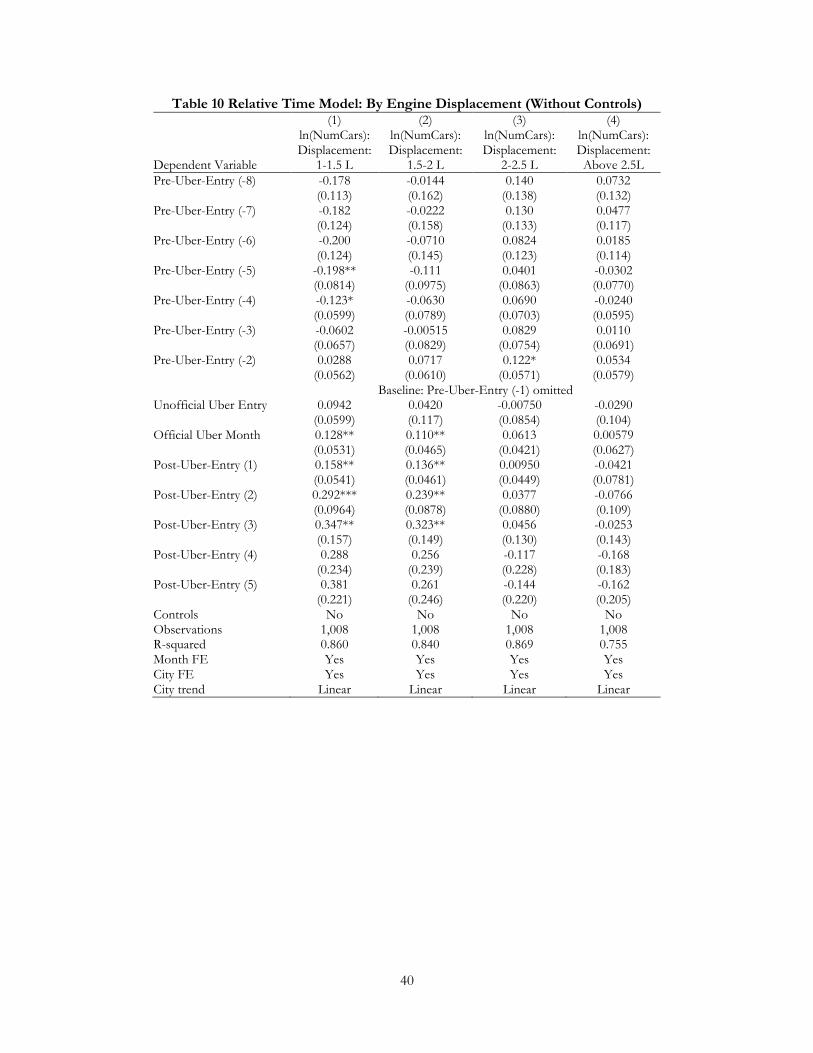
40
Table 10 Relative Time Model: By Engine Displacement (Without Controls) (1) (2) (3) (4) ln(NumCars): ln(NumCars): ln(NumCars): ln(NumCars):
Dependent Variable Displacement:
1-1.5 L Displacement:
1.5-2 L Displacement:
2-2.5 L Displacement: Above 2.5L
Pre-Uber-Entry (-8) -0.178 -0.0144 0.140 0.0732 (0.113) (0.162) (0.138) (0.132) Pre-Uber-Entry (-7) -0.182 -0.0222 0.130 0.0477 (0.124) (0.158) (0.133) (0.117) Pre-Uber-Entry (-6) -0.200 -0.0710 0.0824 0.0185 (0.124) (0.145) (0.123) (0.114) Pre-Uber-Entry (-5) -0.198** -0.111 0.0401 -0.0302 (0.0814) (0.0975) (0.0863) (0.0770) Pre-Uber-Entry (-4) -0.123* -0.0630 0.0690 -0.0240 (0.0599) (0.0789) (0.0703) (0.0595) Pre-Uber-Entry (-3) -0.0602 -0.00515 0.0829 0.0110 (0.0657) (0.0829) (0.0754) (0.0691) Pre-Uber-Entry (-2) 0.0288 0.0717 0.122* 0.0534 (0.0562) (0.0610) (0.0571) (0.0579) Baseline: Pre-Uber-Entry (-1) omitted Unofficial Uber Entry 0.0942 0.0420 -0.00750 -0.0290 (0.0599) (0.117) (0.0854) (0.104) Official Uber Month 0.128** 0.110** 0.0613 0.00579 (0.0531) (0.0465) (0.0421) (0.0627) Post-Uber-Entry (1) 0.158** 0.136** 0.00950 -0.0421 (0.0541) (0.0461) (0.0449) (0.0781) Post-Uber-Entry (2) 0.292*** 0.239** 0.0377 -0.0766 (0.0964) (0.0878) (0.0880) (0.109) Post-Uber-Entry (3) 0.347** 0.323** 0.0456 -0.0253 (0.157) (0.149) (0.130) (0.143) Post-Uber-Entry (4) 0.288 0.256 -0.117 -0.168 (0.234) (0.239) (0.228) (0.183) Post-Uber-Entry (5) 0.381 0.261 -0.144 -0.162 (0.221) (0.246) (0.220) (0.205) Controls No No No No Observations 1,008 1,008 1,008 1,008 R-squared 0.860 0.840 0.869 0.755 Month FE Yes Yes Yes Yes City FE Yes Yes Yes Yes City trend Linear Linear Linear Linear
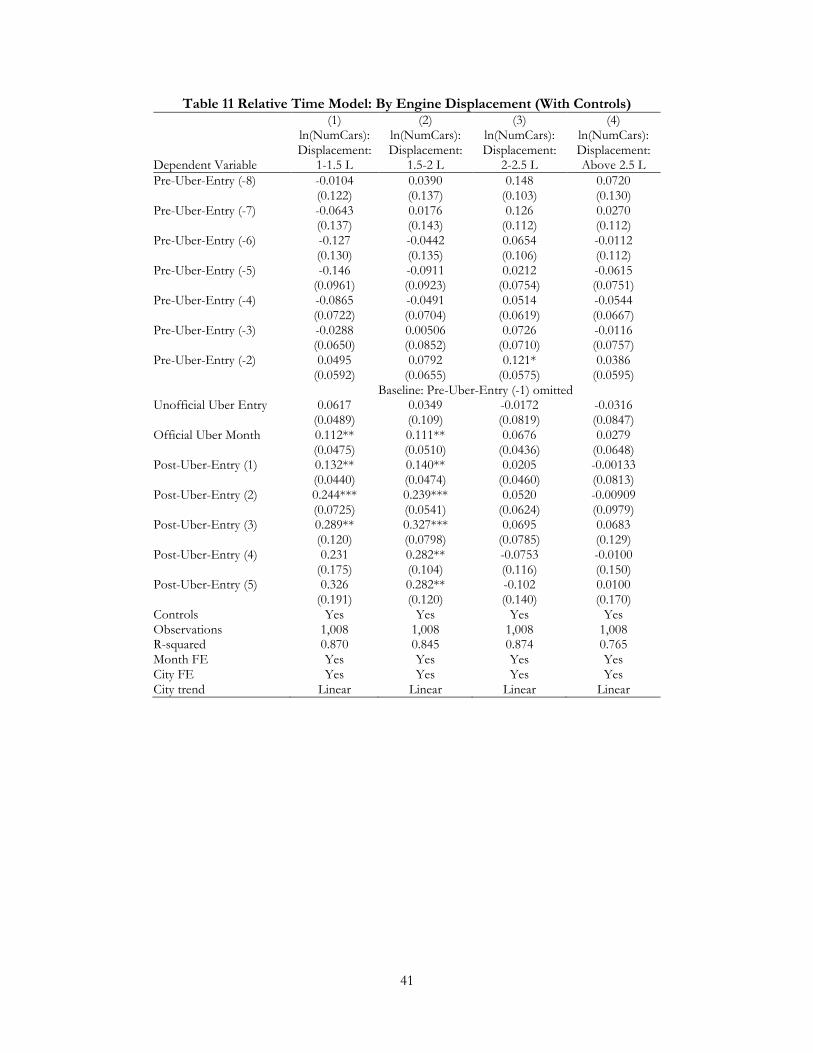
41
Table 11 Relative Time Model: By Engine Displacement (With Controls) (1) (2) (3) (4) ln(NumCars): ln(NumCars): ln(NumCars): ln(NumCars):
Dependent Variable Displacement:
1-1.5 L Displacement:
1.5-2 L Displacement:
2-2.5 L Displacement: Above 2.5 L
Pre-Uber-Entry (-8) -0.0104 0.0390 0.148 0.0720 (0.122) (0.137) (0.103) (0.130) Pre-Uber-Entry (-7) -0.0643 0.0176 0.126 0.0270 (0.137) (0.143) (0.112) (0.112) Pre-Uber-Entry (-6) -0.127 -0.0442 0.0654 -0.0112 (0.130) (0.135) (0.106) (0.112) Pre-Uber-Entry (-5) -0.146 -0.0911 0.0212 -0.0615 (0.0961) (0.0923) (0.0754) (0.0751) Pre-Uber-Entry (-4) -0.0865 -0.0491 0.0514 -0.0544 (0.0722) (0.0704) (0.0619) (0.0667) Pre-Uber-Entry (-3) -0.0288 0.00506 0.0726 -0.0116 (0.0650) (0.0852) (0.0710) (0.0757) Pre-Uber-Entry (-2) 0.0495 0.0792 0.121* 0.0386 (0.0592) (0.0655) (0.0575) (0.0595) Baseline: Pre-Uber-Entry (-1) omitted Unofficial Uber Entry 0.0617 0.0349 -0.0172 -0.0316 (0.0489) (0.109) (0.0819) (0.0847) Official Uber Month 0.112** 0.111** 0.0676 0.0279 (0.0475) (0.0510) (0.0436) (0.0648) Post-Uber-Entry (1) 0.132** 0.140** 0.0205 -0.00133 (0.0440) (0.0474) (0.0460) (0.0813) Post-Uber-Entry (2) 0.244*** 0.239*** 0.0520 -0.00909 (0.0725) (0.0541) (0.0624) (0.0979) Post-Uber-Entry (3) 0.289** 0.327*** 0.0695 0.0683 (0.120) (0.0798) (0.0785) (0.129) Post-Uber-Entry (4) 0.231 0.282** -0.0753 -0.0100 (0.175) (0.104) (0.116) (0.150) Post-Uber-Entry (5) 0.326 0.282** -0.102 0.0100 (0.191) (0.120) (0.140) (0.170) Controls Yes Yes Yes Yes Observations 1,008 1,008 1,008 1,008 R-squared 0.870 0.845 0.874 0.765 Month FE Yes Yes Yes Yes City FE Yes Yes Yes Yes City trend Linear Linear Linear Linear
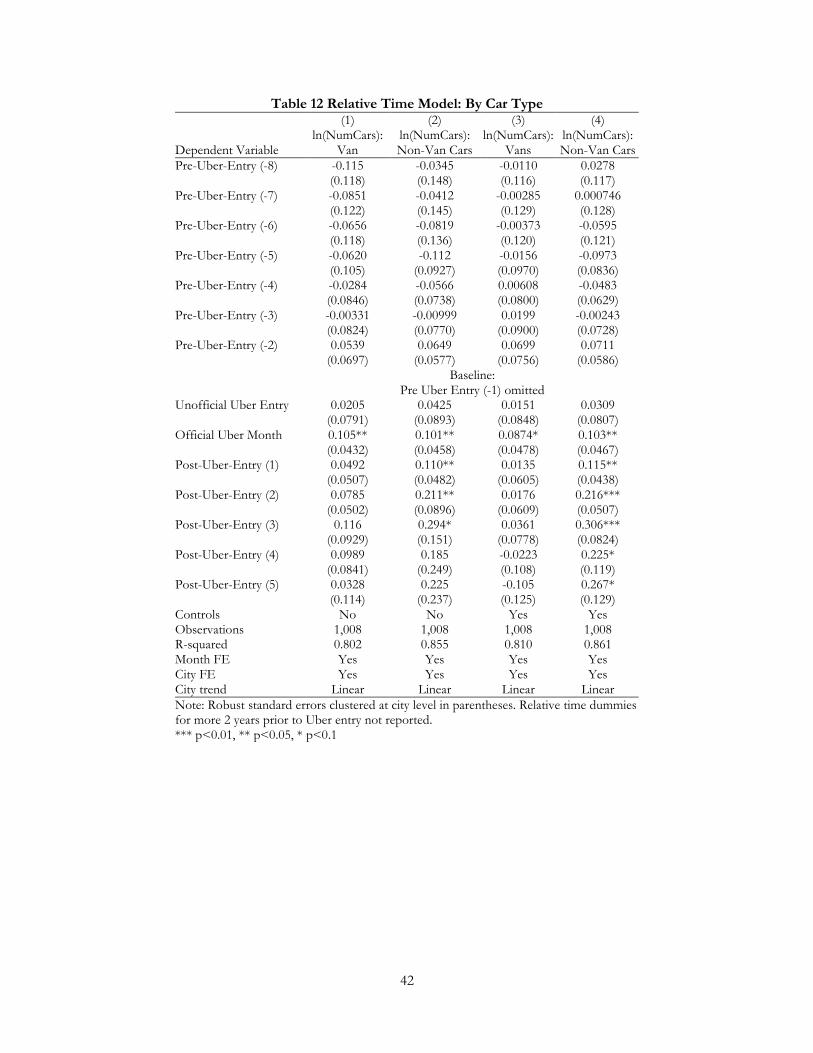
42
Table 12 Relative Time Model: By Car Type (1) (2) (3) (4)
Dependent Variable ln(NumCars):
Van ln(NumCars): Non-Van Cars
ln(NumCars): Vans
ln(NumCars): Non-Van Cars
Pre-Uber-Entry (-8) -0.115 -0.0345 -0.0110 0.0278 (0.118) (0.148) (0.116) (0.117) Pre-Uber-Entry (-7) -0.0851 -0.0412 -0.00285 0.000746 (0.122) (0.145) (0.129) (0.128) Pre-Uber-Entry (-6) -0.0656 -0.0819 -0.00373 -0.0595 (0.118) (0.136) (0.120) (0.121) Pre-Uber-Entry (-5) -0.0620 -0.112 -0.0156 -0.0973 (0.105) (0.0927) (0.0970) (0.0836) Pre-Uber-Entry (-4) -0.0284 -0.0566 0.00608 -0.0483 (0.0846) (0.0738) (0.0800) (0.0629) Pre-Uber-Entry (-3) -0.00331 -0.00999 0.0199 -0.00243 (0.0824) (0.0770) (0.0900) (0.0728) Pre-Uber-Entry (-2) 0.0539 0.0649 0.0699 0.0711 (0.0697) (0.0577) (0.0756) (0.0586)
Baseline:
Pre Uber Entry (-1) omitted Unofficial Uber Entry 0.0205 0.0425 0.0151 0.0309 (0.0791) (0.0893) (0.0848) (0.0807) Official Uber Month 0.105** 0.101** 0.0874* 0.103** (0.0432) (0.0458) (0.0478) (0.0467) Post-Uber-Entry (1) 0.0492 0.110** 0.0135 0.115** (0.0507) (0.0482) (0.0605) (0.0438) Post-Uber-Entry (2) 0.0785 0.211** 0.0176 0.216*** (0.0502) (0.0896) (0.0609) (0.0507) Post-Uber-Entry (3) 0.116 0.294* 0.0361 0.306*** (0.0929) (0.151) (0.0778) (0.0824) Post-Uber-Entry (4) 0.0989 0.185 -0.0223 0.225* (0.0841) (0.249) (0.108) (0.119) Post-Uber-Entry (5) 0.0328 0.225 -0.105 0.267* (0.114) (0.237) (0.125) (0.129) Controls No No Yes Yes Observations 1,008 1,008 1,008 1,008 R-squared 0.802 0.855 0.810 0.861 Month FE Yes Yes Yes Yes City FE Yes Yes Yes Yes City trend Linear Linear Linear Linear Note: Robust standard errors clustered at city level in parentheses. Relative time dummies for more 2 years prior to Uber entry not reported. *** p<0.01, ** p<0.05, * p<0.1

43
Table 13 Relative Time Model: By Gender (1) (2) (3) (4) ln(NumCars): ln(NumCars): ln(NumCars): ln(NumCars): Dependent Variable Female Male Female Male Pre-Uber-Entry (-8) 0.00952 -0.0686 0.120 -0.0205 (0.198) (0.140) (0.129) (0.131) Pre-Uber-Entry (-7) -0.0190 -0.0739 0.0526 -0.0399 (0.164) (0.149) (0.129) (0.146) Pre-Uber-Entry (-6) -0.0521 -0.130 -0.0145 -0.110 (0.154) (0.146) (0.126) (0.138) Pre-Uber-Entry (-5) -0.0732 -0.150 -0.0561 -0.132 (0.102) (0.0960) (0.0837) (0.0926) Pre-Uber-Entry (-4) -0.0124 -0.0848 -0.00751 -0.0700 (0.0683) (0.0849) (0.0554) (0.0745) Pre-Uber-Entry (-3) 0.00153 -0.0163 0.0104 -0.00678 (0.0719) (0.0899) (0.0711) (0.0864) Pre-Uber-Entry (-2) 0.0468 0.0737 0.0526 0.0823 (0.0573) (0.0614) (0.0597) (0.0645)
Baseline:
Pre-Uber-Entry (-1) omitted Unofficial Uber Entry 0.0541 0.0101 0.0255 0.00300 (0.0880) (0.109) (0.0773) (0.0988) Official Uber Month 0.0962* 0.114** 0.0964* 0.111** (0.0454) (0.0462) (0.0448) (0.0485) Post-Uber-Entry (1) 0.0897 0.127** 0.0990* 0.120*** (0.0531) (0.0460) (0.0490) (0.0384) Post-Uber-Entry (2) 0.170* 0.236** 0.184*** 0.219*** (0.0937) (0.0920) (0.0559) (0.0544) Post-Uber-Entry (3) 0.219 0.318* 0.248*** 0.292*** (0.138) (0.161) (0.0720) (0.0885) Post-Uber-Entry (4) 0.0754 0.241 0.151 0.217 (0.236) (0.263) (0.102) (0.138) Post-Uber-Entry (5) 0.0840 0.282 0.168 0.250 (0.234) (0.260) (0.116) (0.151) Controls No No Yes Yes Observations 1,008 1,008 1,008 1,008 R-squared 0.872 0.831 0.880 0.836 Month FE Yes Yes Yes Yes City FE Yes Yes Yes Yes City trend Linear Linear Linear Linear Note: Robust standard errors clustered at city level in parentheses. Relative time dummies for more 2 years prior to Uber entry not reported. *** p<0.01, ** p<0.05, * p<0.1
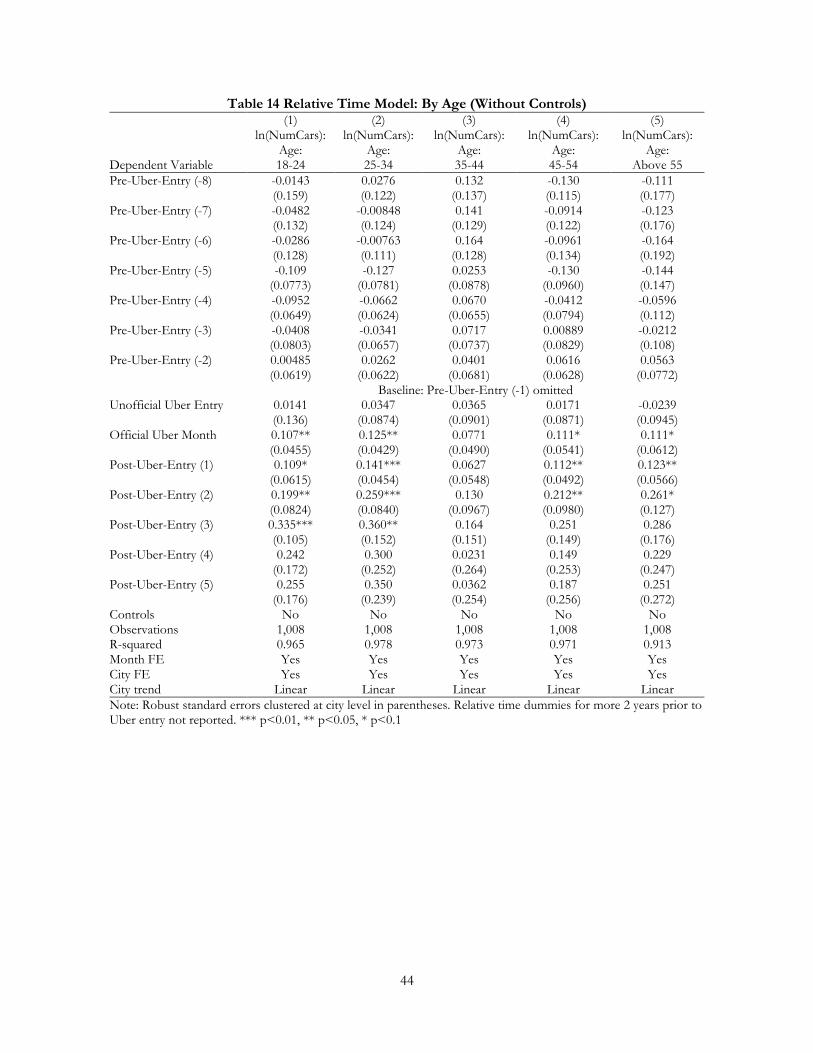
44
Table 14 Relative Time Model: By Age (Without Controls) (1) (2) (3) (4) (5) ln(NumCars): ln(NumCars): ln(NumCars): ln(NumCars): ln(NumCars):
Dependent Variable Age: 18-24
Age: 25-34
Age: 35-44
Age: 45-54
Age: Above 55
Pre-Uber-Entry (-8) -0.0143 0.0276 0.132 -0.130 -0.111 (0.159) (0.122) (0.137) (0.115) (0.177) Pre-Uber-Entry (-7) -0.0482 -0.00848 0.141 -0.0914 -0.123 (0.132) (0.124) (0.129) (0.122) (0.176) Pre-Uber-Entry (-6) -0.0286 -0.00763 0.164 -0.0961 -0.164 (0.128) (0.111) (0.128) (0.134) (0.192) Pre-Uber-Entry (-5) -0.109 -0.127 0.0253 -0.130 -0.144 (0.0773) (0.0781) (0.0878) (0.0960) (0.147) Pre-Uber-Entry (-4) -0.0952 -0.0662 0.0670 -0.0412 -0.0596 (0.0649) (0.0624) (0.0655) (0.0794) (0.112) Pre-Uber-Entry (-3) -0.0408 -0.0341 0.0717 0.00889 -0.0212 (0.0803) (0.0657) (0.0737) (0.0829) (0.108) Pre-Uber-Entry (-2) 0.00485 0.0262 0.0401 0.0616 0.0563 (0.0619) (0.0622) (0.0681) (0.0628) (0.0772) Baseline: Pre-Uber-Entry (-1) omitted Unofficial Uber Entry 0.0141 0.0347 0.0365 0.0171 -0.0239 (0.136) (0.0874) (0.0901) (0.0871) (0.0945) Official Uber Month 0.107** 0.125** 0.0771 0.111* 0.111* (0.0455) (0.0429) (0.0490) (0.0541) (0.0612) Post-Uber-Entry (1) 0.109* 0.141*** 0.0627 0.112** 0.123** (0.0615) (0.0454) (0.0548) (0.0492) (0.0566) Post-Uber-Entry (2) 0.199** 0.259*** 0.130 0.212** 0.261* (0.0824) (0.0840) (0.0967) (0.0980) (0.127) Post-Uber-Entry (3) 0.335*** 0.360** 0.164 0.251 0.286 (0.105) (0.152) (0.151) (0.149) (0.176) Post-Uber-Entry (4) 0.242 0.300 0.0231 0.149 0.229 (0.172) (0.252) (0.264) (0.253) (0.247) Post-Uber-Entry (5) 0.255 0.350 0.0362 0.187 0.251 (0.176) (0.239) (0.254) (0.256) (0.272) Controls No No No No No Observations 1,008 1,008 1,008 1,008 1,008 R-squared 0.965 0.978 0.973 0.971 0.913 Month FE Yes Yes Yes Yes Yes City FE Yes Yes Yes Yes Yes City trend Linear Linear Linear Linear Linear Note: Robust standard errors clustered at city level in parentheses. Relative time dummies for more 2 years prior to Uber entry not reported. *** p<0.01, ** p<0.05, * p<0.1
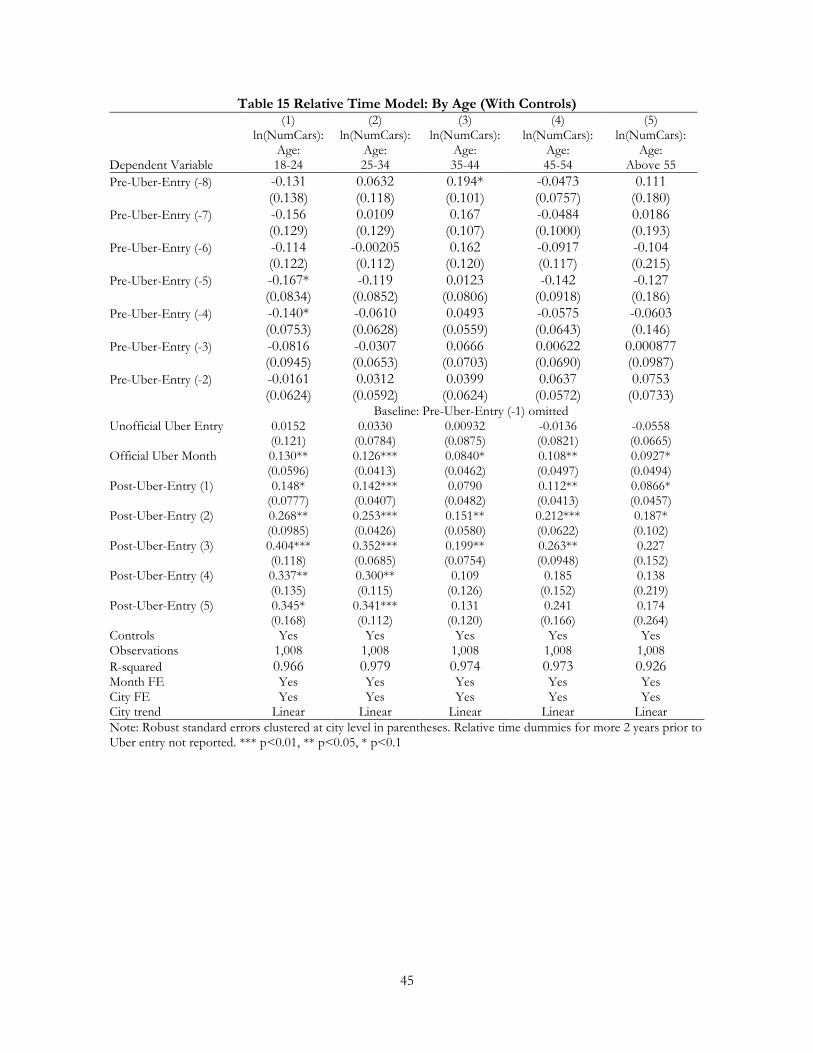
45
Table 15 Relative Time Model: By Age (With Controls) (1) (2) (3) (4) (5) ln(NumCars): ln(NumCars): ln(NumCars): ln(NumCars): ln(NumCars):
Dependent Variable Age: 18-24
Age: 25-34
Age: 35-44
Age: 45-54
Age: Above 55
Pre-Uber-Entry (-8) -0.131 0.0632 0.194* -0.0473 0.111 (0.138) (0.118) (0.101) (0.0757) (0.180) Pre-Uber-Entry (-7) -0.156 0.0109 0.167 -0.0484 0.0186 (0.129) (0.129) (0.107) (0.1000) (0.193) Pre-Uber-Entry (-6) -0.114 -0.00205 0.162 -0.0917 -0.104 (0.122) (0.112) (0.120) (0.117) (0.215) Pre-Uber-Entry (-5) -0.167* -0.119 0.0123 -0.142 -0.127 (0.0834) (0.0852) (0.0806) (0.0918) (0.186) Pre-Uber-Entry (-4) -0.140* -0.0610 0.0493 -0.0575 -0.0603 (0.0753) (0.0628) (0.0559) (0.0643) (0.146) Pre-Uber-Entry (-3) -0.0816 -0.0307 0.0666 0.00622 0.000877 (0.0945) (0.0653) (0.0703) (0.0690) (0.0987) Pre-Uber-Entry (-2) -0.0161 0.0312 0.0399 0.0637 0.0753 (0.0624) (0.0592) (0.0624) (0.0572) (0.0733) Baseline: Pre-Uber-Entry (-1) omitted Unofficial Uber Entry 0.0152 0.0330 0.00932 -0.0136 -0.0558 (0.121) (0.0784) (0.0875) (0.0821) (0.0665) Official Uber Month 0.130** 0.126*** 0.0840* 0.108** 0.0927* (0.0596) (0.0413) (0.0462) (0.0497) (0.0494) Post-Uber-Entry (1) 0.148* 0.142*** 0.0790 0.112** 0.0866* (0.0777) (0.0407) (0.0482) (0.0413) (0.0457) Post-Uber-Entry (2) 0.268** 0.253*** 0.151** 0.212*** 0.187* (0.0985) (0.0426) (0.0580) (0.0622) (0.102) Post-Uber-Entry (3) 0.404*** 0.352*** 0.199** 0.263** 0.227 (0.118) (0.0685) (0.0754) (0.0948) (0.152) Post-Uber-Entry (4) 0.337** 0.300** 0.109 0.185 0.138 (0.135) (0.115) (0.126) (0.152) (0.219) Post-Uber-Entry (5) 0.345* 0.341*** 0.131 0.241 0.174 (0.168) (0.112) (0.120) (0.166) (0.264) Controls Yes Yes Yes Yes Yes Observations 1,008 1,008 1,008 1,008 1,008 R-squared 0.966 0.979 0.974 0.973 0.926 Month FE Yes Yes Yes Yes Yes City FE Yes Yes Yes Yes Yes City trend Linear Linear Linear Linear Linear Note: Robust standard errors clustered at city level in parentheses. Relative time dummies for more 2 years prior to Uber entry not reported. *** p<0.01, ** p<0.05, * p<0.1
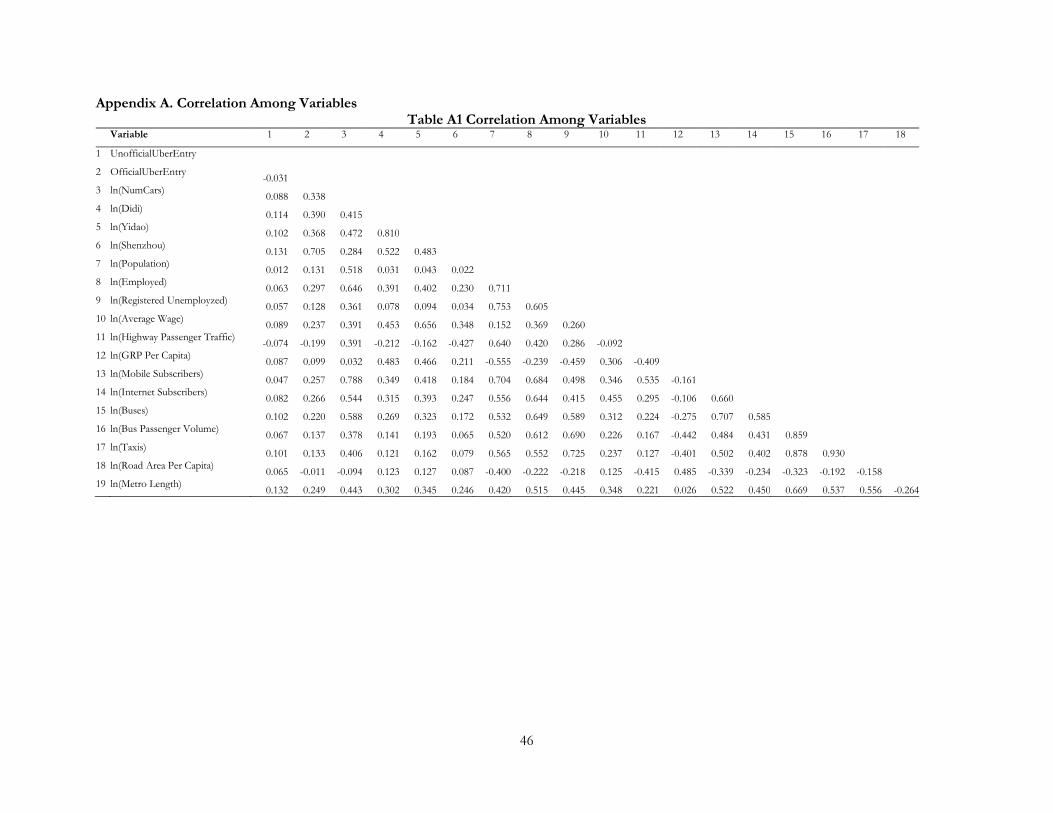
46
Appendix A. Correlation Among Variables Table A1 Correlation Among Variables
Variable 1 2 3 4 5 6 7 8 9 10 11 12 13 14 15 16 17 18
1 UnofficialUberEntry
2 OfficialUberEntry -0.031 3 ln(NumCars) 0.088 0.338 4 ln(Didi) 0.114 0.390 0.415 5 ln(Yidao) 0.102 0.368 0.472 0.810 6 ln(Shenzhou) 0.131 0.705 0.284 0.522 0.483 7 ln(Population) 0.012 0.131 0.518 0.031 0.043 0.022 8 ln(Employed) 0.063 0.297 0.646 0.391 0.402 0.230 0.711 9 ln(Registered Unemployzed) 0.057 0.128 0.361 0.078 0.094 0.034 0.753 0.605 10 ln(Average Wage) 0.089 0.237 0.391 0.453 0.656 0.348 0.152 0.369 0.260 11 ln(Highway Passenger Traffic) -0.074 -0.199 0.391 -0.212 -0.162 -0.427 0.640 0.420 0.286 -0.092 12 ln(GRP Per Capita) 0.087 0.099 0.032 0.483 0.466 0.211 -0.555 -0.239 -0.459 0.306 -0.409 13 ln(Mobile Subscribers) 0.047 0.257 0.788 0.349 0.418 0.184 0.704 0.684 0.498 0.346 0.535 -0.161 14 ln(Internet Subscribers) 0.082 0.266 0.544 0.315 0.393 0.247 0.556 0.644 0.415 0.455 0.295 -0.106 0.660 15 ln(Buses) 0.102 0.220 0.588 0.269 0.323 0.172 0.532 0.649 0.589 0.312 0.224 -0.275 0.707 0.585 16 ln(Bus Passenger Volume) 0.067 0.137 0.378 0.141 0.193 0.065 0.520 0.612 0.690 0.226 0.167 -0.442 0.484 0.431 0.859 17 ln(Taxis) 0.101 0.133 0.406 0.121 0.162 0.079 0.565 0.552 0.725 0.237 0.127 -0.401 0.502 0.402 0.878 0.930 18 ln(Road Area Per Capita) 0.065 -0.011 -0.094 0.123 0.127 0.087 -0.400 -0.222 -0.218 0.125 -0.415 0.485 -0.339 -0.234 -0.323 -0.192 -0.158 19 ln(Metro Length) 0.132 0.249 0.443 0.302 0.345 0.246 0.420 0.515 0.445 0.348 0.221 0.026 0.522 0.450 0.669 0.537 0.556 -0.264
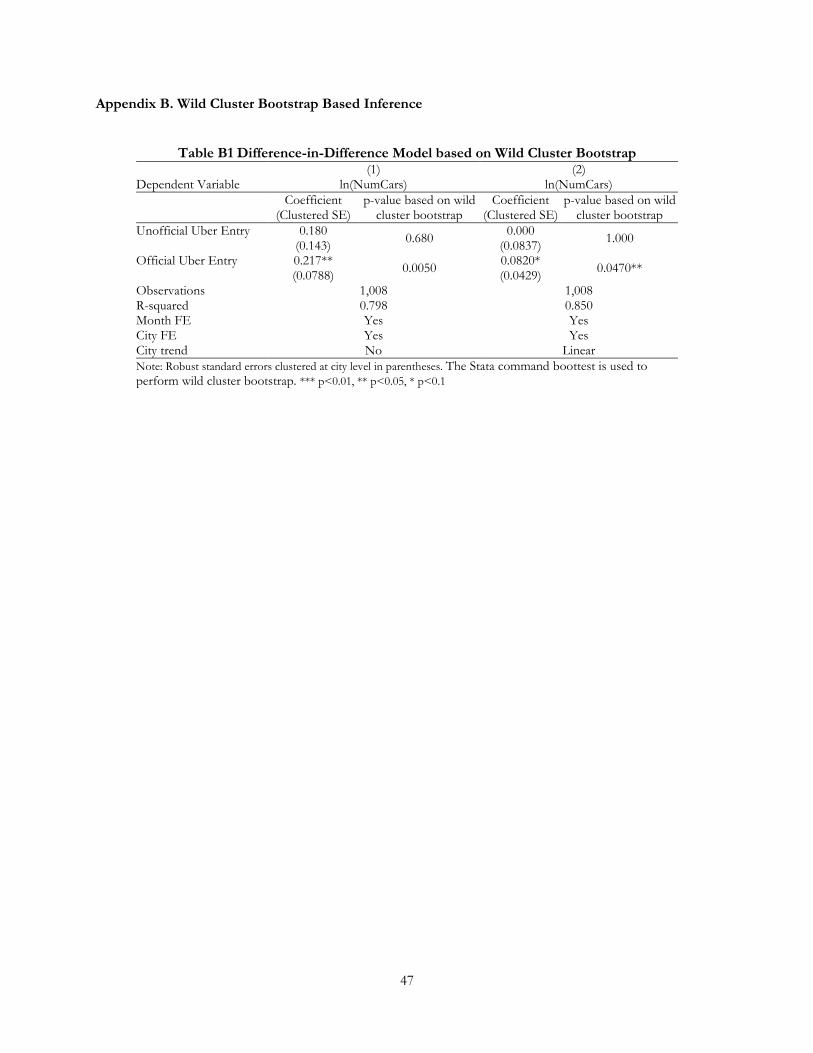
47
Appendix B. Wild Cluster Bootstrap Based Inference
Table B1 Difference-in-Difference Model based on Wild Cluster Bootstrap (1) (2) Dependent Variable ln(NumCars) ln(NumCars)
Coefficient
(Clustered SE) p-value based on wild
cluster bootstrap Coefficient
(Clustered SE) p-value based on wild
cluster bootstrap Unofficial Uber Entry 0.180 0.680 0.000 1.000 (0.143) (0.0837) Official Uber Entry 0.217** 0.0050 0.0820* 0.0470** (0.0788) (0.0429) Observations 1,008 1,008 R-squared 0.798 0.850 Month FE Yes Yes City FE Yes Yes City trend No Linear Note: Robust standard errors clustered at city level in parentheses. The Stata command boottest is used to perform wild cluster bootstrap. *** p<0.01, ** p<0.05, * p<0.1
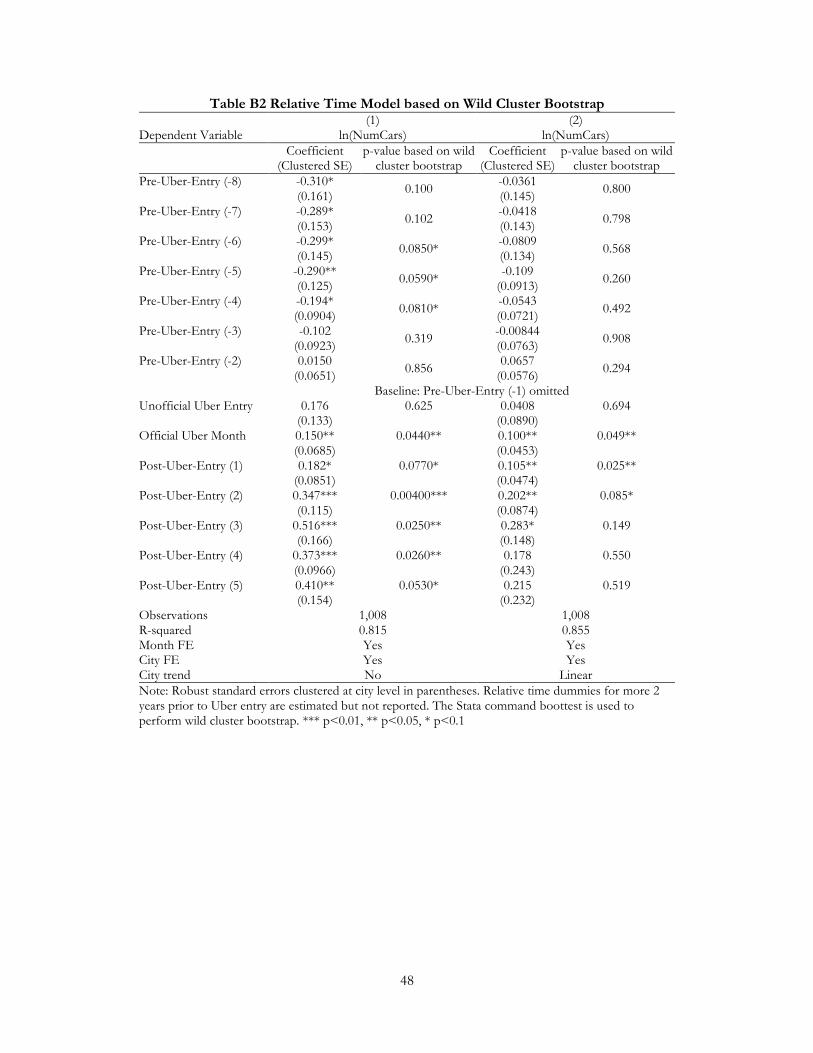
48
Table B2 Relative Time Model based on Wild Cluster Bootstrap (1) (2) Dependent Variable ln(NumCars) ln(NumCars)
Coefficient
(Clustered SE) p-value based on wild
cluster bootstrap Coefficient
(Clustered SE) p-value based on wild
cluster bootstrap Pre-Uber-Entry (-8) -0.310* 0.100 -0.0361 0.800 (0.161) (0.145) Pre-Uber-Entry (-7) -0.289* 0.102 -0.0418 0.798 (0.153) (0.143) Pre-Uber-Entry (-6) -0.299* 0.0850* -0.0809 0.568 (0.145) (0.134) Pre-Uber-Entry (-5) -0.290** 0.0590* -0.109 0.260 (0.125) (0.0913) Pre-Uber-Entry (-4) -0.194* 0.0810* -0.0543 0.492 (0.0904) (0.0721) Pre-Uber-Entry (-3) -0.102 0.319 -0.00844 0.908 (0.0923) (0.0763) Pre-Uber-Entry (-2) 0.0150 0.856 0.0657 0.294 (0.0651) (0.0576) Baseline: Pre-Uber-Entry (-1) omitted Unofficial Uber Entry 0.176 0.625 0.0408 0.694 (0.133) (0.0890) Official Uber Month 0.150** 0.0440** 0.100** 0.049** (0.0685) (0.0453) Post-Uber-Entry (1) 0.182* 0.0770* 0.105** 0.025** (0.0851) (0.0474) Post-Uber-Entry (2) 0.347*** 0.00400*** 0.202** 0.085* (0.115) (0.0874) Post-Uber-Entry (3) 0.516*** 0.0250** 0.283* 0.149 (0.166) (0.148) Post-Uber-Entry (4) 0.373*** 0.0260** 0.178 0.550 (0.0966) (0.243) Post-Uber-Entry (5) 0.410** 0.0530* 0.215 0.519 (0.154) (0.232) Observations 1,008 1,008 R-squared 0.815 0.855 Month FE Yes Yes City FE Yes Yes City trend No Linear Note: Robust standard errors clustered at city level in parentheses. Relative time dummies for more 2 years prior to Uber entry are estimated but not reported. The Stata command boottest is used to perform wild cluster bootstrap. *** p<0.01, ** p<0.05, * p<0.1