ubs equity trust, growth stock series 22 (the information...
TRANSCRIPT

Dear Valued Client:
This annual statement contains importantinformation about your investment.
The UBS Unit Trust thanks you for making thisGrowth Stock Trust a part of your financial plan. Ifyou have any questions, your Financial Advisor isthere to help you. You may also call the Trustee at1-800-356-2754.
The Sponsor has created over $10 Billion in UnitTrust Investments since 1966 and created the firstGrowth Stock Series back in 1986. Thedependability and professional selection that youenjoyed in this Fund are also available in our othertypes of sponsored and co-sponsored unit trusts. Foradditional information, consult your FinancialAdvisor or visit: www.ubs.com/UIT.
Distribution(s) from the Income Account
Year paid: 1999 0.016132000 0.059982001 0.036712002 0.051602003 0.08642
Distribution(s) from the Capital Account
Year paid: 1999 0.109312000 0.093102001 0.288512002 0.34710
UBS Equity Trust, GrowthStock Series 22 (TheInformation Revolution Wars)
Investment Objective
To provide for capital appreciation through aninvestment in equity stocks which have, in theSponsor’s opinion on the Date of Deposit, anabove-average potential for capital appreciation.
Year-End Per Unit Values
As of December 31, 2003:
Net Asset Value $7.78620
Fund Performance*
Since Trust Inception (05/19/99):
Total Return -11.25%
Average Annualized Total Return -2.55%
One Year Ended (12-31-03):
Total Return + 42.64%
* Total return calculations assume units were purchasedat original offering price including maximum sales charge.If applicable, one year performance is gross return.Calculations do not assume any reinvestment of distributions.Past performance is not indicative of future results.
The information presented on page one of this statement was prepared by the Sponsor. The Trustee cannot makeany representation as to the completeness or accuracy of the Sponsor’s information. This information is providedto holders of this Series, and is not authorized for distribution to prospective investors.

UBS EQUITY TRUSTGROWTH STOCK SERIES 22
2003 Annual Report
Income Account Summary
Balance, January 1, 2003 . . . . . . . . . . . . . . . . . . . . . . . . . . . . . . . . . . . . . . . . . . . . . . . . . . . . . . . $ 74,636.26Income received
Interest . . . . . . . . . . . . . . . . . . . . . . . . . . . . . . . . . . . . . . . . . . . . . . $ 0.00Dividends. . . . . . . . . . . . . . . . . . . . . . . . . . . . . . . . . . . . . . . . . . . . . 905,188.75Other. . . . . . . . . . . . . . . . . . . . . . . . . . . . . . . . . . . . . . . . . . . . . . . . 24.88 905,213.63
Expenses paidTrustee fee and expenses . . . . . . . . . . . . . . . . . . . . . . . . . . . . . . . . . $(137,262.30)Evaluator fee . . . . . . . . . . . . . . . . . . . . . . . . . . . . . . . . . . . . . . . . . . 0.00Sponsor fee . . . . . . . . . . . . . . . . . . . . . . . . . . . . . . . . . . . . . . . . . . . (30,818.68)Other. . . . . . . . . . . . . . . . . . . . . . . . . . . . . . . . . . . . . . . . . . . . . . . . (21,789.72) (189,870.70)
4. Plus Balance in account as of close of preceeding yearReceived . . . . . . . . . . . . . . . . . . . . . . . . . . . . . . . . . . . . . . . . . . . . . $ 0.00Repaid. . . . . . . . . . . . . . . . . . . . . . . . . . . . . . . . . . . . . . . . . . . . . . . 0.00 0.00
Transfers from (to) capital cash . . . . . . . . . . . . . . . . . . . . . . . . . . . . . . . . . . . . . . . . . . . . . . . . . . . 0.00
Purchased Interest . . . . . . . . . . . . . . . . . . . . . . . . . . . . . . . . . . . . . . . . . . . . . . . . . . . . . . . . . . . . 0.00
Available for distribution . . . . . . . . . . . . . . . . . . . . . . . . . . . . . . . . . . . . . . . . . . . . . . . . . . . . . . . . $ 789,979.19Distributions paid
To unitholders. . . . . . . . . . . . . . . . . . . . . . . . . . . . . . . . . . . . . . . . . . $(662,160.80)On redemption of units . . . . . . . . . . . . . . . . . . . . . . . . . . . . . . . . . . . (21,893.85) (684,054.65)
Balance, December 31, 2003 . . . . . . . . . . . . . . . . . . . . . . . . . . . . . . . . . . . . . . . . . . . . . . . . . . . . $ 105,924.54
Income cash per unit. . . . . . . . . . . . . . . . . . . . . . . . . . . . . . . . . . . . . . . . . . . . . . . . . . . . . . . $.0146
Distribution(s) from the Income AccountDate Paid Amount Per Unit
03/03 . . . . . . . . . . . . . . . . . . . . . . . . . . . . . . . . . . . . . . . . . . . . . . . . . . . $ 87,576.57 $ .0103606/03 . . . . . . . . . . . . . . . . . . . . . . . . . . . . . . . . . . . . . . . . . . . . . . . . . . . 85,685.73 .0106209/03 . . . . . . . . . . . . . . . . . . . . . . . . . . . . . . . . . . . . . . . . . . . . . . . . . . . 97,658.57 .0125912/03 . . . . . . . . . . . . . . . . . . . . . . . . . . . . . . . . . . . . . . . . . . . . . . . . . . . 391,239.93 .05285
$662,160.80 $0.08642
01092

Capital Account Summary
Balance, January 1, 2003 . . . . . . . . . . . . . . . . . . . . . . . . . . . . . . . . . . . . . . . . . . . . . . . . . . . $ 471,481.90Proceeds received from portfolio transactions . . . . . . . . . . . . . . . . . . . . . . . . . . . . . . . . . . . . . 10,556,560.22Receipts from Supplemental Deposits. . . . . . . . . . . . . . . . . . . . . . . . . . . . . . . . . . . . . . . . . . . 23,556.41Funds used for purchase of securities. . . . . . . . . . . . . . . . . . . . . . . . . . . . . . . . . . . . . . . . . . . (506,508.95)Redemption of 1,572,500 units. . . . . . . . . . . . . . . . . . . . . . . . . . . . . . . . . . . . . . . . . . . . . . . . (10,183,789.65)Transfer from (to) income cash . . . . . . . . . . . . . . . . . . . . . . . . . . . . . . . . . . . . . . . . . . . . . . . 0.00
Available for distribution. . . . . . . . . . . . . . . . . . . . . . . . . . . . . . . . . . . . . . . . . . . . . . . . . . . . . $ 361,299.93Distributions . . . . . . . . . . . . . . . . . . . . . . . . . . . . . . . . . . . . . . . . . . . . . . . . . . . . . . . . . . . . . 0.00
Distributions to Sponsor for Creation and Development Fee . . . . . . . . . . . . . . . . . . . . . . . . . . . 0.00Distributions to Sponsor for Deferred Sales Charge . . . . . . . . . . . . . . . . . . . . . . . . . . . . . . . . . 0.00Balance, December 31, 2003. . . . . . . . . . . . . . . . . . . . . . . . . . . . . . . . . . . . . . . . . . . . . . . . . $ 361,299.93
Capital cash per unit . . . . . . . . . . . . . . . . . . . . . . . . . . . . . . . . . . . . . . . . . . . . . . . . . . . $.0499
Cash Capital Changes
Date SecurityShare
Amount Proceeds Transaction
03/14/03 AMR Corp . . . . . . . . . . . . . . . . . . . . . . 17,502.000 $ 32,727.74 Sale of security per TrustIndenture
06/19/03 Priceline.Com Inc . . . . . . . . . . . . . . . . . 0.497 11.82 Sale of fractional share07/03/03 Lillian Vernon Corp . . . . . . . . . . . . . . . . 45,974.000 333,311.50 Cash Merger: Received $7.25 for
each share Lillian VernonCorporation held
12/23/03 Spiegel Inc Cl A . . . . . . . . . . . . . . . . . . 136,629.000 2,732.26 Sale of security per TrustIndenture
$368,783.32
Non-Cash Capital Changes
Date SecurityShare
Amount Transaction
02/18/03 Microsoft Corp . . . . . . . . . . . . . . . . . . . . 16,879.000 2:1 Stock Split
04/21/03 Carnival Corp. . . . . . . . . . . . . . . . . . . . . 29,460.000 Name Change: Formerly Carnival Corp.
06/16/03 Priceline.Com Inc . . . . . . . . . . . . . . . . . . 1,459.497 1:6 Reverse Stock Split
07/22/03 Dell Inc . . . . . . . . . . . . . . . . . . . . . . . . . 27,631.000 Name Change: Formerly Dell ComputerCorp.
08/29/03 eBay Inc . . . . . . . . . . . . . . . . . . . . . . . . 12,420.000 2:1 Stock Split
10/16/03 Time Warner Inc (Formerly AOL TimeWarner Inc) . . . . . . . . . . . . . . . . . . . . 41,841.000 Name Change: Formerly AOL Time
Warner

Portfolio TransactionsJanuary 8 January 16 January 30
SecurityShares orPar Value Proceeds
Shares orPar Value Proceeds
Shares orPar Value Proceeds
AMB Property Corp . . . . . . . . . . . . . . . 408 11,174.78 285 7,760.31 398 10,602.40AMR Corp . . . . . . . . . . . . . . . . . . . . . . 123 832.68 86 556.40 120 374.38AOL Time Warner Inc . . . . . . . . . . . . . . 321 4,359.04 225 3,398.90 313 4,244.15AT&T Corp. . . . . . . . . . . . . . . . . . . . . . 30 829.47 21 572.02 30 582.28AT&T Wireless Services Inc . . . . . . . . . . 49 305.75 34 244.45 48 313.43Abercrombie & Fitch Co . . . . . . . . . . . . 222 4,766.19 156 4,118.27 217 5,546.35Agere Systems Inc- Cl A . . . . . . . . . . . . 2 2.71 2 3.39 2 3.13Agere Systems Inc- Cl B . . . . . . . . . . . . 39 51.86 28 45.35 38 58.13Allstate Corp . . . . . . . . . . . . . . . . . . . . 245 9,285.22 172 6,506.56 239 8,142.48Amazon.com Inc . . . . . . . . . . . . . . . . . . 140 2,750.91 98 2,132.80 137 2,972.81AnnTaylor Stores, Inc . . . . . . . . . . . . . . 307 6,462.15 215 4,465.41 299 5,363.89Avaya Inc . . . . . . . . . . . . . . . . . . . . . . 13 33.40 9 23.39 12 31.43Bank of New York Co Inc . . . . . . . . . . . 251 6,352.61 176 4,713.13 245 6,190.96Berkshire Hathaway Inc - Cl B . . . . . . . . 4 9,551.59 3 7,022.69 4 8,959.61Carnival Corp . . . . . . . . . . . . . . . . . . . . 210 5,361.13 147 3,661.65 205 4,948.55Cisco Systems Inc . . . . . . . . . . . . . . . . 304 4,174.70 213 3,249.04 296 4,037.69Citigroup Inc . . . . . . . . . . . . . . . . . . . . 281 10,143.79 197 7,379.39 274 9,518.47Clear Channel Communications Inc . . . . 129 5,051.48 90 3,913.08 125 4,864.85Comcast Corp - Cl A . . . . . . . . . . . . . . . 49 1,194.09 34 938.37 48 1,231.64Costco Wholesale Corp . . . . . . . . . . . . . 234 6,673.47 164 5,030.84 228 6,513.76Dell Computer Corp . . . . . . . . . . . . . . . 205 5,633.13 143 3,718.04 199 4,763.91The Walt Disney Co . . . . . . . . . . . . . . . 310 5,348.88 217 3,981.82 302 4,994.92EastGroup Properties Inc . . . . . . . . . . . 461 11,837.34 323 8,123.65 450 10,829.64eBay Inc . . . . . . . . . . . . . . . . . . . . . . . 94 6,509.30 65 4,804.72 91 6,766.63Fedex Corporation . . . . . . . . . . . . . . . . 152 8,428.14 106 6,092.69 148 7,669.12The Gap Inc . . . . . . . . . . . . . . . . . . . . . 219 3,455.71 154 2,390.00 214 3,017.30Gucci Group . . . . . . . . . . . . . . . . . . . . 141 12,949.05 99 9,174.05 138 12,877.77Home Depot Inc . . . . . . . . . . . . . . . . . . 228 4,924.65 160 3,489.49 222 4,570.84International Business Machines Corp . . 70 5,678.92 49 4,319.21 68 5,320.83Estee Lauder Companies - Cl A . . . . . . . 199 5,374.82 139 3,597.21 194 5,071.00Level 3 Communications Inc . . . . . . . . . 105 495.58 74 395.89 103 492.32Lexmark International Group Inc . . . . . . 140 8,776.33 98 6,144.41 137 8,174.54Lillian Vernon Corp . . . . . . . . . . . . . . . . 339 1,383.07 238 1,028.12 331 1,419.94Limited Brands . . . . . . . . . . . . . . . . . . . 426 5,674.14 298 4,070.55 416 5,145.76Lowe’s Companies Inc . . . . . . . . . . . . . 339 12,413.80 237 9,073.43 331 11,369.50Lucent Technologies Inc . . . . . . . . . . . . 152 214.31 106 187.61 148 264.91Mattel Inc . . . . . . . . . . . . . . . . . . . . . . . 351 6,935.55 246 4,973.97 342 6,761.13Merrill Lynch & Co Inc . . . . . . . . . . . . . . 234 9,315.25 164 7,056.70 228 8,116.55Microsoft Corp . . . . . . . . . . . . . . . . . . . 117 6,218.36 82 4,623.02 114 5,563.03Morgan Stanley . . . . . . . . . . . . . . . . . . 187 7,782.70 131 5,742.86 182 6,839.35Nationwide Financial Services Inc -A . . . 199 5,981.75 139 4,363.07 194 5,105.92Nextel Communications Inc-A . . . . . . . . 479 5,963.37 336 4,764.43 467 5,842.32Office Depot Inc . . . . . . . . . . . . . . . . . . 439 6,453.10 307 4,331.63 428 5,486.79Priceline.com Inc . . . . . . . . . . . . . . . . . 64 101.75 45 65.29 63 75.59Progressive Corp . . . . . . . . . . . . . . . . . 193 9,827.26 135 6,778.14 188 8,792.49Qwest Communications International Inc . 199 1,054.66 139 815.90 194 851.63Sabre Holdings Corp . . . . . . . . . . . . . . . 235 4,335.61 164 3,002.74 229 4,092.10Sotheby’s Holdings Inc - Cl A . . . . . . . . . 234 2,185.49 164 1,482.51 228 1,890.06Spiegel Inc Cl A . . . . . . . . . . . . . . . . . . 1,099 384.63 770 230.99 1,072 332.30Staples Inc . . . . . . . . . . . . . . . . . . . . . . 333 5,990.48 233 4,314.34 325 5,560.58Starbucks Corp . . . . . . . . . . . . . . . . . . 491 10,335.23 344 7,044.93 479 10,676.58State Street Corp . . . . . . . . . . . . . . . . . 234 9,482.91 164 6,680.66 228 9,017.12Sun Microsystems Inc . . . . . . . . . . . . . . 561 1,957.83 393 1,481.95 547 1,805.75Talbots Inc . . . . . . . . . . . . . . . . . . . . . . 573 16,343.18 401 11,231.67 559 13,784.52Tiffany & Co . . . . . . . . . . . . . . . . . . . . . 444 10,744.47 311 8,011.11 433 9,750.86Travelers Property Casualty Corp-Cl A . . 12 183.59 8 127.51 12 187.79Travelers Property Casualty Corp-Cl B . . 25 383.23 17 271.82 24 374.62Viacom Inc - Cl B . . . . . . . . . . . . . . . . . 190 8,126.05 133 5,737.44 186 6,978.50Wal-Mart Stores Inc . . . . . . . . . . . . . . . 199 10,075.06 139 7,098.51 194 9,102.20

Portfolio Transactions (Continued)
January 8 January 16 January 30
SecurityShares orPar Value Proceeds
Shares orPar Value Proceeds
Shares orPar Value Proceeds
Wells Fargo & Co . . . . . . . . . . . . . . . . . 234 11,287.82 164 7,899.64 228 10,644.99Xerox Corp . . . . . . . . . . . . . . . . . . . . . 152 1,240.28 106 924.29 148 1,198.76Yahoo! Inc . . . . . . . . . . . . . . . . . . . . . . 117 2,103.59 82 1,620.27 114 2,080.50Zale Corp . . . . . . . . . . . . . . . . . . . . . . 233 7,510.69 163 5,294.08 227 6,884.70Tommy Hilfiger Corp . . . . . . . . . . . . . . . 234 1,588.81 164 1,175.84 228 1,447.75
Total Proceeds . . . . . . . . . . . . . . . . . $352,346.89 $253,471.64 $326,493.80
Per Unit . . . . . . . . . . . . . . . . . . . . . . $ 0.04002 $ 0.02897 $ 0.03750
Units outstanding . . . . . . . . . . . . . . . 8,805,337 8,749,337 8,706,337
February 7 February 14 February 24
SecurityShares orPar Value Proceeds
Shares orPar Value Proceeds
Shares orPar Value Proceeds
AMB Property Corp . . . . . . . . . . . . . . . 410 11,135.26 314 8,609.62 277 7,517.55AMR Corp . . . . . . . . . . . . . . . . . . . . . . 124 333.54 95 303.04 83 248.99AOL Time Warner Inc . . . . . . . . . . . . . . 324 3,521.77 248 2,626.24 219 2,400.16AT&T Corp. . . . . . . . . . . . . . . . . . . . . . 31 574.10 23 413.52 21 377.35AT&T Wireless Services Inc . . . . . . . . . . 50 298.49 38 229.51 33 200.30Abercrombie & Fitch Co . . . . . . . . . . . . 224 6,365.88 171 4,962.27 151 4,351.68Agere Systems Inc- Cl A . . . . . . . . . . . . 2 3.11 2 3.07 2 2.95Agere Systems Inc- Cl B . . . . . . . . . . . . 40 60.39 30 44.99 27 39.14Allstate Corp . . . . . . . . . . . . . . . . . . . . 247 8,452.55 189 6,070.49 167 5,243.64Amazon.com Inc . . . . . . . . . . . . . . . . . . 141 3,071.04 108 2,316.53 95 2,000.63AnnTaylor Stores, Inc . . . . . . . . . . . . . . 309 5,719.41 237 4,661.64 209 4,175.69Avaya Inc . . . . . . . . . . . . . . . . . . . . . . 13 30.80 10 23.59 9 20.42Bank of New York Co Inc . . . . . . . . . . . 253 6,150.24 194 4,541.40 171 3,929.46Berkshire Hathaway Inc - Cl B . . . . . . . . 4 8,875.61 3 6,404.74 3 6,374.71Carnival Corp . . . . . . . . . . . . . . . . . . . . 212 5,003.04 162 3,753.42 143 3,310.35Cisco Systems Inc . . . . . . . . . . . . . . . . 306 3,959.52 234 3,165.92 207 2,962.08Citigroup Inc . . . . . . . . . . . . . . . . . . . . 282 9,390.31 216 7,110.50 191 6,316.17Clear Channel Communications Inc . . . . 129 4,859.28 99 3,828.21 87 3,204.11Comcast Corp - Cl A . . . . . . . . . . . . . . . 49 1,217.07 38 1,010.38 33 863.25Costco Wholesale Corp . . . . . . . . . . . . . 235 6,694.94 180 5,239.64 159 4,725.33Dell Computer Corp . . . . . . . . . . . . . . . 206 4,847.26 158 3,717.62 139 3,608.33The Walt Disney Co . . . . . . . . . . . . . . . 312 5,232.08 239 3,986.39 211 3,576.34EastGroup Properties Inc . . . . . . . . . . . 464 11,260.94 356 8,718.17 314 7,651.94eBay Inc . . . . . . . . . . . . . . . . . . . . . . . 94 6,829.83 72 5,347.99 64 4,906.73Fedex Corporation . . . . . . . . . . . . . . . . 153 7,877.73 117 6,115.40 103 5,352.74The Gap Inc . . . . . . . . . . . . . . . . . . . . . 221 3,233.13 169 2,612.66 149 2,239.40Gucci Group . . . . . . . . . . . . . . . . . . . . 142 13,341.91 109 10,248.96 96 9,050.60Home Depot Inc . . . . . . . . . . . . . . . . . . 230 4,786.15 176 3,785.64 155 3,385.09International Business Machines Corp . . 71 5,418.55 54 4,255.61 48 3,795.24Estee Lauder Companies - Cl A . . . . . . . 200 5,923.82 153 4,429.21 135 3,910.83Level 3 Communications Inc . . . . . . . . . 106 534.22 81 424.42 72 358.54Lexmark International Group Inc . . . . . . 141 8,392.06 108 6,412.84 95 5,701.72Lillian Vernon Corp . . . . . . . . . . . . . . . . 341 1,421.92 262 1,053.20 231 928.59Limited Brands . . . . . . . . . . . . . . . . . . . 429 5,328.01 329 3,898.53 290 3,329.09Lowe’s Companies Inc . . . . . . . . . . . . . 341 11,794.83 262 9,156.62 231 8,197.94Lucent Technologies Inc . . . . . . . . . . . . 153 257.03 117 201.23 103 181.27Mattel Inc . . . . . . . . . . . . . . . . . . . . . . . 353 7,098.61 270 5,680.62 238 4,871.71Merrill Lynch & Co Inc . . . . . . . . . . . . . . 235 8,135.45 180 5,988.41 159 5,540.98Microsoft Corp . . . . . . . . . . . . . . . . . . . 118 5,554.09 90 4,277.57 159 3,906.51Morgan Stanley . . . . . . . . . . . . . . . . . . 188 7,042.26 144 5,216.96 127 4,640.44Nationwide Financial Services Inc -A . . . 200 5,337.83 153 3,905.97 135 3,439.69Nextel Communications Inc-A . . . . . . . . 483 5,870.01 370 4,850.55 326 4,316.10Office Depot Inc . . . . . . . . . . . . . . . . . . 442 5,847.48 339 4,481.44 298 3,531.19

Portfolio Transactions (Continued)
February 7 February 14 February 24
SecurityShares orPar Value Proceeds
Shares orPar Value Proceeds
Shares orPar Value Proceeds
Priceline.com Inc . . . . . . . . . . . . . . . . . 65 79.29 50 61.99 44 53.23Progressive Corp . . . . . . . . . . . . . . . . . 194 9,257.40 149 7,364.84 131 6,319.24Qwest Communications International Inc . 200 885.97 153 639.52 135 545.38Sabre Holdings Corp . . . . . . . . . . . . . . . 236 4,122.79 181 3,076.90 160 2,726.31Sotheby’s Holdings Inc - Cl A . . . . . . . . . 235 1,969.24 180 1,461.55 159 1,330.78Spiegel Inc Cl A . . . . . . . . . . . . . . . . . . 1,106 309.66 847 203.27 747 145.66Staples Inc . . . . . . . . . . . . . . . . . . . . . . 335 5,641.22 257 4,440.82 227 3,720.41Starbucks Corp . . . . . . . . . . . . . . . . . . 494 10,936.53 379 8,481.76 334 7,658.38State Street Corp . . . . . . . . . . . . . . . . . 235 9,004.92 180 6,785.79 159 5,957.55Sun Microsystems Inc . . . . . . . . . . . . . . 565 1,723.76 433 1,407.20 381 1,299.17Talbots Inc . . . . . . . . . . . . . . . . . . . . . . 577 14,909.23 442 11,447.45 389 10,329.50Tiffany & Co . . . . . . . . . . . . . . . . . . . . . 447 10,262.81 343 8,049.96 302 6,985.04Travelers Property Casualty Corp-Cl A . . 12 184.79 9 141.56 8 123.59Travelers Property Casualty Corp-Cl B . . 25 387.23 19 300.76 17 264.00Viacom Inc - Cl B . . . . . . . . . . . . . . . . . 192 7,117.22 147 5,638.75 129 4,891.53Wal-Mart Stores Inc . . . . . . . . . . . . . . . 200 9,415.71 153 7,271.87 135 6,614.80Wells Fargo & Co . . . . . . . . . . . . . . . . . 235 11,025.86 180 8,331.94 159 7,378.96Xerox Corp . . . . . . . . . . . . . . . . . . . . . 153 1,324.93 117 1,017.86 103 944.48Yahoo! Inc . . . . . . . . . . . . . . . . . . . . . . 118 2,079.18 90 1,659.54 79 1,525.44Zale Corp . . . . . . . . . . . . . . . . . . . . . . 234 7,071.26 179 5,300.03 158 4,793.57Tommy Hilfiger Corp . . . . . . . . . . . . . . . 235 1,546.25 180 1,166.36 159 1,011.20
Total Proceeds . . . . . . . . . . . . . . . . . $336,336.80 $258,334.45 $229,303.19
Per Unit . . . . . . . . . . . . . . . . . . . . . . $ 0.03890 $ 0.03010 $ 0.02686
Units outstanding . . . . . . . . . . . . . . . 8,645,337 8,583,337 8,536,337
February 28 March 11 March 17
SecurityShares orPar Value Proceeds
Shares orPar Value Proceeds
Shares orPar Value Proceeds
AMB Property Corp . . . . . . . . . . . . . . . 261 7,229.48 210 5,837.82 218 6,007.89AMR Corp . . . . . . . . . . . . . . . . . . . . . . 79 216.45 63 157.49 0 0.00AOL Time Warner Inc . . . . . . . . . . . . . . 206 2,107.31 165 1,811.64 172 1,826.58AT&T Corp. . . . . . . . . . . . . . . . . . . . . . 19 342.55 16 292.95 16 256.15AT&T Wireless Services Inc . . . . . . . . . . 31 185.68 25 142.99 26 135.97Abercrombie & Fitch Co . . . . . . . . . . . . 142 3,919.08 114 3,171.38 119 3,206.95Agere Systems Inc- Cl A . . . . . . . . . . . . 2 2.93 1 1.57 1 1.43Agere Systems Inc- Cl B . . . . . . . . . . . . 25 35.99 20 30.99 21 29.60Allstate Corp . . . . . . . . . . . . . . . . . . . . 157 4,984.59 126 4,034.39 132 4,036.43Amazon.com Inc . . . . . . . . . . . . . . . . . . 90 1,930.44 72 1,635.07 75 1,708.44AnnTaylor Stores, Inc . . . . . . . . . . . . . . 196 3,802.28 158 3,117.24 164 2,823.99Avaya Inc . . . . . . . . . . . . . . . . . . . . . . 8 15.83 7 15.04 7 14.69Bank of New York Co Inc . . . . . . . . . . . 161 3,575.70 129 2,815.98 135 2,656.71Berkshire Hathaway Inc - Cl B . . . . . . . . 3 6,323.71 2 4,213.81 2 4,511.80Carnival Corp . . . . . . . . . . . . . . . . . . . . 135 3,041.45 108 2,313.29 113 2,323.20Cisco Systems Inc . . . . . . . . . . . . . . . . 195 2,675.31 156 2,101.25 163 2,074.92Citigroup Inc . . . . . . . . . . . . . . . . . . . . 180 5,741.82 144 4,770.57 150 4,636.36Clear Channel Communications Inc . . . . 82 2,846.95 66 2,300.69 69 2,244.50Comcast Corp - Cl A . . . . . . . . . . . . . . . 31 816.51 25 705.22 26 695.73Costco Wholesale Corp . . . . . . . . . . . . . 150 4,427.86 120 3,412.69 125 3,523.64Dell Computer Corp . . . . . . . . . . . . . . . 131 3,379.69 105 2,753.01 110 2,823.61The Walt Disney Co . . . . . . . . . . . . . . . 198 3,229.28 159 2,500.99 166 2,488.26EastGroup Properties Inc . . . . . . . . . . . 295 7,457.31 237 6,043.31 247 6,276.08eBay Inc . . . . . . . . . . . . . . . . . . . . . . . 60 4,624.06 48 3,770.76 50 3,905.88Fedex Corporation . . . . . . . . . . . . . . . . 97 4,713.08 78 3,993.47 81 3,946.20The Gap Inc . . . . . . . . . . . . . . . . . . . . . 140 2,066.33 113 1,502.85 117 1,542.01Gucci Group . . . . . . . . . . . . . . . . . . . . 90 8,456.14 73 6,877.85 76 7,149.86

Portfolio Transactions (Continued)
February 28 March 11 March 17
SecurityShares orPar Value Proceeds
Shares orPar Value Proceeds
Shares orPar Value Proceeds
Home Depot Inc . . . . . . . . . . . . . . . . . . 146 3,220.66 117 2,607.85 122 2,659.51International Business Machines Corp . . 45 3,481.09 36 2,787.75 38 2,838.89Estee Lauder Companies - Cl A . . . . . . . 127 3,611.77 102 2,854.89 106 2,878.87Level 3 Communications Inc . . . . . . . . . 67 329.63 54 252.71 56 257.59Lexmark International Group Inc . . . . . . 90 5,534.83 72 4,506.34 75 4,515.61Lillian Vernon Corp . . . . . . . . . . . . . . . . 217 850.61 174 655.96 182 709.77Limited Brands . . . . . . . . . . . . . . . . . . . 273 3,030.20 219 2,575.36 228 2,635.60Lowe’s Companies Inc . . . . . . . . . . . . . 217 8,165.46 174 6,604.84 182 6,619.14Lucent Technologies Inc . . . . . . . . . . . . 97 137.73 78 120.89 81 119.06Mattel Inc . . . . . . . . . . . . . . . . . . . . . . . 225 4,652.85 180 3,767.28 188 3,750.48Merrill Lynch & Co Inc . . . . . . . . . . . . . . 150 4,951.35 120 4,003.07 125 3,867.38Microsoft Corp . . . . . . . . . . . . . . . . . . . 150 3,533.89 120 2,801.91 125 2,866.16Morgan Stanley . . . . . . . . . . . . . . . . . . 120 4,238.27 96 3,511.57 100 3,270.90Nationwide Financial Services Inc -A . . . 127 3,018.69 102 2,360.20 107 2,316.48Nextel Communications Inc-A . . . . . . . . 307 4,193.49 246 3,141.32 257 2,939.99Office Depot Inc . . . . . . . . . . . . . . . . . . 281 3,189.25 226 2,522.08 235 2,425.12Priceline.com Inc . . . . . . . . . . . . . . . . . 41 54.52 33 42.56 34 42.49Progressive Corp . . . . . . . . . . . . . . . . . 123 6,154.73 99 5,215.16 103 5,231.21Qwest Communications International Inc . 127 417.81 102 325.37 107 330.61Sabre Holdings Corp . . . . . . . . . . . . . . . 150 2,390.92 121 1,909.32 126 1,867.26Sotheby’s Holdings Inc - Cl A . . . . . . . . . 150 1,213.46 120 994.76 125 1,048.71Spiegel Inc Cl A . . . . . . . . . . . . . . . . . . 703 108.96 565 141.24 589 35.33Staples Inc . . . . . . . . . . . . . . . . . . . . . . 213 3,435.58 171 3,018.05 179 3,107.34Starbucks Corp . . . . . . . . . . . . . . . . . . 314 6,973.72 253 5,940.26 263 5,906.80State Street Corp . . . . . . . . . . . . . . . . . 150 5,341.33 120 4,252.67 125 4,056.12Sun Microsystems Inc . . . . . . . . . . . . . . 359 1,199.02 289 950.78 301 930.06Talbots Inc . . . . . . . . . . . . . . . . . . . . . . 367 9,081.94 295 6,882.14 307 7,165.16Tiffany & Co . . . . . . . . . . . . . . . . . . . . . 284 6,227.93 228 5,294.00 238 5,266.78Travelers Property Casualty Corp-Cl A . . 8 120.79 6 92.33 6 80.51Travelers Property Casualty Corp-Cl B . . 16 241.75 13 200.06 13 174.45Viacom Inc - Cl B . . . . . . . . . . . . . . . . . 122 4,405.28 98 3,505.35 102 3,439.33Wal-Mart Stores Inc . . . . . . . . . . . . . . . 127 6,088.19 102 4,942.77 107 5,035.26Wells Fargo & Co . . . . . . . . . . . . . . . . . 150 6,704.79 120 5,458.63 125 5,483.58Xerox Corp . . . . . . . . . . . . . . . . . . . . . 97 819.62 78 679.35 81 694.14Yahoo! Inc . . . . . . . . . . . . . . . . . . . . . . 75 1,458.70 60 1,166.36 63 1,180.58Zale Corp . . . . . . . . . . . . . . . . . . . . . . 149 4,411.75 120 3,543.49 125 3,639.89Tommy Hilfiger Corp . . . . . . . . . . . . . . . 150 881.97 120 733.17 125 714.97
Total Proceeds . . . . . . . . . . . . . . . . . $212,020.34 $170,686.15 $170,948.01
Per Unit . . . . . . . . . . . . . . . . . . . . . . $ 0.02496 $ 0.02019 $ 0.02030
Units outstanding . . . . . . . . . . . . . . . 8,493,337 8,453,337 8,421,337
March 24 April 4 April 15
SecurityShares orPar Value Proceeds
Shares orPar Value Proceeds
Shares orPar Value Proceeds
AMB Property Corp . . . . . . . . . . . . . . . 244 6,856.19 256 7,300.77 345 9,349.06AOL Time Warner Inc . . . . . . . . . . . . . . 192 2,188.73 202 2,187.55 272 3,408.00AT&T Corp. . . . . . . . . . . . . . . . . . . . . . 18 303.65 19 307.02 26 363.98AT&T Wireless Services Inc . . . . . . . . . . 29 184.14 31 202.42 42 270.04Abercrombie & Fitch Co . . . . . . . . . . . . 133 3,963.28 140 4,097.60 188 5,859.68Agere Systems Inc- Cl A . . . . . . . . . . . . 1 1.53 1 1.51 2 2.61Agere Systems Inc- Cl B . . . . . . . . . . . . 24 35.03 25 36.49 33 40.91Allstate Corp . . . . . . . . . . . . . . . . . . . . 147 4,871.43 154 5,197.25 208 7,300.45Amazon.com Inc . . . . . . . . . . . . . . . . . . 84 2,201.57 88 2,221.89 119 3,001.27AnnTaylor Stores, Inc . . . . . . . . . . . . . . 183 3,544.60 193 3,852.09 260 5,675.53Avaya Inc . . . . . . . . . . . . . . . . . . . . . . 8 16.79 8 16.47 11 24.19

Portfolio Transactions (Continued)
March 24 April 4 April 15
SecurityShares orPar Value Proceeds
Shares orPar Value Proceeds
Shares orPar Value Proceeds
Bank of New York Co Inc . . . . . . . . . . . 150 3,302.90 158 3,270.44 213 4,798.66Berkshire Hathaway Inc - Cl B . . . . . . . . 2 4,526.32 3 6,485.60 3 6,983.58Carnival Corp . . . . . . . . . . . . . . . . . . . . 126 3,062.96 132 3,134.85 178 4,480.05Cisco Systems Inc . . . . . . . . . . . . . . . . 182 2,568.81 191 2,447.43 258 3,348.65Citigroup Inc . . . . . . . . . . . . . . . . . . . . 168 5,873.10 177 6,185.86 238 8,805.58Clear Channel Communications Inc . . . . 77 2,675.66 81 2,714.18 109 3,959.78Comcast Corp - Cl A . . . . . . . . . . . . . . . 29 854.31 31 893.09 42 1,226.34Costco Wholesale Corp . . . . . . . . . . . . . 140 4,296.68 147 4,398.07 198 6,539.63Dell Computer Corp . . . . . . . . . . . . . . . 122 3,418.33 129 3,511.44 173 4,888.75The Walt Disney Co . . . . . . . . . . . . . . . 185 3,050.55 195 3,318.74 263 4,510.23EastGroup Properties Inc . . . . . . . . . . . 276 7,150.94 290 7,471.93 391 10,161.61eBay Inc . . . . . . . . . . . . . . . . . . . . . . . 56 4,869.05 59 5,086.15 79 6,955.62Fedex Corporation . . . . . . . . . . . . . . . . 91 4,893.83 96 5,279.75 129 7,178.51The Gap Inc . . . . . . . . . . . . . . . . . . . . . 131 1,920.40 138 1,978.82 186 2,918.20Gucci Group . . . . . . . . . . . . . . . . . . . . 84 8,013.35 89 8,502.66 119 11,378.24Home Depot Inc . . . . . . . . . . . . . . . . . . 136 3,270.70 143 3,427.54 193 4,998.46International Business Machines Corp . . 42 3,422.47 44 3,464.83 59 4,631.87Estee Lauder Companies - Cl A . . . . . . . 119 3,557.99 125 3,732.32 168 4,917.12Level 3 Communications Inc . . . . . . . . . 63 305.54 66 335.26 89 509.05Lexmark International Group Inc . . . . . . 84 5,446.39 88 5,891.32 119 8,183.24Lillian Vernon Corp . . . . . . . . . . . . . . . . 203 860.69 213 866.86 287 1,185.25Limited Brands . . . . . . . . . . . . . . . . . . . 255 3,291.95 268 3,371.28 361 4,833.56Lowe’s Companies Inc . . . . . . . . . . . . . 203 8,140.05 213 8,670.82 287 12,443.73Lucent Technologies Inc . . . . . . . . . . . . 91 146.50 96 136.31 129 190.91Mattel Inc . . . . . . . . . . . . . . . . . . . . . . . 210 4,582.06 221 4,914.80 297 6,572.30Merrill Lynch & Co Inc . . . . . . . . . . . . . . 140 5,041.24 147 5,285.87 198 7,468.21Microsoft Corp . . . . . . . . . . . . . . . . . . . 140 3,610.49 147 3,579.71 198 4,845.09Morgan Stanley . . . . . . . . . . . . . . . . . . 112 4,360.02 118 4,627.74 159 6,579.11Nationwide Financial Services Inc -A . . . 119 3,008.22 125 3,039.85 168 4,146.04Nextel Communications Inc-A . . . . . . . . 287 3,808.37 302 4,119.08 406 4,856.30Office Depot Inc . . . . . . . . . . . . . . . . . . 262 3,068.52 276 3,176.61 372 4,259.20Priceline.com Inc . . . . . . . . . . . . . . . . . 38 70.29 40 64.39 54 88.55Progressive Corp . . . . . . . . . . . . . . . . . 115 6,683.59 121 7,351.61 163 10,490.18Qwest Communications International Inc . 119 474.79 125 426.22 168 628.29Sabre Holdings Corp . . . . . . . . . . . . . . . 140 2,263.73 148 2,373.80 199 3,271.40Sotheby’s Holdings Inc - Cl A . . . . . . . . . 140 1,237.56 147 1,350.86 198 1,803.69Spiegel Inc Cl A . . . . . . . . . . . . . . . . . . 657 25.61 692 34.59 931 53.99Staples Inc . . . . . . . . . . . . . . . . . . . . . . 199 3,830.63 210 3,731.54 282 5,385.94Starbucks Corp . . . . . . . . . . . . . . . . . . 294 7,308.61 309 7,922.38 416 10,615.82State Street Corp . . . . . . . . . . . . . . . . . 140 5,182.64 147 4,649.39 198 6,387.18Sun Microsystems Inc . . . . . . . . . . . . . . 336 1,162.52 353 1,142.25 476 1,561.20Talbots Inc . . . . . . . . . . . . . . . . . . . . . . 342 9,001.16 360 9,175.97 485 13,565.49Tiffany & Co . . . . . . . . . . . . . . . . . . . . . 266 6,865.25 280 6,870.87 377 10,114.43Travelers Property Casualty Corp-Cl A . . 7 98.97 8 112.47 10 151.79Travelers Property Casualty Corp-Cl B . . 15 212.99 16 225.74 21 319.60Viacom Inc - Cl B . . . . . . . . . . . . . . . . . 114 4,276.01 120 4,422.99 161 6,425.20Wal-Mart Stores Inc . . . . . . . . . . . . . . . 119 6,217.56 125 6,464.69 168 9,009.41Wells Fargo & Co . . . . . . . . . . . . . . . . . 140 6,529.40 147 6,672.01 198 9,248.14Xerox Corp . . . . . . . . . . . . . . . . . . . . . 91 814.42 96 838.04 129 1,119.66Yahoo! Inc . . . . . . . . . . . . . . . . . . . . . . 70 1,507.81 74 1,697.70 99 2,337.28Zale Corp . . . . . . . . . . . . . . . . . . . . . . 139 4,521.53 146 4,673.24 197 6,642.52Tommy Hilfiger Corp . . . . . . . . . . . . . . . 140 816.17 147 1,048.06 198 1,409.69
Total Proceeds . . . . . . . . . . . . . . . . . $209,666.57 $219,989.08 $304,678.04
Per Unit . . . . . . . . . . . . . . . . . . . . . . $ 0.02502 $ 0.02636 $ 0.03668
Units outstanding . . . . . . . . . . . . . . . 8,381,337 8,344,337 8,305,337

Portfolio Transactions (Continued)
May 5 May 14 May 21
SecurityShares orPar Value Proceeds
Shares orPar Value Proceeds
Shares orPar Value Proceeds
AMB Property Corp . . . . . . . . . . . . . . . 517 14,154.79 198 5,543.74 242 6,676.46AOL Time Warner Inc . . . . . . . . . . . . . . 408 5,568.93 156 2,023.22 191 2,666.23AT&T Corp. . . . . . . . . . . . . . . . . . . . . . 39 668.03 15 243.73 18 329.38AT&T Wireless Services Inc . . . . . . . . . . 62 406.70 24 160.55 29 191.68Abercrombie & Fitch Co . . . . . . . . . . . . 282 9,218.14 108 3,229.04 132 3,616.63Agere Systems Inc- Cl A . . . . . . . . . . . . 3 5.27 1 2.10 1 2.34Agere Systems Inc- Cl B . . . . . . . . . . . . 50 82.99 19 38.18 23 51.05Allstate Corp . . . . . . . . . . . . . . . . . . . . 311 11,780.12 119 4,305.21 146 5,371.08Amazon.com Inc . . . . . . . . . . . . . . . . . . 178 5,094.12 68 2,077.30 83 2,708.16AnnTaylor Stores, Inc . . . . . . . . . . . . . . 389 9,183.85 149 3,467.06 182 4,205.82Avaya Inc . . . . . . . . . . . . . . . . . . . . . . 16 68.15 6 28.97 8 49.51Bank of New York Co Inc . . . . . . . . . . . 319 8,465.86 122 3,163.31 149 4,055.58Berkshire Hathaway Inc - Cl B . . . . . . . . 5 11,694.30 2 4,847.71 2 4,919.70Carnival Corp. . . . . . . . . . . . . . . . . . . . 267 7,344.82 102 2,909.92 125 3,727.32Cisco Systems Inc . . . . . . . . . . . . . . . . 386 5,807.48 148 2,327.93 181 3,000.83Citigroup Inc . . . . . . . . . . . . . . . . . . . . 356 14,004.38 136 5,281.99 167 6,547.76Clear Channel Communications Inc . . . . 163 6,434.93 62 2,415.40 76 3,064.93Comcast Corp - Cl A . . . . . . . . . . . . . . . 62 1,966.54 24 735.08 29 909.68Costco Wholesale Corp . . . . . . . . . . . . . 297 10,275.77 113 3,944.37 139 4,900.73Dell Computer Corp . . . . . . . . . . . . . . . 260 7,501.29 99 3,054.00 122 3,825.74The Walt Disney Co . . . . . . . . . . . . . . . 393 7,309.45 150 2,755.37 184 3,390.96EastGroup Properties Inc . . . . . . . . . . . 585 15,103.99 224 5,951.40 274 7,293.53eBay Inc . . . . . . . . . . . . . . . . . . . . . . . 119 11,048.63 45 4,208.65 56 5,570.61Fedex Corporation . . . . . . . . . . . . . . . . 193 11,531.21 74 4,547.82 90 5,552.73The Gap Inc . . . . . . . . . . . . . . . . . . . . . 278 4,620.14 106 1,822.05 130 2,140.99Gucci Group . . . . . . . . . . . . . . . . . . . . 179 17,177.82 68 6,601.13 84 8,204.73Home Depot Inc . . . . . . . . . . . . . . . . . . 289 8,088.73 111 3,265.46 135 3,906.71International Business Machines Corp . . 89 7,561.97 34 2,967.38 42 3,753.36Estee Lauder Companies - Cl A . . . . . . . 252 8,136.69 96 3,180.33 118 3,956.35Level 3 Communications Inc . . . . . . . . . 133 754.07 51 304.45 63 430.26Lexmark International Group Inc . . . . . . 178 13,185.62 68 4,969.88 83 6,099.38Lillian Vernon Corp . . . . . . . . . . . . . . . . 430 3,061.45 165 1,179.69 202 1,440.19Limited Brands . . . . . . . . . . . . . . . . . . . 541 7,860.36 207 2,868.88 253 3,430.51Lowe’s Companies Inc . . . . . . . . . . . . . 430 18,833.11 165 7,409.80 202 8,917.88Lucent Technologies Inc . . . . . . . . . . . . 193 347.38 74 165.75 90 207.89Mattel Inc . . . . . . . . . . . . . . . . . . . . . . . 445 9,660.49 170 3,828.22 208 4,677.70Merrill Lynch & Co Inc . . . . . . . . . . . . . . 297 12,122.97 113 4,750.29 139 5,855.79Microsoft Corp . . . . . . . . . . . . . . . . . . . 297 7,619.77 113 2,971.76 139 3,572.13Morgan Stanley . . . . . . . . . . . . . . . . . . 237 10,591.03 91 4,049.31 111 4,965.90Nationwide Financial Services Inc -A . . . 252 7,063.22 96 2,704.19 118 3,388.80Nextel Communications Inc-A . . . . . . . . 608 9,009.52 233 3,101.27 285 3,907.16Office Depot Inc . . . . . . . . . . . . . . . . . . 557 7,118.12 213 2,809.33 261 3,486.79Priceline.com Inc . . . . . . . . . . . . . . . . . 82 172.27 31 89.58 38 119.31Progressive Corp . . . . . . . . . . . . . . . . . 245 16,664.11 94 6,319.32 115 8,070.32Qwest Communications International Inc . 252 957.55 96 398.38 118 542.77Sabre Holdings Corp . . . . . . . . . . . . . . . 298 6,177.25 114 2,350.56 140 3,175.05Sotheby’s Holdings Inc - Cl A . . . . . . . . . 297 2,613.47 114 943.87 139 988.24Spiegel Inc Cl A . . . . . . . . . . . . . . . . . . 1,394 61.33 533 47.96 653 62.03Staples Inc . . . . . . . . . . . . . . . . . . . . . . 423 7,947.87 162 3,338.66 198 3,947.93Starbucks Corp . . . . . . . . . . . . . . . . . . 623 14,683.42 238 5,515.20 292 6,867.51State Street Corp . . . . . . . . . . . . . . . . . 297 10,424.21 113 4,070.06 139 5,258.12Sun Microsystems Inc . . . . . . . . . . . . . . 712 2,334.53 272 1,018.02 333 1,355.24Talbots Inc . . . . . . . . . . . . . . . . . . . . . . 727 20,914.81 278 7,850.35 340 9,142.17Tiffany & Co . . . . . . . . . . . . . . . . . . . . . 564 15,706.66 216 6,059.65 264 8,041.06Travelers Property Casualty Corp-Cl A . . 15 242.68 6 95.33 7 116.61Travelers Property Casualty Corp-Cl B . . 32 518.37 12 190.67 15 250.63Viacom Inc - Cl B . . . . . . . . . . . . . . . . . 241 10,523.97 92 4,028.49 113 5,097.19Wal-Mart Stores Inc . . . . . . . . . . . . . . . 252 14,169.29 96 5,325.83 118 6,303.26Wells Fargo & Co . . . . . . . . . . . . . . . . . 297 14,338.48 114 5,362.30 139 6,735.62

Portfolio Transactions (Continued)
May 5 May 14 May 21
SecurityShares orPar Value Proceeds
Shares orPar Value Proceeds
Shares orPar Value Proceeds
Xerox Corp . . . . . . . . . . . . . . . . . . . . . 193 1,897.10 74 748.84 90 952.15Yahoo! Inc . . . . . . . . . . . . . . . . . . . . . . 148 3,661.49 57 1,422.65 69 1,898.79Zale Corp . . . . . . . . . . . . . . . . . . . . . . 295 10,300.91 113 4,048.60 138 4,858.75Tommy Hilfiger Corp . . . . . . . . . . . . . . . 297 2,453.10 114 850.40 139 1,064.68
Total Proceeds . . . . . . . . . . . . . . . . . $484,295.07 $186,285.94 $229,818.39
Per Unit . . . . . . . . . . . . . . . . . . . . . . $ 0.05869 $ 0.02279 $ 0.02822
Units outstanding . . . . . . . . . . . . . . . 8,252,337 8,173,337 8,143,337
May 30 June 12 July 8
SecurityShares orPar Value Proceeds
Shares orPar Value Proceeds
Shares orPar Value Proceeds
AMB Property Corp . . . . . . . . . . . . . . . 251 7,030.18 304 8,779.10 294 8,349.20AOL Time Warner Inc . . . . . . . . . . . . . . 198 2,961.94 240 3,580.63 232 3,748.94AT&T Corp. . . . . . . . . . . . . . . . . . . . . . 19 360.03 23 451.23 22 417.98AT&T Wireless Services Inc . . . . . . . . . . 30 225.88 37 276.00 35 285.93Abercrombie & Fitch Co . . . . . . . . . . . . 137 3,768.69 166 4,529.92 160 4,521.38Agere Systems Inc- Cl A . . . . . . . . . . . . 1 2.46 2 5.03 2 4.81Agere Systems Inc- Cl B . . . . . . . . . . . . 24 56.63 29 69.88 28 64.95Allstate Corp . . . . . . . . . . . . . . . . . . . . 151 5,307.40 183 6,444.95 177 6,633.64Amazon.com Inc . . . . . . . . . . . . . . . . . . 86 2,978.90 105 3,515.23 101 3,780.25AnnTaylor Stores, Inc . . . . . . . . . . . . . . 189 4,482.86 229 6,510.16 221 6,455.10Avaya Inc . . . . . . . . . . . . . . . . . . . . . . 8 50.79 9 69.83 9 58.85Bank of New York Co Inc . . . . . . . . . . . 155 4,336.69 188 5,404.74 181 5,125.67Berkshire Hathaway Inc - Cl B . . . . . . . . 3 7,394.56 3 7,226.57 3 7,253.57Carnival Corp. . . . . . . . . . . . . . . . . . . . 130 3,793.22 157 4,890.32 152 4,933.68Cisco Systems Inc . . . . . . . . . . . . . . . . 188 3,013.49 227 3,906.48 219 3,823.56Citigroup Inc . . . . . . . . . . . . . . . . . . . . 173 6,898.91 210 8,983.37 202 8,824.96Clear Channel Communications Inc . . . . 79 3,183.55 96 3,966.53 93 3,806.31Comcast Corp - Cl A . . . . . . . . . . . . . . . 30 905.35 37 1,141.39 35 1,052.40Costco Wholesale Corp . . . . . . . . . . . . . 144 5,098.80 175 6,119.99 168 6,081.65Dell Computer Corp . . . . . . . . . . . . . . . 126 3,730.68 153 4,725.94 147 4,711.12The Walt Disney Co . . . . . . . . . . . . . . . 191 3,567.71 231 4,714.48 223 4,479.86EastGroup Properties Inc . . . . . . . . . . . 285 7,680.39 345 9,414.60 332 9,039.93eBay Inc . . . . . . . . . . . . . . . . . . . . . . . 58 5,942.40 70 6,746.28 67 7,199.48Fedex Corporation . . . . . . . . . . . . . . . . 94 5,829.60 114 7,147.46 109 6,701.00The Gap Inc . . . . . . . . . . . . . . . . . . . . . 135 2,267.89 164 2,881.34 158 2,981.32Gucci Group . . . . . . . . . . . . . . . . . . . . 87 8,455.13 105 10,237.02 102 9,987.37Home Depot Inc . . . . . . . . . . . . . . . . . . 141 4,414.50 170 5,545.14 164 5,470.78International Business Machines Corp . . 43 3,755.87 52 4,202.44 51 4,292.46Estee Lauder Companies - Cl A . . . . . . . 123 4,211.32 148 4,972.56 143 4,784.55Level 3 Communications Inc . . . . . . . . . 65 452.37 79 511.89 76 446.85Lexmark International Group Inc . . . . . . 87 6,098.41 105 7,493.49 101 7,303.97Lillian Vernon Corp . . . . . . . . . . . . . . . . 209 1,490.09 253 1,806.33 244 1,756.71Limited Brands . . . . . . . . . . . . . . . . . . . 263 3,702.86 318 4,874.71 307 4,792.04Lowe’s Companies Inc . . . . . . . . . . . . . 209 8,545.60 253 11,020.16 244 10,364.63Lucent Technologies Inc . . . . . . . . . . . . 94 219.94 114 249.64 109 219.07Mattel Inc . . . . . . . . . . . . . . . . . . . . . . . 216 4,643.78 262 5,341.92 253 5,100.24Merrill Lynch & Co Inc . . . . . . . . . . . . . . 144 6,007.39 175 7,990.12 168 8,087.14Microsoft Corp . . . . . . . . . . . . . . . . . . . 144 3,553.75 175 4,149.05 168 4,503.86Morgan Stanley . . . . . . . . . . . . . . . . . . 115 5,051.71 140 6,680.48 135 5,982.91Nationwide Financial Services Inc -A . . . 123 3,619.72 148 4,664.74 143 4,611.53Nextel Communications Inc-A . . . . . . . . 296 4,422.03 358 5,083.36 345 6,264.90Office Depot Inc . . . . . . . . . . . . . . . . . . 271 3,633.93 328 4,709.85 316 4,679.74Priceline.com Inc . . . . . . . . . . . . . . . . . 40 168.39 48 180.47 0 0.00Priceline.Com Inc . . . . . . . . . . . . . . . . . 0 0.00 0 0.00 8 180.07

Portfolio Transactions (Continued)
May 30 June 12 July 8
SecurityShares orPar Value Proceeds
Shares orPar Value Proceeds
Shares orPar Value Proceeds
Progressive Corp . . . . . . . . . . . . . . . . . 119 8,481.92 144 10,016.17 139 10,304.97Qwest Communications International Inc . 123 578.07 148 707.40 143 703.52Sabre Holdings Corp . . . . . . . . . . . . . . . 145 3,275.39 175 4,360.79 169 4,321.12Sotheby’s Holdings Inc - Cl A . . . . . . . . . 144 1,033.87 175 1,454.18 168 1,288.49Spiegel Inc Cl A . . . . . . . . . . . . . . . . . . 678 47.45 821 69.78 791 35.59Staples Inc . . . . . . . . . . . . . . . . . . . . . . 206 3,950.89 249 4,887.64 240 4,446.58Starbucks Corp . . . . . . . . . . . . . . . . . . 303 7,205.00 367 8,840.61 354 9,369.94State Street Corp . . . . . . . . . . . . . . . . . 144 5,274.47 175 6,801.93 168 6,681.04Sun Microsystems Inc . . . . . . . . . . . . . . 346 1,439.29 419 2,153.55 404 1,926.98Talbots Inc . . . . . . . . . . . . . . . . . . . . . . 353 9,724.69 428 12,292.82 413 12,331.60Tiffany & Co . . . . . . . . . . . . . . . . . . . . . 274 8,578.53 332 11,184.55 320 10,511.50Travelers Property Casualty Corp-Cl A . . 7 113.95 9 142.55 9 146.24Travelers Property Casualty Corp-Cl B . . 15 244.93 19 300.94 18 292.30Viacom Inc - Cl B . . . . . . . . . . . . . . . . . 117 5,386.42 142 6,469.21 137 5,887.98Wal-Mart Stores Inc . . . . . . . . . . . . . . . 123 6,442.43 148 7,973.86 143 7,870.35Wells Fargo & Co . . . . . . . . . . . . . . . . . 144 6,914.55 175 8,677.84 168 8,523.92Xerox Corp . . . . . . . . . . . . . . . . . . . . . 94 1,022.67 114 1,241.40 109 1,164.06Yahoo! Inc . . . . . . . . . . . . . . . . . . . . . . 72 2,156.29 87 2,386.29 84 2,857.54Zale Corp . . . . . . . . . . . . . . . . . . . . . . 144 5,026.80 174 6,629.08 168 7,751.15Tommy Hilfiger Corp . . . . . . . . . . . . . . . 144 1,114.50 175 1,518.92 168 1,542.16
Total Proceeds . . . . . . . . . . . . . . . . . $241,327.90 $299,324.33 $297,121.39
Per Unit . . . . . . . . . . . . . . . . . . . . . . $ 0.02977 $ 0.03710 $ 0.03704
Units outstanding . . . . . . . . . . . . . . . 8,106,337 8,068,337 8,021,337
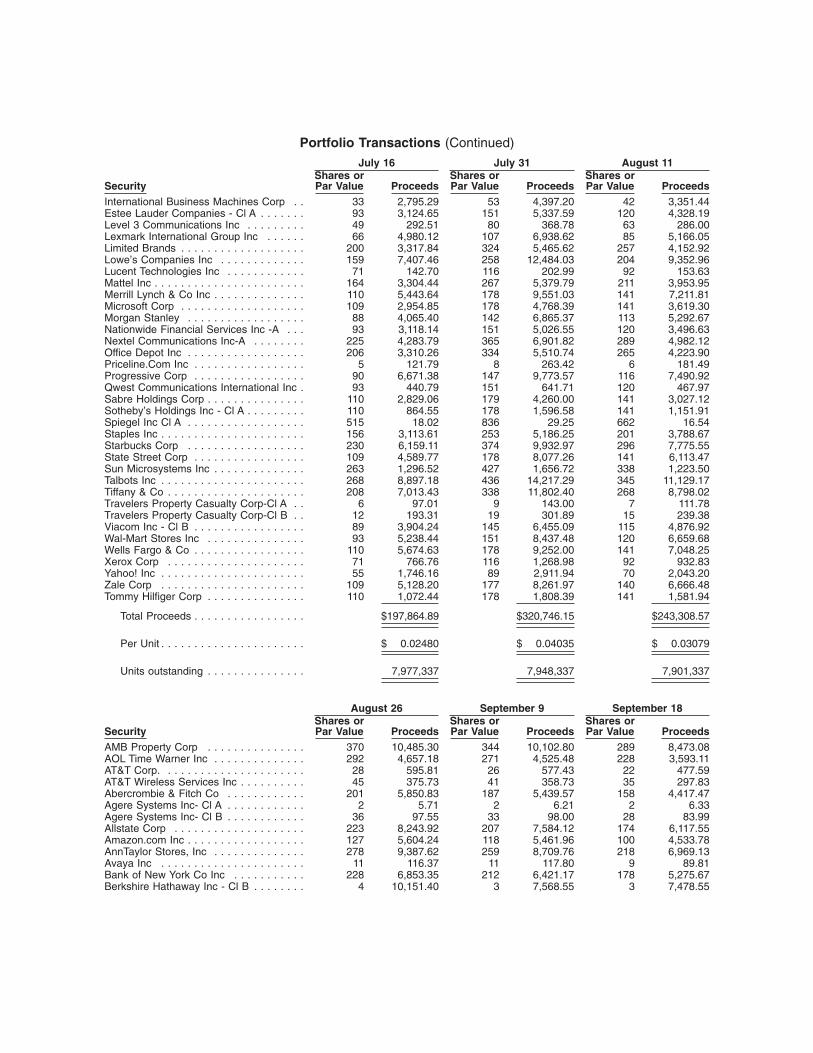
July 16 July 31 August 11
SecurityShares orPar Value Proceeds
Shares orPar Value Proceeds
Shares orPar Value Proceeds
AMB Property Corp . . . . . . . . . . . . . . . 191 5,154.84 310 8,551.56 246 6,816.34AOL Time Warner Inc . . . . . . . . . . . . . . 151 2,464.20 245 3,834.07 194 2,894.34AT&T Corp. . . . . . . . . . . . . . . . . . . . . . 14 271.02 23 499.30 18 375.10AT&T Wireless Services Inc . . . . . . . . . . 23 186.29 37 322.62 30 236.68Abercrombie & Fitch Co . . . . . . . . . . . . 104 3,206.16 169 5,367.18 134 4,102.88Agere Systems Inc- Cl A . . . . . . . . . . . . 1 2.95 2 5.51 1 2.55Agere Systems Inc- Cl B . . . . . . . . . . . . 18 50.21 30 78.89 24 57.59Allstate Corp . . . . . . . . . . . . . . . . . . . . 115 4,328.39 187 7,159.89 148 5,378.06Amazon.com Inc . . . . . . . . . . . . . . . . . . 66 2,465.65 107 4,392.14 84 3,232.16AnnTaylor Stores, Inc . . . . . . . . . . . . . . 144 4,105.24 233 6,542.33 185 5,314.80Avaya Inc . . . . . . . . . . . . . . . . . . . . . . 6 44.03 10 92.19 8 75.11Bank of New York Co Inc . . . . . . . . . . . 118 3,541.01 191 5,746.92 151 4,366.71Berkshire Hathaway Inc - Cl B . . . . . . . . 2 4,901.71 3 7,184.57 2 4,795.83Carnival Corp. . . . . . . . . . . . . . . . . . . . 99 3,189.63 160 5,322.95 127 4,282.23Cisco Systems Inc . . . . . . . . . . . . . . . . 142 2,621.19 231 4,393.41 183 3,218.81Citigroup Inc . . . . . . . . . . . . . . . . . . . . 131 6,012.61 213 9,691.04 169 7,359.60Clear Channel Communications Inc . . . . 60 2,482.68 98 3,963.91 78 3,070.71Comcast Corp - Cl A . . . . . . . . . . . . . . . 23 731.82 37 1,116.97 30 870.85Costco Wholesale Corp . . . . . . . . . . . . . 110 4,052.21 178 6,510.93 141 4,122.64Dell Computer Corp . . . . . . . . . . . . . . . 96 3,206.24 0 0.00 0 0.00Dell Inc . . . . . . . . . . . . . . . . . . . . . . . . 0 0.00 156 5,160.23 123 3,848.48The Walt Disney Co . . . . . . . . . . . . . . . 145 2,989.75 236 5,175.23 187 4,010.96EastGroup Properties Inc . . . . . . . . . . . 216 6,041.23 351 9,623.96 278 7,430.59eBay Inc . . . . . . . . . . . . . . . . . . . . . . . 44 4,948.88 71 7,858.62 56 5,724.61Fedex Corporation . . . . . . . . . . . . . . . . 71 4,502.60 116 7,489.76 92 5,907.96The Gap Inc . . . . . . . . . . . . . . . . . . . . . 103 1,933.21 167 3,169.51 132 2,301.97Gucci Group . . . . . . . . . . . . . . . . . . . . 66 6,496.07 107 10,511.18 85 8,367.85Home Depot Inc . . . . . . . . . . . . . . . . . . 107 3,557.58 173 5,504.60 137 4,246.80
Portfolio Transactions (Continued)
July 16 July 31 August 11
SecurityShares orPar Value Proceeds
Shares orPar Value Proceeds
Shares orPar Value Proceeds
International Business Machines Corp . . 33 2,795.29 53 4,397.20 42 3,351.44Estee Lauder Companies - Cl A . . . . . . . 93 3,124.65 151 5,337.59 120 4,328.19Level 3 Communications Inc . . . . . . . . . 49 292.51 80 368.78 63 286.00Lexmark International Group Inc . . . . . . 66 4,980.12 107 6,938.62 85 5,166.05Limited Brands . . . . . . . . . . . . . . . . . . . 200 3,317.84 324 5,465.62 257 4,152.92Lowe’s Companies Inc . . . . . . . . . . . . . 159 7,407.46 258 12,484.03 204 9,352.96Lucent Technologies Inc . . . . . . . . . . . . 71 142.70 116 202.99 92 153.63Mattel Inc . . . . . . . . . . . . . . . . . . . . . . . 164 3,304.44 267 5,379.79 211 3,953.95Merrill Lynch & Co Inc . . . . . . . . . . . . . . 110 5,443.64 178 9,551.03 141 7,211.81Microsoft Corp . . . . . . . . . . . . . . . . . . . 109 2,954.85 178 4,768.39 141 3,619.30Morgan Stanley . . . . . . . . . . . . . . . . . . 88 4,065.40 142 6,865.37 113 5,292.67Nationwide Financial Services Inc -A . . . 93 3,118.14 151 5,026.55 120 3,496.63Nextel Communications Inc-A . . . . . . . . 225 4,283.79 365 6,901.82 289 4,982.12Office Depot Inc . . . . . . . . . . . . . . . . . . 206 3,310.26 334 5,510.74 265 4,223.90Priceline.Com Inc . . . . . . . . . . . . . . . . . 5 121.79 8 263.42 6 181.49Progressive Corp . . . . . . . . . . . . . . . . . 90 6,671.38 147 9,773.57 116 7,490.92Qwest Communications International Inc . 93 440.79 151 641.71 120 467.97Sabre Holdings Corp . . . . . . . . . . . . . . . 110 2,829.06 179 4,260.00 141 3,027.12Sotheby’s Holdings Inc - Cl A . . . . . . . . . 110 864.55 178 1,596.58 141 1,151.91Spiegel Inc Cl A . . . . . . . . . . . . . . . . . . 515 18.02 836 29.25 662 16.54Staples Inc . . . . . . . . . . . . . . . . . . . . . . 156 3,113.61 253 5,186.25 201 3,788.67Starbucks Corp . . . . . . . . . . . . . . . . . . 230 6,159.11 374 9,932.97 296 7,775.55State Street Corp . . . . . . . . . . . . . . . . . 109 4,589.77 178 8,077.26 141 6,113.47Sun Microsystems Inc . . . . . . . . . . . . . . 263 1,296.52 427 1,656.72 338 1,223.50Talbots Inc . . . . . . . . . . . . . . . . . . . . . . 268 8,897.18 436 14,217.29 345 11,129.17Tiffany & Co . . . . . . . . . . . . . . . . . . . . . 208 7,013.43 338 11,802.40 268 8,798.02Travelers Property Casualty Corp-Cl A . . 6 97.01 9 143.00 7 111.78Travelers Property Casualty Corp-Cl B . . 12 193.31 19 301.89 15 239.38Viacom Inc - Cl B . . . . . . . . . . . . . . . . . 89 3,904.24 145 6,455.09 115 4,876.92Wal-Mart Stores Inc . . . . . . . . . . . . . . . 93 5,238.44 151 8,437.48 120 6,659.68Wells Fargo & Co . . . . . . . . . . . . . . . . . 110 5,674.63 178 9,252.00 141 7,048.25Xerox Corp . . . . . . . . . . . . . . . . . . . . . 71 766.76 116 1,268.98 92 932.83Yahoo! Inc . . . . . . . . . . . . . . . . . . . . . . 55 1,746.16 89 2,911.94 70 2,043.20Zale Corp . . . . . . . . . . . . . . . . . . . . . . 109 5,128.20 177 8,261.97 140 6,666.48Tommy Hilfiger Corp . . . . . . . . . . . . . . . 110 1,072.44 178 1,808.39 141 1,581.94
Total Proceeds . . . . . . . . . . . . . . . . . $197,864.89 $320,746.15 $243,308.57
Per Unit . . . . . . . . . . . . . . . . . . . . . . $ 0.02480 $ 0.04035 $ 0.03079
Units outstanding . . . . . . . . . . . . . . . 7,977,337 7,948,337 7,901,337
August 26 September 9 September 18
SecurityShares orPar Value Proceeds
Shares orPar Value Proceeds
Shares orPar Value Proceeds
AMB Property Corp . . . . . . . . . . . . . . . 370 10,485.30 344 10,102.80 289 8,473.08AOL Time Warner Inc . . . . . . . . . . . . . . 292 4,657.18 271 4,525.48 228 3,593.11AT&T Corp. . . . . . . . . . . . . . . . . . . . . . 28 595.81 26 577.43 22 477.59AT&T Wireless Services Inc . . . . . . . . . . 45 375.73 41 358.73 35 297.83Abercrombie & Fitch Co . . . . . . . . . . . . 201 5,850.83 187 5,439.57 158 4,417.47Agere Systems Inc- Cl A . . . . . . . . . . . . 2 5.71 2 6.21 2 6.33Agere Systems Inc- Cl B . . . . . . . . . . . . 36 97.55 33 98.00 28 83.99Allstate Corp . . . . . . . . . . . . . . . . . . . . 223 8,243.92 207 7,584.12 174 6,117.55Amazon.com Inc . . . . . . . . . . . . . . . . . . 127 5,604.24 118 5,461.96 100 4,533.78AnnTaylor Stores, Inc . . . . . . . . . . . . . . 278 9,387.62 259 8,709.76 218 6,969.13Avaya Inc . . . . . . . . . . . . . . . . . . . . . . 11 116.37 11 117.80 9 89.81Bank of New York Co Inc . . . . . . . . . . . 228 6,853.35 212 6,421.17 178 5,275.67Berkshire Hathaway Inc - Cl B . . . . . . . . 4 10,151.40 3 7,568.55 3 7,478.55

Portfolio Transactions (Continued)
August 26 September 9 September 18
SecurityShares orPar Value Proceeds
Shares orPar Value Proceeds
Shares orPar Value Proceeds
Carnival Corp. . . . . . . . . . . . . . . . . . . . 191 6,814.56 177 6,159.31 149 5,186.44Cisco Systems Inc . . . . . . . . . . . . . . . . 276 5,216.15 256 5,265.67 216 4,434.27Citigroup Inc . . . . . . . . . . . . . . . . . . . . 254 11,294.85 237 10,458.32 199 8,723.75Clear Channel Communications Inc . . . . 117 4,889.20 108 4,907.29 91 3,880.05Comcast Corp - Cl A . . . . . . . . . . . . . . . 45 1,310.78 41 1,229.12 35 1,052.40Costco Wholesale Corp . . . . . . . . . . . . . 212 6,491.13 197 6,435.68 166 5,140.77Dell Inc . . . . . . . . . . . . . . . . . . . . . . . . 186 6,033.55 172 5,854.60 145 4,871.77The Walt Disney Co . . . . . . . . . . . . . . . 281 6,164.85 261 5,566.86 220 4,423.99EastGroup Properties Inc . . . . . . . . . . . 418 11,318.90 389 10,860.37 328 9,331.16eBay Inc . . . . . . . . . . . . . . . . . . . . . . . 85 9,443.05 158 8,138.19 133 7,173.68Fedex Corporation . . . . . . . . . . . . . . . . 138 9,380.80 128 8,574.31 108 7,012.11The Gap Inc . . . . . . . . . . . . . . . . . . . . . 199 3,894.24 185 3,472.28 156 2,848.42Gucci Group . . . . . . . . . . . . . . . . . . . . 128 12,607.40 119 11,854.22 100 9,953.53Home Depot Inc . . . . . . . . . . . . . . . . . . 207 6,752.02 192 6,456.65 162 5,261.51International Business Machines Corp . . 64 5,340.54 59 5,125.68 50 4,459.29Estee Lauder Companies - Cl A . . . . . . . 180 5,945.12 168 5,894.84 141 4,821.97Level 3 Communications Inc . . . . . . . . . 95 442.67 89 460.10 75 359.98Lexmark International Group Inc . . . . . . 127 8,186.03 118 8,084.98 100 6,581.69Limited Brands . . . . . . . . . . . . . . . . . . . 386 6,472.91 359 6,005.78 303 4,826.56Lowe’s Companies Inc . . . . . . . . . . . . . 308 16,415.63 286 15,703.52 241 12,671.18Lucent Technologies Inc . . . . . . . . . . . . 138 255.28 128 270.06 108 237.58Mattel Inc . . . . . . . . . . . . . . . . . . . . . . . 318 6,397.86 296 5,881.24 249 4,860.25Merrill Lynch & Co Inc . . . . . . . . . . . . . . 212 11,449.58 197 10,749.78 166 8,950.30Microsoft Corp . . . . . . . . . . . . . . . . . . . 212 5,630.45 197 5,561.04 166 4,707.53Morgan Stanley . . . . . . . . . . . . . . . . . . 170 8,412.90 158 7,706.87 133 6,483.44Nationwide Financial Services Inc -A . . . 180 5,502.34 168 5,108.64 141 4,260.82Nextel Communications Inc-A . . . . . . . . 435 8,168.91 404 7,825.11 340 6,456.29Office Depot Inc . . . . . . . . . . . . . . . . . . 398 6,976.61 370 6,101.01 312 4,738.02Priceline.Com Inc . . . . . . . . . . . . . . . . . 10 376.18 9 340.45 8 292.54Progressive Corp . . . . . . . . . . . . . . . . . 175 12,188.17 163 11,758.26 137 9,555.30Qwest Communications International Inc . 180 811.76 168 700.52 141 532.95Sabre Holdings Corp . . . . . . . . . . . . . . . 213 4,834.87 198 4,745.83 167 4,161.44Sotheby’s Holdings Inc - Cl A . . . . . . . . . 212 1,782.83 197 1,782.76 166 1,711.37Spiegel Inc Cl A . . . . . . . . . . . . . . . . . . 997 4.98 926 4.62 780 15.59Staples Inc . . . . . . . . . . . . . . . . . . . . . . 302 6,963.79 281 6,704.34 237 5,590.56Starbucks Corp . . . . . . . . . . . . . . . . . . 445 12,054.48 414 12,021.99 349 10,103.07State Street Corp . . . . . . . . . . . . . . . . . 212 9,537.43 197 8,760.17 166 7,350.13Sun Microsystems Inc . . . . . . . . . . . . . . 509 1,959.55 473 1,910.82 398 1,528.24Talbots Inc . . . . . . . . . . . . . . . . . . . . . . 519 18,392.49 483 17,160.18 407 13,776.30Tiffany & Co . . . . . . . . . . . . . . . . . . . . . 403 15,740.44 375 14,639.31 315 12,205.67Travelers Property Casualty Corp-Cl A . . 11 172.03 10 156.79 9 138.95Travelers Property Casualty Corp-Cl B . . 23 358.78 21 329.47 18 279.34Viacom Inc - Cl B . . . . . . . . . . . . . . . . . 173 7,673.92 160 7,386.85 135 5,873.57Wal-Mart Stores Inc . . . . . . . . . . . . . . . 180 10,606.90 168 10,054.32 141 8,143.77Wells Fargo & Co . . . . . . . . . . . . . . . . . 212 10,597.38 197 10,026.83 166 8,289.65Xerox Corp . . . . . . . . . . . . . . . . . . . . . 138 1,386.83 128 1,391.29 108 1,101.54Yahoo! Inc . . . . . . . . . . . . . . . . . . . . . . 106 3,429.99 99 3,377.72 83 2,887.43Zale Corp . . . . . . . . . . . . . . . . . . . . . . 211 10,557.94 196 9,774.06 165 7,919.62Tommy Hilfiger Corp . . . . . . . . . . . . . . . 212 2,535.40 197 2,369.79 166 1,976.96
Total Proceeds . . . . . . . . . . . . . . . . . $391,599.46 $368,079.47 $304,956.63
Per Unit . . . . . . . . . . . . . . . . . . . . . . $ 0.04979 $ 0.04714 $ 0.03931
Units outstanding . . . . . . . . . . . . . . . 7,864,337 7,808,837 7,756,837

Portfolio Transactions (Continued)
September 29 October 9 October 17
SecurityShares orPar Value Proceeds
Shares orPar Value Proceeds
Shares orPar Value Proceeds
AMB Property Corp . . . . . . . . . . . . . . . 206 6,235.32 236 7,329.81 206 6,365.10AOL Time Warner Inc . . . . . . . . . . . . . . 163 2,576.90 186 2,897.74 0 0.00AT&T Corp. . . . . . . . . . . . . . . . . . . . . . 15 333.28 18 362.32 15 300.43AT&T Wireless Services Inc . . . . . . . . . . 25 213.23 28 240.78 25 206.74Abercrombie & Fitch Co . . . . . . . . . . . . 112 3,212.00 129 3,742.11 112 3,474.07Agere Systems Inc- Cl A . . . . . . . . . . . . 1 3.30 1 3.15 1 3.44Agere Systems Inc- Cl B . . . . . . . . . . . . 20 62.39 23 69.22 20 64.99Allstate Corp . . . . . . . . . . . . . . . . . . . . 124 4,566.70 142 5,354.56 124 4,719.21Amazon.com Inc . . . . . . . . . . . . . . . . . . 71 3,555.51 81 4,301.85 71 4,177.44AnnTaylor Stores, Inc . . . . . . . . . . . . . . 155 5,131.80 178 6,019.67 155 5,561.13Avaya Inc . . . . . . . . . . . . . . . . . . . . . . 6 62.63 7 77.13 6 80.57Bank of New York Co Inc . . . . . . . . . . . 127 3,826.33 145 4,512.18 127 4,099.36Berkshire Hathaway Inc - Cl B . . . . . . . . 2 5,029.70 2 5,035.70 2 5,069.70Carnival Corp. . . . . . . . . . . . . . . . . . . . 106 3,685.44 122 4,216.12 106 3,645.16Cisco Systems Inc . . . . . . . . . . . . . . . . 154 3,184.57 176 3,646.54 154 3,219.98Citigroup Inc . . . . . . . . . . . . . . . . . . . . 142 6,592.75 162 7,659.00 142 6,905.13Clear Channel Communications Inc . . . . 65 2,539.43 74 3,046.43 65 2,700.62Comcast Corp - Cl A . . . . . . . . . . . . . . . 25 776.21 28 913.03 25 801.46Costco Wholesale Corp . . . . . . . . . . . . . 118 3,775.82 135 4,410.24 118 3,929.21Dell Inc . . . . . . . . . . . . . . . . . . . . . . . . 103 3,480.20 118 4,118.00 103 3,699.58The Walt Disney Co . . . . . . . . . . . . . . . 157 3,106.88 179 3,767.77 157 3,449.12EastGroup Properties Inc . . . . . . . . . . . 233 6,446.80 267 7,654.53 233 6,679.79eBay Inc . . . . . . . . . . . . . . . . . . . . . . . 95 5,345.39 108 6,164.35 95 5,591.43Fedex Corporation . . . . . . . . . . . . . . . . 77 5,052.50 88 5,972.28 77 5,639.98The Gap Inc . . . . . . . . . . . . . . . . . . . . . 111 1,969.04 127 2,322.72 111 2,183.26Gucci Group . . . . . . . . . . . . . . . . . . . . 71 7,053.51 82 6,904.89 71 5,980.75Home Depot Inc . . . . . . . . . . . . . . . . . . 115 3,731.57 132 4,481.19 115 4,050.11International Business Machines Corp . . 35 3,154.05 41 3,731.64 35 3,235.59Estee Lauder Companies - Cl A . . . . . . . 100 3,414.84 115 4,060.45 101 3,706.52Level 3 Communications Inc . . . . . . . . . 53 266.04 61 320.23 53 289.36Lexmark International Group Inc . . . . . . 71 4,682.23 81 5,454.28 71 4,844.81Limited Brands . . . . . . . . . . . . . . . . . . . 215 3,304.39 247 3,974.04 216 3,797.10Lowe’s Companies Inc . . . . . . . . . . . . . 172 9,110.41 196 10,997.04 172 9,903.29Lucent Technologies Inc . . . . . . . . . . . . 77 169.39 88 197.99 77 179.40Mattel Inc . . . . . . . . . . . . . . . . . . . . . . . 177 3,449.56 203 3,986.73 177 3,578.77Merrill Lynch & Co Inc . . . . . . . . . . . . . . 118 6,493.23 135 7,636.59 118 6,867.27Microsoft Corp . . . . . . . . . . . . . . . . . . . 118 3,394.70 135 3,913.46 118 3,360.48Morgan Stanley . . . . . . . . . . . . . . . . . . 95 4,801.07 108 5,690.25 95 5,110.76Nationwide Financial Services Inc -A . . . 101 3,228.81 115 3,732.72 101 3,295.47Nextel Communications Inc-A . . . . . . . . 242 4,909.94 277 5,902.65 242 5,178.55Office Depot Inc . . . . . . . . . . . . . . . . . . 222 3,223.28 254 3,707.20 222 3,223.28Priceline.Com Inc . . . . . . . . . . . . . . . . . 5 148.89 6 192.11 5 166.09Progressive Corp . . . . . . . . . . . . . . . . . 98 7,005.69 112 8,089.38 98 7,243.82Qwest Communications International Inc . 101 362.57 115 416.28 101 359.54Sabre Holdings Corp . . . . . . . . . . . . . . . 119 2,849.91 136 3,031.29 119 2,640.48Sotheby’s Holdings Inc - Cl A . . . . . . . . . 118 1,373.45 135 1,538.92 118 1,375.81Spiegel Inc Cl A . . . . . . . . . . . . . . . . . . 556 11.11 636 12.71 556 13.89Staples Inc . . . . . . . . . . . . . . . . . . . . . . 169 4,153.82 193 4,778.91 169 4,278.87Starbucks Corp . . . . . . . . . . . . . . . . . . 248 7,466.93 284 8,513.92 248 7,511.56State Street Corp . . . . . . . . . . . . . . . . . 118 5,392.34 135 6,379.80 118 6,102.67Sun Microsystems Inc . . . . . . . . . . . . . . 284 1,150.14 325 1,078.94 284 1,008.15Talbots Inc . . . . . . . . . . . . . . . . . . . . . . 290 10,352.51 331 11,716.85 290 9,963.93Tiffany & Co . . . . . . . . . . . . . . . . . . . . . 225 8,704.84 257 10,004.54 225 9,526.05Time Warner Inc (Formerly AOL Time
Warner Inc) . . . . . . . . . . . . . . . . . . . . 0 0.00 0 0.00 163 2,554.09Travelers Property Casualty Corp-Cl A . . 6 93.77 7 110.38 6 92.75Travelers Property Casualty Corp-Cl B . . 13 203.57 14 221.60 13 202.14Viacom Inc - Cl B . . . . . . . . . . . . . . . . . 96 3,712.14 110 4,447.09 96 3,975.17Wal-Mart Stores Inc . . . . . . . . . . . . . . . 101 5,727.44 115 6,655.88 101 5,957.71

Portfolio Transactions (Continued)
September 29 October 9 October 17
SecurityShares orPar Value Proceeds
Shares orPar Value Proceeds
Shares orPar Value Proceeds
Wells Fargo & Co . . . . . . . . . . . . . . . . . 118 5,981.13 135 7,201.91 118 6,475.53Xerox Corp . . . . . . . . . . . . . . . . . . . . . 77 813.85 88 945.95 77 847.73Yahoo! Inc . . . . . . . . . . . . . . . . . . . . . . 59 2,200.59 68 2,682.47 59 2,494.99Zale Corp . . . . . . . . . . . . . . . . . . . . . . 118 5,569.33 135 6,273.15 118 5,713.29Tommy Hilfiger Corp . . . . . . . . . . . . . . . 118 1,467.85 135 1,659.07 118 1,584.66
Total Proceeds . . . . . . . . . . . . . . . . . $219,893.01 $254,479.73 $229,257.33
Per Unit . . . . . . . . . . . . . . . . . . . . . . $ 0.02851 $ 0.03312 $ 0.02998
Units outstanding . . . . . . . . . . . . . . . 7,713,837 7,682,837 7,647,837
October 24 October 31 November 7
SecurityShares orPar Value Proceeds
Shares orPar Value Proceeds
Shares orPar Value Proceeds
AMB Property Corp . . . . . . . . . . . . . . . 220 6,912.07 246 7,409.17 199 6,101.05AT&T Corp. . . . . . . . . . . . . . . . . . . . . . 16 315.18 18 355.30 15 283.78AT&T Wireless Services Inc . . . . . . . . . . 27 218.41 30 215.98 24 167.27Abercrombie & Fitch Co . . . . . . . . . . . . 120 3,634.62 134 3,948.79 108 3,086.49Agere Systems Inc- Cl A . . . . . . . . . . . . 1 3.75 1 3.38 1 3.60Agere Systems Inc- Cl B . . . . . . . . . . . . 21 75.38 24 77.75 19 65.73Allstate Corp . . . . . . . . . . . . . . . . . . . . 132 5,279.75 148 5,825.00 120 4,823.77Amazon.com Inc . . . . . . . . . . . . . . . . . . 76 4,626.66 85 4,666.28 68 3,847.32AnnTaylor Stores, Inc . . . . . . . . . . . . . . 165 5,959.52 185 6,574.59 150 5,440.24Avaya Inc . . . . . . . . . . . . . . . . . . . . . . 7 94.07 8 106.07 6 79.55Bank of New York Co Inc . . . . . . . . . . . 135 4,196.95 152 4,693.54 123 3,892.76Berkshire Hathaway Inc - Cl B . . . . . . . . 2 5,081.70 2 5,157.69 2 5,309.69Carnival Corp. . . . . . . . . . . . . . . . . . . . 113 3,797.75 127 4,343.19 103 3,593.50Cisco Systems Inc . . . . . . . . . . . . . . . . 164 3,462.49 183 3,742.17 148 3,172.97Citigroup Inc . . . . . . . . . . . . . . . . . . . . 151 7,190.28 169 7,961.21 137 6,607.20Clear Channel Communications Inc . . . . 69 2,771.60 78 3,200.97 63 2,585.39Comcast Corp - Cl A . . . . . . . . . . . . . . . 26 845.74 30 994.75 24 784.52Costco Wholesale Corp . . . . . . . . . . . . . 126 4,268.68 141 4,844.53 114 4,009.19Dell Inc . . . . . . . . . . . . . . . . . . . . . . . . 110 4,079.70 123 4,398.27 100 3,598.83The Walt Disney Co . . . . . . . . . . . . . . . 167 3,617.05 187 4,207.30 151 3,407.91EastGroup Properties Inc . . . . . . . . . . . 249 7,230.62 278 8,031.04 225 6,673.43eBay Inc . . . . . . . . . . . . . . . . . . . . . . . 101 5,726.43 113 6,354.82 91 5,234.98Fedex Corporation . . . . . . . . . . . . . . . . 82 5,929.96 92 6,685.32 74 5,628.91The Gap Inc . . . . . . . . . . . . . . . . . . . . . 118 2,207.67 132 2,422.08 107 2,006.15Gucci Group . . . . . . . . . . . . . . . . . . . . 76 6,557.73 85 7,325.80 69 5,852.30Home Depot Inc . . . . . . . . . . . . . . . . . . 123 4,469.61 137 5,046.84 111 4,126.78International Business Machines Corp . . 38 3,388.68 42 3,756.72 34 3,022.79Estee Lauder Companies - Cl A . . . . . . . 107 3,933.13 120 4,517.78 97 3,609.20Level 3 Communications Inc . . . . . . . . . 57 304.93 63 325.69 51 283.54Lexmark International Group Inc . . . . . . 76 5,632.09 85 6,168.16 68 4,952.88Limited Brands . . . . . . . . . . . . . . . . . . . 230 4,086.90 257 4,456.17 208 3,625.27Lowe’s Companies Inc . . . . . . . . . . . . . 183 10,598.86 204 11,998.71 165 9,818.69Lucent Technologies Inc . . . . . . . . . . . . 82 202.53 92 261.26 74 231.60Mattel Inc . . . . . . . . . . . . . . . . . . . . . . . 189 3,639.96 212 4,021.45 171 3,344.60Merrill Lynch & Co Inc . . . . . . . . . . . . . . 126 7,201.82 141 8,083.15 114 6,828.28Microsoft Corp . . . . . . . . . . . . . . . . . . . 126 3,694.14 141 3,813.45 114 2,963.86Morgan Stanley . . . . . . . . . . . . . . . . . . 101 5,368.90 113 6,003.40 91 5,119.42Nationwide Financial Services Inc -A . . . 107 3,471.98 120 3,847.01 97 3,305.60Nextel Communications Inc-A . . . . . . . . 258 5,858.90 289 6,614.90 234 5,578.29Office Depot Inc . . . . . . . . . . . . . . . . . . 236 3,322.72 265 3,868.81 214 3,261.20Priceline.Com Inc . . . . . . . . . . . . . . . . . 6 182.93 6 171.23 5 146.24Progressive Corp . . . . . . . . . . . . . . . . . 104 7,627.00 116 8,533.72 94 7,090.08Qwest Communications International Inc . 107 372.34 120 394.78 97 339.48

Portfolio Transactions (Continued)
October 24 October 31 November 7
SecurityShares orPar Value Proceeds
Shares orPar Value Proceeds
Shares orPar Value Proceeds
Sabre Holdings Corp . . . . . . . . . . . . . . . 126 2,574.05 142 3,008.83 115 2,549.43Sotheby’s Holdings Inc - Cl A . . . . . . . . . 126 1,409.87 141 1,534.00 114 1,206.06Spiegel Inc Cl A . . . . . . . . . . . . . . . . . . 592 47.35 663 99.44 536 69.67Staples Inc . . . . . . . . . . . . . . . . . . . . . . 179 4,641.25 201 5,372.47 163 4,402.42Starbucks Corp . . . . . . . . . . . . . . . . . . 265 7,973.47 296 8,947.66 240 7,576.44State Street Corp . . . . . . . . . . . . . . . . . 126 6,489.95 141 7,217.45 114 6,007.51Sun Microsystems Inc . . . . . . . . . . . . . . 302 1,050.91 338 1,169.42 274 1,150.74Talbots Inc . . . . . . . . . . . . . . . . . . . . . . 309 10,492.21 345 11,598.35 280 9,158.37Tiffany & Co . . . . . . . . . . . . . . . . . . . . . 239 10,603.93 268 12,163.95 217 10,304.84Time Warner Inc (Formerly AOL Time
Warner Inc) . . . . . . . . . . . . . . . . . . . . 173 2,714.24 194 2,975.82 157 2,442.80Travelers Property Casualty Corp-Cl A . . 7 112.27 7 109.96 6 97.55Travelers Property Casualty Corp-Cl B . . 13 209.68 15 236.98 12 195.59Viacom Inc - Cl B . . . . . . . . . . . . . . . . . 103 3,974.58 115 4,538.83 93 3,623.11Wal-Mart Stores Inc . . . . . . . . . . . . . . . 107 6,356.57 120 6,956.07 97 5,681.99Wells Fargo & Co . . . . . . . . . . . . . . . . . 126 7,005.27 141 7,668.63 114 6,366.60Xerox Corp . . . . . . . . . . . . . . . . . . . . . 82 933.11 92 974.23 74 777.70Yahoo! Inc . . . . . . . . . . . . . . . . . . . . . . 63 2,712.02 70 2,922.36 57 2,469.69Zale Corp . . . . . . . . . . . . . . . . . . . . . . 125 6,052.21 140 6,770.08 114 6,039.43Tommy Hilfiger Corp . . . . . . . . . . . . . . . 126 1,729.89 141 1,931.60 114 1,644.94
Total Proceeds . . . . . . . . . . . . . . . . . $244,524.01 $271,624.35 $225,669.21
Per Unit . . . . . . . . . . . . . . . . . . . . . . $ 0.03210 $ 0.03582 $ 0.02990
Units outstanding . . . . . . . . . . . . . . . 7,616,837 7,583,837 7,546,837
November 13 November 24 December 8
SecurityShares orPar Value Proceeds
Shares orPar Value Proceeds
Shares orPar Value Proceeds
AMB Property Corp . . . . . . . . . . . . . . . 214 6,678.62 298 9,449.13 245 7,839.63AT&T Corp. . . . . . . . . . . . . . . . . . . . . . 16 302.86 22 420.84 18 364.84AT&T Wireless Services Inc . . . . . . . . . . 26 182.51 36 236.14 30 216.88Abercrombie & Fitch Co . . . . . . . . . . . . 117 3,328.49 163 4,635.50 134 3,656.68Agere Systems Inc- Cl A . . . . . . . . . . . . 1 3.74 2 6.39 1 3.22Agere Systems Inc- Cl B . . . . . . . . . . . . 21 75.59 29 87.86 24 73.43Allstate Corp . . . . . . . . . . . . . . . . . . . . 129 5,253.92 180 7,154.66 148 6,035.15Amazon.com Inc . . . . . . . . . . . . . . . . . . 74 4,056.49 103 5,094.14 84 4,458.51AnnTaylor Stores, Inc . . . . . . . . . . . . . . 161 5,879.44 225 8,236.86 185 7,453.30Avaya Inc . . . . . . . . . . . . . . . . . . . . . . 7 93.51 9 118.16 8 108.79Bank of New York Co Inc . . . . . . . . . . . 132 4,163.08 184 5,438.78 151 4,781.94Berkshire Hathaway Inc - Cl B . . . . . . . . 2 5,301.69 3 8,198.52 2 5,622.69Carnival Corp. . . . . . . . . . . . . . . . . . . . 111 3,944.75 154 5,209.57 127 4,540.03Cisco Systems Inc . . . . . . . . . . . . . . . . 160 3,628.62 222 4,872.67 183 4,307.61Citigroup Inc . . . . . . . . . . . . . . . . . . . . 147 7,080.65 205 9,386.51 169 8,005.15Clear Channel Communications Inc . . . . 68 2,952.42 94 3,799.30 77 3,325.47Comcast Corp - Cl A . . . . . . . . . . . . . . . 26 867.83 36 1,120.98 30 953.95Costco Wholesale Corp . . . . . . . . . . . . . 123 4,251.91 171 5,772.68 141 5,119.47Dell Inc . . . . . . . . . . . . . . . . . . . . . . . . 108 3,935.33 150 5,152.25 123 4,369.98The Walt Disney Co . . . . . . . . . . . . . . . 163 3,840.10 227 5,139.03 187 4,147.46EastGroup Properties Inc . . . . . . . . . . . 242 7,230.62 338 10,102.34 278 8,887.24eBay Inc . . . . . . . . . . . . . . . . . . . . . . . 98 5,551.44 137 7,127.77 113 6,380.81Fedex Corporation . . . . . . . . . . . . . . . . 80 6,197.30 111 8,313.51 91 6,723.67The Gap Inc . . . . . . . . . . . . . . . . . . . . . 115 2,365.43 160 3,335.84 132 2,822.02Gucci Group . . . . . . . . . . . . . . . . . . . . 74 6,291.18 103 8,751.50 85 7,227.21Home Depot Inc . . . . . . . . . . . . . . . . . . 120 4,506.98 167 5,938.24 137 4,949.57International Business Machines Corp . . 37 3,271.75 51 4,558.67 42 3,826.44Estee Lauder Companies - Cl A . . . . . . . 104 3,862.37 145 5,377.79 120 4,760.17

Portfolio Transactions (Continued)
November 13 November 24 December 8
SecurityShares orPar Value Proceeds
Shares orPar Value Proceeds
Shares orPar Value Proceeds
Level 3 Communications Inc . . . . . . . . . 55 299.73 77 386.52 63 340.81Lexmark International Group Inc . . . . . . 74 5,510.52 103 7,619.58 84 6,475.25Limited Brands . . . . . . . . . . . . . . . . . . . 224 3,966.85 312 5,453.50 256 4,561.70Lowe’s Companies Inc . . . . . . . . . . . . . 178 10,615.42 248 14,209.73 204 11,809.00Lucent Technologies Inc . . . . . . . . . . . . 80 263.98 111 335.20 91 280.26Mattel Inc . . . . . . . . . . . . . . . . . . . . . . . 184 3,630.14 257 4,851.93 211 4,152.28Merrill Lynch & Co Inc . . . . . . . . . . . . . . 123 7,355.05 171 9,380.62 141 8,132.49Microsoft Corp . . . . . . . . . . . . . . . . . . . 123 3,228.59 171 4,322.67 141 3,658.77Morgan Stanley . . . . . . . . . . . . . . . . . . 98 5,595.53 137 7,260.65 113 6,403.41Nationwide Financial Services Inc -A . . . 104 3,454.71 145 4,600.63 120 3,932.21Nextel Communications Inc-A . . . . . . . . 252 6,123.31 351 7,904.14 289 7,490.52Office Depot Inc . . . . . . . . . . . . . . . . . . 231 3,545.68 321 4,766.62 264 4,141.96Priceline.Com Inc . . . . . . . . . . . . . . . . . 6 125.63 8 141.75 6 110.81Progressive Corp . . . . . . . . . . . . . . . . . 101 7,684.73 141 10,956.59 116 9,290.00Qwest Communications International Inc . 104 366.06 145 511.82 120 427.17Sabre Holdings Corp . . . . . . . . . . . . . . . 123 2,726.78 172 3,625.59 141 2,832.55Sotheby’s Holdings Inc - Cl A . . . . . . . . . 123 1,410.74 171 1,886.04 141 1,834.32Spiegel Inc Cl A . . . . . . . . . . . . . . . . . . 578 28.89 804 36.17 662 39.71Staples Inc . . . . . . . . . . . . . . . . . . . . . . 175 4,761.52 244 6,121.67 201 5,388.55Starbucks Corp . . . . . . . . . . . . . . . . . . 258 8,387.18 359 11,020.78 296 9,613.95State Street Corp . . . . . . . . . . . . . . . . . 123 6,275.16 171 8,511.98 141 7,303.45Sun Microsystems Inc . . . . . . . . . . . . . . 295 1,227.14 411 1,680.91 338 1,456.71Talbots Inc . . . . . . . . . . . . . . . . . . . . . . 301 9,186.08 419 13,503.73 345 10,829.04Tiffany & Co . . . . . . . . . . . . . . . . . . . . . 234 11,072.36 325 13,555.11 267 11,923.66Time Warner Inc (Formerly AOL Time
Warner Inc) . . . . . . . . . . . . . . . . . . . . 169 2,708.94 235 3,630.57 194 3,216.36Travelers Property Casualty Corp-Cl A . . 6 97.79 9 137.06 7 112.06Travelers Property Casualty Corp-Cl B . . 13 212.15 18 274.48 15 240.13Viacom Inc - Cl B . . . . . . . . . . . . . . . . . 100 4,029.81 139 5,202.52 115 4,576.78Wal-Mart Stores Inc . . . . . . . . . . . . . . . 104 6,094.11 145 7,996.37 120 6,408.89Wells Fargo & Co . . . . . . . . . . . . . . . . . 123 6,866.76 171 9,611.45 141 8,016.88Xerox Corp . . . . . . . . . . . . . . . . . . . . . 80 841.56 111 1,139.91 91 1,121.06Yahoo! Inc . . . . . . . . . . . . . . . . . . . . . . 61 2,614.33 86 3,359.00 70 3,062.35Zale Corp . . . . . . . . . . . . . . . . . . . . . . 122 6,438.85 170 9,109.87 140 7,792.03Tommy Hilfiger Corp . . . . . . . . . . . . . . . 123 1,980.20 171 2,301.55 141 1,938.65
Total Proceeds . . . . . . . . . . . . . . . . . $243,824.90 $328,442.34 $279,875.08
Per Unit . . . . . . . . . . . . . . . . . . . . . . $ 0.03244 $ 0.04388 $ 0.03762
Units outstanding . . . . . . . . . . . . . . . 7,516,837 7,484,837 7,439,837
December 12 December 22 December 29
SecurityShares orPar Value Proceeds
Shares orPar Value Proceeds
Shares orPar Value Proceeds
AMB Property Corp . . . . . . . . . . . . . . . 234 7,539.12 521 16,994.22 376 12,351.02AT&T Corp. . . . . . . . . . . . . . . . . . . . . . 17 337.21 39 735.50 28 546.81AT&T Wireless Services Inc . . . . . . . . . . 28 196.83 63 457.35 45 346.93Abercrombie & Fitch Co . . . . . . . . . . . . 127 3,117.70 284 6,959.49 205 4,966.91Agere Systems Inc- Cl A . . . . . . . . . . . . 1 3.01 3 8.96 2 6.05Agere Systems Inc- Cl B . . . . . . . . . . . . 23 65.08 50 140.99 36 101.51Allstate Corp . . . . . . . . . . . . . . . . . . . . 141 5,760.99 314 13,096.32 227 9,637.96Amazon.com Inc . . . . . . . . . . . . . . . . . . 80 4,031.81 179 8,484.20 129 6,750.25AnnTaylor Stores, Inc . . . . . . . . . . . . . . 176 6,773.92 392 14,546.43 283 10,580.87Avaya Inc . . . . . . . . . . . . . . . . . . . . . . 7 74.96 16 177.27 12 142.91Bank of New York Co Inc . . . . . . . . . . . 144 4,545.86 321 10,069.29 232 7,685.79Berkshire Hathaway Inc - Cl B . . . . . . . . 2 5,585.67 5 13,699.20 4 11,111.35Carnival Corp. . . . . . . . . . . . . . . . . . . . 121 4,481.63 269 10,156.96 194 7,575.34

Portfolio Transactions (Continued)
December 12 December 22 December 29
SecurityShares orPar Value Proceeds
Shares orPar Value Proceeds
Shares orPar Value Proceeds
Cisco Systems Inc . . . . . . . . . . . . . . . . 174 4,116.64 388 9,125.33 281 6,721.20Citigroup Inc . . . . . . . . . . . . . . . . . . . . 161 7,603.67 359 17,022.98 259 12,522.06Clear Channel Communications Inc . . . . 74 3,280.26 164 7,425.57 119 5,617.72Comcast Corp - Cl A . . . . . . . . . . . . . . . 28 873.27 63 1,975.58 45 1,432.73Costco Wholesale Corp . . . . . . . . . . . . . 134 4,876.67 299 10,754.52 216 7,825.31Dell Inc . . . . . . . . . . . . . . . . . . . . . . . . 117 3,949.73 261 8,607.37 189 6,316.08The Walt Disney Co . . . . . . . . . . . . . . . 177 3,927.44 396 9,052.13 286 6,703.52EastGroup Properties Inc . . . . . . . . . . . 264 8,510.96 589 19,000.24 426 13,746.37eBay Inc . . . . . . . . . . . . . . . . . . . . . . . 107 5,972.46 239 13,682.10 173 11,040.34Fedex Corporation . . . . . . . . . . . . . . . . 87 6,289.80 194 13,786.93 140 9,632.94The Gap Inc . . . . . . . . . . . . . . . . . . . . . 126 2,640.83 280 6,170.91 202 4,708.39Gucci Group . . . . . . . . . . . . . . . . . . . . 81 6,895.20 180 15,347.88 130 11,107.97Home Depot Inc . . . . . . . . . . . . . . . . . . 131 4,474.75 291 10,228.17 210 7,288.75International Business Machines Corp . . 40 3,655.02 90 8,381.30 65 6,029.76Estee Lauder Companies - Cl A . . . . . . . 114 4,453.77 254 9,433.11 183 7,125.68Level 3 Communications Inc . . . . . . . . . 60 309.58 134 716.86 97 536.38Lexmark International Group Inc . . . . . . 80 6,021.31 179 13,352.77 130 10,039.42Limited Brands . . . . . . . . . . . . . . . . . . . 244 4,281.99 544 9,612.02 393 7,046.15Lowe’s Companies Inc . . . . . . . . . . . . . 194 10,962.42 433 23,779.24 313 17,023.27Lucent Technologies Inc . . . . . . . . . . . . 87 255.76 194 548.99 140 391.98Mattel Inc . . . . . . . . . . . . . . . . . . . . . . . 201 3,852.98 448 8,605.67 324 6,178.39Merrill Lynch & Co Inc . . . . . . . . . . . . . . 134 7,443.35 299 16,868.79 216 12,523.09Microsoft Corp . . . . . . . . . . . . . . . . . . . 134 3,553.51 299 8,072.62 216 5,859.80Morgan Stanley . . . . . . . . . . . . . . . . . . 107 5,956.41 239 13,744.24 173 9,900.32Nationwide Financial Services Inc -A . . . 114 3,759.54 254 8,175.87 183 5,886.83Nextel Communications Inc-A . . . . . . . . 275 6,836.17 612 15,660.34 442 11,761.06Office Depot Inc . . . . . . . . . . . . . . . . . . 252 4,054.48 561 9,093.38 405 6,653.83Priceline.Com Inc . . . . . . . . . . . . . . . . . 6 105.17 14 247.92 10 178.69Progressive Corp . . . . . . . . . . . . . . . . . 110 8,684.09 246 20,060.36 178 14,577.51Qwest Communications International Inc . 114 400.12 254 886.41 183 677.06Sabre Holdings Corp . . . . . . . . . . . . . . . 135 2,683.67 300 6,188.70 217 4,665.28Sotheby’s Holdings Inc - Cl A . . . . . . . . . 134 1,672.24 299 3,925.68 216 2,874.82Spiegel Inc Cl A . . . . . . . . . . . . . . . . . . 630 34.64 1,404 42.11 0 0.00Staples Inc . . . . . . . . . . . . . . . . . . . . . . 191 5,023.23 426 11,062.70 308 8,207.81Starbucks Corp . . . . . . . . . . . . . . . . . . 281 8,960.67 627 19,906.31 453 14,613.09State Street Corp . . . . . . . . . . . . . . . . . 134 6,804.20 299 14,889.50 216 11,108.35Sun Microsystems Inc . . . . . . . . . . . . . . 322 1,358.77 717 2,946.73 518 2,327.32Talbots Inc . . . . . . . . . . . . . . . . . . . . . . 328 9,905.13 732 21,988.24 529 15,763.46Tiffany & Co . . . . . . . . . . . . . . . . . . . . . 255 10,862.49 568 24,307.22 410 17,989.95Time Warner Inc (Formerly AOL Time
Warner Inc) . . . . . . . . . . . . . . . . . . . . 184 3,048.73 411 7,196.27 297 5,321.99Travelers Property Casualty Corp-Cl A . . 7 111.57 16 255.66 11 176.43Travelers Property Casualty Corp-Cl B . . 14 223.14 32 511.65 23 369.13Viacom Inc - Cl B . . . . . . . . . . . . . . . . . 109 4,411.02 243 10,028.14 176 7,581.72Wal-Mart Stores Inc . . . . . . . . . . . . . . . 114 6,037.15 254 13,174.36 183 9,718.67Wells Fargo & Co . . . . . . . . . . . . . . . . . 134 7,570.64 299 17,113.95 216 12,592.21Xerox Corp . . . . . . . . . . . . . . . . . . . . . 87 1,036.99 194 2,399.66 140 1,902.51Yahoo! Inc . . . . . . . . . . . . . . . . . . . . . . 67 2,832.62 149 6,065.50 108 4,693.46Zale Corp . . . . . . . . . . . . . . . . . . . . . . 133 6,946.26 297 15,585.83 215 11,228.92Tommy Hilfiger Corp . . . . . . . . . . . . . . . 134 1,774.07 299 3,940.63 216 2,909.38
Total Proceeds . . . . . . . . . . . . . . . . . $261,808.37 $586,474.62 $432,900.80
Per Unit . . . . . . . . . . . . . . . . . . . . . . $ 0.03537 $ 0.07960 $ 0.05938
Units outstanding . . . . . . . . . . . . . . . 7,402,837 7,367,837 7,289,837

Portfolio of SecuritiesAs of December 31, 2003
Shares orPar Value Security Market Value
50,317 AMB Property Corp . . . . . . . . . . . . . . . . . . . . . . . . . . . . . . . . . . . . . . . . . . . . . . . . . . $1,654,422.963,752 AT&T Corp. . . . . . . . . . . . . . . . . . . . . . . . . . . . . . . . . . . . . . . . . . . . . . . . . . . . . . . . . 76,165.606,076 AT&T Wireless Services Inc . . . . . . . . . . . . . . . . . . . . . . . . . . . . . . . . . . . . . . . . . . . . 48,547.24
27,418 Abercrombie & Fitch Co . . . . . . . . . . . . . . . . . . . . . . . . . . . . . . . . . . . . . . . . . . . . . . . 677,498.78298 Agere Systems Inc- Cl A . . . . . . . . . . . . . . . . . . . . . . . . . . . . . . . . . . . . . . . . . . . . . . . 908.90
4,875 Agere Systems Inc- Cl B . . . . . . . . . . . . . . . . . . . . . . . . . . . . . . . . . . . . . . . . . . . . . . . 14,137.5030,308 Allstate Corp . . . . . . . . . . . . . . . . . . . . . . . . . . . . . . . . . . . . . . . . . . . . . . . . . . . . . . . 1,303,850.1617,308 Amazon.com Inc . . . . . . . . . . . . . . . . . . . . . . . . . . . . . . . . . . . . . . . . . . . . . . . . . . . . 911,093.1237,886 AnnTaylor Stores, Inc . . . . . . . . . . . . . . . . . . . . . . . . . . . . . . . . . . . . . . . . . . . . . . . . . 1,477,554.001,564 Avaya Inc . . . . . . . . . . . . . . . . . . . . . . . . . . . . . . . . . . . . . . . . . . . . . . . . . . . . . . . . . 20,238.16
31,031 Bank of New York Co Inc . . . . . . . . . . . . . . . . . . . . . . . . . . . . . . . . . . . . . . . . . . . . . . 1,027,746.72508 Berkshire Hathaway Inc - Cl B . . . . . . . . . . . . . . . . . . . . . . . . . . . . . . . . . . . . . . . . . . . 1,430,020.00
25,980 Carnival Corp. . . . . . . . . . . . . . . . . . . . . . . . . . . . . . . . . . . . . . . . . . . . . . . . . . . . . . . 1,032,185.4037,521 Cisco Systems Inc . . . . . . . . . . . . . . . . . . . . . . . . . . . . . . . . . . . . . . . . . . . . . . . . . . . 911,385.0934,639 Citigroup Inc . . . . . . . . . . . . . . . . . . . . . . . . . . . . . . . . . . . . . . . . . . . . . . . . . . . . . . . 1,681,377.0615,877 Clear Channel Communications Inc . . . . . . . . . . . . . . . . . . . . . . . . . . . . . . . . . . . . . . . 743,519.916,072 Comcast Corp - Cl A . . . . . . . . . . . . . . . . . . . . . . . . . . . . . . . . . . . . . . . . . . . . . . . . . 199,586.64
28,856 Costco Wholesale Corp . . . . . . . . . . . . . . . . . . . . . . . . . . . . . . . . . . . . . . . . . . . . . . . 1,072,866.0825,253 Dell Inc . . . . . . . . . . . . . . . . . . . . . . . . . . . . . . . . . . . . . . . . . . . . . . . . . . . . . . . . . . . 857,591.8838,244 The Walt Disney Co . . . . . . . . . . . . . . . . . . . . . . . . . . . . . . . . . . . . . . . . . . . . . . . . . . 892,232.5256,950 EastGroup Properties Inc . . . . . . . . . . . . . . . . . . . . . . . . . . . . . . . . . . . . . . . . . . . . . . 1,844,041.0023,087 eBay Inc . . . . . . . . . . . . . . . . . . . . . . . . . . . . . . . . . . . . . . . . . . . . . . . . . . . . . . . . . . 1,491,189.3318,763 Fedex Corporation . . . . . . . . . . . . . . . . . . . . . . . . . . . . . . . . . . . . . . . . . . . . . . . . . . . 1,266,502.5027,058 The Gap Inc . . . . . . . . . . . . . . . . . . . . . . . . . . . . . . . . . . . . . . . . . . . . . . . . . . . . . . . 628,016.1817,404 Gucci Group . . . . . . . . . . . . . . . . . . . . . . . . . . . . . . . . . . . . . . . . . . . . . . . . . . . . . . . 1,488,912.2028,142 Home Depot Inc . . . . . . . . . . . . . . . . . . . . . . . . . . . . . . . . . . . . . . . . . . . . . . . . . . . . . 998,759.588,658 International Business Machines Corp . . . . . . . . . . . . . . . . . . . . . . . . . . . . . . . . . . . . . 802,423.44
24,528 Estee Lauder Companies - Cl A . . . . . . . . . . . . . . . . . . . . . . . . . . . . . . . . . . . . . . . . . . 962,969.2812,990 Level 3 Communications Inc . . . . . . . . . . . . . . . . . . . . . . . . . . . . . . . . . . . . . . . . . . . . 74,043.0017,318 Lexmark International Group Inc . . . . . . . . . . . . . . . . . . . . . . . . . . . . . . . . . . . . . . . . . 1,361,887.5252,599 Limited Brands . . . . . . . . . . . . . . . . . . . . . . . . . . . . . . . . . . . . . . . . . . . . . . . . . . . . . . 948,359.9741,865 Lowe’s Companies Inc . . . . . . . . . . . . . . . . . . . . . . . . . . . . . . . . . . . . . . . . . . . . . . . . 2,318,902.3518,763 Lucent Technologies Inc . . . . . . . . . . . . . . . . . . . . . . . . . . . . . . . . . . . . . . . . . . . . . . . 53,286.9243,302 Mattel Inc . . . . . . . . . . . . . . . . . . . . . . . . . . . . . . . . . . . . . . . . . . . . . . . . . . . . . . . . . 834,429.5428,860 Merrill Lynch & Co Inc . . . . . . . . . . . . . . . . . . . . . . . . . . . . . . . . . . . . . . . . . . . . . . . . 1,692,639.0028,855 Microsoft Corp . . . . . . . . . . . . . . . . . . . . . . . . . . . . . . . . . . . . . . . . . . . . . . . . . . . . . . 794,666.7023,091 Morgan Stanley . . . . . . . . . . . . . . . . . . . . . . . . . . . . . . . . . . . . . . . . . . . . . . . . . . . . . 1,336,276.1724,536 Nationwide Financial Services Inc -A . . . . . . . . . . . . . . . . . . . . . . . . . . . . . . . . . . . . . . 811,160.1659,165 Nextel Communications Inc-A . . . . . . . . . . . . . . . . . . . . . . . . . . . . . . . . . . . . . . . . . . . 1,660,169.9054,193 Office Depot Inc . . . . . . . . . . . . . . . . . . . . . . . . . . . . . . . . . . . . . . . . . . . . . . . . . . . . . 905,565.031,322 Priceline.Com Inc . . . . . . . . . . . . . . . . . . . . . . . . . . . . . . . . . . . . . . . . . . . . . . . . . . . . 23,663.80
23,799 Progressive Corp . . . . . . . . . . . . . . . . . . . . . . . . . . . . . . . . . . . . . . . . . . . . . . . . . . . . 1,989,358.4124,535 Qwest Communications International Inc . . . . . . . . . . . . . . . . . . . . . . . . . . . . . . . . . . . 105,991.2028,983 Sabre Holdings Corp . . . . . . . . . . . . . . . . . . . . . . . . . . . . . . . . . . . . . . . . . . . . . . . . . 625,742.9728,867 Sotheby’s Holdings Inc - Cl A . . . . . . . . . . . . . . . . . . . . . . . . . . . . . . . . . . . . . . . . . . . 394,323.2241,130 Staples Inc . . . . . . . . . . . . . . . . . . . . . . . . . . . . . . . . . . . . . . . . . . . . . . . . . . . . . . . . 1,122,849.0060,616 Starbucks Corp . . . . . . . . . . . . . . . . . . . . . . . . . . . . . . . . . . . . . . . . . . . . . . . . . . . . . 2,003,964.9628,855 State Street Corp . . . . . . . . . . . . . . . . . . . . . . . . . . . . . . . . . . . . . . . . . . . . . . . . . . . . 1,502,768.4069,275 Sun Microsystems Inc . . . . . . . . . . . . . . . . . . . . . . . . . . . . . . . . . . . . . . . . . . . . . . . . . 311,044.7570,711 Talbots Inc . . . . . . . . . . . . . . . . . . . . . . . . . . . . . . . . . . . . . . . . . . . . . . . . . . . . . . . . . 2,176,484.5854,839 Tiffany & Co . . . . . . . . . . . . . . . . . . . . . . . . . . . . . . . . . . . . . . . . . . . . . . . . . . . . . . . 2,478,722.8039,678 Time Warner Inc (Formerly AOL Time Warner Inc) . . . . . . . . . . . . . . . . . . . . . . . . . . . . . 713,807.221,499 Travelers Property Casualty Corp-Cl A . . . . . . . . . . . . . . . . . . . . . . . . . . . . . . . . . . . . . 25,153.223,074 Travelers Property Casualty Corp-Cl B . . . . . . . . . . . . . . . . . . . . . . . . . . . . . . . . . . . . . 52,165.78
23,494 Viacom Inc - Cl B . . . . . . . . . . . . . . . . . . . . . . . . . . . . . . . . . . . . . . . . . . . . . . . . . . . . 1,042,663.72

Portfolio of Securities (Continued)As of December 31, 2003
Shares orPar Value Security Market Value
24,536 Wal-Mart Stores Inc . . . . . . . . . . . . . . . . . . . . . . . . . . . . . . . . . . . . . . . . . . . . . . . . . . 1,301,634.8028,867 Wells Fargo & Co . . . . . . . . . . . . . . . . . . . . . . . . . . . . . . . . . . . . . . . . . . . . . . . . . . . . 1,699,977.6318,767 Xerox Corp . . . . . . . . . . . . . . . . . . . . . . . . . . . . . . . . . . . . . . . . . . . . . . . . . . . . . . . . 258,984.6014,435 Yahoo! Inc . . . . . . . . . . . . . . . . . . . . . . . . . . . . . . . . . . . . . . . . . . . . . . . . . . . . . . . . . 652,028.9528,728 Zale Corp . . . . . . . . . . . . . . . . . . . . . . . . . . . . . . . . . . . . . . . . . . . . . . . . . . . . . . . . . 1,528,329.6028,865 Tommy Hilfiger Corp . . . . . . . . . . . . . . . . . . . . . . . . . . . . . . . . . . . . . . . . . . . . . . . . . . 427,490.65
Total . . . . . . . . . . . . . . . . . . . . . . . . . . . . . . . . . . . . . . . . . . . . . . . . . . . . . . . . . . $58,744,277.75
2003 Year End SummaryUnits outstanding at year end . . . . . . . . . . . . . . . . . . . . . . . . . . . . . . . . . . . . . . . . . . . . . . . . . . . . 7,235,908Year end unit value:
Portfolio securities . . . . . . . . . . . . . . . . . . . . . . . . . . . . . . . . . . . . . . . . . . . . . . . . . . . . . . . . . . $ 7.7770Other assets, net . . . . . . . . . . . . . . . . . . . . . . . . . . . . . . . . . . . . . . . . . . . . . . . . . . . . . . . . . . 0.0092
$ 7.7862

GROWTH STOCK SERIES 22
IN
VE
ST
OR
SB
AN
K&
TR
UST
CO
MP
AN
Y
P.O.
Box
9130B
oston,M
assachusetts02117
CU
SIP
69590443301092
2003ANNUALREPORT
Sponsor:UBS Financial Services Inc.1285 Avenue of the AmericasNew York, New York 10019www.ubs.com/UIT
Trustee:Investors Bank & Trust CompanyP.O. Box 9130Boston, Massachusetts 02117(800) 356-2754
FIR
ST
CLA
SS
MA
IL
U.S
.PO
STA
GE
PA
ID
NE
WA
RK
,N
.J.
PE
RM
ITN
o.903