uc davis renewable energy anaerobic digestion … research and development division final project...
TRANSCRIPT

E n e r g y R e s e a r c h a n d D e v e l o p m e n t D i v i s i o n F I N A L P R O J E C T R E P O R T
UC DAVIS RENEWABLE ENERGY ANAEROBIC DIGESTION PROJECT
Feedstock Analysis and Performance Assessment
MARCH 2017 CE C-500-2017-021
Prepared for: California Energy Commission Prepared by: University of California, Davis

PREPARED BY: Primary Author(s): Ruihong Zhang (UC Davis) Mianfeng Zhang (UC Davis) Natthiporn Aramrueang (UC Davis) Josh Rapport (CleanWorld) University of California, Davis One Shields Ave Davis, CA 95616 Phone: 530-754-9530 | Fax: 530-752-2640 http://www.ucdavis.edu Contract Number: PIR-10-061 Prepared for: California Energy Commission Rizaldo Aldas / Gail Wigget Project Manager Aleecia Gutierrez Office Manager Energy Generation Research Office Laurie ten Hope Deputy Director ENERGY RESEARCH AND DEVELOPMENT DIVISION Robert P. Oglesby Executive Director
DISCLAIMER This report was prepared as the result of work sponsored by the California Energy Commission. It does not necessarily represent the views of the Energy Commission, its employees or the State of California. The Energy Commission, the State of California, its employees, contractors and subcontractors make no warranty, express or implied, and assume no legal liability for the information in this report; nor does any party represent that the uses of this information will not infringe upon privately owned rights. This report has not been approved or disapproved by the California Energy Commission nor has the California Energy Commission passed upon the accuracy or adequacy of the information in this report.

i
PREFACE
The California Energy Commission Energy Research and Development Division supports public interest energy research and development that will help improve the quality of life in California by bringing environmentally safe, affordable, and reliable energy services and products to the marketplace.
The Energy Research and Development Division conducts public interest research, development, and demonstration (RD&D) projects to benefit California.
The Energy Research and Development Division strives to conduct the most promising public interest energy research by partnering with RD&D entities, including individuals, businesses, utilities, and public or private research institutions.
Energy Research and Development Division funding efforts are focused on the following RD&D program areas:
• Buildings End-Use Energy Efficiency
• Energy Innovations Small Grants
• Energy-Related Environmental Research
• Energy Systems Integration
• Environmentally Preferred Advanced Generation
• Industrial/Agricultural/Water End-Use Energy Efficiency
• Renewable Energy Technologies
• Transportation
Feedstock Analysis and Performance Assessment is the final project of the UC Davis Renewable Energy Anaerobic Digestion Project (Contract Number PIR-10-061) conducted by University of California, Davis. The information from this project contributes to Energy Research and Development Division’s Renewable Energy Technologies Program.
When the source of a table, figure or photo is not otherwise credited, it is the work of the author of the report.
For more information about the Energy Research and Development Division, please visit the Energy Commission’s website at www.energy.ca.gov/research/ or contact the Energy Commission at 916-327-1551.

ii
ACKNOWLEDGEMENTS
This research was made possible by funding support from the California Energy Commission, University of California, Davis, and CleanWorld. Technical and project management contributions were made by many individuals from University of California, Davis and CleanWorld. The following individuals are the major contributors for this report.
University of California, Davis:
Ruihong Zhang, Mianfeng Zhang, Natthiporn Aramrueang, Sid England
CleanWorld:
Josh Rapport, Steve Tourigny, Jason Woldseth, Brad Jacobson,
Michele Wong

iii
ABSTRACT
The University of California, Davis and CleanWorld, in January 2014, built the Renewable Energy Anaerobic Digester Facility to generate electricity from organic waste. The facility was designed to treat 50 tons of organic waste per day using a three-stage thermophilic anaerobic digestion system.
The research team analyzed the feedstock’s characteristics and assessed the performance and processes of equipment used in the digester facility, paying special attention to feedstock conversion, biogas, and energy generation. Data collection and analysis was performed over the course of a year with the digesters consistently being at 60 percent capacity.
The analysis proved the facility operated as planned. Results from this study show that anaerobic digester technology can potentially be adapted to many other facilities in California to reduce the amount of organic waste going into landfills.
Keywords: Anaerobic digester, biomass, renewable energy, biogas
Please use the following citation for this report:
Zhang, Ruihong; Zhang, Mianfeng; Aramrueang, Natthiporn. (UC Davis). 2015. UC DAVIS RENEWABLE ENERGY ANAEROBIC DIGESTION PROJECT Feedstock Analysis and Performance Assessment. California Energy Commission. Publication number: CEC-500-2017-021.

iv
TABLE OF CONTENTS
PREFACE ..................................................................................................................................................... i
Acknowledgements ................................................................................................................................. ii
ABSTRACT .............................................................................................................................................. iii
TABLE OF CONTENTS ......................................................................................................................... iv
LIST OF FIGURES .................................................................................................................................... v
LIST OF TABLES .................................................................................................................................... vi
EXECUTIVE SUMMARY ........................................................................................................................ 1
Introduction ........................................................................................................................................ 1
Project Purpose ................................................................................................................................... 1
Project Process and Results ............................................................................................................... 1
Benefits to California ......................................................................................................................... 2
CHAPTER 1: Overview of UC Davis READ Facility and Research Objectives ........................... 3
CHAPTER 2: Characteristics and Variability of Biomass Feedstock ............................................. 5
2.1 Feedstock Handling and Preprocessing ................................................................................. 5
2.1.1 Feedstock Handling and Preprocessing ......................................................................... 5
2.1.2 Feedstock Type and Amount ........................................................................................... 5
2.2 Characteristics and Compositions of Biomass Feedstock .................................................... 7
2.2.1 Feedstock Sampling and Measurement .......................................................................... 7
2.2.2 Solids Analyses ................................................................................................................... 7
2.2.3 Compositional Analyses ................................................................................................... 8
CHAPTER 3: Anaerobic Digester Performance ............................................................................... 10
3.1 Biogas Production .................................................................................................................... 10
3.1.1 Biogas Composition ......................................................................................................... 10
3.1.2 Biogas Composition through Biogas Cleaning Process .............................................. 11
3.2 Energy Production and Consumption .................................................................................. 13
3.2.1 Electricity Production and Net Energy Generation .................................................... 13
3.3 Energy Consumption of Operational Equipment ............................................................... 16

v
3.4 Digester Effluent Characterizations ...................................................................................... 18
3.4.1 Characteristics of Digester Effluent ............................................................................... 18
3.4.2 pH of Digester .................................................................................................................. 19
3.5 Performance Assessment of READ Facility for the highest feedstock loading period .. 20
3.5.1 Feedstock Handling and Pre-Processing ...................................................................... 20
3.5.2 Biogas and Methane Production .................................................................................... 21
3.5.3 Energy Production ........................................................................................................... 23
CHAPTER 4: Conclusions ...................................................................................................................... 25
GLOSSARY .............................................................................................................................................. 26
REFERENCES .......................................................................................................................................... 27
LIST OF FIGURES
Figure 1: UC Davis Anaerobic Digestion Renewable Energy Facility ................................................ 4
Figure 2: Bioseparator for Feedstock Preprocessing ............................................................................. 5
Figure 3: Digester Feedstock Examples .................................................................................................. 6
Figure 4: Monthly Feedstock Loadings over One-Year Operational Period ..................................... 7
Figure 5: Daily Biogas Production During One-Year ......................................................................... 10
Figure 6: Methane Content of Biogas .................................................................................................... 11
Figure 7: Biogas Sampling ...................................................................................................................... 12
Figure 8: Biogas Samples ......................................................................................................................... 12
Figure 9: UC Davis READ Daily Electricity Production March 15, 2014-February 28, 2015 ......... 14
Figure 10: UC Davis READ Daily Net Electricity Delivered March 15, 2014-February 28, 2015 .. 15
Figure 11: UC Davis READ Microturbine Power Output March 15, 2014-February 28, 201516
Figure 12: Power Use Monitoring .......................................................................................................... 17
Figure 13: Solids Content of Digester Effluents ................................................................................... 19
Figure 14: Ammonia Concentration of Digester Effluents ................................................................. 19
Figure 15: Daily pH of the Digester Tanks Operational March 15, 2014-February 28, 2015 ......... 20
Figure 16: Weekly Feedstock Loadings January-February 2015 ....................................................... 21

vi
Figure 17: Daily Biogas Production January-February 2015 .............................................................. 22
Figure 18: Daily Methane Production January-February 2015 .......................................................... 22
Figure 19: Methane Content of Biogas Produced January-February 2015 ....................................... 23
Figure 20: UC Davis READ Daily Electricity Production and Consumption.................................. 23
During January-February 2015 .............................................................................................................. 23
Figure 21: UC Davis READ Daily Net Electricity Delivered January -February 2015 ................... 24
Figure 22: UC Davis READ Microturbine Power Output January-February 2015 ......................... 24
LIST OF TABLES Table 1: Solids Analysis Results of the Major Feedstock Types .......................................................... 8
Table 2: Nutrient Contents of Major Feedstock (Data Reported on Wet Basis) ................................ 9
Table 3: Salt Contents of Major Feedstock (Data Reported as Wet Basis) .......................................... 9
Table 4: Biogas Composition before and after Cleaning Process as Measured Using Portable Biogas Analyzer........................................................................................................................................ 13
Table 5: Energy Consumption of Operational Equipment ................................................................ 18

1
EXECUTIVE SUMMARY
Introduction
Californians create nearly 2,900 pounds of household garbage and industrial waste every second; although more than half of this waste is recovered and recycled or used to make energy, 37 million tons of material still goes to disposal each year. Electricity from biomass (or waste) is generated by burning or decomposing organic matter. In 2015, more than 6,000 gigawatt hours of electricity in homes and businesses were produced from biomass: burning forestry, agricultural and urban biomass, converting methane-rich landfill gas to energy and processing wastewater and diary biogas into useful energy.
To combat the amount of waste California produces, CleanWorld and the University of California, Davis (UC Davis) developed the UC Davis Renewable Energy Anaerobic Digestion (READ) system as a sustainable waste to energy facility. The READ facility, which has been operational since January 2014, was designed to treat 50 tons of organic waste per day, with an electrical generation capacity of 690 kW from biogas, including an additional 235 kW electrical generation capacity from landfill gas.
Project Purpose
The UC Davis READ facility is one of 132 waste-to-energy plants in California generating almost 3.5 percent of the state’s electricity supply. To verify the READ facility was operating as expected, researchers assessed the performance of processes and equipment used in the READ facility for feedstock conversion, biogas and energy generation.
Project Process and Results
Data collection and analyses were performed from March 2014 to February 2015, with a total of 3,730 tons of waste processed through the READ facility. The feedstock was composed of waste from UC Davis dining halls, food supply companies, restaurants, retail stores, tomatoes, ice cream, dairy products, mouse bedding, and horse manure. In January and February 2015, the monthly feedstock reached 668 tons, allowing the digesters to operate at 60 percent capacity. Feedstock loading was limited by the amount of effluent(produced waste) wastes that could be disposed of off-site. Most of the digester’s effluentwas transported to local farms.
The daily average methane content of biogas was 60 percent and the highest amount of biogas produced was January 2015 with 222,802 standard cubic feet per day. Total electricity production during January and February 2015 was 137,912 kiloWatthours (kWh), with 43,115 kWh electricity delivered to the grid. The energy consumption of major processes and equipment were measured. Researchers found that feedstock processing (separation and grinding), digester mixing, and biogas cleaning skid are major energy consumers. The feedstock processing used more than 40 percent energy consumed by the facility. Overall, the READ facility performed as well as expected from the designs. Any mechanical and operational problems were addressed quickly to allow the continuous operation of anaerobic digesters and biogas energy conversion equipment.

2
Benefits to California
Using biomass to produce electricity reduces California reliance on fossil fuels and the largest contributors to air pollution and greenhouse gasses. The READ facility shows that anaerobic digesters are practical solutions to reduce the amount of waste in landfills and power large facilities. This technology continues to reduce California’s carbon footprint and help the state meet its 2020 renewable energy goals.

3
CHAPTER 1: Overview of UC Davis READ Facility and Research Objectives In January 2014, UC Davis and CleanWorld designed and constructed the UC Davis Renewable Energy Anaerobic Digester (READ) Facility using the high solids anaerobic digestion technology developed at UC Davis. The background information for the development of READ facility is provided in the reports by HDR (2011) and Zhang (2014). The READ facility was designed to treat 50 tons of organic waste per day at an average of 25 percent total solids content.
The facility has four anaerobic tanks, including three anaerobic reactors and one buffer/effluent storage tank. The three anaerobic reactors are operated at a thermophilic temperature (120-135°F) with a total working volume of 450,000 gallons. The facility has four Capstone C200 Microturbines (CARB approved 31% +/- 2% efficiency, each rated at 200 kW) for co-generation of electricity and heat and an organic Rankine-cycle (ORC) engine-generator (rated at 125 kW) for converting waste heat from the microturbines into additional electricity. The biogas produced from anaerobic digesters and landfill gas collected from nearby landfill are combined and supplied to the microturbines for energy generation. At full capacity, biogas accounts for approximately 75 percent of the gas energy supply with the rest from landfill gas. The gases are cleaned using a series of filters (water vapor via chiller, H2S via iron sponge, siloxanes and volatile organic carbons via carbon filter) prior to the microturbines. Figure 1 shows the anaerobic digesters and other equipment at READ. The objectives of this research were to analyze the feedstock characteristics for anaerobic digesters and assess the performance of processes and equipment used in the READ facility with respect to feedstock conversion, biogas and energy generation.

4
Figure 1: UC Davis Anaerobic Digestion Renewable Energy Facility

5
CHAPTER 2: Characteristics and Variability of Biomass Feedstock 2.1 Feedstock Handling and Preprocessing 2.1.1 Feedstock Handling and Preprocessing
Biomass feedstock was delivered to READ, and the total feedstock weight received was recorded at the site. The weight data were recorded in a logbook and later transferred to a computer database for analysis.
The feedstock was then processed through a “bioseparator” processor (DODA Inc.) to separate digestible materials (e.g. food waste, animal manure, straw and paper) from non-digestible materials (e.g. plastics, metal), reduce the particle size of digestible materials through grinding, and pump them into the digester tank (Figure 2). The non-digestible materials were weighed so the amount of digestible materials could be determined as the difference between the total and non-digestible.
Figure 2: Bioseparator for Feedstock Preprocessing
2.1.2 Feedstock Type and Amount
The UC Davis READ facility operated continuously for more than a year with various food wastes and other organic wastes as feedstock. Feedstock included food waste from UC Davis dining halls, commercial restaurants, mouse bedding from a commercial biotech company, horse manure from a UC Davis facility, produce wastes from retail stores, food wastes from commercial food supply companies, tomato wastes, ice cream products, and dairy products. Figure 3 shows the examples feedstock loaded into the digester.

6
From March 2014 - February 2015, the main types of feedstock were UC Davis food wastes (341 tons), mouse bedding (203 tons), produce wastes from market and retail stores (1847 tons), tomato wastes (319 tons), and ice cream (366 tons).
Figure 3: Digester Feedstock Examples
Over one-year operation of the digester during March 2014 – February 2015, a total of 3,730 tons of wastes were processed through the bioseparator, from which 3,536 tons of biodegradable organic matter were separated and loaded into the anaerobic digesters accounting for 95% of the processed wastes.
Figure 4 shows the total amount of feedstock processed and loaded, monthly feedstock loading increased from an average from 178 ton/month in the first quarter (April-June 2014) to 188 (July – September 2014), 359 (October-December 2014) , and 668 ton/month (January-February 2015). Further increase was limited by the capability of disposing the digester effluent off site. Up to September 2014, the digester was operated as 13% of the full design capacity. The feedstock loading increased to a higher level afterward. During January and February, 2015, the facility operated at 60% of the design capacity.

7
Figure 4: Monthly Feedstock Loadings over One-Year Operational Period
2.2 Characteristics and Compositions of Biomass Feedstock 2.2.1 Feedstock Sampling and Measurement
Organic waste samples were collected after preprocessing through the bioseparator during the one-year period from March 2014 to February 2015. Feedstock samples also were taken regularly for each main type of feedstock loaded into the digester.
During each sampling, the material was collected throughout the bioseparator processing period, mixed into 5-gallon bucket, and kept refrigerated before quickly transported to the Bioenvironmental Engineering Research Laboratory (BEE) for solids and compositional analyses.
When the bucket was received at the BEE lab, the feedstock sample was homogenized using a food processor. Sample was withdrawn for analysis. On a regular basis, the solid analysis was performed right after receiving the sample at the BEE laboratory. When the digester reached steady state, in addition to solid analysis, samples were collected from each feedstock type and stored frozen at -20 ºC for compositional analyses. The compositional analyses included nutrients (nitrogen, phosphorus, potassium, sulfur), and salt elements (chloride, sodium, calcium, magnesium).
2.2.2 Solids Analyses
All substrates were measured for solid contents, including total solids (TS), volatile solids (VS), and fixed solids (FS, or ash). The results for TS and VS are shown in Tables 1. Duplicate tests were performed for all samples.
Solids analysis results are presented in Table 1. In an average for solids contents of each major feedstock type, UC Davis food waste contained about 33±18.6 % TS and VS/TS ratio of about
-
200
400
600
800M
onth
ly F
eeds
tock
load
ing
(ton
) Tons Processed
Tons Loaded

8
90.3%. Commercial food waste has 31.5 ± 3.9 % TS. Mouse bedding has highest total solids content of about 85 ± 4.9 % TS. Horse manure has about 58.1 ± 0.1 % TS with the lowest VS/TS ratio of about 72.9%.
Table 1: Solids Analysis Results of the Major Feedstock Types
Feedstock Sample Number TS(%) VS(%) VS/TS(%)
UC Davis Food Waste 29 33.0±18.6 29.6±16.6 90.3±5.0
Commercial Food Waste 6 31.5±3.6 27.9±2.8 88.8±4.5
Produce Food Waste 6 12.6±0.9 11.3±0.7 90.2±2.4
Prison Food Waste 3 22.7±1.6 21.7±1.7 95.4±0.5
Ice Cream Waste 5 44.5±8.4 43.4±8.1 97.6±0.4
Tomato Waste 6 7.3±0.5 6.6±0.5 89.7±1.9
Municipal Organic Solid Waste 5 34.7±1.3 31.2±0.9 89.9±0.9
Mouse Bedding 11 85.0±9.6 79.3±8.2 93.3±0.8
2.2.3 Compositional Analyses
Tables 2 and 3 present analytical results for nutrients, carbon-to-nitrogen ratio (C/N), and salt elements of the major feedstock, including UC Davis food waste, commercial food waste, produce waste, municipal solid waste, horse manure, mouse bedding, tomato wastes, and ice cream waste.
Nitrogen (N) content of the feedstock varied from 1.3-3.6% wb. Potassium (K) and phosphorus (P) are in the range of 0.4-2.4% and 0.2-0.9% wb, respectively. The total salt content, from calcium, magnesium, sodium, and chloride, was in the range of 0.8-5.0% wb. Samples from commercial food waste and municipal organic solid waste have relatively high salt content of 4.7-5.0 % wb. Other feedstock samples contain salt content approximately 1-2% wb.

9
Table 2: Nutrient Contents of Major Feedstock (Data Reported on Wet Basis)
Nutrients
Sample N (%) P (%) K (%) S(%)
UC Davis food waste 3.13 ± 0.15 0.44 ± 0.12 0.89 ± 0.35 0.61 ± 0.06
Commercial food waste 2.65 ± 0.07 0.54 ± 0.03 0.62 ± 0.03 0.5 ± 0.17
Produce food wastes 1.98 ± 0.49 0.38 ± 0.15 2.41 ± 0.80 0.49 ± 0.03
Municipal organic solid waste
2.66 ± 1.20 0.34 ± 0.21 0.79 ± 0.16 0.61 ± 0.04
Horse manure 1.31 ± 0.05 0.31 ± 0.03 1.37 ± 0.08 0.38 ± 0.03
Mouse bedding 3.21 ± 0.54 0.92 ± 0.12 1.11 ± 0.04 0.45 ± 0.04
Tomato waste 3.61 ± 0.74 0.34 ± 0.07 2.03 ± 0.29 0.63 ± 0.05
Ice cream waste 1.53 ± 0.91 0.18 ± 0.03 0.39 ± 0.07 0.20 ± 0.02
Table 3: Salt Contents of Major Feedstock (Data Reported as Wet Basis)
Salt Elements
Sample Ca (%) Mg (%) Na (%) Cl (ppm)
UC Davis food waste 0.97 ± 0.56 0.12 ± 0.08 0.70 ± 0.27 9,717 ± 3,651
Commercial food waste 3.14 ± 0.33 0.13 ± 0.02 0.61 ± 0.04 10893 ± 1,618
Produce wastes 0.59 ± 0.29 0.21 ± 0.08 0.32 ± 0.16 4,713 ± 2,662
Municipal organic solid waste
1.85 ± 2.08 0.11 ± 0.01 1.10 ± 0.95 16,670 ± 13,067
Horse manure 0.75 ± 0.05 0.78 ± 0.03 0.17 ± 0.01 2,303 ± 282
Mouse bedding 1.34 ± 0.23 0.29 ± 0.03 0.25 ± 0.04 3,213 ± 825
Tomato waste 1.20 ± 0.26 0.25 ± 0.08 0.15 ± 0.08 2,353 ± 656
Ice cream waste 0.24 ± 0.04 0.05 ± 0.01 0.21 ± 0.05 3,145 ± 1,379

10
CHAPTER 3: Anaerobic Digester Performance 3.1 Biogas Production Biogas production was continually measured and recorded through in-line gas flow meters. Methane content of biogas was measured and recorded using an in-line gas analyzer. Biogas composition was also measured and checked weekly by taking gas samples from ports installed in the reactor pipeline and analyzing the samples using gas chromatography (GC) and handheld biogas meter (Landtec 5000).
Figure 5 shows daily biogas production for one-year operational period. The average daily biogas production increased for each quarter from 30,901 (Apr-Jun), 37,095 (Jul-Sep), 45,841 (Oct-Dec), and 87,006 (Jan-Feb) standard cubic foot per day (scf/d). Biogas production and methane content varied due to quantity of feedstock loading and loading schedule. The maximum daily biogas production achieved was 222,802 scf/d in January 2015.
No biogas production was monitored and recorded at certain periods during November and December 2014 as a result of a gas meter out of service from maintenance for gas skid and power generator.
Figure 5: Daily Biogas Production During One-Year
3.1.1 Biogas Composition
Mean daily methane content of biogas produced at the READ facility over the one-year operational period is shown in Figure 6. The daily average methane content during one year was 60 ± 6%. The maximum and minimum methane content was 73% and 39%, respectively. The methane content varied depending on the type of feedstock and the health of the microbial
0
50,000
100,000
150,000
200,000
250,000
Bio
gas P
rodu
ctio
n (s
cf/d
)

11
population. Low methane content occurred when the feedstock loading was higher than expected with examples shown early October 2014 and the end of January 2015.
Figure 6: Methane Content of Biogas
3.1.2 Biogas Composition through Biogas Cleaning Process
The quality of biogas was analyzed before and after cleaning by biogas cleaning skid to remove moisture and hydrogen sulfide (H2S). For onsite biogas measurement, biogas composition was measured weekly using Landtec Biogas 5000 portable biogas analyzer. Before gas collection, the port valve was opened at least 1 minute for flushing the pipeline and stabilizing biogas content. The biogas was analyzed for the contents of methane (CH4), carbon dioxide (CO2), and hydrogen sulfide (H2S).
Periodically, the biogas sample was collected from gas sampling port to a Tedlar bag. Each biogas sample was analyzed in duplicates. After sampling, gas samples were transferred immediately to UC Davis Bioenergy and Environmental Engineering lab. The biogas sample was analyzed for methane (CH4), carbon dioxide (CO2), and hydrogen (H2) using gas chromatography (GC). The results from GC measurements were used to check with the results from the portable gas analyzer.
Figures 7 and 8 show the biogas sampling on site and biogas samples in Tedlar bags. The results for biogas composition before and after biogas cleaning process are presented in Table 4. The measurement was performed in duplicates. The H2S content of raw biogas was low initially and then increased to as high as 1680 ppm. The H2S removal efficiency was 75% at the high concentration.
0
20
40
60
80
Met
hane
Con
tent
(%)

12
Figure 7: Biogas Sampling
Figure 8: Biogas Samples

13
Table 4: Biogas Composition Before and After Cleaning Process as Measured Using Portable Biogas Analyzer
Before Gas Cleaning After Gas Cleaning
Date CH4 (%) CO2 (%) H2S (ppm) CH4 (%) CO2 (%) H2S
(ppm)
8/15/14 66.6 31.6 295 60.8 36.1 29
8/28/14 59.8 39.9 583 60.4 38.9 6
9/12/14 58.3 40.8 576 57.5 42.3 12
9/24/14 43.4 49 902 41.4 43.1 21
10/1/14 59.2 39.6 970 59.6 40.2 32
11/5/14 51.8 47.1 690 52.4 46.9 41
11/12/14 59.8 39.4 890 57.3 41.6 54
11/19/14 63.8 36.1 1100 64.2 35.5 72
12/4/14 52.6 45.9 1245 54.1 43.8 66
12/18/14 62.7 35.9 975 63.1 35.1 80
1/8/15 57.3 41.8 1482 58.2 40.9 98
1/22/15 61.8 36.2 1730 62.3 37.1 115
2/5/15 65.4 33.6 870 64.6 34.2 101
2/12/15 53.2 44.8 934 54.7 43 89
2/19/15 44.9 53.1 1435 45.2 53.4 390
2/26/15 55.8 43.6 1680 56.9 41.4 438
3.2 Energy Production and Consumption 3.2.1 Electricity Production and Net Energy Generation
3.2.1.1 Electricity Production and Electricity Generation
During a one-year operational period, UC Davis READ facility generated electricity through the micro-combustion of biogas using microturbine. The data for electricity production, net electricity delivered, and net power output were automatically monitored and recorded.
Electricity production increased corresponding to the increase in feedstock loading and biogas production. Figures 9 and 10 show the electricity production and net generation from the READ facility. The electricity production profile follows those of biogas production shown in Figure 4.

14
The average daily electricity production over one-year period from March 15, 2014-February 28, 2015 was 2,002 kWh/d, disregarding engine shut off times without electricity production. The maximum daily electricity produced achieved 8,302 kWh/d.
There was no electricity production for certain periods. During September, data storage unit failed resulting to the missing of some power production data. During October to December there were periods when the microturbines were not running and no data for electricity production were recorded from maintenance on the microturbines and the gas processing skid. During these periods, the biogas produced went to flare instead of producing electricity.
At the start-up phase, feedstock loading gradually increased. The digester was operated at a lower feedstock loading than the full digester capacity allowed for, resulting in the negative net electricity output. Toward the end of the period, when larger amount of feedstock was fed into the digester, READ facility had positive net energy generation.
Figure 9: UC Davis READ Daily Electricity Production March 15, 2014-February 28, 2015
-
2,500
5,000
7,500
10,000
Ele
ctri
city
Pro
duct
ion
(kW
h/d)

15
Figure 10: UC Davis READ Daily Net Electricity Delivered March 15, 2014-February 28, 2015
Note: negative values indicate more consumption than production of electricity resulting in a net power use. 3.2.1.2 Microturbine Net Power Output
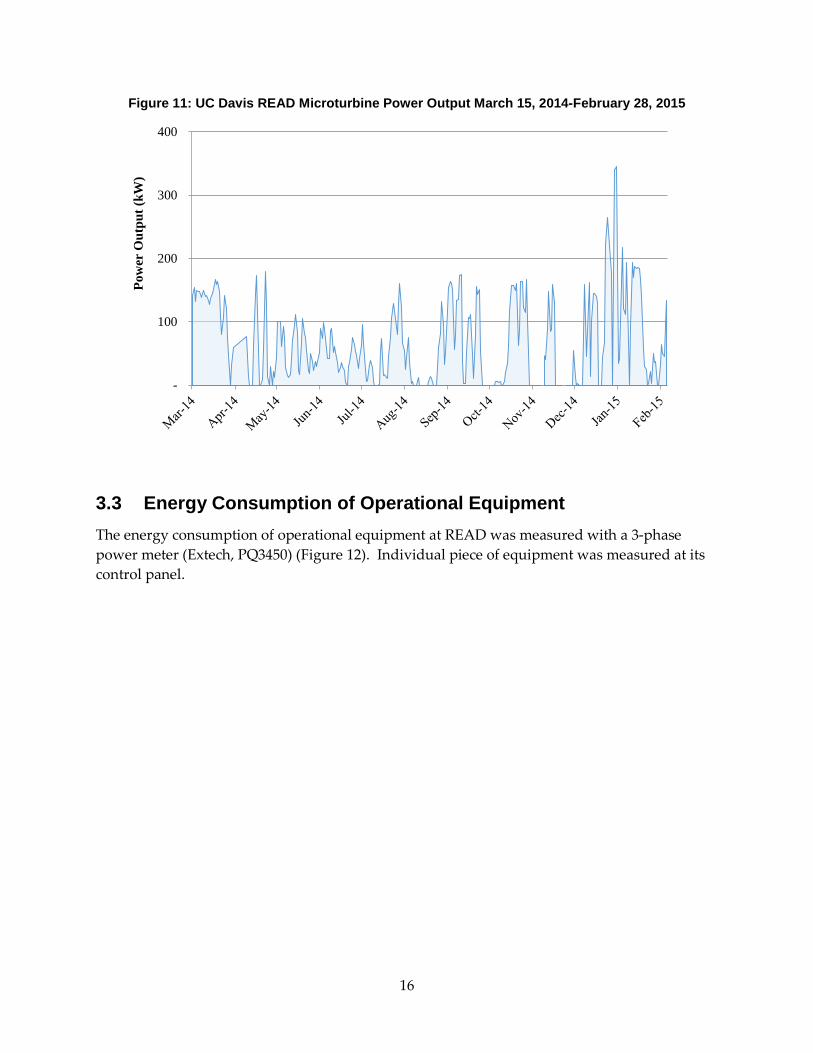
Figure 11 shows power output from microturbine during March 15, 2014 to February 28, 2015. The average net daily power output over one-year period from March 15, 2014-February 28, 2015 was 85 kW. The maximum daily net power output was 346 kW.
-2,500
0
2,500
5,000
7,500N
et E
lect
rici
ty D
eliv
ere
(kW
h/d)
16
Figure 11: UC Davis READ Microturbine Power Output March 15, 2014-February 28, 2015
3.3 Energy Consumption of Operational Equipment The energy consumption of operational equipment at READ was measured with a 3-phase power meter (Extech, PQ3450) (Figure 12). Individual piece of equipment was measured at its control panel.
-
100
200
300
400Po
wer
Out
put (
kW)

17
Figure 12: Power Use Monitoring
Equipment including microturbines and Organic Rankin Cycle (ORC) generator were considered as electricity generation units thus were not monitored for energy consumption. The output from microturbines and ORC were automatically monitored and recorded through onsite data storage unit.
The bioseparator averaged 60kW during five hours of testing when it processed commercial food waste, dairy waste and mouse bedding. Its operation power varied from 30 kW to 85 kW, depending on the feedstock. When processing mouse bedding, bioseparator used as low as 30 kW power. While processing commercial food waste and dairy waste that contained contaminants such as plastic containers and bags and metallic packaging materials, the bioseparator used as high as 85 kW power. The operation time data of various equipment are based on the estimates of facility operation (Table 5). The actual operation time of each process may vary due to the needs for occasional adjustment. The bioseparator consumed the most energy. Its energy consumption accounted for 45.8% of the total energy consumption of the facility. Gas cleaning skid was the second energy consumer and its energy consumption was 16.5% of the total.

18
Table 5: Energy Consumption of Operational Equipment
Process Equipment Operation Power (kW)
Operation Time (h/day)
Energy Consumption
(kWh/day)
Energy Consump.
Distribution
(%)
Feedstock Processing
Doda Separator 60.09 8 480.71 45.8
Tanks Tank1 Top Mixer 12.07 6 72.40 6.9
Tank1 Side Mixer 21.92 6 131.51 12.5
Tank2 Top Mixer 5.99 6 35.96 3.4
Skid B Pump 1* 11.58 6 69.47 6.6
Skid B Pump 2** 3.50 6 20.99 2.0
Skid A Pump 1*** 10.97 6 65.82 6.3
Gas Processing
Gas Skid 7.23 24 173.41 16.5
Total 1050.28 100
*Skid B pump 1 is used for both tanks 1 and 2 hydraulic mixing and feeding. ** Skid B pump 2 is used for liquid return while feeding. *** Skid A pump 1 is used for hydraulic mixing for Tank 3.
3.4 Digester Effluent Characterizations
3.4.1 Characteristics of Digester Effluent
Effluent samples of pilot digesters were collected weekly and analyzed for pH, solids and ammonia contents at BEE lab.
As shown in Figure 13, TS content of digester effluent increased corresponding to the increasing in the amount of feedstock loading. After a two-month start-up period, the range of TS for each digester tank were 2.0-7.2 %TS (tank 1), 1.4-6.9 %TS (tank 2), 1.1-6.0%TS (tank 3), and 1.1-5.7 %TS (tank 4), respectively. The TS contents were 6.6 %TS for tank 1, and in the range of 3.4-4.3 %TS for tank 2-4 at the end of operation during January-February. Table 6 shows the results for solids contents and ammonia concentration of the digester effluent.
As presented in Figure 14, ammonia concentration increased over time with the increasing organic loading, and was stabilized at around 3,310-3,513 ppm toward the end of operation.

19
Figure 1: Solids Content of Digester Effluents
Figure 14: Ammonia Concentration of Digester Effluents
3.4.2 pH of Digester
Figure 15 shows the pH of the digester tanks. The pH of the digester in tank 3 and 4, which are polishing and buffer tank, were stable over one-year operation in the range of 7-8. Whereas, the pH of digester tank 1 (hydrolysis tank) and tank 2 (methanogenic tank) were relatively lower and fluctuated according to the amount and types of feedstock loaded. The missing data in the figure was a result from pH probe failures. For the last two months, the average pH of the digester tanks were 6.0 ± 0.9 (tank 1), 6.7 ± 0.7 (tank 2), 7.7 ± 0.2 (tank 3), 8.0 ± 0.2 (tank 4), respectively.
0
2
4
6
8
May-14 Jun-14 Jul-14 Jul-14 Aug-14 Sep-14 Oct-14 Nov-14 Dec-14 Jan-15 Feb-15
Tot
al S
olid
s (%
) Digester tank 1
Digester tank 2
Digester tank 3
Digester tank 4
0
1000
2000
3000
4000
5000
May-14 Jun-14 Jul-14 Jul-14 Aug-14 Sep-14 Oct-14 Nov-14 Dec-14 Jan-15 Feb-15
Am
mon
ia c
onte
nt (p
pm)
Digester tank 1
Digester tank 2
Digester tank 3
Digester tank 4

20
Figure 2: Daily pH of the Digester Tanks Operational March 15, 2014-February 28, 2015
3.5 Performance Assessment of READ Facility for the highest feedstock loading period To assess the digester performance, the data collected from the last two-month operational period (January and February, 2015), were analyzed.
3.5.1 Feedstock Handling and Pre-Processing
In January and February of 2015, READ facility processed 715 and 695 tons of feedstock (wet basis) through bioseparator, respectively. The amount of feedstock loaded into the digester was 668 tons for each month, accounting for 95% of the total feedstock processed. Figure 16 shows weekly feedstock processed and loaded during that period. Average feedstock processed and loaded were 157 and 149 ton/week, respectively. The maximum and minimum feedstock loads into the digester were 229 and 33 ton/week, respectively.
1
3
5
7
9
11
13
Mar-14 Apr-14 May-14 Jun-14 Jul-14 Aug-14 Sep-14 Oct-14 Oct-14 Nov-14 Dec-14 Jan-15 Feb-15
Digester tank 1
Digester tank 2
Digester tank 3
Digester tank 4

21
Figure 3: Weekly Feedstock Loadings January-February 2015
3.5.2 Biogas and Methane Production
During January-February, 2015, the total production for biogas and methane were 4,959,362 scf and 3,010,403 scf, respectively. Figures 17 and 18 show the daily production of biogas and methane, respectively. An average daily biogas production was 87,006 scf/d. The maximum daily biogas production reached 222,802 scf/d. Daily methane production averaged 57,892 scf/d with a maximum production of 141,947 sfc/d. The yield of biogas and methane were 3,710 scf of biogas/ton feedstock (wb), and 2,252 scf of CH4/ton feedstock (wb), respectively.
The biogas production decreased after the second week of February due to pH decrease below 6.5 in digester tank 2 where optimal pH is above 7. This pH decrease might have been caused by intensive ice cream loading during that period.
Methane content of biogas produced is shown in Figures 19. The average methane content was 60%. The maximum and minimum methane content was 70% and 45%, respectively. The lowest methane content correlated with low pH, indicating that the drop in methane content was due to process instability. By the end of February, 2015, the methane content and pH had returned to normal, indicating that the system is robust in the face of process upsets.
-
100
200
300
1-Jan 8-Jan 15-Jan 22-Jan 29-Jan 5-Feb 12-Feb 19-Feb 26-Feb
Wee
kly
Feed
stoc
k lo
adin
g (t
on)
Tons Processed Tons Loaded

22
Figure 4: Daily Biogas Production January-February 2015
Figure 5: Daily Methane Production January-February 2015
0
50,000
100,000
150,000
200,000
250,000
1-Jan 8-Jan 15-Jan 22-Jan 29-Jan 5-Feb 12-Feb 19-Feb 26-Feb
Bio
gas P
rodu
ctio
n (s
cf/d
)
-
20,000
40,000
60,000
80,000
100,000
120,000
140,000
160,000
1-Jan 8-Jan 15-Jan 22-Jan 29-Jan 5-Feb 12-Feb 19-Feb 26-Feb
Met
hane
Pro
duct
ion
(scf
/d)

23
Figure 6: Methane Content of Biogas Produced January-February 2015
3.5.3 Energy Production
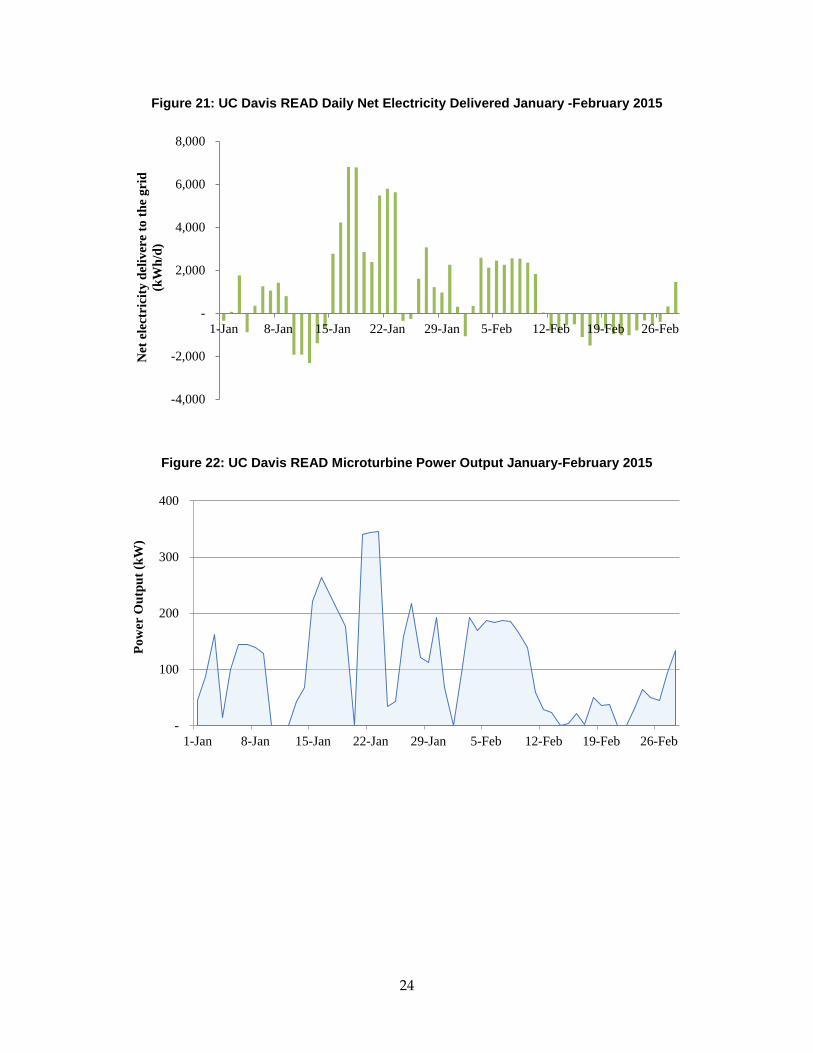
Figures 20-22 show the electricity production and consumption, net electricity generation, and power output from READ facility during January and February 2015. The average daily electricity production was 2,420 kWh/d, with the maximum production being 8,302 kWh/d. Total electricity production during this two-month period was 137,912 kWh, contributing to the net electricity delivered to the grid of 43,115 kWh.
Figure 20: UC Davis READ Daily Electricity Production and Consumption
During January-February 2015
0
20
40
60
80
1-Jan 8-Jan 15-Jan 22-Jan 29-Jan 5-Feb 12-Feb 19-Feb 26-Feb
Met
hane
Con
tent
(%)
0
2000
4000
6000
8000
10000
1-Jan 8-Jan 15-Jan 22-Jan 29-Jan 5-Feb 12-Feb 19-Feb 26-Feb
Ele
ctri
city
(kW
h/d)
Electricity Production (kWh/d) Electricity Consumption (kWh/d)
24
Figure 21: UC Davis READ Daily Net Electricity Delivered January -February 2015
Figure 22: UC Davis READ Microturbine Power Output January-February 2015
-4,000
-2,000
-
2,000
4,000
6,000
8,000
1-Jan 8-Jan 15-Jan 22-Jan 29-Jan 5-Feb 12-Feb 19-Feb 26-Feb
Net
ele
ctri
city
del
iver
e to
the
grid
(k
Wh/
d)
-
100
200
300
400
1-Jan 8-Jan 15-Jan 22-Jan 29-Jan 5-Feb 12-Feb 19-Feb 26-Feb
Pow
er O
utpu
t (kW
)

25
CHAPTER 4: Conclusions The results of one-year data collection and analysis from March 2014 – February 2015 are summarized as follows:
• A total of 3,730 tons of wastes were processed through the READ facility.Approximately 95% of the wastes processed at the facility were loaded into thedigesters.
• Monthly feedstock loading reached 668 ton/month in January and February 2015,allowing the digesters operating at 60% of the design capacity. The feedstock loadingwas limited by the capacity of effluent disposal off site. Digester effluent was mostlytransported to the nearby farms for land application. As more farmers are willing toaccept the digester effluent, the more waste can be loaded into the digesters to allow theincrease of digester capacity.
• Food wastes from various sources are the primary feedstock for digesters with close to30% total solids content.
• The digester effluent has total solids content of 3-4% and pH close to 8.0. The ammoniaconcentration was 3000-4000 mg/L at the high feedstock loading.
• The maximum daily biogas production achieved was 222,802 scf/d in January 2015. Thedaily average methane content of biogas was 60%. Total electricity production duringJanuary and February 2015, when the feedstock loading was the highest was 137,912kWh, contributing to the net electricity delivered to the grid of 43,115 kWh.
• The energy consumption of major processes and equipment were measured. It wasfound that the feedstock processing (separation and grinding), digester mixing andbiogas cleaning skid are major energy consumers. The feedstock processing used morethan 40% energy consumed by the facility.
• Overall READ facility performed well as expected from the designs. Even though somemechanical and operational problems were encountered, they were able to be addressedquickly to allow the continuous operation of anaerobic digesters and biogas energyconversion equipment.

26
GLOSSARY
Term Definition
BEE Lab Bioenvironmental Energy Research Laboratory
CARB California Air Resources Board
GC Gas Chromatography
ORC Organic Rankin Cycle
READ Renewable Energy Anaerobic Digestior

27
REFERENCES
HDR. University of California, Davis. Renewable Energy Anaerobic Digester Project Feasibility Study. HDR, Folsom, California. 2011.
Zhang, R. and M. Zhang. UC Davis Renewable Energy Anaerobic Digestion Project. UC Davis Biological and Agricultural Engineering Department. University of California, Davis. February