uc santa cruz - escholarship.org
TRANSCRIPT

UC Santa CruzMapping Global Inequalities
TitleA look at the Spatial Inequality in Pakistan:Case study of District Sargodha
Permalinkhttps://escholarship.org/uc/item/4hd5n6pr
AuthorAli Asjad Naqvi, Syed
Publication Date2007-12-04
eScholarship.org Powered by the California Digital LibraryUniversity of California

1
A look at the Spatial Inequality in Pakistan: Case study of District Sargodha
Working paper
submitted for the conference on Mapping Global Inequalities - Beyond Income Inequality
University of California, Santa Cruz
Second Draft: 4th December, 2007
Syed Ali Asjad Naqvi1
New School for Social Research
1 Currently enrolled in the first year Ph.D. Economics program at New School for Social Research (New York). A large part of the information was collected while working at Lahore University of Management Sciences (LUMS), Pakistan as a Research Fellow/Data Coordinator in the Economics Department (2005-2007). Please send comments and feedback at [email protected])

2
Acknowledgements
This paper draws heavily on the research work conducted by Dr. Ali Cheema (Associate Professor and Head of Economics Department, LUMS) and Shandana Khan Mohmand (Teaching Fellow, Social Sciences Department) on the District of Sargodha in the past three years. Dr. Ali Cheema has been a constant source of inspiration throughout my research career at LUMS and has been an integral part for developing the research framework for the overall project. This paper would not have been possible without his support.
I would like to acknowledge funding support received from the DRC on the Future State, Institute of Development Studies, University of Sussex; CIDA funded LUMS-McGill Social Enterprise Development Centre; and the Punjab Planning and Development Department for the “LUMS Sargodha Informal Institutions Project”. In addition to this I would like to acknowledge the support received from the Agriculture Census Organization and the Secretary Statistics, Mr. Asad Elahi for their support. Lastly, I would like to thank my friend Ayesha Zafar Sehgol (RISEPAK, LUMS) for reviewing and editing the paper on a short notice.

3
Section 1: Introduction With an estimated population of 161,836,500 at the time of writing this paper, Pakistan spans 796,096 square kilometers encompassing 48,066 villages according to the latest counts.2 These rural areas house 67.5%3 of the population and due to the disparity between the urban and rural populace in terms of income distribution and access to resources it is not surprising that almost all development indices are underscored by the low levels of development that exists in the country.4 Even though aggregated numbers are reflective of the overall situation, care has to be taken while using such statistics because regional variations tend to be averaged out at the macro level. This is especially true for Pakistan, a country which has a wide range of ethnic, cultural and social setups such that region specific analysis seems more pertinent when taking into account the differences that prevail in the society. Conducting primary research on rural regions is a daunting task even if the focus is on a specific pool of villages within a given area. Even though databases exist that can give some baseline information, two key problems exist. First, the Government of Pakistan, which has the capacity and capability of carrying out detailed rural studies does not share data easily. Second, no central repository of datasets exist and where it does, matching identifiers across the different files is almost impossible since village names are usually stripped for confidentiality reasons. So, low accessibility to information that can potentially lead to important policy work is one of the reasons that few extensive village level studies have been done on this country. Such information can be used to generate simple spatial maps which can reveal important patterns across regions at a glance and can be used as a proper planning tool as is the case in most developed countries. The use of GIS (Geographic Information Systems) can allow one to conduct spatial analysis based on socio-economic variations which can be used to generate and test hypothesis. One such hypothesis which is taken into account in this paper is the assumption that historical setup matter in determining developmental outcomes. The importance and significance of historical institutions has been highlighted in several seminal studies which show strong correlations between these institutions and path-dependant outcomes (for example see Acemoglu et. al. (2003)). This approach is particularly interesting to study in Pakistan which has a diverse mix of native ethnic groups, migrants who have faced a host of alien rulers over the centuries which has given them their own unique mix of culture and norms. Based on the above premise, this paper will aim to take a case District, one of the more well-to-do in the country, and show how dissecting village level information in a particular way can reveal interesting patterns (especially in education and access to resources). The subsequent sections will first give an account of the history of villages, then details of their administrative and political structure. The sections to follow will discuss data sources and the construction of the database used and the last section will
2 http://www.statpak.gov.pk/depts/pco/ for population estimates and http://www.statpak.gov.pk/depts/aco/statistics/mouza_statistics/mouza_statistics.html for village estimates. 3 ibid. 4 For example see the Human Development Report 2006 which ranks Pakistan at 134, the end of the medium development spectrum.

4
show GIS maps based on economic indicators revealing the differences between historically different villages. Section 2: Villages in Punjab Out of the four provinces in Pakistan, Punjab is the largest which houses 55% of the total population according to the 1998 census.5 In addition to being the largest plain in the world with a warm tropical climate, it is inundated by five rivers which has made it a popular place for settlers for centuries.6 Villages in this region have existed ever since the beginning of its 3000 year old history. It is not surprising that it has been the focus of local leaders and rulers even in the pre-partition days because of its economic potential and even now, the district consumes half the federal budget. With time, different types of villages in this province have evolved and can be categorized based on their historical characteristics based on the unique methodology developed in Cheema, Mohmand, Naqvi (2007).7 Although the paper looks at finer categorizations, for the purpose of this study, two broad categories have been used. These are the historically existing landlord villages and the British colonized canal colonies. A brief description of both is given below: Landlord villages With the passage of time villages inhabited by natives evolved along the rivers creating a landlord-serf system and the development of small feudal estates. These local landlords played a key role in the progress of this region collecting tax revenue for the rulers of the sub-continent8 and then later for the British colonizers. Unlike other European colonies where the locals were exploited as slaves, the British utilized the historically existing power nexuses for surplus extraction. In exchange for tax revenue and services, the landlords were bestowed with titles and were formally made part of the system. Many new estates with complete ownership rights were given out to the families loyal to the British. As a consequence of granting property rights to landlords, the landlord villages ended up having high concentrations of land in the hands of one family with a whole pool of landless peasants, tenants and artisans working for them (Cheema, Mohmand, Naqvi (2007)). Even though feudalism does not exist in its original form in most parts of Pakistan, it still plays an essential role in rural areas because these families still have a significant clout over locals and are often in some way connected with politics. As shown in the picture below these landlord villages house a relatively large population. From the shape of these villages, it is also evident that these villages expand in an ad-hoc manner over time can have several smaller settlements around them.
5 http://www.statpak.gov.pk/depts/pco/statistics/demographic_indicators98/demographic_indicators.html 6 Punjab literally means land of five rivers. The five rivers are Indus, Satluj, Ravi, Chenab and Jhelum. 7 See Cheema, Mohmand, Naqvi (2007) for a detailed exposition on village typology. 8 The historical name of this region that is now India and Pakistan.

Figure 1: Structure of Landlord villages (Source: Google Earth) Canal colonies In the early 19th century, British colonizers saw the great potential in this province for agriculture surplus extraction. To fully utilize the fallow land, they built the largest canal system in the world and developed planned settlements to accommodate the population they brought in to cultivate the land around them. These canal colonies (or Crown Estates as they were originally called)9 had no prior influence of any landlord and had a more egalitarian distribution of land. One family in every canal colony was chosen as a headman (numberdar) based on their social status to collect land revenues and to assist the various government officials who visited their villages (Cheema, Mohmand, Naqvi(2007)). Even though the title numberdar currently does not have much influence on the working of these villages, it still has a considerable social status associated with it. Canal colonies, as shown below in Figure 2, have the same square grid structure all over the province. A market place and a mosque are usually in the centre surrounded by affluent families while the lower castes and artisans live on the outskirts. Landholdings are roughly the same in these villages with the numberdar usually as the largest landowner.
Figure 2: Structure of Canal Colonies (Source: Google Earth)
59 Board of Revenue Archives – Sargodha.

Section 3: Administrative and Political Punjab Given the simple version of the historical setup of villages, it is also important to discuss the administrative and political setup that exists today in the two types of villages under study. This gives them an overlapping layer of institutions which creates an interesting dynamics in the functioning of each village type. The chart below is a summary of Pakistan’s political and administrative divisions within a province. Provinces are now divided into Districts (the old Division system is now abolished) and each District into further divided into Tehsils. Tehsils are revenue collection units which are further split up into Patwar Circles (patwar is an area under a patwari, the lowest revenue official). Each Patwar Circle (PC) encompasses 1-6 villages depending on the size of the landholding. Besides having the revenue system, devolution reforms in 2001 created a parallel three-tier political system.10 The newly created Union Councils cut across Patwar Circle boundaries based on population rather than landholding creating another overlapping system. The devolution has led to important changes in the administrative structure including access to a large pool of funds. Since the most recent variables used in this paper were collected in 2005, they do not capture the extent of the reforms and hence the discussion around local politics has been left out.
Punjab Province
Sargodha Division (abolished in 2001)
Sargodha District
Sargodha Tehsil
Patwar Circles
Village 1
Village 2
Village 3
Union Councils (introduced in 2001)
Village 2Shahpur Tehsil
Village 3Sillanwali Tehsil
Village 4 Bhalwal Tehsil
Sahiwal Tehsil
Other Districts
Other Divisions
Chart 1: Pakistan Administrative and Political hierarchy
6
10 The Devolution reforms of 2001 created tiers of local government in terms of the District, Tehsil and the Union Councils. The old system of Divisions was abolished and significant power was devolved to these tiers. Although administrative decentralization has taken plan, the fiscal system still follows the old pattern creating huge hurdles across the various government departments.

7
Section 4: Methodology and Case District This mix of old and new institutions makes the District of Sargodha in Punjab particularly interesting to study. Being one of the first areas to be colonized by the British, it has both historically landlord dominated villages and canal colonies. This District is also landlocked between two rivers with an elaborate canal system making it one of the most fertile in Punjab. With majority of its population engaged in agriculture, and having benefited from the citrus revolution in the early 70s, the district has seen significant growth in the past few decades. A large pool of funds is also accessible to these villages because of its political influence in the province making development comparisons interesting. With this District covering 832 villages according to the 1998 census, it represents 3.2% of the 25,930 villages in Punjab.11 The main hypothesis in this paper is that historically different village systems – landlord and canal colonies – lead to different economic and developmental outcomes. This investigation will be done using a map created specifically for this study and will give simple GIS representation of various indicators from censuses collected by the Government through various departments. Section 5: Data Sources Village level information is sparse and hard to access in Pakistan. With the last census done in 1998 and the next one due in 2008, some extrapolation might be required to come up with current estimates. Moreover there are significant methodological inconsistencies that exist across these datasets. There are variations in definitions and simple statistics, like total number of schools for example, do not perfectly match across datasets. Boundaries also shift over time because some villages are made part of different administrative circles and exact boundary maps do not exist or at least have not been made public. Therefore to make all these changes consistent the data collected have gone through months of labor to ensure identifiers and names match and datasets can be smoothly merged. The following data sources have been used to construct this paper:
• Census of Pakistan 1998 – Population Census Organization (PCO) • Village Census 2003 – Agriculture Census Organization (ACO) • National Education Census 2005 – Federal Bureau of Statistics (FBS) • British settlement reports – Board of Revenue Arciheves, District of Sargodha. • Official District Map of Sargodha – Maps of Pakistan • Roads, hydrography and railways shapefiles from GeoCommunity website
(www.geocomm.com). Official village level boundaries do not exist except on a piece of silk cloth drawn by hand and kept by village patwaris (lowest revenue official). This practice which dates back to a couple of centuries was also adopted by the British and formalized to improve revenue collection. No major attempt has been made to consolidate these maps to come
11 1998 Census

8
up with accurate boundaries since scales on these hand-drawn maps vary and physical reference points have either disappeared or shifted making the task almost impossible and costly. For the purpose of this paper, official patwar circle boundaries have been used and split up in villages based on the official hand drawn map of the District (see appendix for actual map). This paper by no means claims that the boundaries are completely accurate although they are close to the actual size of the village hadbast or the total area of a village including both cultivated and uncultivated land. Special care has been taken to maintain the spatial positioning of villages with as much accuracy as possible.

Section 6: GIS Mapping Map 1 below shows the basic shape of the district, which is flanked by two rivers both on the east and the west. All the 5 tehsils and the 832 villages as listed in the 1998 census have been mapped. The road, drainage and railways network has also been superimposed to give an idea of the infrastructure within the District.
Map 1: District Sargodha and its Tehsils. The Tehsils are depicted in different colors with Bhalwal being the largest followed by Sargodha. Shahpur in yellow color on top is historically a landlord dominated area and was also the District headquarters from 1893 to 1914 which was later shifted to Sargodha. Shahpur had strong ties with the British and gave them support in terms of providing horses and troops and is known for its large horse-breeding grants and large estates. The grey area is Sillanwali Tehsil which was completely developed by the British together with the green Sargodha Tehsil as canal colonies.
9

Map 2: Division of Landlord villages and Canal Colonies. For comparison between landlord villages and canal colonies the District has been split up as shown in Map 2 above. Canal colonies are easy to identify based on the naming convention introduced by the British which is usually a number followed by it location relative to the primary canal. For example Chak 50-SB simply means village (chak means village or settlement) number 50 irrigated by the South Branch. Hence the numbering sequence was divided between villages which were irrigated by different canal systems and their abbreviated names were attached to the names. Therefore a 50-NB also exists but no village number and its branch reference will be found as a duplicate all across Punjab and its canal colonies villages. A perusal of the British records lying in the Board of Revenue Archives in Sargodha verify these naming conventions and even give information as early as 1910 when the first assessment was done on this canal colonies. The sections below will give simple statistics from the censuses done by the Government across the two categories – canal colonies and landlord villages. Although some of these maps give the evident picture, descriptions will be given where necessary. 10

Household Demographics The pattern of household distribution and household density is given in maps 3 and 4 below. Villages around roads and cities show a higher population concentration while the remoter areas on the south-east and south-west corners which lack access to major roads or proximity to cities have sparser populations. The next two maps give house density also seen higher nearer roads and cities. The average household size is consistent across both regions and is also uniform across the whole Province having 6.8 members on average. The darker green areas belong to some of the most influential families in Pakistan and the road networks shows that the infrastructure has been built around them.
Map 3: Household Distribution in District Sargodha
11

Map 4: Household Density
12Map 5: Average Household Size

The two maps below show the living conditions across the two types. With a larger proportion of families live in single room houses. With the given average household size of 6-7 in this region conditions in canal colonies are much better off with a larger proportion of houses being having 5 or more rooms the canal colonies perform much better in terms of this indicator. Map 8 gives the proportion of mud houses (kacha houses) which have a higher proportion in remoter areas. Although one of the landlord estates on the top shows an exceptionally large proportion even though its lines next to the metal road. The family from this area is known for its affluence and its grand palaces which can still be seen today.
Map 6: Houses with just one room (%age of total house structures)
13

Map 7: Houses with five or more rooms (%age of total house structures)
14Map 8: Mud houses (%age of total house structures)
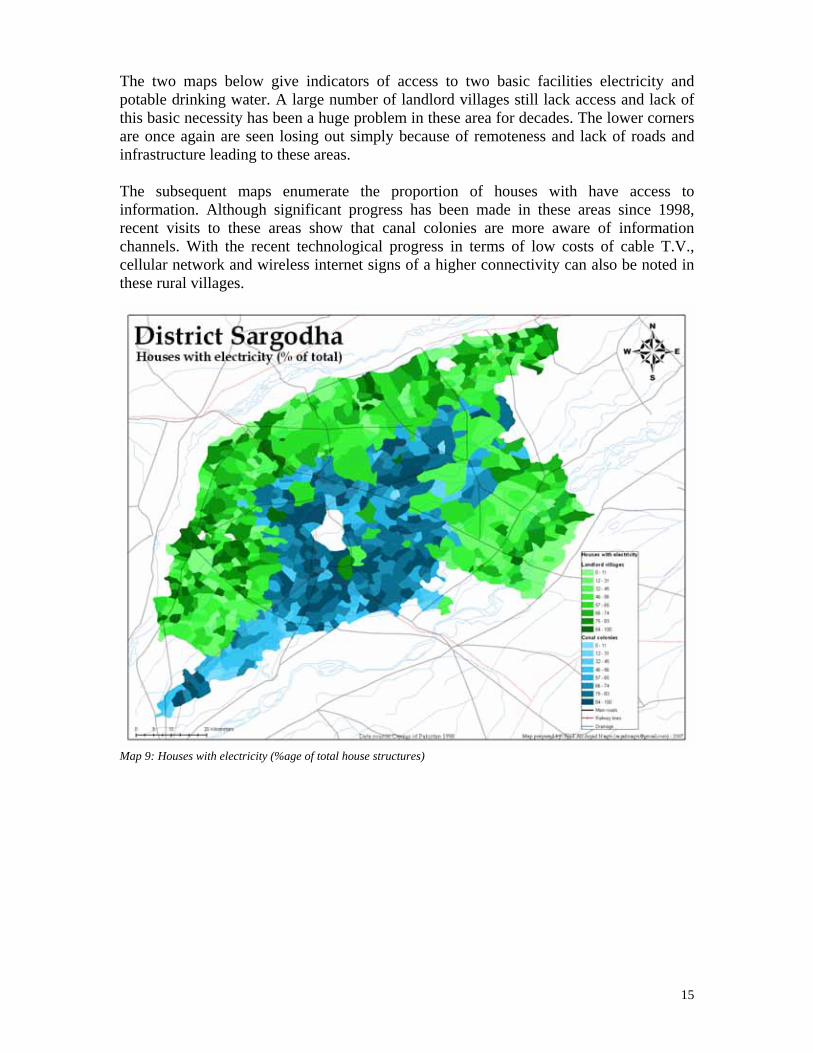
The two maps below give indicators of access to two basic facilities electricity and potable drinking water. A large number of landlord villages still lack access and lack of this basic necessity has been a huge problem in these area for decades. The lower corners are once again are seen losing out simply because of remoteness and lack of roads and infrastructure leading to these areas. The subsequent maps enumerate the proportion of houses with have access to information. Although significant progress has been made in these areas since 1998, recent visits to these areas show that canal colonies are more aware of information channels. With the recent technological progress in terms of low costs of cable T.V., cellular network and wireless internet signs of a higher connectivity can also be noted in these rural villages.
Map 9: Houses with electricity (%age of total house structures)
15

Map 10: Houses with potable water (%age of total house structures)
16Map 11: Houses with access to Newspapers (%age of total house structures)

Map 12: Houses with access to Radio (%age of total house structures)
17Map 13: Houses with access to Television (%age of total house structures)

Population and literacy As it is evident, larger areas have a proportionately larger population and those mainly encompass landlord estates. Since population and households increase proportionately, the map below resonates with the one on total households given above giving the same distribution across the villages.
Map 14: Population Distribution in District Sargodha The most important indicator that has been touted in development literature is education and how literacy is important in the social development having an intergenerational impact. Literacy rates in Pakistan have been one of the most used indicators and as can be seen below vary hugely. The graph on female literacy below is one of the most interesting and important one in this paper showing the level of access to schools the women in these villages have and the proportion that actually utilizes them. What will also be interesting to look at after the next census, when the population has aged by 10 years, is how this trend impacts regional development, especially in those areas where female literacy is high. The maps below show the stark comparison that exists and no detailed explanation for these are necessary.
18

Map 15: Overall literacy in District Sargodha
19Map 16: Male literacy in District Sargodha

Map 17: Female literacy in District Sargodha The above two maps show the importance of disaggregating the data. The male literacy map pulls up the average of the general population and critical information is missed out. The comparison of female literacy levels above together the housing conditions show how landlords have stunted development by reducing access to schooling. While on the other hand, canal colonies have managed to do much better due to lack of pre-existing institutional structures. Schooling statistics extracted from the schooling census are given below in the next section.
20

Schooling To understand the state of literacy rates, it is important to look at the schooling status. The next set of maps give an overall picture highlighting status of schools, their conditions and enrollment rates. Huge variations can be seen across the two types of villages which can be linked to the above story on development in these areas. The story is clear, either no schools exists in landlord villages or are non-functional. Even in those regions which are comparable to the canal colonies, female literacy rates are low.
Map 18: Total schools
21

Map 19: Total boys schools
22Map 20: Total girls schools

Map 21: Schools without electricity
23Map 21: Non-functional schools

Map 22: Total enrollment
24Map 23: Total boys enrollment

Map 24: Total girls enrollment
25Map 25: Total teachers

Map 26: Student-teacher ratio
26

Agriculture and Land Since the majority of populace is involved in agriculture in form or the other, this pool of maps give a general idea of how land and resources are distributed across the village types. Each village is assigned a hadbast number which is the defined as the boundary of the total land, both cultivated and uncultivated that comes under the domain of a village. Once again this system was formalized by the British and a proper sequencing was assigned to these villages. Every tehsil starts with a hadbast of 1 and increases with the number of villages. Hence a combination of tehsil and hadbast is unique one across Punjab except in few places where so boundaries were split up. The maps below indicate the distribution of resources which the landlord villages are able to skew in their favor. Moreover it should also be noted that the upper part of Sargodha has sweet ground water which gets brackish as we move down. Hence tubewells are not that effective in the lower part of the District especially in the Sillanwali tehsil and have been a major source of concern in the past couple of decades.
Map 27: Total village (hadbast) area in acres
27

Map 28: Proportion of land cultivated
28Map 29: Total number of tubewells both electric and diesel
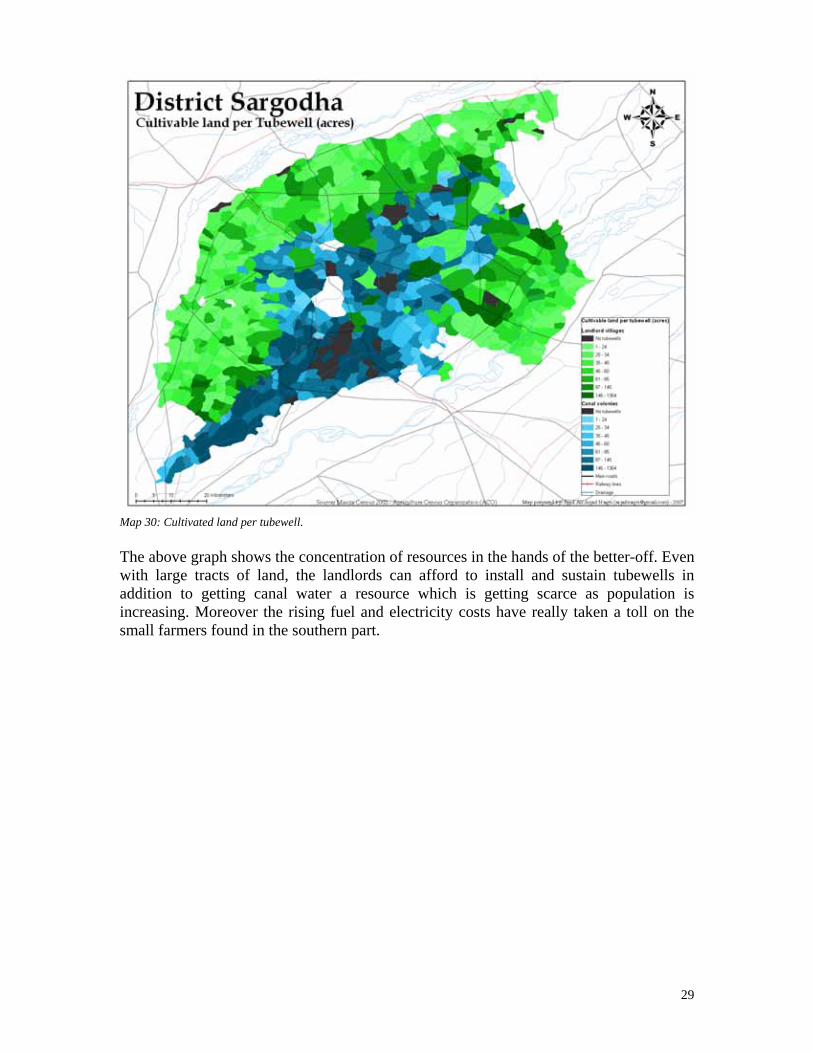
Map 30: Cultivated land per tubewell. The above graph shows the concentration of resources in the hands of the better-off. Even with large tracts of land, the landlords can afford to install and sustain tubewells in addition to getting canal water a resource which is getting scarce as population is increasing. Moreover the rising fuel and electricity costs have really taken a toll on the small farmers found in the southern part.
29
30
Section 7: Findings and Recommendations The above section highlighted the contrast that exists in District Sargodha which has access to a large pool of resources. A look at the historical records of 1910-1922 indicates equal levels of development in both regions. Given that this baseline information indicates same starting points, it is clear that after 80 years, both the regions have taken different trajectories. With the landlord villages performing much better in access to resources due to their clout in the region, canal colonies are much better off in terms of development indicators. These differences raise several economic and social questions like how funds are channeled across villages even though all of them are suppose to have equal access and what social constructs are present in canal colonies which allow for high female education. These are just two of the many questions which need to be studied in detail if any effective policy is to be implemented. Given the basic analysis done above, the facts suggest a reallocation of resources to benefit both the village types. Distribution of water, focus on schooling especially on female education and development of infrastructure in more remote areas are clear starting points. It should also be noted that the above analysis is just one way of looking at the data. Various other controls can be used and with the availability of tools for advance spatial analysis can certainly lead to a more rigorous analysis. With billions of dollars given in aid for the uplifting of these regions alone, reports prepared by iNGOs and the government still show the need for a strong focus on the development of these regions. This also raises the question for the need of third party verification on the efficacy of the plethora of schemes that are running all over the country including the case District. Access to micro finance, water purification schemes, child planning and health care centers and newer roads can all be found in Sargodha but a visit to remoter shows the extent of deprivation that exists there. Hence in final reflection, there is a pressing need for independent academic research to analyze these unstudied areas to come up with region specific policies. Moreover, given the diversity it is imperative that region social aspects have to be taken into account while doing such analysis. Taking the example of Sargodha District, where everyone is aware of the conditions in landlord villages and the problems faced by canal colonies in terms of water access, social setups need to be taken into account for any effective policy reforms.

31
Bibliography: Acemoglu, Daron & Johnson, Simon & Robinson, James A, 2003. “The Rise of Europe: Atlantic Trade, Institutional Change and Economic Growth”, CEPR Discussion Paper 3712, C.E.P.R. Discussion Papers. Alesina, A., Baqir, R., and Easterly, W. R., 1999. “Public Goods and Ethnic Divisions”, Quarterly Journal of Economics. Ali, I., 1988, The Punjab Under Imperialism, 1885-1947, Delhi: Oxford University Press. Board of Revenue District Records, Board of Revenue Archives, Sargodha. Cheema, A, Mohmand, Shandana K., & Naqvi, Syed Ali Asjad, 2007. “History, Land Settlement and Semi-formal Local Governance Structures in Sargodha”, LUMS-IDS Working Paper. District Census Report of Sargodha 1998, Population Census Organization, 1999, Islamabad: Government of Pakistan. GeoCommunity Database. http://data.geocomm.com/catalog/PK/datalist.html Human Development Report 2006. http://hdr.undp.org/en/reports/global/hdr2006/ Mauza Census 2003, Agriculture Census Organization, Government of Pakistan. National Education Census 2005, Federal Bureau of Statistics, Government of Pakistan. Population Census 1998, Population Census Organization, Government of Pakistan.

Appendix A: Official Map of Sargodha
32