uc santa cruz - earth & planetary sciences - the deep mantle … › ~thorne › tl.pdfs ›...
TRANSCRIPT
INTRODUCTION
The mantle plume hypothesis (Morgan, 1971, 1972; An-derson and Natland, this volume) postulates the existence ofnarrow cylindrical upwellings that drain hot material from aninternal thermal boundary layer in the mantle, giving rise to mas-sive pressure-release melting within and below the lithosphere,thereby accounting for hotspot volcanism. Although various as-
pects of the shallow melting and dynamic system predicted forthermal plumes can be explained by alternate mechanisms, allnotions of thermal plumes share the need for a deep thermalboundary layer from which the plumes originate. Characteriza-tion of any mantle thermal boundary layers at depth thus hasdirect relevance to assessment of the plume hypothesis.
The existence of thermal boundary layers in a planet has twomain prerequisites: heat must flow across a persistent boundary,
Geological Society of AmericaSpecial Paper 388
2005
The deep mantle thermo-chemical boundary layer:The putative mantle plume source
Thorne Lay*Earth Sciences Department, University of California–Santa Cruz, Santa Cruz, California 95064, USA
ABSTRACT
Hypothetical narrow, cylindrical thermal plumes from great depths in the Earth,which are commonly invoked to account for relatively stationary and persistent con-centrations of volcanism at the surface, are intimately linked to the notion of instabil-ities and upwellings of a deep thermal boundary layer in the mantle. If the mantle isundergoing whole-mantle convection with no internal stratification, the primary ther-mal boundary layer within the interior that may serve as a plume source is locatedabove the core-mantle boundary. If the mantle convection regime is globally or locallystably stratified by compositional layering, thermal boundary layers should exist onthe margins of the compositional contrasts, and any such boundary layers could serveas plume sources. Seismological, mineral physics, and geodynamic evidence favors theexistence of a complex thermo-chemical boundary layer in the lowermost few hundredkilometers of the mantle, the so-called D� region, involving extensive, if not global,chemical stratification. Although chemical stratification of the mid-mantle has notbeen ruled out, the lack of direct evidence for global existence of thermal boundarylayers in the mid-mantle means that the lowermost mantle region is generally invokedas the source of thermal plumes that give rise to melting and chemical anomalies as-sociated with hotspot volcanism. Observational constraints on this putative mantleplume source are summarized here, along with consideration of the attendant impli-cations for plume existence.
Keywords: D″ region, core-mantle boundary, superplumes, thermal plume, mantle hetero-geneity.
193
*E-mail: [email protected].
T. Lay, 2005, The deep mantle thermo-chemical boundary layer: The putative mantle plume source, in Foulger, G.R., Natland, J.H., Presnall, D.C., and Anderson,D.L., eds., Plates, plumes, and paradigms: Geological Society of America Special Paper 388, p. 193–205. For permission to copy, contact [email protected].© 2005 Geological Society of America.

and there must be density or viscous stratification of the systemthat permits superadiabatic thermal gradients to develop andpersist adjacent to the boundary (e.g., Stacey and Loper, 1983;Christensen, 1984; Olson et al., 1987). These requirementsare certainly satisfied in the Earth at the surface and at the core-mantle boundary. Dramatic compositional and viscosity con-trasts across these two boundaries combine with the ongoingcooling of the mantle and the core to give rise to thermal bound-ary layers at the top and bottom of the mantle. If the mantleconvection regime is further dynamically stratified as a conse-quence of chemical or rheological layering, thermal boundarylayers with superadiabatic thermal gradients will have devel-oped across the stratified boundaries as heat has sought its wayto the surface. Advocates of the mantle plume hypothesis thusinvoke boundary layer instabilities either from the core-mantlethermal boundary layer or from some mid-mantle thermal bound-ary layer associated with stratification of the mantle flow regime(e.g., Kellogg et al., 1999).
The presence of a global seismic velocity discontinuity near650 km depth, combined with the change in seismic velocitygradients above and below the discontinuity, prompted earlyconsideration of chemical layering of the mantle at the base ofthe transition zone (e.g., DePaolo and Wasserburg, 1976). Recog-nition that the 650 km discontinuity can be explained well by aphase transition in (Mg,Fe)2SiO4 (with possible contributionfrom a garnet to perovskite transition) removed the need for achemical contrast at this depth (e.g., Anderson, 1967). The en-dothermic phase change at 650 km probably impedes radialtransport of material and may be accompanied by a rheologicaltransition with important dynamic effects (e.g., Dziewonski,this volume). No globally extensive seismic velocity disconti-nuity has yet been established at depths between the base of thetransition zone and the core-mantle boundary, and although it isplausible that density stratification does exist and is simply dif-ficult to resolve with seismic waves (Anderson, 2002), there isas yet no strong observational basis for asserting that there areglobal thermal boundary layers in the mantle anywhere otherthan near the surface and the core-mantle boundary (e.g., Cas-tle and van der Hilst, 2003). Thus advocates of thermal plumesusually invoke deep mantle origins, although upwellings fromthe transition zone or from a mid-mantle discontinuity have notactually been ruled out.
Seismic wave analysis has revealed that there is significantstructural heterogeneity near the base of the mantle, with strongradial seismic velocity gradients (or discontinuities) and stronglateral velocity variations. The lowermost 200–300 km of themantle, designated by seismologists as the D″ region, has themost pronounced variations, and these are more strongly mani-fested in shear wave velocities (Vs) than in compressional wavevelocities (Vp). These seismic wave velocity variations provideevidence that a major thermo-chemical boundary layer exists onthe mantle side of the core-mantle boundary, extending at leastseveral hundred kilometers upward into the lower mantle (e.g.,Lay et al., 2004). Of particular importance are two large-scale
regions of low shear velocity in the deep mantle below the cen-tral and southern Pacific Ocean and below the southern AtlanticOcean, Africa, and the southern Indian Ocean (Dziewonski et al.,1993). These regions have horizontal dimensions of 2000–3000km and shear velocity anomalies (dVs) averaging –3% to –5%.The common assumption that low shear velocity in the mantleis a consequence of relatively hot, buoyant material has led todesignation of these features as “superplumes,” an unfortunateterm that has dynamic implications that are actually at odds withsome of what is known about these regions and with the con-ventional fluid dynamic definition of a thermal plume. I will callthese regions large low-velocity provinces, a dynamically neu-tral description appropriate for the uncertain nature of thesestructures.
The two large low-velocity provinces in the lower mantlehave strong seismic velocity expressions in the D″ region, but itappears that some portions of them extend upward (or are over-lain by separate low-velocity material) 800–1000 km above thecore-mantle boundary, significantly exceeding the conventionalthickness associated with D″. Weaker velocity anomalies mayextend to even shallower depths. Evidence for chemical contrastbetween large low-velocity provinces and surrounding mantle,summarized later, suggests that large low-velocity provinces aremassive chemical heterogeneities in the lower mantle, and assuch they may be enshrouded in thermal boundary layers. Thuseven though large low-velocity provinces may not be buoyantlyascending or may be unable to penetrate up to the surface, theymay still give rise to thermal plumes shed from their boundarylayers. If they are long-lived they may significantly affect theoverall thermal transport in the deep mantle.
In addition to large low-velocity provinces, there are morelocalized regions of relatively low velocity in the lower mantle,some of which underlie surface hotspots and some of whichdo not. With as yet poorly resolved lateral dimensions of 200–500 km, those low-velocity regions with significant near-verticalcontinuity are commonly interpreted as plumes rising throughthe mantle (e.g., Goes et al., 1999; Bijwaard and Spakman,1999; Nataf, 2000; Montelli et al., 2004; Zhao, 2004), with theexplicit assumption that low shear velocity indicates hot, buoy-ant material.
Combining the general expectation of thermal boundarylayers above the core-mantle boundary and on the margins ofmajor chemical boundaries, the deep sources for plumes arecommonly envisioned, of late, as shown in Figure 1. “Classic”plumes are viewed as narrow conduits with diameters of 50–200 km rising directly from the thermal boundary layer at thecore-mantle boundary, some with sufficient plume flux to ascend2900 km through the mantle conveying excess temperatures thatinduce large-scale pressure-release melting at locales such asHawaii and Iceland (e.g., Stacey and Loper, 1983; Davies, 1988;Sleep, 1990). If D″ is a distinct chemical layer, such plumes mayrise from the top of that layer rather than directly from the core-mantle boundary (e.g., Tackley, 1998). Hotspot regions of thesouth Pacific and Africa are, perforce, attributed to plumes ris-
194 T. Lay
Should these be expressed as Vs and Vp (with “V” italic and “s” and “p” sub-scripted)? If so, please indicate the change wherever these terms appear in the pageproofs of your chapter
Shouldany partof this bein italicsor be sub-scripted?

ing from the large low-velocity provinces in the deep mantle be-neath them (e.g., Jellinek and Manga, 2002; Romanowicz andGung, 2002). Yet other hotspots are attributed to shallow platetectonic processes (e.g., Courtillot et al., 2003; Anderson, thisvolume). Entrainment of material from the core, D″, or largelow-velocity provinces in ascending plumes from the deep man-tle is commonly advocated as an explanation for geochemicalanomalies in hotspot magmas (e.g., Hofmann and White, 1982;Hart et al., 1992; Hofmann, 1997; Albarede and van der Hilst,2002), although the level of confidence with which these can betied to any deep boundary layer is not high.
Given the array of possibilities for a deep mantle source ofthermal plumes, it is worthwhile to consider what is actuallyknown about the lowermost mantle structure to provide a basisfor assessing conceptual notions such as those in Figure 1.Fortunately several recent review articles summarize the multi-disciplinary contributions to our current understanding of lower-most mantle structure (e.g., Lay et al., 1998a; Garnero, 2000;Lay and Garnero, 2004; Lay et al., 2004). As those referencesprovide comprehensive reading lists and citations, the goal herewill be to cast summary observations and constraints on the struc-ture and processes near the core-mantle boundary in the contextof the debate (e.g., Anderson, this volume) about the existenceand nature of thermal plumes in the mantle.
ATTRIBUTES OF THE CORE-MANTLE THERMO-CHEMICAL BOUNDARY LAYER
Thermal Structure
The temperature drop across the surface thermal boundarylayer is well established as being ~1200–1300° (e.g., Green andFalloon, this volume), but there is great uncertainty about the
temperature contrast across the core-mantle boundary layer. Thelatter contrast must be inferred based on extrapolations from thefew relatively robust temperature tie-points in the deep interiorconstrained by experiments, the temperatures of upper mantlephase transitions in olivine, and the estimated freezing pointof core alloy at the inner core boundary. One can estimate thetemperature contrast across the core-mantle boundary whenthese tie-point estimates, themselves subject to substantial un-certainty due to imprecisely known compositional effects, areextrapolated down or up along mantle and core adiabats, re-spectively, under the assumption that there are no regions ofsuperadiabatic gradients anywhere other than near the core-mantle boundary. This procedure yields a temperature contrastacross the core-mantle boundary on the order of 1000–2000°(e.g., Williams, 1998; Boehler, 2000), comparable to the litho-spheric temperature drop. The core-mantle boundary itself isnearly isothermal as a result of the very low viscosity of corematerial, with a temperature somewhere between 3300 K and4800 K, and any instability in the overlying mantle thermalboundary layer could thus bring very hot material upward intothe mantle. The observation that excess temperatures associatedwith hotspot magmas are usually found to be less than 200° (seeAnderson and Natland, this volume; Green and Falloon, this vol-ume; Presnall and Gudfinnsson, this volume) raises immediatequestions about the viability of thermal plumes rising directlyfrom the core-mantle boundary due to the large excess temper-ature estimates for the boundary layer. Given secular cooling ofthe core, the temperature contrast of ancient plumes would beeven higher, and Archaean komatiites are often interpreted inthis light; however, questions are now arising about the excesstemperatures actually associated with these melts (e.g., Parmanand Grove, this volume). Albers and Christensen (1996) andFarnetani (1997) have explored the excess temperature issue,
The deep mantle thermo-chemical boundary layer 195
AndesS. America Africa
Atlantic OceanPacific OceanHawaii
660
CMB++--
-++
++- - -
-
++410
TBL
East PacificFise
Figure 1. Schematic mantle cross-section showing key structural elements of the near-surface thermo-chemical boundary layer involved in platetectonics and notions of how deep mantle thermal plumes may rise from either a thermal boundary layer (TBL) near the core-mantle boundary(CMB) or from the thermal or mechanical boundary layers around large low-velocity provinces of distinct composition found below the Pacificand southern Atlantic Oceans. Globally extensive phase transitions exist at depths near 410 and 660 km.

with the latter establishing that unless the core-mantle bound-ary temperature estimates are in gross error, it is far easier toaccount for the relatively modest temperature excess of hotspotmelts if a much weaker boundary layer serves as the source of athermal plume.
If the lower mantle is chemical layered—for example, if D″is a compositionally distinct layer—the estimated temperaturecontrasts across the upper boundary of D″ and the core-mantleboundary can be reduced by a factor of two, helping to resolvethe excess temperature problem (Farnetani, 1997). Dynamicinstabilities of a thermal boundary layer above a dense, compo-sitionally distinct layer tend to draw in material from the upperportion of the thermal boundary layer, not sensing the fulltemperature increase. This same argument also holds for ther-mal boundary layers at shallower depths than D″. A key issuethat then emerges is the longevity of a chemical contrast in theface of steady entrainment (e.g., Sleep, 1988; Tackley, 2000).Relatively small density increases of 1%–3% allow chemicallayers to persist for a long time for entrainment models thataccount for strong pressure effects on material properties suchas thermal expansion (e.g., Zhong and Hager, 2003). Pressureeffects also serve to increase the temporal and spatial scales oflower mantle features so that very large long-lived features arefavored at the base of the mantle.
Absolute temperature issues aside, the best argument for athermal boundary layer at the base of the mantle is that the heatflux through the core-mantle boundary needed to sustain thegeodynamo is estimated to be from 1 to 15 terrawatts (TW),which is a very uncertain number but almost always a positivevalue (except in a few exotic models), implying heatflow fromthe core into the mantle (e.g., Buffett, 2002; Lay et al., 2004).Given estimates of a global surface heat flux on the order of42–44 TW (e.g., Kellogg et al., 1999), there is a correspondinglylarge uncertainty in the degree to which the mantle is heatedfrom below versus heated from within, with the former essentialfor genesis of thermal plumes by boundary-layer instabilities.Lower values of core-mantle boundary heat flux are easier toreconcile with an old inner core and with reasonable initial Earthtemperatures. If chemical layering in the mantle produces anymid-mantle thermal boundary layers one can obtain lower core-mantle boundary heat flux estimates in some of the calculations.Reassessment of the estimates of global surface heat flux (e.g.,Hoffmeister and Criss, this volume) may lower the heat fluxvalues for the surface and the core-mantle boundary as well.
Large Low-Velocity Provinces
Seismological constraints on the temperature field in D″ areeven more indirect than those from geodynamic and geomagneticarguments, with lack of constraint on the compositional effectsand on the high-pressure thermal expansion leading to largeuncertainties (e.g., Trampert et al., 2001; Julian, this volume).Perhaps the most robust statement is that seismology reveals theexistence of large-scale lateral variations in the seismic velocity
structure near the base of the mantle (Fig. 2; see also Ritsema,this volume), with a large degree 2 component in the shear wavestructure. Recent global seismic tomography models for D″ arediscussed in detail by Lay et al. (2004), but for our immediatepurpose there are two key attributes of the D″ boundary layerrelevant to the plume question.
The first is that two large low-velocity provinces, as men-tioned previously, are evident in all of the shear wave models,separated by a circum-Pacific ring of relatively high-velocitymaterial. The primary wave (P-wave) velocity expression of thesetwo large low-velocity provinces is much more muted, but thereis less agreement among Vp models, and Vp fluctuations areonly ~20%–50% of those in the Vs models. As the resolution ofseismic tomography improves, internal coherence of the largelow-velocity provinces may diminish, but the large-scale patternwill persist (see Dziewonski, this volume). The predominanceof long-wavelength structure runs counter to expectations for avery hot, inviscid thermal boundary layer beset by many insta-bilities giving rise to plumes: some process imposes large-scalestructure on the boundary apart from the intrinsic boundary layertemperature structure. Possibilities include disruption of the hotthermal boundary layer by cooled downwelling material in thelower-mantle circum-Pacific high-velocity ring or the existenceof large-scale chemical heterogeneities embedded in the bound-ary layer. If there is a thermal contribution to the large-scaleheterogeneities, attendant variations in radial temperature gradi-ents will impose a spatially varying heat flux boundary conditionon the core flow regime (e.g., Glatzmaier et al., 1999), whichmay play an important role in reversals of the magnetic field.
The second important attribute of the D″ boundary layer tobe gleaned from these low-resolution tomography models is thatin some well-sampled regions, such as under the central Pacific,there are strong decorrelations between Vp and Vs variations, orat least much stronger relative perturbations in Vs versus Vp.This indicates that thermal variations are not the sole explana-tion for the large-scale patterns. Inversions for bulk sound ve-locity variations (which depend on bulk modulus and density,but not on rigidity) emphasize the differences in behavior of Vpand Vs and suggest some anticorrelation with Vs patterns onlarge scales (Fig. 3). This behavior cannot be readily accountedfor by temperature alone, and although there are many technicalchallenges to bulk sound velocity estimation, most seismologistsagree that compositional heterogeneity is probably important onlarge scales in D″ (e.g., Masters et al., 2000). The differences inglobal sampling for P-waves and shear waves (S-waves) in thedeep mantle is significant, but even localized determinationsof velocity structure, as for the central Pacific region illustratedin Figure 3, support a difference in the behavior of Vp and Vsthat can be accounted for only by bulk modulus and shear mod-ulus perturbations of opposite sign. This appears to be the casefor both the Pacific and African large low-velocity provinces,although complex relationships between Vp and Vs are docu-mented in other regions as well (e.g., Wysession et al., 1999;Saltzer et al., 2001).
196 T. Lay

Attributes of the large low-velocity provinces are summa-rized in Figure 4, and the many seismic observations associatedwith these structures are discussed at length by Lay and Garnero(2004). The lateral gradients on the edges of these structures arevery abrupt, resolved by detailed waveform and traveltimeanalyses (not by global tomography) to be on the scale of tensof kilometers (Ni et al., 2002). For some portions of the largelow-velocity provinces, sharp lateral gradients persist into themid-mantle, 800–1000 km above the core-mantle boundary.There are ongoing debates about the internal velocity structureof the large low-velocity provinces, but most researchers agreethat the Vs reductions are much stronger than Vp reductions.The strong lateral gradients and anomalous Vp/Vs observationsstrongly suggest a distinct chemistry of large low-velocityprovinces. At the high pressures near the base of the mantle, thesensitivity of seismic wave velocity to temperature variations issignificantly suppressed relative to that in the shallow mantle
(e.g., Chopelas, 1996; Julian, this volume), so very large temper-ature increases would be required to account for the Vs reduc-tions, yielding very hot large low-velocity provinces. However,the apparent need for a compensating bulk modulus increase (toexplain why Vp is not proportionally low) requires a chemicalchange, which alone may suffice to reduce the rigidity with nothermal anomaly (candidate materials are not yet constrained).While pushing the limits of normal mode analysis, there is evi-dence that large low-velocity provinces have higher than normaldensity (e.g., Ishii and Tromp, 1999, 2004).
Taking the information presently available at face value, onecould argue either that large low-velocity provinces are massive,hot upwellings with distinct chemistry that gives rise to theirdensity and Vp/Vs characteristics (“superplumes”) or that theyare chemically distinct piles of dense material that may or maynot have any thermal anomaly, but do have steep lateral gradientssustained by the shear flow of the surrounding high-viscosity
The deep mantle thermo-chemical boundary layer 197
-4
-2
0
2
4
-2
0
2
B dVs: Mengin and RomanowiczA dVs: Grand
C dVp: Zhao D dVp: Boschi and Dziewonski
dVs
(%)
dVp
(%)
Figure 2. Maps of S velocity (top row) and P velocity (bottom row) variations relative to the global average values in the D″ region at a depth~200 km above the core-mantle boundary in representative global mantle seismic tomography models. S velocity variations are from Grand(2002) and Mégnin and Romanowicz (2000), and P velocity variations are from Zhao (2001) and Boschi and Dziewonski (2000). Positive values(blue) indicate higher-than-average velocities, and negative values (red) indicate lower-than-average velocities. The scale bars differ: S velocityvariations are two to three times stronger than P velocity variations. Large-scale patterns dominate, suggesting the presence of coherent thermaland chemical structures on continental-type scales.

deep mantle. Numerous investigations of the dynamics of chem-ical plumes have been spurred by these observations (e.g., Tack-ley, 2000; McNamara and Zhong, 2004), but a key questionplaces all interpretations in doubt: what is the relative contribu-tion of thermal versus chemical heterogeneity to the seismic ve-locity anomalies and to any positive or negative buoyancy? This
issue is wide open, but in the context of considering scenariossuch as that in Figure 1, we can accept with confidence that thereare large chemical anomalies in the deep mantle concentrated nearthe core-mantle boundary, possibly with localized extensionsupward beyond the conventional limits of the D″ region. Whetheror not there are strong thermal boundary layers surroundingthese regions that are capable of detaching and rising as plumesdepends on whether large low-velocity provinces have relativelyhigh, normal, or low temperatures. If the structures are piles ofchemically distinct material with no major heat flux throughtheir boundaries, shear flows in the surrounding mantle couldstill transport hot material from the core-mantle boundary layer
198 T. Lay
2000
2200
2400
2600
2800
Dep
th (
km)
6.8 7.0 7.2 7.4
Vs (km/s)
PREM-H
SPAC
12.8 13.2 13.6 14.0
Vp (km/s)
PREM-H
PPAC
-1.5
0.0
1.5
δVb (%)
A Bulk sound velocity, model Sb10l18
B Shear and compressional velocity profiles
6.3 ULVZ
δVs 1.7% δVp 0.75%
Figure 3. (A) Map of bulk sound velocity (Vb = (Vp2–4/3Vs2)0.5)variations in the D″ region from the tomographic model Sb10l18 ofMasters et al. (2000). Comparison with the shear and compressionalvelocity models in Figure 2 shows anticorrelation of Vb and Vs in D″in the central Pacific, where relative reductions in Vs are more than 2.7times those in Vp. The small box indicates the region of a detailed analy-sis of S- and P-wave triplications by Russell et al. (2001). (B) ModelsSPAC and PPAC obtained by Russell et al. (2001) for the central Pa-cific, along with a reference structure (PREM-H), a modification of thePREM model of Dziewonski and Anderson (1981), with D″ havingthe same velocity gradients as in the overlying lower mantle rather thanreduced gradients as in PREM. This is viewed as an empirical homo-geneous, adiabatic reference model relative to which effects of thermaland chemical heterogeneity in the boundary layer should be assessed.The sizes of the velocity discontinuities at 2661 km depth are indicated,along with the presence of a 10 km–thick ultra-low-velocity zone formodels SPAC and PPAC. From Lay et al. (2004).
Shouldthis beexpressedas Vb
(with “V”ital and“b” sub-scripted?
Locations of large low S velocity provinces in D"
CMB
-3% dVs
ULVZ
300 km
300 km
-1- -3% dVs DecreaseSharpBoundaries
-3-12% dVsvelocities
Figure 4. Top: Two massive provinces with thick regions of low S ve-locity exist in the lower mantle: under the southern Pacific and underthe southern Atlantic, Africa, and the southern Indian Ocean. Bottom:A south-to-north (left-to-right) cross-section sketch of the latter featureis shown, with a 200–300 km–thick layer in D″ having an abrupt de-crease in Vs of 1–3% overlying a layer with average Vs decreases of3%–5%. Under Africa this low-velocity body appears to extend as muchas 800 km above the core-mantle boundary (CMB), and it may havean ultra-low-velocity zone (ULVZ) just above the CMB. It has sharplateral boundaries in D″ and in the mid-mantle. The low-S-velocityprovince under the central Pacific is not yet as fully imaged, but appearscomparable in size and in the strength of the velocity reductions.

up along the margins of the large low-velocity provinces, withinstabilities arising from the complex flow geometry (e.g.,Jellinek and Manga, 2002). Thorne et al. (2004) report a statis-tical correlation between the location of surface hotspots andstrong lateral gradients near the margins of low-velocity regionsin the lowermost mantle (not only for the two large low-velocityprovinces), which may provide some support for the latter no-tion. While the statistical significance of spatial correlations ofthis type is open to question, it is noteworthy that hotspots tendto not be centered over the core regions of large low-velocityprovinces, which may bear upon their dynamic status.
Ultra-Low-Velocity Zones
It is important to recognize that the seismically characterizedlarge low-velocity provinces are not equivalent to the “ultra-low-velocity zones” detected just above the core-mantle bound-ary (e.g., Garnero et al., 1998; Thorne and Garnero, 2004). Thelatter features occur rather extensively (Fig. 5) and involve verystrong reductions in both Vp (up to 10%) and Vs (up to 30%),and there is evidence that they have strong (10%) density in-creases. The ultra-low-velocity zones are typically only a fewkilometers to a few tens of kilometers thick, juxtaposed againstthe core-mantle boundary, and have sharp upper boundaries thatreflect short-period seismic waves. The velocity anomalies in Vsand Vp have a ratio of 2.5 to 3, which is compatible with thepresence of partial melting (e.g., Williams and Garnero, 1996;Lay et al., 2004), with likely iron partitioning into partially seg-regated melts possibly accounting for excess density. As seen inFigure 5, the properties of ultra-low-velocity zones are remark-able in terms of their velocity perturbations, and their locationnext to the core-mantle boundary, inarguably the hottest placein the mantle, strongly suggests a thermal influence associatedwith the thermal boundary layer there. However, there are in-teresting issues, such as, why, if there is dense melt, it has notcompletely drained to the core, and whether these regions rep-resent core material that has penetrated into the mantle. Thedynamics and thermal transport of ultra-low-velocity zones arejust beginning to be explored numerically.
Figure 5 indicates that ultra-low-velocity zones occur inmany regions of the core-mantle boundary layer. Williams et al.(1998) present a correlation analysis suggesting that the distri-bution of surface hotspots is better correlated with this distribu-tion of ultra-low-velocity zones than with that of the large-scalelow-velocity regions of D″. The significance of such correlationscan be questioned because some ultra-low-velocity zones appearto actually have very localized three-dimensional configurations,involving mounds rather than thin lenses (e.g., Helmberger et al.,1998; Wen and Helmberger, 1998), so their horizontal dimen-sions may be much smaller than indicated in Figure 5, whichis based on Fresnel zones for 1D structures. Plumes rising fromultra-low-velocity zones should have large temperature excessesand should quickly drain out the localized structures, so it seemsdifficult to invoke ultra-low-velocity zones as sources for major
plumes. If dense melts separate out from upwelling boundarylayer instabilities, the ultra-low-velocity zones could be conse-quences rather than causes of thermal plumes.
The likelihood that partial melting or a melt phase is in-volved in ultra-low-velocity zones raises the possibility that thelower mantle is near the eutectic (the lower mantle assemblageis very likely to have a eutectic) of the bulk mantle composition(e.g., Akins et al., 2004). The effects of partial melt on seismicvelocities are much more pronounced than those of subsolidustemperature variations, and this fact motivates considerationof large low-velocity provinces as regions with very small meltfractions, perhaps as a consequence of their chemical anomaly
The deep mantle thermo-chemical boundary layer 199
Detected ULVZ presence (light) and absence (dark)
2200
2400
2600
2800
30005 6 7 8
Dep
th, k
m
12 13 14P Velocity, km/sS Velocity, km/s
ULVZ ULVZ
PREM
Pacific
PREM
Pacific
Figure 5. A map (top) showing regions where features of an ultra-lowvelocity zone (ULVZ) have either been observed (light gray) or are notobserved (dark gray), and (bottom) seismic velocity models for PREMand the central Pacific region, where a ULVZ is detected immediatelyabove the core-mantle boundary (bottom). The ULVZ structures in var-ious regions have P velocity drops of 4%–10% and S velocity dropsof 12%–30%. In general, regions with ULVZ in the D″ region tendto occur in regions of low S velocities, but this is not universally true(cf. Fig. 2). Some ULVZ regions may involve much more localizeddomelike heterogeneities of smaller lateral extent than indicated by the1D velocity profiles.
(e.g., Lay et al., 2004). Ultra-low-velocity zones might then beviewed as relatively high-melt-fraction portions of D″, whilelarge low-velocity provinces have a low melt fraction, with bothdiffering chemically from overlying mantle. As it is unclearwhether melts in D″ will be buoyant or will sink, the importancefor the plume issue of any partial melting in ultra-low-velocityzones or large low-velocity provinces remains unclear. Ultra-low-velocity zones may represent partial melting of chemicallydistinct material and need not be related to the bulk lower-mantle eutectic at all. Not all regions of large low-velocity prov-inces are underlain by ultra-low-velocity zones (the northernand western portion of the Pacific large low-velocity provinceis, and so is the northernmost region of the African large low-velocity province; see Figures 5 and 4), and some ultra-low-velocity zones may underlie regions of high velocity in D″, sono generally valid interpretation of the connection betweenthese low-velocity features has emerged.
Seismic Velocity Discontinuities
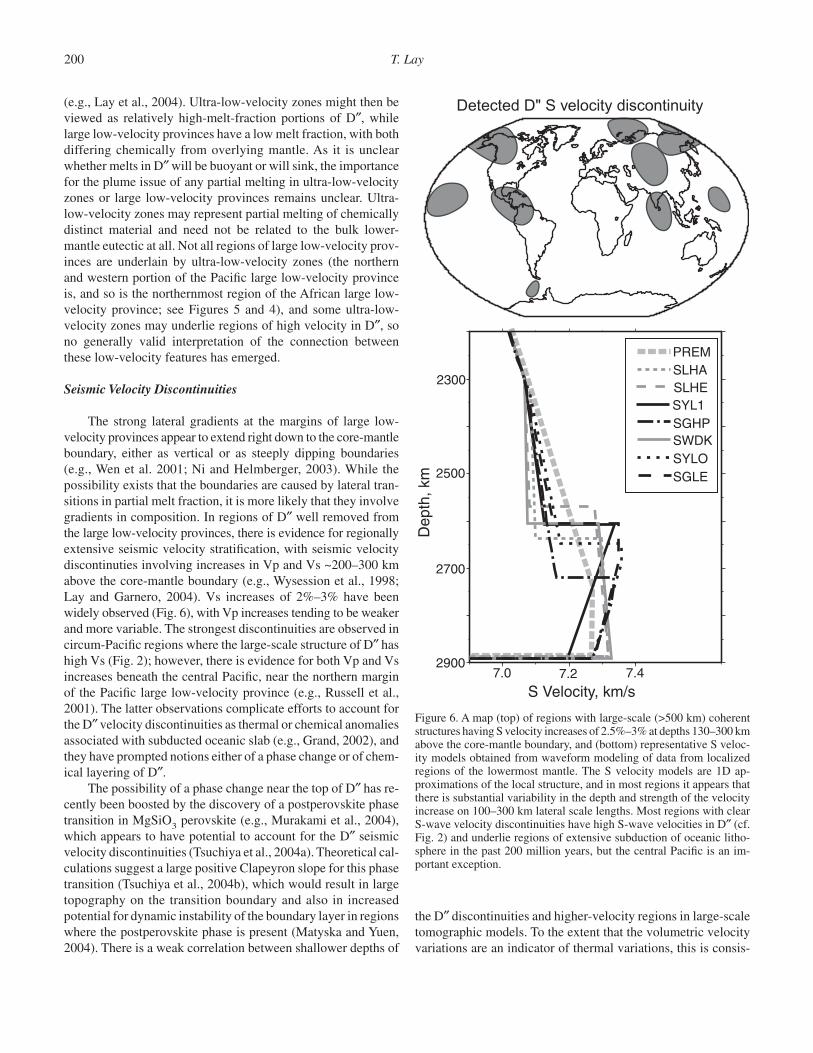
The strong lateral gradients at the margins of large low-velocity provinces appear to extend right down to the core-mantleboundary, either as vertical or as steeply dipping boundaries(e.g., Wen et al. 2001; Ni and Helmberger, 2003). While thepossibility exists that the boundaries are caused by lateral tran-sitions in partial melt fraction, it is more likely that they involvegradients in composition. In regions of D″ well removed fromthe large low-velocity provinces, there is evidence for regionallyextensive seismic velocity stratification, with seismic velocitydiscontinuties involving increases in Vp and Vs ~200–300 kmabove the core-mantle boundary (e.g., Wysession et al., 1998;Lay and Garnero, 2004). Vs increases of 2%–3% have beenwidely observed (Fig. 6), with Vp increases tending to be weakerand more variable. The strongest discontinuities are observed incircum-Pacific regions where the large-scale structure of D″ hashigh Vs (Fig. 2); however, there is evidence for both Vp and Vsincreases beneath the central Pacific, near the northern marginof the Pacific large low-velocity province (e.g., Russell et al.,2001). The latter observations complicate efforts to account forthe D″ velocity discontinuities as thermal or chemical anomaliesassociated with subducted oceanic slab (e.g., Grand, 2002), andthey have prompted notions either of a phase change or of chem-ical layering of D″.
The possibility of a phase change near the top of D″ has re-cently been boosted by the discovery of a postperovskite phasetransition in MgSiO3 perovskite (e.g., Murakami et al., 2004),which appears to have potential to account for the D″ seismicvelocity discontinuities (Tsuchiya et al., 2004a). Theoretical cal-culations suggest a large positive Clapeyron slope for this phasetransition (Tsuchiya et al., 2004b), which would result in largetopography on the transition boundary and also in increasedpotential for dynamic instability of the boundary layer in regionswhere the postperovskite phase is present (Matyska and Yuen,2004). There is a weak correlation between shallower depths of
the D″ discontinuities and higher-velocity regions in large-scaletomographic models. To the extent that the volumetric velocityvariations are an indicator of thermal variations, this is consis-
200 T. Lay
2300
2500
2700
29007.0 7.2 7.4
PREM
SYL1SLHESLHA
SYLOSWDK
SGLE
SGHP
S Velocity, km/s
Dep
th, k
m
Detected D" S velocity discontinuity
Figure 6. A map (top) of regions with large-scale (>500 km) coherentstructures having S velocity increases of 2.5%–3% at depths 130–300 kmabove the core-mantle boundary, and (bottom) representative S veloc-ity models obtained from waveform modeling of data from localizedregions of the lowermost mantle. The S velocity models are 1D ap-proximations of the local structure, and in most regions it appears thatthere is substantial variability in the depth and strength of the velocityincrease on 100–300 km lateral scale lengths. Most regions with clearS-wave velocity discontinuities have high S-wave velocities in D″ (cf.Fig. 2) and underlie regions of extensive subduction of oceanic litho-sphere in the past 200 million years, but the central Pacific is an im-portant exception.

tent with a large positive Clapeyron slope for a phase change(e.g., Sidorin et al., 1999). However, the patchy occurrence ofD″ discontinuities favors the existence of the phase change pri-marily in relatively cool regions of high seismic velocity. Thusone might not expect any phase change to exist or for it to bedeeper in the mantle in hot areas (large low-velocity provinces?),which is at odds with the observations of discontinuities underthe central Pacific several hundred kilometers above the core-mantle boundary (e.g., Russell et al., 2001). It is also curious thatthe margins of large low-velocity provinces do not yet clearlyindicate any transition to regions with a positive velocity in-crease at the top of D″. What little evidence exists for structureat the tops of large low-velocity provinces tends to favor small Vsdecreases at about the same depth as Vs increases in other regions(e.g., Wen 2001; Ni and Helmberger, 2003). Some combinationof chemical heterogeneity and a phase change must be invokedto account for the full suite of observations, and at present thereare substantial uncertainties in doing so (see Lay et al., 2004).
The other likely explanation for D″ discontinuities involveschemical heterogeneities, either of primordial nature or possiblyreplenishing accumulations of oceanic crustal components de-laminated from slabs in the deep mantle. The occurrence ofstrong D″ discontinuities beneath regions of subduction over thepast 100 million years and beneath regions of relatively high Vsin the mid-mantle is often invoked in favor of an oceanic slabconnection. There are only a few regions where tomographicimages show high velocities extending continuously across themantle, with the region below the Gulf of Mexico perhaps thebest example (e.g., Grand, 2002), but raypath sampling in thetomography studies is quite limited and may accentuate appar-ent continuity in finely parameterized tomographic models (seeDziewonski, this volume), so connections between D″ structureand shallow subduction remain tenuous. The correlation betweenregions of historical subduction and mantle heterogeneity atdepths of 800–1000 km are relatively strong (e.g., Scrivner andAnderson, 1992; Wen and Anderson, 1995, 1997), but this cor-relation weakens significantly with depth.
Because the interpretation of deep mantle seismic velocitystructures alone is ambiguous, additional observations areneeded. Seismologists have detected seismic anisotropy in manyregions of D″ (Fig. 7) and are seeking to establish a probe of theflow and strain system in the boundary layer and its relationshipto flow in the mid-mantle (e.g., Lay et al., 1998b; Moore et al.,2004). While progress is being made in mapping the existenceand properties of anisotropy in D″, the most general current ob-servation is that regions of relatively high shear velocity, wherestrong D″ discontinuities are observed, tend to have the mostpronounced anisotropy, and the orientation is close to being ver-tical transverse isotropy. This observation can be accounted forby dynamic models in which low temperatures and high stressesassociated with mid-mantle downwellings drive underlyingregions of D″ into a dislocation deformation regime in whichlattice preferred orientation in (Mg,Fe)O can develop over largescales (e.g., McNamara et al., 2002). It remains to be determined
whether a postperovskite phase transition in the deep mantle playsa significant role in the anisotropy in the boundary layer, butthere does appear to be some correspondence between the D″velocity discontinuities and the onset of detectable anisotropy.
DISCUSSION AND CONCLUSIONS
Given the many degrees of freedom that exist for the prop-erties and configuration of hypothesized chemical heterogeneities,phase changes, partial melting, and thermal structure in D″, it ispossible to account for the diverse seismic observations with
The deep mantle thermo-chemical boundary layer 201
Detected strong (dark) or weak (light) D" anisotropy
2300
2500
2700
29007.0 7.2 7.4 7.0 7.2 7.4
Dep
th, k
m
S velocity, km/s S velocity, km/s
VshVsv
VshVsv
PREM PREM
Figure 7. A map (top) showing locations where relatively strong (>1%)vertical transverse isotropy has been detected in region D″ (dark shad-ing) or where weak or nonexistent anisotropy has been observed (lightshading), and (bottom) examples of shear velocity models proposed forvarious regions of D″ where the velocity structure has been found to beanisotropic. The velocity models, which are compared to the PREMreference structure, have velocities a few percent higher for horizon-tally polarized S-waves (SH) than for vertically polarized S-waves (SV),which is consistent with vertical transverse isotropy. S-wave anisotropyin D″ has been detected in regions with high S velocities (Fig. 2) andstrong S velocity discontinuities (Fig. 6) and in regions with low S ve-locities and weak or nonexistent S velocity discontinuities.
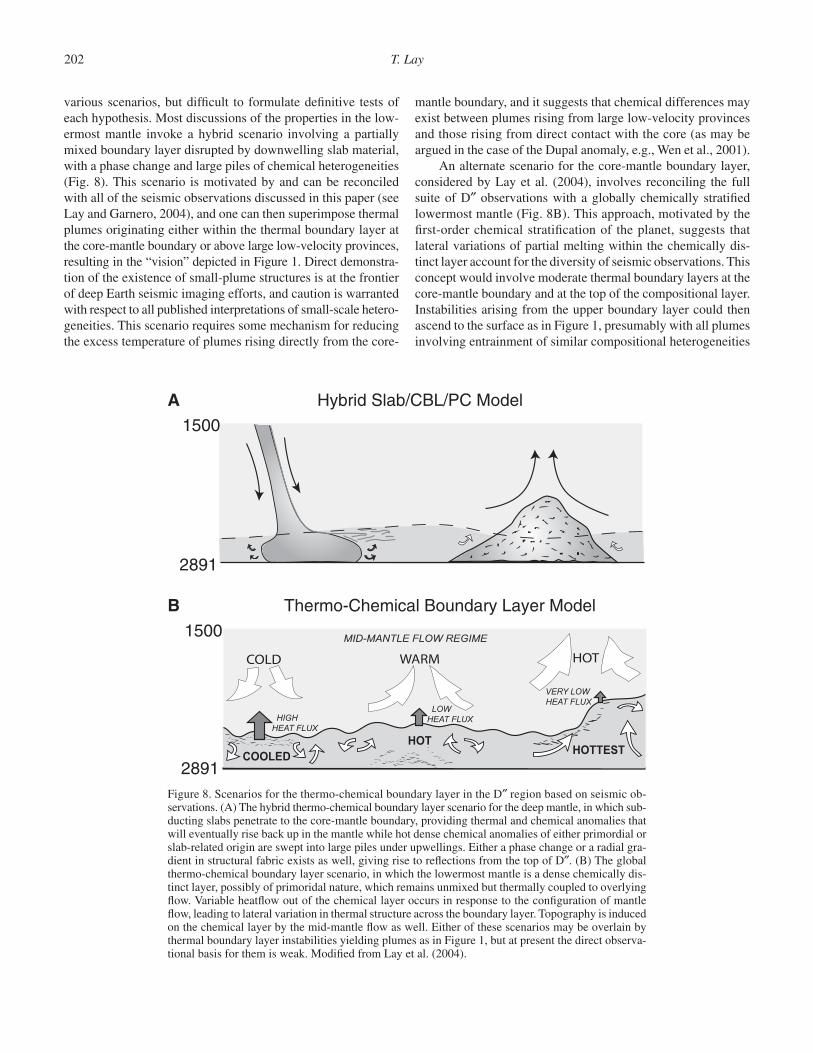
various scenarios, but difficult to formulate definitive tests ofeach hypothesis. Most discussions of the properties in the low-ermost mantle invoke a hybrid scenario involving a partiallymixed boundary layer disrupted by downwelling slab material,with a phase change and large piles of chemical heterogeneities(Fig. 8). This scenario is motivated by and can be reconciledwith all of the seismic observations discussed in this paper (seeLay and Garnero, 2004), and one can then superimpose thermalplumes originating either within the thermal boundary layer atthe core-mantle boundary or above large low-velocity provinces,resulting in the “vision” depicted in Figure 1. Direct demonstra-tion of the existence of small-plume structures is at the frontierof deep Earth seismic imaging efforts, and caution is warrantedwith respect to all published interpretations of small-scale hetero-geneities. This scenario requires some mechanism for reducingthe excess temperature of plumes rising directly from the core-
mantle boundary, and it suggests that chemical differences mayexist between plumes rising from large low-velocity provincesand those rising from direct contact with the core (as may beargued in the case of the Dupal anomaly, e.g., Wen et al., 2001).
An alternate scenario for the core-mantle boundary layer,considered by Lay et al. (2004), involves reconciling the fullsuite of D″ observations with a globally chemically stratifiedlowermost mantle (Fig. 8B). This approach, motivated by thefirst-order chemical stratification of the planet, suggests thatlateral variations of partial melting within the chemically dis-tinct layer account for the diversity of seismic observations. Thisconcept would involve moderate thermal boundary layers at thecore-mantle boundary and at the top of the compositional layer.Instabilities arising from the upper boundary layer could thenascend to the surface as in Figure 1, presumably with all plumesinvolving entrainment of similar compositional heterogeneities
202 T. Lay
A Hybrid Slab/CBL/PC Model
1500
2891
B Thermo-Chemical Boundary Layer Model
1500
2891
HIGH HEAT FLUX
LOW HEAT FLUX
COOLED HOTTESTHOT
MID-MANTLE FLOW REGIME
VERY LOW HEAT FLUX
COLD WARM HOT
Figure 8. Scenarios for the thermo-chemical boundary layer in the D″ region based on seismic ob-servations. (A) The hybrid thermo-chemical boundary layer scenario for the deep mantle, in which sub-ducting slabs penetrate to the core-mantle boundary, providing thermal and chemical anomalies thatwill eventually rise back up in the mantle while hot dense chemical anomalies of either primordial orslab-related origin are swept into large piles under upwellings. Either a phase change or a radial gra-dient in structural fabric exists as well, giving rise to reflections from the top of D″. (B) The globalthermo-chemical boundary layer scenario, in which the lowermost mantle is a dense chemically dis-tinct layer, possibly of primoridal nature, which remains unmixed but thermally coupled to overlyingflow. Variable heatflow out of the chemical layer occurs in response to the configuration of mantleflow, leading to lateral variation in thermal structure across the boundary layer. Topography is inducedon the chemical layer by the mid-mantle flow as well. Either of these scenarios may be overlain bythermal boundary layer instabilities yielding plumes as in Figure 1, but at present the direct observa-tional basis for them is weak. Modified from Lay et al. (2004).

from the D″ layer and having smaller excess temperatures thanwould plumes arising directly from the core-mantle boundary.However, such plumes are not a necessary consequence of thisscenario, and the majority of seismic observations can be ac-counted for without instabilities in the upper boundary layer.
Overall, the lowermost mantle appears to have substantialchemical and thermal heterogeneity, and this complex thermo-chemical boundary layer may plausibly serve as a source of ther-mal instabilities that rise through the mantle. However, a soberassessment of our current understanding and observations is thatthere are many unknowns with regard to the nature of this deepboundary layer, and it is quite plausible that there are, in fact, nothermal plumes rising from the region. Thus much more workwill be required before we can attach much confidence to car-toon notions such as that of Figure 1.
ACKNOWLEDGMENTS
This paper was motivated in part by discussions at the 2004CIDER (Cooperative Institute for Deep Earth Research) work-shop, which was supported by the National Science Foundation(NSF) under Grant PHY99-07949. This research was supportedby NSF grant EAR-0125595. Ed Garnero collaborated with theauthor on several studies from which graphics and ideas havebeen drawn. Don Anderson, Gillian Foulger, Bruce Julian, andLianxing Wen provided helpful comments. Contribution no. 479,Center for the Study of Imaging and Dynamics of the Earth,Institute of Geophysics and Planetary Physics, University ofCalifornia–Santa Cruz.
REFERENCES CITED
Akins, J.A., Luo, S.-N., Asimow, P.D., and Ahrens, T.J., 2004, Shock-inducedmelting of MgSiO3 perovskite and implications for melts in Earth’s lower-most mantle: Geophysical Research Letters, v. 31, L14612, doi: 10.1029/2004GL020237.
Albarede, F., and van der Hilst, R.D., 2002, Zoned mantle convection: Philo-sophical Transactions of the Royal Society of London (Ser. A), v. 360,p. 2569–2592.
Albers, M., and Christensen, U.R., 1996, The excess temperature of plumes ris-ing from the core-mantle boundary: Geophysical Research Letters, v. 23,p. 3567–3570, doi: 10.1029/96GL03311.
Anderson, D.L., 1967, Phase changes in the upper mantle: Science, v. 157,p. 1165–1173.
Anderson, D.L., 2002, The case for irreversible chemical stratification of themantle: International Geology Review, v. 44, p. 97–116.
Bijwaard, H., and Spakman, W., 1999, Tomographic evidence for a narrowwhole mantle plume below Iceland: Earth and Planetary Science Letters,v. 166, p. 121–126, doi: 10.1016/S0012-821X(99)00004-7.
Boehler, R., 2000, High-pressure experiments and the phase diagram of lowermantle and core materials: Reviews of Geophysics, v. 38, p. 221–245, doi:10.1029/1998RG000053.
Boschi, L., and Dziewonski, A.M., 2000, Whole Earth tomography from delaytimes of P, PcP, and PKP phases: Lateral heterogeneities in the outer coreor radial anisotropy in the mantle?: Journal of Geophysical Research,v. 105, p. 13,675–13,696, doi: 10.1029/2000JB900059.
Buffett, B.A., 2002, Estimates of heat flow in the deep mantle based on thepower requirements for the geodynamo: Geophysical Research Letters,v. 29, no. 12, doi: 10.1029/2001GL014649.
Castle, J.C., and van der Hilst, R.D., 2003, Searching for seismic scattering offmantle interfaces between 800 and 2000 km depth: Journal of GeophysicalResearch, v. 108, 2095, doi: 10.1029/2001JB000286.
Chopelas, A., 1996, Thermal expansivity of lower mantle phases MgO andMgSiO3 perovskite at high pressure derived from vibrational spectroscopy:Physics of the Earth and Planetary Interiors, v. 98, p. 3–15, doi: 10.1016/S0031-9201(96)03175-5.
Christensen, U., 1984, Instability of a hot boundary layer and initiation of thermo-chemical plumes: Annales Geophysicae, v. 2, p. 311–319.
Courtillot, V., Davaille, A., Besse, J., and Stock, J., 2003, Three distinct types ofhotspots in the Earth’s mantle: Earth and Planetary Science Letters, v. 205,p. 295–308, doi: 10.1016/S0012-821X(02)01048-8.
Davies, G.F., 1988, Ocean bathymetry and mantle convection, A: Large-scaleflow and hotspots: Journal of Geophysical Research, v. 93, p. 10,467–10,480.
DePaolo, D., and Wasserburg, G.J., 1976, Nd isotope variations and petrogenicmodels: Geophysical Research Letters, v. 3, p. 249–252.
Dziewonski, A.M., and Anderson, D.L., 1981, Preliminary Reference EarthModel: Physics of the Earth and Planetary Interiors, v. 25, p. 297–356, doi:10.1016/0031-9201(81)90046-7.
Dziewonski, A.M., Foret, A.M., Su, W.-J., and Woodward, R.L., 1993, Seismictomography and geodynamics, in Aki, K., and Dmoska, R., eds., Relatinggeophysical structures and processes: The Jeffereys volume: Washington,D.C., American Geophysical Union Geophysical Monograph 76, p. 67–105.
Farnetani, C.G., 1997, Excess temperature of mantle plumes: The role of chem-ical stratification across D: Geophysical Research Letters, v. 24, p. 1583–1586, doi: 10.1029/97GL01548.
Garnero, E.J., 2000, Lower mantle heterogeneity: Annual Reviews of Earth andPlanetary Science, v. 28, p. 509–537, doi: 10.1146/annurev.earth.28.1.509.
Garnero, E.J., Revenaugh, J.S., Williams, Q., Lay, T., and Kellogg, L.H., 1998,Ultralow velocity zone at the core-mantle boundary, in Gurnis, M., et al.,eds., The core-mantle boundary region: Washington, D.C., American Geo-physical Union, p. 319–334.
Goes, S., Spakman, W., and Bijwaard, H., 1999, A lower mantle source forcentral European volcanism: Science, v. 286, p. 1928–1931, doi: 10.1126/science.286.5446.1928.
Glatzmaier, G.A., Coe, R.S., Hongre, L., and Roberts, P.H., 1999, The role ofthe Earth’s mantle in controlling the frequency of geomagnetic reversals:Nature, v. 401, p. 885–890, doi: 10.1038/44776.
Grand, S.P., 2002, Mantle shear-wave tomography and the fate of subductedslabs: Philosophical Transactions of the Royal Society of London (Ser. A),v. 360, p. 2475–2491.
Hart, S.R., Hauri, E.H., Oschmann, L.A., and Whitehead, J.A., 1992, Mantleplumes and entrainment: Isotopic evidence: Science, v. 256, p. 517–520.
Helmberger, D.V., Wen, L., and Ding, X., 1998, Seismic evidence that the sourceof the Iceland hotspot lies at the core-mantle boundary: Nature, v. 396,p. 251–255, doi: 10.1038/24357.
Hofmann, A.W., 1997, Mantle geochemistry: The message from oceanic vol-canism: Nature, v. 385, p. 219–229, doi: 10.1038/385219a0.
Hofmann, A.W., and White, W.M., 1982, Mantle plumes from ancient oceaniccrust: Earth and Planetary Science Letters, v. 57, p. 421–436, doi: 10.1016/0012-821X(82)90161-3.
Ishii, M., and Tromp, J., 1999, Normal-mode and free-air gravity constraints onlateral variations in velocity and density: Science, v. 285, p. 1231–1236,doi: 10.1126/science.285.5431.1231.
Ishii, M., and Tromp, J., 2004, Constraining large-scale mantle heterogeneityusing mantle and inner-core sensitive normal modes: Physics of the Earthand Planetary Interiors, v. 146, p. 113–124, doi: 10.1016/j.pepi.2003.06.012.
Jellinek, A.M., and Manga, M., 2002, The influence of a chemical boundarylayer on the fixity, spacing and lifetime of mantle plumes: Nature, v. 418,p. 760–763, doi: 10.1038/nature00979.
Kellogg, L.H., Hager, B.H., and van der Hilst, R.D., 1999, Compositional strat-ification in the deep mantle: Science, v. 283, p. 1881–1884, doi: 10.1126/science.283.5409.1881.
Lay, T., and Garnero, E.J., 2004, Core-mantle boundary structures and processes,in Hawkesworth, C., and Sparks, S., eds., State of the planet, Washington,
The deep mantle thermo-chemical boundary layer 203

D.C., American Geophysical Union, Geophysical Monograph 150,p. 25–41.
Lay, T., Garnero, E.J., and Williams, Q., 2004, Partial melting in a thermo-chemical boundary layer at the base of the mantle: Physics of the Earth andPlanetary Interiors, v. 146, p. 441–467, doi: 10.1016/j.pepi.2004.04.004.
Lay, T., Williams, Q., and Garnero, E.J., 1998a, The core-mantle boundary layerand deep Earth dynamics: Nature, v. 392, p. 461–468, doi: 10.1038/33083.
Lay, T., Williams, Q., Garnero, E.J., Kellogg, L., and Wysession, M.E., 1998b,Seismic wave anisotropy in the D″ region and its implications, in Gurnis,M., et al., eds., The core-mantle boundary region: Washington, D.C., Amer-ican Geophysical Union, p. 229–318.
Masters, G., Laske, G., Bolton, H., and Dziewonski, A.M., 2000, The relativebehavior of shear velocity, bulk sound speed, and compressional velocityin the mantle: Implications for chemical and thermal structure in Earth’sdeep interior, in Karato, S., et al., eds., Mineral physics and tomographyfrom the atomic to the global scale: Washington, D.C., American Geo-physical Union, p. 63–87.
Matyska, C., and Yuen, D.A., 2004, The importance of radiative heat transferfor superplumes with a deep mantle phase transition: Earth and PlanetaryScience Letters, v. 125. p. 255–266.
McNamara, A.K., and Zhong, S., 2004, Thermochemical structures within aspherical mantle: Superplumes or piles?: Journal of Geophysical Research,v. 109, B07402, doi: 10.1029/2003JB002847.
McNamara, A.K., van Keken, P.E., and Karato, S.-I., 2002, Development ofanisotropic structure in the Earth’s lower mantle by solid-state convection:Nature, v. 416, p. 310–314, doi: 10.1038/416310a.
Mégnin, C., and Romanowicz, B., 2000, The three-dimensional shear velocitystructure of the mantle from the inversion of body, surface, and higher-mode waveforms: Geophysical Journal International, v. 143, p. 709–728,doi: 10.1046/j.1365-246X.2000.00298.x.
Montelli, R., Nolet, G., Dahlen, F.A., Master, G., Engdahl, E.R., and Hung, S.H.,2004, Finite-frequency tomography reveals a variety of plumes in the man-tle: Science, v. 303, p. 338–343, doi: 10.1126/science.1092485.
Moore, M.M., Garnero, E.J., Lay, T., and Williams, Q., 2004, Shear wave split-ting and waveform complexity for lowermost mantle structures with low-velocity lamellae and transverse isotropy: Journal of Geophysical Research,v. 109, p. B02319, doi: 10.1029/2003JB002546.
Morgan, W.J., 1971, Convective plumes in the lower mantle: Nature, v. 230,p. 42–43.
Morgan, W.J., 1972, Deep mantle convection plumes and plate motions:Bulletin of the American Association of Petroleum Geologists, v. 56,p. 203–213.
Murakami, M., Hirose, K., Kawamura, K., Sata, N., and Ohishi, Y., 2004, Post-perovskite phase transition in MgSiO3: Science, v. 304, p. 855–858, doi:10.1126/science.1095932.
Nataf, H.C., 2000, Seismic imaging of mantle plumes: Annual Reviews ofEarth and Planetary Science, v. 28, p. 391–417, doi: 10.1146/annurev.earth.28.1.391.
Ni, S., and Helmberger, D.V., 2003, Ridge-like lower mantle structure beneathSouth Africa: Journal of Geophysical Research, v. 108, B2, 2094, doi:10.1029/2001JB001545.
Ni, S., Tan, E., Gurnis, M., and Helmberger, D., 2002, Sharp sides to the Africansuperplume: Science, v. 296, p. 1850–1852, doi: 10.1126/science.1070698.
Olson, P., Schubert, G., and Anderson, C., 1987, Plume formation in theD″-layer and the roughness of the core-mantle boundary: Nature, v. 327,p. 409–413, doi: 10.1038/327409a0.
Romanowicz, B., and Gung, Y.C., 2002, Superplumes from the core-mantleboundary to the lithosphere: Implications for heat flux: Science, v. 296,p. 513–516, doi: 10.1126/science.1069404.
Russell, S.A., Reasoner, C., Lay, T., and Revenaugh, J., 2001, Coexisting shear-and compressional-wave seismic velocity discontinuities beneath thecentral Pacific: Geophysical Research Letters, v. 28, p. 2281–2284, doi:10.1029/2000GL012553.
Saltzer, R.L., van der Hilst, R.D., and Kárason, H., 2001, Comparing P and S
wave heterogeneity in the mantle: Geophysical Research Letters, v. 28,p. 1335–1338, doi: 10.1029/2000GL012339.
Scrivner, C., and Anderson, D.L., 1992, The effect of post Pangea subductionon global mantle tomography and convection: Geophysical Research Let-ters, v. 19, p. 1053–1056.
Sidorin, I., Gurnis, M., and Helmberger, D.V., 1999, Dynamics of a phasechange at the base of the mantle consistent with seismological observa-tions: Journal of Geophysical Research, v. 104, p. 15,005–15,023, doi:10.1029/1999JB900065.
Sleep, N.H., 1988, Gradual entrainment of a chemical layer at the base of themantle by overlying convection: Geophysical Journal, v. 95, p. 437–447.
Sleep, N.H., 1990, Hotspots and mantle plumes: Some phenomenology: Jour-nal of Geophysical Research, v. 95, p. 6715–6736.
Stacey, F.D., and Loper, D.E., 1983, The thermal boundary-layer interpretationof D″ and its role as a plume source: Physics of the Earth and PlanetaryInteriors, v. 33, p. 45–55, doi: 10.1016/0031-9201(83)90006-7.
Tackley, P.J., 1998, Three-dimensional simulations of mantle convection with athermo-chemical basal boundary layer: D″, in Gurnis, M., et al., eds., Thecore-mantle boundary region: Washington, D.C., American GeophysicalUnion, p. 231–253.
Tackley, P., 2000, Mantle convection and plate tectonics: Toward an integratedphysical and chemical theory: Science, v. 288, p. 2002–2007, doi: 10.1126/science.288.5473.2002.
Thorne, M.S., and Garnero, E.J., 2004, Inferences on ultralow-velocity zonestructure from a global analysis of SPdKS waves: Journal of GeophysicalResearch, v. 109, B08301, doi: 10.1029/2004JB003010.
Thorne, M.S., Garnero, E.J., and Grand, S.P., 2004, Geographic correlation be-tween hot spots and deep mantle lateral shear-wave velocity gradients:Physics of the Earth and Planetary Interiors, v. 146, p. 47–63, doi: 10.1016/j.pepi.2003.09.026.
Trampert, J., Vacher, P., and Vlaar, N., 2001, Sensitivities of seismic velocitiesto temperature, pressure and composition in the lower mantle: Physics ofthe Earth and Planetary Interiors, v. 124, p. 255–267, doi: 10.1016/S0031-9201(01)00201-1.
Tsuchiya, T., Tsuchiya, J., Umemoto, K., and Wentzcovitch, R.M., 2004a,Elasticity of post-perovskite MgSiO3: Geophysical Research Letters, v. 31,p. L14603, doi: 10.1029/2004GL020278.
Tsuchiya, T., Tsuchiya, J., Umemoto, K., and Wentcovitch, R.M., 2004b, Phasetransition in MgSiO3 perovskite in the Earth’s lower mantle: Earth andPlanetary Science Letters, v. 224, p. 241–248.
Wen, L., 2001, Seismic evidence for a rapidly-varying compositional anom-aly at the base of the Earth’s mantle beneath Indian ocean: Earth andPlanetary Science Letters, v. 194, p. 83–95, doi: 10.1016/S0012-821X(01)00550-7.
Wen, L., and Anderson, D.L., 1995, The fate of slabs inferred from seismictomography and 130 million years of subduction: Earth and PlanetarySciences Letters, v. 133, p. 185–198, doi: 10.1016/0012-821X(95)00064-J.
Wen, L., and Anderson, D.L., 1997, Slabs, hotspots, cratons and mantle con-vection revealed from residual seismic tomography in the upper mantle:Physics of the Earth and Planetary Interiors, v. 99, p. 131–143, doi:10.1016/S0031-9201(96)03162-7.
Wen, L., and Helmberger, D.V., 1998, Ultra-low velocity zones near the core-mantle boundary from broadband PKP precursors: Science, v. 279, p. 1701–1703, doi: 10.1126/science.279.5357.1701.
Wen, L., Silver, P., James, D., and Kuehnel, R., 2001, Seismic evidence for athermo-chemical boundary at the base of the Earth’s mantle: Earth andPlanetary Science Letters, v. 189, p. 141–153, doi: 10.1016/S0012-821X(01)00365-X.
Williams, Q., 1998, The temperature contrast across D″, in Gurnis, M., et al.,eds., The core-mantle boundary region: Washington, D.C., American Geo-physical Union, p. 73–81.
Williams, Q., and Garnero, E.J., 1996, Seismic evidence for partial melt at thebase of the Earth’s mantle: Science, v. 273, p. 1528–1530.
Williams, Q., Revenaugh, J., and Garnero, E.J., 1998, A correlation between
204 T. Lay
ultra-low basal velocities in the mantle and hot spots: Science, v. 281,p. 546–549, doi: 10.1126/science.281.5376.546.
Wysession, M., Lay, T., Revenaugh, J., Williams, Q., Garnero, E.J., Jeanloz, R.,and Kellogg, L., 1998, The D″ discontinuity and its implications, in Gur-nis, M., et al., eds., The core-mantle boundary region: Washington, D.C.,American Geophysical Union, p. 273–298.
Wysession, M.E., Langenhorst, A., Fouch, M.J., Fischer, K.M., Al-Eqabi, G.I.,Shore, P.J., and Clarke, T.J., 1999, Lateral variations in compressional/shear velocities at the base of the mantle: Science, v. 284, p. 120–125, doi:10.1126/science.284.5411.120.
Zhao, D., 2001, Seismic structure and origin of hotspots and mantle plumes:
Earth and Planetary Science Letters, v. 192, p. 251–265, doi: 10.1016/S0012-821X(01)00465-4.
Zhao, D., 2004, Global tomographic images of mantle plumes and subductingslabs: Insight into deep Earth dynamics: Physics of the Earth and PlanetaryInteriors, v. 146, p. 3–34, doi: 10.1016/j.pepi.2003.07.032.
Zhong, S., and Hager, B.H., 2003, Entrainment of a dense layer by thermalplumes: Geophysical Journal International, v. 154, p. 666–676, doi: 10.1046/j.1365-246X.2003.01988.x.
MANUSCRIPT ACCEPTED BY THE SOCIETY JANUARY 3, 2005
The deep mantle thermo-chemical boundary layer 205
Printed in the USA

Page 206 is blank