ucd centre for economic research working paper … · ucd school of economics university college...
TRANSCRIPT

UCD CENTRE FOR ECONOMIC RESEARCH
WORKING PAPER SERIES
2020
Can Early Intervention have a
Sustained Effect on Human Capital?
Orla Doyle, University College Dublin
WP20/08
April 2020
UCD SCHOOL OF ECONOMICS UNIVERSITY COLLEGE DUBLIN
BELFIELD DUBLIN 4

1
Can Early Intervention have a Sustained Effect on Human Capital?
Orla Doyle
University College Dublin
ABSTRACT
Evidence on the sustained effect of early intervention is inconclusive, with many
studies experiencing a dissolution of treatment effects once the program ends.
Using a randomized trial, this paper examines the impact of Preparing for Life
(PFL), a pregnancy to age five home visiting and parenting program, on
outcomes in middle childhood. We find little evidence of cognitive fade-out at
age nine, with significant treatment effects on cognitive skills (0.67SD) and
school achievement tests (0.47-0.74SD) that are of a similar magnitude to those
observed at the end of the program. There is no impact on other school
outcomes and earlier effects for socio-emotional skills are no longer evident.
While about 50 percent of the sample is retained at age nine, the treatment
groups are still balanced on all key baseline characteristics and the results are
robust to inverse probability weighting. Mediation analysis suggests that ~46
percent of the treatment effect on cognitive skills is explained by improvements
in early parental investment. This study demonstrates that boosting children’s
early cognitive skills can reduce school-age inequalities five years after
program completion, yet continued investment may be needed to break long-
standing inequalities in other dimensions of skills.
Keywords: Early childhood intervention; cognitive skills; socio-emotional and behavioral
skills; randomized control trial; school-age inequalities.
JEL Classification: C93, D13, I26, J13
The evaluation of the Preparing for Life program was funded by the Northside Partnership through the Department of
Children and Youth Affairs and The Atlantic Philanthropies. Additional support was provided by Tusla, the Community
Foundation of Ireland and the HSE for the Age 9 follow-up. We would like to thank all those who supported this research,
especially the participating families and community organizations, the PFL intervention staff, and the program’s Expert
Advisory Committee. Thanks also to the Scientific Advisory Committee, including Sylvana Côté, Colm Harmon, James
Heckman, Cecily Kelleher, Sharon Ramey, Craig Ramey, and Richard Tremblay, for their guidance and advice, and to the
Early Childhood Research Team at the UCD Geary Institute for Public Policy who significantly contributed to this study.
The trial was registered with controlled-trials.com (ISRCTN04631728) and the AEA RCT Registry (AEARCTR-0000066).
All study procedures were approved by the UCD Human Research Ethics Committee, the Rotunda Hospital’s ethics
committee, and the National Maternity Hospital’s ethics committee. E-mail: [email protected]

2
I Introduction
There has been a sizable increase in the number of studies in economics focusing on the early
childhood period. This is in recognition of the importance of this period for human capital formation.
Biologically, pregnancy and the earliest years are the most productive period for brain development,
whereby infants’ underlying neurodevelopmental capacities are formed (Cantor et al. 2019; Knudsen
et al. 2006; Thompson and Nelson 2001). Although this process is largely genetic, research from
epigenetics demonstrates that the environment, and in particular the level of parental stimulation and
sensitive caregiving, can shape the strength of structural and functional brain networks in either a
positive or negative way (Shonkoff 2010). This is important as these neurological processes are
instrumental in shaping children’s later cognitive, social, behavioral, and physical development (Blair
and Raver 2012).
Inequalities in children’s capacities typically arise in contexts of disadvantage, where a
family’s ability to invest in their children may be hampered by monetary or cognitive constraints
(Becker 1965; Mani et al. 2013) or the stress that accompanies poverty (Conger et al. 1994; Lupien et
al. 2001; Masarik and Conger 2017). These inequalities develop early in life and unless remediated
continue to widen as children progress through school (Cunha and Heckman 2007; Heckman and
Mosso 2014). Duncan et al. (2019) notes that rising income inequality in the US in recent years has
been accompanied by a widening gap in achievement scores across social groups, and Waldfogel and
Washbrook (2011) find that between a third and a half of the income-related gap in children’s
cognitive ability may be attributed to differences in parenting style and the home learning
environment. Yet despite growing evidence on the importance of parental investment in the prenatal
and infancy period in particular (Almond and Currie 2011), there remains a dearth of studies
identifying effective interventions to circumvent these later inequalities.
This paper aims to address this gap by examining the impact of an early intervention program
at reducing school-age inequalities in children’s skills. The trial, known as Preparing for Life (PFL),
began in 2008, and is based on the premise that investing in intensive parenting supports from
pregnancy until age five will permanently alter children’s skill level. The study targeted pregnant
women residing in a highly disadvantaged suburban community in Ireland and randomly allocated
them to a ‘high’ or ‘low’ treatment group. The high treatment group received fortnightly home visits
from trained mentors from pregnancy until age five, in addition to baby massage classes in the first
year and group-based parenting classes in the second year. The cohort were assessed at eight time
points during the trial and by age five, Doyle (2020) finds that the program significantly improved

3
children’s cognitive, social, and behavioral development.1 Specifically, children in the high treatment
groups had higher language ability (0.67 of a standard deviation, SD), spatial ability (0.65 SD), and
pictorial reasoning ability (0.56 SD) compared to children in the low treatment group. They were also
significantly less likely to score below average (20 vs 60 percent) and significantly more likely to
score above average (25 vs 8 percent) in terms of overall cognitive ability. The program had some
impact on socio-emotional skills, although the effect sizes were smaller and the results less robust. For
example, the high treatment children were less likely to experience clinically significant externalizing
(0 vs 16 percent) and internalizing (3 vs 20 percent) problems at age four, and engaged in better
prosocial behavior (Doyle 2020), however there were no effects on teacher-reported scores of socio-
emotional skills in the first year of primary school (Doyle and PFL Evaluation Team 2016).
The contributions of this paper are two-fold. First, to test for the continuity or fade-out of
early intervention treatment effects on human capital in middle childhood. The objective of the PFL
program was to improve children’s school readiness skills with the expectation that boosting
children’s skills prior to school entry would allow them to fully exploit the learning opportunities
which school provides. Thus, by assessing the impact of the program at age nine, we can document its
success or otherwise at narrowing socio-economic gaps in school-age skills. Data are available on
cognitive ability, which is considered a relatively stable trait, and achievement tests which are more
amenable to schooling and other investments (Magnuson and Duncan 2018), as well as different
dimensions of non-cognitive skills capturing both cognitive and behavioral components. Analysing
multiple measures of skills allows us to identify the areas through which early intervention can have a
persistent effect.
The evidence base used to justify investment in the early years is founded on a handful of
experiments which were conducted in the 1960’s and 70’s and continue to follow participants into
adulthood. The results from these landmark studies, such as the Perry Preschool, Abecedarian, and
Jamaica studies, typically find that intervening early in life leads to higher earnings and employment,
reduced crime, and better health in adulthood (e.g. Campbell and Ramey 1994; Gertler et al. 2014;
Heckman et al. 2010; Heckman et al. 2013; Schweinhart 2013). Many of the more recent
interventions, particularly the new wave of home visiting programs operating in developing countries
1 A number of papers published during the trial report interim findings. Doyle (2013) sets out the design of the
study. Doyle et al. (2014) analyze maternity hospital data and finds that the program had a significant effect on
reducing caesarean sections. Doyle et al. (2017a) finds that the program had no impact on early cognitive and
non-cognitive skills measured at six, 12, and 18 months, although effects on some parenting outcomes and
measures of the home environment were significant. Doyle et al. (2015) focused on child health at five time-
points between six and 36 months find effects on respiratory illnesses and general health problems, but only at
24 months. O’Sullivan, Fitzpatrick and Doyle (2017) conduct a mediation analysis and finds that improvements
in dietary intake, and protein in particular, mediates the impact of the program on cognitive development at 24
and 36 months. Doyle et al. (2017b) find no evidence that the program improved maternal well-being. Cote et
al. (2018) investigate whether the impact of the program varies according to children’s developmental
trajectories and find a positive impact on trajectories of cognitive development and number of health clinic visits
for all children, whereas positive impacts on externalizing behavior problems are restricted to children with the
most severe problems. Doyle (2020) reports on the final outcomes of the trial.

4
(usual tied to conditional cash transfer programs), either do not follow participants beyond the
intervention period or will have to wait several years to identify school age effects (e.g. Andrew et al.
2018; Attanasio et al. 2020; Barry et al. 2017).
This has resulted in what Almond, Currie and Duque (2018) refer to as the ‘missing middle’.
They argue that the full impact of early shocks, and by extension, early investment, in childhood is
not observed until adulthood, and there is a relative lack of knowledge on the mechanisms through
which policies implemented in early childhood transition through middle childhood and into
adulthood. For example, many of the landmark studies experienced a fading out of cognitive effects in
the aftermath of the intervention, yet improved outcomes in adulthood (e.g. Campbell et al. 2014;
Heckman et al. 2017). This points to either a latency/sleeper effect or that the intervention impacts
other unmeasured skills in childhood and adolescence which are important for later development
(Almond et al. 2018). Work by Heckman and colleagues, using the Perry Preschool program, points
to the latter and finds that treatment effects on earnings, criminality and health are largely driven by
improvements in non-cognitive skills, in particular externalizing behavior (Heckman, Pinto, and
Salvelyev 2013).
To date, there are few follow-up studies of more contemporary interventions which focus on
the prenatal and infancy period. While the seminal studies are influential in shaping our understanding
of the long term impact of intervening in an environment that was largely devoid of other family
supports, the ‘services as usual’ or counterfactual for children participating in contemporary trials is
typically more generous in terms of subsidized childcare and financial supports for low-income
families, at least in developed countries. Thus, on the one hand, we would anticipate lower effect sizes
in contemporary trials, both during and following the intervention, as high risk families receive more
‘treatment’ as standard practice. On the other hand, effect sizes may be higher and more persistent in
contemporary trials if dynamic complementarities exist (Cunha and Heckman 2007) and treatment
children, whose early skills have been boosted by the intervention during infancy can exploit the
higher level of universal investments made in school-age children. This study can help to address this
hypothesis by investigating whether the positive effects observed at the end of the PFL trial persist or
dissipate in later childhood and whether the effects are stronger for different types of skills. In this
way this study starts to fill the ‘missing middle’ by examining the impact of intervening during the
earlier stages of life on human capital at nine years old.
The second contribution of this paper is to identify the mechanisms through which treatment
effects operate. Most early intervention programs are based on the premise that providing children
with a supportive environment helps to protect them against the risk factors (such as poverty and
living in a high stress environment) which can compromise healthy development (Shonkoff 2010).
While interventions differ in their approach (e.g. center-based programs, home visiting programs,
conditional/unconditional cash transfer programs) they all promote caregiving behavior that is based

5
on the provision of enriching and stimulating environments which is responsive to children’s
developmental needs. The intervention studied in this paper is primarily a home visiting program,
where the specific focus is on improving parenting behavior and the quality of the home environment.
Home visiting programs operate by changing the knowledge, attitudes, and beliefs of parents, as well
as encouraging greater parent-child interactions (Britto et al. 2015). Thus the mechanism through
which the intervention should impact child outcomes is via changes in parental behavior. As PFL is a
holistic intervention with multiple treatments and whose remit within the broad scope of ‘parenting
behavior’ is wide, identifying the mechanisms through which treatment effects emerge is complicated
by the sheer number of factors upon which the intervention could impact. We address this using
exploratory factor analysis to summarize 190 different measures of parenting behaviors collected
between the ages of six and 48 months. We then use the resultant factors to conduct a mediation
analysis to determine what proportion, if any, of the age nine treatment effects can be explained by
improvements in early parenting behavior.
A common concern in longitudinal trials is attrition. In this study, approximately 65 percent
of the sample participated in the age five assessment, with equal representation across the high and
low treatment groups. By age nine, we retained ~60 percent of the high treatment group and ~40
percent of the low treatment group. Despite this unbalance in the number of participants in the groups,
tests for baseline equivalence shows that the treatment groups are still balanced on all key baseline
characteristics, indicating that the randomization assumption still holds. In addition, all results are
estimated both with and without inverse probability weights and are robust to their inclusion.
Overall, we find little evidence of cognitive fade-out at age nine, with effect sizes of 0.67 SD
on general conceptual ability and standardized school achievement tests of reading (0.74 SD) and
math (0.47 SD). These effects are larger than those found in both the seminal studies of home visiting
programs (e.g. Heckman et al. 2017) and the early outcomes that have emerged from more
contemporary home visiting trials (e.g. Attanasio et al. 2014). The program, however, has no impact
on absenteeism or the use of school resources and the significant treatment effects observed for
children’s socio-emotional skills and behavior at age four are no longer present at age nine. Mediation
analysis suggests that ~46 percent of the treatment effect on cognitive skills is explained by
improvements in early parenting behavior. The large and persistent effect on the more cognitive
dimensions of children’s skills may be attributed to both the length and intensity of the PFL program.
Many of the seminal and more recent interventions are typically shorter in duration and start later in
the lifecycle. By intervening in pregnancy and infancy, PFL helps to optimize brain development
during a period of heightened malleability, and by continuing the investment until school age it
exploits this elevated skill level to develop more advanced skills. The lack of persistent effects on the
non-cognitive dimensions of prosociality and behavior may be attributed to the weaker treatment
effects and the concentration of effects within the clinical range found at earlier ages.

6
The remainder of the paper is organized at follows. Section II sets out the theoretical
background and reviews the literature on school-age follow-ups of early intervention programs.
Section III describes the intervention and study procedures. Section IV presents the results. Section V
summarizes and concludes.
II Background & Literature
The Cunha and Heckman (2013) model of skill formation can be used to hypothesize the
likely impact of early intervention programs in middle childhood. Their model captures the role of
child endowments and parental/caregiver investment in shaping human capital over time. It posits that
mastering simple skills is a prerequisite for mastering more complex skills, a process referred to as
self-productivity. For example, a child must recognize numbers before performing addition. Thus, if
an intervention is effective in raising children’s basic skills early in life, this facilitates the acquisition
of more advanced skills later in life. Bailey et al. (2017) argue that interventions which develop skills
incrementally and target fundamental skills which are predictive of later skills have a higher
probability of achieving persistent effects. Based on this theory, one would expect that providing
sustained investment throughout the critical periods of skill formation which can respond to the
child’s growing skill set will be more likely to demonstrate effects beyond the life of the intervention.
Thus, the PFL program, which operates from pregnancy until age five and is based on a model of
supporting and coaching parents to optimize their child’s development using a set of age-appropriate
tip sheets, may be more likely to generate lasting change than center-based programs which start later
in childhood thus missing the critical ‘first 1000 days’, and due to higher child-caregiver ratios, may
not have the flexibility to respond to children’s individual needs.
Cunha and Heckman (2013) also state that the skills developed in one period make
investments in subsequent periods more effective, a process known as dynamic complementary.
Essentially, if an intervention raises skills early in life, this allows children to capitalize on later
investments. For example, children who start school with greater word recognition and vocabulary
skills are more likely to benefit from school-based literacy instruction compared to children lacking
these basic skills. This later investment may come from targeted interventions (e.g. preschool support
for disadvantaged children) or universal services (e.g. public primary schools). Bailey et al. (2017)
note that while the quality of this later investment may impact children’s skills, the gap between the
treatment and control groups will remain or widen if dynamic complementaries are at play. In the
context of PFL, as described below, there are no differences in the type or quality of schools attended
by the treatment and control groups, thus if the treatment group exhibits superior skills at age nine, it
would provide some support for this skill beget skill hypothesis.
Despite these theoretical considerations, much of the evidence base for early intervention
programs tends to exhibit a pattern of fade-out rather than persistence over time. A study by Baily et

7
al. (2017) examines the persistence of 67 high-quality early intervention programs2 and finds a
general pattern of declining effects sizes, with end of program effects averaging 0.23 SD, which then
fall to 0.10 SD by the end year one, and 0.05 SD up to two years after treatment has ended.3 They note
that apart from the few seminal programs, the majority of studies fail to follow participants thus
precluding the analysis of long term effects.
Regarding the seminal studies, most of which are center-based programs starting later in
childhood, the majority experience a fade-out of their initial treatment effects. For example, the Perry
Preschool Program found that the large and significant impact on cognitive development of 0.75 SD
identified at the end of the program had fallen to 0.08 SD by age eight (Schweinhart et al. 2005). In
addition, the effect sizes of ~0.20 SD on cognitive skills identified at the end of the Head Start
program (age four) were no longer present at subsequent follow-ups between kindergarten and third
grade (eight-nine years old) (Puma et al. 2012). Despite such cognitive fade-outs, these programs still
observed improvements in other outcomes later in life such as involvement in crime and being in
receipt of social welfare (Heckman et al. 2017). In addition, some did not report such cognitive fade-
outs. For example, the Jamaica study, which was based on weekly home visits from nine to 24
months, found that treatment effects on IQ of 0.88 SD had dissipated by age seven, but reemerged at
the 11, 17, and 22 year follow-ups with effect sizes ranging between 0.40 - 0.60 SDs (Grantham-
McGregor and Smith 2016). In addition, the significant IQ effect of 0.74 SD in the Abecedarian
program, which offered center-based care and home visits from infancy until age five, persisted,
although declined to 0.37 SD, on average, during the follow-up periods at ages eight, 12, 15, and 21
(Campbell et al. 2001). It is notable that the studies which experienced early cognitive fade-out are
based on programs starting at age three (e.g. Perry and Head Start), while programs starting earlier in
the lifecycle appear to demonstrate more persistent effects (e.g. Jamaica and Abecedarian), although
this observation is based on a handful of studies with long-term follow-ups.
Regarding contemporary interventions specifically focusing on home-based programs starting
before or shortly after birth, the evidence base for sustained effects is also inconsistent. Systematic
reviews reporting on treatment effects during or shortly after the program’s end, find impacts on
children’s health, development, behavioral problems, family economic self-sufficiency, and positive
parenting practices (Filene et al. 2013; Peacock et al. 2013; Sweet and Appelbaum 2004), however
these effects tend to be short lived (Burger 2010; Peacock et al. 2013) and few continue to follow the
cohorts into middle childhood. Appendix Tables 1a-c summarize the sparse literature examining the
2 Note that the majority of these studies are based on center-based early childhood education programs, with
one-third being assessed through random assignment, and the remaining using some form of quasi-experimental
design. 3 A meta-analysis focusing on programs targetting early phonological awareness, conducted by Bus and van
IJzendoorn (1999), found large initial impacts on children’s reading skills (0.44 SD) which faded to 0.16 SD at
the 18 month assessment on average. A number of mathematic interventions also find that large initial gains
tend to fade over time (Clements et al. 2013; Smith et al. 2013).

8
medium term impact of home visiting programs on children’s outcomes between the ages of five and
12 in developed countries, thus broadly corresponding to the follow-up period considered in this
paper.
Table 1a shows that of the four studies assessing the medium-term impact on children’s
cognitive development, only one has a significant effect. In particular, Bierman et al. (2017) find that
children who participated in Early Head Start (home based component) had improved cognitive
ability at ages seven to nine. However, no effects are found for Early Head Start at age five (Chazan-
Cohen, Raikes and Vogel 2013) or the Nurse Family Partnership program at ages six-nine (Olds et al.
2014) or age 12 (Kitzman et al. 2010).
Table 1b shows that of the five studies assessing children’s achievement tests, three identify a
significant treatment effect. Bierman et al. (2017) also find that Early Head Start had an impact on
children’s reading and language skills at ages seven to nine, and two studies of the Healthy Families
America program identify significant effects on the percentage of children in a gifted program,
receiving special education, and excelling academically in behaviors that promote learning at ages six
to seven (DuMont et al., 2010; Kirkland and Mitchell-Herzfield 2012). The Nurse Family Partnership
program had no impact on achievement tests at ages six to 12 (Sidora-Arcoleo et al. 2010) or at age
12 (Kitzman et al. 2010).
Finally, Table 1c shows that of the ten studies assessing the medium-term impact of home
visiting programs on children’s socio-emotional skills and behavior, only three identify significant
effects. In particular, two studies of the Early Head Start program find effects on children’s behaviors,
perceived competence, and approaches to learning at ages five (Chazan-Cohen, Raikes, and Vogel
2013) and ages seven to nine (Bierman et al. 2017). In addition, the Nurse Family Partnership
program finds a reduction in internalizing disorders at age 12 (Kitzman et al. 2010). However, a
number of other home visiting studies, including Healthy Families America at age seven (DuMont et
al. 2010), Healthy Steps at age five (Minkowitz et al. 2007), Family Check-Up at age five (Sitnick et
al. 2015) and age seven to eight (Smith et al. 2014), as well as the Nurse Family Partnership program
at ages six to nine (Olds et al. 2014) and ages six to 12 (Sidora-Arcoleo et al. 2010), fail to identify
sustained effects on children’s socio-emotional skills and behavior.
In general, based on this literature, there is little evidence that home visiting programs have a
sustained impact on children’s development in middle childhood. It is important to note that many of
these programs demonstrated small, although significant, effects at the end of the program, thus it is
possible that interventions which achieve sizeable improvements across multiple dimensions of skills
at program completion have a greater chance of demonstrating longer term impacts.

9
III Methods
A. The PFL Intervention
The intervention considered in this paper is based on the PFL program. The program was developed
in a bottom-up fashion by local service providers and community representatives with the aim of
advocating for greater parental investment in children. The over-arching aim of the program was to
reduce social inequalities in children’s skills by working with families residing in a highly
disadvantaged community from pregnancy until approximately age five. The program was delivered
by a team of family mentors who were directly employed on a full-time basis. Although the mentors
came from different professional backgrounds, ranging from social work to psychology, they all
received six months training before the trial began, as well as monthly supervision throughout the
trial, to ensure consistency of program delivery.
PFL was essentially a dosage experiment such that all participants received some low levels
supports and the ‘high’ treatment group received additional intensive parenting supports. The ‘low’
treatment included five developmental-toy packs containing, for example, building blocks and a play
mat; four developmental-book packs containing between six-eight books; two framed professional
photographs of the target child; access to a support worker to assist in non-parenting related issues;
invitations to attend workshops on healthy eating and stress control, as well as PFL specific social
event (e.g. Christmas parties, coffee mornings). The ‘high’ treatment included a baby massage
course, the Triple P Positive Parenting Program, and the primary treatment - a five year home visiting
program. Each treatment was designed to support and encourage parents to engage in parenting
behaviors which would optimize their children’s development.
Although the evidence base for baby massage is limited (see Bennett, Underdown, and
Barlow 2013), participants in the high treatment group were invited to attend five two-hour baby
massage classes during the first year of the program. The dual aim of these sessions were to
encourage early physical and gaze interactions between parents and their infants, as well as serve as
an incentive for early engagement with the PFL program. In total, 62 percent of the high treatment
group attended at least one of the classes.
All the PFL mentors were trained in delivery of the Triple P Positive Parenting Program.
Triple P is a universal program which operates at five levels of intervention including a media
campaign and communication strategy, a positive parenting seminar series, single session discussion
groups, intensive small group and individual programs, and intensive family intervention (Sanders,
Markie-Dadds, and Turner 2003). Its core principle is the promotion of positive parenting strategies
through setting clear rules and boundaries while providing a safe and engaging home environment
(Sanders 2012). Each Triple P level has been subject to some form of experimental evaluation, with
demonstrated evidence of effect on parenting behavior and children’s socio-emotional skills (Sanders

10
et al. 2014) The PFL mentors used the Triple P strategies throughout the home visits and during the
third year of treatment (between 24 and 36 months) participants were invited to take part in five
group-based Triple P sessions. These two-hour sessions took place in the local community center and
were facilitated by the mentors who worked through a range of goal setting exercises focused on
managing misbehaviour and promoting child development using active discussion, videos, vignettes
and role playing. In total, 43 percent of the high treatment group took part in all least one Triple P
session.
At its core PFL is a home visiting program. Each family in the high treatment group was
assigned a PFL mentor to work with the family in their home from pregnancy until their child started
primary school. It was hypothesized that working with the same family for such an extended and
critical period in the child’s life would facilitate a relationship of trust and respect to develop, which
in turn, would ensure the efficacious delivery of the program’s content. Although the prescribed
treatment was based on one-hourly home visit every two weeks, there was considerable variability in
the quantity of visits delivered with 16 percent of families participating in more than 90 home visits
and 17 percent participating in no visits. On average, families received 50 visits from the mentors (SD
= 38. range 0 - 145), which represents approximately one visit per month.
The mentoring was based on three core principles of providing knowledge and active
guidance on appropriate parenting techniques, helping parents to identify and promote children’s
developmental milestones, and encouraging parents to provide greater stimulation to their children,
particularly during infancy. The mentors used an active learning approach which involved modelling
behavior which promotes child development, observation and feedback on parents’ interactions with
their children, as well as providing skills training in various domains such as nutrition and discipline.
The success of these strategies was dependent on the strength of the mentor-parent relationship, thus
the mentors invested a significant amount of resources, especially during the first year, on building
this relationship.
The content of the home visits was based ~200 ‘Tip Sheets’ which were delivered based on
the age of the child and the needs of the family. The Tip Sheets delivered between pregnancy and age
one focused on pregnancy health, preparing for the birth, nutrition and infant health, providing a safe
home environment, building a secure parent-infant relationship, and methods for promoting the
infant’s early cognitive development, amongst others. The Tip Sheets delivered between age one and
two continued to focus on child health and nutrition, but with a larger emphasis on supporting the
child’s socio-emotional development, as well as identified and promoting developmental milestones.
The final set of Tip Sheets delivered between age two and school entry, continued to focus on
methods for developing the child’s cognitive and socio-emotional development, with a particular
emphasis on language skills and managing challenging behavior, as well as preparing the child for
school. While the Tip Sheets were developed by the PFL program team, they were informed by best
practice evidence on child development and parenting. The mentors used a variety of tools to deliver

11
the material including role modelling and observation techniques, discussion and feedback, and
critical review and goal setting. A qualitative study of the PFL program identified the importance of
the parent-mentor relationship and program flexibility as the main factors influencing participant
engagement with the program (Lovett et al. 2016).
B. Study design
The PFL program was delivered between 2008 and 2015 to pregnant women living a high-
poverty community in Dublin, Ireland.4 Apart from geographical residency, there were no exclusion
criteria. Women were recruited through the local maternity hospital and a community-based
advertising campaign. As recruitment was voluntary, an estimated 52 percent of all eligible women
were recruited into the study.5 After consenting to join the study, participants were randomly assigned
to either the high treatment group (n=115) or the low treatment group (n=118) using individual-level
randomization with no blocking or stratification.6 Randomization was conducted on a tablet computer
whereby participants were invited to initiate their own treatment assignment by tapping the PFL logo
on the welcome page. This action initiated an email listing the participant’s ID number and treatment
condition which was automatically sent to the study team and acted as a permanent record of
treatment assignment, thus countering any subversion by the recruitment officer or the participant. A
baseline comparison of the high and low treatment groups found that there were no statistically
significant differences between the groups on 108 of the 117 measures tested, confirming the success
of the randomization procedure. Please refer to Doyle (2013) and Doyle (2020) for more detail on the
recruitment and randomization procedures.
Outcome data were collected from participants at multiple time points during the trial
(pregnancy, and when the children were six, 12, 18, 24, 36, 48, 51, and 60 months).7 Five years after
the program ended, additional funding was received to conduct a follow-up of the cohort at age nine.
All families who were originally recruited and randomized were eligible to take part in the follow-up
however, participants who had officially dropped out or left the study due to death or miscarriage
4 The community is characterized by high rates of unemployment (12 percent) and low education (7 percent
college degree), as well as high rates of public housing (42 percent) (Census 2006) and poor levels of children’s
school readiness skills (Doyle et al. 2012). 5 Among those who did not join the study, the study team had no contact with approximately half of eligible
non-participants and had some level of contact with the other half who either refused to join the study or could
not be further contacted for recruitment. A survey of eligible non-participants, conducted through the local
preschool centers when the children were four years old, found there were no differences between participants
and non-participants in terms of maternal age, family size, parity, relationship status, or type of employment,
however participants were younger at the birth of their first child, had lower levels of education, were less likely
to be employed, and were more likely to be eligible for free medical care compared to non-participants. Please
see Doyle (2020) for more information. 6 A power analysis, based on 80 percent power, a 5 percent significance level, and a minimum detectable effect
of 0.18 SD for cognitive skills (based on a meta-analysis of home visiting programs by Sweet and Appelbaum
2004), found that a sample of 117 in the treatment and control groups was required. 7 All PFL data is publicly available for use and can be accessed in the Irish Social Data Archive at
www.ucd.ie/issda

12
were not contacted. In the first phase of recruitment, all families were invited to attend a community
event organised by the PFL mentoring team and eligible attendees were invited to participate in the
follow-up. As a second phase of recruitment, eligible participants who did not attend the community
event and who had previously agreed to future contact by the study team, were contacted directly and
invited to participate. In both phases of recruitment, eligible participants were provided with
information about the follow-up study and were asked to re-consent to join the study.
C. Attrition
Figure 1 depicts the families’ participation in the study between program entry and the age
nine follow-up. At the end of the program, 65 percent of the high treatment group and 63 percent of
the low treatment group were retained, thus attrition was largely equivalent across both groups.
However, by age nine, attrition was significantly higher among the low treatment group. Child
assessment data were collected for 117 of the original 233 randomly assigned participants,
representing an overall retention rate of 50 percent (high=59 percent; low=41 percent; p-
value=0.003). For the school data, information on 123 participants were available, representing a
retention rate of 53 percent (high=61 percent; low=45 percent; p-value=0.015). For the parent data,
surveys were conducted by 111 participants, representing an overall retention rate of 48 percent
(high=56 percent; low=40 percent; p-value=0.016). This higher rate of attrition among the low
treatment group may, in part, be attributed to the recruitment strategy which largely depended on the
PFL mentors, with whom the high treatment families have greater contact. As shown in Appendix
Table 1a-c, these rates are somewhat lower than the follow-up studies of the mainly US-based home
visiting programs.8
A comparison of the high and low treatment groups at baseline using the age nine estimation
samples finds that the groups significantly differ (at the 10 percent level) on 6.8 percent (8/117) of
baseline measures for the child assessment data, 10.3 percent (12/117) of measures for the school
data, and 12.8 percent (15/117) of measures for the parent data. These are largely consistent with
chance and indicate that the groups remain balanced at the follow-up, particularly for the child data.9
Table 1 compares the age nine participants in the high and low treatment groups across the three
estimation samples for a selection of baseline variables. It shows that there are no statistically
significant differences across the two groups for a range of socio-demographic factors including
parental age, education, employment status, and health.
Although the estimation samples are largely balanced in terms of baseline characteristics, it is
important to test for differential attrition in the high and low treatment group. To investigate this, the
8 The introduction of the General Data Protection Regulation (GDPR) in 2018, an EU law on data protection and
privacy, limited our ability to directly contact the original trial participants without explicit consent beyond the
life of the trial. 9 As discussed in results section, the results are robust to conditioning on baseline differences.

13
factors predicting participation in the child, school, and parent assessments are tested separately for
the high and low treatment groups using bivariate tests with 50 of the baseline measures. We find
some evidence of differential attrition, with between 17 and 36 percent of baseline measures
predicting attrition from the high treatment group at age nine, and between 11 and 19 percent of
measures predicting attrition from the low treatment group (in two-tailed tests, using the 10 percent
significance level).10
Overall, there is less evidence of differential attrition in the school sample than
the parent or child samples. The factors associated with attrition are similar in the high and low
treatment groups, however the number of variables predicting attrition is lower in the low treatment
group. Table 2 compares a selection of baseline characteristics of those who participated in the age
nine parent assessment, i.e. stayers, to those who did not, i.e. non-stayers. It shows that high treatment
parents who completed the age 9 assessment were older, had higher IQ, and were more likely to be
employed at baseline, while low treatment parents who completed the age nine assessment were less
likely to be first time mothers.
In order to account for differential attrition across the high and low treatment groups, the
treatment effects are estimated using the Inverse Probability Weighting (IPW) procedure (Robins,
Rotnitzky, and Zhao 1994). To determine which baseline measures predict the age nine drop-out rate,
separate bivariate tests are conducted and the Bayesian Information Criterion (BIC; Schwarz 1978) is
used to reduce down the number of significant measures to be included the final logistic model
predicting the probability of participating in the assessment. These logistic models are then used to
generate predicted probability weights which are included in the estimation of treatment effects. This
method ensures that those who participated in the age nine follow-up and have similar characteristics
to those who did not are given a larger weight in the analysis.11
C. Data
Unlike previous PFL data collection waves which took place in a two and a half year block in
order to capture children who were the same age at the time of the interview, data for the age nine
follow up were collected in a six-month period between February and June 2019. While the majority
of children were nine years old at the time of assessment (average age 9.4 years), the children ranged
in age from eight to 11 years old.12
Importantly, there were no statistically significant differences in
the age of the children in the high and low treatment groups at the time of assessment (high
treatment=9.5 years, low treatment=9.4 years; p-value=0.355). As there are no differences in the ages
of the children across groups, we do not control for age in the analyses. Data were collected through
10
For the child sample, 32 and 11 percent of baseline measures significantly predict attrition from the high and
low treatment groups respectively. For the school sample, the corresponding figures are 17 and 19 percent. For
the parent sample, the corresponding figures are 36 and 17 percent. 11
Participants who completed the age nine assessment, but did not complete the baseline assessment, are
assigned the average weight. 12
In particular, 30 percent of the children were eight years old, 42 percent nine years old, 27 percent 10 years
old, and 1 percent 11 years old.

14
direct assessments with children, information provided by schools, and interviews with parents.
Detailed information on all instruments used may be found in Appendix B.
Direct assessment
A total of 117 child assessments were conducted lasting approximately 45-60 minutes on
average. Children were invited to participate in tests of their cognitive skills using the British Ability
Scales III: School Age Battery (BAS III; Elliott, Smith and McCulloch 2011) (an updated version of
the assessment used in earlier waves). The BAS III yields an overall score reflecting general cognitive
ability (General Conceptual Ability, GCA), as well as three standardized scores for Verbal Ability,
Pictorial Reasoning Ability, and Spatial Ability. Children’s socio-emotional skills was assessed using
the self-reported Social Skills Improvement System Rating Scales (SSIS-RS; Elliot and Gresham,
2008). The majority of these assessments (99%) were conducted in the child’s school.
School records
Information on standardized achievement test scores, absenteeism and resource supports were
gathered from 32 schools. Data on achievement scores were available for 118 children, while data on
absenteeism and school resources were available for 123 children. All schools in Ireland must
complete standardized testing for reading and maths in second grade (age seven/eight), and schools
can choose to administer the tests more frequently if they wish. The test scores capture children’s
literacy and numeracy skills based on either the Drumcondra Tests for Reading and Mathematics or
the Micra-T for English Reading and Sigma-T for Mathematics tests. Within our sample, 64 percent
of children completed the Micra and Sigma tests and 34 percent the Drumcondra tests. The norm-
referenced standard scores and categorization of above and below average performance based on
STen scores are used as indicators of children’s reading and mathematics ability. The absenteeism
records include information on school attendance in 2017/18 and 2018/19 based on the number of
days in attendance as a proportion of days in the school year. Data was also gathered on the type and
amount of additional resource/learning support which the child received.
Table 2 compares the school characteristics of the high and low treatment groups and shows
that there are no statistically significant differences across the groups in terms of the proportion of
children attending designated disadvantaged status (DEIS) schools13
, single-gender schools, schools
outside the PFL catchment area, and the distance of schools from the catchment area. In addition,
there are no differences across the high and low treatment groups regarding the proportion of children
taking the Drumcondra tests or the Micra/Sigma tests. This is important as it allows us to combine the
scores from both tests to estimate treatment effects for the whole sample. Robustness tests, where the
13
DEIS schools are classified using socio-economic indicators of the community and school population e.g.
unemployment, social housing, literacy levels. These schools receive additional resources including additional
staff and funding and access to literacy and numeracy programs.

15
tests are analyzed separately, are also conducted. Although the PFL children attended a wide range of
schools (32 in total), 55 percent attended one of the four schools in the PFL catchment area. In 26 of
the other schools, only one or two PFL children were attending. A large proportion of the children
were attending a DEIS school (71 percent), 76 percent were attending coeducational schools, and 24
percent were attending single gender schools. The vast majority were attending Catholic schools (98
percent). The finding that the children in the high and low treatment groups are attending similar
schools suggests that the program had no impact on parent’s school enrolment decisions.14
Parent interview
In total 111 parent interviews were conducted either online (n=39), over the phone (n=49), or
in person (n=23) depending on the participant’s preference. The questionnaire included measures to
assess children’s socio-emotional skills using the Brief Problems Monitor (BPM; Achenbach et al.
2011) and two sub-domains of the Strengths and Difficulties Questionnaire (SDQ; Goodman 1997).
The interview did not exceed 20 minutes in duration.
D. Estimation of Treatment Effects
To estimate the effect of PFL on age nine outcomes we use permutation-based hypothesis
tests with 100,000 replications (see Good 2005; Ludbrook and Dudley 1998; Mewhort 2005).15
We
control for child gender in all specifications as the high treatment group contained more boys than the
low treatment group at baseline, and this difference is also present in the age nine samples.16
We
estimate the following equation:
𝑌𝑖 = β0 + β1Di + β2𝑋𝑖+ ϵi
where Yi is the outcome variable, Di is an indicator of treatment status, Xi represents child gender, and
i is an idiosyncratic error term. The parameter of interest is 1. As we anticipate the program to have
a positive impact on school-age outcomes, one-sided tests with the accepted Type I error rate set at 10
percent are reported. As a robustness test, we add additional covariates to this model to test the impact
of controlling for four baseline differences on which the high and low treatment groups differ (i.e.
maternal knowledge of child development, parenting self-efficacy, maternal attachment, and maternal
consideration of future consequences). When controls are added to the permutation tests, the
Freedman–Lane procedure (Freedman and Lane 1983) is used to partition the sample into subsets
14
In Ireland, parents are, in theory, free to send their children to a State-funded primary school of their choice.
However, due to space constraints, most school use some form of an admissions policy, generally giving
preference to students from the local area. Most children start school between four and five years of age, and all
children must be enrolled in school by age six. 15
As the age nine estimation samples are relatively small, permutation tests which do not depend on the
asymptotic behavior of the test statistic are more suitable (Ludbrook and Dudley 1998). This method has been
used to estimate treatment effects using previous waves of the PFL data (see Doyle et al. 2017a; Doyle 2020). 16
For the age nine child sample, 57 percent of the high treatment group are boys compared to 35 percent of the
low treatment group.

16
which include participants with the same characteristics. Under the null hypothesis of no effect, the
outcomes of the high and low treatment groups have the same distributions within a subset. However,
when multiple control variables are used, the subsets may become too small, thus each outcome is
regressed on the control variables assumed to share a linear relationship with the outcomes. The
predicted residuals are then permuted from these regressions within the subsets.
As multiple outcomes are tested at age nine, the stepdown procedure (Romano and Wolf
2005)17
is used to address issues associated with multiple hypothesis testing. For the cognitive
outcomes, the variables are placed into three stepdown categories capturing BAS composite scores,
BAS above the norm scores, and BAS below the norm scores. For the school outcomes, variables are
placed in four stepdown families capturing standardized test scores, above the norm scores, below the
norm scores, and absenteeism/school resources. For the socio-emotional outcomes, the variables are
placed into four stepdown categories capturing child-reported socio-emotional scores, child-reported
socio-emotional below-average scores, parent-reported socio-emotional scores, and parent-reported
socio-emotional below-average scores. The methods used in this paper to estimate treatment effects
based on conditional permutation testing with the stepdown procedure, has been used and described in
other papers reporting on the PFL trial (e.g. Doyle et al. 2017a; Doyle 2020).
IV Results
A. Cognitive outcomes
The results reported in Table 4 indicate that the PFL program continues to have a significant
and sizable impact on children’s skills at age nine. The treatment increases children’s overall BAS
GCA score by 0.67 SD, which is similar to the effect of 0.77 SD identified using the same measure at
the end of the program (Doyle 2020), demonstrating the sustained impact of the program almost five
years after the treatment ended. The results also show that PFL has a significant impact on each
dimension of cognitive skill including spatial ability (0.48 SD) which involves problem solving,
spatial visualization, and short-term visual memory; non-verbal reasoning ability (0.76 SD) which
involves inductive reasoning; and also verbal ability (0.39 SD) which involves children’s verbal
reasoning, verbal knowledge, and expressive language. In addition, all four composite scores survive
adjustment for multiple hypotheses testing.
Children are classified as scoring above the norm if their GCA score is greater than 110 points
and below the norm if their scores are less than 90 points (range 51-122). Table 4 shows that the high
17 First, a t-statistic for each null hypothesis in the stepdown family is calculated. Next, the outcome with the
largest t-statistic is compared with the distribution of maxima permuted t-statistics. If the corresponding p value
is less than 10 percent, the joint null hypothesis is rejected, and the outcome with the lowest p value is excluded.
The remaining outcomes in the stepdown family are tested again. This process continues until the resulting
subset of outcomes fails to be rejected or only one outcome remains.

17
treatment children are more likely to score above the norm in terms of their overall cognitive ability
and their spatial ability; however neither result survives multiple hypotheses adjustment with effect
sizes ranging from 0.01 to 0.36 SD. In contrast, the high treatment children are less likely to score
below the norm across all three cognitive domains, as well as overall ability, and the results are robust
to multiple hypothesis adjustment. The effect sizes range from 0.42 to 0.67 SD. It is important to note
that relatively few children, in either the high or low treatment group, score above the norm, while
large proportions score below the norm. For example, only 2 percent of children in the high treatment
group have GCA scores above the norm, while 58 percent score below the norm. The BASIII norms
are based on a representative UK sample including children across all social groups. The scores
identified here thus reflect the disadvantaged nature of the PFL cohort, yet the counterfactual reveals
that without the PFL intervention a significantly greater proportion of the high treatment children
would have scored below the norm (78 percent in the low treatment group), thus demonstrating the
effectiveness of the program.18
The significant results regarding the proportion of children scoring below the norm suggests
that the program primarily impacts the lower end of the distribution of children’s skills. This is
demonstrated in Figure 3 which shows that the distribution of GCA scores for the high treatment
group is shifted to the right of the low treatment groups’, with larger differences at the lower end of
the distribution.
B. School outcomes
Table 5, which reports the results for the school-based outcomes, are in-line with those
observed for cognitive skills. The results indicate that the PFL program has a significant and large
impact on children’s academic test scores at age nine, however there are no effects on absenteeism or
use of school resource.
The first panel shows the results based on children’s second and third class standardized
achievement tests. Note that the sample size is lower for third class as complete data are only
available for second class as many of the children had not yet entered third class compared. Children
in the high treatment group have significantly higher second and third class reading and maths
standardized scores to the low treatment group. All the standardized results survive adjustment for
multiple hypotheses testing and the effect sizes range from 0.33 to 0.74 SD. Children in the high
treatment group are significantly less likely to score below the norm in terms of their reading and
maths scores in both years, and are significantly more likely to score above the norm in terms of their
third class reading and maths scores, as well as their second class maths score. Two of the four above
18
The non-IPW adjusted results are slightly more conservative with somewhat lower effect sizes. For example,
14 of the 16 cognitive outcomes reach conventional levels of significance in the individual IPW-adjusted
permutation tests, compared to nine in the non-adjusted results. However, all three stepdown families are still
statistically significant in the non-adjusted results.

18
the norm results survive multiple hypotheses adjustment – third class reading scores and second class
maths scores. The effect sizes range from 0.19 to 0.64 SD. All four of the below the norm scores
survive adjustment for multiple hypothesis testing, with effect sizes of 0.34 to 0.57 SD. In contrast,
only one of the six absenteeism and school resources outcomes are statistically significant in the
individual tests (high treatment children are less likely to have additional out-of-class educational
supports), however it does not survive adjustment for multiple hypothesis testing.19
As a robustness test, the school results are re-estimated by conditioning on the schools DEIS
(disadvantaged) status and an indicator of whether the child conducted the Drumcondra tests or the
Micro/Sigma tests. The findings, provided in Appendix Table B1, show that the results are robust to
the inclusion of these controls.20
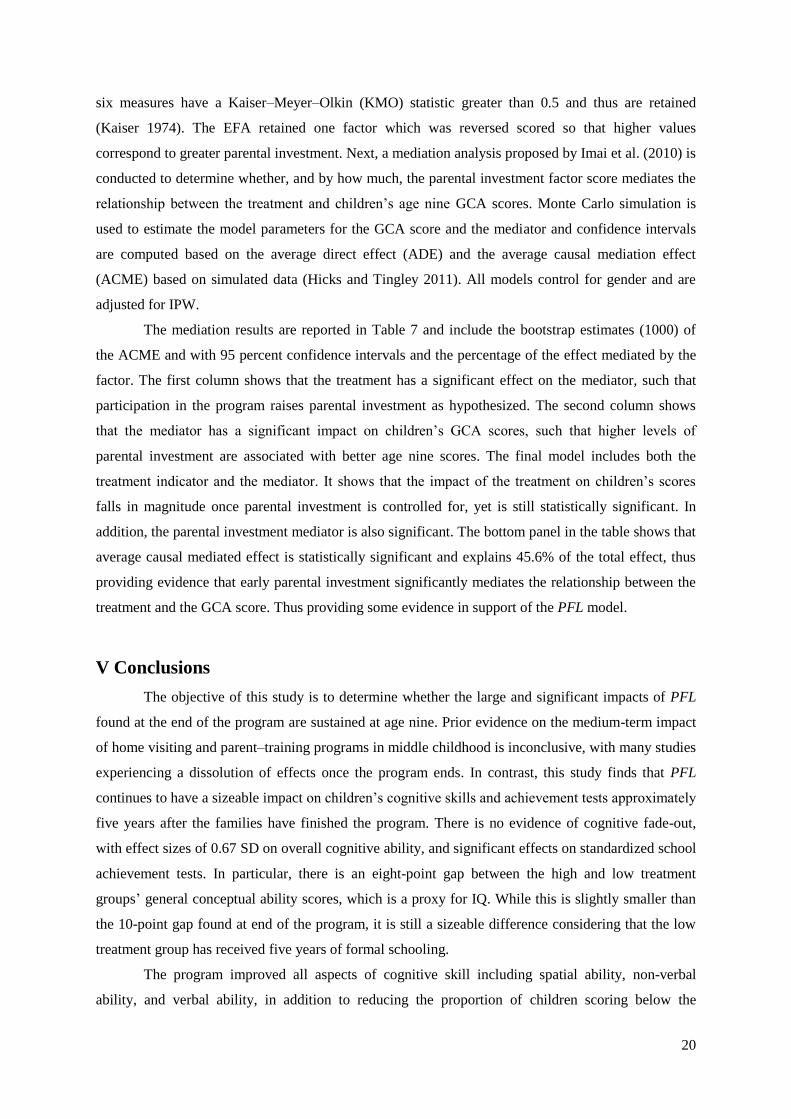
C. Child socio-emotional outcomes
The results in Table 6 indicate that the program has no impact on children’s socio-emotional
skills at age nine as measured using the child-reported Social Skills Improvement System Behavior
Problems Subscale (SSIS) or the parent-reported Strengths and Difficulties Scale (SDQ) or the Brief
Problems Monitor (BPM). Children in the high treatment group have fewer internalizing problems,
but more externalizing problems, however these differences are not statistically significant and the
effect sizes are low. In addition, although children in the high treatment group have statistically
significantly fewer peer problems, attention problems, and total behavioral problems according to the
individual permutation tests, these results do not survive adjustment for multiple hypothesis testing.
The program also has no impact on the proportion of children with ADHD or learning difficulties. In
sum, these results suggest a fade-out of the program’s impact on the socio-emotional and behavioral
skills that were observed at age four.21
D. Conditioning on baseline differences
As a robustness test, the results are re-estimated conditioning on four variables on which there
were significant differences between the high and low treatment groups at baseline and may impact
child outcomes – namely maternal knowledge of child development, parenting self-efficacy, maternal
attachment, and maternal consideration of future consequences. Appendix Table C2 shows that the
19
The non-IPW adjusted results are also similar. There are no differences in the number (or level) of statistically
significant results between the IPW and non-IPW adjusted models and the effect sizes are largely similar.
However, more of the results survive multiple hypothesis adjustment. 20
A separate analysis which included all 18 school outcomes in one stepdown family found that the standard
reading score in third class, the standard maths score in second class, and the proportion scoring above the norm
on maths scores in second class remained statistically significant in the stepdown analysis. 21
The non-IPW adjusted results are similar to the IPW adjusted results, however two statistically significant
differences emerge in the non-IPW adjusted individual permutation tests – children in the high treatment group
are significantly less likely to fall within in the above the norm range for bullying problems and overall
behavioral problems – however, neither of these results survive multiple hypotheses adjustment.

19
conditional results for child cognitive outcomes are largely similar to the main results, however two of
the outcomes which reach conventional levels of significance in the individual permutation tests are
not significant in the conditional results – general conceptual ability and non-verbal above the norm
scores. The remaining results are similar in terms of effect size and significance. Table C3 shows that
the conditional results for the school outcomes are similar to the main results in terms of the number
of statistically significant differences and the effect sizes. Table C4 shows that the conditional results
for child socio-emotional outcomes are largely similar to the main results, however one outcome is
statistically significant in the conditional results which was not significant in the unconditional results
– proportion of children with above the norm behavioral problems – however it does not survive
multiple hypothesis adjustment. In addition, the three individual significant treatment effects found in
the main results for children’s socio-emotional standardized scores are no longer significant once
controls are added. This again confirms a lack of program impact on children’s socio-emotional skills
at age nine.
E. Mediation Analysis
The second aim of this paper is to understand the channels through which these improvements
in cognitive skills and achievement were obtained. Thus, a mediation analysis is carried out to
examine the potential mechanisms underlying the treatment effects. As discussed in the introduction,
PFL is a holistic program that aims to impact multiple aspects of parenting in the expectation that
these improvements will have a direct impact on child outcomes. Throughout the course of the trial,
multiple indicators of parenting were collected between six and 48 months, and 190 of them are
considered for inclusion in the mediation analysis.
As the number of potential mediators is greater than the number of participants, 190 OLS
models are first conducted to test which variables predict children’s cognitive skills as measured by
the GCA standardized score. The models control for gender and are adjusted for IPW as in the main
specification. In total, 18 percent (34 of the 190 indicators) are significantly associated with age nine
GCA scores. Next, we test which of these 34 measures are significantly impacted by the treatment,
again using OLS and controlling for gender and IPW. In the majority of cases, the treatment has no
impact on the parenting behaviors that are associated with the GCA scores. However, the treatment
does impact the following six variables in the expected direction – the use of electrical socket covers
at six months, the HOME (Home Observation Measurement of the Environment) Acceptance score at
18 months, the PACOTIS (Parental Cognition and Conduct Toward the Infant Scale) Impact Score at
24 months, the PSDQ (Parenting Styles and Dimensions Questionnaire) Permissive Parenting score at
36 months, the PSDQ Punitive Parenting score at 36 months, and smoking in the home at 36 months.
In order to summarize these six measures into one aggregate measure of parental investment,
exploratory factor analysis (EFA) is applied. The Kaiser criterion, scree plot, (Cattell 1966), and
Horn’s (1965) parallel analysis is used to determine the number of factors to be retained. Note that all
20
six measures have a Kaiser–Meyer–Olkin (KMO) statistic greater than 0.5 and thus are retained
(Kaiser 1974). The EFA retained one factor which was reversed scored so that higher values
correspond to greater parental investment. Next, a mediation analysis proposed by Imai et al. (2010) is
conducted to determine whether, and by how much, the parental investment factor score mediates the
relationship between the treatment and children’s age nine GCA scores. Monte Carlo simulation is
used to estimate the model parameters for the GCA score and the mediator and confidence intervals
are computed based on the average direct effect (ADE) and the average causal mediation effect
(ACME) based on simulated data (Hicks and Tingley 2011). All models control for gender and are
adjusted for IPW.
The mediation results are reported in Table 7 and include the bootstrap estimates (1000) of
the ACME and with 95 percent confidence intervals and the percentage of the effect mediated by the
factor. The first column shows that the treatment has a significant effect on the mediator, such that
participation in the program raises parental investment as hypothesized. The second column shows
that the mediator has a significant impact on children’s GCA scores, such that higher levels of
parental investment are associated with better age nine scores. The final model includes both the
treatment indicator and the mediator. It shows that the impact of the treatment on children’s scores
falls in magnitude once parental investment is controlled for, yet is still statistically significant. In
addition, the parental investment mediator is also significant. The bottom panel in the table shows that
average causal mediated effect is statistically significant and explains 45.6% of the total effect, thus
providing evidence that early parental investment significantly mediates the relationship between the
treatment and the GCA score. Thus providing some evidence in support of the PFL model.
V Conclusions
The objective of this study is to determine whether the large and significant impacts of PFL
found at the end of the program are sustained at age nine. Prior evidence on the medium-term impact
of home visiting and parent–training programs in middle childhood is inconclusive, with many studies
experiencing a dissolution of effects once the program ends. In contrast, this study finds that PFL
continues to have a sizeable impact on children’s cognitive skills and achievement tests approximately
five years after the families have finished the program. There is no evidence of cognitive fade-out,
with effect sizes of 0.67 SD on overall cognitive ability, and significant effects on standardized school
achievement tests. In particular, there is an eight-point gap between the high and low treatment
groups’ general conceptual ability scores, which is a proxy for IQ. While this is slightly smaller than
the 10-point gap found at end of the program, it is still a sizeable difference considering that the low
treatment group has received five years of formal schooling.
The program improved all aspects of cognitive skill including spatial ability, non-verbal
ability, and verbal ability, in addition to reducing the proportion of children scoring below the

21
standardized norm. The program is particularly beneficial for children at the lower end of the skills
distribution. This contrasts somewhat from earlier findings where there was evidence that the program
shifted the entire distribution of cognitive skills. This difference may have occurred as naturally
higher ability children, regardless of their treatment status, may be better placed to take advantage of
the learning and supports provided in school. The magnitude of the cognitive effects at age nine (0.39
- 0.76 SD) are similar, albeit a little smaller, to those found at the end of the program (0.56 - 0.77 SD).
An additional analysis shows that controlling for age five cognitive scores reduces the size of the age
nine treatment effects, however the impact of the program on age nine scores is still statistically
significant.22
This suggests that PFL is continuing to have an impact on children’s development
beyond the lifetime of the program.
The results provide evidence in support of the skill formation model (Cunha and Heckman
2007) which posits that developing children’s skills early in life helps them to develop more advanced
skills later in life through a process of self-productivity, and this in turn raises the effectiveness of
later investments, such as investments in schooling. Thus the study offers support for such dynamic
complementarities, although an explicit test of this hypothesis is not possible as all children were
exposed to schooling. If this process persists and the high treatment group continue to utilize their
advanced skill set, this is likely to translate into improved outcomes throughout the life cycle. Indeed,
the large and significant treatment effects found for school achievement tests suggest that these
advanced cognitive skills are already having an impact on the children’s performance in school.
Children who received the high treatment supports have better second and third class standardized test
scores in reading and maths, with effect sizes ranging from 0.33 - 0.74 SD. The high treatment group
is also significantly less likely to score below the norm on their second and third class reading and
maths tests and more likely to score above the norm on their third class reading and second class
maths tests.23
Unlike the cognitive tests which were only administered to the PFL cohort, the
achievement tests were completed by all children in all schools in Ireland as part of national
standardized testing, therefore they provide an independent assessment of the children’s reading and
maths ability. In addition, they allow us to compare the PFL cohort to the national norm. In Ireland,
about one-third of children score below the norm i.e. a STen score of 4 or below, and one-third of
children score above the norm, i.e. a STen score of 7 or above (Department of Education and Skills
2016). In our sample, 31 percent of the high treatment group score below the norm on their reading
scores and 34 percent on their maths scores, compared to 47 and 55 percent for the low treatment
groups’ reading and maths scores respectively. In addition, 26 and 22 percent of the high treatment
group score above the norm on their reading and maths tests, compared to 19 and 5 percent
22
Results available upon request. 23
Note that the third class results are based on a smaller sample size as some of the children had not yet started
third class at the time of data collection, thus the third class results should be interpreted with caution.

22
respectively in the low treatment group. This suggests that the program has raised the ability scores of
the high treatment group to the national average, thus eliminating inequalities in school-age skills.
An interesting finding which emerged during data collection was the number and diversity of
primary schools attended by the PFL cohort. In total, the 123 children are attending 32 different
schools. While the majority are attending designated disadvantaged schools (73 and 68 percent in the
high and low treatment group respectively), there is still some heterogeneity. Although 55 percent are
attending schools within the PFL catchment area, many children are attending schools outside the
catchment area. As equal proportions of the high and low treatment groups are attending schools
outside the catchment area, this suggests that the program did not change parents’ preferences
regarding the type or location of their child’s primary school. From an evaluation perspective it is
useful as it suggests that the significant treatment effects found for cognitive ability and achievement
tests are unlikely to be driven by differences in school type.
In contrast to the results for children’s cognitive skills, the program has no impact on school
absenteeism or the use of school resources. The result for absenteeism is not particularly surprising
given that most schools have home-school liaison officers who directly address this issue, thus
resulting in very low proportions of children missing school (94 percent of the high and low treatment
group are present throughout the school year). The rates of absenteeism among the PFL cohort is also
very similar to the national average rate of absenteeism which ranged from 5.4 to 5.9 percent between
2012/13 and 2016/17 (Millar 2018). The lack of significant treatment effects for the use of additional
school resources, such as a special needs assistant and additional literacy and maths support, are more
surprising, especially given the high proportion of children scoring below the norm, especially in the
low treatment group. Indeed, only 6 and 5 percent of children in the high and low treatment group
respectively have a special needs assistant. Although the low treatment group avail of a higher
proportion of in-class and out-of-class support (54 and 38 percent respectively) compared to the high
treatment group (40 and 24 percent respectively), these differences are not statistically significant.
The lack of differences across the two groups may reflect recent policy to provide additional support
to all children within the classroom environment rather than singling individual children out for
treatment.
The findings also indicate that the significant treatment effects observed for children’s socio-
emotional skills at age four are no longer present at age nine. At earlier time points we found that the
program was effective in reducing the proportion of children within the clinical range of behavioral
problems, however, few effects were identified for continuous scores of children’s socio-emotional
skills (Doyle et al. 2016). These earlier measures were based on parent reports only. At age nine we
assessed children’s socio-emotional skills using both parent and child reports. The lack of treatment
effects across both measures, for either the continuous or clinical range, suggests a dissolution of the
PFL’s earlier impact on children’s wellbeing. Given the small effect sizes, these results are unlikely to
be driven by sample size issues. The fade-out of these effects may also reflect the smaller number of

23
significant impacts and lower effect sizes found for non-cognitive skills at earlier time points. These
results are in-line with the home visiting literature reported in Appendix Table 1c which finds
significant treatment effects in only three of the 10 follow-up studies conducted. The PFL treatment
effects observed at age four were driven by a small number of children exhibiting significant
behavioral problems, thus it is possible that exposure to the school environment, as well as natural
child maturation, has helped to reduce these behavioral issues. Indeed, the overall incidence of
clinically significant problems at age nine is low in the PFL cohort. For example, only 8 percent of
the high treatment group and 4 percent of the low treatment group are diagnosed with ASD or ADHD.
The higher rate in the high treatment group may reflect the parents’ ability to advocate for their
children in terms of receiving a diagnosis and/or that the children’s conditions were identified by the
PFL mentors during the program, and thus an early diagnosis was sought. The PFL children are now
spending a greater proportion of their day outside the home environment, thus it is possible that
specific supports targeting the school environment are required to bolster children’s development in
these areas.
The mediation analysis indicates that ~46 percent of the treatment effect on cognitive skills is
explained by improvements in parental investment. While 190 different measures of parental
investment were considered as potential mediators, only six were both impacted by the treatment and
had an impact on cognitive skills. These measures of investment largely relate to parental style (e.g.
engaging in less permissive and punitive parenting) and parental behaviors (e.g. the use of socket
covers during infancy and less smoking in the home). Thus the PFL model, which is based on
providing knowledge and active guidance on appropriate parenting techniques, appears to have been
effective, and the cumulative effect of these improvements in parental investment can help to explain
the identified effects at age nine. However, to further explore the mechanisms through which the
treatment effects emerge, mediation analysis where the treatment effects are decomposed into
components associated with parental investments and intervention-induced changes in early skills is
needed, as described in Heckman et al. (2013) and Heckman et al. (2017).
While the effect sizes for the cognitive and achievement tests are larger than those observed
in the more contemporary trials, they are in-line with some of the seminal studies that offered home
visiting and/or intervened during infancy. For example, our finding of an eight point gap in overall
cognitive skills at age nine is similar to the six point gap found in the Jamaica study at age 11/12
(Walker et al. 2000). In addition, the standardized effect sizes of 0.67 SD for cognitive skills, 0.33-
0.74 SD for reading scores, and 0.47-0.56 SD for maths scores are larger, or of a similar magnitude, to
the pooled effect sizes of 0.37 SD for cognition, 0.47 SD for reading, and 0.37 SD for maths found
across the age eight, 12, 15, and 21 year follow-ups of the Abecedarian study (Campbell et al. 2001).
A re-analysis of the Nurse Family Partnership program, which is the most comparable to PFL in terms
of its prenatal start and its focus on home visiting, by Heckman et al. (2017) identify treatment effects

24
on reading and math tests at age 12, but the effects are restricted to boys and the effect sizes (between
0.15-0.22 SD) are substantially lower than those observed for PFL.
These findings raise the question of why the PFL treatment effects are larger and more
persistent than many other studies in the field, particularly other home visiting programs. The design
of the PFL program differs in some fundamental ways to the studies mentioned above. In particular it
provides five years of multi-treatment supports starting during pregnancy. While some home visiting
program start in the prenatal period (e.g. Nurse Family Partnership), most start after the birth of the
child (e.g. Jamaica study). By intervening during pregnancy and the first few months of life, the
program capitalizes on heightened brain malleability, but perhaps just as importantly, it allows the
PFL mentors to build relationships with the treatment families during a unique period of the family’s
life when they may be more receptive to change. PFL is also longer in duration than most home
visiting programs. For example, both the Nurse Family Partnership program and the Jamaica study
intervene for two-two and a half years, while PFL continues until school entry. This is important for
two reasons. First, the longer program duration allows the mentors to continue to develop and deepen
their relationship with the families, which may result in families becoming more responsive to the
treatments provided. Second, building on the skill beget skill hypothesis, intervening from pregnancy
until school entry allows the mentors, and consequently the families, to respond appropriately to the
child’s growing skill set and provide treatment that is tailored to the child’s developmental needs. The
larger and persistent effects observed in the PFL trial may also be attributed to its multi-treatment
approach. Although some other programs provide multiple treatments e.g. Abecedarian and Early
Head Start offer both home visits and center-based care, PFL consistently focused on the parents –
teaching parents baby massage, delivering group-based parenting classes, and providing parent-
focused home visits. This focus on parents as the primary mechanism of change using different, yet
reinforcing, delivery methods may account for the persistence of effects up to age nine.
Although the results reported here increase our understanding of the potential medium-term
effects of early and sustained intervention in the ‘missing middle’ period, the limitations of the study
should be noted. In particular, similar to the seminal studies in the field, PFL is a single site
intervention that took place in one community at one point in time (2008-2015). Thus the findings
may not be generalizable to other settings or different populations, however the manualized nature of
the program allows for replication and testing in other settings, funding dependant. Another potential
issue is spillover effects. As the intervention took place in a small geographical area it is possible that
participants in the high and low treatment groups shared PFL material or parenting advice, which may
result in an under-estimation of the treatment effects (assuming the treatment is effective). However,
as tested and reported in earlier studies, a series of questions designed to measure cross talk and
information flows across the treatment groups found little evidence of contamination (Doyle et al.
2015; Doyle et al. 2017, Doyle 2020). Possibly the largest threat to the internal validity concerns
attrition. While the retention rate between the age five and age nine follow-ups only fell by about 5

25
percentage points for the high treatment group, the comparable figure for low treatment groups was
about 20 percentage points. Despite this, the groups remained balanced on almost all baseline
characteristics, for example, for the child data there are no differences on 109 of the 117 measures
considered, thus the types of participants who remained in the sample at age nine are largely
equivalent. However, there is some evidence that, across both groups, families with more risk factors
were more likely to drop out of the study. To ensure the age nine sample is representative of the
original randomized sample, IPW were used in all analysis and as described in the results section, the
findings from the IPW are largely similar to the non-IPW results.
To conclude, this study finds that the PFL program continues to have a significant impact on
important dimensions of children’s skills five years after the families finished the program, yet
continued investment may be needed to break long-standing inequalities in socio-emotional skills.
That said, the sizable cognitive advantages are likely to have positive impacts as the children progress
from primary to secondary school, as well as subsequent outcomes in adolescence. Thus it is critical
to continue to track the PFL cohort as they progress from primary to secondary school. This is
particularly important given the magnitude of the cognitive effects, especially in comparison to other
intervention programs, as PFL can provide a model for other communities aiming to reduce long-term
socio-economic inequalities in skills.

26
References
Achenbach, T.M., McConaughy, S.H., Ivanova, M.Y., & Rescorla, L.A. 2011. Manual for the
ASEBA Brief Problem Monitor (BPM). Burlington, VT: ASEBA, 1-33.
Almond, Douglas, and Janet Currie. 2011. “Killing Me Softly: The Fetal Origins Hypothesis.”
Journal of Economic Perspectives 25 (3): 153–72.
Almond, Douglas, Janet Currie, and Valentina Duque. 2018. “Childhood Circumstances and Adult
Outcomes: Act II”. Journal of Economic Literature 56(4): 1360-1446.
Andrew, Alison, Orazio Attanasio, Emla Fitzsimons, Sally Grantham‐McGregor, Costas
Meghir, and Marta Rubio‐Codina. 2018. “Impacts 2 Years after a Scalable Early Childhood
Development Intervention to Increase Psychosocial Stimulation in the Home: A Follow‐up of a
Cluster Randomised Controlled Trial in Colombia.” PLOS Medicine 15 (4): e1002556.
Attanasio, Orazio, Sarah Cattan, Emla Fitzsimons, Costas Meghir, and Marta Rubio-Codina.
2020. “Estimating the Production Function for Human Capital: Results from a Randomized
Control Trial in Colombia.” American Economic Review 110(1): 48-85.
Attanasio, Orazio, Camila Fernández, Emla Fitzsimons, Sally M. Grantham-McGregor, Costas
Meghir, and Marta Rubio-Codina. 2014. “Using the Infrastructure of a Conditional Cash
Transfer Programme to Deliver a Scalable Integrated Early Child Development Programme in
Colombia: A Cluster Randomised Controlled Trial.” British Medical Journal 349: g5785.
Bailey, Drew, Greg J. Duncan, Candice L. Odgers, and Winnie Yu. 2017. “Persistence and
Fadeout in the Impacts of Child and Adolescent Interventions”. Journal of Research on
Educational Effectiveness 10(1): 7–39.
Barry, Oumar, Cheikh Anta Diop, Ali Mory Maïdoka, and Patrick Premand. 2017. “Promoting
Positive Parenting practices in Niger Through a Cash Transfer Programme”. Early Childhood
Matters, Bernard Van Leer Foundation.
Becker, Gary S. 1965. “A Theory of the Allocation of Time.” The Economic Journal 75: 493-517.
Bennett, Cathy, Angela Underdown, and Jane Barlow. 2013. “Massage for Promoting Mental and
Physical Health in Typically Developing Infants Under the Age of Six Months. Cochrane
Database of Systematic Reviews Issue 4. Art. No.: CD005038.
Bierman, K.B., Heinrichs, B.S., Welsh, J.A., Nix, R.L., and Gest, S.G. 2016. “Enriching preschool
classrooms and home visits with evidence-based programming: Sustained benefits for low-
income children”. Journal of Child Psychology and Psychiatry 58, 129–137.
Blair, C., and Raver, C.C. 2012. “Child Development in the Context of Adversity: Experiential
Canalization of Brain and Behavior”. American Psychologist 67(4), 309-318.
Britto, Pia R., Angelica Ponguta, Chin Reyes, and Romilla Karnati. 2015. A Systematic Review of
Parenting Programmes for Young Children in Low- and Middle-Income Countries. New York,
NY: United Nations Children’s Fund.

27
Burger, Kaspar. 2010. “How does early childhood care and education affect cognitive development?
An international review of the effects of early interventions for children from different social
backgrounds”. Early Childhood Research Quarterly 25(2), 140–165.
Bus, A.G., and van Ijzendoorn, M.H. 1999. “Phonological Awareness and Early Reading: A meta-
analysis of Experimental Training Studies”. Journal of Educational Psychology 91(3): 403–
414.
Campbell, Frances A, and Craig T. Ramey. 1994. “Effects of Early Intervention on Intellectual and
Academic Achievement: A Follow-Up Study of Children from Low-Income Families”. Child
Development 65(2): 684-98.
Campbell, F.A., Pungello, E.P., Miller-Johnson, S., Burchinal, M., Ramey, C.T. 2001. “The
Development of Cognitive and Academic Abilities: Growth Curves from an Early Childhood
Educational Experiment”. Developmental Psychology 37(2): 231–242.
Campbell, Frances, Gabrielle Conti, James J. Heckman, Seong Hyeok Moon, Rodrigo Pinto,
Elizabeth Pungello, and Yi Pan. 2014. “Early Childhood Investments Substantially Boost
Adult Health”. Science 343, 1478-1485.
Cantor, Pamela, David Osher, Juliette Berg, Lily Steyer and Todd Rose. 2019. “Malleability,
Plasticity, and Individuality: How Children Learn and Develop in Context”. Applied
Developmental Science 23(4,) 307-337.
Cattell, Raymond B. 1966. “The Scree Test for the Number of Factors”. Multivariate Behavioral
Research 1 (2), 245–276.
Census. 2006. Retrieved from http://www.cso.ie/en/census/census2006reports/.
Chazan‐Cohen, R., Raikes, H. H., and Vogel, C. 2013. “Program Subgroups: Patterns of Impacts
for Home-based, Center-based, and mixed-approach programs”. Monographs of the Society for
Research in Child Development 78(1), 93-109.
Clements, D.H., Sarama, J., Wolfe, C.B., and Spitler, M.E. 2013. “Longitudinal Evaluation of a
Scale-up Model for Teaching Mathematics with Trajectories and Technologies: Persistence of
Effects in the Third Year”. American Educational Research Journal 50(4): 812–850.
Conger, R.D, Ge, X., Elder, G.H., Lorenz, F.O., and Simons, R.L. 1994. “Economic Stress,
Coercive Family Process, and Developmental Problems of Adolescents”. Child Development
65(2): 541-61.
Côté, Sylvana, Massimiliano Orri, Richard E. Tremblay, and Orla Doyle. 2018. “A Multi-
Component Early Intervention Program and Trajectories of Behavior, Cognition, and Health”.
Pediatrics 141(5): e20173174.
Cunha, Flávio, and James J. Heckman. 2007. “The Technology of Skill Formation.” American
Economic Review 97 (2): 31-47.
Cunha, Flávio, James J. Heckman, and Susanne M. Schennach. 2010. “Estimating the
Technology of Cognitive and Noncognitive Skill Formation.” Econometrica 78: 883–931.

28
Department of Education and Skills. 2016. Standardised Achievement Tests: An Analysis of the
Results at Primary School Level for 2011-12 and 2012-13. Dublin: Department of Education
and Skills.
Doyle, Orla. 2013. “Breaking the Cycle of Deprivation: An Experimental Evaluation of an Early
Childhood Intervention.” Journal of the Statistical and Social Inquiry Society of Ireland Vol.
XLI, 92-111.
Doyle, Orla. 2020. “The First 2000 Days and Children’s Skills”. Forthcoming Journal of Political
Economy.
Doyle, Orla, Liam Delaney, Christine O’Farrelly, Nick Fitzpatrick, and Michael Daly. 2017b.
“Can Early Intervention Policies Improve Well-being? Evidence from a randomized controlled
trial.” PLoS ONE 12 (1): e0169829.
Doyle, Orla, Nick Fitzpatrick, Caroline Rawdon, and Judy Lovett. 2015. “Early Intervention and
Child Health: Evidence from a Dublin-based Trial”. Economics and Human Biology 19: 224-
245.
Doyle, Orla, Colm Harmon, James J. Heckman, and Richard Tremblay. 2009. “Investing in
Early Human Development: Timing and Economic Efficiency”. Economics and Human
Biology 7 (1): 1-6.
Doyle, Orla, Colm Harmon, James J. Heckman, Caitriona Logue, and Seong Hyeok Moon.
2017a “Measuring Investment in Human Capital Formation: An Experimental Analysis of
Early Life Outcomes.” Labour Economics 45: 40-58.
Doyle, Orla, Louise McEntee, and Kelly A. McNamara. 2012. “Skills, Capabilities and Inequality
at School Entry in a Disadvantaged Community.” European Journal of the Psychology of
Education 27: 133-154.
Doyle, Orla, Edel McGlanaghy, Eylin Palamaro Munsell, and Fionnuala M. McAuliffe. 2014.
“Home Based Educational Intervention to Improve Perinatal Outcomes for a Disadvantaged
Community: A Randomised Control Trial”. European Journal of Obstetrics and Gynaecology
180: 162-167.
Doyle, Orla, Edel Mc Glanaghy, Christine O’Farrelly, and Richard Tremblay. 2016. “The
Impact of a Randomized Controlled Trial of a Community-based Home Visiting Program on
Children’s Early Socio-emotional Development”. PLOS One 11(6), e0156397.
Doyle, Orla, and PFL Evaluation Team. 2016. Final Report: Did Preparing for Life Improve
Children’s School Readiness. Report to Preparing for Life Programme. Atlantic Philanthropies
& Department of Children and Youth Affairs.
DuMont, K., Kirkland, K., Mitchell-Herzfeld, S., Ehrhard-Dietzel, S., Rodriguez, M. L., Lee, E.,
... and Greene, R. 2010. “A Randomized Trial of Healthy Families New York (HFNY): Does
Home Visiting Prevent Child Maltreatment”. Rensselaer, NY: New York State Office of

29
Children & Family Services and Albany, NY: The University of Albany, State University of New
York.
Duncan, Greg, Katherine Magnuson, Richard Murnane, and Elizabeth Votruba-Drzal. 2019.
“Income Inequality and the Well-Being of American Families”. Family Relations 68: 313-325.
Elliott, S.N., and Gresham, F.M. 2008. Social Skills Improvement System: Rating scales Manual.
Elliott, Colin D., Pauline Smith, and Kay McCulloch. 2011. British Ability Scales III. Windsor,
UK: NFER-Nelson.
Filene, Jill H., Jennifer W. Kaminski, Linda Anne Valle, and Patrice Cachat. 2013. “Components
Associated with Home Visiting Program Outcomes: A Meta-analysis. Pediatrics
132(Supplement): S100–S109.
Freedman, David, and David Lane. 1983. “A Nonstochastic Interpretation of Reported Significance
Levels.” Journal of Business Economics and Statistics 1 (4), 292–298.
Gertler, Paul, James Heckman, Rodrigo Pinto, Arianna Zanolini, Christel Vermeersch, Susan
Walker, Susan M. Chang, and Sally Grantham-McGregor. 2014. “Labor Market Returns to
an Early Childhood Stimulation Intervention in Jamaica.” Science 344 (6187): 998-1001.
Good, Phillip. 2005. Permutation, Parametric and Bootstrap Tests of Hypotheses (3rd
ed.), New
York: Springer.
Goodman, Robert. 1997. “The Strengths and Difficulties Questionnaire: A Research Note.” Journal
of Child Psychology and Psychiatry 38 (5): 581-586.
Grantham-McGregor, Sally and Joanne A. Smith. 2016. “Extending The Jamaican Early
Childhood Development Intervention.” Journal of Applied Research on Children: Informing
Policy for Children at Risk: 7 (2), Article 4.
Heckman, James. J., Margaret L. Holland, Kevin K. Makino, Rodrigo Pinto, and Maria
Rosales-Rueda, 2017. “An Analysis of the Memphis Nurse-Family Partnership Program.”
NBER Working Paper No. 23610.
Heckman, James J, Seong H. Moon, Rodrigo Pinto, Peter A. Savelyev, and Adam Yavitz. 2010.
“Analyzing Social Experiments as Implemented: A Reexamination of the Evidence from the
HighScope Perry Preschool Program.” Quantitative Economics 1 (2): 1-46.
Heckman, James J, and Stefano Mosso. 2014. “The Economics of Human Development and Social
Mobility.” Annual Review of Economics 6 (1): 689–733.
Heckman James J, Rodrigo Pinto, and Peter A. Savelyev. 2013. “Understanding the Mechanisms
Through Which an Influential Early Childhood Program Boosted Adult Outcomes.” American
Economic Review 103: 2052–86.
Hicks, Raymond and Dustin Tingley. 2011. “Causal Mediation Analysis”. Stata Journal 11 (4):
605-619.
Horn, John L. 1965. “A Rationale and Test for the Number of Factors in Factor Analysis”.
Psychometrika 30 (2): 179–185.

30
Imai, Kosuke, Luke Keele, and Dustin Tingley. 2010. “A General Approach to Causal Mediation
Analysis”. Psychological Methods 15 (4): 309–334.
Kaiser, Henry F. 1974. “An Index of Factorial Simplicity”. Psychometrika 39 (1): 31–36.
Kirkland, Kristen, and Susan Mitchell-Herzfeld. 2012. Evaluating the effectiveness of home
visiting services in promoting children’s adjustment in school: Final report to the Pew Center
on the States. Rensselaer, NY: New York State Office of Children and Family Services, Bureau
of Evaluation and Research.
Kitzman, H. J., Olds, D. L., Cole, R. E., Hanks, C. A., Anson, E. A., Arcoleo, K. J., ... and
Holmberg, J. R. 2010. “Enduring Effects of Prenatal and Infancy Home Visiting by Nurses on
Children: Follow-up of a Randomized Trial among Children at Age 12 years”. Archives of
Pediatrics & Adolescent Medicine 164(5): 412-418.
Knudsen, Eric I., James J. Heckman, Judy L. Cameron, and Jack P. Shonkoff. 2006. “Economic,
Neurobiological, and Behavioral Perspectives on Building America’s Future Workforce.”
Proceedings of the National Academy of Science USA 103 (27): 10155–10162
Lovett, J., Palamaro Munsell, E., McNamara, K., and Doyle O. 2016 “Friend, foe or facilitator?
The role of the parent-service provider relationship in the early implementation of a family-
based community intervention”. Community Psychology in Global Perspective 2(1): 52-72.
Ludbrook, John, and Hugh Dudley. 1998. “Why Permutation Tests are Superior to t and F Tests in
Biomedical Research.” American Statistician 52 (2): 127-132.
Lupien, S. J., King, S., Meaney, M. J., and McEwen, B. S. 2001. “Can Poverty get Under Your
Skin? Basal Cortisol Levels and Cognitive Function in Children from Low and High
Socioeconomic Status”. Development and Psychopathology13: 653–676.
Magnuson, Katharine A. and Greg J. Duncan. 2016. “Can Early Childhood Interventions Decrease
Inequality of Economic Opportunity?” RSF: The Russell Sage Foundation Journal of the Social
Sciences 2(2): 123–41.
Mani, A., Mullainathan, S., Shafir, E., and Zhao, J. 2013. “Poverty Impedes Cognitive Function.
Science 341: 976–980.
Masarik, April S. and Conger, Rand D. 2017. “Stress and Child Development: A Review of the
Family Stress Model”. Current Opinion in Psychology 13, 85-90
Mewhort, Douglas J.K. 2005. “A Comparison of the Randomization Test with the F test when Error
is Skewed.” Behavior Research Methods 37: 426–435.
Millar, D. 2018. School Attendance Data from Primary and Post-Primary Schools, 2016/17, Analysis
and Report to the Child and Family Agency. Dublin: Educational Research Centre.
Minkovitz, C. S., Strobino, D., Mistry, K. B., Scharfstein, D. O., Grason, H., Hou, W., ... Guyer,
B. 2007. “Healthy steps for young children: Sustained results at 5.5
years”. Pediatrics, 120(3), e658-e668.

31
O’Sullivan, Aifric, Nick Fitzpatrick, and Orla Doyle. 2017. “Effects of Dietary Recommendations
During Early Childhood on Cognitive Functioning: A Randomized Controlled Trial.” Public
Health Nutrition 20 (1): 154-164.
Olds, D. L., Holmberg, J. R., Donelan-McCall, N., Luckey, D. W., Knudtson, M. D., and
Robinson, J. 2014. “Effects of home visits by paraprofessionals and by nurses on children:
follow-up of a randomized trial at ages 6 and 9 years”. JAMA Pediatrics 168(2), 114-121.
Peacock, Shelley, Stephanie Konrad, Erin Watson, Darren Nickel, and Nazeem Muhajarine.
2013. “Effectiveness of Home Visiting Programs on Child Outcomes: A Systematic Review.”
BMC Public Health 13 (1): 17.
Puma, M., Bell, S., Cook, R., Heid, C., Broene, P., Jenkins, F., Downer, J. 2012. “Third grade
follow-up to the Head Start Impact Study: Final report”. OPRE Report No. 2012–45.
Robins, James M., Andrea Rotnitzky, and Lue P. Zhao. 1994. “Estimation of Regression
Coefficients when Some Regressors are Not Always Observed.” Journal of the American
Statistical Association 89 (427): 846-866.
Romano, Joseph P., and Michael Wolf. 2005. “Exact and Approximate Stepdown Methods for
Multiple Hypothesis Testing.” Journal of the American Statistical Association 100 (469): 94-
108.
Sanders, Matthew R. 2012. “Development, Evaluation, and Multinational Dissemination of the
Triple P-Positive Parenting Program.” Annual Review of Clinical Psychology 8(1): 345–379.
Sanders, Matthews R., James N. Kirby, Cassandra L Tellegen, and Jamin J. Day. 2014. “The
Triple P-Positive Parenting Program: A Systematic Review and Meta-analysis of a Multi-level
System of Parenting Support.” Clinical Psychology Review 34: 337-357.
Sanders, Matthews R., Carol Markie-Dadds, and Karen Turner. 2003. “Theoretical, Scientific
and Clinical Foundations of the Triple P-Positive Parenting Program: A Population Approach
to the Promotion of Parenting Competence.” Parenting Research and Practice Monograph 1:
1-21.
Schwarz, Gideon. 1978. “Estimating the Dimension of a Model.” Annals of Statistics 6: 461-464.
Schweinhart, Larry J. 2013. “Long-term Follow-up of a Preschool Experiment. Journal of
Experimental Criminology”. 9(4): 389-409.
Schweinhart, LJ., Montie, J., Xiang, Z., Barnett, WS., Belfield, CR., Nores, M. 2005. “Lifetime
Effects: The High/Scope Perry Preschool Study Through Age 40”. Ypsilanti: MI: High/Scope
Press.
Shonkoff, Jack P.2010. “Building a New Biodevelopmental Framework to Guide the Future of Early
Childhood Policy”. Child Development 81(1): 357–67.
Sidora-Arcoleo, K., Anson, E., Lorber, M., Cole, R., Olds, D., and Kitzman, H. 2010.
“Differential Effects of a Nurse Home-visiting Intervention on Physically Aggressive Behavior
in Children”. Journal of Pediatric Nursing 25(1): 35-45.

32
Sitnick, S. L., Shaw, D. S., Gill, A., Dishion, T., Winter, C., Waller, R., ... and Wilson, M. 2015.
“Parenting and the Family Check-Up: Changes in Observed Parent-Child Interaction Following
Early Childhood Intervention”. Journal of Clinical Child & Adolescent Psychology 44(6): 970-
984.
Smith, J., Dishion, T., Shaw, D., and Wilson M. 2014. “Coercive Family Process and Early-Onset
Conduct Problems from Age 2 to School Entry.” Development and Psychopathology 26: 917-
932.
Smith, T.M., Cobb, P., Farran, D.C., Cordray, D.S., and Munter, C. 2013. “Evaluating Math
Recovery: Assessing the Causal Impact of a Diagnostic Tutoring Program on Student
Achievement”. American Educational Research Journal 50(2): 1–32.
Sweet, Monica A., and Mark I. Appelbaum. 2004. “Is Home Visiting an Effective Strategy? A
Meta-Analytic Review of Home Visiting Programs for Families with Young Children.” Child
Development 75: 1435-1456.
Thompson, Ross A., and Charles A. Nelson. 2001. “Developmental Science and The Media: Early
Brain Development.” American Psychologist 56 (1): 5–15.
Waldfogel, Jane, and Elizabeth Washbrook. 2011. “Early Years Policy.” Child Development
Research 1–12.
Walker, S.P., Grantham-McGregor, S.M., Powell, C.A., and Chang, S.M. 2000. “Effects of
growth restriction in early childhood on growth, IQ, and cognition at age 11 to 12 years and the
benefits of nutritional supplementation and psychosocial stimulation”. Journal of Pediatrics
137(1), 36-41.

33
Figure 1 Participant flow
High Treatment N=115
Baseline N=104
36-months N=74
12-months N=82
18-months N=80
24-months N=81
48-months N=74
60 months N=75
51-months N=71
Age 9
Parent data N=64
Child data N=69
School data N=70
6-months N=83
Low Treatment N=118
Baseline N=101
24-months N=84
12-months N=83
18-months N=74
48-months N=73
36-months N=76
51 months N=63
60 months N=74
Age 9
Parent data N=47
Child data N=48
School data N=53
6-months N=90
Randomised 233

34
Figure 2 Distribution of BAS GCA cognitive scores at age 9
0
0.05
0.1
0.15
0.2
0.25
0.3
0.35
40 60 80 100 120 140
GCA Score
Low Treatment
High Treatment
Per
cen
tag
e o
f ch
ild
ren

35
Table 1 Baseline comparison of high and low treatment groups: Child, School, and Parent samples
Child Sample School Sample Parent Sample
MHIGH
(SD)
MLOW
(SD)
p1 MHIGH
(SD)
MLOW
(SD)
p1 MHIGH
(SD)
MLOW
(SD)
p1
Age 26.50 (5.59)
25.07 (5.82)
0.197 26.23 (5.67)
25.90 (6.10)
0.763 26.66 (5.69)
26.20 (6.12)
0.694
Married 0.147 (0.36)
0.133 (0.34)
0.890 0.145 (0.36)
0.180 (0.39)
0.515 0.156 (0.37)
0.178 (0.39)
0.782
No. of children 1.97 (1.27)
1.96 (1.07)
0.940 1.91 (1.25)
2.04 (1.07)
0.531 1.98 (1.30)
2.09 (1.10)
0.638
First time mother 0.500 (0.50)
0.422 (0.50)
0.415 0.522 (0.50)
0.380 (0.49)
0.127 0.516 (0.50)
0.378 (0.49)
0.154
Low education (left ≤ age 16) 0.294 (0.46)
0.311 (0.47)
0.920 0.304 (0.46)
0.320 (0.47)
0.875 0.328 (0.47)
0.311 (0.47)
0.851
Weschler Abbreviated Scale of
Intelligence (WASI)
84.66 (11.35)
81.91 (14.03)
0.275 84.46 (11.38)
82.12 (13.68)
0.328 84.54 (11.55)
83.22 (13.54)
0.600
Employed 0.485 (0.50)
0.444 (0.50)
0.658 0.493 (0.50)
0.440 (0.50)
0.525 0.516 (0.50)
0.467 (0.51)
0.576
Resides in social housing 0.529 (0.50)
0.533 (0.51)
0.877 0.522 (0.50)
0.560 (0.50)
0.666 0.531 (0.50)
0.556 (0.50)
0.777
Medical card 0.574 (0.50)
0.667 (0.48)
0.289 0.565 (0.50)
0.660 (0.48)
0.310 0.547 (0.50)
0.622 (0.49)
0.445
Prior physical health condition 0.794 (0.41)
0.644 (0.48)
0.116 0.783 (0.41)
0.640 (0.49)
0.078 0.781 (0.42)
0.644 (0.48)
0.129
Prior mental health condition 0.309 (0.47)
0.267 (0.45)
0.642 0.290 (0.46)
0.280 (0.45)
0.949 0.281 (0.45)
0.311 (0.47)
0.747
Smoking during pregnancy 0.459 (0.50)
0.422 (0.50)
0.768 0.464 (0.50)
0.440 (0.50)
0.782 0.453 (0.50)
0.467 (0.51)
0.912
Drinking alcohol during pregnancy 0.309 (0.47)
0.311 (0.47)
0.946 0.319 (0.47)
0.300 (0.46)
0.844 0.297 (0.46)
0.333 (0.48)
0.692
N ~113 ~119 ~109
Notes: All baseline measures were assessed during pregnancy prior to treatment delivery except for WASI which was assessed at 3 months postpartum. Baseline data are missing for
four participants in the age 9 assessment. 1 two-tailed p-values calculated from permutation tests with 100,000 replications.

36
Table 2 Comparison of high and low treatment groups: School data
MHIGH
(SD)
MLOW
(SD)
p1
School has DEIS status 0.73 (0.45)
0.68 (0.47)
0.558
Single gender school 0.27 (0.45)
0.21 (0.41)
0.408
School outside PFL catchment area 0.46 (0.50)
0.45 (0.50)
0.976
Driving distance from school to PFL village centre
(in kms)
5.51 (14.98)
3.97 (7.25)
0.543
School conducts Micra/Sigma tests 0.67 (0.48)
0.60 (0.50)
0.432
N 70 53
Notes: 1 two-tailed p-values calculated from permutation tests with 100,000 replications.

37
Table 3 Baseline characteristics predicting attrition from the Age 9 Parent sample
High Treatment Group Low Treatment Group
MSTAYER
(SD)
MNON-STAYER
(SD)
p1 MSTAYER
(SD)
MNON-
STAYER
(SD)
p1
Age 26.66 (5.69)
23.55 (5.66)
0.006 26.20 (6.12)
24.57 (5.74)
0.179
Married 0.156 (0.37)
0.125 (0.34)
0.679 0.178 (0.39)
0.179 (0.39)
0.897
First time mother 0.516 (0.50)
0.575 (0.50)
0.627 0.378 (0.49)
0.589 (0.50)
0.037
No. of children 1.98 (1.30)
1.88 (1.30)
0.692 2.09 (1.10)
1.77 (1.18)
0.164
Low education (left ≤ age 16) 0.328 (0.47)
0.350 (0.48)
0.712 0.311 (0.47)
0.464 (0.50)
0.124
Weschler Abbreviated Scale of
Intelligence (WASI)
84.47 (11.32)
78.20 (13.00)
0.013 83.22 (13.54)
79.05 (12.13)
0.114
Employed 0.516 (0.50)
0.125 (0.34)
0.000 0.467 (0.51)
0.339 (0.48)
0.183
Resides in social housing 0.531 (0.50)
0.590 (0.50)
0.569 0.556 (0.50)
0.554 (0.50)
0.845
Medical card 0.547 (0.50)
0.675 (0.47)
0.182 0.622 (0.49)
0.696 (0.46)
0.444
Prior physical health condition 0.781 (0.42)
0.700 (0.46)
0.416 0.644 (0.48)
0.607 (0.49)
0.784
Prior mental health condition 0.281 (0.45)
0.275 (0.452)
0.978 0.311 (0.47)
0.179 (0.39)
0.133
Smoking during pregnancy 0.453 (0.50)
0.600 (0.50)
0.122 0.467 (0.51)
0.482 (0.50)
0.929
Drinking alcohol during
pregnancy
0.297 (0.46)
0.175 (0.39)
0.167 0.333 (0.48)
0.214 (0.41)
0.226
N 64 40 45 56
Notes: All baseline measures were assessed during pregnancy prior to treatment delivery except for WASI which
was assessed at 3 months postpartum. Baseline data are missing for four participants in the age 9 assessment. 1
two-tailed p-values calculated from permutation tests with 100,000 replications.

38
Table 4 Comparison of high and low treatment groups: Cognitive outcomes
N
(HIGH/LOW)
MHIGH
(SD)
MLOW
(SD)
p1 p
2 ES
BAS Composite Scores
General Conceptual Ability 116 (69/47)
88.12 (11.85)
80.13 (12.11)
0.002 0.006 0.67
Spatial Ability 117 (69/48)
94.09 (14.26)
86.75 (16.27)
0.032 0.045 0.48
Non-Verbal Ability 117 (69/48)
84.63 (11.67)
76.53 (9.70)
0.000 0.001 0.76
Verbal Ability 116 (69/47)
92.22 (11.70)
87.27 (13.67)
0.043 0.043 0.39
BAS Above the Norm %
General Conceptual Ability 116 (69/47)
0.02 (0.14)
0.00 (0.00)
0.038 0.239 0.29
Spatial Ability 117 (69/48)
0.11 (0.31)
0.10 (0.31)
0.406 0.679 0.01
Non-Verbal Ability 117 (69/48)
0.03 (0.17)
0.00 (0.00)
0.023 0.156 0.36
Verbal Ability 116 (69/47)
0.05 (0.22)
0.07 (0.26)
0.659 0.659 0.08
BAS Below the Norm %
General Conceptual Ability 116 (69/47)
0.58 (0.50)
0.78 (0.42)
0.029 0.029 0.42
Spatial Ability 117 (69/48)
0.34 (0.48)
0.66 (0.48)
0.007 0.018 0.67
Non-Verbal Ability 117 (69/48)
0.70 (0.46)
0.89 (0.31)
0.009 0.017 0.51
Verbal Ability 116 (69/47)
0.33 (0.47)
0.60 (0.49)
0.027 0.036 0.58
Notes: N’ indicates the sample size. ‘M’ indicates the IPW-adjusted mean. ‘SD’ indicates the IPW-adjusted standard
deviation. 1 one-tailed (right-sided) conditional p-value from individual IPW-adjusted permutation test with 100,000
replications. 2 one-tailed (right-sided) conditional p-value from IPW-adjusted stepdown permutation test with 100,000
replications. ‘Effect size’ is the ratio of the treatment effect to the pooled standard deviation.

39
Table 5 Comparison of high and low treatment groups: School outcomes
N
(HIGH/LOW)
MHIGH
(SD)
MLOW
(SD)
p1 p
2 ES
Academic Standardised Scores
2nd
class reading standardised score 118 (66/52)
99.55 (15.10)
94.93 (12.63)
0.038 0.038 0.33
2nd
class maths standardised score 117 (66/51)
97.42 (14.62)
89.73 (12.89)
0.007 0.015 0.56
3rd
class reading standardised score 70 (41/29)
97.51 (11.97)
89.67 (9.30)
0.002 0.013 0.74
3rd
class maths standardised score 70 (41/29)
94.42 (14.05)
88.05 (12.96)
0.060 0.080 0.47
Academic Above the Norm Cutoff
Scores %
2nd
class above average reading score 118 (66/52)
0.26 (0.44)
0.19 (0.39)
0.180 0.180 0.19
2nd
class above average maths score 117 (66/51)
0.22 (0.42)
0.05 (0.21)
0.002 0.010 0.55
3rd
class above average reading score 70 (41/29)
0.26 (0.44)
0.05 (0.22)
0.006 0.020 0.64
3rd
class above average maths score 70 (41/29)
0.14 (0.36)
0.05 (0.22)
0.064 0.164 0.34
Academic Below the Norm Cutoff
Scores %
2nd
class below average reading score 118 (66/52)
0.31 (0.47)
0.47 (0.50)
0.043 0.043 0.34
2nd
class below average maths score 117 (66/51)
0.34 (0.48)
0.55 (0.50)
0.041 0.087 0.43
3rd
class below average reading score 70 (41/29)
0.34 (0.48)
0.62 (0.49)
0.024 0.098 0.57
3rd
class below average maths score 70 (41/29)
0.45 (0.50)
0.72 (0.46)
0.042 0.059 0.55
Absenteeism & School Resources %
Proportion of days present in previous
school year
104 (59/45)
0.92 (0.05)
0.93 (0.06)
0.762 0.762 0.20
Proportion of days present in current
school year
122 (70/52)
0.94 (0.04)
0.94 (0.06)
0.561 0.763 0.00
In class supports 123 (70/53)
0.40 (0.49)
0.54 (0.50)
0.126 0.325 0.27
Out of class supports 123 (70/53)
0.24 (0.43)
0.38 (0.49)
0.092 0.307 0.31
SNA supports 123 (70/53)
0.06 (0.25)
0.05 (0.21)
0.499 0.798 0.08
Other supports 123 (70/53)
0.11 (0.31)
0.14 (0.35)
0.198 0.606 0.10
Notes: N’ indicates the sample size. ‘M’ indicates the IPW-adjusted mean. ‘SD’ indicates the IPW-adjusted standard
deviation. 1 one-tailed (right-sided) conditional p-value from individual IPW-adjusted permutation test with 100,000
replications. 2 one-tailed (right-sided) conditional p-value from IPW-adjusted stepdown permutation test with 100,000
replications. ‘Effect size’ is the ratio of the treatment effect to the pooled standard deviation.
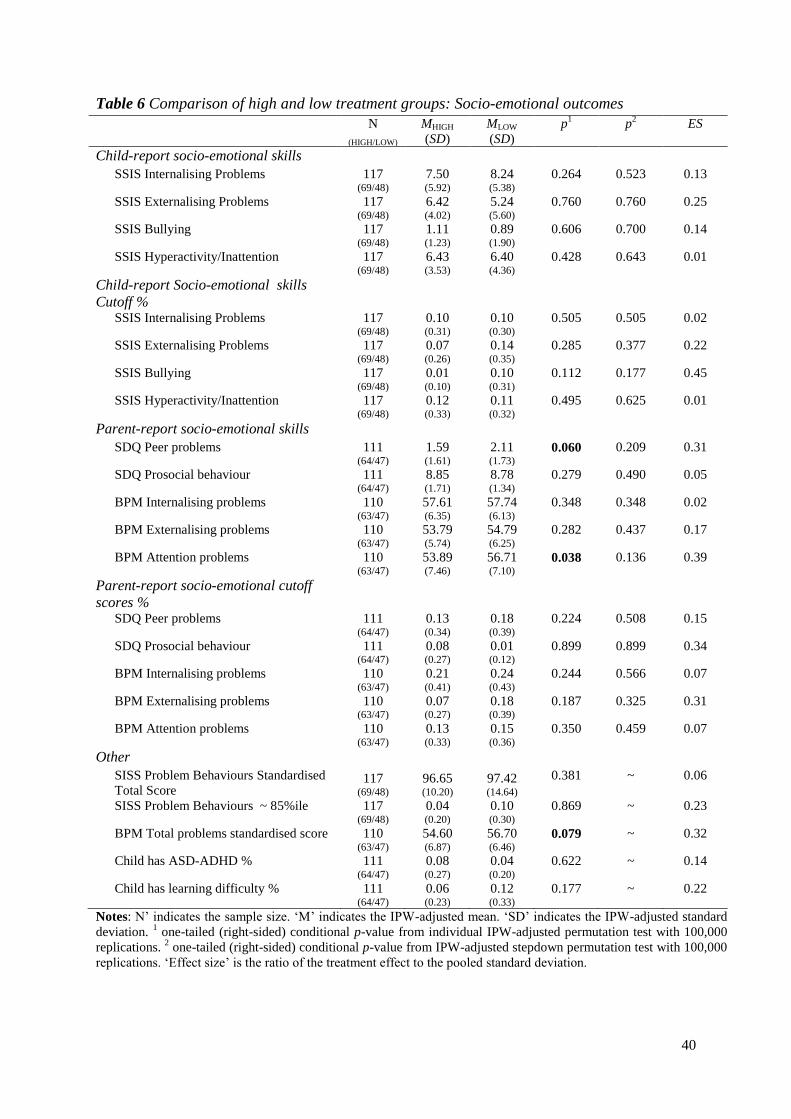
40
Table 6 Comparison of high and low treatment groups: Socio-emotional outcomes
N
(HIGH/LOW)
MHIGH
(SD)
MLOW
(SD)
p1 p
2 ES
Child-report socio-emotional skills
SSIS Internalising Problems 117 (69/48)
7.50 (5.92)
8.24 (5.38)
0.264 0.523 0.13
SSIS Externalising Problems 117 (69/48)
6.42 (4.02)
5.24 (5.60)
0.760 0.760 0.25
SSIS Bullying 117 (69/48)
1.11 (1.23)
0.89 (1.90)
0.606 0.700 0.14
SSIS Hyperactivity/Inattention 117 (69/48)
6.43 (3.53)
6.40 (4.36)
0.428 0.643 0.01
Child-report Socio-emotional skills
Cutoff %
SSIS Internalising Problems 117 (69/48)
0.10 (0.31)
0.10 (0.30)
0.505 0.505 0.02
SSIS Externalising Problems 117 (69/48)
0.07 (0.26)
0.14 (0.35)
0.285 0.377 0.22
SSIS Bullying 117 (69/48)
0.01 (0.10)
0.10 (0.31)
0.112 0.177 0.45
SSIS Hyperactivity/Inattention 117 (69/48)
0.12 (0.33)
0.11 (0.32)
0.495 0.625 0.01
Parent-report socio-emotional skills
SDQ Peer problems 111 (64/47)
1.59 (1.61)
2.11 (1.73)
0.060 0.209 0.31
SDQ Prosocial behaviour 111 (64/47)
8.85 (1.71)
8.78 (1.34)
0.279 0.490 0.05
BPM Internalising problems 110 (63/47)
57.61 (6.35)
57.74 (6.13)
0.348 0.348 0.02
BPM Externalising problems 110 (63/47)
53.79 (5.74)
54.79 (6.25)
0.282 0.437 0.17
BPM Attention problems 110 (63/47)
53.89 (7.46)
56.71 (7.10)
0.038 0.136 0.39
Parent-report socio-emotional cutoff
scores %
SDQ Peer problems 111 (64/47)
0.13 (0.34)
0.18 (0.39)
0.224 0.508 0.15
SDQ Prosocial behaviour 111 (64/47)
0.08 (0.27)
0.01 (0.12)
0.899 0.899 0.34
BPM Internalising problems 110 (63/47)
0.21 (0.41)
0.24 (0.43)
0.244 0.566 0.07
BPM Externalising problems 110 (63/47)
0.07 (0.27)
0.18 (0.39)
0.187 0.325 0.31
BPM Attention problems 110 (63/47)
0.13 (0.33)
0.15 (0.36)
0.350 0.459 0.07
Other
SISS Problem Behaviours Standardised
Total Score 117
(69/48)
96.65 (10.20)
97.42 (14.64)
0.381 ~ 0.06
SISS Problem Behaviours ~ 85%ile 117 (69/48)
0.04 (0.20)
0.10 (0.30)
0.869 ~ 0.23
BPM Total problems standardised score 110 (63/47)
54.60 (6.87)
56.70 (6.46)
0.079 ~ 0.32
Child has ASD-ADHD % 111 (64/47)
0.08 (0.27)
0.04 (0.20)
0.622 ~ 0.14
Child has learning difficulty % 111 (64/47)
0.06 (0.23)
0.12 (0.33)
0.177 ~ 0.22
Notes: N’ indicates the sample size. ‘M’ indicates the IPW-adjusted mean. ‘SD’ indicates the IPW-adjusted standard
deviation. 1 one-tailed (right-sided) conditional p-value from individual IPW-adjusted permutation test with 100,000
replications. 2 one-tailed (right-sided) conditional p-value from IPW-adjusted stepdown permutation test with 100,000
replications. ‘Effect size’ is the ratio of the treatment effect to the pooled standard deviation.

41
Table 7 Cognitive skills results – Mediation analysis
Parental Investment GCA Score GCA Score
Treatment 1.113***
(0.275)
9.642***
(3.111)
5.201*
(2.950)
Parental investment ~ ~ 3.990***
(1.199)
ACME 4.44 [1.48, 8.51]
Direct effect 5.33 [-.01, 10.90]
Total effect 9.77 [4.17, 15.67]
% of total effect mediated 45.6%
Note: N=95. All models include child gender and are adjusted for attrition using IPW weights. Rounded
brackets show robust standard errors. Square brackets show 95 percent confidence intervals. ***p <0.01, **p <
0.05, *p < 0.10.

42
Appendix A
Table 1a Evaluations of Cognitive Outcomes for Home Visiting Programs from Ages 5-12
Outcome Author Sample
Size
Programme Measures Significant
Finding
Effect Age
(years)
% of original
sample retained
Cognitive tests Bierman et
al. (2017)
556
children
Early Head
Start Home
Based
Option +
REDI-P
Woodcock Johnson tests of
Achievement (Letter-Word
Identification Scale), School
Readiness Questionnaire, Learning
Behaviours Scale
Woodcock
Johnson tests of
Achievement
Favorable 7-9 87%
Chazan-
Cohen,
Raikes and
Vogel
(2013)
927
families
Early Head
Start Home
Based
Option
English receptive vocabulary,
Woodcock-Johnson revised test,
Leiter R sustained attention test,
speech problems survey
None None 5 Original N not
reported. Retention
between ages 2-5:
96% parent
interviews,
92% child
assessments
Kitzman et
al. (2010)
635
children
Nurse
Family
Partnership
Leiter-R sustained attention test None None 12 80% parent
interviews,
76% child
interviews,
85% school records
Olds et al.
(2014)
411
children
Nurse
Family
Partnership
Conners continuous performance
test (attention dysfunction)
None None 6-9 81% at age 6
78% at age 9

43
Table 1b Evaluations of Achievement Test Outcomes for Home Visiting Programs from Ages 5-12
Outcome Author Sample
Size
Programme Measures Significant
Finding
Effect Age
(years)
% of original
sample retained
Achievement tests Bierman et
al. (2017)
556
children
Early Head
Start Home
Based
Option +
REDI-P
Test of Word Rereading
Efficiency, Academic Competence
Evaluation Scales (ACES;
reading/language skills,
mathematics), Academic
Performance Rating Scale
ACES
(reading/language
skills)
Favorable 7-9 87%
DuMont et
al. (2010)
897
mothers
Healthy
Families
America
Partaking in a gifted program,
receiving remedial services,
receiving special education,
repeating a grade
Participating in a
gifted programme,
receiving special
education
Favorable 7 80% of baseline
sample
Kirkland and
Mitchell-
Herzfield
(2012)
577
mother
and child
pairs
Healthy
Families
America
Doing poorly academically (below
grade level in reading, math or
positive behaviors that promote
learning), excelling academically
(reading and math, behaviors that
promote learning), retained in 1st
grade
Excelling
academically with
all 3 behaviors
that promote
learning, retained
in 1st grade
Favorable 6-7 49% academic
reports,
68% child
interviews,
80% parent surveys
Kitzman et
al. (2010)
635
children
Nurse
Family
Partnership
Placement in special education,
ever retained in a grade, GPA,
Group achievement test scores,
Peabody Individual Achievement
Tests
None None 12 80% parent
interviews,
76% child
interviews,
85% school records
Sidora-
Arcoleo et
al. (2010)
721
mother
and child
dyads
Nurse
Family
Partnership
Peabody Picture Vocabulary Test-
Revised
None None 6-12
years
Not reported
44
Table 1c Evaluations of Socio-emotional Outcomes for Home Visiting Programs from Ages 5-12
Outcome Author Sample
Size
Programme Measures Significant
Finding
Effect Age
(years)
% of original
sample retained
Socio-emotional
development
Bierman et
al. (2017)
556
children
Early Head
Start Home
Based
Option +
REDI-P
Social Competence Scale, Student
Teacher Relationship Scale, Child
Behavior Scale (excluded by
peers), Perceived Competence
Scale for Children, Loneliness
Scale, Friendship Questionnaire
Perceived
Competence Scale
for Children,
Child Behaviour
Scale
Favorable 7-9 87%
Chazan-
Cohen,
Raikes and
Vogel
(2013)
927
families
Early Head
Start Home
Based
Option
Child Behavior Checklist (CBCL),
Family and Child Experiences
Survey (FACES), negativity
towards parents during play
FACES (positive
approaches to
learning), FACES
(social behavior
problems)
Favorable 5 Original N not
reported. Retention
between ages 2-5:
96% parent
interviews
92% child
assessments
Dumont et
al. (2010)
897
mothers
Healthy
Families
America
CBCL (attention problems, rule
breaking and aggressive
behaviours, social problems, and
the anxious-depressed and
withdrawn-depressed syndrome)
None None 7 80% of baseline
sample
Kitzman et
al. (2010)
635
children
Nurse
Family
Partnership
Child conduct None None 12 80% parent
interviews,
76% child
interviews,
85% school records
Kitzman et
al., (2010)
594
mothers,
578
children
Nurse
Family
Partnership
Ever arrested, externalizing
disorders and internalizing
disorders, total problems
Internalizing
disorders
Favorable 12 80% parent
interviews,
76% child
interviews,
85% school records
Minkowitz
et al. (2007)
1308
children
Healthy
Steps
CBCL (internalizing, externalizing,
total problems)
None None 5.5 57%
Olds et al.
(2014)
411
children
Nurse
Family
Partnership
CBCL (internalizing, externalizing,
total problems)
None None 6-9 81% at age 6,
78% at age 9

45
Sidora-
Arcoleo et
al. (2010)
721
mother
and child
dyads
Nurse
Family
Partnership
CBCL (physical aggression items) None None 6-12 Not reported
Sitnick et al.
(2015)
614
families
Family
Check Up
for Children
CBCL (oppositional-aggressive
items)
None None 5 85%
Smith et al.
(2014)
612
children
Family
Check Up
for Children
CBCL (oppositional-aggressive
items), oppositional behavior in the
classroom
None None 7-8 62%

46
Appendix B Measure Description
Cognitive skills
Children’s cognitive ability was assessed using the School Age British Ability Scales III
(Elliot and Smith 2011). The BAS III School Age battery was designed as an assessment of
children’s abilities in clinical, educational, and research settings for children and students
aged from 5 years 0 months to 17 years 11 months. The BAS III consists of six subscales:
word definitions, verbal similarities, matrices, quantitative reasoning, recognition of designs,
and pattern construction. These sub-scales yield an overall score reflecting general cognitive
ability (General Conceptual Ability, GCA), as well as three cluster scores for Verbal Ability,
Non-Verbal Ability, and Spatial Ability. The GCA score assesses overall cognitive ability
such as thinking logically, making decisions, and learning. The Spatial Ability score assesses
problem solving, spatial visualisation, and short-term visual memory. The Nonverbal
Reasoning score assesses inductive reasoning. The Verbal ability score assesses children’s
verbal reasoning, verbal knowledge, and expressive language. Age-based T scores are
calculated for each domain that are standardised to have a mean of 100 and a standard
deviation of 15, as well as cutoff scores indicating whether the child scores above or below
average for the GCA and cluster scores.
Socio-emotional skills
The Social Skills Improvement System Rating Scales (SSIS-RS; Elliot and Gresham 2008) is
a child report measure (α = 0.87) that assesses children’s social skills and problem behaviour
with two subscales by those names. The current study used the behaviour problems subscale,
which consists of 29-items measuring: externalising (x items; α = 0.79), internalising (x
items; α = 0.84), bullying (x items; α = 0.44), and hyperactivity/inattention (x items; α =
0.70) for children aged 3 to 18 years. Children indicated how true a statement about each
social skill and problem behaviour was for them using a 4-point scale of not true, a little true,
a lot true, and very true. These were scored as 0, 1, 2, 3 respectively. The relevant items were
summed to create subscale scores. A total score was also computed and converted to a
standard score using the scale norms for age and gender. Cutoff scores were also created for
each of the subscales and the standardised total score to indicate whether or not the child
scored above average for each score.
Achievement Test Scores
All primary schools in Ireland are required to administer standardised achievement tests in
English reading and Mathematics at the end of second class when children are approximately
7/8 years of age, some school also continue to administer standardised achievement tests at
the end of each school class. There are two published sets of standardised achievement tests
normed for the Irish population that primary schools can use: Drumcondra Tests for Reading
and Mathematics, produced by the Educational Research Centre or the Micra-T for English
Reading and Sigma-T for Mathematics produced by Folens. These norm-referenced tests
provide a standard score (mean = 100, SD = 15), with higher scores indicative of better
performance. Standard scores are also converted to STen scores ranging from 1 to 10
indicating the child’s approximate position with respect to the reference population. Standard
and STen scores for participating children were obtained from the child’s school. Scores for
2nd
and 3rd
class, where available (equivalent to US 2nd
and 3rd
grade and UK Year 3 and 4)
were used in this report. STen scores were converted to indicators of above and below
average performance based on National Council for Curriculum and Assessment (NCCA)
STen score descriptors.
47
Absenteeism and School Resources
Information on daily school attendance was gathered from participating children’s schools in
the form of days attended and days absent for the previous school year (2017/2018) and up to
the point of data collection for the year of data collection (2018/2019). This information was
used to calculate the proportion of days attended in the school year for the current and
previous school year.
Children with special education needs in Primary Schools in Ireland receive educational
support to assist their integration into ordinary mainstream schools or to support their
education in specialised schools. These supports normally take the form of in/out of class
resource/learning support, or Special Needs Assistant depending on the child’s assessed level
of need. Schools were asked to indicate, yes or no, whether each child received education
supports in school in the form of in-class support, out of class support, Special Needs
Assistant, or other educational supports.
Parent-reported Instruments
Socio-emotional Skills
The Brief Problems Monitor (BPM; Achenbach, McConaughy, Ivanovaa, and Rescorla 2011)
is a parent report measure for children aged 6-18 years to monitor children’s functioning and
responses to interventions. The BPM is based on items from the Child Behaviour Checklist
(CBCL), Teachers Report Form (TRF) and Youth Self Report (YSR). The measure consists
of 19 items with the response options not true, somewhat true, or very true. These were
scored as zero, 1 and 2 respectively. The measure yields scores across three subscales:
internalising (6 items; α = 0.76), attention (6 items; α = 0.89) and externalising (7 items; α =
0.80) problems. The scores for each of the three problems subscales were summed to create a
Total Problems score. Scores were then converted to standard scores based on the child’s age
and gender, and binary indicators of concerning problem behaviour were created based on
standard scores exceeding 60.
The Strengths and Difficulties Questionnaire (SDQ; Goodman 1997) is a 25-item
questionnaire assessing behaviours, emotions, and relationships of 4- to 16-year-olds. The
questionnaire covers five dimensions: conduct problems, emotional symptoms, hyperactivity,
peer problems, and pro-social behaviour. The 5-item Peer Problems (α = 0.62) and 5-item
Pro-Social (α = 0.72) subscales were used in this report. Items were scored 0 for not true, 1
for somewhat true, and 2 for certainly true. Two items from the Peer Problems subscale were
reverse scored. The five items for each subscale were summed giving a total score of 0 to 10
for each subscale (α = 0.90). Cutoff scores were also created to indicate scores that were of
clinical concern.
Binary indicators for whether or not the child has a diagnosis of Autism Spectrum
Disorder/Attention Deficit Hyperactivity Disorder (ASD-ADHD) or whether or not the child
has a diagnosed learning difficulty were created from parents responses to a question asking
them if their child has a developmental delay/disorder or any diagnosed learning or physical
disability, and if so to list the diagnosis.

48
Appendix C Robustness Tests
Table C1 Comparison of high and low treatment groups: School outcomes conditional on
DEIS status and type of test
N
(HIGH/LOW)
MHIGH
(SD)
MLOW
(SD)
p1 p
2 ES
Academic Standardised Scores
2nd
class reading standardised score 118 (66/52)
99.55 (15.10)
94.93 (12.63)
0.044 0.044 0.33
3rd
class reading standardised score 69 (40/29)
97.51 (12.09)
89.67 (9.30)
0.001 0.011 0.73
2nd
class maths standardised score 117 (66/51)
97.42 (14.62)
89.73 (12.89)
0.003 0.011 0.56
3rd
class maths standardised score 69 (40/29)
94.47 (14.19)
88.05 (12.96)
0.058 0.081 0.47
Academic Above the Norm Cutoff
Scores
2nd
class above average reading score % 118 (66/52)
0.26 (0.44)
0.19 (0.39)
0.127 0.127 0.19
3rd
class above average reading score % 69 (40/29)
0.26 (0.44)
0.05 (0.22)
0.006 0.014 0.65
2nd
class above average maths score % 117 (66/51)
0.22 (0.42)
0.05 (0.21)
0.000 0.006 0.55
3rd
class above average maths score % 69 (40/29)
0.15 (0.36)
0.05 (0.22)
0.059 0.119 0.35
Academic Below the Norm Cutoff
Scores
2nd
class below average reading score % 118 (66/52)
0.31 (0.47)
0.47 (0.50)
0.044 0.044 0.34
3rd
class below average reading score % 69 (40/29)
0.35 (0.48)
0.62 (0.49)
0.033 0.047 0.56
2nd
class below average maths score % 117 (66/51)
0.34 (0.48)
0.55 (0.50)
0.030 0.075 0.43
3rd
class below average maths score % 69 (40/29)
0.44 (0.50)
0.72 (0.46)
0.035 0.091 0.57
Absenteeism & School Resources
Proportion of days present in last school
year %
100 (55/45)
0.93 (0.05)
0.93 (0.06)
0.663 0.663 0.11
Proportion of days present in current
school year %
117 (66/51)
0.94 (0.04)
0.94 (0.06)
0.626 0.746 0.04
In class supports % 118 (66/52)
0.39 (0.49)
0.53 (0.50)
0.092 0.400 0.28
Out of class supports % 118 (66/52)
0.24 (0.43)
0.37 (0.49)
0.121 0.359 0.28
SNA supports % 118 (66/52)
0.04 (0.19)
0.03 (0.17)
0.279 0.709 0.04
Other supports % 118 (66/52)
0.09 (0.29)
0.14 (0.35)
0.158 0.556 0.16
Notes: N’ indicates the sample size. ‘M’ indicates the IPW-adjusted mean. ‘SD’ indicates the IPW-adjusted standard
deviation. 1 one-tailed (right-sided) conditional p-value from individual IPW-adjusted permutation test with 100,000
replications. 2 one-tailed (right-sided) conditional p-value from IPW-adjusted stepdown permutation test with 100,000
replications. ‘Effect size’ is the ratio of the treatment effect to the standard deviation of the low treatment group. The
conditional set includes gender, DEIS status, and type of test conducted.

49
Table C2 Comparison of high and low treatment groups: Child cognitive outcomes
conditional on baseline differences
N
(HIGH/LOW)
MHIGH
(SD)
MLOW
(SD)
p1 p
2 ES
BAS Composite Scores
General Conceptual Ability 110 (68/42)
88.18 (11.95)
79.65 (12.85)
0.008 0.022 0.61
Spatial Ability 111 (68/43)
94.39 (14.22)
86.72 (17.08)
0.059 0.129 0.42
Non-Verbal Ability 111 (68/43)
84.53 (11.76)
76.47 (10.22)
0.000 0.004 0.73
Verbal Ability 110 (68/42)
92.19 (11.81)
86.19 (13.79)
0.054 0.114 0.39
BAS Above the Norm %
General Conceptual Ability 110 (68/42)
0.02 (0.14)
0.00 (0.00)
0.190 0.473 0.31
Spatial Ability 111 (68/43)
0.11 (0.31)
0.12 (0.33)
0.521 0.789 0.03
Non-Verbal Ability 111 (68/43)
0.03 (0.18)
0.00 (0.00)
0.241 0.460 0.25
Verbal Ability 110 (68/42)
0.05 (0.22)
0.08 (0.28)
0.845 0.845 0.19
BAS Below the Norm %
General Conceptual Ability 110 (68/42)
0.57 (0.50)
0.74 (0.44)
0.041 0.041 0.38
Spatial Ability 111 (68/43)
0.33 (0.47)
0.68 (0.47)
0.008 0.015 0.68
Non-Verbal Ability 111 (68/43)
0.71 (0.46)
0.88 (0.33)
0.006 0.023 0.52
Verbal Ability 110 (68/42)
0.33 (0.47)
0.66 (0.48)
0.024 0.030 0.54
NIH Toolbox Executive Functioning
Flanker Task - Inhibitory control 110 (68/42)
97.89 (16.77)
90.11 (11.90)
0.061 0.061 0.39
Dimensional Change Card Sort Task -
Attention flexibility 109
(68/41) 102.26 (21.88)
91.76 (12.57)
0.046 0.065 0.44
List Sorting Task - Working memory 107 (68/39)
96.05 (13.46)
89.51 (9.46)
0.011 0.069 0.49
Other
Composite Executive Function score 107 (68/39)
0.38 (1.03)
0.18 (0.69)
0.033 0.033 0.49
Notes: N’ indicates the sample size. ‘M’ indicates the IPW-adjusted mean. ‘SD’ indicates the IPW-adjusted
standard deviation. 1 one-tailed (right-sided) conditional p-value from individual IPW-adjusted permutation test
with 100,000 replications. 2 one-tailed (right-sided) conditional p-value from IPW-adjusted stepdown
permutation test with 100,000 replications. ‘Effect size’ is the ratio of the treatment effect to the pooled standard
deviation. The conditional set includes gender maternal knowledge of child development, parenting self-
efficacy, maternal attachment, and maternal consideration of future consequences.
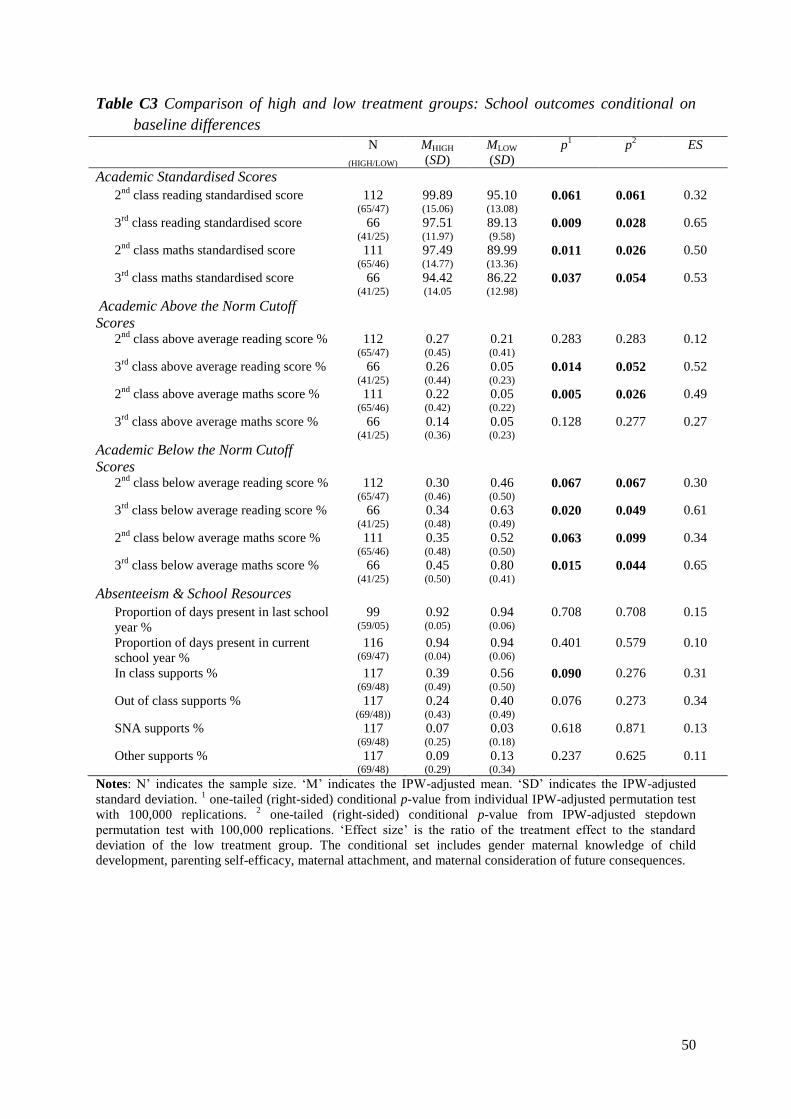
50
Table C3 Comparison of high and low treatment groups: School outcomes conditional on
baseline differences
N
(HIGH/LOW)
MHIGH
(SD)
MLOW
(SD)
p1 p
2 ES
Academic Standardised Scores
2nd
class reading standardised score 112 (65/47)
99.89 (15.06)
95.10 (13.08)
0.061 0.061 0.32
3rd
class reading standardised score 66 (41/25)
97.51 (11.97)
89.13 (9.58)
0.009 0.028 0.65
2nd
class maths standardised score 111 (65/46)
97.49 (14.77)
89.99 (13.36)
0.011 0.026 0.50
3rd
class maths standardised score 66 (41/25)
94.42 (14.05
86.22 (12.98)
0.037 0.054 0.53
Academic Above the Norm Cutoff
Scores
2nd
class above average reading score % 112 (65/47)
0.27 (0.45)
0.21 (0.41)
0.283 0.283 0.12
3rd
class above average reading score % 66 (41/25)
0.26 (0.44)
0.05 (0.23)
0.014 0.052 0.52
2nd
class above average maths score % 111 (65/46)
0.22 (0.42)
0.05 (0.22)
0.005 0.026 0.49
3rd
class above average maths score % 66 (41/25)
0.14 (0.36)
0.05 (0.23)
0.128 0.277 0.27
Academic Below the Norm Cutoff
Scores
2nd
class below average reading score % 112 (65/47)
0.30 (0.46)
0.46 (0.50)
0.067 0.067 0.30
3rd
class below average reading score % 66 (41/25)
0.34 (0.48)
0.63 (0.49)
0.020 0.049 0.61
2nd
class below average maths score % 111 (65/46)
0.35 (0.48)
0.52 (0.50)
0.063 0.099 0.34
3rd
class below average maths score % 66 (41/25)
0.45 (0.50)
0.80 (0.41)
0.015 0.044 0.65
Absenteeism & School Resources
Proportion of days present in last school
year %
99 (59/05)
0.92 (0.05)
0.94 (0.06)
0.708 0.708 0.15
Proportion of days present in current
school year %
116 (69/47)
0.94 (0.04)
0.94 (0.06)
0.401 0.579 0.10
In class supports % 117 (69/48)
0.39 (0.49)
0.56 (0.50)
0.090 0.276 0.31
Out of class supports % 117 (69/48))
0.24 (0.43)
0.40 (0.49)
0.076 0.273 0.34
SNA supports % 117 (69/48)
0.07 (0.25)
0.03 (0.18)
0.618 0.871 0.13
Other supports % 117 (69/48)
0.09 (0.29)
0.13 (0.34)
0.237 0.625 0.11
Notes: N’ indicates the sample size. ‘M’ indicates the IPW-adjusted mean. ‘SD’ indicates the IPW-adjusted
standard deviation. 1 one-tailed (right-sided) conditional p-value from individual IPW-adjusted permutation test
with 100,000 replications. 2 one-tailed (right-sided) conditional p-value from IPW-adjusted stepdown
permutation test with 100,000 replications. ‘Effect size’ is the ratio of the treatment effect to the standard
deviation of the low treatment group. The conditional set includes gender maternal knowledge of child
development, parenting self-efficacy, maternal attachment, and maternal consideration of future consequences.

51
Table C4 Comparison of high and low treatment groups: Child socio-emotional outcomes
conditional on baseline differences
N
(HIGH/LOW)
MHIGH
(SD)
MLOW
(SD)
p1 p
2 ES
Child-report
SSIS Internalizing Problems 111 (68/43)
7.54 (5.83)
8.36 (5.58)
0.304 0.552 0.09
SSIS Externalizing Problems 111 (68/43)
6.43 (3.92)
4.89 (5.61)
0.830 0.887 0.25
SSIS Bullying 111 (68/43)
1.11 (1.24)
0.60 (1.68)
0.818 0.818 0.27
SSIS Hyperactivity/Inattention 111 (68/43)
6.45 (3.48)
6.17 (4.40)
0.585 0.789 0.08
Child-report Cutoff %
SSIS Internalizing Problems 111 (68/43)
0.11 (0.31)
0.11 (0.32)
0.376 0.376 0.04
SSIS Externalizing Problems 111 (68/43)
0.08 (0.27)
0.09 (0.29)
0.467 0.559 0.04
SSIS Bullying 111 (68/43)
0.01 (0.10)
0.04 (0.21)
0.178 0.456 0.17
SSIS Hyperactivity/Inattention 111 (68/43)
0.11 (0.31)
0.13 (0.34)
0.346 0.521 0.09
Parent-report
SDQ Peer problems 107 (64/43)
1.59 (1.61)
1.93 (1.49)
0.115 0.385 0.20
SDQ Prosocial behaviour 107 (64/43)
8.85 (1.71)
8.80 (1.29)
0.465 0.456 0.05
BPM Internalising problems 106 (63/43)
57.54 (6.34)
57.23 (6.14)
0.452 0.663 0.04
BPM Externalising problems 106 (63/43)
53.79 (5.74)
54.70 (6.08)
0.261 0.398 0.17
BPM Attention problems 106 (63/43))
53.89 (7.46)
56.47 (7.05)
0.133 0.370 0.23
Parent-report Cutoff%
SDQ Peer problems 107 (64/43)
0.13 (0.34)
0.14 (0.35)
0.384 0.762 0.03
SDQ Prosocial behaviour 107 (64/43)
0.08 (0.27)
0.02 (0.12)
0.918 0.918 0.37
BPM Internalising problems 106 (63/43)
0.21 (0.41)
0.22 (0.42)
0.344 0.695 0.02
BPM Externalising problems 106 (63/43)
0.07 (0.27)
0.16 (0.37)
0.262 0.491 0.23
BPM Attention problems 106 (63/43)
0.13 (0.33)
0.14 (0.35)
0.531 0.657 0.03
Other
SISS Problem Behaviours Standardised
Total Score
111 (68/43)
96.73 (10.03)
96.63 (14.85)
0506 0.506 0.02
SISS Problem behaviours total score - ~
85%ile
111 (68/43)
0.04 (0.20)
0.12 (0.32)
0.072 0.205 0.32
BPM Total problems standardised score 106 (63/43)
54.60 (6.87)
56.48 (6.44)3
0.138 0256 0.24
Child has ASD-ADHD 107 (64/43)
0.08 (0.27)
0.05 (0.21)
0.561 0.561 0.10
Child has learning difficulty 107 (64/43)
0.06 (0.23)
0.11 (0.32)
0.204 0.260 0.19
Notes: N’ indicates the sample size. ‘M’ indicates the IPW-adjusted mean. ‘SD’ indicates the IPW-adjusted standard
deviation. 1 one-tailed (right-sided) conditional p-value from individual IPW-adjusted permutation test with 100,000
replications. 2 one-tailed (right-sided) conditional p-value from IPW-adjusted stepdown permutation test with 100,000
replications. ‘Effect size’ is the ratio of the treatment effect to the pooled standard deviation. The conditional set
includes gender maternal knowledge of child development, parenting self-efficacy, maternal attachment, and maternal
consideration of future consequences.

UCD CENTRE FOR ECONOMIC RESEARCH – RECENT WORKING PAPERS WP19/17 David Madden: 'The ESR at 50: A Review Article on Fiscal Policy Papers' August 2019 WP19/18 Jonathan Briody, Orla Doyle and Cecily Kelleher: 'The Effect of the Great Recession on Health: A longitudinal study of Irish Mothers 2001-2011' August 2019 WP19/19 Martina Lawless and Zuzanna Studnicka: 'Old Firms and New Export Flows: Does Experience Increase Survival?' September 2019
WP19/20 Sarah Parlane and Lisa Ryan: 'Optimal Contracts for Renewable Electricity' September 2019 WP19/21 Claes Ek and Margaret Samahita: 'Pessimism and Overcommitment' September 2019 WP19/22 David Madden 'BMI Mobility and Obesity Transitions Among Children in Ireland' September 2019 WP19/23 Martina Lawless and Zuzanna Studnicka: 'Products or Markets: What Type of Experience Matters for Export Survival?' October 2019 WP19/24 Neil Cummins and Cormac Ó Gráda: 'Artisanal Skills, Watchmaking, and the Industrial Revolution: Prescot and Beyond' October 2019 WP19/25 Morgan Kelly, Cormac Ó Gráda and Peter Solar: 'Safety at Sea during the Industrial Revolution' October 2019 WP19/26 Oana Peia and Davide Romelli: 'Did Bank Lending Stifle Innovation in Europe During the Great Recession?' November 2019 WP19/27 Dimitrios Bermperoglou, Yota Deli and Sarantis Kalyvitis: 'Investment Tax Incentives and Their Big Time-to-Build Fiscal Multiplier' November 2019 WP19/28 Judith M Delaney and Paul J Devereux: 'Math Matters! The Importance of Mathematical and Verbal Skills for Degree Performance' November 2019 WP19/29 Alan Fernihough and Cormac Ó Gráda: 'Across the Sea to Ireland: Return Atlantic Migration before the First World War' November 2019 WP19/30 Tamanna Adhikari and Karl Whelan: 'Do Business-Friendly Reforms Boost GDP?' December 2019 WP19/31 Judith M Delaney and Paul J Devereux: 'The Effect of High School Rank in English and Math on College Major Choice' December 2019 WP19/32 Tensay Hadush Meles, Lisa Ryan and Sanghamitra Mukherjee: 'Heterogeneity in Preferences for Renewable Home Heating Systems' December 2019 WP20/01 Cormac Ó Gráda: 'Economic History: ‘An Isthmus Joining Two Great Continents’?' January 2020 WP20/02 Margaret Samahita and Håkan J Holm: 'Mining for Mood Effect in the Field' January 2020 WP20/03 Vincent Hogan and Patrick Massey: 'Professional Rugby on the Celtic Fringe' January 2020 WP20/04 Sanghamitra Chattopadhyay Mukherjee, Séin Healy, Tensay Hadush Meles, Lisa Ryan, Robert Mooney, Lindsay Sharpe and Paul Hayes: 'Renewable Energy Technology Uptake: Public Preferences and Policy Design in Early Adoption' February 2020 WP20/05 Ronald B Davies and James R Markusen: 'The Structure of Multinational Firms' International Activities' February 2020 WP20/06 Morgan Kelly: 'Direct Standard Errors for Regressions with Spatially Autocorrelated Residuals' March 2020 WP20/07 Anna Bayona and Oana Peia: 'Financial Contagion and the Wealth Effect: An Experimental Study' March 2020
UCD Centre for Economic Research Email [email protected]