uganda - domestic resource mobilization for poverty reduction in
TRANSCRIPT
African Development Bank Group
Domestic Resource Mobilization
for Poverty Reduction in East Africa:
Uganda Case Study
Regional Department East A (OREA)
NOVEMBER 2010

i
Table of Contents
Table of Contents .................................................................................................... i List of abbreviations .................................................................................................ii Preface ................................................................................................................... iii Acknowledgements ................................................................................................iv
Executive summary ................................................................................................iv 1 Context – Political economy and fiscal legacies ............................................... 1
1.1 The NRM‘s drive for economic recovery and liberalisation ............................ 1 1.2 Macro-economic, fiscal stability and steady growth from the 1980s .............. 1 1.3 Development financing mix and challenges ................................................... 2
1.4 Political economy dynamics underpinning DRM ............................................ 4 1.5 Fiscal governance drivers, results and trajectory ........................................... 7
2 Trends in the tax system ..................................................................................... 9
2.1 Changes in tax policies over the years .......................................................... 9 2.2 Institutional changes .................................................................................... 11 2.3 Changes in the administrative systems ....................................................... 12
2.4 Fiscal decentralisation and taxation by local governments .......................... 13 2.5 Reforms sequencing, implementation and results ....................................... 14
3 Domestic revenue performance ........................................................................ 17
3.1 Domestic revenue performance trends ........................................................ 17 3.2 Tax administration benchmarks ................................................................... 19
3.3 Summary of overall trends ........................................................................... 22 4 Challenges and issues ....................................................................................... 23
4.1 An introduction to the challenges and issues ............................................... 23
4.2 Ensuring the efficacy of tax incentives and exemptions............................... 23 4.3 Widening the tax base ................................................................................. 23
4.4 Developing and maintaining capacity for tax policy management ............... 23 4.5 Building and sustaining management capacity in URA................................ 24
4.6 Minimising corruption in tax collection ......................................................... 24 4.7 Ensuring harmonised, systematic and policy led regional integration
measures ..................................................................................................... 25 5 Lessons of experience ....................................................................................... 26
5.1 It is important to insulate an ARA from politics ............................................ 26 5.2 Restructuring, reengineering and automation can facilitate the
reduction in the cost of collection ................................................................. 27
5.3 Tax incentives and exemptions can negate DRM results ............................ 27 Annex A: List of Key informants ................................................................................ 28 Annex B: Bibliography ................................................................................................ 30 Annex C: Select indicators ......................................................................................... 35
Annex D: Changes to the administrative systems at URA ...................................... 40 Annex E: Glossary of definitions of select terms ..................................................... 42
ii
List of abbreviations
AfDB African Development Bank AFRODAD African Forum and Network on Debt and Development APRM African Peer Review Mechanism ARA Autonomous Revenue Authority ASYCUDA Automated System for Customs Data CET Common External Tariff CIT Corporate Income Tax CITPROD Corporate Income Tax Revenue Productivity CTL Commercial Transaction Levy DFID Department for International Development DRM Domestic Resource Mobilization EAC East African Community eFiling Electronic Filing EPRC Economic Policy Research Centre eTax Integrated Tax Management System FDI Foreign Direct Investment GDP Gross Domestic Product GoU Government of Uganda HIPC Heavily Indebted Poor Countries Initiative ICT Information and Communication Technology ID Identification IEP Integrity Enhancement Programme IMF International Monetary Fund LTO Large Taxpayers‘ Office M&E Monitoring and Evaluation MDRI Multilateral Debt Reduction Initiative MoFPED Ministry of Finance, Planning and Economic Development MTEF Medium Term Expenditure Framework NDP National Development Plan NRM National Resistance Movement ODA Official Development Assistance OECD Organisation for Economic Cooperation and Development PEAP Poverty Eradication Action Plan PIT Personal Income Tax PITPROD Personal Income Tax Revenue Productivity PwC PricewaterhouseCoopers RADDEX Revenue Authority Digital Data Exchange SAP Structural Adjustment Programme SSA Sub-Saharan Africa TAXSTAFF Ratio of Tax Staff per Population TIN Taxpayer Identification Number URA Uganda Revenue Authority VAT Value Added Tax VATGCR VAT Gross Compliance Ratio
iii
Preface
The African Development Bank (AfDB) has partnered with the African Tax
Administration Forum (ATAF) and the East African Secretariat on a project aimed at
sharing lessons of experience from Domestic Resource Mobilization (DRM) though
case studies for the East African Community partner states (EAC), South Africa and
South Korea. For the purposes of this work, DRM is defined to include only tax policy
and administration and excludes other possible components of DRM such as domestic
financial markets.
The overall objective of this project is to make recommendations, for the participating
countries of the EAC, on the priority reforms and ways to sequence and implement
them, in order to significantly enhance DRM. As such, the primary beneficiaries of the
project are both the Ministries of Finance and the Revenue Administrations of the EAC.
This paper seeks to respond to the following question: What key factors have
contributed to or inhibited DRM in Uganda? This case study has been prepared
following an extensive review of available literature, interviews with key informants in
Uganda, the collection of quantitative data, and the analysis of both primary and
secondary data. Its development has also been informed by a methodological
framework designed by the AfDB. The core principle of the methodological framework is
to analyse tax performance as a result of tax systems, reforms and the political
economy. The study adopts an explanatory case study approach to match patterns from
our analysis of the literature and key informant interviews.
The achievements and lessons of experience contained in this and other country case
studies will provide primary inputs for a policy note. The policy note will seek to address
the following questions: What are the priority reforms for EAC partner states and the
EAC? How should these reforms be sequenced and implemented?
Chapter 1 of this case study begins with an examination of Uganda‘s political economy
and fiscal legacies. Thereafter, Chapters 2 and 3 explain and analyse the trends in the
tax system and their impact on domestic revenue performance, respectively. The final
chapters highlight the challenges and issues currently faced by the authorities (Chapter
4), and lessons of experience for consideration by the EAC partner states (Chapter 5).
iv
Acknowledgements
The Uganda Case Study was prepared under the overall supervision of Mrs. Diarietou Gaye
(Regional Director, Department East A, OREA) and Catherine Baumont-Keita (Lead
Economist, OREA). Core team members were Edward Sennoga (Macro Economist, UGFO
and Task Manager, Richard Walker (Country Economist, KEFO) and Christian Lim
(Private Sector Specialist, OSGE). The external consultants were led by Elizabeth Kariuki
and Kithingi Kiragu (PricewaterhouseCoopers).
Mr. Aloysius Ordu (Vice President, Country and Regional Programs), Mr. Steve Kayizzi-
Mugerwa (Director, Operational Resources and Policies), and Ms. Radhika Bharat
(Investment Officer) initiated the project and were involved in the early design of the study.
The production of this case study was made possible by the generous financial support from
the Korea-Africa Fund for Economic Cooperation. We also thank the African Tax
Administration Forum, East African Community Secretariat, senior management and staff
of the Uganda Revenue Authority and Ministry of Finance, Planning and Economic
Development for the extremely productive exchanges and valuable insights provided to us
during the preparation of this case study. Similar appreciation also goes to representatives of
regional organizations, private sector organisations, think tanks and multilateral and
bilateral development partners in Uganda.
The case study also benefitted from valuable feedback provided by staff in different
departments of the ADB both at headquarters and in the field offices (Kenya, Tanzania,
Uganda and Rwanda). External reviewers were Tom Richardson IMF Snr. Res Rep,
Uganda, Kalyebbi B. Magoola, Assistant Commissioner: Research, Planning and
Development, Uganda Revenue Authority who provided valuable comments.
There is not enough space here to name each and every one of those who have contributed
immensely to the successful completion of this case study; however, Annex A lists some of
the key contributors to this report. In addition, we seek the indulgence of all the contributors
in accepting this blanket acknowledgement and appreciation of their efforts and
contribution. We are indeed very thankful.
v
Executive summary
1. Context-Political economy and fiscal legacies
The first two and a half decades following Uganda‘s independence (in 1962) were
dominated by political turmoil and war, including nine years rule under the dreaded
Amin regime (1971-79). Economic performance was either dismal or negative in the
intervening fiscal years. The National Resistance Movement (NRM) regime of President
Museveni, which has governed Uganda since 1986 ushered an era of peace, political
and economic reforms, and sustained social-economic development. On assumption of
power, the regime embraced Structural Adjustment Programmes (SAPs). The
implementation of the SAPs extended into and dominated the 1990s (AFRODAD,
2007), and entailed wholesale economic liberalisation. In return, Bretton Woods
Institutions and the developed countries of the West lavished the regime with all round
development assistance.
From the late 1980s, Uganda entered its current trajectory of macro-economic and fiscal
stability, and poverty reduction. From 1987 to 2000, per capita GDP grew at an average
annual rate of just over 3%, and this rate rose to about 4% in 2001 and 8.7% in
2007/08. According to the IMF (2009a), aggregate economic growth in the past five
years has been at particularly high rate - approaching an annual average of 9%. Yet,
according to the same source, in spite of two decades of steady economic growth,
Uganda‘s economy remains more reliant on subsistence agriculture and
correspondingly less on high-productivity manufacturing. It appears that one major
drawback in Uganda‘s era of economic recovery and development has been the limited
investments in economic infrastructure in yesteryears.
As elaborated below, DRM in Uganda has clearly lagged well behind both economic
growth and far reaching tax administration reform efforts for many years. A review of
political economy legacies suggests, firstly, despite strong support from the NRM
regime for DRM, the national political leadership may have undermined tax revenue
collection through ad hoc decisions on matters touching on tax policies and
administration. Also, the tax base remains narrow. Furthermore, ―tax morale‖ is
undermined by the public perception that public services are predominantly funded with
external resources, and a prevailing sense that due to corruption and mismanagement,
government has not been delivering value for money with resources made available to
it.
vi
The commercial production of newly discovered oil reserves which are projected to
commence by 2015 will be the most critical variable in Uganda‘s fiscal governance
trajectory in the medium to long-term. No doubt oil revenues will vastly add to the level
of domestic resources. This development will in turn, generate four significant
outcomes. First, whether or not these revenues are managed by URA will impact either
positively or negatively on the capacity and performance of URA to collect other
revenue. Second, oil revenues may also serve to reduce Uganda‘s reliance on external
resources. As a consequence, the relationship between Uganda and international
development organisations will be redefined. Third, there is a distinct prospect that new
revenue streams will in all probability, stimulate the acceleration of the modernisation of
the economy and poverty reduction. Fourth, the availability of this new source of
development resources, and the concurrent modernisation of the economy, may in the
long-term dampen the prevailing propensity of political leaders to make ad hoc awards
of tax incentives and exemptions. Therefore, barring the unforeseen or the tragedy of
the so called ―oil curse‖, the fiscal governance trajectory for Uganda is exponential.
2. Tax reforms: Sequencing, implementation and results
In the early years following independence, Uganda relied on unified tax policies and an
administrative system jointly administered by the initial three members of the EAC.
Following the enactment of the Income Tax Decree No. 1 of 1974, there were no major
changes to the tax system until the 1990s and 2000s when government:
Established URA (in 1991) in an attempt to better coordinate tax administration
and enhance tax revenue collection;
Introduced the Value Added Tax (VAT) (in 1996) despite popular resistance;
Promulgated a new Income Tax Act (in 1997) with the objectives of levying tax
on a residence basis, ensuring simplicity and promoting a flat tax rate scale;
Abolished export taxes and embarked on tariff reform whose policy objectives
evolved around simplification of the tax structure;
Introduced major policy changes in the decade up to 2007/08 primarily around
VAT and income tax.
An initial series of administrative reforms took place following the establishment of URA.
The reform focus in these early years was on breaking the culture of corruption by
screening staff, strengthening URA‘s capacity (Fjeldstad, 2005) and to a limited extent,
modernising systems (IMF, 1999). However, corruption remained pervasive leading to
the appointment of an independent inquiry into URA led by Justice Julia Sebutinde in
2002. The inquiry‘s report was, however, questioned by Parliamentarians, and nullified
vii
by the High Court in 2004 (Fjeldstad, 2005). Still, in 2004/05 GoU appointed a new
Commissioner General and Board. Since then the URA has undergone two phases of
reform: (1) structural and further institutional reforms; and (2) a programme of
modernisation.
As part of its post 2005 reforms, structural changes evolved around streamlining URA‘s
structure which had become top heavy as well as hierarchical. Thereafter, URA‘s
management also continued to address the problem of staff integrity, and embarked on
modernising the authority. Key results under the modernisation phase include the
following:
Business processes in customs and domestic tax have been reengineered, new
procedures drawn up, and staff retrained;
Certain aspects of URA‘s corporate services have been modernised;
As a means towards enhancing integrity, a revised staff code of conduct and
whistle blowing policy were developed in 2009;
URA has disseminated a taxpayers‘ charter with clear standards of service;
Various publications on tax has been translated into eight languages, and Public and Taxpayer Education services regularly hold tax clinics to obtain feedback on taxpayers‘ needs.
It is noteworthy that the post 2005 reforms have focused primarily on tax administration.
This is not surprising because Uganda is yet to undertake rigorous and comprehensive
research and analysis of the tax system for instance as was the case with the work of
the Katz Commission in South Africa.
3. Domestic revenue performance
Uganda achieved considerably improved levels of domestic revenue in the first seven
years following the establishment of URA - with tax and non tax revenue collections
rising by 5.1 percentage points to 11.9% of GDP in 1998/99. The reform of tax
administration arrangements, as well as the introduction of VAT and Income Tax
legislation contributed to a significant increase in domestic revenue collections in the
late 1990s.
In addition, since 1991/92, non-tax revenues have contributed an average of 7% of total
domestic revenue collected each year. It is noteworthy that from 2002/03, URA started
to collect some non-tax revenues on behalf of ministries and departments including for
viii
example: passport and migration fees; company regulation fees; and mining fees and
royalties.
Still, in the current decade, domestic revenue growth has not been as high as
anticipated, levelling at 12.8% of GDP in 2007/08. Revenue collections stagnated as a
result of smuggling and tax evasion. The growing level of incentives and exemptions
granted in recent years has further undermined Uganda‘s revenue potential, and
perhaps explains the sizeable tax gap.
4. Challenges and issues
Considerable efforts have been made to modernize the URA, with a view to realising its
vision ―to be a model for best practices and innovation in revenue services‖. However,
the following major challenges will need to be addressed for this vision to be realised
and sustained:
Ensuring the efficacy of tax incentives and exemptions: According to some key
informants, tax revenue as a percentage of GDP could easily go up to 16%, if,
some of the revenue negating measures, particularly incentives and exemptions
were removed;
Widening the tax base: The predominance of a large informal sector that is
outside the tax net, under declarations, evasion and smuggling are challenges;
Developing and maintaining capacity for tax policy management: There is a view
that more could be done to build and sustain tax policy capacity in Uganda. Key
informants proposed that one way of building and sustaining this capacity, would
be, to promote knowledge sharing in the region. Another approach proposed
would be to transfer staff between MoFPED and URA;
Building and sustaining management capacity in URA: senior managerial
positions have fixed term limits. Also remuneration has not been adjusted for
senior staff and personnel in professional and technical positions since 2004/05.
As a result, URA has not been able to retain institutional knowledge and
specialised skills;
Minimising corruption in tax collection: In 2009, URA was ranked as the second
and seventh most corrupt public institution in Uganda, and in the three EAC
countries (of Kenya, Tanzania and Uganda), respectively (Transparency
International, 2009). Furthermore, the 2008 integrity baseline survey
commissioned by URA suggests that corruption is still a challenge;
ix
Ensuring harmonised, systematic and policy led regional integration measures: It
is noteworthy that there are demands by Ugandan based businesses to extend
the duty exemption period beyond 2010 for the importation of key inputs and
materials under the Duty Remission Scheme. In addition, Uganda‘s tax regime is
not fully in synch with the systems in other EAC partner states.
5. Lessons of experience
There are three key lessons that can be drawn from Uganda DRM experience:
It is important to insulate an ARA from politics: It would seem that URA‘s staff
remuneration has been politicised in recent years, and therefore pay has not kept
up with packages offered by other organisations in the market seeking to recruit
similar skills. Therefore, URA has suffered staff losses in critical positions;
Restructuring, reengineering and automation can facilitate the reduction in the
cost of collection: Since 1996/97, URA has been able to bring down the cost of
collecting tax and non-tax revenues. This reduction demonstrates one benefit of
the restructuring, reengineering and automation initiatives;
Tax incentives and exemptions can negate DRM results: It is therefore important
to quantify, and if significant, reverse the effects of this and other negating
factors.
1
1 Context – Political economy and fiscal legacies
1.1 The NRM’s drive for economic recovery and liberalisation
The first two and a half decades following Uganda‘s independence were dominated by
political turmoil and war, including a military coup nine years after independence, which
was followed by the era of the dreaded Amin regime (1971-79) – who ―became known
as the ‗Butcher of Uganda‘‖ (The Independent, 2003). Thereafter, following the 1979-80
war with Tanzania, Idi Amin was deposed, and the Uganda National Liberation Front
under President Binaisa took over power for two years before he was overthrown,
President Milton Obote took over for a period of five years (1980-1985), before a military
junta (1985-86) overthrew him, and the National Resistance Movement (NRM) seized
power in 1986.
Since 1986, the NRM under President Yoweri Kaguta Museveni has virtually dominated
politics and the exercise of power in Uganda. The NRM‘s ten point agenda on taking
power, which until recently was the legacy ideology of the movement, placed a strong
focus on economic recovery and liberalisation. However, only a year after taking over,
NRM embraced the IMF and World Bank structural adjustments programme and
economic liberalisation policies as it recognised ―the need for increased external
support‖ (APRM, 2009). Thereafter, the government embarked on rebuilding the
economy, which had virtually collapsed as a result of the prolonged economic
mismanagement and the wars.
1.2 Macro-economic, fiscal stability and steady growth from the 1980s
―The NRM and President Museveni provided the leadership and governance discipline
that helped turn around the fortunes of the country‖ (Tumushabe, 2009). The regime
embraced Structural Adjustment Programmes (SAPs), ―whose implementation extended
into and dominated the 1990s‖ (AFRODAD, 2007). Under SAPs, the Government of
Uganda (GoU) liberalised: prices and trade in the domestic market; foreign exchange;
and payments. These measures enabled Uganda to diversify its exports. Furthermore,
under SAPs, GoU restructured and divested its holdings in private enterprises. It was
also able to contain inflation and promote a rise in interest rates through prudent
monetary policies (IMF, 1999). In return, Bretton Woods Institutions and the developed
countries of the West, lavished the regime with all round development assistance.
By the mid-nineteen nineties, Uganda entered onto a trajectory of macro-economic and
fiscal stability. From: 1987 to 1996, per capita GDP grew at an average rate of 3% per
annum (p.a.); and 1996 to 2000, average GDP per capita growth remained at around
the same level. It is noteworthy that between 2001 and 2007, Uganda‘s average GDP
per capita growth rose to around 4% p.a. According to the IMF (2009a), in the last five
years, Uganda‘s average growth has been almost at 9% p.a.
2
Between 1990/91 and 2005/06 the structure of Uganda‘s economy changed fairly
significantly. The services sector overtook the agriculture sector to become the largest
contributor to the economy. Industry‘s share in production also rose, but since 2001/02
its share in total output has remained flat. Available estimates indicate that the
contributions by the three sectors remained at around the same levels in 2009 –
agriculture (22.2%), industry (25.1%) and services (52.8%)1. Selassie (2008) suggests
that industry‘s contribution could be much higher if more investment had been made in
infrastructure – in particular, ―cheap and effective infrastructure is a pre-requisite for
industrialization‖. To this end, for example, GoU is championing the Bujagali
hydropower project scheduled to be commissioned in 2011.
In addition to the above Uganda‘s economic ―growth has contributed to a sharp decline
in poverty from 56% of the population in 1992/93 to 31% in 2005/06‖ (IMF, 2009a). This
decline is attributable to concerted efforts on the part of GoU to combat poverty through
the Poverty Eradication Action Plan (PEAP). ―PEAP defines the framework through
which [GoU] provides public goods and services needed to support economic growth
and development‖ (GoU, 2004). PEAP was succeeded by a National Development Plan
(NDP) covering a five-year period from 2010/11. The NDP targets a national growth rate
of 8 to 9% of GDP p.a., and incorporates interventions aimed at further rapidly reducing
poverty on a sustainable basis. Enhancing the quality of life of disadvantaged and
vulnerable groups by financing initiatives in social services and infrastructure is at the
forefront.
1.3 Development financing mix and challenges
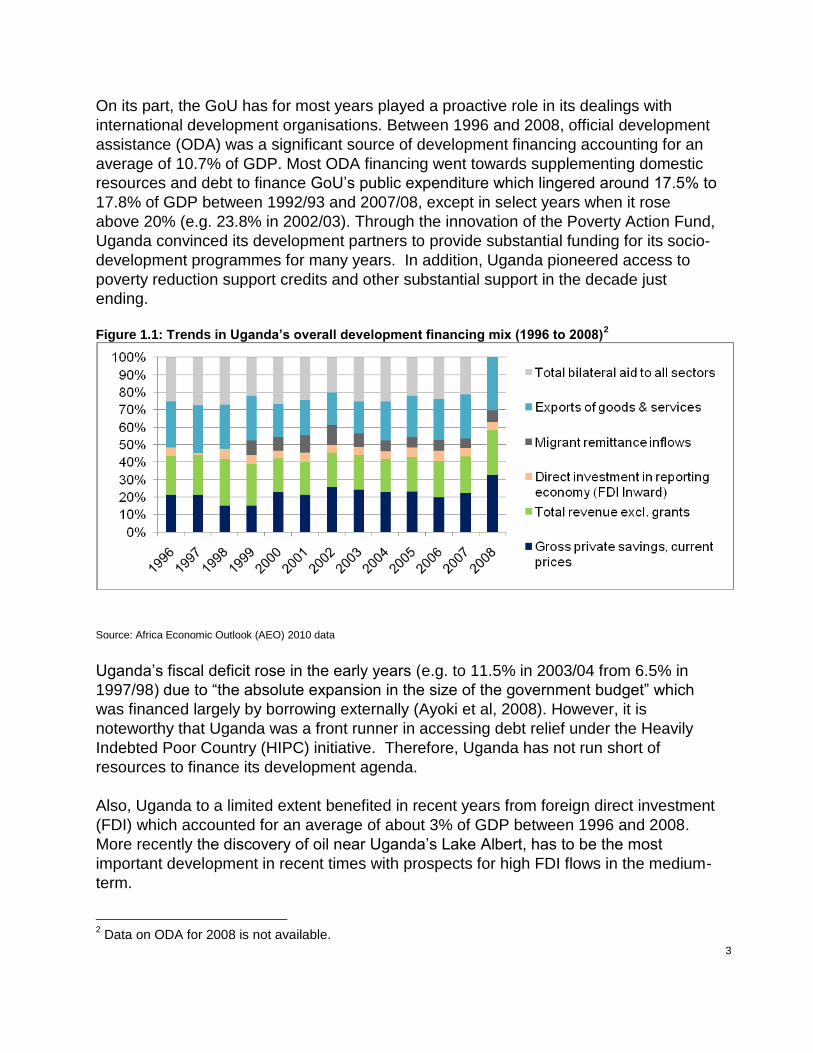
Figure 1.1 shows trends in the overall development financing mix for Uganda between
1996 and 2008. The three largest sources of developing financing during the period
were gross private savings, exports and domestic revenue. Gross private savings
(averaging at 14.6% of GDP between 2002 and 2008) were fairly low remaining below
the Africa benchmark for the post-Monterrey period (after 2002) of 22.1%. This low level
of saving is partly attributable to low household income levels and interest rates offered
for deposits (World Bank, 2007). However, between 2002 and 2008, gross private
savings grew at a fairly rapid rate of 19.9%.
Liberalising Uganda‘s economy has facilitated the growth of the nation‘s exports.
According to the IMF (2009a), ―the volume growth of major export commodities …was
either in line or above the average volume growth of world exports‖. In 2008 and 2009,
Uganda‘s largest foreign exchange earners were from the export of coffee, fish and fish
products and tobacco.
1 See https://www.cia.gov/library/publications/the-world-factbook/fields/2012.html [Accessed 26 March
2010].
3
On its part, the GoU has for most years played a proactive role in its dealings with
international development organisations. Between 1996 and 2008, official development
assistance (ODA) was a significant source of development financing accounting for an
average of 10.7% of GDP. Most ODA financing went towards supplementing domestic
resources and debt to finance GoU‘s public expenditure which lingered around 17.5% to
17.8% of GDP between 1992/93 and 2007/08, except in select years when it rose
above 20% (e.g. 23.8% in 2002/03). Through the innovation of the Poverty Action Fund,
Uganda convinced its development partners to provide substantial funding for its socio-
development programmes for many years. In addition, Uganda pioneered access to
poverty reduction support credits and other substantial support in the decade just
ending.
Figure 1.1: Trends in Uganda’s overall development financing mix (1996 to 2008)2
Source: Africa Economic Outlook (AEO) 2010 data
Uganda‘s fiscal deficit rose in the early years (e.g. to 11.5% in 2003/04 from 6.5% in
1997/98) due to ―the absolute expansion in the size of the government budget‖ which
was financed largely by borrowing externally (Ayoki et al, 2008). However, it is
noteworthy that Uganda was a front runner in accessing debt relief under the Heavily
Indebted Poor Country (HIPC) initiative. Therefore, Uganda has not run short of
resources to finance its development agenda.
Also, Uganda to a limited extent benefited in recent years from foreign direct investment
(FDI) which accounted for an average of about 3% of GDP between 1996 and 2008.
More recently the discovery of oil near Uganda‘s Lake Albert, has to be the most
important development in recent times with prospects for high FDI flows in the medium-
term.
2 Data on ODA for 2008 is not available.
4
1.4 Political economy dynamics underpinning DRM
The synopsis of the political economy legacies that have impacted DRM, as presented
in the subsections below, is based on Brautigam‘s (2008) analytical framework3, which
consists of the following five facets: (1) level of economic development and economic
structure; (2) societal factors: culture, values, trust and ‗tax morale‘; (3) war and taxes:
bureaucratic modernisation as a response to threat; (4) political institutions and tax
systems; and (5) taxation and the fiscal contract.
1.4.1 The economic structure is predominantly agrarian driven and hard to tax
In spite of two decades of steady economic growth, Uganda‘s economy ―remains more
reliant on subsistence agriculture and correspondingly less on high-productivity
manufacturing‖4 (IMF, 2009a). Furthermore, as observed in a DIFD (2008) publication:
―Agriculture by nature is difficult to tax, and so far the…sector has not made any
significant contribution to government revenue. Even with the commercialisation
drive that is underway, it is not expected that agriculture can be relied on for tax
revenue in near future. There are also views ... that taxing [farmers] will cripple
agriculture (discourage investment) and have disastrous economic fallout for
farmers who are already facing hardship‖
It appears that one major drawback in Uganda‘s era of economic recovery has been the
limited investments in economic infrastructure. In spite of liberalisation, only a few large
corporations have invested significantly in the Ugandan economy. For many years,
investments in physical infrastructure were limited to relatively small projects in social
services delivery, and rehabilitation and maintenance of historical facilities. Large
investments identified in transport, energy, property development and agricultural
production and agro-processing, have lagged behind for most of the years. Indeed it is
only in the past five years that large investments in energy, mining, tourism and roads
have been made.
However, Uganda has just entered a threshold of fiscal transformation, following the
discovery of substantial oil deposits, which have attracted considerable investments in
the last few years. Initial yields of oil production are anticipated in 2011, and full
commercial potential, and thereby revenue streams for government financing, are
expected in 2015. ―The country expects to earn US$ 2 billion a year from oil by 2015‖
(The Economist, 2010). It is not clear at the moment what the full implications for
3 Brautigam‘s framework is adopted because compared to others that were examined; it is judged to be
more comprehensive and elegant. However, like most others, its historical perspective derives too much from the emergence of the modern European state to be linearly applied to states that are legacies of colonial rule, such as Uganda. 4 Although over 70% of Uganda‘s population is employed directly or indirectly in agriculture, in 2009, the
services sector contributed close to 50% of GDP.
5
Uganda‘s economic structure and development financing mix will be given the imminent
substantial oil revenues.
1.4.2 A culture of conflict and distrust which contributes to low ‘tax morale’5
Many important facets of traditional culture among Uganda‘s diverse communities, have
withstood the onslaught of western culture. In this regard it has been suggested that
the tastes associated with that culture constrain the transit to consumerism associated
with economic development in the same way, for example, as in neighbouring Kenya.
As a consequence, many wealthy Ugandans have resisted full entry into the modern
monetary economy. In other words, a reliance on informal institutions for business
transactions remains comparatively high. Furthermore, many years of civil war and
ethnic tensions, have given rise to a culture of conflict and distrust in sections of the
society. As a matter of fact, sections of society consider the NRM to be hegemonic. In
addition, over the past decade, the government has been intermittently bedeviled with
high profile cases of public expenditure scandals and corruption in the public service. As
a result, trust in government, and between communities, is low. In these circumstances,
tax morale in Ugandan society is low.
1.4.3 Bureaucratic modernisation of the tax administration was a high priority following
the wars that brought NRM to power
In the decade following independence, Uganda benefited from a robust revenue
mobilisation bureaucracy, jointly developed by the defunct EAC (1967-1977). The
foundations of these structures, were inherited from the colonial East African Common
Services Organisation. The collapse of the EAC in the late 1970‘s was very disruptive to
the development of the revenue administration system. The decade of civil war that
followed sustained that disruption.
The final days of the Amin regime were epitomised by his declarations of war against
both Kenya and Tanzania. ―He clashed with President Jomo Kenyatta after making
absurd territorial claims to western Kenya and in 1978 made the mistake of declaring
war on Tanzania‖ (The Independent, 2003). To wage these wars, Amin had strived to
enter into alliances with rich Arab and Islamic regimes, and to an extent the Soviet
Union, to obtain the resources for war. Therefore, his regime did not give due attention
to DRM, and the development of an enabling bureaucracy. Therefore subsequent short-
lived regimes, as well as, the NRM did not inherit a viable tax administration
bureaucracy.
After its victory, the NRM government was cognisant of the high priority it needed to
accord to resource mobilisation, in order to sustain its operations as a modern state.
Also, since the NRM was not democratically elected, the expansion and intensification
5 In a society where ―tax morale‖ is high, there are low levels of tax evasion and avoidance. It is only in a
social culture where citizens generally appreciate their responsibility for sustaining state services and where they have a trust in their state institutions and leaders that ―tax morale‖ evolves.

6
of basic social services was central to achieving regime legitimacy among the
population. It is therefore no wonder that the NRM regime was a trail blazer among the
countries of the region in establishing an autonomous revenue authority (ARA), the
Uganda Revenue Authority (URA) in 1991, with high expectations of rapid growth in
DRM.
1.4.4 Political support for URA’s autonomy has waivered in recent years
Apparently, the NRM political elite led by President Museveni, strongly backed the
establishment of URA as an autonomous and integrated agency (Fjeldstad, 2005). The
NRM political leadership collaborated closely with, and took advice, from the Bretton
Woods Institutions and the British Government which provided substantial initial
technical support. At that point, there was a general consensus about the need to
insulate URA from both bureaucratic and political interference. It is in this context that
two Commissioner Generals of URA (1991-1997, 2001-2004), were expatriates. Several
top management positions were also filled by expatriates and funded by donors.
President Museveni is cited to have openly hailed the role of the expatriates in ensuring
the professionalism of the agency.
However, there was serious distrust and conflict between URA and the top political
leadership, including those in Ministry of Finance, Planning and Economic Development
(MoFPED). At the time the Value Added Tax (VAT) was introduced, URA staff were
suspected to be active in encouraging resistance by the general public (Therkildsen,
2004). Subsequently, with an explicit cue from the President, in 1998, MoFPED moved
to curtail the mandate and administrative autonomy of the URA‘s Board (Fjeldstad,
2005). Since then, URA has remained prone to close oversight and patronage by the
national political leadership.
In the latter context, it is also significant that the national political leadership in Uganda
has over the years, intervened on an ad hoc basis on matters touching tax policies and
administration. In particular, many tax incentives and exemptions have been imposed
on URA by political leaders outside formal tax policy formulation and administration
processes.
1.4.5 There is no semblance of a fiscal contract between government and its citizens6
The opportunities for even a semblance of a fiscal contract between Uganda‘s
taxpayers and the government/URA, have been severely curtailed in at least three
respects. First, so far, the tax base remains narrow, and taxpayers are largely confined
to a relatively small number of private sector enterprises, government as an employer
6 Fiscal contract has its genesis in agreements between European monarchies and the propertied class
and merchants that the latter would contribute to state coffers especially to fund war in return for specific benefits. In modern times a fiscal contract would be characterised by government pledges of specific socio-economic benefits to justify taxation. This is a more realistic proposition in a democratic dispensation.
7
and importers. The popular resistance to the introduction of the VAT in 1996, reflected
the absence of a fiscal contract. Yet since then, there does not appear to be any
evidence of any concrete initiatives to develop one. Such an initiative would necessarily
be led by the national political leadership.
A second factor is the success of the NRM regime in financing a large proportion of
public expenditure with external resources. Over the past two decades, external donor
support has accounted for about 20% to 50% of the public expenditure budget.
A third factor arises from a prevailing sense amongst taxpayers and potential taxpayers
that due to corruption and mismanagement, government has not been delivering value
for money with resources made available to it. According to a publication by the Private
Sector Foundation of Uganda (2009) ―85% of both taxpayers and professionals believe
[low compliance is] …the key cause of low [DRM]… Most respondents…were generally
pessimistic [about]‖ how funds are used‖. It is no surprise therefore that the Minister of
Finance, Planning and Economic Development in her 2009/10 budget speech
mentioned the problem of compliance. Specifically, ―compliance remains a challenge,
as we undertake reforms in tax administration‖.
1.5 Fiscal governance drivers, results and trajectory
The NRM regime‘s legitimacy has remained predicated more on development results
than on liberal democratic ideals. Accordingly, President Museveni has been
preoccupied with economic development in terms of expanding access to public service
delivery (including infrastructure development) and modernisation of the economy.
Thus, on the one hand, the demand for ever expanding fiscal space to meet public
service delivery targets has been sustained over the years. On the other hand, the
President is personally involved in the extensive award of tax incentives and
exemptions to potential investors on an ad hoc basis ((Mwenda and Atuhaire, 2006);
(Sseppuya, 2005)). Fortunately for Uganda, external resources have been available to
close the financing gap in successive years.
The persistent large gap between domestic revenues and the public expenditure
framework, has given ample room for international development organisations to
exercise considerable influence in Uganda‘s fiscal governance. For example, according
to Therkildsen (2004) in addition to their involvement in economic policy:
―Donors’ fingerprints on tax policy and administration are obviously numerous and
deep… [they] participate in setting revenue targets…[This involvement] has
[forced] URA to concentrate on the larger known taxpayers‖.
Ayoki et al (2008), suggest that ―high levels of development aid [could] be
a…disincentive to making full use of domestic resources for revenue generation‖. The
recent African Peer Review Mechanism (APRM) (2009) report on Uganda is another

8
source that confirms that excessive reliance on external financing is an important fiscal
governance driver in Uganda in that it ―impinges on the sovereignty of the country and
constrains its economic budgetary choices‖. This concern has been previously raised by
Uganda‘s Members of Parliament, prompting government to initiate a reduction in aid
contributions to its budgets, and ambitious targets to grow domestic resources.
The discovery of oil has injected a new dynamic in Uganda‘s fiscal governance.
Already, there is clamour for control or influence on access and use of the oil revenues.
Also, aspirations for the rapid growth in public service delivery and poverty reduction,
have been considerably raised by the prospect of oil wealth – ―Oil executives and
loyalists of Uganda‘s President…say the bonanza, offers a chance to overhaul the
country‘s rickety infrastructure and to train a professional workforce‖ (The Economist,
2010). As the IMF (2009a) observes there is a case for fiscal restraint to curtail pressure
to spend when government starts to receive revenues from oil. Therefore, to counter
this risk ―a specific line on oil will be introduced in the National Accounts and
incorporated into the Medium Term Fiscal Framework‖.
The management of the imminent substantial oil revenues will be the most critical
variable in Uganda‘s fiscal governance trajectory in the medium to long-term. There
appears to be little doubt that in five years time, these revenues will vastly add to the
level of domestic resources. This development will in turn, generate four major
outcomes. In one respect, whether or not these revenues are managed by URA will
impact either positively or negatively on the capacity and performance of URA to collect
other revenue. Second, oil revenues may also serve to reduce Uganda‘s reliance on
external resources. As a consequence, the relationship between Uganda and
international development organisations will be redefined. Third, there is a distinct
prospect that new revenue streams will in all probability, stimulate the acceleration of
the modernisation of the economy and poverty reduction. Fourth, the availability of this
new source of development resources, and the concurrent modernisation of the
economy, may in the long-term dampen the prevailing propensity of political leaders to
make ad hoc awards of tax incentives and exemptions7. Therefore, the fiscal
governance trajectory for Uganda holds a lot of promise.
7 There is a view that the discovery of oil could in the short-term lead the scaling-up of exemptions
(through concessions).
9
2 Trends in the tax system
2.1 Changes in tax policies over the years
In the early years following independence, Uganda relied on unified tax policies and an
administrative system jointly administered by the initial three members of the EAC.
However, there were changes even before the collapse of the EAC. In 1971 and 1972,
the three governments held discussions ―on how to improve income tax collection in a
manner equitable‖ to all, leading to a decision to ―place the responsibility of income tax
in the hands of each national government‖ (Osoro, 1993). As a consequence, Uganda
legislated its own Income Tax Decree No. 1 of 1974 ―which [over the next twenty years
was frequently and extensively amended‖ (Holmes, 2006). There were no major
changes to the tax laws until the 1990s. Thereafter, there were two main episodes in tax
policy reforms as presented below.
2.1.1 Fundamental changes to tax policy in the 1990s
Despite popular resistance, Uganda was one of the first countries in the EAC to
introduce the VAT in July 1996 at a rate of 17%, replacing the sales tax and commercial
transaction levy (CTL). According to the IMF (1999) copies of the sales tax and CTL
legislation were in limited supply. Furthermore, legislation had undergone numerous
amendments, and only a few were conversant with their requirements. The new VAT
law: was ―generally easier to understand and interpret, [and therefore] huge strides
were made to help compliance and improve transparency‖; and removed the Minister of
Finance‘s power to grant exemptions on a discretionary basis (IMF, 1999). Under the
Act certain supplies were VAT exempt (e.g. milk, maize, dental, medical, financial and
insurance services, passenger transportation etc.).
It was not until 1997 that the GoU promulgated a new Income Tax Act with the
objectives of levying tax on a residence basis, ensuring simplicity and promoting a flat
tax rate scale (Holmes, 2006). Again this new act removed the Minister of Finance‘s
power to grant discretionary exemptions. It also: provided for accelerated and simplified
depreciation allowances on productive assets; removed tax holidays offered under the
investment code; introduced a presumptive tax for businesses with a turnover of less
than UShs 50 million; eliminated exemptions (e.g. for public servants and parastatals)
and/or made them more stringent; introduced a capital gains tax on certain business
transactions; and streamlined the withholding tax regime (IMF, 1999).
During the 1990s, as a means of promoting trade, GoU gradually abolished export taxes
(Cawley and Zake, 2010). It also embarked on tariff reform whose policy objectives
evolved around simplification of the structure, reducing the number of rates, the removal
of exemptions and elimination of bans on the importation of certain goods (e.g.
cigarettes, beer, sodas etc.). ―However, as import duty rates were being lowered, ad

10
valorem excises were imposed…with the dual objective of allowing some degree of
protection‖ for local firms and recouping revenue foregone (IMF, 1999).
2.1.2 Major tax policies from 2000 to 2008
The major tax policy changes in the decade up to 2007/08 have primarily evolved
around VAT and income tax. During this period, the main policy changes around VAT
were the following:
To encourage the development of Information and Communications Technology (ICT) services government removed VAT on computers and computer software in 2002/03 and 2003/04 respectively;
To minimise any revenue leakages arising from tax evasion, a new rule requiring
government to only issue contracts to suppliers who are VAT registered, became
effective in 2002/03.;
As a means of widening the tax base: accommodation in hotels and tourist
venues which were previously exempt from VAT, became taxable at the VAT the
standard rate from 2003/04;
In 2004/05 the VAT Act was amended to exempt constructors of roads and bridges, and providers of consulting services to such construction contractors. This had the effect of reducing the prices charged to government for road construction, as there was no longer any VAT element;
In line with government‘s deliberate policy of increasing the proportion of the
national budget that is financed by domestic revenue, the standard rate of VAT
went up to 18% with effect from 1 June 2005;
In 2006/07, the government zero rated VAT on Liquid Petroleum Gas to increase
its affordability given its use as an alternate energy source for lighting and
cooking. To promote the use of condoms in the fight against HIV/AIDS and
animal husbandry, GoU also exempted contraceptive sheaths and acaricides;
As a means of promoting tax morality and enhancing revenue collections,
government (in 2007/08) also offered non-compliant taxpayers an amnesty on
penalties and interest for principal taxes (i.e. under the Customs and Excise,
Income Tax, VAT and Stamps Acts). Taxpayers were required to voluntarily
disclose and pay their taxes by 31 December 2007.
The major changes to income tax policy since then include the following:
In 2001/02, on the one hand to widen the tax base, interest payable on Treasury
bills became taxable. On the other hand, to promote the development of a stock
11
exchange, expenses relating to initial public offerings became an allowable tax
expense;
In 2003/04, to promote exports, the government indicated it would provide firms
operating in export processing zones with various incentives such as a ten-year
corporation tax holiday, duty exemption on raw materials, plant and machinery
and other inputs etc.;
In 2005/06 to expand access to finance, interest earned by financial institutions on loans granted to persons engaged in the agriculture sector was exempted from income tax;
The tax amnesty of 2007/08 (see above) also covered income tax. Also, to
promote exports and thereby stimulate economic growth in 2007/08 the
government offered various incentives, including a 10 year tax holiday to
companies engaged in value added exports, which is limited to export of finished
consumer and capital goods.
Changes in customs policies and administration have been driven by the East African
Community Customs Management Act of 2004, which underpins the establishment of
common external tariffs (CETs) and elimination of internal tariffs. It also brought about
the: harmonisation of customs principles and procedures; and removal of suspended
duty.
Excise duties are regulated under the Excise Management Act of 1970. The Act is
levied on beer, wines, spirits, soft drinks, cigarettes and fuel which are manufactured in
or imported into Uganda, as well as mobile airtime. Over the years, there have been
modest increases and decreases in the rates levied for certain goods and services.
2.2 Institutional changes
URA was the second revenue authority to be established in Africa in 1991, following the
enactment of the URA Act Cap 196. The establishment of URA was ―an attempt to
integrate central government taxes under one management, and to improve revenue
collection through enhanced autonomy, acquisition of skilled staff, increased integrity
and effective use of automated systems‖ (Ayoki, 2008). From its launch, URA‘s
operations have been financed by Parliamentary appropriations.
The authority is led by a Commissioner General who reports to a Board of Directors.
The Board of Directors ―is [URA‘s] policy making body and has general oversight‖

12
responsibility, and is accountable to the Minister of Finance8. MoFPED sets URA‘s
revenue targets on an annual basis.
Following a restructuring exercise undertaken in 2004, six departments within URA have
responsibility for the following day-to-day operations: (1) the Commissioner General‘s
office which in addition to maintaining executive control, is charged with managing
research and planning, and corporate and public affairs; (2) board and legal affairs; (3)
collecting and accounting for international trade taxes; (4) registration, audit,
assessment, collection and accounting for domestic revenues; (5) the provision of
various corporate services (e.g. finance, administration, human resources, ICT); and (6)
internal audit and tax investigations. Also, URA has a training school which runs both
technical as well as ICT courses.
2.3 Changes in the administrative systems
URA employs around 2,000 staff. Under the Act, URA has freedom to pay its staff
competitive salaries. At its launch, ―substantial salary increases to staff that moved to
the URA meant that they were relatively well paid to start with – by a factor of 8 to 9 –
compared to most public-sector employees‖ (Therkildsen, 2004). Also, ―bonuses as a
percentage of their salaries were a potential lure when URA exceeded tax collection
targets, but this was only done once, with a 10% bonus in 1998/99‖ (Robinson, 2004).
Furthermore, there have been no substantial salary increments for managerial staff
since 2004/05.
The development of URA‘s administrative systems has been guided by a tax
modernisation initiative (see Section 2.5). The administrative systems that are
operational (also see Annex D) include:
A bespoke developed Integrated Tax Administration System (eTax) in the
Domestic Tax Revenue Department covering all taxes and non-tax revenues
collected by URA. The eTax‘s functionality was recently extended to cover
electronic filing (eFiling) and payments;
The Automated System for Customs Data ++ (ASYCUDA++) in customs for
direct trader input so that importers can lodge declarations from their bases.
Further, to support the effective cargo tracking between the revenue authorities
of the EAC, URA has implemented the Revenue Authority Digital Data Exchange
(RADDEX) system;
URA has also recently introduced a call centre with a toll free line which operates
on weekdays and responds to any queries lodged at the authority‘s new
interactive website (http://ura.go.ug/uraweb/index.jsp);
8 http://www.ugrevenue.com/administration/ [Accessed 28 March 2010].
13
URAnet for internal communications among staff.
2.4 Fiscal decentralisation and taxation by local governments
Uganda was widely seen as one of the forerunners of decentralisation in Africa during
the 1990s. Decentralisation in Uganda is based on the devolution of powers, functions
and responsibilities to popularly elected local governments. Devolution is not only aimed
at the current 112 districts in the country (as at August 2010), but also at the sub-county
level and other sub-district levels (including the village level). Local governments are
assigned responsibility to deliver key social and economic services, including primary
and secondary education; public health services; agricultural extension services; roads;
water and sanitation. Corresponding with the importance of the functions assigned to
them, local governments receive almost one-third of the country‘s public financial
resources (Bitarabeho, 2008; Ministry of Local Government 2009).
In principle, local governments in Uganda: are highly autonomous. In practice, however,
local governments are increasingly constrained by inadequate resource discretion and
administrative re-centralisation9. Own source revenues have declined considerably over
the past ten years, in large part due to the abolition of the main local revenue source,
the graduated tax. As a result, local governments now receive 90% of their resources in
the form of intergovernmental fiscal transfers. The overwhelming majority of these
intergovernmental fiscal transfers are in the form of conditional grants.
Available local revenue data indicate that own source revenues for the district level
(excluding sub-country revenues) has decreased not only in relative terms in Uganda,
but declined considerably in nominal terms, from UShs 80.1 billion in 2003/04 to UShs
39.5 billion in 2006/07 (Steffensen 2008). The main contributing factor to the drop in
local revenue collection was the abolition of the graduated tax on 1 July 2005. Also, the
rest of Uganda‘s local government revenue system has been performing poorly. In part,
this has been due to the tax structure; for instance, the many tax exemptions in the
property rates have added to the funding gaps amongst the urban authorities
(Steffenson 2008).
A new Local Service Tax (LST) and Local Government Hotel Tax (LGHT) system was
adopted from FY 2008/09, but the implementation of these new revenue sources have
been surrounded by numerous technical and political obstacles. Even when fully
implemented, the revenue yield from these new sources is expected to be quite limited
compared to the graduated tax system. A Local Government Finance Commission
survey in 2007/08 established that local governments collected UShs 4.8 billion from
LST and LGHT compared to the projected UShs 67 billion that the taxes were estimated
to be contribute to local government revenues annually.
9 Whereas previously the Chief Administrative Officer was appointed by the District Service Commission,
the appointment and supervision of CAOs was re-centralised by the central government during the Constitution reforms adopted in July 2005.
14
2.5 Reforms sequencing, implementation and results
An initial series of administrative reforms took place following the establishment of URA.
The reform focus in these early years was on breaking the culture of corruption by
screening staff, strengthening URA‘s capacity (Fjeldstad, 2005) and to a limited extent,
modernising systems (IMF, 1999). However, corruption remained pervasive leading to
the appointment of an independent inquiry into URA led by Justice Julia Sebutinde in
2002. The inquiry‘s report was, however, questioned by Parliamentarians, and nullified
by the High Court in 2004 (Fjeldstad, 2005). Still, in 2004/05 GoU appointed a new
Commissioner General and Board. Since then the URA has undergone two phases of
reform: (1) structural and further institutional reforms; and (2) a programme of
modernisation.
2.5.1 Sequencing and implementation of reforms
As part of its post 2005 reforms, structural changes evolved around streamlining URA‘s
structure which had become top heavy as well as hierarchical – the new structure is
described in Section 2.2 . Thereafter, URA‘s management also continued to address
the problem of staff integrity. In particular, in 2006, it launched an Integrity
Enhancement Programme (IEP) which, for instance: introduced an internal process for
investigating reported cases of misconduct; sensitised staff on ethics; and instituted a
code of conduct.
From 2006, URA‘s reforms are specified in its ‗Modernisation Plan‘ covering the period
from 2006/07 to 2009/10. The reforms have received support (US$15 million) from
development partners, including: Belgium; China; DANIDA; DFID; IMF; JICA,
Netherlands; SIDA; and the World Bank. The modernisation programme is
comprehensive, and seeks to achieve the following ten objectives (URA, 2009):
A strategy development process backed up by a disciplined ―plan-implement-
monitor-review‖ cycle to ensure achievement of results;
User friendly, simplified, cost effective and transparent processes;
Quality client service characterised by open, responsive and pro-active customer
care programmes;
A dynamic organisational structure that adapts to operational demands;
A highly skilled and motivated work force committed to delivering to the highest
professional standards;
Application of ICT and other productivity tools in a manner that integrates people,
process and technology for greatest value;
15
A safe and healthy working environment;
A regulatory and policy framework that supports continuous improvement;
Use of analytical tools and other modern management techniques to enhance
compliance and minimise resource wastage;
A corporate culture across all levels of URA that values service excellence.
Modernisation reforms are substantially complete. Key results under the modernisation
phase include the following:
Business processes in customs have been reengineered, new procedures drawn
up, and staff retrained. ASYCUDA++ and RADDEX are functioning (see Annex
D);
Business processes in domestic tax have been reengineered, new procedures
drawn up, and staff retrained. The eTax system is in operation (see Annex D),
however, work is ongoing to extend its functionality (e.g. to cover audits, refunds,
investigations etc);
Certain aspects of URA‘s corporate services have been modernised. For
example, URA has a corporate plan in place. M&E of the corporate plan is
supported by the corporate scorecard system (see Annex D);
As a means towards enhancing integrity, a revised staff code of conduct and
whistle blowing policy were developed in 2009. Furthermore, URA is proactive in
communicating issues centring on integrity both internally and externally;
URA has disseminated a taxpayers‘ charter with clear standards of service;
As a means for improving access to information, various literature on tax has been translated into eight languages. Further Public and Taxpayer Education services regularly hold tax clinics to obtain feedback on taxpayers‘ needs.
It is noteworthy that the reforms pursued by URA have been primarily administrative
oriented. In other words, they have been short in policy innovations and prescriptions.
This is not surprising because there is apparently no rigorous and comprehensive
research and analysis of the tax policy environment and system such as the work of the
Katz Commission in South Africa which lasted for five years. This may in part explain
the minimal impact of the reforms on tax revenue as a percentage of GDP, tax effort
and tax gap (see Section 3.2.4).

16
Furthermore, while URA‘s reforms were administratively comprehensive, generally, they
were neither focussed nor driven by specific performance outcomes such as improved
enforcement, a wider tax base etc. ―The main focus was on meeting revenue targets
and not enough was done to embed non-revenue performance objectives and
indicators‖ (Cawley and Zake, 2010). Excessive tax exemptions may also have
significantly cancelled out the prospective impact of the reforms on tax revenue
performance. In addition, Ndulu et al (2007) attribute a slow growth in tax revenue in
both Uganda and Tanzania as a percentage of GDP to emanate ―chiefly from fiscal
corruption‖.
17
3 Domestic revenue performance
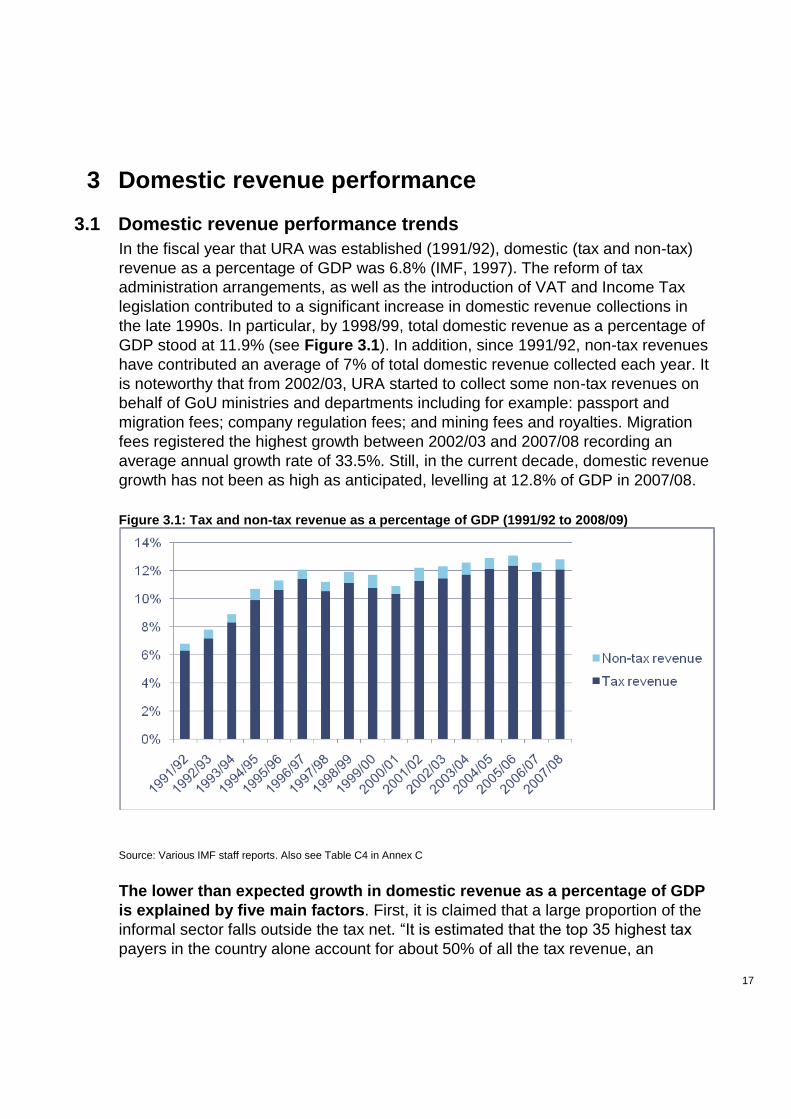
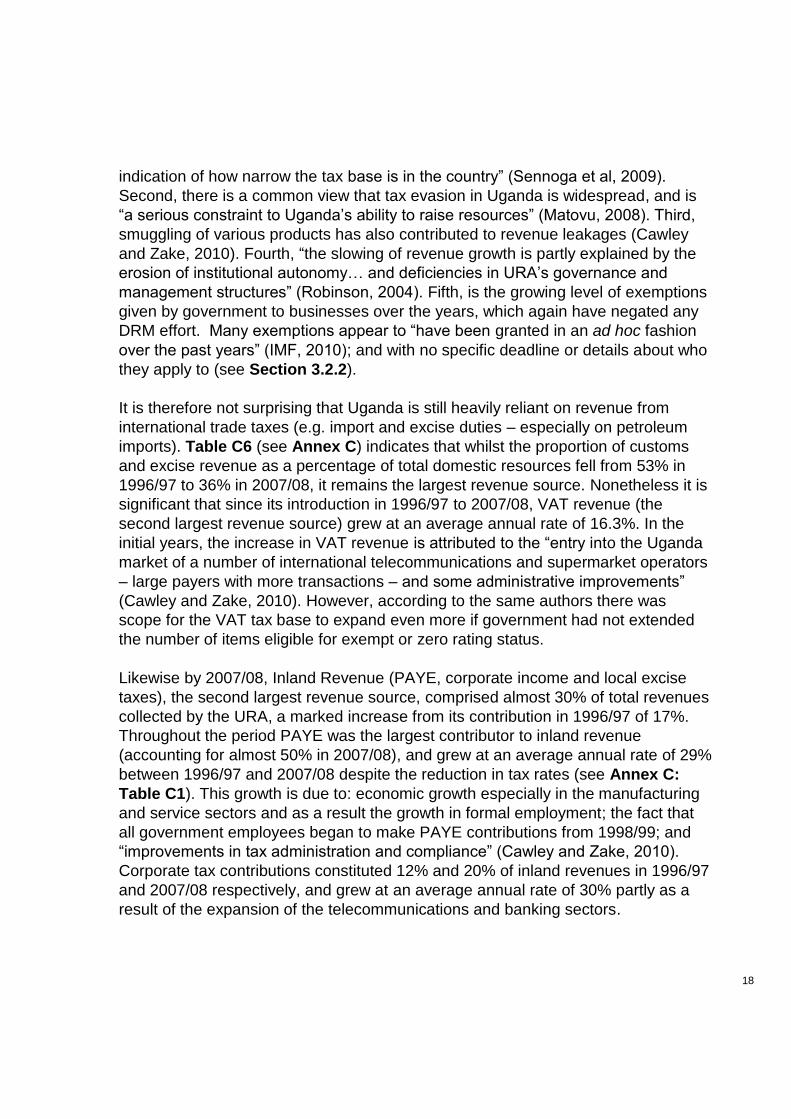
3.1 Domestic revenue performance trends
In the fiscal year that URA was established (1991/92), domestic (tax and non-tax)
revenue as a percentage of GDP was 6.8% (IMF, 1997). The reform of tax
administration arrangements, as well as the introduction of VAT and Income Tax
legislation contributed to a significant increase in domestic revenue collections in
the late 1990s. In particular, by 1998/99, total domestic revenue as a percentage of
GDP stood at 11.9% (see Figure 3.1). In addition, since 1991/92, non-tax revenues
have contributed an average of 7% of total domestic revenue collected each year. It
is noteworthy that from 2002/03, URA started to collect some non-tax revenues on
behalf of GoU ministries and departments including for example: passport and
migration fees; company regulation fees; and mining fees and royalties. Migration
fees registered the highest growth between 2002/03 and 2007/08 recording an
average annual growth rate of 33.5%. Still, in the current decade, domestic revenue
growth has not been as high as anticipated, levelling at 12.8% of GDP in 2007/08.
Figure 3.1: Tax and non-tax revenue as a percentage of GDP (1991/92 to 2008/09)
Source: Various IMF staff reports. Also see Table C4 in Annex C
The lower than expected growth in domestic revenue as a percentage of GDP
is explained by five main factors. First, it is claimed that a large proportion of the
informal sector falls outside the tax net. ―It is estimated that the top 35 highest tax
payers in the country alone account for about 50% of all the tax revenue, an
18
indication of how narrow the tax base is in the country‖ (Sennoga et al, 2009).
Second, there is a common view that tax evasion in Uganda is widespread, and is
―a serious constraint to Uganda‘s ability to raise resources‖ (Matovu, 2008). Third,
smuggling of various products has also contributed to revenue leakages (Cawley
and Zake, 2010). Fourth, ―the slowing of revenue growth is partly explained by the
erosion of institutional autonomy… and deficiencies in URA‘s governance and
management structures‖ (Robinson, 2004). Fifth, is the growing level of exemptions
given by government to businesses over the years, which again have negated any
DRM effort. Many exemptions appear to ―have been granted in an ad hoc fashion
over the past years‖ (IMF, 2010); and with no specific deadline or details about who
they apply to (see Section 3.2.2).
It is therefore not surprising that Uganda is still heavily reliant on revenue from
international trade taxes (e.g. import and excise duties – especially on petroleum
imports). Table C6 (see Annex C) indicates that whilst the proportion of customs
and excise revenue as a percentage of total domestic resources fell from 53% in
1996/97 to 36% in 2007/08, it remains the largest revenue source. Nonetheless it is
significant that since its introduction in 1996/97 to 2007/08, VAT revenue (the
second largest revenue source) grew at an average annual rate of 16.3%. In the
initial years, the increase in VAT revenue is attributed to the ―entry into the Uganda
market of a number of international telecommunications and supermarket operators
– large payers with more transactions – and some administrative improvements‖
(Cawley and Zake, 2010). However, according to the same authors there was
scope for the VAT tax base to expand even more if government had not extended
the number of items eligible for exempt or zero rating status.
Likewise by 2007/08, Inland Revenue (PAYE, corporate income and local excise
taxes), the second largest revenue source, comprised almost 30% of total revenues
collected by the URA, a marked increase from its contribution in 1996/97 of 17%.
Throughout the period PAYE was the largest contributor to inland revenue
(accounting for almost 50% in 2007/08), and grew at an average annual rate of 29%
between 1996/97 and 2007/08 despite the reduction in tax rates (see Annex C:
Table C1). This growth is due to: economic growth especially in the manufacturing
and service sectors and as a result the growth in formal employment; the fact that
all government employees began to make PAYE contributions from 1998/99; and
―improvements in tax administration and compliance‖ (Cawley and Zake, 2010).
Corporate tax contributions constituted 12% and 20% of inland revenues in 1996/97
and 2007/08 respectively, and grew at an average annual rate of 30% partly as a
result of the expansion of the telecommunications and banking sectors.

19
Another tax policy that proved to be a success was the tax amnesty offered by GoU
in 2007/08. The amnesty not only registered new taxpayers but also GoU realised
UShs 41 billion (about US$18 million) from the voluntary disclosures. To further
encourage entities to clean up their books, in 2008/09 the Minister of Finance
proposed to write off arrears of duty and tax relating to the principle, interest and
penalties that had accrued to 30th June 2002. This proposal was in order in that it
encouraged taxpayers to start from a clean slate. Also it was in line with the Income
Tax Act in that the URA can not go beyond 5 years back in its audit coverage.
3.2 Tax administration benchmarks
3.2.1 Performance efficiency
Cost of collection. Between 1995/96 and 2007/08 the average cost of collection as
a percentage of total domestic revenues was 3.4% p.a. The cost of collection as a
percentage of revenue has been on the decline since 1995/96, except in years
when URA has incurred high capital expenditures (e.g. in 2003/04, when it procured
heavy duty scanners for the Customs and Excise Department) (see Annex C:
Table C2). However, between 1995/96 and 2007/08, tax administration costs grew
at an average annual rate of 15.1%.
Organizational structure. URA is organised along functional lines. It established a
large taxpayers‘ office (LTO) in November 1998. The LTO currently serves 667
large taxpayers. In 2008, large taxpayers constituted 1% of the entire taxpayer
base, but contributed 72% of tax revenues10.
Ease of paying taxes. Uganda has the second best rating among the EAC
countries, (after Rwanda), in terms of the World Bank‘s Doing Business Ranking
with respect to, ease of paying taxes – ranking 61st out of 183 countries in 2010,
which is a marked improvement on its position in 2009 of 71st place. According to
the World Bank‘s 2010 Paying Taxes report, a company is required to make 32
payments a year which are below the SSA average of 37.7 p.a., but above the
OCED average of 12.8 a year (see Annex C: Table C11).
Tax arrears. URA reports that tax arrears at the end of 2007/08 were UShs 162
billion (or 4.8% of total revenues). Key informants indicate that tax arrears increased
by 439.8% between 2006/07 and 2007/08, partly due to the zealous charging of
penalties by some URA officers. URA is addressing this issue to ensure that
penalties are only levied when warranted. Also, in 2006/07, GoU wrote off tax
10
Source: The International Tax Dialogue: Tax Administration in Selected African Countries: 2009.
20
arrears of UShs 120 billion arising from government‘s commitment to pay tax on
donor funded projects.
Tax compliance. Uganda has a very low VAT gross compliance ratio (VATGCR) of
26.50 in comparison to World and SSA averages of 65.48 and 38.45 respectively11.
This low rate may be due to the significant number of exemptions. From an
economic efficiency perspective, a moderate VAT rate with a broad consumption
base and few exemptions is always preferred to a high rate with many exemptions.
Cawley and Zake (2010) also indicate that VATGCR has remained low because
―administration capacity and compliance did not improve as much as expected‖.
Further, Uganda‘s CIT revenue productivity (CITPROD) and personal income tax
(PIT) productivity (PITPTOD) measures of 0.03 and 0.11, respectively, indicate that
Uganda uses these taxes less efficiently in generating revenue than World
averages of 0.13 and 0.14 for CITPROD and PITPROD, respectively. The low
revenue yields are partly attributable to low levels of voluntary compliance by
taxpayers12.
3.2.2 Allocative efficiency
Between 1991/92 and 1997/98, the levels of corporate tax collections were reduced
as a result of the investment code, which was subsequently abolished and replaced
with depreciation and tax allowances (e.g. for depreciation). Furthermore, there
have been various exemptions offered over the years, such as the ten year tax
holiday introduced in 2007/08 (see Section 2.1.2). Although the associated loss in
tax revenues has not been determined through rigorous study, key informants
suggest Uganda could be foregoing revenue of at least 2% of GDP as a result of
such incentives and exemptions.
3.2.3 Performance equity
The World Bank‘s 2010 Paying Taxes report indicates that the ‗total tax rate‘ as a
percentage of profit of 35.7% is significantly lower than the OECD average of
44.5%, and lower than the SSA average of 67.5%. Furthermore, a study by Matovu
et al (2009) intimates that PAYE rates are relatively progressive for most individuals
– ―this perhaps explains why PAYE is one of the taxes where government collects a
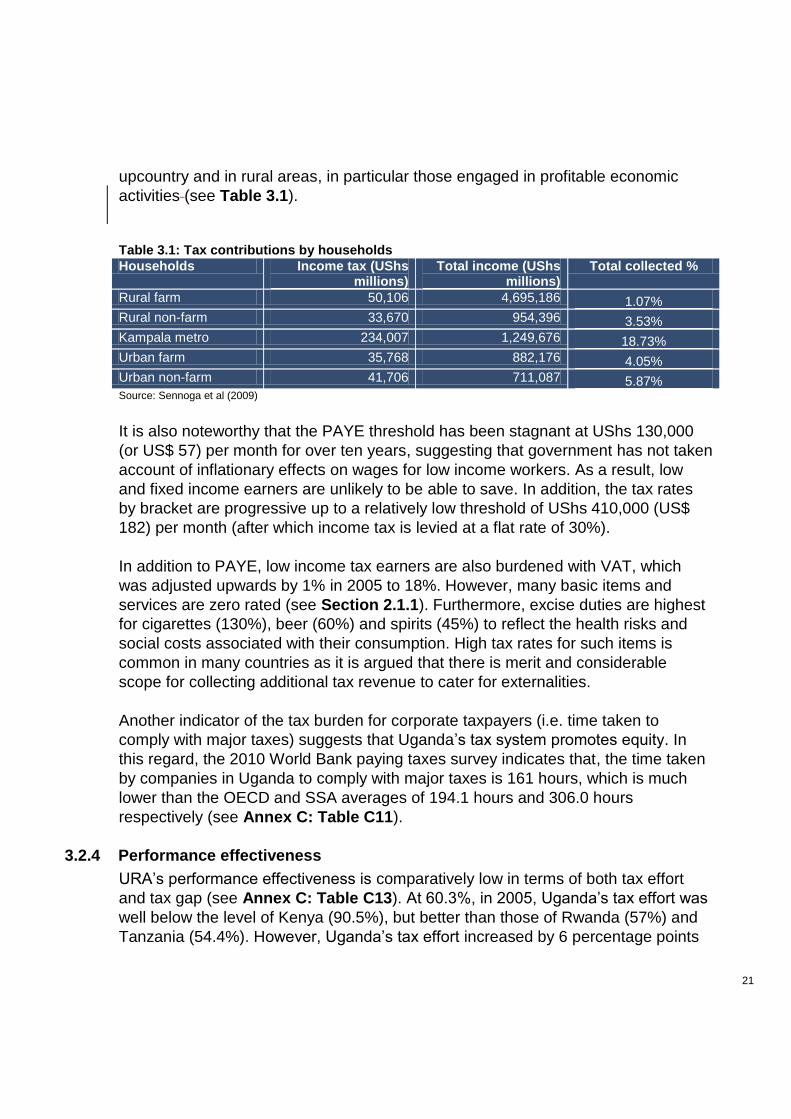
lot of revenue‖. However, another study by Sennoga et al (2009) reports that the
highest PAYE burden falls on households based in Kampala, and suggests that
there is scope to spread the burden by taxing households which are based
11
http://www.fiscalreform.net/index.php?option=com_wrapper&Itemid=132 [Accessed 2 February 2010]. 12
www.cabri-sbo.org/ [Accessed 7 July 2010].
21
upcountry and in rural areas, in particular those engaged in profitable economic
activities (see Table 3.1).
Table 3.1: Tax contributions by households
Households Income tax (UShs millions)
Total income (UShs millions)
Total collected %
Rural farm 50,106 4,695,186 1.07%
Rural non-farm 33,670 954,396 3.53%
Kampala metro 234,007 1,249,676 18.73%
Urban farm 35,768 882,176 4.05%
Urban non-farm 41,706 711,087 5.87% Source: Sennoga et al (2009)
It is also noteworthy that the PAYE threshold has been stagnant at UShs 130,000
(or US$ 57) per month for over ten years, suggesting that government has not taken
account of inflationary effects on wages for low income workers. As a result, low
and fixed income earners are unlikely to be able to save. In addition, the tax rates
by bracket are progressive up to a relatively low threshold of UShs 410,000 (US$
182) per month (after which income tax is levied at a flat rate of 30%).
In addition to PAYE, low income tax earners are also burdened with VAT, which
was adjusted upwards by 1% in 2005 to 18%. However, many basic items and
services are zero rated (see Section 2.1.1). Furthermore, excise duties are highest
for cigarettes (130%), beer (60%) and spirits (45%) to reflect the health risks and
social costs associated with their consumption. High tax rates for such items is
common in many countries as it is argued that there is merit and considerable
scope for collecting additional tax revenue to cater for externalities.
Another indicator of the tax burden for corporate taxpayers (i.e. time taken to
comply with major taxes) suggests that Uganda‘s tax system promotes equity. In
this regard, the 2010 World Bank paying taxes survey indicates that, the time taken
by companies in Uganda to comply with major taxes is 161 hours, which is much
lower than the OECD and SSA averages of 194.1 hours and 306.0 hours
respectively (see Annex C: Table C11).
3.2.4 Performance effectiveness
URA‘s performance effectiveness is comparatively low in terms of both tax effort
and tax gap (see Annex C: Table C13). At 60.3%, in 2005, Uganda‘s tax effort was
well below the level of Kenya (90.5%), but better than those of Rwanda (57%) and
Tanzania (54.4%). However, Uganda‘s tax effort increased by 6 percentage points
22
between 2001and 2005. During the same period, Uganda, also managed to reduce
its tax gap by 1 percentage point to 7.8% of GDP. Still, there is considerable scope
to further reduce the tax gap.
URA has been proactive in soliciting feedback on its performance with a view to
improving the effectiveness of tax administration. Soliciting feedback on perceptions
about service delivery, and the integrity of URA, appears to have been of particular
importance in recent years. An independent integrity survey of 444 taxpayers
commissioned by URA in 2008, confirms views expressed in the literature, and by
key informants around revenue performance (RDC, 2009). For example ―tax
evasion in general was perceived to be a major problem in tax collection‖.
3.3 Summary of overall trends
Uganda achieved considerably improved levels of domestic revenue in the first seven years following the establishment of URA - with tax and non tax revenue collections rising by 5.1 percentage points to 11.9% of GDP in 1998/99. Much of this growth is attributable to the growth of the economy following many years of conflict, and more effective in collection by URA. However, in subsequent years revenue collections stagnated as a result of smuggling and tax evasion. The growing level of incentives and exemptions granted in recent years has further undermined Uganda‘s revenue potential, and perhaps explains the sizeable tax gap.
23
4 Challenges and issues
4.1 An introduction to the challenges and issues
Chapter 2 sought to demonstrate the considerable efforts that have gone into
modernising the tax system in URA, with a view to realising its vision ―to be a model
for best practices and innovation in revenue services‖. However, major challenges
will need to be addressed for this vision to be realised and sustained. These
challenges and issues are expounded on in the remainder of this chapter.
4.2 Ensuring the efficacy of tax incentives and exemptions
According to some key informants, tax revenue as a percentage of GDP could
easily go up to 16%, if, some of the revenue negating measures, particularly
incentives and exemptions were removed. GoU has undertaken to draw up ―a
register of all existing incentives and exemptions…their cost [computed]—in terms
of lost revenue—and net economic impact quantified‖ (IMF, 2010). It is anticipated
that government will abolish unproductive tax expenditures from 2010/11. The
elimination of non-value adding incentives and exemptions will however, demand
the resolve and commitment of Uganda‘s political leadership.
4.3 Widening the tax base
The predominance of a large informal sector that is outside the tax net, under
declarations, evasion and smuggling are challenges that commonly arise in the
literature and discussions on Uganda‘s tax system. The problem of smuggling is
being addressed through measures such as heightened intelligence (e.g.
RADDEX), and the introduction of customs clearances at specific border points.
However, the issues around the informal sector, under declarations and evasion are
best addressed through one or more of the following: (1) an exercise to quantify the
size of the informal economy; (2) enforcing compliance; (3) the availability of a
functioning land registry system which provides URA with third party information;
and (4) the introduction of a national identification (ID) system. The development of
a land registry system is ongoing under a World Bank financed Private Sector
Development Project. In addition, there are indications that the national ID project is
back on track.
4.4 Developing and maintaining capacity for tax policy management
It was suggested in Chapter 2 that the tax reforms in Uganda are weak in terms of
policy innovations and prescriptions, and that this may underlie the minimal impact
of the reforms on DRM. It is also the case that some key informants to the study
indicated that the tax policy function is weak. In this context there is a view that
24
more could be done to build and sustain tax policy capacity in Uganda – particularly
in supporting the nation to increase its revenue as a percentage of GDP. Key
informants proposed that one way of building and sustaining this capacity, would
be, to promote knowledge sharing in the region. Another approach proposed would
be to transfer staff between MoFPED and URA. But when this approach has been
tried in the past, the large differences in salaries between the two institutions, has
created a problem around motivation. In this latter regard, an anonymous source
from MoFPED is quoted as having said that:
―The salary disparities paid by the same government to its workers is creating
discontent among the lowly paid workers in the civil service yet they do almost
the same work and are qualified. According to this official there is no
justification in paying workers in statutory bodies higher salaries (which are
nearly 70% higher) compared to their counterparts working in ministries‖
(Habuti and Masinde, 2009).
4.5 Building and sustaining management capacity in URA
There are two potential obstacles to building and sustaining management capacity
in URA. First, is that the positions of Commissioner General, Commissioners and
Assistant Commissioners have fixed term limits, following which incumbents are
prevented from serving any longer. There is therefore, a danger that specialised
skills and institutional knowledge, are lost each time such staff depart from the
organisation. Second, is the issue of remuneration, which has not been adjusted for
senior staff and personnel in professional and technical positions since 2004/05.
With respect to this latter issue, it would appear that the salaries of URA staff have
been politicised, especially since URA‘s salaries are perceived to be high when
compared to those offered to public servants. As a result, some key informants
indicated that URA has been unable to retain specialised skills in areas such as ICT
and audit.
4.6 Minimising corruption in tax collection
In 2009, URA was ranked as the second and seventh most corrupt public institution
in Uganda, and in the three EAC countries (of Kenya, Tanzania and Uganda)
respectively (Transparency International, 2009). URA ―was the only tax authority in
the region to appear among the top five institutions in their respective country index‖
(Transparency International, 2009).
In its corporate plan URA acknowledges that ―there is a perception among the
public that to some extent corruption still exists within the organisation‖.
Furthermore, the 2008 integrity baseline survey commissioned by URA indicates
25
that ―a good number of respondents reported that they had experienced or seen
URA officers engage in improper behaviour‖ (RDC, 2009). Furthermore, the report
suggests that URA still needs to ensure that it strengthens resistance to corruption.
To this end, URA inevitably continues to actively collaborate with anti-corruption
bodies and the public, and will shortly implement its whistle-blowing policy.
4.7 Ensuring harmonised, systematic and policy led regional integration measures
Regional integration at both EAC Customs Union level is apparently a
predominantly politically driven initiative. Evidently, many of the regional integration
measures promulgated by regional political forums have been made before any
rigorous assessment of both the feasibility of implementation, and DRM
implications. Thus for example: (1) common external tariffs (CETs) were
pronounced on the eve of the EAC Customs Union launch, there is still a lot of
haggling over them; (2) there is an absence of clarity on the appropriate
classification of manufactured and semi-manufactured goods; (3) ―the value of
goods which [qualify] for exemptions and remissions has been growing‖ (Mugisa,
2009) ; and (4) weak and poorly coordinated controls over the rules of origin
continue to pose major problems for all the ARAs in the EAC member states.
It is noteworthy that there are demands by Uganda based businesses to extend the
duty exemption period beyond 2010 for the importation of key inputs and materials
(225 tariff numbers) given to 94 companies under the Duty Remission Scheme. Yet
businesses in other EAC member states are required to pay import duty at the
applicable CET rate. ―This is contrary to the spirit of the agreed position, and
naturally, there is opposition to this from other members and even in Uganda there
is no unanimous support on this matter‖ (Mugisa et al, 2009). In addition, Uganda‘s
tax regime is not fully in synch with the systems in other EAC partner states. For
example, VAT and excise duty are not harmonised, which could negatively impact
on cross-border trade.
26
5 Lessons of experience
It is clear that URA like other ARAs in the region has embarked on extensive
reforms and capacity building initiatives. This synthesis of lessons of experience is
based on an assessment of outputs from the reform efforts and policy measures for
which specific outcomes can be identified. At the same time, this chapter captures
lessons of experience in terms of what decisions, and actions, affect tax efforts.
5.1 It is important to insulate an ARA from politics
In line with the original envisioning of the relevance of URA‘s autonomy, the
authority should have the institutional environment and incentives that allow it to
attract and retain the talent necessary to build, operate and maintain an efficient
and effective tax administration system. However, as indicated earlier in this paper,
it would seem that URA‘s staff remuneration has been politicised in recent years,
and therefore pay has not kept up with packages offered by other organisations in
the market seeking to recruit similar skills (see Box 5.1). Therefore, URA has
suffered staff losses in critical positions. Furthermore, freezing URA‘s pay levels
may serve to undermine its image in the market. For example, it may be perceived
to be less professional due to its reduced ability to attract and retain the best skills
available in the market. The remuneration aspect ―of autonomy has [therefore]
become less significant over time as pay and conditions move more closely into line
with civil service norms‖ (Robinson, 2004).
Box 5.1: Political leader tirade against salary adjustments for URA staff
Despite the global economic downturn the URA is moving to increase the salaries paid to its employees in a bid to improve its ‗operational efficiency‘. The tax body which has some of the highest paid employees on the government payroll submitted a proposal to the Ugandan parliament last week in which it seeks a 16% increment to its employees‘ salaries.
Members of parliament.. last week threatened to block the proposal. ―Our economy is doing badly and we are collecting less revenue, not due to lack of skilled staff, but because of the financial crisis... It will be irrational for us to increase URA salaries by Shs7.8 billion yet we are collecting less and our people have no drugs in hospitals. We cannot fix the realities of the financial crisis by rewarding URA executives.‖ [one Member of Parliament] argued.
Ironically as the URA asks for staff salary increments, the National Health Service Commission will not be able to recruit the 1,000 health workers its needs this financial year [FY 2008/09] for lack of funding. Furthermore the national budget this year slashed about 3.4 billion off the main national hospital (Mulago Hospital) budget, yet the hospital is in dire need of these funds.
Source: Anyoka (2009)
27
5.2 Restructuring, reengineering and automation can facilitate the reduction in the cost of collection
Table C2 Annex C indicates that since 1996/97, URA has been able to bring down
the cost of collecting tax and non-tax revenues. This reduction demonstrates one
benefit of the restructuring, reengineering and automation initiatives that URA has
implemented. When all the new processes and systems are fully functioning, there
is a distinct possibility that the cost of collection as a percentage of total revenue
collected will be even lower. Then also, URA should start ―harvesting‖ from its
massive investment in IT systems say through, data matching, enhancing
compliance management capabilities, use of third party information, and sharing of
information across departments.
5.3 Tax incentives and exemptions can negate DRM results
URA has made noteworthy advancements with its modernisation agenda. However,
the effect of its reforms are not fully discernible in domestic revenue performance
indicators (See Chapter 3), especially collections as a percentage of GDP. The key
factors for this lower than expected performance appear to be: the large proportion
of the informal sector that falls outside the tax net; the common view that tax
evasion in Uganda is widespread; and the growing level of exemptions – which ―not
only shrink the tax base but also complicate tax administration and are a major
source of revenue resource leakage from the taxed economy‖ (Gupta and Tareq,
2008). It is therefore important to quantify, and if significant, reverse the effects of
these three negating factors.

28
Annex A: List of Key informants
Jack Grigg (Mr) Economist – Tax Policy Division – Fiscal Affairs Department, International Monetary Fund
Jeroen de Lange (Mr) Senior Economist, World Bank Country Office
John Ogol (Mr) Senior Finance Officer – Legal, Ministry of Finance, Planning and Economic Development
Kalyebbi Magoola (Mr) Assistant Commissioner – Research, Planning & Development, Uganda Revenue Authority
Keith Muhakanizi (Mr) Deputy Secretary to Treasury, Ministry of Finance Planning and Economic Development
Lawrence Bategeka (Mr) Senior Research Fellow, Economic Policy Research Centre
Lawrence Kiiza (Mr) Director Economic Affairs, Ministry of Finance, Planning and Economic Development
Luke Okumu (Dr) Senior Research Fellow, Economic Policy Research Centre
Moses Kajubi (Mr) Commissioner Domestic Taxes, Uganda Revenue Authority
Moses Kibirige (Mr) Adviser Financial and Private Sector Development, World Bank Country Office
Moses Ogwal (Mr) Director Policy and Advocacy, Private Sector Foundation Uganda
Moses Sabiiti (Mr) Manager – Modernisation, Uganda Revenue Authority
Patrick Khaemba (Mr) Resident Representative - Uganda, African Development Bank
Paul Wade (Mr) Poverty Reduction and Economic Management Cluster Lead, The World Bank
Peter Malinga (Mr) Commissioner Customs, Uganda Revenue Authority
Rob Rudy (Mr) Pro-Poor Growth Adviser, Department for International Development
29
Sarah Babalanda (Ms) Supervisor Tax Education – Public and Corporate Affairs, Uganda Revenue Authority
Sarah Birungi Banage (Ms) Assistant Commissioner, Public and Corporate Affairs Management, Uganda Revenue Authority
Sarah Ssewanyana (Dr) Executive Director, Economic Policy Research Centre
Thomas Richardson (Mr) Senior Resident Representative - Uganda, International Monetary Fund
30
Annex B: Bibliography
Africa Peer Review Mechanism (2009) Republic of Uganda APRM Country Review Report No. 7.
African Forum and Network on Debt and Development (2007) A Critical Assessment of Aid Management & Donor Harmonisation: The Case of Uganda, AFRODAD 2007.
Anyoka, M. (2009) Higher URA Wages vs Better Health Care [Available at: http://www.groundreport.com/Opinion/HIGHER-URA-WAGES-VS-BETTER-HEALTHCARE/2904087] [Accessed 4 April 2010].
Ayoki, M. (2008) Tax Administration in Poor Countries: Country Report Uganda. IPRA, 2008. Working Paper No. 20.Ayoki, M (2008) Tax Administration in Poor Countries: Country Report Uganda Institute of Policy Research and Analysis IPRA Working Paper No 20.
Ayoki, M., Obwana, M., Ogwapus, M. (2005) Tax Reforms and Domestic Revenue Mobilization in Uganda Institute of Policy Research and Analysis, Global Development Network.
BBC (2002) Uganda Roots Out Tax Corruption BBC News 15/03/02, [online].
Bitarabeho, J. (2008) The Experience of Uganda – Local Government‘s Role as a Partner in the Decentralisation Process to Strengthen Local Development. A Paper Presented at a Conference on Access to Development Funding for Local Governments in Africa, Johannesburg, 15 – 17 September 2008.
Boko, SH. and Baliamoune-Lutz, M. (2009) Fiscal Decentralisation, Donor Funding and Poverty Reduction in Africa: A Case Study of Uganda. Paper presented at Conference on the Role of the Sub-National Jurisdiction in Efforts to Achieve the MDGs, Abuja Nigeria 7-9 May 2009.
Brautigam, D.A. (2008) Introduction: Taxation and State Building in Developing Countries. In D.A Brautigam., O-H. Fjeldstad and M. Moore (eds) Taxation and State Building in Developing Countries Cambridge University Press: Cambridge, pp. 1-33.
Cawley, G. and Zake, J. (2010) Tax Reform In F. Kuteesa, E. Tumusiime-Mutebile, A. Whitworth and T. Williamson (eds) Uganda’s Economic Reforms: Insider Accounts Oxford University Press: Oxford, , 1st edtn, pp. 103-128.
31
Chen, D., Matovu, JM., Reinikka, R. (2001) A Quest for Revenue and Tax Incidence in Uganda IMF Working Paper WP/01/24.
DFID (2008) Making Uganda’s Tax System More Appropriate in Meeting National Objectives: What works, what doesn’t, and why Institute of Policy Research and Analysis, DFID 2008.
Fjeldstad, OH. (2005a) Corruption in Tax Administration: Lessons from Institutional Reforms in Uganda, CMI Working Paper WP 2005: 10.
Fjeldstad, OH. (2005b) Revenues and Corruption: An Overview of Issues, In U4-Workshop on Corruption in Public Financial Management: Donor Perspectives Bergen, 16-17 February 2005.
Fjeldstad, OH. and Rakner, L (2003) Taxation and tax reforms in developing countries: Illustrations from sub-Saharan Africa CMI Report R 2003:6.
Gauthier, B. and Reinikka, R. (2001) Shifting Tax Burdens Tax Burdens Through Exemptions And Evasion Exemptions: An Empirical Investigation Of Uganda The World Bank Policy Research Working Paper 2735.
Gauthier,B. and Reinikka, R. (2006) Shifting Tax Burdens through Exemptions and Evasion: an Empirical Investigation of Uganda Journal of African Economies doi:10.1093/jae/ejl022 Advance Access published June 14, 2006.
GoU, (2004), Poverty Eradication Action Plan (2004/5 – 2007/8). GoU, 2004.
Growth E. (2008) Uganda’s Taxation Policy: Implications for Poverty Reduction and Economic Growth Review Report No. 9
Gupta, S., and Tareq, S.(2008) Mobilising Revenue: Strengthening domestic Revenue Bases is Key to Creating Fiscal Space for Africa‘s Developmental Needs, IMF Fiscal Affairs Department, Finance and Development, 2008.
Habuti, M.A. and Masinde, J. (2009) Tensions Mount Over Disparities in Uganda’s Public Service Salaries East Africa In Focus 10/11/2009, [online].
Hauser, E. (1999) Ugandan relations with Western donors in the 1990s: what impact on democratisation? The Journal of Modern African Studies 37(4):621-641.
Holmes, K. (2006) The Uganda Income Tax Act 1997: A Primer on Concepts and Structure IFBD Publications: Amsterdam.
IMF (1997) Uganda Statistical Appendix. IMF, 1997. Report no. 97/48.
32
IMF (1999) Uganda: Selected Issues and Statistical Appendix. IMF,1999. Report No. 99/116.
IMF (2009a) Country Report, IMF Country Report No. 09/79, March 2009.
IMF (2009b) Some Observations on Domestic Revenue Mobilization. Presentation made during IMF Staff Visit to Rwanda, Oct-November 2009.
IMF (2010) Uganda: Sixth Review Under the Policy Support Instrument and Request for an Extension of the Policy Support Instrument—Staff Report. IMF, 2010. Report no. 10/1.
Kaweesa, C. (2004) Taxation and Investment in Uganda Structure and Trend A Presentation To The Business Forum in London, UK For Investment Opportunities In Uganda May 2004.
Kayaga, L. (2007) Tax Policy Challenges Facing Developing Countries: a Case Study of Uganda Unpublished Master‘s Thesis, Faculty of Law, Queens University.
Khorana, S., Kimbugwe, K., Perdikis, N. (2007) The Impact of Tariff Reductions under the East African Community Customs Union: Intra-trade effects on Uganda BOUWP/08/08.
Matovu JM. (2008) Domestic Resource Mobilisation in Uganda and Economic Performance, Country Presentation for the North-South Institute Domestic Resources Mobilization in Sub-Saharan Africa Project January 2008-January 2009.
Matovu,J., Twimukye,E. Nabiddo,W., Guloba,M. (2009) Impact of Tax Reforms on Household Welfare. EPRC, 2009. Research Series No.64.
Ministry of Local Government (2009) Ministerial Policy Statement Presented To Parliament For The Debate On The Budget Estimates. Government of Uganda, 2009.
Monitor Reporter (2005) Uganda Must Give Incentives to Investors, says Museveni The Monitor 16/02/2005, [online].
Mugisa, E., Onyango, C., Mugoya, P. (2009) An Evaluation of the Implementation and Impact of the East African Community Customs Union. EAC, March 2009.
Mwenda , A.M. and Atuhaire, A.B. (2006) Museveni Gives Bassajja Another Shs. 13b in Taxes The Monitor 14/06/2006, [online].
33
Ndulu, B.J., Chakraborti, L., Lijane, L., Ramachandran, V., Wolgin, J. (2007) Challenges of African Growth: Opportunities, Constraints, and Strategic Directions IBRD/World Bank: Washington, 1st edtn.
Osoro (1993) Revenue Productivity Implications of Tax Reform in Tanzania. AERC, 1993. Paper No. 20.
Page, S. and Te Velde, D.W. (2004) Foreign Direct Investment by African Countries. ODI, 2004.
Private Sector Foundation Uganda (2009) Widening Uganda’s Tax Base and Improving Tax Administration Final Report.
RDC (2009) Perceptions and Integrity Baseline Survey in URA. URA, 2009.
Rice, X. (2009) Oil Find Sparks New Hope for Uganda’s People Guardina25/08/09, [online].
Robinson, M. (2004) Managing Successful Governance Reforms: Lessons of Design and Implementation – The Political Economy of Governance Reforms in Uganda. World Bank, 2004.
Robinson, M. (2006) The Political Economy of Governance Reforms in Uganda Institute of Development Studies, Discussion Paper 386.
Selassie, A.A. (2008) Beyond Macroeconomic Stability: The Quest for Industrialization in Uganda. IMF, 2008. WP/09/231.
Sennoga, E., Matovu, J.M., Twimukye, E. (2009) Tax Evasion and Widening the Tax Base in Uganda. EPRC, 2009. Research Series No.63.
Sseppuya, M. (2005) Rakai to Get Free Trade Zone The New Vision 16/12/2005, [online].
Steffensen, J. (2008) Fiscal Decentralisation Issues. Mission Report for the JBSF Taskforce, October 25, 2008.
Tangri, R. and Mwenda, A. (2010) President Museveni and the Politics Of Presidential Tenure in Uganda Journal of Contemporary African Studies, Volume 28 Issue 1 2010.
The Economist (2010) A Bonanza Beckons: Hope and Peril for the Great Lakes The Economist 03/04/2010, p.37-38.
34
The Independent (2003) Idi Amin: Jovial but Brutal Tyrant known as the 'Butcher of Uganda' The Independent on Sunday 18/08/2003, [online].
Therkildsen, O. (2004) Autonomous Tax Administration in Sub-Saharan Africa: The Case of the Uganda Revenue Authority in Forum for Development Studies No. 1 – 2004 Volume 31, Norwegian Institute of International Affairs.
Transparency International (2009) The East African Bribery Index 2009. Transparency International, 2009.
Tumushabe, G. (2009) Trends in Public Administration Expenditure In Uganda: The Cost of the Executive and its Implications on Poverty Eradication and Governance ACODE Policy Research Series, No. 27, 2009.
UCC (2009) A Review of the Post and Telecommunications Market 2008/09. UCC, 2009.
Uganda Revenue Authority (2009) Taxpayer’s Charter, URA Revised edition, June 2009.
URA (2009) Modernisation Plan 2006/07 – 2009/10: Best Opportunity for Total Transformation. URA, 2009.
World Bank (1995) Economic Consequences of the Transition from Civil War to Peace Development Brief Number 47.
World Bank (2005) Budget Support, Aid Dependency, and Dutch Disease: The Case of Uganda, Practitioner’s Forum on Budget Support Cape Town, South Africa May 5-6, 2005.
World Bank (2007) Uganda: Moving Beyond Recovery: Investment & Behavior Change, For Growth. World Bank, 2007. Report no. 39221-UG.
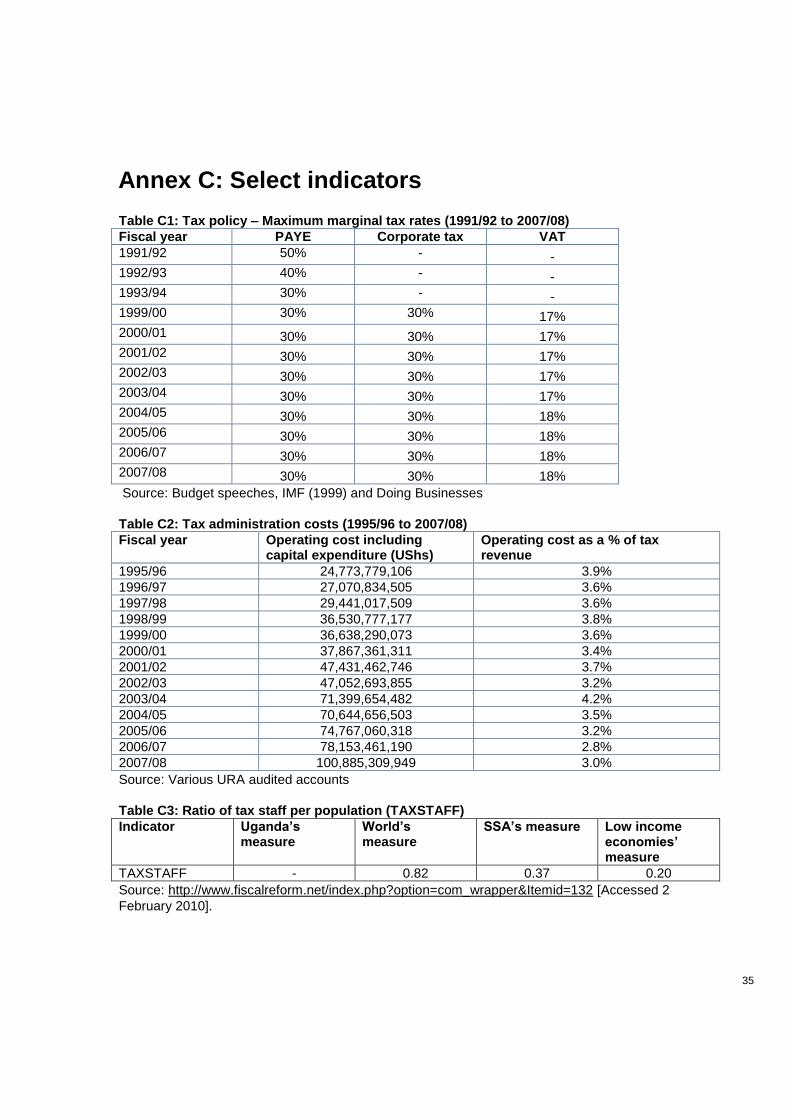
35
Annex C: Select indicators
Table C1: Tax policy – Maximum marginal tax rates (1991/92 to 2007/08)
Fiscal year PAYE Corporate tax VAT
1991/92 50% - -
1992/93 40% - -
1993/94 30% - -
1999/00 30% 30% 17%
2000/01 30% 30% 17%
2001/02 30% 30% 17%
2002/03 30% 30% 17%
2003/04 30% 30% 17%
2004/05 30% 30% 18%
2005/06 30% 30% 18%
2006/07 30% 30% 18%
2007/08 30% 30% 18%
Source: Budget speeches, IMF (1999) and Doing Businesses
Table C2: Tax administration costs (1995/96 to 2007/08)
Fiscal year Operating cost including capital expenditure (UShs)
Operating cost as a % of tax revenue
1995/96 24,773,779,106 3.9%
1996/97 27,070,834,505 3.6%
1997/98 29,441,017,509 3.6%
1998/99 36,530,777,177 3.8%
1999/00 36,638,290,073 3.6%
2000/01 37,867,361,311 3.4%
2001/02 47,431,462,746 3.7%
2002/03 47,052,693,855 3.2%
2003/04 71,399,654,482 4.2%
2004/05 70,644,656,503 3.5%
2005/06 74,767,060,318 3.2%
2006/07 78,153,461,190 2.8%
2007/08 100,885,309,949 3.0%
Source: Various URA audited accounts
Table C3: Ratio of tax staff per population (TAXSTAFF)
Indicator Uganda’s measure
World’s measure
SSA’s measure Low income economies’ measure
TAXSTAFF - 0.82 0.37 0.20
Source: http://www.fiscalreform.net/index.php?option=com_wrapper&Itemid=132 [Accessed 2
February 2010].
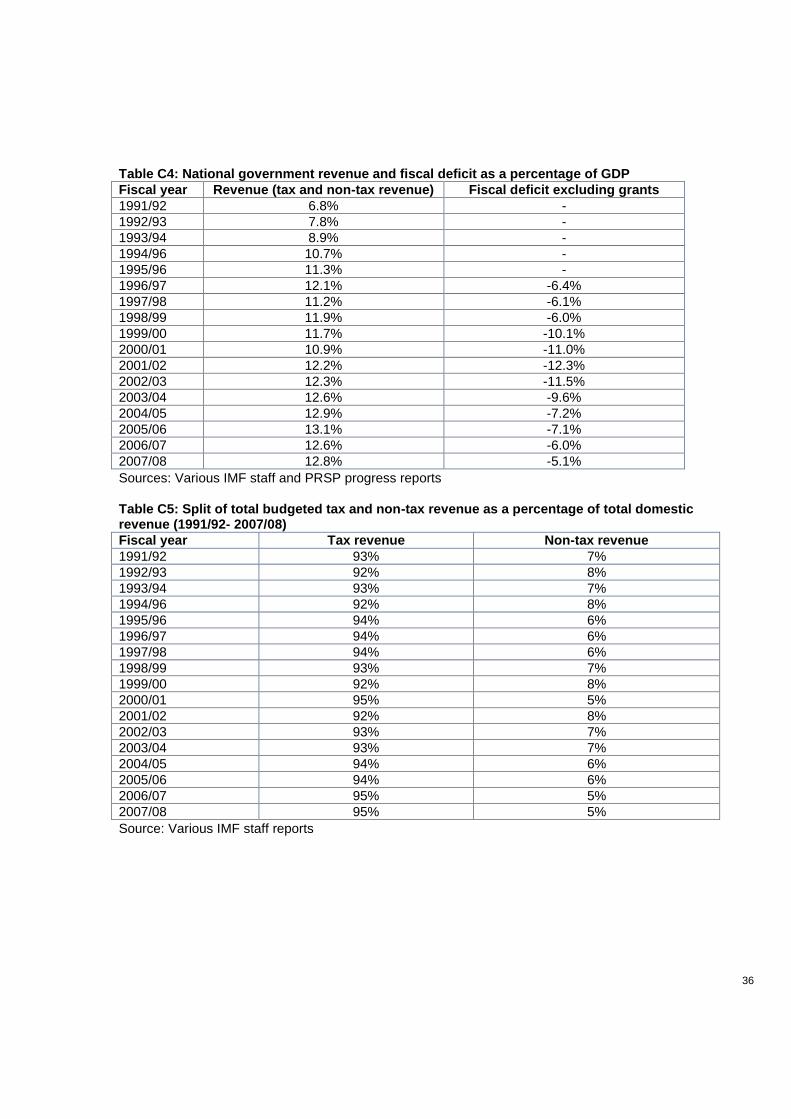
36
Table C4: National government revenue and fiscal deficit as a percentage of GDP
Fiscal year Revenue (tax and non-tax revenue) Fiscal deficit excluding grants
1991/92 6.8% -
1992/93 7.8% -
1993/94 8.9% -
1994/96 10.7% -
1995/96 11.3% -
1996/97 12.1% -6.4%
1997/98 11.2% -6.1%
1998/99 11.9% -6.0%
1999/00 11.7% -10.1%
2000/01 10.9% -11.0%
2001/02 12.2% -12.3%
2002/03 12.3% -11.5%
2003/04 12.6% -9.6%
2004/05 12.9% -7.2%
2005/06 13.1% -7.1%
2006/07 12.6% -6.0%
2007/08 12.8% -5.1%
Sources: Various IMF staff and PRSP progress reports
Table C5: Split of total budgeted tax and non-tax revenue as a percentage of total domestic revenue (1991/92- 2007/08)
Fiscal year Tax revenue Non-tax revenue
1991/92 93% 7%
1992/93 92% 8%
1993/94 93% 7%
1994/96 92% 8%
1995/96 94% 6%
1996/97 94% 6%
1997/98 94% 6%
1998/99 93% 7%
1999/00 92% 8%
2000/01 95% 5%
2001/02 92% 8%
2002/03 93% 7%
2003/04 93% 7%
2004/05 94% 6%
2005/06 94% 6%
2006/07 95% 5%
2007/08 95% 5%
Source: Various IMF staff reports
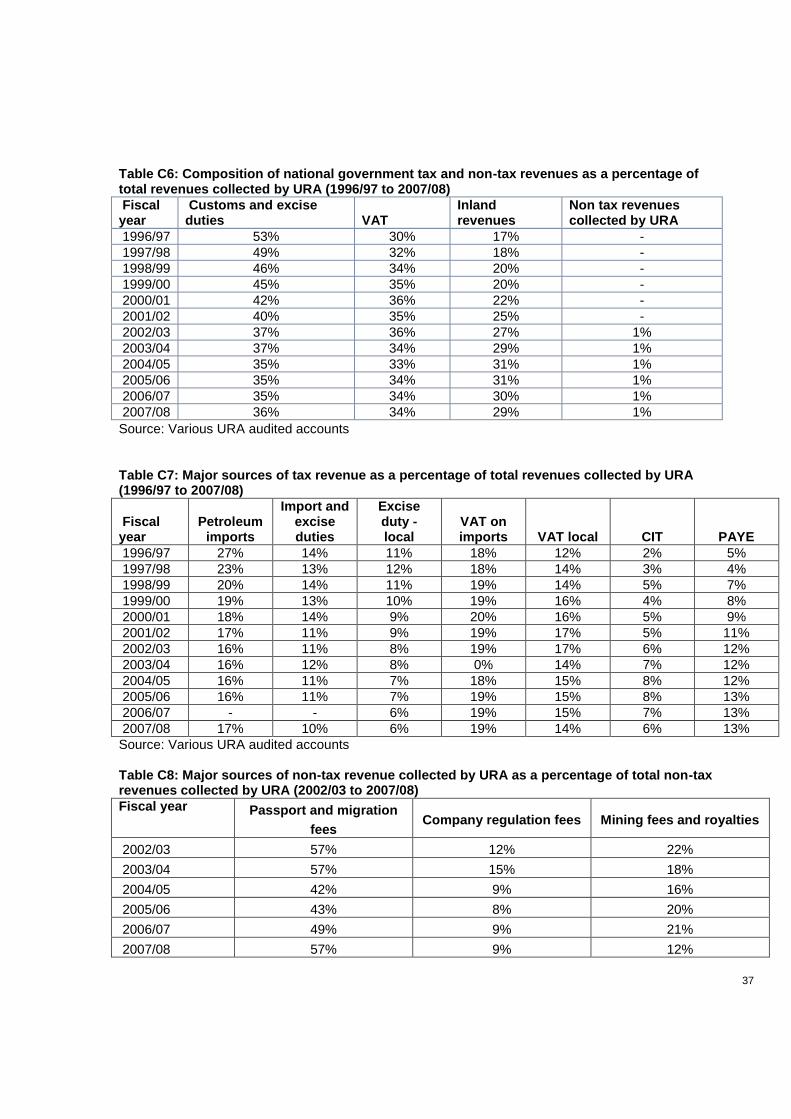
37
Table C6: Composition of national government tax and non-tax revenues as a percentage of total revenues collected by URA (1996/97 to 2007/08)
Fiscal year
Customs and excise duties VAT
Inland revenues
Non tax revenues collected by URA
1996/97 53% 30% 17% -
1997/98 49% 32% 18% -
1998/99 46% 34% 20% -
1999/00 45% 35% 20% -
2000/01 42% 36% 22% -
2001/02 40% 35% 25% -
2002/03 37% 36% 27% 1%
2003/04 37% 34% 29% 1%
2004/05 35% 33% 31% 1%
2005/06 35% 34% 31% 1%
2006/07 35% 34% 30% 1%
2007/08 36% 34% 29% 1%
Source: Various URA audited accounts
Table C7: Major sources of tax revenue as a percentage of total revenues collected by URA (1996/97 to 2007/08)
Fiscal year
Petroleum imports
Import and excise duties
Excise duty - local
VAT on imports VAT local CIT PAYE
1996/97 27% 14% 11% 18% 12% 2% 5%
1997/98 23% 13% 12% 18% 14% 3% 4%
1998/99 20% 14% 11% 19% 14% 5% 7%
1999/00 19% 13% 10% 19% 16% 4% 8%
2000/01 18% 14% 9% 20% 16% 5% 9%
2001/02 17% 11% 9% 19% 17% 5% 11%
2002/03 16% 11% 8% 19% 17% 6% 12%
2003/04 16% 12% 8% 0% 14% 7% 12%
2004/05 16% 11% 7% 18% 15% 8% 12%
2005/06 16% 11% 7% 19% 15% 8% 13%
2006/07 - - 6% 19% 15% 7% 13%
2007/08 17% 10% 6% 19% 14% 6% 13%
Source: Various URA audited accounts Table C8: Major sources of non-tax revenue collected by URA as a percentage of total non-tax revenues collected by URA (2002/03 to 2007/08)
Fiscal year Passport and migration
fees Company regulation fees Mining fees and royalties
2002/03 57% 12% 22%
2003/04 57% 15% 18%
2004/05 42% 9% 16%
2005/06 43% 8% 20%
2006/07 49% 9% 21%
2007/08 57% 9% 12%
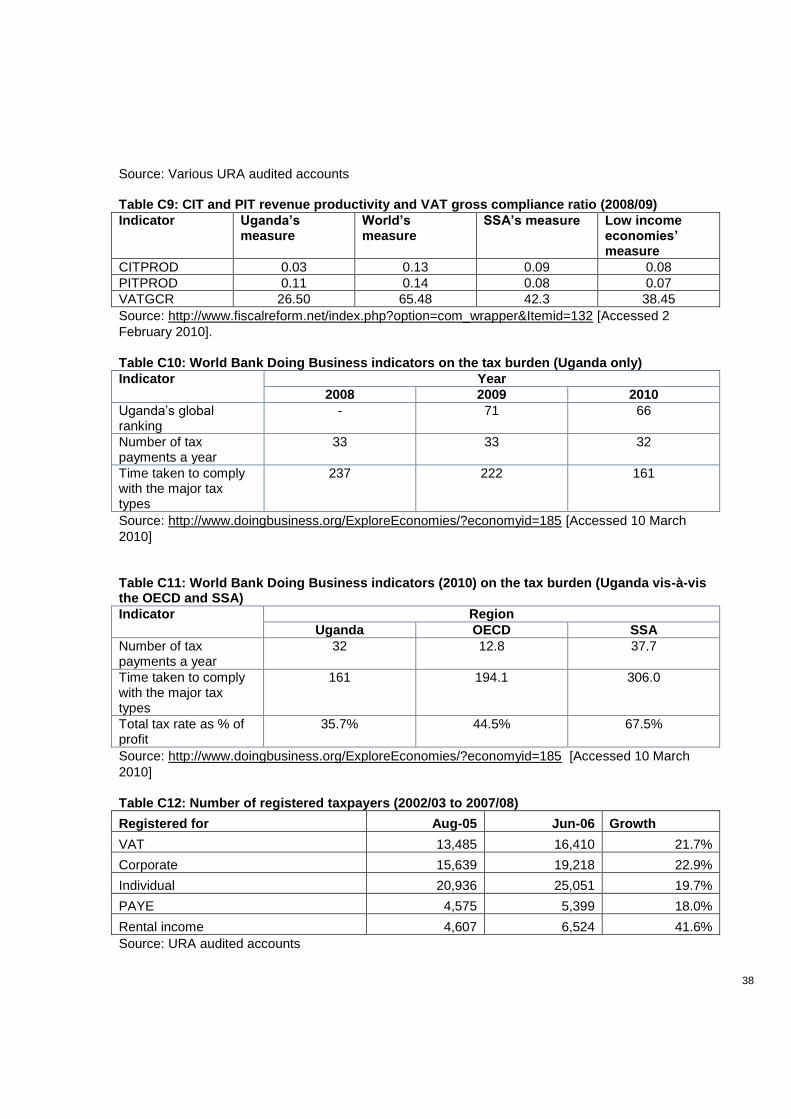
38
Source: Various URA audited accounts Table C9: CIT and PIT revenue productivity and VAT gross compliance ratio (2008/09)
Indicator Uganda’s measure
World’s measure
SSA’s measure Low income economies’ measure
CITPROD 0.03 0.13 0.09 0.08
PITPROD 0.11 0.14 0.08 0.07
VATGCR 26.50 65.48 42.3 38.45
Source: http://www.fiscalreform.net/index.php?option=com_wrapper&Itemid=132 [Accessed 2
February 2010].
Table C10: World Bank Doing Business indicators on the tax burden (Uganda only)
Indicator Year
2008 2009 2010
Uganda‘s global ranking
- 71 66
Number of tax payments a year
33 33 32
Time taken to comply with the major tax types
237 222 161
Source: http://www.doingbusiness.org/ExploreEconomies/?economyid=185 [Accessed 10 March
2010]
Table C11: World Bank Doing Business indicators (2010) on the tax burden (Uganda vis-à-vis the OECD and SSA)
Indicator Region
Uganda OECD SSA
Number of tax payments a year
32 12.8 37.7
Time taken to comply with the major tax types
161 194.1 306.0
Total tax rate as % of profit
35.7% 44.5% 67.5%
Source: http://www.doingbusiness.org/ExploreEconomies/?economyid=185 [Accessed 10 March
2010]
Table C12: Number of registered taxpayers (2002/03 to 2007/08)
Registered for Aug-05 Jun-06 Growth
VAT 13,485 16,410 21.7%
Corporate 15,639 19,218 22.9%
Individual 20,936 25,051 19.7%
PAYE 4,575 5,399 18.0%
Rental income 4,607 6,524 41.6%
Source: URA audited accounts
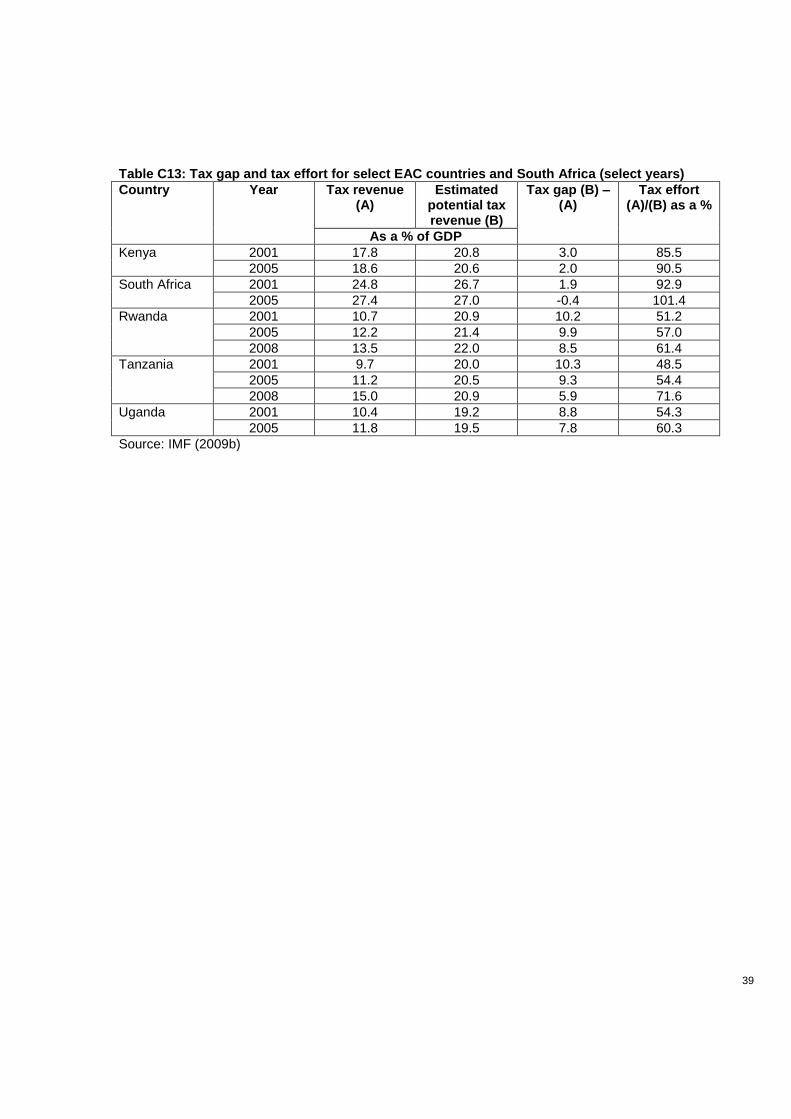
39
Table C13: Tax gap and tax effort for select EAC countries and South Africa (select years)
Country Year Tax revenue (A)
Estimated potential tax revenue (B)
Tax gap (B) – (A)
Tax effort (A)/(B) as a %
As a % of GDP
Kenya 2001 17.8 20.8 3.0 85.5
2005 18.6 20.6 2.0 90.5
South Africa 2001 24.8 26.7 1.9 92.9
2005 27.4 27.0 -0.4 101.4
Rwanda 2001 10.7 20.9 10.2 51.2
2005 12.2 21.4 9.9 57.0
2008 13.5 22.0 8.5 61.4
Tanzania 2001 9.7 20.0 10.3 48.5
2005 11.2 20.5 9.3 54.4
2008 15.0 20.9 5.9 71.6
Uganda 2001 10.4 19.2 8.8 54.3
2005 11.8 19.5 7.8 60.3
Source: IMF (2009b)
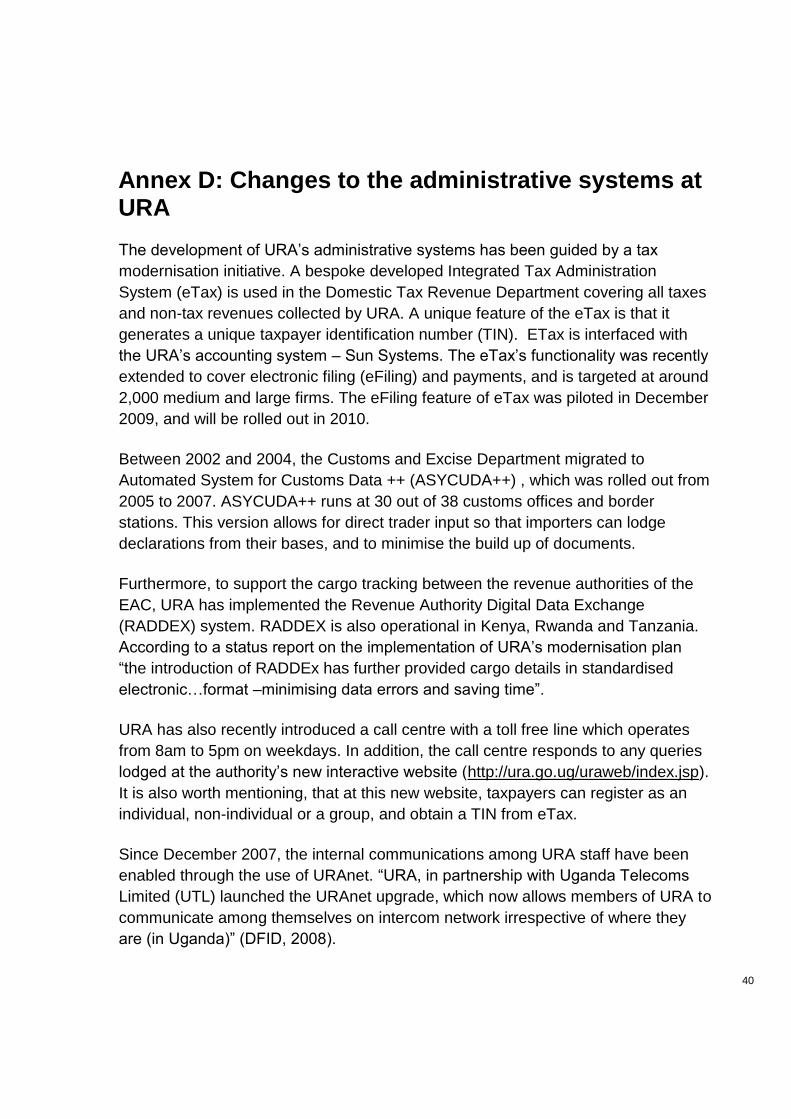
40
Annex D: Changes to the administrative systems at URA
The development of URA‘s administrative systems has been guided by a tax
modernisation initiative. A bespoke developed Integrated Tax Administration
System (eTax) is used in the Domestic Tax Revenue Department covering all taxes
and non-tax revenues collected by URA. A unique feature of the eTax is that it
generates a unique taxpayer identification number (TIN). ETax is interfaced with
the URA‘s accounting system – Sun Systems. The eTax‘s functionality was recently
extended to cover electronic filing (eFiling) and payments, and is targeted at around
2,000 medium and large firms. The eFiling feature of eTax was piloted in December
2009, and will be rolled out in 2010.
Between 2002 and 2004, the Customs and Excise Department migrated to
Automated System for Customs Data ++ (ASYCUDA++) , which was rolled out from
2005 to 2007. ASYCUDA++ runs at 30 out of 38 customs offices and border
stations. This version allows for direct trader input so that importers can lodge
declarations from their bases, and to minimise the build up of documents.
Furthermore, to support the cargo tracking between the revenue authorities of the
EAC, URA has implemented the Revenue Authority Digital Data Exchange
(RADDEX) system. RADDEX is also operational in Kenya, Rwanda and Tanzania.
According to a status report on the implementation of URA‘s modernisation plan
―the introduction of RADDEx has further provided cargo details in standardised
electronic…format –minimising data errors and saving time‖.
URA has also recently introduced a call centre with a toll free line which operates
from 8am to 5pm on weekdays. In addition, the call centre responds to any queries
lodged at the authority‘s new interactive website (http://ura.go.ug/uraweb/index.jsp).
It is also worth mentioning, that at this new website, taxpayers can register as an
individual, non-individual or a group, and obtain a TIN from eTax.
Since December 2007, the internal communications among URA staff have been
enabled through the use of URAnet. ―URA, in partnership with Uganda Telecoms
Limited (UTL) launched the URAnet upgrade, which now allows members of URA to
communicate among themselves on intercom network irrespective of where they
are (in Uganda)‖ (DFID, 2008).
41
URA has in place a corporate plan covering the period from 2006 to 2010, which
specifies four goals: (1) maximise taxpayer compliance; (2) maximise the quality of
service delivery; (3) modernise URA through its people, processes and systems;
and (4) enhance URA‘s corporate image13. To facilitate monitoring and evaluation
(M&E) of the achievement of performance indicators and targets contained in URA‘s
corporate plan, a corporate scorecard was developed in 2009. The corporate
scorecard maintains a record of actual results against baseline indicators.
13 A new corporate plan based on the balanced scorecard framework has been
developed to run until 2014.
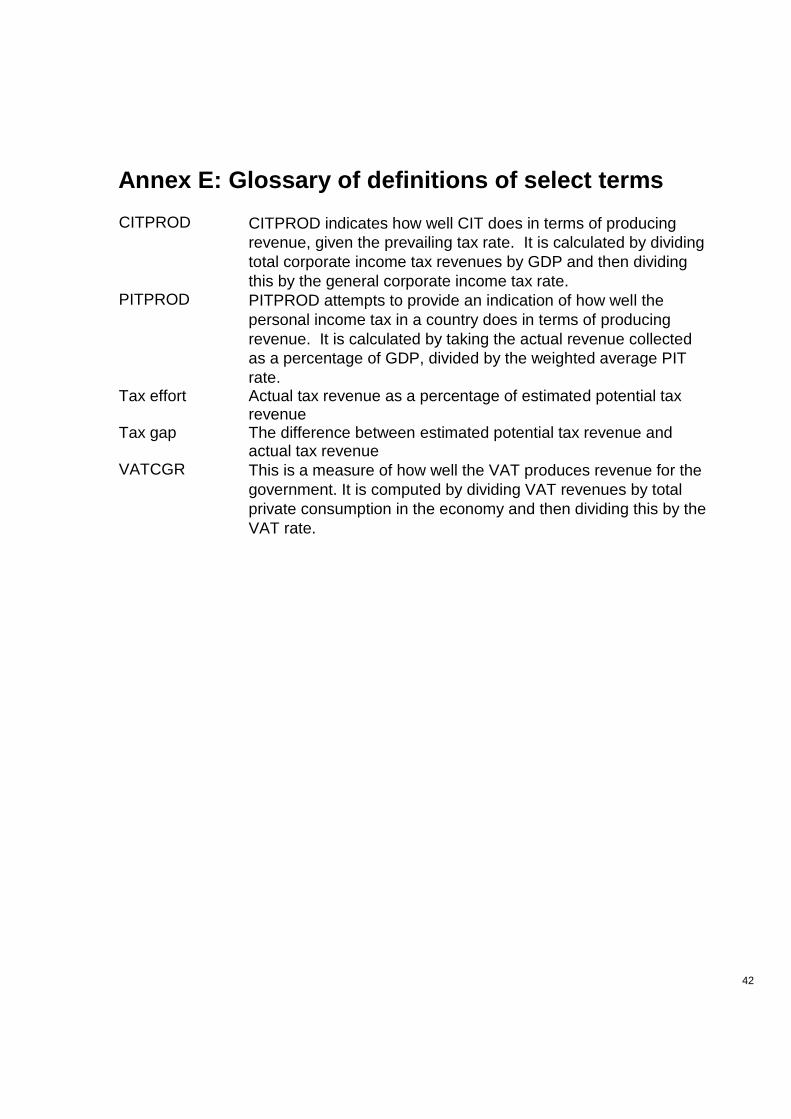
42
Annex E: Glossary of definitions of select terms
CITPROD CITPROD indicates how well CIT does in terms of producing
revenue, given the prevailing tax rate. It is calculated by dividing
total corporate income tax revenues by GDP and then dividing
this by the general corporate income tax rate. PITPROD PITPROD attempts to provide an indication of how well the
personal income tax in a country does in terms of producing
revenue. It is calculated by taking the actual revenue collected
as a percentage of GDP, divided by the weighted average PIT
rate. Tax effort Actual tax revenue as a percentage of estimated potential tax
revenue Tax gap The difference between estimated potential tax revenue and
actual tax revenue VATCGR This is a measure of how well the VAT produces revenue for the
government. It is computed by dividing VAT revenues by total
private consumption in the economy and then dividing this by the
VAT rate.