uganda east africa - kenya, sudan, tanzania and cotton ...pdf.usaid.gov/pdf_docs/pa00k1qn.pdf ·...
TRANSCRIPT

Competitive Supply Side Analysis Of
Cotton, Textile & Apparel Sectors In
East Africa-Kenya, Sudan, Tanzania and
Uganda
African Cotton and Textile Industries Federation
Centre for the Development of Enterprise
AUGUST 2011

Page 2 of 154
Table of Contents
Acknowledgement ........................................................................................................................................ 5
Abbreviations ................................................................................................................................................ 6
Executive Summary ....................................................................................................................................... 8
1. Project Background and Objective ...................................................................................................... 17
2. Project Methodology and Timeline .................................................................................................... 19
2.1. Methodology ......................................................................................................................... 19
2.1.1. Industry Mapping .......................................................................................................... 19
2.1.2. Interpretation and Analysis ........................................................................................... 21
2.1.3. Strategy Formulation .................................................................................................... 22
2.1.4. Final Report ................................................................................................................... 22
2.2 Project Timeline .......................................................................................................................... 22
3. Country Level Analysis ........................................................................................................................ 23
3.1. Kenya ..................................................................................................................................... 23
3.1.1. Country Overview ......................................................................................................... 23
3.1.2. Cotton, Textile and Apparel Sector Overview ............................................................... 23
3.1.3. Value Chain Analysis ..................................................................................................... 25
3.1.4. Sector Competitiveness ................................................................................................ 35
3.1.5. Foreign Trade ................................................................................................................ 38
3.1.6. SWOT Analysis ............................................................................................................... 41
3.1.7. Recommendations ........................................................................................................ 43
3.2. Sudan .................................................................................................................................... 45
3.2.1. Country Overview ......................................................................................................... 45
3.2.2. Cotton, Textile and Apparel Sector Overview ............................................................... 45
3.2.3. Value Chain Analysis ..................................................................................................... 47
3.2.4. Sector Competitiveness ................................................................................................ 53
3.2.5. Foreign Trade ................................................................................................................ 55
3.2.6. SWOT Analysis ............................................................................................................... 58
3.2.7. Recommendations ........................................................................................................ 58
3.3. Tanzania ................................................................................................................................ 61
3.3.1. Country Overview ......................................................................................................... 61
3.3.2. Cotton, Textile and Apparel Sector Overview ............................................................... 61

Page 3 of 154
3.3.3. Value Chain Analysis ..................................................................................................... 63
3.3.4. Sector Competitiveness ................................................................................................ 72
3.3.5. Foreign Trade ................................................................................................................ 75
3.3.6. SWOT Analysis ............................................................................................................... 78
3.3.7. Recommendations ........................................................................................................ 81
3.4. Uganda .................................................................................................................................. 83
3.4.1. Country Overview ......................................................................................................... 83
3.4.2. Cotton, Textile and Apparel Sector Overview ............................................................... 83
3.4.3. Value Chain Analysis ..................................................................................................... 85
3.4.4. Sector Competitiveness ................................................................................................ 93
3.4.5. Foreign Trade ................................................................................................................ 95
3.4.6. SWOT Analysis ............................................................................................................... 99
3.4.7. Recommendations ...................................................................................................... 101
4. Regional Level Analysis ..................................................................................................................... 103
4.1. Snapshot ............................................................................................................................. 103
4.2. Value Chain Analysis: Summary* ........................................................................................ 105
4.3. Cost Comparison ................................................................................................................. 105
4.4. SWOT Analysis ..................................................................................................................... 106
4.5. Key Issues and Recommendations ...................................................................................... 109
5. Benchmarking and Recommendations ............................................................................................. 113
5.1. Cotton Productivity ............................................................................................................. 113
5.2. Fiber Contamination ........................................................................................................... 122
5.3. Value Addition ..................................................................................................................... 125
5.4. Technology Level ................................................................................................................. 129
5.5. Logistics ............................................................................................................................... 131
5.6. Power Scenario ................................................................................................................... 132
5.7. Business Financing .............................................................................................................. 134
5.8. Supply Chain Linkages ......................................................................................................... 136
5.9. Training and Education ....................................................................................................... 139
5.10. Market Development ...................................................................................................... 142
5.11. Investment Promotion .................................................................................................... 144
5.12. Government Support ...................................................................................................... 148
6. Proposed Interventions..................................................................................................................... 150

Page 4 of 154
6.1. Cluster Development .......................................................................................................... 150
6.1.1. Objective ......................................................................................................................... 150
6.1.2. Broad contours of the intervention ................................................................................ 150
6.1.3. Implementation framework ............................................................................................ 150
6.1.4. Impact ............................................................................................................................. 150
6.1.5. Cost Estimate .................................................................................................................. 150
6.2. Training Program................................................................................................................. 151
6.2.1. Objective ......................................................................................................................... 151
6.2.2. Implementation framework ............................................................................................ 151
6.2.3. Impact ............................................................................................................................. 151
6.2.4. Cost Estimate .................................................................................................................. 151
6.3. Upgradation of Education Institutes ................................................................................... 152
6.3.1. Objective ......................................................................................................................... 152
6.3.2. Broad contours of the intervention ................................................................................ 152
6.3.3. Implementation framework ............................................................................................ 152
6.3.4. Impact ............................................................................................................................. 152
6.3.5. Cost Estimate .................................................................................................................. 152
6.4. Creating various Networking Platforms .............................................................................. 153
6.4.1. Objective ......................................................................................................................... 153
6.4.2. Broad contours of the intervention ................................................................................ 153
6.4.3. Implementation framework ............................................................................................ 153
6.4.4. Impact ............................................................................................................................. 153
6.4.5. Cost Estimate .................................................................................................................. 153
6.5. Investment Support Scheme ............................................................................................... 154
6.5.1. Objective ......................................................................................................................... 154
6.5.2. Broad contours of the intervention ................................................................................ 154
6.5.3. Implementation framework ............................................................................................ 154
6.5.4. Impact ............................................................................................................................. 154
6.5.5. Cost Estimate .................................................................................................................. 154

Page 5 of 154
Acknowledgement
This report has been prepared collectively by Intertek (Mauritius) and Wazir Advisors (India),
coordinated by the office of African Cotton and Textile Industries Federation (ACTIF) and funded by
Centre for the Development of Enterprise (CDE).This report is the outcome of primary and secondary
research carried out in Kenya, Sudan, Uganda and Tanzania during April to July 2011.
The team is grateful to CDE for sponsoring the study and giving the opportunity to work on the
initiative. We thank Mr. Rooben Mooteeveeren (Operations Officer, CDE) and Mr. Jaswinder Bedi
(Chairman, ACTIF & KAM) for participating in the interim report presentations and making valuable
recommendations. We are also thankful to ACTIF for providing continuous support throughout the
project.
Important contributions were received from the external consultants appointed by ACTIF member
associations in each of the target countries, viz. ACTIF in Kenya, Tanzania Cotton Board in Tanzania,
Sudan Cotton Company Ltd. in Sudan and Uganda Textiles and Garment Manufacturers Association
in Uganda. The report also draws from a number of studies and reports conducted by various
government and non-government organizations and individuals regarding the Cotton, Textile and
Apparel sector in target countries.
We would also like to acknowledge the inputs provided to us by about 100 industry stakeholders
during primary research work in target countries covering ginners, spinners, textile mills, garment
manufacturers, associations, support institutes, government bodies, etc. without which the report
would not have accomplished the study objectives.

Page 6 of 154
Abbreviations
ACTIF African Cotton and Textile Industries Federation
AGOA African Growth Opportunity Act
ASAL Arid and Semi-Arid Lands
Bn Billion
BPA Bukalasa Pedigree Albar
CAGR Compounded Annual Growth Rate
CDE Centre for the Development Enterprise
CDO Common Development Organization
CODA Cotton Development Authority
CSR Corporate Social Responsibility
CTA Cotton, Textile and Apparel
CTDP Cotton and Textile Development Programme
EAC East African Community
ECGA Eastern Cotton Growing Area
ELS Extra Long Staple
EPA Economic Partnership
EPZ Export Processing Zones
EPZA Export Processing Zone Authority
EU European Union
FOB Free on Board
FOT Free on Truck
FBGs Farmer Business Groups
GDP Gross Domestic Product
GM Genetically Modified
GOT Ginning Out Turn
IARI Ilonga Agricultural Research Institute
ICA International Cotton Association
IMF International Monetary Fund
IRCC Industrial Research and Consultancy Centre
KAMEA Kenya Apparel Manufacturers and Exporters Association
KARI Kenya Agricultural Research Institute
KEBS Kenya Bureau of Standards
KEPHIS Kenya Plant Health Inspectorate Service
LDC Least Developed Country
LZARDI The Lake Zone Agricultural Research Development Institute
MAAIF Ministry of Agriculture, Animal Industry and Fisheries
Mn Million
MT Metric Tones
MTTI Ministry of Tourism, Trade, and Industry
MUB Manufacturing Under Bond
MFPED Ministry of Finance, Planning & Economic Development
NAADS National Agricultural Advisory Services

Page 7 of 154
NACRRI National Agricultural Crop Resources Research Institute
NaSARRI National Semi-Arid Resources Research Institute
NARO National Agriculture Research organization
NCSF National Cotton Stakeholders Forum
NEMC National Environment Management Council
NGO Non-Government Organization
NPT National Performance Trial
R&D Research and Development
RLDC Rural Livelihoods Development Company
RVP River Valley Project
SADC South African Development Community
SATU Serere Albar Type Uganda
SCCL Sudan Cotton Company Limited
SCIA Sudanese Chambers of Industries Association
SEZ Special Economic Zones
T&A Textile and Apparel
TBS Tanzania Bureau of Standards
TCA Tanzania Cotton Association
TCB Tanzania Cotton Board
TEMAU Textile Manufacturer Uganda
TOSCI Tanzania Official Seed certification institute
TPRI Tropical Pesticides Research Institute
UDC Uganda Development Corporation
US United States
USAID United States Agency for International Development
USD United State Dollar
WCGA Western Cotton Growing Area

Page 8 of 154
Executive Summary
African Cotton and Textile Industries Federation (ACTIF), which is a not for profit regional
industry/trade body, with the support of Centre for the Development of Enterprise (CDE), proposed
to get a comprehensive supply side analysis done for the Cotton, Textile and Apparel sector of 4 East
Africa countries – Kenya, Sudan, Tanzania and Uganda. Intertek (Mauritius) and Wazir Advisors
(India) as a consortium were selected through a competitive bidding process as Consultants to
conduct this study.
The purpose of the study is to analyse the existing supply chain, identify potential regional strengths
(product emphasis) and weaknesses, identify gaps in the institutional structures and communication
channels and make recommendations for promoting the sector. Another major objective of the
study is to provide a source of information for buyer/seller matchmaking to grow exports and
encourage regional integration.
The project involved a combination of primary and secondary research, data analysis and
interpretation, which was followed by strategy formulation. Primary research was conducted in
target countries of Kenya, Uganda, Tanzania and Sudan with the assistance of local consultants. The
discussions with various stakeholders were held using the structured questionnaires and/or
discussion guides.
After completion of the primary and secondary research, the data was collated and analysed to
present an overall picture at the country and regional level. In addition to providing factual industry
trends and insights, we have also presented our own interpretation, recommendations & key
insights about the sector. On the basis of collected facts and figures, we have analysed and brought
out the underlying reasons for issues and recommended strategies to address the same.
Findings of each of the countries have been summarised below:
1. Kenya
Cotton sector in Kenya is characterized by a large number of small holder farmers in the Eastern
zone comprising Coastal, Eastern and North eastern regions and Western zone comprising Nyanza,
Rift Valley and other western regions. Cotton exports from the country are almost negligible; rather
most of the domestic requirements are met through import of cotton from neighbouring countries
like Tanzania and Uganda.
Domestic spinning and weaving capacities have reduced drastically from ~ 52 mills in 1983 to about
6 mills currently. This is due to the failure of country’s cotton sub sector, large scale imports of
intermediate products as well as imports of second hand clothing, high production cost and poor
infrastructure.
The garment sector of Kenya is principally driven by exports to the US under the African Growth and
Opportunity Act (AGOA) initiative. There are ~170 large scale garment manufacturing units operating
in Kenya today. In 2010, garment sector remains the dominated sector in EPZ which constituted 29%
of all EPZ enterprises, 78% of total EPZ local employment, 56% of EPZ exports, 52% of total EPZ sales
and 30% of all EPZ private investment.

Page 9 of 154
Country’s trade data shows that Kenya has been a net importer in T&A sector since 2005. Share of
T&A exports in country’s total exports have declined gradually from ~11% in 2005 to ~6% in 2009
and share of T&A imports in country’s total imports have declined from ~17% in 2005 to ~7% in 2006
and it is consistently at ~7% thereafter. Kenya’s exports consist of Women's woven suits, jackets,
knitted jerseys, pullovers whereas imports constitute worn clothing and woven fabric of synthetic
filament yarn. USA is the leading market for Kenya whereas China is the leading supplier.
Major challenges faced by the industry include high costs of doing business related to power and
fuel. The existing costs of borrowing are also very high at ~16-18% which makes it difficult for the
sector to bear high costs. In addition, the formalities for loan approvals, requirements for collaterals
and other documentation are also intense. Current machineries / technology in use are very
outdated in the textile sector, which further adds to the costs of manufacturing. Sector is currently
facing lack of new investments for upgrading technology. There are huge imports of second hand
clothes in the country which is posing a big threat to the economy.
There is a huge requirement of enhancing the skills of people to increase their efficiency levels. The
current infrastructure provides for few such institutions which have limited capacities. There is a
significant need to promote training institutions and support such programs with necessary
infrastructure and train a large number of trainees each year in line with the sector demand.
There is a lot of scope for making value added products particularly for the export markets such as
adding embroidery, sequins, other style/design elements. This will bring in incremental revenue to
the sector and will also lead to more employment creation and skill enhancement.
2. Sudan
Cotton provides an important livelihood for an estimated 200,000 cotton growers and their families,
in addition to employing seasonal labour during harvest time. Cotton is grown in Sudan under both
irrigated and rain-fed modes of production. The majority of Sudan’s extra-long staple cotton is
grown in the Gezira irrigation scheme. While the scheme is government managed, tenant farmers
decide which areas and varieties to plant. In recent years, more than half of Sudan’s cotton exports
have been Barakat, which requires a longer growing season but earns more at export.
Country’s overall trade statistics show that Sudan was a net importer till 2006 but in 2007 exports
surpassed imports and the same trend was seen till 2009. The CTA sector exports have decreased
since 2005 from US$ 0.08 bn to US$ 0.03 bn in 2009. Share of CTA exports in country’s total exports
also declined from 1.5% in 2005 to 0.4% in 2009. On the other hand CTA imports have witnessed
increase from US$ 0.27 bn in 2005 to US$ 0.42 bn in 2009, thus registering a compounded growth of
12%. Share of CTA imports in country’s total imports has increased from 4.4% in 2005 to 6.1% in
2009.
Cotton fiber accounts for almost 98% of Sudan’s CTA exports whereas imports constitute Men’s
woven suits, jackets, women’s knitted suits, dresses, etc. Egypt is the leading market for Sudan
whereas China is the leading supplier.
The major challenges faced by the industry are closure of large capacities, high cost of doing
business and low utilization of manufacturing capacity and unavailability of finance. Technology is

Page 10 of 154
another key area of concern which needs upgrading to enhance the competitiveness of the overall
textile industry. Most of the cotton produced is exported out of the country. Farmers have shifted
from cotton to other crops in last few years as a result of existing low prices and less demand at that
time. This resulted in significant decrease in area under cotton cultivation and hence the cotton
production.
3. Tanzania
Cotton in Tanzania is grown mainly on small scale farms by who own between 0.5 to 10 acres and
grow mostly in the rain fed areas. Major production areas are the Western Cotton Growing Area
(WCGA) and the Eastern Cotton Growing Area (ECGA). WCGA accounts for over 98% percent of
production. Cotton production in Tanzania is largely meant for exports. Major importers of
Tanzania’s cotton are China, Indonesia, Thailand, Kenya, Portugal, Bangladesh, Vietnam and
Pakistan. Initiatives have been taken to introduce contract farming to promote the industry.
The Tanzanian textile sector consists of two standalone spinning mill and several integrated firms.
The industry spins mostly cotton yarns for both knit and woven fabric. A few fabric mills concentrate
in making woven printed women khanga and kitenge; as well as yarn dyed woven kikoi fabrics, bed
linen and home textiles. Most of these traditional fabrics are sold in Tanzania; a few exported in the
surrounding countries; and limited amounts into some of the island states off the east African coast.
Tanzania is the world’s 2nd largest sisal producer. Tanzania has a number of sisal processors which
spin/weave sisal and make products such as sacks, ropes, twines, mats, etc.
Country’s trade data shows that Tanzania is a net importer in CTA sector, with net imports
amounting to US$ 0.23 bn. CTA exports have slightly increased since 2005 from US$ 0.16 bn to US$
0.17 bn. However, share of CTA exports in country’s total exports have declined gradually from 11%
in 2005 to 8% in 2009. Tanzania mainly exports cotton fiber and home furnishing whereas imports
constitute worn clothing and woven fabric of synthetic filament yarn. Kenya and India are the
leading market for Tanzania whereas China is a major supplier to them.
Major challenges faced by the industry are too many disruptions in the power supply which lead to
increased costs for the manufacturers. The borrowing costs for the sector are relatively high at
~15%. So, it becomes highly unaffordable for the manufacturers to borrow from the banks. The
technology currently in use is highly outdated in all areas like ginning, spinning and weaving. Many
mills have lot of dysfunctional machineries which is just lying with them for many years. There is
huge requirement of modern technology and training people to operate these machineries, to
improve productivity in the sector. There are huge imports of second hand clothes in the country
which is posing a big threat to the economy. The present legal framework is not strong enough to
prevent this practice.
The present workforce lacks the requisite skills and training to do the required job. There is
requirement of skilled workers especially in areas like efficient farm practices, weaving and textile
manufacturing. There is a huge requirement of enhancing the skills of people to increase their
efficiency levels. The current infrastructure provides for very few such institutions with limited
capacities and has few enrolments for the training facilities. There is a need for promoting these
institutions (new and old), support these with the necessary infrastructure and churn out large no. of
trainees each year.

Page 11 of 154
Tanzania has limited value added services and 80% of the cotton produced in the country is exported
without any value addition. Country offers huge scope for introduction of value-added services but
requires additional manufacturing facility for that.
4. Uganda
In Uganda, cotton is grown in nearly every part of county and is entirely rain fed. It is grown on a
regular basis by over 10,000 farmers. Over 90% of cotton is exported raw out of. Uganda’s Cotton is
among the most commonly produced and traded cotton variety in the world and belongs to the
species Gossypium birsidum, accounting for 75% of world trade.
In Uganda, textile firms are mostly small or medium-sized. Mostly the capacities remain
underutilized. These mills produce both clothing and cloth for sale on the local market. Most
Ugandan textile mills do not produce large volume fabric orders, but rather concentrate on
producing small runs of a variety of fabrics. Uganda’s apparel sector largely consists of small, locally
owned companies that produce apparel and uniforms for domestic and regional markets. Most of
these apparel producers uses domestically produced yarn or fabric, or they import from Asia.
Country’s trade data shows that Uganda is a net importer in CTA sector, with net imports amounting
to US$ 0.09 bn. CTA exports have declined since 2005 from US$ 0.06 bn to US$ 0.03 bn. CTA imports
have witnessed increase from US$ 0.07 bn in 2005 to US$ 0.12 bn in 2009, thus registering a
compounded growth of 15%. Share of CTA imports in country’s total imports has consistently been
at 5%. Cotton fibre accounts for 81% of Ugandan CTA exports whereas it imports mainly worn
clothing and twines, cords. China is the biggest supplier to Uganda whereas the biggest export
market is Indonesia.
Major challenges faced by the industry include high energy rates, while reliability of electricity
service is also an issue. Also since the region is land locked, firms have to incur high internal and
external transport costs. Textile sector manages to borrow funds at a very high finance rate ranging
between 18-24%. Technology and lack of skilled workforce are other areas of concern which needs
to be addressed to enhance the competitiveness of the overall textile industry.
Regional Level Analysis
Kenya, Sudan, Tanzania and Uganda together account for significant quantities of cotton production.
This is sufficient to not only meet the domestic requirements but also export significant quantities.
The cotton industry has been one of the key areas in these countries and significant population has
been dependant on the sector for more than a century.
These regions enjoy preferential market access and their products can enter most of the world’s
richer economies free of any customs duties and with limited quota restrictions. Some of the trade
agreements these countries have signed up for preferential market access includes African Growth
and Opportunity Act (AGOA), Economic Partnership Agreement (EPA) with EU, East African
Community (EAC) and others.
However, the industry suffers due to the use of outdated technologies particularly in ginning and
textile manufacturing. The sector is dominated by smallholder producers with limited knowledge on
crop and farm management practices, price and market trends, input procurement and supply
trends which results in low cotton yield. There are issues with regard to the quality of cotton as it

Page 12 of 154
has high contamination. The cost of doing business including high power costs and/or inadequate
power supply and high costs of borrowing. Bankers are quite reluctant to lend loans to the CTA
sector. Large scale import of second hand clothing has crippled the development of domestic
market. Emergence of alternative cash crops, which are cheaper to grow but fetch higher returns
than cotton in the major cotton growing areas, are also a threat for the sector.
Benchmarking
The four target countries are compared with the leading countries and benchmarked on some of the
key parameters relevant for the industry. The idea is to understand world-wide best practices or
some of the key initiatives undertaken by these countries to promote their respective industries.
These indicators include:
1. Cotton Productivity
Kenya, Tanzania, Sudan and Uganda all have cotton productivity far less than the world average.
Most of the large cotton producers globally have better productivity levels than these 4 countries.
Australia has the highest cotton yield in the world. About 85% of cotton area in Australia is irrigated,
which partly explains why the average cotton yield is high. Apart from fertile soil and a favourable
climate, the high yields are a result of the national cotton breeding program and better farm
management practices.
2. Fiber Contamination
ITMF’s cotton contamination survey 2009 shows that among the target countries, contamination is a
major issue with Sudanese cotton whereas Ugandan cotton is the better one. Degree of
contamination varies a lot with growing area and farm practices. In general, cotton from India,
Pakistan, Syria and some African countries are known to have higher contamination level than the
world average, whereas cotton varieties of Australia, Brazil, China, Mexico and USA possess
minimum contamination.
The major reasons for contamination are lack of awareness of the importance of reducing
contamination, absence of QC procedures, manual picking, dirty storage environment, use of poly-
propylene (PP) and jute bags or wrappings, poor supervision, improper ginning process.
3. Value addition
Most of the cotton produced in Tanzania, Sudan and Uganda is exported out of the country in raw
form. A major reason behind this is the absence of sufficient manufacturing capacities in the
countries to consume cotton. In Kenya, the cotton exports are nil, but the cotton production volume
there is also low.
Most of the large cotton producing countries have established capacities to consume maximum
cotton within their own countries. Value addition opportunity is lost by exports of raw cotton, it also
loses out on creation of extra jobs across the value chain – spinning, weaving or knitting, dyeing &
processing and garmenting. For e.g., China’s cotton exports have dwindled since the last decade and
it is now the world’s largest importer of cotton.

Page 13 of 154
4. Technology level
The primary survey conducted for this assignment in all the four countries revealed a general lack of
modern technology machinery for textile manufacturing. The reason behind non-upgradation of
machines is lack of major new investments in the sector.
Many of large manufacturing nations address this issue by reducing the effective cost of investment
thus encouraging the entrepreneurs to invest in the sector. For example in India, the flagship
scheme of Ministry of Textiles, known as Technological Upgradation Fund Scheme (TUFS) provide an
interest subsidy of 5 percentage points on the bank credit for modernization of ginning, textile and
apparel companies. It also provides a capital subsidy of 10% or 25% on selected machinery for
processing and technical textiles.
5. Logistics
In today’s price and time sensitive markets, logistics holds the key to make or break an exporter’s
position in its target market. The intercity connectivity from port to manufacturing locations in
target countries is satisfactory with lot of highway development happening all across. The issue
sometimes is of paperwork and hassles at border post (from Uganda to Kenya) and delays for
clearances at the ports itself.
6. Power scenario
There are two aspects related to power scenario of a country – cost of power and quality of power.
In terms of cost of power, it is quite competitive in Tanzania whereas costs in Kenya are the highest
amongst the target countries. The quality of power was reported satisfactory only in Kenya; whereas
in other countries the availability was erratic and fluctuations were common.
The model followed by some of the countries to promote captive power generation to improve the
power scenario is allowing manufacturers to produce, say hydro-based power at one place in the
country, sell it to the main grid and purchase at its manufacturing location at same cost. Similarly
some countries promote alternative power sources like windmills by providing appropriate
incentives e.g. subsidies, accelerated depreciation, tax exemption, etc.
7. Business Financing
High cost coupled with low availability of business financing is one of the major issues in the region
that has resulted in low investment in CTA sector.
The rate of interest charged by banks is more related to the macroeconomic environment of the
country and policies. The effective rates to any sector may however be reduced by the Government
by identifying it as a priority segment and providing interest subsidies on loans offered by banks to
businesses in that sector.
8. Supply chain linkages
Kenya has a strong garment manufacturing capacity but no backward linkages within the country to
support it. Uganda and Sudan produces cotton, but lacks further downstream processes. Tanzania
has some capacities from cotton to fabrics, but lacks value addition in terms of fabric type as well as
garment conversion.

Page 14 of 154
For countries where substantial benefits for exports are available, it becomes important to have a
complete supply chain as buyers prefer integrated supply bases. Importing yarn or fabric leads to
higher costs, higher lead time and loss of employment opportunity.
9. Training and Education
Cotton, Textile and Apparel sector is one of the largest employment providers in developing nations.
The sector has potential to employ manpower in significant quantum specifically at the start of value
chain (farming and ginning) and towards the end (apparel manufacturing).
Countries like India have paid special attention to this aspect and have built up a strong education
infrastructure, and also have launched several capacity building programs. There are also a host of
schemes launched by various arms of Government for development of skills required in the textile
sector.
10. Market development
The domestic market in all the target countries is dominated by imports of yarn, fabrics, finished
goods and second hand clothing (except in Sudan).
For development of exports market, it is important to showcase the product range, manufacturing
capacities, etc. to buyers who have not yet made inroads in the region. Such buyer-seller meets /
programs are run all over the world by trade and government bodies. For example, in India there are
10 export promotion councils in CTA sector, entrusted with export market development of specific
products.
11. Investment Promotion
Promotion of investments from domestic and foreign investors is a must for every country. All the
target countries have investment promotion cell/department but these are not specific to CTA
sector, such as Kenya Investment Authority (Kenya), Ministry of Investment (Sudan), Tanzania
Investment Center (Tanzania) and Uganda Investment Authority (Uganda).
The initiatives undertaken by leading textile and apparel manufacturing nations to promote the
sector includes organising Investor Summit and inviting large scale participation, allowing 100% FDI
in the sector through automatic route (without pre-approval), improving investment climate through
administrative streamlining, etc.
12. Government support
Government support in the target countries is very limited than what it should have been as the
sector is of the strategic importance to the country as well as region.
Specific support to textile sector is provided by governments in China, India, Bangladesh and Turkey
largely in the form of providing suitable infrastructure, incentives for investments in the sector,
incentives for promoting exports, marketing support, single window clearance system, trade
agreements with major suppliers and buyers, supporting research and development activities, etc.
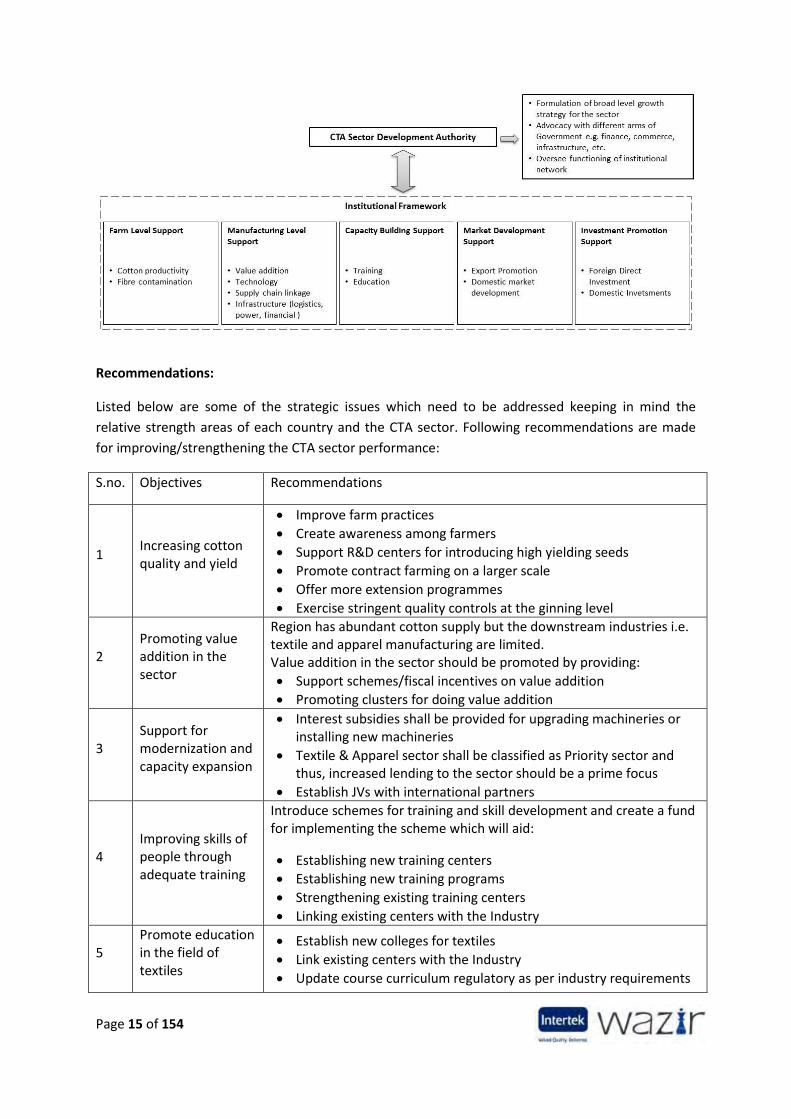
However, in order to implement any intervention successfully, the utmost importance is of
establishing strong institutions in the country to promote, plan and monitor the sector growth. In an
ideal scenario, following should be the institutional framework for implementing various initiatives:
Page 15 of 154
Recommendations:
Listed below are some of the strategic issues which need to be addressed keeping in mind the
relative strength areas of each country and the CTA sector. Following recommendations are made
for improving/strengthening the CTA sector performance:
S.no. Objectives Recommendations
1 Increasing cotton quality and yield
Improve farm practices
Create awareness among farmers
Support R&D centers for introducing high yielding seeds
Promote contract farming on a larger scale
Offer more extension programmes
Exercise stringent quality controls at the ginning level
2 Promoting value addition in the sector
Region has abundant cotton supply but the downstream industries i.e. textile and apparel manufacturing are limited. Value addition in the sector should be promoted by providing:
Support schemes/fiscal incentives on value addition
Promoting clusters for doing value addition
3 Support for modernization and capacity expansion
Interest subsidies shall be provided for upgrading machineries or installing new machineries
Textile & Apparel sector shall be classified as Priority sector and thus, increased lending to the sector should be a prime focus
Establish JVs with international partners
4 Improving skills of people through adequate training
Introduce schemes for training and skill development and create a fund for implementing the scheme which will aid:
Establishing new training centers
Establishing new training programs
Strengthening existing training centers
Linking existing centers with the Industry
5 Promote education in the field of textiles
Establish new colleges for textiles
Link existing centers with the Industry
Update course curriculum regulatory as per industry requirements

Page 16 of 154
Tie-up with other international colleges for student exchange/knowledge exchange programs
6
Improve existing infrastructure and rationalize costs of doing business
Adopt cluster based development approach where suitable infrastructure is provided to the units operating within those and at reasonable costs
Various clusters should be identified by doing a detailed study and then promoted as ‘Textile & Apparel districts’ within the region
7
Initiatives to promote domestic market development
Phase out supply of second-hand clothing from the market through appropriate policy interventions
Develop a mechanism to regulate flow of cotton to domestic market
8 Investment promotion activities
Organize Mega Trade show in the region showcasing business opportunities in cotton and textile sector and facilitating buyer seller meets

Page 17 of 154
1. Project Background and Objective
The cotton, textile and clothing exports from the East African nations (Kenya, Uganda, Tanzania &
Sudan) into the EU market are almost negligible despite the potential of the region and the existence
of trade agreements between EU and these Eastern African countries.
To promote trade in Cotton, Textile & Apparel (CTA) sector between East African region and the EU,
the African Cotton and Textile Industries Federation (ACTIF), which is a not for profit regional
industry/trade body, with the support of Centre for the Development of Enterprise (CDE), proposed
to get a comprehensive supply side analysis done for the CTA sector of above mentioned four
countries.
The study aims to accomplish following objectives:
a) Provide a source of information for buyer/seller matchmaking to grow exports and
encourage regional integration.
b) Monitor growth (exports/employment trends).
c) Identify potential regional strengths (product emphasis) and weaknesses.
d) Identify gaps in institutional structures and communication channels.
e) Provide a base for encouraging optimum use of existing R&D and Training facilities within
the region.
f) Explore the status and potential for each country to explore niche segments in the EU
market through fair trade & bio cotton (organic) or equitable cotton production.
As a result of this intervention, ACTIF will be empowered to provide better services to its members
and encourage trade linkages of Africa with the EU Market. This includes:
I. Assistance to ACTIF to update the supply side information for developing linkages with the
prospective buyers regionally and internationally.
II. ACTIF will benefit by increasing its membership and developing linkages with potential
regional and EU market buyers with an interest to import from its members.
III. A comprehensive sector analysis report will help ACTIF to advise government and other
agencies on the needs to develop exports.
IV. Assist ACTIF to generate a sustainable plan for the growth of fiber to fashion value chain
through Private Public Partnerships (PPP).
V. ACTIF members stand to benefit from a sector supply side analysis which will establish the
short comings of the existing suppliers and identify the needs for up gradation for the plants
and machinery as well as capacity building to be able to access regional and international
markets.

Page 18 of 154
VI. ACTIF members with a potential of increasing their exports or developing exports would
benefit by understanding the demand and the procedures to enter the EU market.
VII. The Supply Side Analysis Report will identify the gaps in institutional structures,
communication channels & competitiveness.
VIII. The report will also provide a base for encouraging optimum use of existing R&D and
Training facilities within the region.
IX. The report on Fair trade & bio cotton (organic) or equitable cotton production will enable
ACTIF to draw up recommendations to its members for exploiting the niche segments within
the EU market.
Intertek (Mauritius) and Wazir Advisors (India) as a consortium were selected through a competitive
bidding process as Consultants to conduct this study. The Consultants, with the assistance of ACTIF,
further appointed local consultants in each of the target countries to conduct deeper research in
these regions.

Page 19 of 154
2. Project Methodology and Timeline
2.1. Methodology
The project involved a combination of extensive primary and secondary research, data analysis and
interpretation based on the following work-steps:
2.1.1. Industry Mapping
A comprehensive mapping of the CTA sector in each of the four countries was done through
extensive primary and secondary research work. The details are as follows:
Primary Research
Primary research was conducted in target countries of Kenya, Uganda, Tanzania and Sudan with the
assistance of local consultants. The discussions with various stakeholders were held using the
structured questionnaires and / or discussion guides (included in annexure).
The primary objective of these one-to-one meetings was to understand the current industry
scenario, identify key issues the industry is facing from different perspectives (for e.g. ginner, textile
mill, association, etc.), and identify some of the key initiatives taken by the industry, amongst others.
Industry Mapping
1Interpretation and Analysis
Final Report
2 4
Primary research (Interaction with value chain members in each country)
Desk research
Fact based analysis at country level and regional level
Benchmarking
Growth enablers and inhibiters
SWOT Analysis
Directory listing of value chain members and supporting functionaries
Component wise analysis: Cotton, Ginning, Spinning, Fabrics and Garment
Micro and Macro environment analysis
Industry structure analysis
Competitiveness for exports with focus on EU market
Strategy Formulation
3
Growth strategy formulation for increase in regional trade with EU
Figure 1: Project Methodology

Page 20 of 154
Following was the timeline for conducting primary research:
Table 1: Primary Research Timeline
Country 3
0 A
pr
1 M
ay
2 M
ay
3 M
ay
4 M
ay
5 M
ay
6 M
ay
7 M
ay
8 M
ay
9 M
ay
10
May
11
May
12
May
13
May
14
May
15
May
16
May
17
May
18
May
Kenya
Tanzania
Uganda
Sudan
In addition to the above timeline, local consultants were in touch with the industry stakeholders on
continuous basis for the entire duration of the project. Stakeholder interaction also happened over
phone and emails, primarily for follow-ups.
The coverage of primary research was as follows:
Table 2: Primary Research Coverage
Country
Gin
nin
g u
nit
s
Spin
ner
s
We
avin
g co
mp
anie
s
Kn
itti
ng
com
pan
ies
Pro
cess
ho
use
s
Gar
me
nt
com
pan
ies
Trad
e u
nio
n
Inve
stm
ent
pro
mo
tio
n a
uth
ori
ty
Co
tto
n b
oar
d
Trad
e zo
nes
Fash
ion
ho
use
Un
ive
rsit
y /
Fash
ion
sch
oo
ls
Trad
e as
soci
atio
n
Go
vern
men
t b
od
ies
/ m
inis
trie
s
Co
tto
n m
erch
ant
Agr
icu
ltu
re r
esea
rch
inst
itu
te
Bu
reau
of
stan
dar
ds
Kenya
Sudan
Tanzania
Uganda

Page 21 of 154
Secondary Research
An exhaustive secondary research was carried out for the target countries, EU market and leading
global T&A exporters by studying a large number of documents and databases available online or
otherwise, as mentioned in the section on sources of information. The review of existing literature
also included country / issue specific reports provided by associations in target countries. The list of
sources of information is included as annexure.
2.1.2. Interpretation and Analysis
Fact Based Analysis
The information and data collected through primary and secondary research was collated and
analyzed to present an overall picture at the country and regional level. In addition to providing
factual industry trends and insights, we have also presented our own interpretation,
recommendations & key insights about the sector.
Benchmarking
Comparison of CTA sector of each of the target countries has been done with other major exporters
(like China and India) to see the difference in terms of:
Policy support
Marketing approach
Manufacturing capability
Technology level
R&D input
Product offering
Pricing
Services
Growth enablers and inhibitors
The various growth enablers and inhibitors in each country are analyzed and discussed in length in
respective sections, covering:
Growth in demand of textile products
in globally and EU
Concentration of textile production
activity in certain clusters
Fluctuation in raw material price
Adoption / emergence of new
technology
Competition from other nations
Partnership Change in regulatory
environment
Directory Listing
Directory listing of all the significant stakeholders across the value chain has been done comprising
of ginners, spinning & weaving, processing, garmenting, etc. In addition to these, all the National
associations or other important stakeholders, such as Government Ministries/departments and
training/research facilities has also included in the directory listing.

Page 22 of 154
2.1.3. Strategy Formulation
On the basis of collected facts and figures, we have analyzed and brought out the underlying reasons
for issues and provided strategies to address the same at the country level and regional level.
2.1.4. Final Report
The final report containing all the information as specified in Terms of Reference for the assignment
and our recommendations has been compiled in report form for submission.
The report is divided in two sections:
Section A – CTA Supply Side Analysis of Target Countries
Section B – Directory Listing
2.2 Project Timeline
The assignment has been completed on time following the timeline as mentioned in the original
proposal, which was:
Table 3: Project Timeline
Activity March April May Jun July
Project planning
Secondary research
Primary research
Data Collation and Analysis
Strategy formulation
Final Presentation
Final report submission

Page 23 of 154
3. Country Level Analysis
3.1. Kenya
3.1.1. Country Overview
Kenya is the regional hub for trade and finance in East Africa. Kenya's economy is market-based,
with a few state-owned infrastructure enterprises, and maintains a liberalized external trade system.
The country's economic prospects are positive with expected GDP growth of 4-5%, largely because
of expansions in tourism, telecommunications, transport, construction and a recovery in agriculture.
The current size of Kenyan economy is US$ 32 Bn (2010, nominal GDP). The per capita GDP is
estimated at ~ US$ 888 (2010, Nominal). The service sector is the largest contributor to economic
activity, contributing ~62% to the GDP; dominated largely by trade hotels and restaurants, transport
and communications.
Figure 2: Economic Snapshot, Kenya
Source: World Economic Outlook Database, IMF
3.1.2. Cotton, Textile and Apparel Sector Overview
Cotton was introduced in Kenya in the year 1902 by British Colonial administration. In the year 1953,
Cotton Lint and Seed Marketing Board were established by the government whose major role was to
undertake production, processing and marketing of the cotton sector. At the same time, the
Cooperative Unions were also formed to handle primary activities like input supply and payment to
the farmers.
Since Independence (1963), Kenya’s cotton textile and apparel industry has gone through major
phases. At the time of independence, the industry was dominated by the private ginners. Over the
next ten years, Government provided a lot of support in the form of well organised marketing
0
200
400
600
800
1,000
0
10
20
30
40
2000 2001 2002 2003 2004 2005 2006 2007 2008 2009 2010E
GD
P p
er
cap
ita
(US$
)
GD
P in
US$
bn
GDP (nominal) GDPper capita (Nominal)

Page 24 of 154
system and timely payments. In addition to this, the Government also invested in number of textile
mills which largely supplied to the large private apparel (garment) manufacturers.
Kenya's cotton industry was largely controlled by Cotton Board of Kenya till 1991. However, the
government decided to liberate the sector in 1991 and allowed private investors to participate in the
cotton sector. As a result of this, the government support started declining, and this subsequently
resulted in the decline in cotton production.
Cotton is mainly grown in Arid and Semi-Arid Areas where there are limited economic activities. It is
grown solely by small-scale farmers in Western, Nyanza, Central, Rift Valley, Eastern and Coast
provinces of Kenya. An estimated 200,000 farmers grow most of the cotton on holdings of less than
one hectare.
The sector faces certain challenges which include competition from the synthetic fabric, cheap
imports of second hand clothes, high production cost, etc. Cotton production has shown a declining
trend in the past two decades. However, it is slowly picking up after years of neglect and
disillusionment among farmers.
Cotton is considered under the Country Vision 2030 and in the Government Medium Term Plan
2008-2012 as one of the most important industries to implement the long term Arid and Semi-Arid
Lands (ASAL) development initiatives and industrialization strategy. The government is implementing
revival initiatives of the sector that started in 2005.

Page 25 of 154
3.1.3. Value Chain Analysis
3.1.3.1. Overview
Figure 3: Kenya's CTA Value Chain Overview
No. of farmers: ~2, 00,000 Average Yield (Seed cotton): Average: 572 kg/ha Potential: 2,000 kg/ha Average Cotton Holding: 0.5- 1 ha
No of ginneries: Co-operatives:4 Private: 18 Installed Ginning Capacity: 140,000 bales/annum GOT of cotton lint: 33%
Installed Spinning Capacity: Short Staple: 1, 00,000 Long Staple: 4,000 O-E Rotors: 1,200
No. of textile Mills: 12 Main Products: Woven Fabric
Garment Manufacturers: Large Scale: 170 Main Products/Markets: Domestic Market: Trousers, Uniforms etc Export Market: Jeans,
Trousers/Pants, Shorts, Shirts,
etc

Page 26 of 154
3.1.3.2. Cotton Fiber
The cotton sector in Kenya is characterized by a large number of small holder farmers. Eighty
percent of Kenya’s land area is Arid and Semi-Arid Land (ASAL) with limited economic opportunities
for the communities in these areas. Cotton is among the few cash crops that flourish in the AS AL
regions, and hence a major potential source of employment, income generation and food security.
From the year 2005 to date the Government through the Ministry of Agriculture has continued to
support the cotton sector.
Table 4: Cotton Sector Profile, Kenya
Exchange Rate used: Euro=130 KES
Source: Primary Research Findings
Production Statistics
In Kenya, cotton is currently grown mainly by small-scale farmers in Western, Nyanza, Central, Rift Valley, Eastern and Coast Provinces of Kenya. An estimated 200,000 farmers grow most of the cotton on holdings of less than one hectare. Majority of the production takes place in the Eastern zone comprising Coastal, Eastern and North eastern regions. These regions contribute to ~85% of the production. While the Western zone, comprising Nyanza, Rift Valley and other western regions, contribute to about 15% of the seed cotton production.
No. of farmers ~2,00,000
Average Productivity <300 kg/acre
Seed cotton price paid to farmers
Price in Currency KES 35/kg cotton seed
Euro Equivalent 0.27 Euro/kg
Average Yield
Current 253 kg/ha
Potential 2,000 kg/ha
Seed Planting Rate 15 kg/hectare
Variety of Cotton Gossypium Hirsutum (American upland cotton)
Average farm size 0.5- 1 ha
Land Available for Cotton Production 43,000 ha

Page 27 of 154
Table 5: Regional Cotton Seed Production 2010, Kenya
Zones Region Area Planted (Ha)
Area Harvested (Ha)
Seed Cotton Production (Tons)
Price of Seed Cotton (KES/Ton)
Western Nyanza 1,887 1,451 1,117 50,000
Western 782 537 197 55,000
Rift Valley 852 840 483 34,000
Western Total 3,521 2,828 1,796
Eastern Coast 8,027 6,248 3,624 37,000
Eastern 13,000 11,000 6400 37,000
North Eastern 5 3 2 37,000
Eastern Total 31,020 21,032 10,026
Grand Total 34,541 23,860 11,822 Source: Cotton Development Authority, Kenya
Cotton Statistics (1990-2011)
Production was low, at <23k bales up to 2005 due to lack of incentives to growers in terms of prices,
marketing system, credit and poor coordination of the sector. But due to government intervention in
form of provision of seeds, chemicals, training, streamlined marketing system, etc., the cotton
production gradually started increasing reaching to ~55k bales in 2011.
Significant improvement in yield is visible and has resulted in higher production. This has also
lowered the dependence of Kenya's CTA sector on imported cotton.
The cotton imports have reduced over the years as the demand has remained more or less constant
whereas the production has improved considerably. There are almost nil cotton exports from Kenya.
In 2009 the mill demands were lower than previous years, but the production that year was even
lower. The equation ultimately resulted in almost halving the country's cotton inventory.

Page 28 of 154
Table 6: Cotton Balance Sheet (1990-2010), Kenya
Values in ‘000 (480-pound) bales
Year from Aug 1 to Jul 31
Year Opening Stocks Prod. Import
Total Supply
Mill Use Export
Ending Stocks
Harvested
area (000) Acres
Yield Pounds/ Acre
2010 8 49 5 62 50 0 12 104 226
2009 17 23 8 48 40 0 8 99 112
2008 13 46 13 72 55 0 17 106 208
2007 17 38 8 63 50 0 13 89 205
2006 15 46 11 72 55 0 17 82 269
2005 10 20 40 70 50 5 15 74 130
2004 10 20 40 70 50 10 10 91 105
2003 15 20 40 75 55 10 10 124 77
2002 25 20 40 85 55 15 15 124 77
2001 35 20 30 85 50 10 25 74 130
2000 40 20 35 95 50 10 35 136 71
1999 30 30 40 100 60 0 40 136 106
1998 20 30 40 90 60 0 30 136 106
1997 10 30 40 80 60 0 20 136 106
1996 10 25 35 70 60 0 10 136 88
1995 10 20 40 70 60 0 10 148 65
1994 15 15 40 70 60 0 10 99 73
1993 15 20 40 75 60 0 15 138 70
1992 15 20 35 70 55 0 15 138 70
1991 16 24 35 75 60 0 15 148 78
1990 15 26 37 78 62 0 16 151 83
Source: National Cotton Council of America
Planting Seasons
The growing seasons of cotton in Kenya is shown in the table below
Table 7: Cotton Planting Seasons in Kenya
Eastern Kenya Western Kenya
Sowing October March
Bottom crop Jan / Feb -
Main crop July Aug/Sep
Ginning period Bottom crop – 1 month Main crop – 2/3 months
2/3 months
Source : Primary Research Finding

Page 29 of 154
Cotton Characteristics
The cultivated cotton in Kenya is mainly of the American Upland type (Gossypium hirsutum).
Currently there are two varieties of cotton grown in Kenya i.e. HART 89 M and KSA 81 M.
Cotton Grades
The main Quality and Grade measure for local cottons is by Grades A (AR) and B (BR); and Variety
(HART 89M and KSA 81M). Grade AR is the higher grade of the Roller ginned cotton and BR is the
lower grade of the Roller ginned cotton. All the cotton in the country is roller ginned.
Cotton Types
Currently there are two dominant varieties of cotton grown in Kenya:
Table 8: Kenyan Cotton Varieties
Variety Length Fineness
(Micronaire)
Share Growing area Yield-rain fed Kg/ha
Yield- irrigated Kg/ha
HART 89M 28-29 3.8-4.2 60% East of rift 2,500 4,000
KSA 81 M 28-29 3.8-4.2 40% West of rift 2,000 3,000
Source: Cotton Development Authority
There are now over five new varieties of cotton that are undergoing national performance trials with
Kenya Plant Health Inspectorate Service (KEPHIS).
Key Initiatives
Bt Cotton
Bt (Bacillus thuringiensis) cotton trials had been carried out in Kenya for last 5-6 years in confined
fields by Kenya Agricultural Research Institute (KARI) with an aim to control African bollworm and
make cotton pest control more efficient thereby increasing farmers return while conserving the
environment. Bt cotton produces an insecticidal protein from the naturally occurring soil bacterium
Bt making it insect resistant. This reduces the cost of production as no pesticides would be required.
The commercialization initiative has been carried out by various stakeholders to revive the cotton
industry. Bt cotton technology would increase the productivity and hence would help boost the
revival of the sector. It is expected to commercialize by 2014.
Organic Cotton
Organic cotton trials are being carried out in Kenya for last five years in Lamu. Gin in Kiboka
processes organic cotton from Tanzania.
Certified Seed Cotton Production
In order to improve the cotton production and create employment, the CODA in consultation with
the stakeholders convened a meeting to chart the way forward for cotton seed production in Kenya.
Kenya Seed Company was identified as the most suitable seed

Page 30 of 154
merchant for certified seed cotton production. The plan for implementation of Certified Seed cotton
production for the next 3 years is given below:
Table 9: Implementation Plan for Certified Seed Cotton, Kenya
Source: Kenya Seed Company Ltd
Fair-trade Cotton
Fair-trade Cotton is a two year project which aims at improving the lives of small-scale cotton
farmers in two of Kenya’s poorest districts, Kitui and Mwingi. This project is funded by Comic Relief.
It will enable small holder farmers in Kitui and Mwingi to increase their income from cotton by
helping them in improving their production and linking them into a fair trade supply chain through a
local ginnery. Guaranteed fair trade sales will mean farmers receive an increased and consistent
price for their cotton and are able to improve their families’ standard of living. In total, the lives of
2,500 farmers and their families (12,500 people) will be improved.
3.1.3.3. Ginning
There are 22 ginneries spread out in the cotton growing provinces in Kenya. Out of these only 10 are
operational. The operating ginneries are - Meru Ginnery, Makueni Ginnery, Kitui Ginnery, Nyanza
Ginnery, Salawa Ginnery, Ndeere Ginnery, Luanda Farmers’ Cooperative Union Ginnery, Mwea
Ginnery, Malindi Ginnery, Voi Ginnery and Mpeketoni Ginnery.
However, these ginneries are underutilized due to the low supply of seed cotton, which currently
stands at about 25,000 MT.
The cotton co-operative societies own four cotton ginneries in Nyanza and Western provinces –
Ndere, Nambale, Malaba,/Malakisi and Luanda. Three have been leased to private ginnery operators
while only Nambale ginnery is operated by the cooperative society. The leased ginneries are
2011 2012 2013
Western Eastern Western Eastern Western Eastern
Area under certified seed
Plant 60 acres of breeders seed in June at Ahero.
Plant 1 acre of breeders
seed in October in Hola/Bura
Plant 300 acres
of pre-basic seed
in Ahero/ Perkera in
March
Plant 200 acres of
Standard seed in
March in Hola/ Bura. Plant 100
hectares of breeders seed in
October at Hola/Bura.
Plant 300 acres
of basic seed in Ahero/ Perkera in October
Plant 300 acres of pre basic seed
at Hola/Bura in October.
Expected Yields (kgs)
72,000 1,200 360,000 240,000 (standard
seeds) 120,000 (certified
seed)
360,000 360,000

Page 31 of 154
operational but underutilized and the unions are re-organizing themselves to repossess them. These
ginneries are in poor state of maintenance.There are high costs associated with ginning in the
country due to old machineries/equipments and low capacity utilisation.
Table 10: Installed and Operational Gins in Kenya
Province Number of firms Operational Factory
Central 1 1 Mwea
Coast 5 3 Voi, Mpeketoni and Malindi
Eastern 5 3 Kitui, Makueni, Meru (1994)
RVP 1 1 Salawa (Rift Valley Products)
Western 4 0 Luanda on lease (A collection yard for RVP)
Nyanza 6 2 Nyanza and Ndeere (Operating but in a very poor state)
Total 22 10 1 cooper (Ndeere) & 9 privately owned
Source: Primary Research Findings
Out of the existing private ginneries, six were originally owned by the Cotton Board of Kenya (Mwea,
Makueni, Kibos, Meru, Salawa and Hola) but were later sold to private entrepreneurs through
divestiture in the 1990s.
Table 11: Ginning Sector Profile, Kenya
No. of Ginneries 22 Cooperatives Private Investors
4 18
Annual Installed Ginning Capacity 140,000 bales Ginning Equipment Roller - medium to medium long staple cottons
Average GOT% for lint 33%
Capacity Utilization 17-31%
Price for cotton seed FOB/FOT ginnery KES 35/kg cotton seed
Seed Cotton Storage capacity 25,253 MT Source: Primary Research Findings
3.1.3.4. Textiles
During the year 1983, Kenya had 52 textile mills operating with an installed capacity of 115 million
square meters per annum. After market liberalization in the early 1990’s, there was a decline in
textile and apparel industry. The reasons that contributed to the decline of the sector were an
enormous import of textile products and garments and an increase in import of second hand
clothing. Though the Kenyan Government reacted by imposing a duty on such imports, but the
Government’s efforts to limit the import of second hand garments and fabrics was a failure.
Other factors that aggravated the problem include the failure of country’s cotton sub sector,

Page 32 of 154
increased use of synthetic fibers and a worse operating environment in terms of high production
cost and poor infrastructure.
Currently 80% of the domestic lint requirement is met through imports by yarn spinners and fabric
manufacturers. Annual local fabric demand is over 225.0 million square meters and to meet this
demand, about 200,000 bales of cotton are required annually which is for more than the available
cotton. The average capacity utilization for the textile firms is less than 50% capacity and is likely to
remain low unless local supply of lint, yarn and fabric is improved. At present, there are only six
textile mills that spin and weave in the country.
Major products manufactured by the textile sector are listed below:
For local and regional markets Woven fabric for blankets, acrylic yarn
For export markets Organic cotton yarn, organic cotton knit fabric, yarn
and fabric of cotton/manmade-fiber blends, thread
3.1.3.5. Apparel
The garment sector of Kenya is principally driven by exports to the US under the African Growth and
Opportunity Act (AGOA) initiative. As of 2008, there are 35 large scale garment manufacturers
exporting to the US of which 15 are located in the Export Processing Zones (EPZ), 7 enjoy
Manufacturing under Bond (MUB) while 5 operate outside the EPZ and MUB.
It is estimated that there are 170 large scale and ~74,000 small and micro garment/apparel
manufacturers operating in Kenya today. The range of apparel products for both local and domestic
market includes the following:
For local and regional markets Trousers, uniforms, overalls, vests, inner garments
For export markets Jeans, trousers/pants, shorts, shirts, nightwear,
blouses and dresses
The local production of garment accessories (zippers, buttons, etc.) is very limited in terms of variety
and quality. Currently, most of the garment manufacturers import their accessories for finishing the
product.
EPZ Apparel Sector
There has been a lot of emphasis by Kenya’s Export Processing Zone Authority to promote and
provide attractive investment opportunities for the export-oriented business ventures in the
country. It also aims at employment creation and generation of foreign exchange earnings,
technological transfer and creation of linkages with the customs territory in various sectors. One of
the key sectors supported by EPZ is Garment and Textile sector. EPZ textile exports on average make
up 80% of total Kenyan textile exports. According to the Export Processing Zones Annual Program
report, 2010, garment sector remains the dominated sector which constituted 29% of all EPZ
enterprises, 78% of total EPZ local employment, 56% of EPZ exports, 52% of total EPZ sales and 30%
of all EPZ private investment.

Page 33 of 154
Table 12: Garment Sector Performance, Kenya (2010)
(Values in US$ mn) Firms Local Jobs Exports Sales Investments
Garment and Support Services 22 24,137 179 186 78
Others 53 6,889 140 170 181
Proportion of T&A sector 29% 78% 56% 52% 30% Source: Annual report EPZA
Exports of apparel articles have increased by 27% to US$180 Mn in 2010 from US$ 141 Mn in 2009.
Investment on other hand registered an increase of 27% on account of the enterprises expanding
operations and acquisition of new plant, machinery and equipment to meet the market demand.
Table 13: Garment Sector Trends, Kenya
Indicator 2005 2006 2007 2008 2009 2010 % growth (2009 -10)
No. of Enterprises 25 25 22 18 19 16 -16%
Employment (No.) 34,234 31,813 28,506 25,766 24,359 24,114 -1%
Investment (US$ Mn) 99.5 102.8 82.1 74.8 54.2 68.7 27%
Exports (USD million) 145.1 147.1 136.0 156.2 125.4 159.9 24%
Quantity of exports (million pieces)
50.0 46.3 59.6 67.9 58.1 70.3 21%
Exchange rate used: 1US$=80 KES
Source: Annual Report EPZA

Page 34 of 154
3.1.3.6. Support Institutes
The various institutes that support the Cotton, Textile and Apparel sector are listed below:
Table 14: CTA Sector Support Institutes in Kenya and their Functions
Institutions Main Functions
Cotton Development Authority ( CODA)
The Cotton Development Authority (CODA) is a regulatory state corporation was established in 2006. The role of the authority is to promote, coordinate, monitor, regulate and direct the cotton industry in Kenya.
National Cotton Stakeholders Forum (NCSF)
An umbrella body which provides a forum where all stakeholders can discuss issues affecting them and has membership of farmers, ginners, spinners and weavers and textiles and garment manufacturers. It was formed to spearhead the revival of the cotton industry in Kenya.
Kenya Cotton Growers Association
An umbrella body of farmers with representation all over the country and aimed at lobbying for the formulation and implementation of favorable policies and laws for the cotton sub-sector.
Kenya Association of Apparel Manufacturers (KAMEA)
Represents interests of all manufacturers in the cotton textiles industry under the Textiles Manufacturers Association and includes spinners, textiles and garment manufacturers.
Kenya Cotton Ginners Association
Consists of Ginners and its main function is to provide support and lobbying for ginners.
Kenya Association of Manufacturers (KAM)
An umbrella body of manufacturers which provides an essential link for co-operation, dialogue and understanding with the Government by promoting trade and investment, upholding standards and representing members’ views and concerns to the relevant authorities
Cotton Board of Kenya-Cotton Secretariat
Provides advisory services to farmers and ginners and a secretariat to the Cotton Ginners Association
Kenya Agricultural Research Institute (KARI)
Provides research and extension services to farmers
Kenya Bureau of Standards (KEBS)
Facilitate quality control and assurance

Page 35 of 154
3.1.4. Sector Competitiveness
3.1.4.1. Raw material
Cotton production in the country as well as the land under cultivation has declined over the years.
Most of the cotton is imported from neighboring countries of Tanzania and Uganda. Few initiatives
have been undertaken for value added cotton such as trials are being conducted for organic cotton
as well as Bt. Cotton.
3.1.4.2. Manpower
There is availability of manpower but the present workforce lacks the requisite skills and training to
do the required job. There is huge requirement of skilled workers especially in manufacturing areas
of spinning, weaving, processing and garmenting.
3.1.4.3. Power, Water & Fuel
Power supply is consistent in Kenya, however, the costs of power is relatively higher which leads to
high costs of business. Likewise, water and fuel costs are also high adding to the total manufacturing
costs.
3.1.4.4. Financial support
Majority of the industry players find it very difficult to borrow funds from the banks and other
financial institutions. Even if they manage to seek funds, it is possible only at very high rates of
interest (~16-18%) and thus, makes it unaffordable for the industry.
3.1.4.5. Market access
Kenya made textile and apparel products can enter most of the world’s richer economies free of any
customs duties and with limited/no quota restrictions. Some of the trade agreements that they have
signed up for preferential market access includes:
African Growth and Opportunity Act (AGOA)
Economic Partnership Agreement (EPA) with EU
Common Market for Eastern and Southern Africa (COMESA)
East African Community (EAC)
3.1.4.6. Technology
The technology currently in use is outdated particularly in the areas like ginning, spinning and
weaving. Certain mills have unutilized machineries owing to lack of functionality and efficiency.
Machineries in the garmenting sector are relatively new and fully functional.
3.1.4.7. Industrial zones
The no. of gazette zones as at December 2010 stood at 42, of which 40 are privately owned and
operated, while 2 are public owned and operated. About 75 enterprises are operating within these

Page 36 of 154
zones and have made cumulative investments of US$ 290 million. The location details of these 42
zones are listed below:
1. Athi River/Mavoko/Mlolongo : 03
2. Nairobi : 09
3. Mombasa : 20
4. Voi : 01
5. Kilifi : 03
6. Kerio Valley : 01
7. Thika : 01
8. Isinya, Kajiado : 01
9. Ruiru : 01
10. Malindi : 01
11. Eldoret : 01
3.1.4.8. Research & product development
Research initiatives currently being undertaken are limited as there are very few such institutes. One
such institute is Kenya Agricultural Research Institute (KARI) which does research on farm activities
and exploring the possibilities of value addition and improvement within the existing fields.
3.1.4.9. Value addition
Currently, most of the products made are very basic in designs at the textile level as well as
garments (finished product) level. There is very limited focus on value addition w.r.to designs,
specialized finishes, embroidery, sequins, etc.
3.1.4.10. Compliances and CSR activities
Majority of the firms contribute to charities and make donations as part of CSR activities and also
provide better working conditions at the work place to the labor force. Few firms located at far-flung
areas/export processing zones have created provision for various facilities for employees’ like
crèche, employees’ children education, canteen facilities, activity zones, etc.
3.1.4.11. Logistics and Business Costs
Kenya has its own port at Mombasa while most of the textile mills are located in the capital city of
Nairobi. The overall procedure for customs clearance, documentation and processing takes lot of
time causing delays in the shipment. The sailing time from Nairobi to China is ~25-30 days. The costs
of doing business in Kenya are relatively high owing to high costs of power and interest costs. Details
on each of the cost component are given ahead:

Page 37 of 154
Table 15: Logistics and Business Costs, Kenya
Power Availability Consistent
Power cost US cents 20 / unit
Lending rate 16%
Water cost US$ 2 / cu. m.
Wage/ month ~US$ 100
Own Port Yes
Nearest port Mombasa
Sailing time from China 17 days
Sailing time to US 25 days
Freight cost / container (20 ft) Export - US$ 2100 Import - US$ 2200
Source: Primary Research Findings
3.1.4.12. Government Initiatives
The Government is providing targeted support to the smallholder farmers in form of provision of
planting seeds as a food security measure, advisory service through extension service and cotton
research. The Government through the Cotton Development Authority (CODA) has initiated
measures like collaborative research, establishing input supply system etc., to improve
competitiveness in terms of yields, quality, costs and logistics.
3.1.4.13. Domestic market
The domestic market is characterized by all sorts of dresses – T-shirts, jeans, office wear, skirts,
shorts, etc. Lots of domestic manufacturers make work-wear garments which includes uniforms for
corporate, schools, army people, etc.
Domestic market is affected by huge imports of second-hand clothing at very low prices. This has led
to dependence on imported clothing and domestic producers make products mainly for the export
markets.

Page 38 of 154
3.1.5. Foreign Trade
3.1.5.1. Overview
Kenya is a net importer in T&A sector since 2005, with net imports (T&A) amounting to US$ 0.43 Bn
in 2009. T&A exports have declined since 2005 from US$ 0.34 Bn to US$ 0.25 Bn. Share of T&A
exports in country’s total exports have declined gradually from ~11% in 2005 to ~6% in 2009.
T&A imports have witnessed increase from US$ 0.5 Bn in 2005 to US$ 0.7 Bn in 2009, thus
registering a compounded growth of 8%. Share of T&A imports in country’s total imports has
declined from ~17% in 2005 to ~7% in 2006 and it is consistently at ~7% thereafter. Kenya’s exports
consist of Women's woven suits, jackets, knitted jerseys, pullovers whereas imports constitute worn
clothing and woven fabric of synthetic filament yarn. USA is the leading market for Kenya whereas
China is the leading supplier to them.
Figure 4: Kenya’s Overall Trade
Figure 5: Kenya’s CTA sector Trade
Source: UN Commodity Trade Statistics Database Table 16: Key CTA Sector Export and Import Statistics, Kenya (2009)
Top 4 exported commodities 65% Top 4 imported commodities 39%
Women's woven suits, jackets etc. 27% Worn clothing 13%
Knitted jerseys, pullovers, etc. 15% Woven fabric of synthetic filament yarn 13%
Women's knitted suits, jackets etc. 13% Woven fabric with more than 85%
cotton, less than 200 gsm 8%
Men's suits, jackets etc. 11% Linen 5%
Leading 4 markets 89% Leading 4 suppliers 65%
USA 81% China 38%
Uganda 4% India 11%
China 2% UAE 10%
Tanzania 2% Hong Kong 6%
Source: UN Commodity Trade Statistics Database
3.13.3 3.6
4.9 4.13.0
7.28.7
9.6 9.4
2005 2006 2007 2008 2009Total Exports Total Imports
Values in US$Bn
0.34 0.33 0.32 0.320.25
0.50 0.520.62
0.71 0.68
2005 2006 2007 2008 2009T&A Exports T&A Imports
Values in US$Bn

Page 39 of 154
3.1.5.2. Exports to EU
Kenya is a minor supplier of textile and apparel product to EU. Kenya’s T&A exports to EU-27 during
the year 2010 were valued at US$ 8.5 Mn. The value of exports with EU-27 has been declining during
the last 5 years.
Figure 6: Kenya’s CTA Sector Exports to EU
Source: Eurostat
Table 17: Major Categories of EU imports from Kenya
Values in US$ Mn
2006 2007 2008 2009 2010 CAGR 2010 share
Other veg. fiber e.g. coconut, abaca, sisal, ramie, & their waste
5.5 5.2 6.4 3.2 3.2 -14% 38%
Sacks & bags 0.0 0.0 0.0 0.0 1.4 330% 16%
Linen 0.2 0.2 0.1 0.1 0.9 77% 11%
Cotton yarn, with >= 85% cotton 3.8 2.3 1.2 1.4 0.6 -34% 8%
Women's suits, jackets, dresses, skirts, shorts, etc.
0.0 0.1 0.1 0.2 0.5 71% 6%
Subtotal top 5 categories 9.6 7.8 7.8 5.0 6.7 -5% 79%
Others 2.8 3.4 2.6 1.2 1.8 -19% 21%
Total 12.4 11.2 10.4 6.2 8.5 -9% 100%
Source: Eurostat
3.1.5.3. Exports to USA
USA is the leading market for Kenya’s textile and apparel exports, with exports valued at US$ 202.2
12.411.2
10.4
6.2
8.5
2006 2007 2008 2009 2010
CAGR- 9%
Values in US$ Mn

Page 40 of 154
Mn in 2010. The value of T&A exports with the US shows a declining trend over the last five years.
(See the figure below)
Figure 7:Kenya’s CTA Sector Exports to US
Source: Otexa Table 18: Major Categories of the US imports from Kenya
Values in US$ Mn
2006 2007 2008 2009 2010 CAGR 2010 share
Women’s, girls suits, jacket, dress, skirt, etc.
126.0 104.5 106.4 64.1 50.4 -17% 25%
Men’s or boys suits, jackets, trousers etc.
59.1 52.4 37.4 24.5 31.6 -12% 16%
Jerseys, pullovers, cardigans, etc., knit or crochet
25.2 25.7 35.7 35.3 46.2 13% 23%
Women’s, girls suit, dress, skirt, etc., knit or crochet
13.5 21.1 25.2 30.4 31.9 19% 16%
T-shirts, singlet’s and other vests 7.7 3.7 7.0 4.4 3.9 -13% 2%
Men's or boys' shirts 5.1 3.6 1.4 1.5 1.6 -21% 1%
Sub Total 236.6 211.0 213.0 160.1 165.6 -7% 82%
Others 27.2 38.1 33.9 35.2 36.6 6% 18%
Total 263.8 249.1 246.9 195.4 202.2 -5% 100%
Source: Otexa
263.8249.1 246.9
195.4 202.2
2006 2007 2008 2009 2010
CAGR -5%
Values in US$ Mn

Page 41 of 154
3.1.6. SWOT Analysis
Strengths:
1. Increased focus on the sector: Government is laying focus on the sector and is committed to
revitalize the cotton sector. This will provide additional momentum to the sector and will create
interests of amongst the existing industry players as well as the potential investors.
2. Active stakeholder’s forum (National Cotton Stakeholders Forum): This forum tries to address
the issues of various stakeholders and promote development of the sector.
3. Export driven sector: The apparel sector is largely exports driven and currently contributes to
about 56% of the EPZ exports. This offers opportunities to the international textile players to set
up their manufacturing capacities in Kenya.
Weaknesses:
1. Inefficient farm practices: Low cotton yields due to poor quality planting seeds, untimely land
preparation, poor pest control as well as inadequate use of fertilizers and manure.
2. High production costs: All the business costs are quite high with respect to farm inputs
(spraying, weeding, harvesting, and use of pesticides) or manufacturing costs (power, fuel).
Thus, the domestic product loses its competitiveness and industry people prefer to import
intermediate goods rather than manufacturing it locally.
3. Outdated technology: Current machineries / technology in use are very outdated particularly for
ginning and textile sector. This further adds to the costs of manufacturing. Sector is currently
facing lack of new investments for upgrading technology.
4. High borrowing costs: The existing costs of borrowing are so high that it almost makes it
impossible for the sector to rely on these financial institutions. Even if they manage to bear the
high costs, the formalities for loan approvals, requirements for collaterals and other
documentation are intense.
5. Lack of support institutions for training and skill development: There is a huge requirement for
enhancing the skills of people to increase their efficiency levels. The current infrastructure
provides for very few such institutions with limited capacities and has few enrollments for the
training facilities. There is a need for promoting these institutions (new and old), supporting
these with the necessary infrastructure and churn out large no. of trainees each year.
6. Lack of well-developed transport infrastructure: The current road, rail, port infrastructure
needs improvement to overcome delays in transit as well as procedural formalities. The current
procedure for customs clearance, documentation and processing takes lot of time causing

Page 42 of 154
unforeseen delays in the shipment.
7. Absence of integrated supply chain: Though the industry has presence across farm to finished
products, there are certain weak links which needs to be strengthened with focused attention
and investments. For e.g., there are several garmenting units with foreign investments which fail
to source fabric locally. They are highly dependent on other economies for fabric imports and
then process it to make garments.
8. Absence of institutional infrastructure: To facilitate dialogue across the entire farm-to-finished
product supply chain. There is a need to integrate various value adding activities and help create
demand for primary inputs as well as enhance the competitiveness of finished goods.
Opportunities:
1. Huge demand potential: Enduring demand for cotton fabrics and textiles due to rising
population, increasing income, and changing consumer patterns in preference for cotton textiles
and apparel.
2. Increased investments in the sector: Specific budget allocation by the government will increase
investments in textiles manufacturing and enhance skills development, boost incomes and jobs,
and underpin a more sustainable domestic industrialisation strategy.
3. Scope for value addition: There is a lot of scope for making value added products particularly for
the export markets such as adding embroidery, sequins, and other style/design elements. This
will bring in incremental revenue to the sector and will also lead to more employment creation
and skill enhancement.
Threats:
1. Threat from second hand articles: There are huge imports of second hand clothes in the country
which is posing a big threat to the economy. The present legal framework is not strong enough
to prevent this practice.
2. Competition from leading global textile manufacturers: With the end of Multi-Fibre Agreement
in 2005 and establishment of Customs Union on 1st January 2005, the domestic sector is facing
tough competition from Chinese and Asian companies which have high productivity levels and
enjoys economies of scale.
3. Huge dependencies of select markets for exports: Kenya’s garment industry is principally
dependent on AGOA and the U.S. market, making the entire industry vulnerable to fluctuations
in these markets and their policies.

Page 43 of 154
3.1.7. Recommendations
After conducting a comprehensive analysis of CTA sector in Kenya, we did a SWOT analysis which
brings out the key issues that the sector is currently facing. These are strategic issues which need to
be addressed keeping in mind the relative strength areas of Kenya and its CTA sector. Following
recommendations are made for improving/strengthening the CTA sector performance:
S.no. Objectives Recommendations
1 Increasing cotton quality and yield
Improve farm practices
Create awareness among farmers
Support R&D centers for introducing high yielding seeds
Promote contract farming
Offer more extension programmes
2 Promoting value added products in garmenting
Garmenting sector is relatively big in Kenya but the focus has always been on basic products and uniforms. There is an opportunity to do value addition in garmenting by providing:
Support schemes/fiscal incentives on value addition
Promoting clusters for doing value addition
3 Support for modernization and capacity expansion
Interest subsidies shall be provided for upgrading machineries or installing new machineries
T&A sector shall be classified as Priority sector and thus, increased lending to the sector should be a prime focus
Establish JVs with international partners
4 Improving skills of people through adequate training
Introduce schemes for training and skill development and create a fund for implementing the scheme which will aid:
Establishing new training centers
Establishing new training programs
Strengthening existing training centers
Linking existing centers with the Industry

Page 44 of 154
5 Promote education in the field of textiles and fashion designing
Establish new colleges for textiles/fashion designing
Link existing centers with the Industry
Update course curriculum regulatory as per industry requirements
Tie-up with other international colleges for student exchange/knowledge exchange programs
6 Improve existing infrastructure and rationalize costs of doing business
Adopt cluster based development approach where suitable infrastructure is provided to the units operating within those and at reasonable costs
Various clusters should be identified by doing a detailed study and then promoted as ‘T&A districts’ within the region
7 Initiatives to promote domestic market development
Phase out supply of second-hand clothing from the market through appropriate policy interventions
Organize regional level design competition and fashion shows to create and promote domestic fashion industry
8 Promote investments in the sector
Organize Mega Trade shows in the country to promote investments in the sector An event shall be held in which all the buyers, sellers, investors, industry associations and support institutions should participate. There should be an Investors summit showcasing business opportunities in Kenya’s textile sector. It will also serve a platform for organizing Buyer-seller meets.
All these recommendations have been dealt in detail under Chapter 5: Benchmarking and Proposed
Interventions, where we have compared the target countries with the leading CTA manufacturing
countries of the world on the key parameters.

Page 45 of 154
3.2. Sudan
3.2.1. Country Overview
Sudan is the largest and one of the most geographically diverse countries in Africa. It possesses rich
mineral resources including petroleum, natural gas, gold, silver, chromite & asbestos. Until the
second half of 2008, Sudan's economy boomed on the back of increases in oil production, high oil
prices, and large inflows of foreign direct investment. GDP growth registered more than 10% per
year in 2006 and 2007. From 1997 to date, Sudan has been working with the IMF to implement
macroeconomic reforms.
The current size of Sudan’s economy is ~ US$ 66 Bn (2010, nominal GDP). The per capita GDP is
estimated at ~ US$ 1,705 (2010, Nominal). The service sector is the largest contributor to economic
activity, contributing ~39% to the GDP; dominated largely by wholesale, retail trade, transport &
communications.
Figure 8: Economic Snapshot, Sudan
Source: World Economic Outlook Database, IMF
3.2.2. Cotton, Textile and Apparel Sector Overview
The first modern textile factory was established by the private sector in Anzara (Equatoria State), in
1945. It was designed to produce 4 to 5 million yards per year, using raw cotton grown and ginned in
the same local area. However, the thought of building textile industries on a large scale began with
the set-up of the first national government, immediately after independence in 1956. The first textile
plant, Sudan Textile Factory, was established in 1962, completely financed by the Sudanese private
sector. A considerable number of factories followed soon.
The sector has been on a downtrend since last many years as it is facing several financial and
technical difficulties. Most of the mills have closed down; the ones which are working are largely
underutilized. Most of the cotton produced in the country is exported in fiber form. The market is
0
200
400
600
800
1,000
1,200
1,400
1,600
1,800
0
10
20
30
40
50
60
70
2000 2001 2002 2003 2004 2005 2006 2007 2008 2009 2010E
GD
P p
er
cap
ita
(US$
)
GD
P in
US$
bn
GDP (nominal) GDPper capita (Nominal)

Page 46 of 154
largely dominated by imported textile and apparel goods.
Since 1990s the inflation had been very high, this led to high costs of doing business which ultimately
led to downfall of the sector. However, in recent years there has been a renewed interest on the
part of Government to revive the sector. The Ministry of Industry in its plan for 2002 concentrated to
upgrade of textile and spinning industry.
The authorities have taken the CTA sector as the priority sector and are pushing for the growth in
sector. Sudanese Cotton Council is also taking various enabling initiatives like providing cotton seeds,
funds and crop insurance to farmers. Some foreign companies have also expressed interest about
investing in around 250,000 acres of cotton cultivation.
The Sudan Cotton Company Ltd. (SCCL), marketer of all cotton produced in Sudan, has signed
contracts of importing 10 advanced cotton ginneries. The ginning units will have state-of-the-art
equipment from Turkish and Brazilian technology suppliers. As per a certain economic and social
plan, the rehabilitation and operation of the textile factories of Kosti, El-Duwaim, al-Haj Abdullah
and Shendi are planned.

Page 47 of 154
3.2.3. Value Chain Analysis
3.2.3.1. Overview
No. of farmers: >200,000
No of ginneries: 12 Ginning Equipment in Use: Roller and Saw gin
2 open end mills, no ring spinning unit Used to have 16 Spinning plants with a capacity of 63,000 tons / year. Some of these are now under rehabilitation
Used to have 45 weaving and 18 knitting factories, most of which have closed down. 2 knitting units are still operational At present 12 weaving and 5 knitting units are under rehabilitation.
No. of Garment factory:
24 working out of 74
Main Products:
Galabia and Tobe
(national dress), women
and men’s innerwear,
suiting, shirts, blouses
5 factories for
absorbent cotton also
exist
Figure 9: Sudan CTA Value Chain Overview

Page 48 of 154
3.2.3.2. Cotton Fiber
Sudan's cotton industry has assumed a key role since the mid 1920's in its national economic
development both on economic and social grounds.
Cotton used to be the principal foreign exchange earner for the country till early 1990s. Later on, the
share of cotton in Sudan’s foreign export earnings declined whereas share of products like oil,
sesame and livestock have increased.
Cotton provides an important livelihood for an estimated 200,000 growers and their families, in
addition to employing seasonal labor during harvest time. Cotton is grown in Sudan under both
irrigated and rain-fed modes of production. The majority of Sudan’s extra-long staple cotton is
grown in the Gezira Irrigation Scheme. While the scheme is government managed, tenant farmers
decide which areas and varieties to plant. In recent years, more than half of Sudan’s cotton exports
have been Barakat, which requires a longer growing season but earns more at export.
Production Statistics
The area under cotton cultivation has been under a continuous decline from 2005. The main reason
for decline in harvested area under cotton is shift towards food crops. This has led to significant
lowering of cotton production.
Most of the cotton produced in Sudan is exported. Major importers of Sudan’s cotton are Egypt in
Africa; Germany & Italy in Europe; and China, India, Thailand & Bangladesh in Asia. The exports have
reduced drastically in last 5 years or so. Over the years the mill use has also slumped.

Page 49 of 154
Table 19: Cotton Balance Sheet (1990-2010), Sudan
Values in ‘000 (480-pound) bales Year from Aug 1 to Jul 31
Year Opening Stocks Production Imports
Total Supply Mill Use Exports
Ending Stocks
Harvested Area (000) Acres
Yield Pounds/ Acre
2010 62 100 0 162 8 100 54 104 462
2009 160 50 0 210 8 140 62 67 358
2008 193 135 0 328 8 160 160 210 309
2007 293 105 0 398 8 197 193 128 394
2006 292 270 0 562 8 261 293 395 328
2005 310 330 0 640 8 340 292 420 377
2004 78 525 0 603 9 284 310 519 486
2003 194 310 0 504 14 412 78 442 337
2002 215 375 0 590 19 377 194 383 470
2001 191 330 0 521 17 289 215 371 427
2000 38 340 0 378 28 159 191 420 389
1999 23 240 0 263 40 185 38 408 282
1998 101 210 0 311 41 247 23 297 339
1997 97 400 0 497 52 344 101 445 431
1996 37 485 0 522 63 362 97 445 523
1995 30 490 0 520 58 425 37 544 432
1994 32 400 0 432 52 350 30 430 447
1993 75 216 0 291 59 200 32 272 381
1992 69 276 0 345 70 200 75 376 352
1991 143 386 0 529 60 400 69 474 391
1990 223 380 0 603 60 400 143 484 377
Source: National Cotton council of America
Planting Seasons
The cotton planting starts in July and ends in August. Picking takes place from December to March
and ginning starts in December and ends in June.
Cotton Characteristics
The main three types of cultivated cotton, the long and the extra-long staple (Gossypium
barbadense), the medium and short staple cotton (G. hirsutum) are grown under irrigation and rain-
fed. A major cotton variety is Extra Long Staple, which has superior strength and fineness, and is
grown mainly in Gezira State.
Cotton Grades
The grades of Sudan Barakat Cotton GIB, XG2B and G2B are extra-long staple variety. It has early
maturing and high yielding. This variety is superior in fineness and strength. Barakat is mostly grown
in Gezira. The whole crop is handpicked and the ginning is carried out by roller. Acala is medium
staple cotton which is both roller and saw ginned.

Page 50 of 154
Table 20: Historical Prices of Sudanese Cotton
Value in USD cents/lb
Grade 2006-07 2007-08 2008-09 2009-10 2010-11
Barakat Cotton
G1B 91.00 90.16 88.00 121.75 234.00
XG2B 89.00 88.34 86.00 119.75 232.00
G2B 87.00 86.52 84.00 117.75 230.00
Acala Cotton (R.G)
1G 59.00 70.95 - - -
Acala Cotton (S.G)
1SG 57.00 90.16 57.00 78.77 162.00
2SG 56.00 88.34 56.00 77.77 161.00 Source: SCCL (The Sudan Cotton Co. ltd)
Cotton Types
Sudan’s Barakat cotton is 100% handpicked, which maintains fibre length, and gently ginned on
roller gins. The strength of this extra-long staple (ELS) cotton allows the spinning of finer, longer
yarns, yielding a lighter, more supple and durable fabric with thread counts three to four times
higher than commodity cotton. Nour is a non-traditional high count Acala which is highly resistant to
Jassid and bacterial blight. It is longer and stronger compared to traditional Acala. Acala is medium
staple cotton both roller and saw ginned. It is has a good micronaire value and bright colour.
Table 21: Main Fibre Properties of Major Sudanese Cotton Varieties
Variety Length 2.5% SL (mm)
Fineness Micronaire
Strength (g/tex)
HVI
BARAKAT 33 - 36 3.5 - 4.2 26 - 30 34 – 41 NOUR: Roller-Gin 29 – 31 4.4 - 4.7 21 – 23 29 – 34
Saw- Gin 28 – 30 4.4 - 4.6 20 – 22 28 – 33 ACALA:
Roller-Gin 27 – 28 3.8 - 4.3 19 – 22 25 – 32 Saw- Gin 25 – 28 3.7 - 4.4 18 – 22 24 – 31
Source: SCCL (The Sudan Cotton Co. ltd)

Page 51 of 154
Sudan has recently released nine varieties of cotton which are listed below.
Table 22: Main Fibre Properties of Newly Released Varieties, Sudan
Varieties Length: 2.5% Span Length (mm)
Fineness Micronaire
Strength ( g/tex) HVI
Hadi 32.6 3.7 35.0
Siddig 32.8 3.6 37.0 Kheiralla 29.2 4.2 31.5
Hamid 27.9 4.9 30.1 Knight 29.3 4.5 31.1 Abdin 31.8 4.4 34.0 Wager 28.9 4.5 30.4 Burhan 29.4 5.2 30.3 Khalifa 27.3 4.1 28.0
Source: SCCL (The Sudan Cotton Co. ltd)
Key Initiatives
Release of Extra fine count cotton
Sudan has recently released a top class, extra-fine count cotton, a cultivar combining traditional
Sakel with high-yielding Lambert varieties. This type of cotton has a high resistance to disease, is the
longest variety and has the finest fibre. Others varieties introduced include Nuba and Acrain, both of
which are rain-fed.
National Agricultural Schemes
Under the framework of privatization policy adopted by the government, a lot of schemes were
transferred into agricultural companies.
Gezira Scheme:
It is the oldest agricultural scheme adopted by the government in 1925 as the biggest irrigated farm
in the world in an area of 2.1 million feddans. The scheme extends through Gezira and Sennar states
and irrigated by flowing irrigation. The scheme contributes by 65% of the country's cotton
production. The Scheme provides great opportunities for investment in agricultural industries and
weaving and spinning industry.
Rahad Agricultural Scheme:
This Scheme was established in the 2nd half of the seventies and extends through Gadaref and
Gezira States. The area of the Scheme is estimated at 800,000 feddans, and 30,000 feddans of the
area were cultivated. Other preparations are underway for the remaining area. The system adopted
in the Scheme is the intensive rotation system whereby all the area of the Scheme are cultivated in
quarterly rotation to produce cotton (medium staple), groundnuts, sorghum and wheat.
Suki Agricultural Scheme:
The Scheme is located in Sennar State and is considered as the smallest federal scheme in an area of
85,000 feddans. The cost of the irrigation in the Scheme is the highest when compared with other
irrigated schemes because of the pump irrigation system. The quarterly rotation system is designed
to grow cotton (medium staple), ground nuts sorghum, wheat and sunflower.

Page 52 of 154
3.2.3.3. Ginning and Oil Pressing
There are 18 ginneries in Sudan which are dispersed in different parts of the country and especially
in cotton producing schemes which are scattered all across the country.
3.2.3.4. Textiles
The textile industry originally started as a traditional industry in the southern province of Equatoria
in 1945 and gradually developed in 1960 by the establishment of Sudan’s textile factory in Khartoum
North which is considered as a biggest factory in Africa at that time. In 1970-75 all existing plans
were set up in both private as well as in public sector. Since 1990 the textile industry began to
collapse mainly due to the liberalization prices policy, high cost of electricity, outdated technology,
etc. Problems of low capacity utilization persist until today, but the Government keeps the sector on
the priority list of the Ministry of Industry.
At present, there are 16 spinning and textile factories in Sudan out of which only four are working
now. The efficiency and the production capacity of these factories is low as compared to their
designated capacity.
3.2.3.5. Apparel
There are 75 garment factories in Sudan out of which only 13 are in operation. The manufacturing of
apparel and clothing in Sudan is mainly for domestic consumption. The exports of apparel and
apparel made ups are almost negligible.
The most commons products manufactured are Galabia and Tobe ( the national dress), innerwear,
suiting (trousers and shirts), shirts, blouses, grey loom state cloth ( pure cotton) count 16/1,
bleached count Ne 16/1, bed sheets , blankets, etc.
3.2.3.6. Support Institutes
The Sudan Cotton company Ltd
The Sudan Cotton company Ltd was established in 1990 to undertake the marketing of all cotton
produced in Sudan.
Industrial Research and Consultancy Centre
The Industrial Research and Consultancy Centre (IRCC) is the Research Institute in Sudan that focuses
on Industrial Research and Consultancy to the Sudanese Industry. IRCC conducts several research,
technological and consultancy directions, such as Industrial Information, Product Design, Technology
and Production Line Design, Quality Assurance, Economic and Feasibility Studies and Industrial
Process Modeling. The Activities of IRCC address all directions of Sudanese Industry and cover the
entire spectrum of its consultancy needs, contributing to sustainable development.
Sudanese Businessmen & Employers Federation
Sudanese Businessmen and Employers Federation encourage economic, scientific and practical
studies in different aspects and supports industrial, commercial and agricultural research. It also
holds marketing fairs inside and outside the Sudan to show and circulate the national products.

Page 53 of 154
Sudanese Chambers of Industries Association
Sudanese Chambers of Industries Association is a representative of the Sudanese Industrial Sector
inside and outside Sudan. It contributes in setting up of the rules of the Industrial policy. SCIA also
participates in the trade agreements and the workers legislations.
Sudanese Standards& Metrology Organization
Sudanese Standards & Metrology Organization was established in the year 1992 with the objective
of protection & awareness of consumers, strengthening national economy, improving quantity &
quality of national produce & services, adoption of philosophy of quality assurance and
enforces implementation, standardization of commodities and monitoring quality of imports &
exports.
Farmers Commercial Bank
Farmers Commercial Bank major roles are to finance the agricultural, industrial, and commercial as
well as export sectors, facilitate the availability of production input for agricultural sector, adopt
integrated rural development projects that help with the development of rural areas in Sudan,
provide healthy investment opportunities for farmers and also provide comprehensive banking
services.
3.2.4. Sector Competitiveness
3.2.4.1. Raw material
Sudan is one of the larger producers of cotton in the world; however the production has been
significantly lower in recent years on account of farmers shifting to other more profitable crops. The
reasons behind this were low domestic demand and low prices of cotton in export markets which
prevailed few years back. The cotton productivity in Sudan is better than the other target countries,
even India but low plantation of crop has resulted in dismal performance of the sector.
3.2.4.2. Manpower
Most of the textile and apparel manufacturing units were forced out of business; those who are
operating are few and operate much below their actual capacities. As such the demand of
manpower has also shrunk. There are 2 universities in Sudan offering Diploma, Graduate and
Masters program in Textiles, but the student strength has not been too encouraging recently as they
face issues of employment in the industry. There are some training programs for the operator level
workforce, which is being run in association with UNIDO. Several companies employ ex-pats in their
units as staff and officers at various levels
3.2.4.3. Power, Water & Fuel
The power cost is in the range of US$ cents 12 / unit which is quite high. Moreover the supply is
quite erratic. There is no major issue related to other utilities as far as the supply is concerned.

Page 54 of 154
3.2.4.4. Financial support
Sudanese banks do not offer long term credit to businesses. Only short term finance is available at
an interest rate of 9 to 12%. Some finances are also available from Arab countries, but not too
significant contribution has been made in CTA sector till date
3.2.4.5. Market access
Sudanese textile and apparel products can enter EU and some other economies free of any customs
duties and with limited/no quota restrictions. Some of the trade agreements that they have signed
up for preferential market access includes:
Economic Partnership Agreement (EPA) with EU
Common Market for Eastern and Southern Africa (COMESA)
Arab Trade Organization
3.2.4.6. Technology
Most of the technology employed is outdated, but the rehabilitation program is being envisioned
with latest technology e.g. 10 new gins which are planned have latest machinery from Brazil (5 saw
gins) and Turkey (5 roller gins) which have very high productivity level. Similarly, 3 weaving factories
are being planned with rapier looms.
3.2.4.7. Industrial zones
Till date there are no CTA sector unit is operational in any industrial zones, but the government
envisages establishment of several such zones, which may benefit the business in future.
3.2.4.8. Research & product development
There is a severe lack of R&D activity at product level. However, at fiber level research work is
continuously going on and recently 9 high yielding seed varieties were launched
3.2.4.9. Value addition
There is absolute dearth of value addition in the Sudanese CTA sector. Most of the cotton is
exported out of the country in raw form.
3.2.4.10. Compliances and CSR activities
No significant contribution. Some of the garment factories provide for the basic requirement of their
staff members, which is more of employee welfare than CSR activity.
3.2.4.11. Logistics and Business Costs
Sudan has its own port – Port Sudan from where exports and imports are done. There are no major
issues related to delays etc. at port. The sailing time form China to Port Sudan is ~ 20 days, whereas
the sailing time to US is ~18 days.

Page 55 of 154
Table 23: Logistics and Business Costs, Sudan
Power Availability Erratic
Power cost US$ 12 cents / unit
Lending rate No long term financing
Water cost Minimal
Wage/ month US$160-300 / month
Own Port Yes
Nearest port Port Sudan
Sailing time from China 20
Sailing time to US 18
Freight cost / container (20 ft) Export - US$ 2000 Import - US$ 2100
Source: Primary Research Findings
3.2.4.12. Government Initiatives
The government of Sudan has made several initiatives to revive the industry including revival of
several factories. However, the power scenario and other macro factors remain unfavorable which
has hampered the anticipated development.
3.2.4.13. Domestic market
The domestic market is largely dominated by imports of clothing from China, India, Turkey, etc. most
of the local manufacturers are engaged in supplies to institutional buyer and local dresses.
3.2.5. Foreign Trade
3.2.5.1. Overview
Sudan was net importer till 2006 but in 2007 exports surpassed imports and the same trend was
seen till 2009. The exports saw a compounded growth rate of ~11% whereas imports increased with
compounded annual growth rate of 3% from 2005 to 2009.
T&A exports have decreased since 2005 from US$ 0.08 Bn to US$ 0.03 Bn in 2009. Share of T&A
exports in country’s total exports have declined gradually from 1.5% in 2005 to 0.4% in 2009.
T&A imports have witnessed increase from US$ 0.27 Bn in 2005 to US$ 0.42 Bn in 2009, thus
registering a compounded growth of 12%. Share of T&A imports in country’s total imports has
increased from 4.4% in 2005 to 6.1% in 2009.
Cotton fiber accounts for almost 98% of Sudan’s exports whereas imports constitute Mens woven
suits, jackets, women knitted suits, dresses, etc.

Page 56 of 154
Figure 10: Sudan’s Overall Trade
Figure 11: Sudan’s CTA Sector Trade
Source: UN Commodity Trade Statistics Database
Table 24: Key CTA Sector Export and Import Statistics, Sudan (2009)
Top 4 exported commodities 99.7% Top 4 imported commodities 27%
Cotton fibre 97.7% Mens woven suits, jacket etc. 9%
Shawl, scarves etc. 1.6% Women Knitted suits, dresses etc. 7%
Synthetic staple fibre 0.2% Men’s woven shirts 6%
Worn clothing 0.2% Woven fabric of synthetic filament yarn 5%
Leading 4 markets 93% Leading 4 suppliers 81%
Egypt 70% China 52%
China 11% India 13%
Germany 7% Egypt 10%
India 5% Indonesia 6%
Source: UN Commodity Trade Statistics Database
5.4 6.1
8.6
13.3
8.26.1
7.1 6.9 7.7 6.8
2005 2006 2007 2008 2009
Total Exports Total Imports
Values in US$Bn
0.08 0.06 0.06 0.05 0.03
0.270.39 0.43 0.43 0.42
2005 2006 2007 2008 2009
T&A Exports T&A Imports
Values in US$Bn

Page 57 of 154
3.2.5.2. Exports to EU
Figure 12: Sudan's CTA Sector Exports to EU
Source: Eurostat
Table 25: Major categories of EU Imports from Sudan
(in ‘000 US$) 2006 2007 2008 2009 2010 CAGR 2010 share
Raw cotton 7,239 6887 5218 2682 2596 -28% 99%
Knitted garments for
professional, sporting uses 0 0 10 4 24 371% 1%
Subtotal top 2 categories 7,239 6887 5228 2685 2620 -27% 100%
Others 130 2 9 10 4 23% 0%
Total 7,369 6889 5237 2696 2624 -27% 100%
Source: Eurostat
7.46.9
5.2
2.7 2.6
2006 2007 2008 2009 2010
CAGR: -27%
Values in US$ Mn.

Page 58 of 154
3.2.6. SWOT Analysis
Strengths
1. Good quality cotton: Sudan is one of the leading producers of long staple cotton varieties, which
are suitable for fine quality products and carry a premium on price. In Sudan, the cotton picking
is done manually. This makes the Sudanese cotton free of any blemishes or knots
Weaknesses:
1. Low utilization of manufacturing capacity: Current utilization level of manufacturing is very low,
with several units closed down. Technology is another key area of concern which needs
upgrading to enhance the competitiveness of the overall textile industry.
2. Export of unprocessed cotton: More than 90% of the cotton produced in Uganda is exported
without any value addition.
3. Reduction of cotton output: Farmer's shifted from cotton to other crops in last few years as a
result of existing low prices and less demand at that time. This resulted in significant decrease in
area under cotton cultivation and hence the cotton production.
Opportunities:
1. Government focus: Government has started focusing on development of the CTA sector in the
country in a significant manner. Several steps have been planned to revive the sector in near
future
2. Huge domestic/regional/international market demand: The current sector output is not able to
meet the country's demand. A lot of untapped demand exists.
3. Market Access: Free trade agreement exists with key markets of textile and apparel products.
Threats:
1. Competition from leading global textile manufacturers: With the end of Multi-Fiber Agreement
in 2005 and establishment of Customs Union on 1st January 2005, the domestic sector is facing
tough competition from Chinese and Asian companies which have high productivity levels and
enjoys economies of scale.
2. Focus on other crops: Cotton is continuously being displaced by more profitable food crops by
farmers.
3.2.7. Recommendations
After conducting a comprehensive analysis of CTA sector in Sudan, we did a SWOT analysis which
brings out the key issues that the sector is currently facing. These are strategic issues which need to
be addressed keeping in mind the relative strength areas of Sudan and its cotton, textile and apparel
sector. Following recommendations are made for improving/strengthening the CTA sector
performance:

Page 59 of 154
S.no. Objectives Recommendations
1 Increasing cotton quality and yield
Improve farm practices
Create awareness among farmers
Support R&D centers for introducing high yielding seeds
Promote contract farming on a larger scale
Offer more extension programmes
Exercise stringent quality controls at the ginning level
2 Promoting value addition in the sector
Sudan has abundant cotton supply but the downstream industries i.e. textile and apparel manufacturing are limited. Value addition in the sector should be promoted by providing:
Support schemes/fiscal incentives on value addition
Promoting clusters for doing value addition
3 Support for modernization and capacity expansion
Interest subsidies shall be provided for upgrading machineries or installing new machineries
Textile & Apparel sector shall be classified as Priority sector and thus, increased lending to the sector should be a prime focus
Establish JVs with international partners
4 Improving skills of people through adequate training
Introduce schemes for training and skill development and create a fund for implementing the scheme which will aid:
Establishing new training centers
Establishing new training programs
Strengthening existing training centers
Linking existing centers with the Industry
5 Promote education in the field of textiles
Establish new colleges for textiles
Link existing centers with the Industry
Update course curriculum regulatory as per industry requirements
Tie-up with other international colleges for student exchange/knowledge exchange programs
6 Improve existing infrastructure and rationalize costs of doing business
Adopt cluster based development approach where suitable infrastructure is provided to the units operating within those and at reasonable costs
Various clusters should be identified by doing a detailed study and then promoted as ‘Textile & Apparel districts’ within the region

Page 60 of 154
7 Initiatives to promote domestic market development
Phase out supply of second-hand clothing from the market through appropriate policy interventions
Develop a mechanism to regulate flow of cotton to domestic market
8 Investment promotion activities
Organize Annual Investor Summit showcasing business opportunities in Sudan’s cotton and textile sector
All these recommendations have been dealt in detail under Chapter 5: Benchmarking and Proposed
Interventions, where we have compared the target countries with the leading CTA manufacturing
countries of the world on the key parameters.

Page 61 of 154
3.3. Tanzania
3.3.1. Country Overview
Tanzania witnessed a high GDP growth of ~9% between 2000 and 2010. The country's growth is
supported by continued donor assistance and supporting macroeconomic policies. The current size
of Tanzania’s economy is US$ 22.4 Bn (2010, nominal GDP) and per capita GDP is estimated at ~ US$
543 (2010, Nominal).
The agriculture sector is the largest contributor to economic activity, contributing ~42% to the GDP,
dominated largely by coffee, sisal, tea and cotton production. The sector employs ~80% of the work
force. The country is rich in natural resources like gold, natural gas, iron ore, coal, diamonds, etc. The
country has several beautiful National parks and other places of tourist interests and tourism has
become a vital part of the economy.
Figure 13: Economic Snapshot, Tanzania
Source: World Economic Outlook Database, IMF
3.3.2. Cotton, Textile and Apparel Sector Overview
Cotton was introduced in Tanzania more than 120 years ago. Cotton is the second largest export
product in Tanzania with over 80% of cotton produced in Tanzania is exported. Cotton is a major
source of employment and livelihood to about 40% of the population, i.e. about 16 million. It is one
of the major cash crops grown in Tanzania. Over the last five year, among the traditional crops,
Cotton has generated maximum revenue for the country amounting to US$ 92 Mn per annum.
In Tanzania, cotton is grown mainly on small scale farms by 350,000 to 500,000 farmers who own
between 0.5 to 10 acres and grow mostly in the rain fed areas. Major production areas are the
Western Cotton Growing Area (WCGA) and the Eastern Cotton Growing Area (ECGA). WCGA
accounts for over 98% percent of production comprising sub-regions like Shinyanga, Mwanza,
Tabora, Mara, Singida, Kagera and Kigoma.
0
250
500
750
0
5
10
15
20
25
2000 2001 2002 2003 2004 2005 2006 2007 2008 2009 2010E
GD
P p
er
cap
ita
(US$
)
GD
P in
US$
bn
GDP (nominal) GDP per capita (Nominal)

Page 62 of 154
Tanzania is the fourth largest producer of organic cotton in the world after India, Turkey and Syria.
Organic cotton farming is practiced in certain areas of WCGA especially in Meatu District and fetches
relatively higher price.
Though, the cotton sector was liberalised in the 1990’s but the cotton sub sector is still regulated by
the Tanzania Cotton Board who determines the floor price of the seed cotton and issues permit to
the seed cotton buyers and traders.
The textile industry of Tanzania grew rapidly between 1966 and 1985 with supportive government
policy to industrialize the country. The policy aimed at producing consumer goods locally and adding
value to primary products, including cotton.
Cotton spinners, weavers and textile millers comprise of ~ 25 mills - both old and new. All these mills
are privately owned, and produce exclusive fabrics – kanga, kitenge, dyed drill, linen and bed sheets.
These mills utilize only about 20% of domestic lint; rest is imported due to unfavourable prices and
unacceptable quality levels of local fibres. These mills operate at 40-50% of installed capacity and
employ around 20,000 workers.
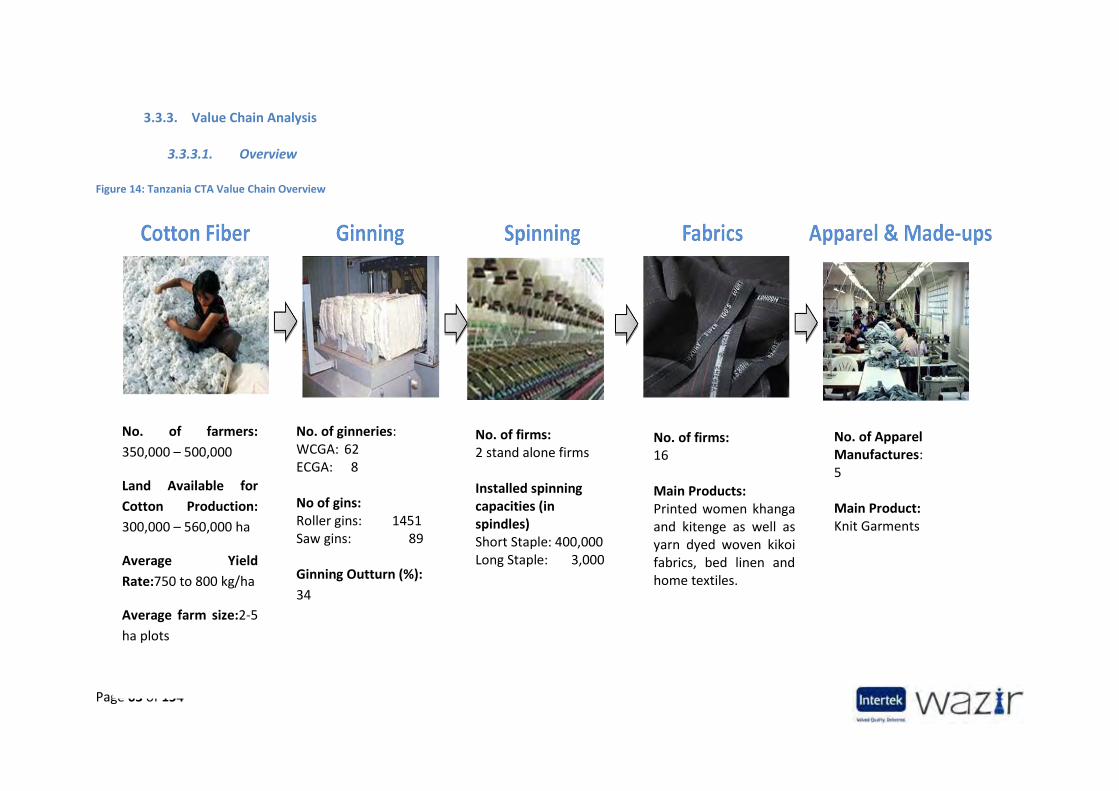
Page 63 of 154
3.3.3. Value Chain Analysis
3.3.3.1. Overview
Figure 14: Tanzania CTA Value Chain Overview
No. of farmers:
350,000 – 500,000
Land Available for
Cotton Production:
300,000 – 560,000 ha
Average Yield
Rate:750 to 800 kg/ha
Average farm size:2-5
ha plots
No. of ginneries: WCGA: 62 ECGA: 8 No of gins: Roller gins: 1451 Saw gins: 89 Ginning Outturn (%):
34
No. of firms: 2 stand alone firms Installed spinning capacities (in spindles) Short Staple: 400,000 Long Staple: 3,000
No. of firms: 16 Main Products: Printed women khanga and kitenge as well as yarn dyed woven kikoi fabrics, bed linen and home textiles.
No. of Apparel Manufactures: 5 Main Product: Knit Garments

Page 64 of 154
3.3.3.2. Cotton Fiber
Cotton is one of the most important cash crops of the economy and has contributed significantly to
the agricultural growth and earnings of the country. Cotton is a source of employment and livelihood
to about 40% of the population, i.e. about 16 million people.Over the last five years from 2005-2009,
among the traditional cash crops, cotton has generated the highest foreign exchange earnings,
averaging US$ 92.0Mn per annum, compared with US$ 89.7 Mn (tobacco) and US$ 88.6Mn (coffee).
In Tanzania, cotton is grown in 42 districts and 13 regions out of 127 districts and 21 regions of
Mainland Tanzania. Cotton is grown mainly on small scale farms, in the 2 cotton growing areas - the
Western Cotton Growing Area (WCGA) and the Eastern Cotton Growing Area (ECGA).
Table 26: Cotton Sector Profile, Tanzania
Source: Primary Research Findings
Production Statistics
The regional cotton production trend during the period 2001-02 to 2008-09 shows that WCGA
accounted for 99 percent of total cotton production per year on an average and only 1 percent was
produced in ECGA.
The main cotton growing sub-regions in WCGA includes Shinyanga, Mwanza, Mara, Tabora, Singida,
Kagera and Kigoma. Shinyanga and Mwanza together account for ~80% of the cotton production.
The sub-regions in ECGA include Morogoro, Manyara, Coast, Tanga, Iringa, and Kilimanjaro.
No. of farmers 350,000-500,000
Seed cotton price paid to farmers
Price in Currency Tanzania shillings (TZS) 500/kg cotton seed
Euro Equivalent 0.22Euro/kg
Average Yield
Current 200 kg/ha
Potential 2,500kg/ha
Seed Planting Rate 25kg/hectare
Variety of Cotton Gossypium Hirsutum (American upland cotton)
Land Available for Cotton Production 300,000 – 560,000 ha
Average farm size 2-5 ha plots

Page 65 of 154
Table 27: Regional Cotton Production Trends, Tanzania
Values in MT
Zones Regions 2001-02 2002-03 2003-04 2004-05 2005-06 2006-07 2007-08 2008-09
Western Shinyanga 80,030 119,107 88,352 204,626 233,721 82,740 128,285 220,808
Mwanza 46,685 43,681 31,296 90,974 90,868 29,087 41,814 74,744
Mara 13,091 11,361 11,296 24,128 28,281 4,734 13,081 53,282
Kagera 3,117 1,613 3,476 7,091 4,639 1,992 4,257 2,559
Tabora 4,613 11,409 4,332 10,560 14,197 9,997 11,698 13,451
Kigoma 18 28 62 542 484 208 238 412
Singida 21 8 39 481 697 507 581 1,641
Total Western
147,575 187,147 138,904 338,402 372,885 129,265 199,954 366,897
Percentage
99.6 99.6 99.3 98.1 99. 5 99 99.9 99.5
Eastern Manyara 130 120 224 829 781 404 540 898
Morogoro 242 347 523 1,948 875 845 98 299
Mbeya 0 0 0 0
Kilimanjaro
21 20 29 26 6 11 23 84
Pwani 9 86 83 190 45 19 48 83
Tanga 15 61 49 140 58 42 307
Iringa 150 102 17 54 7 1 23
Total Eastern
567 736 929 3,187 1,772 1,325 710 1,694
Percent 0.4 0.4 0.7 1.9 0.5 1 0.1 0.5
Grand Total
148,142 187,883 139,829 341,789 374,657 130,585 200,664 368,697
Source: Tanzania Cotton Board
Cotton Production and Yields Statistics (1990-2011)
In the recent years, the production of cotton has declined as farmers have turned to other cash
crops such as tobacco. The various challenges in cotton cultivation include low productivity, poor
cotton quality and a low level of mechanization level.
Cotton production in Tanzania is largely meant for exports. Major importers of Tanzania’s cotton are
China, Indonesia, Thailand, Kenya, Portugal, Bangladesh, Vietnam and Pakistan. There has been a
drastic dip in exports in the year 2006. However, since then the quantum of cotton exports has
increased.

Page 66 of 154
Table 28: Cotton Balance Sheet (1990-2010), Tanzania
Values in ‘000 (480-pound) bales Year from Aug 1 to Jul 31
Year Opening Stocks Production Imports
Total Supply Mill Use Exports
Ending Stocks
Harvested Area (000) Acres
Yield Pounds/Acre
2010 435 275 0 710 150 225 335 741 178
2009 440 410 0 850 140 275 435 902 218
2008 285 570 0 855 165 250 440 998 274
2007 295 310 0 605 170 150 285 1,112 134
2006 302 200 0 502 110 97 295 741 130
2005 248 575 0 823 120 401 302 1,260 219
2004 152 525 0 677 70 359 248 1,236 204
2003 142 235 0 377 70 155 152 956 118
2002 137 280 0 417 60 215 142 956 141
2001 116 230 0 346 55 154 137 1,038 106
2000 124 188 0 312 50 146 116 450 201
1999 160 161 0 321 55 142 124 618 125
1998 170 165 0 335 51 124 160 445 178
1997 207 285 0 492 41 280 170 865 158
1996 183 400 0 583 64 312 207 699 275
1995 132 377 0 509 69 257 183 850 213
1994 170 184 0 354 60 161 132 425 208
1993 221 207 0 428 51 207 170 850 117
1992 111 441 0 552 64 266 221 1,063 199
1991 83 390 0 473 73 289 111 1,112 168
1990 106 220 0 326 64 179 83 791 134
Source: National Cotton Council of America
Planting Seasons
The planting and the harvesting season varies in the Western and the Eastern growing areas in the
region. In WCGA, cotton is planted between mid-November to mid-December, late planting
continues till end January; harvesting and marketing begins in July of following year. In ECGA, cotton
is planted between February and March; and harvesting and marketing is done between July and
August of the same year.
Cotton Characteristics
The cultivated cotton in Tanzania is mainly of the American Upland type (Gossypium hirsutum L).
Tanzania cotton is sold on the basis of Grade, together with the corresponding staple length known
as Type. There are seven grades of cotton out of which five are physical and two are descriptive. The
basic selling grade is Gany, as adopted by the International Cotton Association (ICA).
Cotton Grades

Page 67 of 154
Table 29: Cotton Grades, Tanzania
Grade Universal grades % of total crop Remarks
Tang Good middling 1.40 Physical
Gany Strict middling 41.63 Physical
Gany Middling 39.73 Physical
Gany Strict low middling 13.81 Descriptive
Gany Low middling 1.80 Physical
Gany Strict Good Ordinary 0.40 Descriptive
Yika Good ordinary 0.32 Physical
Under grade (UG) Below grade (BG) 0.91 No grade
Source: Tanzania Cotton Board
Cotton Types Table 30: Cotton Types, Tanzania
Type Millimeter Code % of the total
Type 1 – staple length 11/18” 28.2 - 28.7 36 36.17
Type 2 – staple length 13/32” 27.4 - 27.9 35 50.56
Type 3 – staple length 11/16” 26.7 - 27.2 34 13.27
Source: Tanzania Cotton Board
Over 82% of the cotton grading is middling and above. The staple length of cotton in Tanzania varies
from 11/16” to 11/18”. More than 85% of cotton produced is medium to long staple length.
Key Initiatives
Contract Farming
In order to protect and promote the industry, the cotton stakeholders in Tanzania have decided to
opt for contract farming. For two consecutive years, contract farming pilot studies have been
conducted in Serengeti, Bunda and Musoma districts, and in 2011 the scheme has been extended to
four wards in Bariadi and Kibondo districts in Shinyanga and Kigoma regions. It will now be extended
to many other regions.
The contract farming model entails formation of farmer-business groups (FBGs) comprising between
50 and 90 smallholders. In this model, ginners will be required to work with farmers from ploughing
to pricing, hence enhancing quality and quantity. Earlier the cultivators and the ginners used to enter
in an agreement only at the time of cultivation, which resulted in inferior and low produce of cotton.
Contract farming will keep the agents away from the cotton trade and provide assurance to both
ginners as well as farmers.
Several issues in cotton production like inferior quality of cotton, less productivity and low level of
mechanism have remained important concerns in Tanzania which has discouraged the cotton
cultivators and induced them to switch to cultivation of other cash crops like tobacco. Contract
farming is seen to reverse the trend as it provides the farmers with an assurance for inputs,
marketing support and also a steady price and income.

Page 68 of 154
The programme is sponsored by Tanzania Gatsby Trust, under Cotton and Textile Development
Programme (CTDP) and implemented by Tanzania Cotton Board (TCB), which is committed to
overseeing the implementation of the new system in order to safeguard interests of farmers and
ginners.
Organic Cotton Production
Initiatives have been taken by various organizations to improve the working condition of the small
holder farmers and promote the organic cotton production in different regions of Tanzania.
Organic cotton fetches better prices at the international market than the traditional one in the
market for seed cotton.
Table 31: Organic Cotton Production in Tanzania
Production in Tons 2005-06 2006-07 2007-08 2008-09
TZ organic lint 649 1 662 2 852 4 181
Total African organic lint 2,377 4,359 7,285 9,168
Total global organic lint 37,799 57,731 145,865 175,113 Source: Tanzania Cotton Board
The various organizations that support organic cotton production are listed below:
Remei/BioRe Bio Re Tanzania Ltd coordinates the growing and processing of organic cotton in Tanzania’s Meatu region
Biosustain Biosustain was established in the year 2006 with an aim to revive cotton production using organic farming and to provide markets for organic certified products with an emphasis on quality. It co-ordinates the growing of organic cotton in Tanzania’s Singida region.
Rural Livelihoods Development Company (RLDC)
RLDC is working with the private enterprise and cotton farmers to facilitate the sustainable growth of organic cotton farming. It is involved in the co-ordination of organic cotton in the Maswa district in Tanzania’s Shinyanga region
3.3.3.2. Ginning and Oil Pressing
Presence of a large number of buyers of the Tanzanian cotton is one of the key features of the
sector. Most of these buyers also own ginneries, who compete to purchase seed cotton. During the
year 1994-95, 22 private companies started trading cotton, and 8 new private ginneries were added.
Initially, many of the private buyers who did not own ginneries entered into toll ginning contracts
with the cooperative unions that own ginnery. However, these cooperative unions got support from
the government and they were reluctant to enter into toll ginning contracts with the private buyers.
The cooperative unions were not even considering selling ginning facilities to these private buyers.
This encouraged the expansion of the private ginning capacities, despite the existence of under-
utilized capacity at ginneries owned by cooperative unions.
Another factor that has contributed to the expansion of the private ginning capacity is that the
ginning equipments held by the cooperative unions were old or poorly maintained. The oldest are

Page 69 of 154
Ukerewe (1923) and Nassa (1924); and the newest are Chato and Ngasamo (1966) and Kahama
(1967). Most of the private ginneries, with the exception of Manonga (1958), were constructed after
1995; and 17 of them were constructed after 2000. With old equipment in place, it was difficult to
achieve good quality lint and fragmentation of seed coat was another major problem.
Post liberalization, the sector has experienced multiple entry and exit of firms from year to year.
While some of this is completely new entry or final exit, some ginneries are left underutilized simply
for a season or two, either because the company concerned has financial difficulties or because it
feels that buying prices are too high to make buying worthwhile.
Table 32: Ginning Sector Profile in the WCGA, Tanzania
No. of ginneries 62
Cooperatives Private Investors
21 41
Number of gins 1,368
Roller Gins Saw Gins
1,279 89
Installed Ginning Capacity (estimated) 1.2 m bales of 200 kg each
Ginning equipment Mainly roller gins, but also have some saw gins
Average Ginning Outturn( GOT) 36%
Price for cotton seed FOB/FOT ginnery Tanzania shillings (TZS) 500/kg cotton seed Source: Tanzania Cotton Board
In WCGA there are a total of 62 ginneries equipped with 1,279 roller gins, and 89 saw gins. 21 of
these ginneries are owned and operated by cooperatives. The remaining 41 are owned by private
companies. In ECGA there are 8 ginneries; 7 out of which are old and 1 is new.
Most of the ginners have oil mills as an important component of their cotton business operations. At
present 32 ginners have oil mills too, which processes about 16,121MT p.a. of cotton oil. However,
this represents only 14% of the installed capacity which stands at 115,150 MT. These oil mills also
produce around 52,000 MT of cotton cake annually.
3.3.3.3. Textiles
The textile grew rapidly between 1966 and 1985 with supportive government policy to industrialize
the country. The policy aimed at producing consumer goods locally and adding value to primary
products, including cotton. The growth was triggered by high demand for cloth- kikoi, khanga,
kitenge, bed sheets, blankets and other dressing materials. However, after the privatization
programme of the late 1990s many of these mills closed altogether.
Currently, the spinning, weaving and textile mills industry comprises of 25 firms employing about
20,000 workers. It is estimated that about 30,000 tons of Tanzania’s cotton crop is locally processed
into textiles every year.
Tanzania is the world’s 2nd largest sisal producer. Tanzania has a number of sisal processors which
spin/weave sisal and make products such as sacks, ropes, twines, mats, etc.

Page 70 of 154
Table 33: Textile Manufacturing Industry Profile, Tanzania
Segment No. of firms Description
Cotton Spinning 2 standalone
firms
Yarn output partly sold locally and partly exported
Installed Spinning Capacity:(Spindles)
Short Staple: 400,000
Long Staple: 3,000
Traditional Fabrics 10 firms Concentrate in making woven printed women kanga and
kitenge; as well as yarn dyed woven kikoi fabrics, bed linen and
home textiles. Most of these traditional fabrics are sold in
Tanzania; a few exported in the surrounding land-locked
countries; and limited amounts into some of the island states
off the east African coast.
Specialist Textile 6 firms 1 firm manufactures heavier weight woven canvas textiles
which are mainly exported; 3 firms make mosquito bed-nets
sold locally and to other African states; 2 firms make limited
volumes of blankets sold locally
Sisal textiles and products A number of firms present to process domestic sisal crop into
textiles and made-up items such as yarn, fabrics, ropes, sacks,
carpets and mats
Source: Primary Research, International Textile Machinery Shipment Statistics Vol 32, 2009
Table 34: Market Access and Sales, Tanzania
Local Majority of locally produced textiles are sold in Tanzania in the form of kanga &kitenge –
these are woven cotton printed cloth wraps mainly worn by women
Regional Large volumes of Tanzania made kanga &kitenge, and mosquito nets are sold into
regional East African markets (e.g. Mozambique, Zambia, Malawi)
Export Limited volumes of textiles & apparel are currently sold into the US and EU. In recent
times, volumes of Tanzania garments are now being sold duty free into South Africa
Source: Primary Research
3.3.3.5. Apparel
In Tanzania, there are five large apparel producers mainly making knitted garments. These firms include Mazava Fabrics &Production, Sunflag, Kibotrade, Ellen Knitweave Mills, and A to Z Textiles. They use both local and imported fabric; and produce largely for export market within East Africa, South Africa, the European Union and limited sales to the US.
3.3.3.6. Support Institutes
The cotton sector of Tanzania is supported by various institutes listed below:

Page 71 of 154
Tanzania Cotton Board
Tanzania Cotton Board (TCB) was established on July 1, 2004. TCB major roles are regulation,
promotion, monitoring, advisory, facilitation, coordination, development and representation in the
cotton sector.
Cotton Research Institutes
Currently, there are two institutes which directly deal with cotton research - the Lake Zone
Agricultural Research Development Institute (LZARDI); and the Ilonga Agricultural Research Institute
(IARI). Both are government owned. LZARDI is in WCGA; while IARI is in ECGA.
Tanzania Cotton Association
Tanzania Cotton Association was formed in 1997 as an apex organization of cotton stakeholders to
promote the interest of the sector in a unified approach. Currently TCA has 50 members which
include ginners, traders, exporters and Tanzania Cotton Growers Association. TCA has played an
important role in promoting self-regulation amongst its members as well as in increased cotton
output volumes and yields through timely availing farmers with inputs and tractor hire services.
Government Institutions
A number of government owned entities in the agricultural sector play a critical public role in various
sectors, including the cotton sub sector. These include the Tanzania Official Seed Certification
Institute (TOSCI), Tropical Pesticides Research Institute (TPRI) and others like the National
Environment Management Council (NEMC) and Tanzania Bureau of Standards (TBS).
Development Partners
The development partners which include multilateral and bilateral organizations and agencies
support Government and community in the agricultural sector, in general, and cotton sub-sector, in
particular, through grants and soft loans. They also provide technical support in the implementation
of agreed programmes. Most financial and technical assistance is now provided through basket
funding, a framework for coordinating and managing external resources and for forging closer
partnership between the Government and Development Partners.

Page 72 of 154
3.3.4. Sector Competitiveness
3.3.4.1. Raw material
Tanzania is one of the key cotton growing countries in East African sub-continent. Of the overall
production, about 80% is exported and only rest is utilized in the domestic market. Over 82% of the
cotton is middling and above. Cotton production is 100% rain fed and thus, the production varies
with the climatic conditions. Tanzania has inherent strengths in cotton production but is lately been
effected by increasing issues of contamination. With new farm initiatives such as contract farming,
this issue is expected to resolve to a large extent.
3.3.4.2. Manpower
There is availability of manpower but the present workforce lacks the requisite skills and training to
do the required job. There is requirement of skilled workers especially in areas like efficient farm
practices, weaving and textile manufacturing.
3.3.4.3. Power, Water & Fuel
Availability of power is highly erratic and a big constraint for the sector. The costs are reasonable but
there are too many disruptions in the power supply and voltage due to which machines fail to
operate continuously. Water supply is also irregular as it is dependent on power. All these factors
increase the cost of power, water & fuel and thereby, increased production costs.
3.3.4.4. Financial support
There are large no. of local and international banks and financial institutions present in the country
such as Bank of Africa, Tanzania Investment Bank, Commercial Bank of Africa, Barclays Bank,
Standard Chartered, Citi Bank, etc. These Institutions lend funds to the textile industry but at very
high costs of ~15%. So, it becomes highly unaffordable for the manufacturers to borrow from these
banks.
3.3.4.5. Market access
Tanzania made textile and apparel products can enter most of the world’s richer economies free of
any customs duties and with limited quota restrictions. Some of the trade agreements that they
have signed up for preferential market access includes:
African Growth and Opportunity Act (AGOA)
Southern African Development Community (SADC)
Economic Partnership Agreement (EPA) with EU
Least Developed Country (LDC)
East African Community (EAC)
Page 73 of 154
3.3.4.6. Technology
The technology currently in use is highly outdated in all areas like ginning, spinning and weaving.
Many mills have lot of dysfunctional machineries which is just lying with them for many years. There
is huge requirement of modern technology and training people to operate these machineries, to
improve productivity in the sector.
3.3.4.7. Industrial zones
EPZ Authority has identified major areas of the EPZ / SEZ in the 17 regions in Tanzanian Mainland.
Currently 3 of these EPZ have already been established, which are:
Benjamin William Mkapa Special Economic Zones
EPZ Msamvu, Morogoro
Kamal Industrial Estate EPZ – Bagamoyo, Pwani
With continued efforts by the Ministry, many investors have continued to show interest in building
industrial and business investment through the free investment areas of EPZ and Special Economic
Zones (SEZ).
3.3.4.8. Research & product development
Few research initiatives have been undertaken by Research Association like Lake Zone Agricultural
Research Development Institute, in the Eastern Zone and the Western Zone. These initiatives have
led to the introduction of new varieties of seeds resulting in higher yields, good fibre content and
better resistance. These initiatives have been funded partly by government and partly by Cotton
Trust Fund and NGOs.
However, the research initiatives are currently not taking place in big way due to lack of sufficient
researchers. The funding support for research and development is also limited as there is no private
sector participation in the area.
3.3.4.9. Value addition
Tanzania has limited value added services and 80% of the cotton produced in the country is exported
without any value addition. Country offers huge scope for introduction of value-added services but
requires additional manufacturing facility for the same.
3.3.4.10. Compliances and CSR activities
Majority of the firms contribute to charities and make donations as part of CSR activities and support
villagers needs of building schools, hospitals, etc. Few firms which are located at far-flung areas
create provision for various facilities for employees like training, employees’ children education,
canteen facilities, activity zone, etc.

Page 74 of 154
3.3.4.11. Logistics and Business Cost
Tanzania has advantage in terms of presence of port at Dar-es-Salaam. It takes about 10 days for
document shipment & processing, customs clearance and then ~3 weeks to reach the destination.
Sometimes there is a delay in shipment or clearance but not a major concern for the industry. The
costs of doing business in Tanzania are one of the most competitive as compared to other target
countries. Costs in terms of wages, power, water and logistics are reasonable. But the interruptions
in supply lead to increased costs for the manufacturers. The borrowing costs for the sector are
relatively high at ~15%.
Table 35: Logistics and Business Costs, Tanzania
Power Availability Inadequate
Power cost US cents 14/ units
Lending rate ~15%
Water cost US$ 0.5/ cu. m
Wage/ month US$ 80-100
Own Port Yes
Nearest port Dar-Es-Salaam
Sailing time from China 18 days
Sailing time to US 25 days
Freight cost / container (20 ft) Export - US$ 1,300 Import - US$ 1,500
Source: Primary ResearchFindings
3.3.4.12. Government Initiatives
Cotton is one of the priority sectors of the Government and is supporting the sector through
formation of various boards and relevant organizations to oversee the development of the sector. It
has created Export Processing Zones (EPZ) along with EPZ Authority (EPZA) which offers various fiscal
and non-fiscal incentives to the investors and the units. Government also provides support to the
farmers by giving subsidies for procuring inputs like seeds, fertilizers, etc. Government through
Tanzania Cotton Board and cotton authorities funds 60-70% of the cost while the rest is contributed
by the farmers.
3.3.4.13. Domestic market
The domestic market is characterized by local fabric - Kanga and Kitenge. Kanga is used as a garment
by local residents, as skirts, wraparounds, head gear, etc. These printed fabrics are available in
varied designs and patterns. There is not much demand for domestically manufactured textile
garments such as women dress wear, shirts and trousers for men.

Page 75 of 154
There are also other forms of grey dyed printed cotton fabrics like sheeting canvas, twill, bed sheets,
pillow covers, table cloth and others like mosquito nets.
Domestic market is saturated by huge imports of second-hand clothing at very low prices. This has
led to dependence on imported clothing and domestic producers have also losing interest in local
garment manufacturing.
3.3.5. Foreign Trade
3.3.5.1. Overview
Tanzania is a net importer in T&A sector, with net imports amounting to US$ 0.23 Bn. T&A exports
have slightly increased since 2005 from US$ 0.16 Bn to US$ 0.17 Bn. However, share of T&A exports
in country’s total exports have declined gradually from 11% in 2005 to 8% in 2009.
T&A imports have witnessed increase from US$ 0.25 Bn in 2005 to US$ 0.40 Bn in 2009, thus
registering a compounded growth of 12%. Share of T&A imports have been ~7-8% in the last 5 years.
Though the share has gone up to 13% in 2008 but it again dipped down to 7% in 2009.
Tanzania mainly exports cotton fiber and home furnishing whereas imports constitute worn clothing
and woven fabric of synthetic filament yarn. China and India are the major suppliers of textile and
apparel and Kenya & India are the major markets for Tanzania.
Figure 15: Tanzania’s Overall Trade
Figure 16: Tanzania’s CTA Sector Trade
Source: UN Commodity Trade Statistics Database
1.6 1.8 1.92.3 2.4
3.23.8
5.16.1 5.5
2005 2006 2007 2008 2009
Total Exports Total Imports
0.16 0.15 0.12 0.19 0.170.25 0.28
0.39
0.82
0.40
2005 2006 2007 2008 2009
T&A Exports T&A Imports
Values in US$ Bn Values in US$ Bn

Page 76 of 154
Table 36: Key CTA Sector Export and Import Statistics, Tanzania (2009)
Top 4 exported commodities 85% Top 4 imported commodities 46%
Cotton fiber 58% Worn Clothing 14%
Home furn. excl. blanket& linen 17% Woven fb of synthetic filament yarn 14%
Otherveg. fib. (coconut, abaca, etc.) 6% Woven fb> 85% ctn, < 200 gsm 13%
Woven fb of synthetic filament yarn 4% Women woven suit, jacket etc. 5%
Leading 4 markets 56% Leading 4 suppliers 74%
Kenya 19% China 36%
India 19% India 25%
Viet Nam 10% United Arab Emirates 9%
Indonesia 8% USA 4%
Source: UN Commodity Trade Statistics Database
3.3.5.2. Exports to EU
Tanzania is a minor supplier of textiles and apparels products to the EU market. Tanzania’s supply to
the EU-27 countries in 2010 was ~US$ 9.1 Mn. Further, the overall value of trade with EU 27 is also
on a declining trend over last 5 years.
Figure 17: Tanzania’s CTA Sector Exports to EU
Source: Eurostat
16.414.9
17.5
6.9
9.1
2006 2007 2008 2009 2010
Values in US$ Mn
CAGR -14%

Page 77 of 154
Table 37: Major Categories of Imports by EU from Tanzania
Values in US$ ‘000 2006 2007 2008 2009 2010 CAGR 2010 share
Raw Cotton 5505 3438 7253 2658 2732 -16% 30%
Cotton yarn, with >= 85% cotton 3864 3426 1857 815 1300 -24% 14%
Other veg. fiber e.g. coconut, abaca, sisal, ramie, etc. and their waste
2287 2709 3565 913 1166 -15% 13%
Yarn of vegetable textile fibers like flax, jute, other bast fibers
260 717 509 482 1163 45% 13%
Knitted T-Shirts, singlets and other vests
3088 2069 1563 972 1610 -15% 18%
Carded or combed cotton 711 1662 1811 773 710 0% 8%
Subtotal top 6 categories 15716 14019 16558 6614 8681 -14% 95%
Others 717 867 968 308 453 -11% 5%
Total 16433 14885 17526 6922 9134 -14% 100%
Source: Eurostat
3.3.5.3. Exports to USA
Limited volumes of Tanzania’s textiles and apparels products are exported to the US market.
Tanzania’s supply to the US in 2010 was ~US$ 1.9 Mn. Further, the overall value export to the US has
declined over the years.
Figure 18: Tanzania’s CTA Sector Exports to US
Source: Otexa
3.7
3.3
1.9
1.2
1.9
2006 2007 2008 2009 2010
CAGR -12%
-12%
Values in US$ Mn

Page 78 of 154
Table 38: Major Categories of Imports by US from Tanzania
Values in US$ ‘000s
2006 2007 2008 2009 2010 CAGR 2010 share
Mens, boys suits, jackets, trousers etc knit or crochet
- - - - 785 - 41%
Clothing accessories or parts, knit or crochet
- 0 - - 517 - 27%
T-shirts, singlets and other vests, knit or crochet
710 518 846 814 298 -16% 15%
Jerseys, pullovers, cardigans, etc, knit or crochet
276 529 76 - 250 -2% 13%
Women’s, girls suit, dress, skirt, etc.
24 17 3 - 41 12% 2%
Garments, knit or crochet 1 - - 2 20 78% 1%
Sub Total Top 6 categories 1,011 1,064 924 815 1,912 14% 99%
Others 2,707 2,217 948 389 11 -67% 1%
Total 3,718 3,281 1,872 1,204 1,923 -12% 100%
Source: Otexa
3.3.6. SWOT Analysis
Strengths
1. Mainstay of economy: The cotton industry has been a socio-economic mainstay in the country
as significant population has been dependant on the sector for more than a century. The primary
producers are dedicated to cotton.
2. Favourable climatic conditions: Existence of large tracts of fertile soils; numerous and large
permanent water bodies are suitable for increased acreage and irrigation cotton farming.
3. Large cotton production: Tanzania is one of the key growers of cotton in Africa and supplies
cotton to many countries including Kenya, China, Indonesia, Thailand, Bangladesh, Vietnam,
Pakistan, etc. Thus, it is one of the principal crop generating export revenues.
Weaknesses:
1. Poor farm practices: The sector is dominated by smallholder producers with limited knowledge
on crop and farm management practices, price and market trends, input procurement and
supply trends.
2. Weak linkages across the value chain: The stakeholders in spinning, weaving and textile
manufacturing are disorganised with little or no cooperation, and other support institutions and

Page 79 of 154
local governments not playing effective role in supervising operations of agriculture, including
cotton.
3. Lack of value addition in the sector: Though Tanzania has abundant cotton production; about
80% of the cotton is exported. There is limited value addition happening in terms of
manufacturing of finished goods/garments.
4. Interruptions in power supply: The power supply in Tanzania is highly erratic and a big
constraint for the sector. There are too many disruptions in the power supply and voltage due to
which machines fail to operate continuously. Many mills can operate only 3 days a week due to
power shortage.
5. Outdated technology: Current machineries / technology in use are very outdated particularly for
ginning and textile sector. This further adds to the costs of manufacturing. Sector is currently
facing lack of new investments for upgrading technology.
6. Lack of support institutions for training and skill development: The skill level of people working
in a mill or at farm is very low. They need to be constantly trained and monitored to ensure
smooth functioning of work. There is lack of training and skill development institutions which
can enhance their job skills to a certain level and thereby, increases productivity.
7. Under developed domestic market: The domestic market is completely under-developed and is
largely dependent on local fabric - Kanga and Kitenge or second hand garments. There is little
availability as well as little demand for domestically manufactured textile garments such as
women dress wear, shirts and trousers for men.
Opportunities:
1. Huge demand potential: Enduring demand for cotton fabrics and textiles due to rising
population, increasing income, and changing consumer patterns in preference for cotton textiles
and apparel.
2. Use of better practices: There is an inclination towards adopting new improved practices in
cotton production and processing; e.g. contract and irrigation cotton farming, and systematic
breeding of better quality hybrid seeds for higher crop yields and output volumes.
3. Increased investments in the sector: Rising investments in textiles manufacturing will enhance
skills development, boost incomes and jobs, and underpin a more sustainable domestic
industrialisation strategy.
Threats:
1. Deteriorating cotton quality: The contamination levels in the cotton are increasing and this may
pose a threat to the country’s cotton sector. This will negatively impact the earnings as well as
competitiveness of Tanzania’s cotton if suitable measures are not taken in time.

Page 80 of 154
2. Increased focus towards other profitable cash crops: Emergence of alternative cash crops,
especially green gram, which are cheaper to grow but fetch higher returns than cotton in the
major cotton growing areas of WCGA, is a threat for the sector.
3. Competition from leading global textile manufacturers: Expanding acreage, increasing yields
and falling production costs in major producing and consuming countries pose threat to
Tanzania cotton sector leading to reduced prices and markets for Tanzania cotton.
4. Threat from second hand articles: There are huge imports of second hand clothes in the country
which is posing a big threat to the economy. The present legal framework is not strong enough
to prevent this practice.

Page 81 of 154
3.3.7. Recommendations
After conducting a comprehensive analysis of CTA sector in Tanzania, we did a SWOT analysis which
brings out the key issues that the sector is currently facing. These are strategic issues which need to
be addressed keeping in mind the relative strength areas of Tanzania and its cotton, textile and
apparel sector. Following recommendations are made for improving/strengthening the CTA sector
performance:
S.no. Objectives Recommendations
1 Increasing cotton quality and yield
Improve farm practices
Create awareness among farmers
Support R&D centers for introducing high yielding seeds
Promote contract farming on a larger scale
Offer more extension programmes
Exercise stringent quality controls at the ginning level
2 Promoting value addition in the sector
Tanzania has abundant cotton supply but the downstream industries i.e. textile and apparel manufacturing are limited. Value addition in the sector should be promoted by providing:
Support schemes/fiscal incentives on value addition
Promoting clusters for doing value addition
3 Support for modernization and capacity expansion
Interest subsidies shall be provided for upgrading machineries or installing new machineries
Textile & Apparel sector shall be classified as Priority sector and thus, increased lending to the sector should be a prime focus
Establish JVs with international partners
4 Improving skills of people through adequate training
Introduce schemes for training and skill development and create a fund for implementing the scheme which will aid:
Establishing new training centers
Establishing new training programs
Strengthening existing training centers
Linking existing centers with the Industry

Page 82 of 154
5 Promote education in the field of textiles
Establish new colleges for textiles
Link existing centers with the Industry
Update course curriculum regulatory as per industry requirements
Tie-up with other international colleges for student exchange/knowledge exchange programs
6 Improve existing infrastructure and rationalize costs of doing business
Adopt cluster based development approach where suitable infrastructure is provided to the units operating within those and at reasonable costs
Various clusters should be identified by doing a detailed study and then promoted as ‘Textile & Apparel districts’ within the region
7 Initiatives to promote domestic market development
Phase out supply of second-hand clothing from the market through appropriate policy interventions
Develop a mechanism to regulate flow of cotton to domestic market
8 Investment promotion activities
Organize Annual Investor Summit showcasing business opportunities in Tanzania’s cotton and textile sector
All these recommendations have been dealt in detail under Chapter 5: Benchmarking and Proposed
Interventions, where we have compared the target countries with the leading CTA manufacturing
countries of the world on the key parameters.

Page 83 of 154
3.4. Uganda
3.4.1. Country Overview
Uganda, known as the “Pearl of Africa” is a landlocked country in East Africa. It possesses substantial
natural resources, including fertile soils, regular rainfall, and sizable mineral deposits of copper,
cobalt, gold, and recently discovered oil.
For decades, Uganda's economy suffered from devastating economic policies and instability, leaving
Uganda as one of the world's poorest countries in the world. However, the country has commenced
economic reforms and since then growth has been robust. In 2008, Uganda recorded 7% growth
despite the global downturn and regional instability
The current size of Ugandan economy is US$ ~17 Bn (2010, nominal GDP). The per capita GDP in is
estimated at ~US$ 504 (2010, Nominal). The services sector is the largest contributor to economic
activity, contributing ~52% to the GDP; dominated largely by wholesale & retail trade, real estate
activities, education and transport & communications.
Figure 19: Economic Snapshot, Uganda
Source: World Economic Outlook Database, IMF
3.4.2. Cotton, Textile and Apparel Sector Overview
Cotton farming began in the year 1903 and is one of the major Uganda’s traditional crops. Cotton
can be produced in most parts of Uganda, but over 50 percent of the crop is today produced in the
areas north and east of River Nile.Cotton is normally grown on small plots of less than half an acre
and is often inter-cropped with other cash and food crops. Farmers use traditional farming practices
and tools for cultivation and all crops are rain-fed. During the 1960s, Uganda was Sub-Saharan
Africa‘s largest cotton producer. It represented 40% of foreign earnings. However, political
instability and poor policy choices of the 1970s caused a serious decline in the sector.
In 1994, Uganda’s cotton sub-sector was liberalized by the government with the hope to address the
decline. In particular, the government hoped to solve the problem of crop financing in order to
0
250
500
750
0
5
10
15
20
2000 2001 2002 2003 2004 2005 2006 2007 2008 2009 2010E
GD
P p
er
cap
ita
(US$
)
GD
P in
US$
bn
GDP (nominal) GDP per capita (Nominal)

Page 84 of 154
increase production and productivity and to remove inefficient institutions. By 2004, the production
of cotton increased but after that there was decline in the production largely due to reduction in
area under cotton cultivation.
Today, although many ginneries operate at less than 40 percent of their estimated capacity, cotton is
estimated to contribute to the incomes of 10 percent of Uganda’s population in rural areas in the
North, East, and West.
The Ugandan textile sub sector was founded in the 1950s and 60s spearheaded by the Uganda
Development Corporation (UDC). A National Textile Board was established in the late 1960s to guide
textile industry activity in Uganda that focused at import substitution. The textile and apparel
section of the cotton value chain typically consists of three types of firms. These are textile mills that
primarily carry out spinning and weaving, finishing mills that do bleaching, dyeing, printing, and
garment cutters and household manufacturers. Most of the larger firms are vertically integrated,
carrying out spinning, weaving, finishing, converting, and in some cases, tailoring.
The spinning and weaving capacities are low and the existing mills cannot process more than 10
percent of the cotton lint currently being produced in Uganda. The annual output aggregates to
about 25 million meters.
Government of Uganda and the private sector have plans and budgets to further improve
production and value addition in the chain and to make the sector more competitive. In order to
make the sector more efficient and spur investments into the sector, the government has drafted
National Textile Policy for the country.
In December 2009, Ugandan government launched National Textile Policy, with a vision to create a
strong and vibrant textile and clothing industry with sustainable capacity utilisation and enhanced
investment through the textile value chain.
The specific objectives of the policy include a three-step development process:
Improvement period (1-2 years) with a focus on improving the capacities of existing textile
companies, reducing costs of doing business in Uganda, controlling counterfeits.
Expansion period (3-5 years) with a focus on capacity addition, quality improvements,
development of industrial textile parks, etc.
Period of steady and sound development (within 5 years and beyond) with a focus on
increasing downstream linkages within the sector for ancillary products like thread making,
garment accessories, food oils extraction, animal feeds making , etc. and seeking active
cooperation and partnership of industrial bodies.

Page 85 of 154
3.4.3. Value Chain Analysis
3.4.3.1. Overview
Figure 20: Uganda CTA Value Chain Overview
No. of farmers:
~10,000
Average farm
size:< 0.5 ha
Installed Capacity:
1,000,000 bales
Ginning equipment
in use:
Roller gin
Spinning Capacity: (2008) Short staple spindles: 500,000 OE Rotors: 1,200
No of textile mills: ~3
No. of garment Companies: ~24 Dominated by micro
and small-scale sectors
manufacturing various
garments mainly for
domestic purpose

Page 86 of 154
3.4.3.2. Cotton Fiber
During the 1960s, Uganda was Sub-Saharan Africa‘s largest cotton producer. It accounted for over
40% of foreign earnings. However, political instability and poor policy choices of the 1970s led to the
sector‘s decline. Though the attempts to revive the sector with lending operations during the 1980s
failed, policy reforms combined with a lending operation and high cotton prices revitalized the
sector in the 1990s. Nevertheless, there remains the sense that the sector lags behind its full
potential.
In Uganda, cotton is grown in nearly every part of county and is entirely rain fed. It is grown on a
regular basis by over 10,000 farmers. Over 90% of cotton is exported raw out of Uganda onto the
global market where prices continue to fluctuate from time to time based on levels of production
globally. Cotton faces constraints like pests, weeds, diseases, declined soil fertility, changing
climate, poor agronomic practices and marketing system.
Production Statistics
There has been a remarkable increase in the cotton lint production over the years
Table 39: Cotton Production Statistics, Uganda
Period Cotton Lint
Production
(Bales @ 185
Kg)
Earnings from lint Earning by farmers Sale of Seeds by ginners
Ave.
FOB
price
($/Kg
of lint)
Value
($
millions)
Ave. Farm
gate price
(UGX/Kg
of seed
cotton)
Value
(Sh.
Billion)
Total
quantity
of seed
produced
(MT)
Ave.
price
per MT
(UGX)
Total
value of
seed
(UGXBn)
2006-07 134,000 1.10 27.27 470 32.50 46,500 180,000 8.37
2007-08 66,500 1.60 19.68 750 25.74 17,350 340,000 5.90
2008-09 125,310 1.06 24.57 650 48.49 42,731 350,000 14.96
2009-10 70,300 1.59 20.68 900 27.94 23,972 400,000 9.59
2010-11 146,500 3.06 82.93 1,600 58.23 49,957 700,000 34.97
TOTAL 542,610 175.14 134.67 130,553 73.78
Source: Cotton Development Organisation
There has been a tremendous improvement in cotton yields in recent years, which has almost tripled
during 2005 to 2010. However, the production continued to decline largely due to reduction in area
under cotton cultivation. Most of the cotton produced in Uganda is exported. Major importers of
Uganda’s cotton are Indonesia, Portugal, Pakistan, Kenya and India. The exports of cotton however
vary a lot depending on international cotton prices, political instability in major growing areas as well
as a heavy dependence on weather. The internal demand of cotton for mill use in Uganda has
remained stagnant since 2003.

Page 87 of 154
Table 40: Cotton Balance Sheet (1990-2010), Uganda
Values in ‘000 (480-pound) bales Year from Aug 1 to Jul 31
Year Opening Stocks Production Imports Total Supply Mill Use Exports Ending Stocks
Harvested Area (000) Acres
Yield Pounds/Acre
2010 50 125 0 175 20 90 65 247 243
2009 65 60 0 125 20 55 50 173 166
2008 60 100 0 160 20 75 65 247 194
2007 85 60 0 145 20 65 60 247 117
2006 90 95 0 185 20 80 85 395 115
2005 135 90 0 225 20 115 90 667 65
2004 80 200 0 280 20 110 135 988 97
2003 80 125 0 205 20 105 80 618 97
2002 68 95 0 163 15 68 80 618 74
2001 42 90 0 132 7 57 68 618 70
2000 22 85 0 107 7 58 42 618 66
1999 19 100 0 119 7 90 22 618 78
1998 19 70 0 89 5 65 19 618 54
1997 19 50 0 69 5 45 19 124 194
1996 14 80 0 94 5 70 19 247 155
1995 14 45 0 59 5 40 14 371 58
1994 7 37 0 44 5 25 14 319 56
1993 19 18 0 37 5 25 7 175 49
1992 3 51 0 54 10 25 19 430 57
1991 9 32 0 41 10 28 3 331 46
1990 3 41 0 44 9 26 9 220 89
Source: National Cotton Council of America
Planting Seasons
In the northern areas, with one rainy season, cotton planting start at the beginning of April- June
rains and in the South, with two rainy seasons, planting occurs later in the June – July period.
Cotton Characteristics
Uganda’s Cotton is among the most commonly produced and traded cotton variety in the world and
belongs to the species Gossypium birsidum, accounting for 75% of world trade. American Upland
variety of cotton is most suitable for the Uganda’s climatic and soil condition. Two upland varieties
Allen and sunflower have been developed through selections and breeding to the current Bukalasa
Pedigree Albar (BPA) and Serere Albar Type Uganda (SATU) types grown in Uganda.
Cotton Grades
The Uganda Cotton grade are classified into two sets i.e. roller and saw gin set. The roller grade
includes UCON, UCOB, UCOP, UCOA and UCOM. The two Ugandan standards for saw ginned cotton
are UCOSA I and UCOSA II. These grades are determined by micronaire and staple length. All

Page 88 of 154
exporters are required to market Ugandan cotton on the basis of these grades. Over 98% of the crop
is roller ginned annually.
Table 41: Main Fiber Properties and Grades of Ugandan Cotton
Grade Standard Length (mm) Strength(g/tex) Micronaire Value Differences
(Points/ US cts/lb)
Universal
Grades
Roller Ginned
UCON 29 & above 30-33 3.7-4.3 150 points
( +1.5 cts)
Good Middling
UCOB 28-29 30-33 3.7-4.3 75 pts
(+0.75 cts)
Strict Middling
UCOP 28-29 28-32 4.0-4.2 Base Grade Middling
UCOA 26-27 28-30 4.0-4.2 -100 points
(-1.0 cts)
Strict Low
Middling
UCOM 26 & below 27-30 4.2-4.4 -225 points
(-225 cts)
Low Middling
Saw Ginned
UCOSA I 27 & above 28-30 4.0-4.2 100 points
(-1.0 cts)
Strict Middling
UCOSA II 27 & below 27-30 4.0-4.2 Base Grade Middling
Source: Cotton Development Organisation
Cotton Types
Uganda cotton belongs to the G. Hirsutum species whose origins trace back to the American upland
varieties (Allen and Sunflower). These two varieties underwent selections and breeding to produce
the Uganda Bukalasa Pedigree Albar (BPA) and Serne Albar Type Uganda (SATU) types. Uganda only
cultivates the BPA type.
Cotton variety in Uganda
i. East and North Short staple
ii. South & west Long staple

Page 89 of 154
Key Initiatives
Organic Cotton
Organic Cotton was introduced in Uganda in 1998. The organic garments export pioneered by Phenix has brought incredible hope for the sector as it improved the yield. During the year 2006-07 the interest in organic cotton production increased tremendously and particularly in Northern and West Nile regions and hence there was a lot of production of organic cotton in these areas. Mass production of organic cotton had a negative impact on the production and the productivity. As the required technology is missing and farmers are not well trained, yields are lower than 70 to 90% of normal ones. So the Government has stopped promoting Organic Cotton. Table 42: Historic Organic Cotton Production in Uganda
Period Organic Lint production (bales)
National lint production (bales @ 185kg)
Percentage of Organic to National production
1994-95 115 33,000 0.3
1995-96 392 56,416 0.7
1996-97 1,533 110,700 1.4
1997-98 2,393 32,000 7.5
1998-99 1,285 82,000 1.6
1999-00 983 117,000 0.8
2000-01 1,383 100,000 1.4
2001-02 1,391 120,000 1.2
2002-03 1,300 110,000 1.2
2003-04 3,808 160,000 2.4
2004-05 5,809 254,000 2.3
2005-06 2,763 102,000 2.7
2006-07 12,775 134,000 9.5
2007-08 11,274 65,000 17.3
Source: Cotton Development Organisation
Bt Cotton
Cotton has been planted in Uganda for more than a century, despite its low productivity. In an effort
to improve productivity, the Ugandan government is considering genetically modified (GM) varieties
such as insect resistant (IR) and herbicide tolerant (HT) cotton. The research that is being carried out
by Ugandan scientists at the National Agricultural Crop Resources Research Institute (NaCRRI), in
Namulonge, and National Semi-Arid Resources Research Institute (NaSARRI), in two sites, one being
in Serere in Soroti and the other at Mubuku in Kasese genetically modified (GM) cotton is showing
promising signs.

Page 90 of 154
Currently, the team is in the second phase of conducting the trial. The first phase was done from
September 2009 to March 2010. The first trial had encouraging results and the funders decided that
the researchers conduct a second phase of the trial for further evaluation.
The team is conducting the research on herbicide-tolerant cotton as well as boll worm infection.
With herbicide-tolerant cotton, the plant is left to grow without weeding and herbicide is applied to
eliminate the weed without affecting the plant. The boll worm trial is where both the Bt cotton
species and the local varieties are planted in the same field. Once the boll worm lands on the cotton
plant, it is killed immediately which is not the same case with the local variety.
Uganda National Council of Science that authorizes trials of GM crops in Uganda has given the team
a go-ahead to remove the lint of the cotton and sell it but its seeds should be burnt immediately.
This is to avoid farmers from obtaining seeds for planting before the biosafety law is put in place.
The objective of the trial is to assess the ability of Monsanto's GM cotton varieties to tolerate
applications of roundup herbicide, as a weed control method under Uganda's conditions. GM cotton
once adopted for commercialization will lead to increased yields leading to increased income in the
farming community since it will not be affected by the ball warm.
3.4.3.3. Ginning and Oil Pressing
Since cotton in Uganda is a smallholder, rather than estate crop, traditionally there have been little
or no organized backward linkages between ginners and farmers since no ginnery produces its own
cotton. However, ginners are now being supported through the efforts of CDO and USAID-funded
SPEED Project, to provide extension services to the farmers, including supervising demonstration
plots.
Uganda has adequate ginning capacity. There has been a remarkable increase in the ginning capacity
from 100,000 bales to 1,000,000 bales in to 1,000,000 bales in Uganda. Moreover, the Cotton
Development Organization is striving to re-discover the pre-1972 annual production levels of over
500,000 bales per annum.
3.4.3.4. Textiles
Uganda’s textile milling capacity was founded in the 1950 &60s. The Uganda Development
Corporation (UDC) spearheaded establishment of mills, working hand in hand with CALICO Printers
of the UK, YAMATO International & other Asian Family initiatives.
Like any other sector, the textile mills were affected by the chaos that Uganda went through which
resulted into mismanagement and closures. By the divestiture of some mills owned by Government,
machinery was obsolete and the state of repair was generally poor.
In Uganda, textile firms are mostly small or medium-sized, and low-capacity use is common. These
mills produce both clothing and cloth for sale on the local market. Most Ugandan textile mills do not

Page 91 of 154
produce large volume fabric orders, but rather concentrate on producing small runs of a variety of
fabrics. Some firms utilize state of the art electric spinning machines and weaving and knitting
looms, while other firms produce fabric on manually operated machinery. Three mills [Phenix, Sigma
Knitting Industries & Southern Range Nyanza] are now functional, having invested in excess of US$
30 Million in modernization and equipment up-gradation. Idle capacity exists in terms of non-
functioning mills like Lira Spinning Mill, Mulco& ATM while Rayon Textiles was scrapped.
Fabrics are sourced about evenly from local textile operations and Asian imports. Roadways are the
dominant method of export for Ugandan apparel manufacturers
The production of fabrics has gradually improved in quality and quantity to enable millers offer a broader variety of products for the local regional and international market. The organic garments export niche breakthrough pioneered by Phenix has brought incredible hope for the sector. The sector supplies about 10% of the UGX 350 Billion textile market annually. The mills have potential to produce 25-30% of the market demand. The 3 functional mills directly support the livelihood of more than 3000 Ugandans whose aggregate annual income is in excess of UGX2.5Billion. Through TEMAU, the mills have managed to establish human resources management best practices in the sector, enabling unionization of workforce to eliminate industrial unrests that characterized the sector earlier.
Table 43: Key Yarn Characteristics made from Ugandan Cotton
Staple length 30mm (11/5'')
Fibre Strength > 20 g/tex
Fineness (micronnaire) 3.5 - 4.0
Yarn strength >2200 LCCSP
Yarn appearance white, free from Neps
Source: Cotton Development Organisation
Apparel
The manufacturing of apparel and clothing in Uganda is limited and is dominated by micro and small
scale tailors of various garments, mainly for domestic consumption. The production of clothing in
Uganda is very minimal due to the low purchasing power of consumers, competition from second-
hand clothing markets and cheap imports. Most apparel investors in Uganda are local entrepreneurs
that manufacture clothing and uniforms for the local and regional East African markets. Many have
considered or tried to take advantage of AGOA, but have not found it to be profitable, unlike the
markets they already serve.

Page 92 of 154
Support Institutes
The key support institutes involved in the Ugandan Cotton Industry are:
Table 44: CTA Sector Support Institute in Uganda and their Functions
Institutions Main Functions
Cotton Development
Organization (CDO)
Established in 1994, its objective is to regulate the industry as well
as collect and disseminate statistics. It is financed by a levy imposed
on all cotton ex-ports. Its Board of directors consists of the
Chairman (appointed by the Minister), representatives from
MFPED, MAAIF, and NARO, and six private sector representatives
from cotton-related industries. The Managing Director is appointed
by the Board.
Uganda Ginners & Cotton
Exporters Association
(UGCEA)
Formed in 1997 with compulsory membership for all cotton ginners,
its objective is to coordinate activities such as input financing,
operating demonstration plots, and providing a forum for discussing
issues affecting ginners and exporters.
Cotton Research Institute
All cotton research activities take place at the Cotton Research
Station, located in Serere (Soroti district). Its main responsibilities
consist of studying and controlling cotton diseases, seed
multiplication, and introduction of new varieties.
National Agricultural Advisory
Services (NAADS)
NAADS was established by the National Agricultural Advisory
Services Act of 2001 as a statutory corporation, its mandate is to
promote market-oriented agriculture through provision of
extension services.
Ministry of Agriculture,
Animal Industry and Fisheries
(MAAIF)
It is responsible for supporting and guiding the agricultural sector.
Most of its cotton-related activities are performed through the
Cotton Research Institute.
Ministry of Finance, Planning
and Economic Development
(MFPED)
It oversees the planning of strategic development initiatives in
order to facilitate growth, efficiency, stability, and poverty
eradication. It also mobilizes resources for public expenditure
programs
Ministry of Tourism, Trade,
and Industry (MTTI)
Three departments within the Ministry (Trade, Cooperatives, and
Industry) deal with cotton-policy issues such as value addition,
enhancement of competitiveness, and extension services.
Uganda Manufacturers
Association ( UMA)
UMA was established in 1960’s to promote, protect and coordinate
the interests of industrialists in Uganda. UMA initiates discussions
and exchange of information amongst members on industrial
issues. It also advises Government on key policies affecting industry.
Uganda Investment Authority The Uganda Investment Authority (UIA) is a semi-autonomous
investment promotion and facilitation organization in Uganda,
owned by the Government of Uganda. The mission of the UIA is to
promote and facilitate investment projects, provide serviced land,
and advocate for a competitive business environment.

Page 93 of 154
Private Sector Foundation
Uganda
PSFU is Uganda’s apex body for private sector. It has been
Government’s implementation partner for several projects and
programmes aimed at strengthening the private sector as an engine
of economic growth. Such programmes include; the
implementation of the Business Uganda Development Scheme
(BUDS), the BUDS-Energy for Rural Transformation (ERT)
programme and advising government on positive policy reforms.
Source: Primary Research Findings
3.4.4. Sector Competitiveness
3.4.4.1. Raw material
In Uganda, cotton is grown in nearly every part of county and is entirely rain fed. It is grown on a
regular basis by over 10,000 farmers. Over 90% of cotton is exported raw out of Uganda onto the
global market where prices continue to fluctuate from time to time based on levels of production
globally. Uganda has an advantage in production like availability of cheap labor, low pest
pressure and favorable weather. All these factors Uganda to grow the crop through better
agronomy for increase production and productivity.
3.4.4.2. Manpower
There is availability of abundant cheap manpower but the present workforce lacks the requisite skills
and training to do the required job. There is requirement of skilled workers especially in areas like
efficient farm practices, weaving and textile manufacturing.
3.4.4.3. Power, Water & Fuel
Availability of power is highly erratic and a big constraint to this sector. The costs are high and highly
fluctuating.
3.4.4.4. Financial support
Credit availability is very less. Long term loans are available at an interest rate of 18 to 20% with a
repayment period of 3 years. Foreign currency loans may be available to businesses with at least
20% of earnings in foreign currency, at an interest rate of 7 to 12%. However, the availability is very
less.
3.4.4.5. Market access
Uganda made textile and apparel products can enter most of the world’s richer economies free of
any customs duties and with limited quota restrictions. Some of the trade agreements that they
have signed up for preferential market access includes:
African Growth and Opportunity Act (AGOA)
Economic Partnership Agreement (EPA) with EU

Page 94 of 154
Least Developed Country ( LDC)
Common Market for Eastern and Southern Africa (COMESA)
East African Community (EAC)
3.4.4.6. Technology
The technology currently in use is highly outdated in all areas like ginning, spinning and weaving.
Many mills have lot of dysfunctional machineries which is just lying with them for many years. There
is huge requirement of modern technology and training people to operate these machineries, to
improve productivity in the sector.
3.4.4.7. Industrial zones
Uganda has four functional industrial parks at Nalukolongo, Luzira, Bweyogerere and Namanve.
3.4.4.8. Research & product development
Research initiatives currently being undertaken by Cotton Research Institute .Its main responsibilities
consist of studying and controlling cotton diseases, seed multiplication, and introduction of new
varieties
3.4.4.9. Value addition
Uganda has abundant cotton supply but the downstream industries i.e. textile and apparel
manufacturing are limited. Currently, most of the products made are very basic in designs at the
textile level as well as garments (finished product) level. There is very limited focus on value addition
w.r.to designs, specialized finishes, embroidery, sequins, etc.
3.4.4.10. Compliances and CSR activities
Southern Range Nyanza Ltd has been sponsors medical camp where total of 1200 patients’ access
free world class medication annually. They have also sponsored National Badminton championship
many other supporting activities to nurture talent in Uganda. Donate clothes to underprivileged.
3.4.4.11. Logistics and Business Costs
Uganda is a land locked country and utilizes Kenyan port of Mombasa for exports. The intercity
connectivity from port to manufacturing locations is satisfactory with lot of highway development
happening all across. The issue sometimes is of paperwork and hassles at border post (from Uganda
to Kenya) and delays for clearances at the port itself.

Page 95 of 154
Table 45: Logistics and Business Costs, Uganda
Power Availability Erratic
Power cost US cents 12/unit
Lending rate 18-20%
Wage/ month US$ 90-100
Own Port No
Nearest port Mombasa
Sailing time from China 17 days
Sailing time to US 25 days
Freight cost / container (20 ft) Exports US$2100 Imports US$ 2200
Source: Primary Research Findings
3.4.4.12. Government Initiatives
The government is providing support by funding the seed for planting and related activities.
3.4.4.13. Domestic market
The domestic markets Uganda is dominated by imports of yarn, fabrics, finished goods. Domestic
market is affected by huge imports of second-hand clothing at very low prices. This has led to
dependence on imported clothing and domestic producers make products mainly for the export
markets.
3.4.5. Foreign Trade
3.4.5.1. Overview
Uganda is a net importer in T&A sector, with net imports amounting to US$ 0.09 Bn. T&A exports
have declined since 2005 from US$ 0.06 Bn to US$ 0.03 Bn. Share of T&A exports in country’s total
exports have declined gradually from 8% in 2005 to 2% in 2009.
T&A imports have witnessed increase from US$ 0.07 Bn in 2005 to US$ 0.12 Bn in 2009, thus
registering a compounded growth of 15%. Share of T&A imports in country’s total imports has
consistently been at 5%.
Cotton Fiber accounts for 81% of Uganda exports whereas it imports mainly worn clothing and
twines, cords. China is the biggest supplier to Uganda whereas the biggest export market is
Indonesia.

Page 96 of 154
Figure 21: Uganda’s Overall Trade
Figure 22: Uganda’s CTA Sector Trade
Source: UN Commodity Trade Statistics Database
Table 46: Key CTA Sector Export and Import Statistics, Uganda (2009)
Top 4 exported commodities 88% Top 4 imported commodities 54%
Cotton Fiber 81% Worn clothing 20%
Woven fabric with more than 85%
cotton, less than 200 gsm 3% Twine, cordage etc. 17%
Sacks and bags 2% Men's shirts. 9%
Knitted t-shirt 2% Men’s woven suit, shirt etc. 8%
Leading 4 markets 53% Leading 4 suppliers 70%
Indonesia 17% China 26%
Portugal 14% India 22%
Pakistan 14% United Arab Emirates 12%
Burundi 8% Kenya 10%
Source: UN Commodity Trade Statistics Database
3.4.5.2. Exports to EU
Uganda is a minor supplier of textiles and apparels products to the EU market. Uganda’s supply to
the EU-27 countries in 2010 was ~US$ 2.7 Mn. Further, the value of trade with EU 27 is also on a
declining trend over last 5 years with a CAGR of -8%.
0.7 0.71.0
1.1 1.1
1.51.7
2.0
2.4 2.3
2005 2006 2007 2008 2009
Total Exports Total Imports
Values in US$ Bn
0.06
0.030.04
0.02 0.03
0.070.08
0.090.11 0.12
2005 2006 2007 2008 2009
T&A Exports T&A Imports
Values in US$ Bn

Page 97 of 154
Figure 23: Uganda’s CTA Sector Exports to EU
Source: Eurostat
Table 47: Major Categories of Imports by EU from Uganda
Values in US$ ‘000 2006 2007 2008 2009 2010 CAGR 2010 share
Raw Cotton 3746 5273 5467 4173 2584 -9% 95%
Knitted T-Shirts, singlets and other vests
Na 80 14 68 49 -15% 2%
Women's suits, jackets, dresses, skirts, shorts, etc.
4 2 0 11 20 45% 1%
Subtotal top 3 categories 3751 5356 5481 4252 2653 -8% 98%
Others 32 3 42 40 61 18% 2%
Total 3782 5359 5523 4292 2714 -8% 100%
Source: Eurostat
3.8
5.4 5.5
4.3
2.7
0
1
2
3
4
5
6
2006 2007 2008 2009 2010
Values in US$ Mn
CAGR -8%
-*%

Page 98 of 154
3.4.5.3. Exports to USA
Uganda’s export of textiles and apparel products to the US has been very low. Uganda’s export to
the US in the year 2010 was ~ US$ 0.4 Mn. Further, the value of trade to US has declined over the
years.
Figure 24: Uganda’s CTA Sector Exports to USA
Source: Otexa
Table 48: Major Categories of Imports by US from Uganda
2006 2007 2008 2009 2010 CAGR 2010 share
Women's suits, jackets, dresses, skirts, dress, shorts, etc, woven
25,506 20,369 Na Na 264,436 60% 68%
Knitted T-Shirts, singlet and other vests
40,695 953,937 402,725 144,223 44,956 2% 12%
Women's suits, jackets, dresses, skirts, dresses etc, Knitted or crochet
Na Na Na Na 34,080 Na 9%
Jerseys, pullover, Cardigans Na 5,853 Na Na 12,872 Na 3%
Women’s blouses and shirts 1,881 Na Na Na 8,643 49% 2%
Subtotal top 5 categories 67,382 980,159 402,725 144,223 364,987 40% 93%
Others 1,190,195 225,289 9,537 41,623 25,564 -54% 7%
Total 1,257,577 1,205,448 412,262 185,846 390,551 -21% 100%
Source: Otexa
1.3 1.2
0.40.2
0.4
0.0
0.2
0.4
0.6
0.8
1.0
1.2
1.4
2006 2007 2008 2009 2010
Values in US$ Bn
CAGR -21%
-

Page 99 of 154
3.4.6. SWOT Analysis
Strengths
1. Availability of abundant good quality cotton: Uganda’s cotton is of medium to long staple
lengths. In the last five years, the highest annual cotton production registered was 200,000 bales
(185 kg each).
2. Conducive business environment: The free market economic reforms introduced in the 1990’s
have over the years created macroeconomic stability in Uganda. In addition, partnership with
the private sector, as an engine of growth, is the core of the Government policy.
Weaknesses:
1. Low spinning and weaving capacity: Current spinning and weaving capacities are very low (~25
Mn meters) despite the presence of an abundant raw material base. Technology is another key
area of concern which needs upgrading to enhance the competitiveness of the overall textile
industry.
2. Export of unprocessed cotton: Most of the cotton produced in Uganda is exported without any
value addition.
3. High production & finance cost: Currently Ugandan energy rates are the highest in the region,
while reliability of electricity service is also an issue. Also since the region is land locked, firms
have to incur high internal and external transport costs. Textile sector manages to borrow funds
at a very high finance rate ranging between 18-24%.
4. Weak linkages across the value chain: There is very little to no cooperation among the various
stakeholders within the value chain. Human resources training and supporting services like
international sourcing and buying houses are lacking.
Opportunities:
1. Huge domestic/regional/international market demand: The current sector output is not able to
meet the country's demand. A lot of untapped demand exists.
2. Idle capacity in the private sector: Uganda has only two functional vertically integrated textile
mills and several garmenting factories which are all operating below capacity. Mills like Mulco,
African Textile Mills, Rayon Textiles as well as Lira Spinning Mill are closed.
3. Exploration of the organic cotton niche: The world organic lint demand is increasing and ~33%
of the global output is produced in East Africa. In value terms, organic cotton fetches up to 40%
above conventional cotton prices while yarns and fabric derived from organic cotton fetches up
to ten times. Therefore, it is opportunity for the sector to attract investment in organic cotton.

Page 100 of 154
Threats:
1. Threat from Counterfeits and second hand articles: All major local brands have had their brands
copied by unscrupulous business people. The present legal framework is not strong enough to
prevent this practice. There are huge imports of second hand clothes in the country which is also
a threat.
2. Competition from leading global textile manufacturers: With the end of Multi Fiber Agreement
in 2005 and establishment of Customs Union on 1st January 2005, the domestic sector is facing
tough competition from Chinese and Asian companies which have high productivity levels and
enjoys economies of scale.

Page 101 of 154
3.4.7. Recommendations
After conducting a comprehensive analysis of CTA sector in Uganda, we did a SWOT analysis which
brings out the key issues that the sector is currently facing. These are strategic issues which need to
be addressed keeping in mind the relative strength areas of Uganda and its cotton, textile and
apparel sector. Following recommendations are made for improving/strengthening the CTA sector
performance:
S.no. Objectives Recommendations
1 Increasing cotton quality and yield
Improve farm practices
Create awareness among farmers
Support R&D centers for introducing high yielding seeds
Promote contract farming on a larger scale
Offer more extension programmes
Exercise stringent quality controls at the ginning level
2 Promoting value addition in the sector
Uganda has abundant cotton supply but the downstream industries i.e. textile and apparel manufacturing are limited. Value addition in the sector should be promoted by providing:
Support schemes/fiscal incentives on value addition
Promoting clusters for doing value addition
3 Support for modernization and capacity expansion
Interest subsidies shall be provided for upgrading machineries or installing new machineries
Textile & Apparel sector shall be classified as Priority sector and thus, increased lending to the sector should be a prime focus
Establish JVs with international partners
4 Improving skills of people through adequate training
Introduce schemes for training and skill development and create a fund for implementing the scheme which will aid:
Establishing new training centers
Establishing new training programs
Strengthening existing training centers
Linking existing centers with the Industry
5 Promote education in the field of textiles
Establish new colleges for textiles
Link existing centers with the Industry
Update course curriculum regulatory as per industry requirements

Page 102 of 154
Tie-up with other international colleges for student exchange/knowledge exchange programs
6 Improve existing infrastructure and rationalize costs of doing business
Adopt cluster based development approach where suitable infrastructure is provided to the units operating within those and at reasonable costs
Various clusters should be identified by doing a detailed study and then promoted as ‘Textile & Apparel districts’ within the region
7 Initiatives to promote domestic market development
Phase out supply of second-hand clothing from the market through appropriate policy interventions
Develop a mechanism to regulate flow of cotton to domestic market
8 Investment promotion activities
Organize Annual Investor Summit showcasing business opportunities in Uganda’s cotton and textile sector
All these recommendations have been dealt in detail under Chapter 5: Benchmarking and Proposed
Interventions, where we have compared the target countries with the leading CTA manufacturing
countries of the world on the key parameters.

Page 103 of 154
4. Regional Level Analysis
4.1. Snapshot
Table 49: Inter-country Comparison - Key Statistics
Kenya Sudan Tanzania Uganda
Overview
Area (‘000 sq km) 580.3 2,506 947 241
Climate Tropical Tropical in south; arid desert in north
Tropical Tropical
Natural resources Limestone, soda ash, salt, gemstones, fluorspar, zinc, diatomite
Petroleum; small reserves of iron ore, copper, zinc, etc.
Hydropower, tin, phosphates, iron ore, coal, diamonds, gemstones
Copper, Cobalt, Hydro-power, Limestone, Salt, Gold
Major agricultural products
Tea, coffee, corn, wheat, sugarcane, fruit , vegetables
Cotton, groundnuts, sorghum, millet, wheat, gum
Coffee, sisal, tea, cotton, pyrethrum
Coffee, Tea, Cotton, Tobacco, Cassava
Major industries Small-scale consumer goods, agricultural products
Oil, cotton ginning, textiles
Agricultural processing, diamond, gold and iron mining, salt
Sugar, Brewing, Cement, Tobacco, Cotton textiles, Steel production
Economy
GDP (Nominal, 2010 est)
US$ 32 Bn US$ 65.9 Bn US$ 22.4 Bn
US$ 17.1 Bn
GDP (Real, 2010 est) US$ 18 Bn US$11.7Bn US$ 11.2 Bn US$ 8.8 Bn
GDP growth rate (Real, 2010 est.)
4% 5.2% 6.4% 5.8%
GDP per capita (Nominal, 2010 est.)
US$ 888 US$ 1705
US$ 543 US$ 504
GDP composition
Agriculture 22% 32.1% 41.6% 23.6%
Industry 16% 29.0% 18.1% 24.5%
Services 62% 38.9% 38.4% 51.9%
Labour force (2010 est.)
17.94 Mn 12 Mn
21.87Mn 15.5 Mn
Inflation 4.2% 11.8% 7.2% 9.4%
Exports US$ 5.14 Bn US$ 9.8 Bn US$3.8 Bn US$ 2.9 Bn
Imports US$ 10.4 Bn US$ 8.5 Bn US$6.3 Bn US$ 4.5 Bn
External debt US$ 7.9 Bn US$ 38 Bn US$7.6 Bn US$ 2.9 Bn
Currency rate 1US$=80 KES 1 US$ =2.7 SDG 1US$=1500 TZS 1 US$ = 2400 UGX

Page 104 of 154
Kenya Sudan Tanzania Uganda
Demographics
Population 41 Mn 40 Mn 41.3 Mn
35 Mn
Age structure
0-14 years 42.20% 42.1% 42% 49.9%
15-64 years 55.10% 55.2% 55.1% 48.1%
65 years + 2.70% 2.7% 29% 2.1%
Median Age 18.9 years 18.5 years 18.5 years 15.1 years
Population growth rate (2011 est.)
2.5% 2.48% 2.0%
3.6%
Urban population 22% 40% 26% 13%
Literacy rate 85% 61.1% 69.4% 66.8%
Infrastructure
Land line users 664,100 370,400 173,552 233,500
Mobile users (Mn) 19.4 15.3 18 9.4
Internet users (Mn) 4.0 4.2 0.68 3.2
Airports 191(17 paved) 140 (19 paved) 124(9 paved) 46 (5 paved)
Railways (Km) 2,778 5,978 3,68 1244
Roadways (Km) 160,886 11,900 78,892 70,746
Cotton fiber statistics (2010)
Cotton production (000 bales,)
49 100 275 125
Area under cotton cultivation (000 acres)
104 104 741 247
Cotton yield (lb / acre)
226 462 178 243
Mill Use (000 bales) 50 8 150 20
Exports (000 bales) 0 100 225 90
T&A trade statistics (2009)
Exports US$ 252 Bn US$ 33 Bn US$ 174 Bn US$ 26 Bn
Imports US$ 681 Bn US$ 418 Bn US$ 400 Bn US$ 118 Bn
Major exported products
• Suits, jackets, etc.
• Jerseys, pullovers, etc.
• Cotton fiber
• Cotton fiber • Home furn.
excl. blanket & linen
• Cotton fiber
Major imported products
• Worn Clothing • Woven fiber of
syn. filament yarn
• Suits, jackets, etc.
• Men's woven Shirts
• Worn Clothing • Woven fb of
syn. filament • Cotton woven
fb < 200 gsm
• Worn Clothing
• Twine, Cordage, etc.
Major markets • USA • Egypt • China
• Kenya • India • Vietnam
• Indonesia • Portugal • Pakistan
Major suppliers • China • India • UAE
• China • India • Egypt
• China • India
• China • India • UAE

Page 105 of 154
4.2. Value Chain Analysis: Summary*
* Reflects the current, relative status
4.3. Cost Comparison
Table 50: Inter-country Comparison - Costs
Parameter Kenya Sudan Tanzania Uganda
Power cost US cents 20 / unit
US cents 12/ unit US cents 14/ units
US 12 cents / unit
Lending rate 16-18%
9-12% ( short term only)
14-16% 18-20%
Wage/month ~US$ 100 US$ 160-300 US$ 80-100 US$ 90-100
Freight cost / container (20 ft)
Export - US$ 2100 Import- US$ 2200
Export - US$ 2000 Import -US$ 2100
Export - US$ 1300 Import - US$ 1500
Export - US$ 2100 Import -US$ 2200
Corporate Tax 30% 10% 30% 30%
Source: Primary Research Findings

Page 106 of 154
4.4. SWOT Analysis
Strengths
1. Availability of cotton: Kenya, Sudan, Tanzania and Uganda together accounts for significant
amount of cotton production. This is sufficient to not only meet the domestic requirements
but also export significant quantities. The cotton industry has been one of the key areas in
these countries and significant population has been dependant on the sector for more than
a century.
2. Increasing focus on the sector: Government is laying focus on the sector and is committed
to revitalize the cotton sector. This will provide additional momentum to the sector and will
create interests of amongst the existing industry players as well as the potential investors.
Weaknesses
1. Outdated technology: The target countries lack state-of-the-art machinery for textile
manufacturing. Most of the ginning units in all the countries had quite old machinery, which
has been refurbished to keep functioning. Similarly at textile level (yarn, fabrics and
processing) very few units exist with new technology machines. This further adds to the
costs of manufacturing. The reason behind non-upgradation of machines is lack of major
new investment in the sector.
2. Lack of Skills/ training: There is a huge requirement for enhancing the skills of people to
increase their efficiency levels. The current infrastructure provides for very few such
institutions with limited capacities and has few enrollments for the training facilities. There
is a need for promoting these institutions (new and old), support these with the necessary
infrastructure and churn out large no. of trainees each year.
3. Absence of integrated chain: Kenya has a strong garment manufacturing capacity but
limited backward linkages within the country to support it. Uganda and Sudan produces
cotton, but lacks further downstream processes. Tanzania has some capacities from cotton
to fabrics, but lacks value addition in terms of fabric type as well as garment conversion. For
countries where substantial benefits for exports are available, it becomes important to have
a complete supply chain as buyers prefer integrated supply bases.
4. Limited value addition: Most of the cotton produced in the Tanzania, Sudan and Uganda is
exported out of the country in raw form. A major reason behind this is the limited value
addition happening in terms of manufacturing of finished goods/garments. In Kenya, cotton
exports are nil, but the cotton production volume there is also low.
5. High cost of manufacturing: The existing costs of borrowing are so high that it almost makes
it impossible for the sector to rely on these financial institutions. The high cost of capital,
when available, not only deters new investment in the production of yarn, fabric, and other
inputs, but it also increases the costs of existing production. There are difficulties in
Page 107 of 154
obtaining loan at competitive rates for purchasing equipment and raw materials, as well as
for financing trade. Even if they manage to bear the high costs, the formalities for loan
approvals, requirements for collaterals and other documentation are intense.
6. Poor farm practices: The sector is dominated by smallholder producers with limited
knowledge on crop and farm management practices, price and market trends, input
procurement and supply trends which results in low cotton yield.
7. Under developed domestic market: Domestic garment industry is underdeveloped and is
not promoted in the target countries. It is highly impacted by second-hand clothing imports.
There is a need to phase out supply of second-hand clothing from the market through
appropriate policy interventions.
8. Cotton quality issues: The cotton from Sudan and Tanzania is found to have more
contamination than the world average. Cotton suffers from contamination from
polypropylene fibers that are introduced into the cotton during the picking and baling
process. The quality of cotton is also compromised by stickiness resulting from insects,
which can cause irregularities in the yarn production, including yarn breakages.
Contamination and stickiness limit the downstream potential for textile products.
Opportunities
1. Huge demand potential: There is huge demand for cotton fabrics and textiles in the target
countries due to rising population, increasing income, and changing consumer patterns in
preference for cotton textiles and apparel.
2. Preferential trade access: These regions have preferential market access and their products
can enter most of the world’s richer economies free of any customs duties and with limited
quota restrictions. Some of the trade agreements these countries have signed up for
preferential market access includes:
a. African Growth and Opportunity Act (AGOA)
b. Southern African Development Community (SADC)
c. Economic Partnership Agreement (EPA) with EU
d. Least Developed Country (LDC)
e. East African Community (EAC)
3. Scope for value addition: There is a lot of scope for making value added products
particularly for the export markets such as adding embroidery, sequins, and other
style/design elements. This will bring in incremental revenue to the sector and will also lead
to more employment creation and skill enhancement.

Page 108 of 154
Threats
1. Threat from second hand articles: There are huge imports of second hand clothes in Kenya,
Tanzania and Uganda which is posing a big threat to the economy. The present legal
framework is not strong enough to prevent this practice. In Sudan, the import of second
hand clothing is already banned and thus, free from its repercussions.
2. Lack of sector specific incentive/ policy framework: There is lack of specific incentives by
the government to promote Textile & Apparel sector in the target countries. Absence of
sector specific policies in most of these countries limits investments in the sector as foreign
investors are not confident enough to invest in this sector till they are sure of the continuity
of benefits.
3. Limited focus on textile education: There are few institutes/universities offering education
in textile programmes. Moreover, students’ interest is very low in comparison to other
courses. The no. of students passing out each year with degree in Textiles is very low. Other
courses like IT, graphic designs, etc. are gaining popularity as students get better salary
packages from these courses.
4. Shift to other cash crops: Emergence of alternative cash crops, which are cheaper to grow
but fetch higher returns than cotton in the major cotton growing areas, are a threat for the
sector.
5. Competition from global textile manufacturers: Expanding acreage, increasing yields and
falling production costs in major producing and consuming countries pose a great threat to
the target countries.

Page 109 of 154
4.5. Key Issues and Recommendations
Table 51: Inter-country Comparison - Key Issues and Recommendations
S. No. Head Parameter Kenya Sudan Tanzania Uganda Recommendation
1 Cotton Productivity Lint (in Kg/ha) Cotton productivity: 253 kg/ha
Cotton productivity: 518 kg/ha
Cotton productivity: 200 kg/ha
Cotton productivity: 272 kg/ha
* Introduction of Bt Cotton * Improved farm practices * Support to R&D centers for introducing high yielding seeds * Promotion of contract farming
2 Fiber contamination level
On a scale of Low to high Low to Medium Low to Medium
High Low to Medium
* Improved farm practices * Extension programs * Stringent quality control at ginning level
3 Value Addition
Fiber level
Trials for Organic cotton production is going on for last 2 years
Limited focus on organic cotton
World's 4th largest producer of organic cotton in 2010
Organic cotton production has gone down drastically
* Promotion of fair trade cotton * Promotion of organic cotton
Textile level Mostly basic product manufacturing * Focus on value added products in line with the available infrastructure
Finished product level Mostly basic product manufacturing * Focus on value added products
4 Technology level
Fiber level Mostly outdated technology * Modernization / technology upgradation needs to be focused on
Establishing JVs with international partners
Textile level Mostly outdated technology
Finished product level Technology is mostly updated and well-functioning
5 Supply chain linkages
Existing Capacities and utilization
Industry is not well integrated from farm-to-field and has certain weak linkages across the value chain. Ginning capacity is surplus in comparison to current cotton production, and hence it is largely underutilized. Capacities in textiles (Spinning, weaving, knitting and processing) are low In comparison to downstream local demand. However, existing capacities also remain underutilized. Local demand is primarily catered by imports of yarn and fabric.
* Focus on cluster based development approach
Identify key bottlenecks and encourage investments to promote those areas
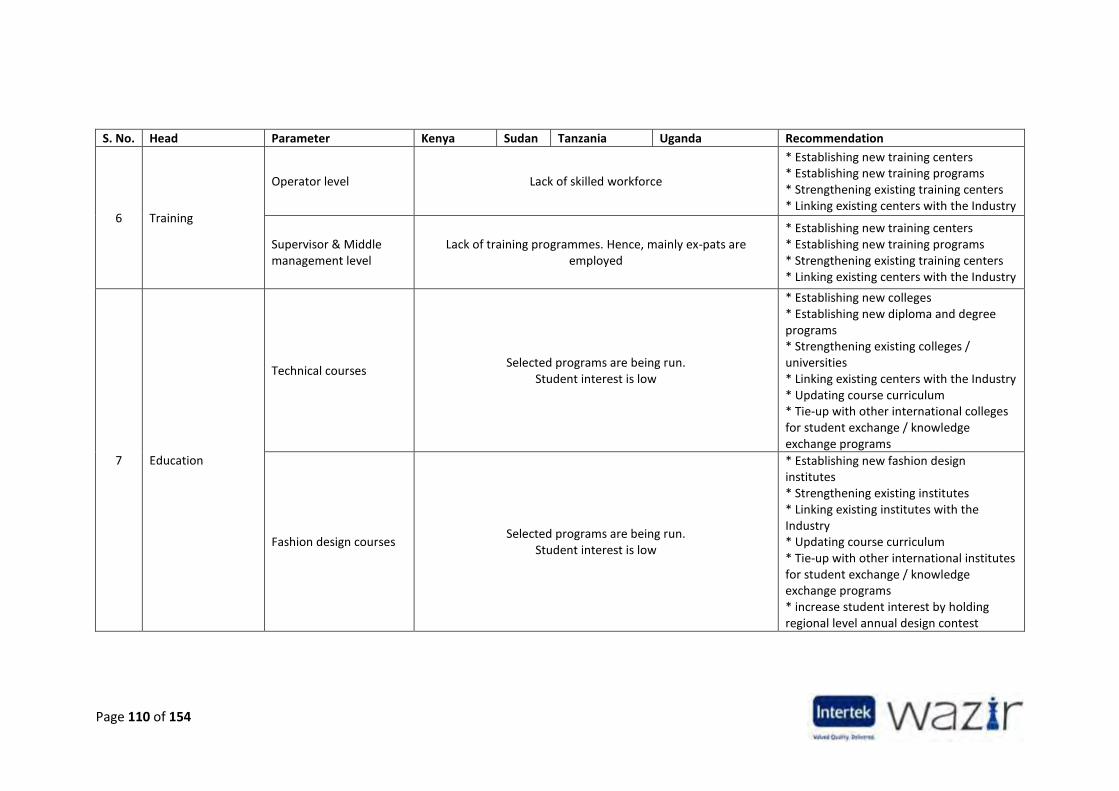
Page 110 of 154
S. No. Head Parameter Kenya Sudan Tanzania Uganda Recommendation
6 Training
Operator level Lack of skilled workforce
* Establishing new training centers * Establishing new training programs * Strengthening existing training centers * Linking existing centers with the Industry
Supervisor & Middle management level
Lack of training programmes. Hence, mainly ex-pats are employed
* Establishing new training centers * Establishing new training programs * Strengthening existing training centers * Linking existing centers with the Industry
7 Education
Technical courses Selected programs are being run.
Student interest is low
* Establishing new colleges * Establishing new diploma and degree programs * Strengthening existing colleges / universities * Linking existing centers with the Industry * Updating course curriculum * Tie-up with other international colleges for student exchange / knowledge exchange programs
Fashion design courses Selected programs are being run.
Student interest is low
* Establishing new fashion design institutes * Strengthening existing institutes * Linking existing institutes with the Industry * Updating course curriculum * Tie-up with other international institutes for student exchange / knowledge exchange programs * increase student interest by holding regional level annual design contest

Page 111 of 154
S. No. Head Parameter Kenya Sudan Tanzania Uganda Recommendation
8 Logistics
Nearest Port Mombasa Port Sudan Dar-Es-Salaam
Mombasa
* Adopt cluster based sector development and provide good infrastructure facilities within the cluster
Sailing time from China 17 days 20 days 18 days 17 days
Sailing time to US 25 days 18 days 25 days 25 days
Freight Cost/ container (20 ft) – Exports US$ 2100 US$ 2000 US$ 1300 US$ 2100
Freight Cost/ container (20 ft) – Imports US$ 2200 US$ 2100 US$ 1500 US$ 2200
9 Power
Availability Consistent
supply Erratic Erratic Erratic
Cost High:
US cents 20/units
Medium: US cents 12/units
Medium: US cents 14/units
Medium: US cents 12/units
10 Business financing
Availability Low Long term financing is unavailable.
Low Low *Work towards improvement of credit availability and reduction in cost of borrowing
Cost 16-18% 9-12% (short term)
14-16% 18-20%

Page 112 of 154
S. No. Head Parameter Kenya Sudan Tanzania Uganda Recommendation
11
Market development & Investment promotion
Investor interest creation Limited promotional activities
*Organized Mega Trade Shows to facilitate buyer-seller meet, investor conference, etc. *Create a separate cell for textiles for policy support, implementation and handling investor queries *Create an incentive package for industry promotion
Organize leading trade & industrial delegation to key countries of investments
Local market development/ Domestic consumption
Domestic garment industry is not promoted, highly impacted by second-hand clothing imports
Domestic garment industry is not promoted, highly impacted by imports
Domestic garment industry is not promoted, highly impacted by second-hand clothing imports. Majority of the Raw material (cotton) is exported
Domestic garment industry is not promoted, highly impacted by second-hand clothing imports
*Phase out supply of second-hand clothing from the market through appropriate policy interventions *Scheme/mechanism to regulate the flow of cotton to domestic markets

Page 113 of 154
5. Benchmarking and Recommendations
5.1. Cotton Productivity
Kenya, Tanzania, Sudan and Uganda all have
cotton productivity far less than the world
average. Most of the large cotton producers
globally have better productivity levels than
these 4 countries.
Though, the climate and soil quality of these
nations provide ample scope for increasing
cotton yields to a much higher level, but the
growth has hampered by lack of awareness of
better farm practices, standard operating
procedures, low mechanization of farm
activities, lack of irrigation network, etc.
Several steps have been taken by the concerned
authorities in each of the countries to improve
cotton productivity and their result can be seen
in the cotton productivity data for last 10-years,
which largely shows an upward trend.
Figure 25: Cotton Yield in Selected Countries (2010)
Source: USDA and National Cotton Council of America
The chart below depicts the cotton yields in the target countries from 1991 to 2010. As we can see in
last five years or so, mostly the yields have started growing after a long period of stagnancy. Among
these four nations, the productivity increase is more prominent in Uganda and Kenya.
Figure 26: Cotton Yield in Target Countries (1991 – 2010)
Source: National Cotton Council of America
200
253
272
468
518
544
661
703
742
771
910
1,289
1,429
1,457
1,597
Tanzania
Kenya
Uganda
India
Sudan
Turkmenist…
Pakistan
Uzbekistan
World …
Greece
USA
China
Turkey
Brazil
Australia
Values in kg / Ha
0
100
200
300
400
500
600
Sudan Tanzania Kenya Uganda
Values in kg/Hectare

Page 114 of 154
Australia is the country which has highest cotton yield in the world: more than twice the world
average, more than thrice the Sudan’s yield values and almost 8 times that of Tanzania. Before last
three years the yields were above 2000 kg/ ha level.
About 85% of cotton area in Australia is irrigated, which partly explains why the average cotton yield
is high. However, the Australian cotton yield remains much higher than in other irrigated countries
also. Apart from fertile soil and a favorable climate, the high yields are a result of the national
cotton breeding program and improved farm management practices.
Figure 27: Australian Cotton Yield
Source: National Cotton Council of America
Reasons for high cotton productivity in Australia:
A. Local Advantages: The soil in most cotton areas of Australia is relatively fertile and rarely needs
applications of phosphorus and potassium. Only nitrogen applications are needed. However, the
soil is sodic, and cotton varieties developed in Australia are adapted to sodic soils. Soil in most
cotton areas is heavy clay, which helps to retain water. In addition, Australia benefits from a long
growing season of 180 days, which contributes to increased yields.
B. Cotton breeding program: Cotton Seed Distributors (CSD), an Australian company created in
1962, initially sold Delta Pine varieties that had been developed in the United States. The
Australian cotton breeding program started in 1972 in Narrabri, at the CSIRO Cotton Research
Unit, and it released its first variety in 1984. Since 1995, locally developed varieties have
represented 90% to 95% of cotton area in Australia, and CSD now sells only CSIRO seeds.
Australian cotton breeding is achieved through a partnership between industry and public
research. About 95% of cotton area in Australia is planted to biotech varieties and the remaining
5% is planted to conventional varieties. The strengths of the Australian breeding program
include locally adapted varieties with improved yields, pest and disease resistance, water-use
efficiency and fiber quality.
1,000
1,250
1,500
1,750
2,000
2,250
Values in Kg/Hectare

Page 115 of 154
C. Farm management practices: Optimal uses of farm management practices that are employed in
the rest of the world have enabled Australian farmers to achieve better productivity levels. The
limited number of cotton producers (around 600 in 2009/10) and the concentration of cotton
production in two states (New South Wales and Queensland) makes it relatively easy and fast for
the lessons drawn from cotton research to be communicated and implemented on farms.
Extension services are managed through the Cotton CRC in partnership with state governments.
Extension resources are available online and free of charge. Australian farmers are very well
educated regarding cotton production. The large size of cotton farms (400 hectares on average
but with a large range of 200 to 10,000 hectares) allows for economies of scale. In addition,
cotton producers often help each other. The limited water resources have pushed farmers to
optimize the efficiency of water use on the irrigated farms. The absence of government subsidies
forces farmers to be very rational: they do not grow cotton if it does not make economic sense,
and if they do grow it they are careful about optimizing their yields while minimizing their
production costs. Small cotton farmers usually rent their pickers from large farmers or
independent contractors.
Table 52: Land under Bt Cotton plantation in selected countries (2009)
Several countries have also achieved better
productivities and economies by use of
genetically modified cotton varieties, including
India. Bt-cotton has so far been commercialized
in 9 countries – the USA (first introduced in
1996), Mexico (1996), Australia (1996), China
(1997), Argentina (1998), South Africa (1998),
Colombia (2002), India (2002) and Brazil (2005).
In 2010, Pakistan also planted the Bt cotton for
first time. In 2007, Bt cotton cultivation
occupied globally 15 m ha which comprised
43% of the total cotton area of 35 m ha. Bt
cotton coverage in 2010 increased by 126% to
reach 260,000 hectares (65% adoption) farmed
by 80,000 farmers, compared with 115,000
hectares in 2009.
Source: Q&A on Bt cotton in India, Dr.
Manjunath
Country Bt cotton plantations (2009)
India 8.4 mn. hectare
China 3.7 mn. hectare
USA 2.2 mn. hectare
Argentina 0.25 mn. hectare
Australia 0.19 mn. hectare
Brazil 0.12 mn. hectare
Mexico 0.06 mn. hectare
Colombia 0.03 mn. hectare
South Africa 0.01 mn. hectare
Page 116 of 154
In India, 6.3 million cotton farmers planted 9.4 million hectares of Bt cotton, equivalent to 86% adoption
rate. Today India has the largest land under Bt cotton cultivation. Bt Cotton was approved for plantation
by Indian authorities in 2002. Since then it has gained widespread popularity among farmers.
The Indian cotton yield at present is approximately 468 kg / Ha, which is about 37% lower than the
world average. Main losses in cotton production in India are due to its susceptibility to about 160+
species of insect pests and a number of diseases. Introduction of Bt cotton in India has led to higher
yields (at least 50% of increase is attributed to Bt technology), reduction in use of pesticides and more
employment (because of higher farm production).

Page 117 of 154
Figure 28: Adoption of Bt cotton in India
Source: Q&A on Bt cotton in India, Dr. Manjunath and ISAAA
However, it is important to mention here that though Genetically Modified (GM) crops are expected to
play an important role in improving agricultural production and economic betterment of farmers, it may
entail unintended risks and hazards. Each country needs to adopt a policy of careful assessment of the
associated benefits and risks at various stages of development and field release of Bt cotton to ensure
biosafety. It took almost 7 years of research and trial work in India, before the first Bt cotton got
commercialized.
In India, the rules governing the handling of genetically modified crops and products thereof were
notified in 1989, which are implemented by two nodal agencies – Ministry of Environment and Forests
(MoEF) and Department of Biotechnology (DBT). Further there are 6 bodies entrusted with non-
overlapping roles to handle various related issues, they are:
a. Recombinant DNA Advisory Committee (RDAC)
b. Institutional biosafety Committee (IBSC)
c. Review Committee on Genetic Manipulation (RCGM)
d. Genetic Engineering Approval Committee (GEAC)
e. State Biotechnology Coordination Committee (SBCC)
f. District Level Committee (DLC)
9
8 8
9 9 9 910
11
0.0 0.10.6
1.3
3.8
6.2
7.68.4
9.4
2002 2003 2004 2005 2006 2007 2008 2009 2010
Total area under cotton cultivation Area under Bt cotton cultivation
Values in Mn. hectares

Page 118 of 154
The overall mechanism and functional linkages among various committees and departments concerned
with the approval of GM crops for commercial release are illustrated below:
Source: Govt. of India
Indian
Council of
Agricultura
l Research
Appl ication Investigator
Institutional Biosafety
Committee
Review
Committee
on Generic
Manipulation
Genetic Engineering Approval
Committee
Appl icant Investigator
State Govt’s
permission for sale
Release for open-field/
commercial cultivation
IBSC functions:
To note
To approve category I and II experiments
To recommend and seek approval of RCGM for category III experiments
RCGM functions:
To note To approve category III and field experiments
To recommend generation of appropriate biosafety
and agronomic data
MEC functions:
To vis i t trial sites
To analyse data
To inspect facilities
To recommend safe and agronomically viable transgenics
GEAC functions:
To approve for large-scale use
To approve open release to environment To inform decision to administrative ministry and
applicants investigators to follow PVP, Seeds Act
ICAR functions:
To generate complete agronomic data on transgenics
To recommend suitable transgenics for commercial
release
Monitoring
-cum –
Evaluation
Committee
Figure 29: Approval Mechanism of GM crops in India

Page 119 of 154
In addition to this, for improving the quality of cotton, increase per hectare productivity, increase the
income of cotton growers by reducing the cost of cultivation, to improve the processing facilities etc.,
the Government of India launched Technology Mission on Cotton (TMC) in February 2000. The broad
objectives of the four Mini Missions are as under:
Mini Mission I
With the Indian Council of Agricultural Research (ICAR) as the Nodal Agency, this Mini Mission has the
following objectives:
Development of short duration, high yielding, disease and pest resistant varieties/hybrids with
appropriate fibre parameters to meet the need of the textile industry.
Development of integrated water and nutrient management practices for cotton and cotton
based cropping system.
Development and validation of Integrated Pest Management Technology for different cotton
growing areas of India to improve yield and reduce the cost of cultivation to ensure better net
return to the cotton growers.
Mini Mission I is being implemented under the overall supervision of Secretary, Department of
Agriculture and Director General, ICAR, Ministry of Agriculture, Government of India by The Central
Institute for Cotton Research (CICR), Nagpur, Central Institute for Research on Cotton Technology
(CIRCOT), Mumbai, National Bureau of Soil Survey and Land Use Planning, Nagpur and other ICAR
Research Institutes, as well as research centres of State Agricultural Universities under All India
Coordinated Cotton Improvement Project (AICCIP).
Mini Mission II
With the Ministry of Agriculture and Co-operation as the Nodal Agency, this Mini Mission has the
following objectives:
Technology Transfer through demonstration and training.
Supply of delinted certified seed by setting up of delinting units.
Accelerating Integrated Pest Management activities.
Providing adequate and timely information input to the farmers periodically.
This is being implemented by the Department of Agriculture & Cooperation, Ministry of Agriculture
through State Agriculture Department of cotton growing States in the country under Intensive Cotton
Development Programme (ICDP) under the overall supervision of Secretary, Department of Agriculture
& Cooperation.

Page 120 of 154
Mini Mission III
The Ministry of Textiles is the Nodal Agency for this Mini Mission. It aims at improvement of marketing
infrastructure through setting up new market yards and activation/improvement of existing market
yards.
Mini Mission IV
The Ministry of Textiles is also the Nodal Agency for this Mini Mission. This Mini mission aims for
modernization and technological upgradation of existing ginning and pressing factories so as to improve
the processing of cotton.
Mini Mission III and IV are implemented by the Ministry of Textiles, Government of India through the
Cotton Corporation of India Ltd. and the help of other field agencies shall also be taken whenever
required. The Secretary, Government of India, Ministry of Textiles will be overall incharge of these two
Mini Missions.
Recommendations
In order to improve the cotton productivity in the region, it is recommended that an intervention be
planned for individual countries wherein
a. Farmer training programs on a larger scale may be undertaken under guidance of international
subject matter experts. The aim of such programs will be create awareness among farming
community about international best practices and adopt those methods as per the suitability in the
region.
b. Farmers should be provided with or incentivized to buy productivity improvement machinery and
tools.
c. The area under irrigation should be improved in a phase wise manner, to support cotton production,
and other crops as well.
d. Support should be provided to seed research institutes for developing high yielding varieties, in
liaison with international bodies, if required
e. The Bt cotton trials and approvals should be put on a fast track. The time taken for field trials etc.
cannot and should not be bargained with. However, before the final outcome it is important to have
clear cut guidelines for governing the handling of genetically modified cotton crop. The mechanism
to approve GM varieties need to be in place which means formation of relevant authorities and
delineating their authority in line with the requirements.

Page 121 of 154
The productivity may also improve as an indirect impact of promotion of cotton farming with
international partners. The international partners will bring their own expertise in the field and will train
the cotton growers accordingly. Assurance of market will also prompt farmers to put more focus
towards the cotton crop, ultimately improving the productivity as well as the quality.

Page 122 of 154
5.2. Fiber Contamination
ITMF’s cotton contamination survey 2009 shows that among the target countries, contamination is a
major issue with Sudanese cotton whereas Ugandan cotton is the better one.
Figure 30: Degree of Cotton Contamination in Target Countries, 2009
Source: Cotton Contamination Surveys, ITMF
Note: Kenya is not covered in the survey, being a minor producing nation
The above chart indicates that globally 72% of the respondents found non-existent / insignificant
contamination; whereas 92% of the respondent users of Ugandan cotton found it to be free of
contamination. The cotton from other two countries is found to have more contamination than the
world average. 16% of the all respondents found that the cotton used by them had moderate
contamination, whereas 38% and 22% users of Tanzanian and Sudanese cotton respectively found it to
have moderate contamination. 11% of the users of Sudanese cotton found it to be seriously
contaminated, whereas the world level is 6%.
However, it is also important to note that the biannual surveys have reported a wide variation in the
contamination levels, as depicted in charts below. Tanzanian and Ugandan cotton were continuously
reported to have serious contamination in surveys from 2001 to 2007; only in 1999 and 2009, were they
reported better than world average. Sudanese cotton on the other hand is reported to be moderately
contaminated by maximum respondents in all the surveys.
78
16
6
67
22
11
62
38
0
92
8
0
Non existent / Insignificant Moderate Serious
World Sudan: Barakat Tanzania: Coastal Uganda

Page 123 of 154
Source: Cotton Contamination Surveys, ITMF
Note: Kenya is not covered in the survey, being a minor producing nation
Degree of Contamination varies a lot with growing area and farm practices. In general, cotton from
India, Pakistan, Syria and some African countries are known to have higher contamination level than the
world average, whereas cotton varieties of Australia, Brazil, China, Mexico and USA possess minimum
contamination.
Contamination of cotton can take place at every step i.e. from the farm-picking to the ginning stage.
Manual picking of cotton is one of the biggest causes of cotton contamination. In addition
polypropylene bags used by pickers, brackish and decayed seed cotton, leaves, flowers, sticks and
weeds, immature balls, trash and dust, plastic bags are the other sources of contamination. Similarly,
cotton packaging in the jute or propylene bags sewed with jute twine and mixing of two varieties or two
grades of the same variety to get economy of transportation can cause contamination.
The major reasons for contamination are:
Lack of awareness of the importance of reducing contamination
Absence of QC procedures
Manual picking
Dirty storage environment
Use of PP and jute bags or wrappings
Poor supervision
Improper ginning process
Contamination in raw cotton causes down-time in processing, wastage of dye stuff, extra manpower
requirement for cleaning inflating the cost, customer rejection of the raw or finished product, costly
claims and penalties, lower prices and, inevitably, the loss of customers or end-market buyers.
Shaded area - World average Solid line - Sudan Dotted line - Tanzania Dashed line - Uganda
Figure 31: Historical changes in Degree of Cotton Contamination in Target Countries

Page 124 of 154
Recommendations
In order to reduce the cotton contamination and supply a consistent quality, it is recommended that:
a. A large scale extension program may be planned making farmers aware about:
losses because of cotton contamination
major reasons of cotton contamination
methods / practices to prevent cotton contamination
b. The QC must be ensured at the ginning level also, if required by engaging inspectors from cotton
development authorities. The authorities may provide their own certification to ginneries on
basis of their inspection, which can be used by the ginners as a marketing tool for cotton
exports.
The contamination may also be reduced as an indirect impact of promotion of cotton farming with
international partners. The international partners will bring their own expertise in the field and will train
the cotton growers accordingly. Assurance of market will also prompt farmers to put more focus
towards the cotton crop, ultimately improving the productivity as well as the quality.

Page 125 of 154
5.3. Value Addition
Table 53: Level of Cotton Exports in the Target Countries
Most of the cotton produced in the Tanzania,
Sudan and Uganda is exported out of the
country in raw form. A major reason behind this
is the absence of sufficient manufacturing
capacities in the countries to consume cotton. In
Kenya, the exports are nil, but the cotton
production volume there is also low.
Most of the large cotton producing countries
have established capacities to consume
maximum cotton within their own countries.
Exceptions to this are US and Australia where
the textile manufacturing is not viable because
of high manpower costs and they have as a
policy deiced to export the cotton produced. Source: Primary Research findings
If we analyze the cotton demand-supply scenario of China for last 20 years, we can see how the cotton
consumption within the country has grown with increasing production & imports and reducing exports.
Since the turn of last decade, China’s exports have been miniscule whereas it became the largest
importer of cotton in the world.
Figure 32: China's Cotton Scenario
Source: National Cotton Council of America
Another large producer of cotton, India also consumes most of the cotton produced in the country. In
recent years, the cotton exports have increased but that is supported by an equivalent increase in
production volume.
Country Level of cotton exports
Kenya Negligible
Sudan Most of the production is exported
Tanzania Apart from own consumption of 150,000 bales / annum; rest crop is exported. In 2010, exports was 225,000 bales which has remained at this level for last few years
Uganda Most of the production is exported
0
1,250
2,500
3,750
5,000
0
10,000
20,000
30,000
40,000
Production (LHS) Imports (LHS) Exports (RHS)
Values in '000 bales of 480 lbs each

Page 126 of 154
Figure 33: India’s Cotton Scenario
Source: National Cotton Council of America
Increase in cotton consumption within the country will serve two purposes: first is creation of extra jobs
across the value chain – spinning, weaving or knitting, dyeing & processing and garmenting. Secondly it
also enables the country to move up the value chain. Value addition opportunity is lost by exports of
raw cotton. Companies looking to sustain in long run need to integrate their operations by moving up
the value chain.
Figure 34: Value Addition across the Value Chain
0.5 / kg 0.75 / kg 1.5 /sq. m. 2.5 / machine
Employment level
0
10,000
20,000
30,000Production Imports Exports
Values in '000 bales of 480 lbs each

Page 127 of 154
Source: Wazir Analysis
As a next step, within the finished goods also, it is important to spot the value added products.
Countries like Germany, Italy, USA, Japan, etc. where the cost of manufacturing is high and most of the
textile and apparel manufacturing industry has shifted elsewhere, still feature among the largest
exporters of textile and apparel, because of their focus on value added items like: lingerie, suits,
sportswear, specialty fibers, technical textiles, etc. These countries have carved a niche for themselves
in the market by focusing on these products which have a high value realization. The manufacturing and
marketing of value added products provides better margins and being a niche category is quite resistant
to downward changes in demand and price.
Table 54: Global Trade of Few Value Added Textile & Apparel Products
Commodity Global trade value (2009, in US$ Mn.)
Leading supplier (share in global trade)
Woven fabric of combed wool or fine animal hair 2,352 Italy (35%)
Artificial filament tow 2,232 USA (40%)
Synthetic staple fiber 4,344 S. Korea (17%)
Nonwovens textiles except felt 9,602 Germany (17%)
Fabric impregnated, coated or covered with plastic 8,720 China (32%)
Special textile products for technical purposes 3,687 Germany (17%)
Knitted Panty hose, tights, hosiery, etc. 10,278 China (37%)
Track suits, ski suits and swimwear 7,870 China (34%)
Men's suits, woolen 2,375 China (26%)
Source: Wazir Analysis, UN comtrade
Recommendations
To encourage manufacturers to opt for value addition, they need to be encouraged by the authorities
by:
Providing subsidies to purchase plant and machinery for manufacturing such products
Providing credit support in form of guarantees or subsidized rate of interests
Providing drawback on exports of such products
Other fiscal incentives like allowance of higher machinery depreciation, duty exemptions, etc. may
also be considered
The authorities may also think of adopting a cluster based approach for promotion of value addition in
the country. Appropriate locations within the country may be adopted for establishing the complete
value chain infrastructure for such products: ginning, spinning, weaving, knitting, processing,
garmenting, trade center, design center, testing labs, training center, warehouses, customs offices, etc.

Page 128 of 154
The government can create the infrastructure at such places in partnership with private operators which
will include: power stations, water reservoirs, roads, ETP, etc. and then invite investments by the private
players in the zone. Special incentives may also be thought of for the businesses operating in the zone to
attract large scale investment.
Within the zone, government may also form an own JV company with some international partner, in
order to establish either a model unit and /or major capacity to cater to or buy from other businesses.

Page 129 of 154
5.4. Technology Level
The primary survey conducted for this assignment in all the four countries revealed a general lack of
state-of-the-art machinery for textile manufacturing. Most of the ginning units in all the countries had
quite old machinery, which has been reconditioned to keep functioning. Similarly at textile level (yarn,
fabrics and processing) very few units existed with new technology machines. In apparel, however, the
technology employed by most of the units can be classified as latest. The reason behind non-
upgradation of machines is lack of major new investment in the sector. Whatever new expansions or
green-field units being planned by the organized sector now are being conceived with the new
technology like, high capacity rotor knife roller ginning machines and shuttleless looms from Turkey and
Europe being sourced by Sudanese authorities for textile mill revival plans; expansion of a couple of
spinners in Kenya and Uganda with technology from Switzerland and Germany; and forward integration
plans of a Tanzanian composite textile mill in to garment manufacturing. However, some plans are on
drawing boards at the moment and even collectively not enough to upgrade the technology level of
entire region.
There are a number of technological developments that have happened across the textile
manufacturing value chain, which have caught the attention of manufacturers across the globe like: high
capacity ginning machines, extensive use of electronics for automation, quality control and better
precision at yarn preparatory stage, compact spinning, electronic control and yarn clearers at winding
stage, higher speed and more precise fabric preparatory machines, electronic data monitoring & control,
higher speeds and automation at weaving stage with shuttleless looms, machines and processes for
application of specialized finishes and washes, automation at garment manufacturing stage etc.
Two factors which leads to deployment of improved technology machines by businesses are: capacity to
pay for that (which unfortunately is a major issue in all of the target countries) and secondly the techno-
commercial suitability of technology for the target products.
In many of the countries, the first factor is addressed to by reducing the effective cost of investment
thus encouraging the entrepreneurs to invest in the sector. For example in India, the flagship scheme of
Ministry of Textiles, known as Technological Upgradation Fund Scheme (TUFS) provide an interest
subsidy of 5 percentage points on the bank credit for modernization of ginning, textile and apparel
companies. It also provides a capital subsidy of 10% or 25% on selected machinery for processing and
technical textiles. The scheme clearly identifies the machinery on which the benefits will be available; so
as to ensure that only modern machinery with improved technology is promoted

Page 130 of 154
Figure 35: Progress made under Technology Up gradation Fund Scheme (TUFS), India
Source: Ministry of Textiles, Government of India
Similarly, in April 2009, State Council of China announced a 3 year plan (2009-2011) to upgrade the
textile and apparel industries. The main feature was to improve the R&D for development of new fibers
and applications, increase automation, reduce energy and water use, development of domestic market
and lower dependence on textile machinery imports. Vat application has been reformed from
production to consumption based to encourage companies to improve their technology.
Recommendations
In order to promote the modernization, authorities need to incentivize businesses, fiscally or otherwise,
to do so. There could be various ways to do so like:
Providing capital and /or interest subsidies for adoption of such technology
Facilitating credit flow to purchase such technology
Encouraging businesses to participate in international machinery exhibition like ITME, by taking an
industry delegation there
Liaison with machinery suppliers and technical consultants to prepare country specific and product
specific project reports, encompassing the latest, suitable technology which can be adopted by the
industry. The products may be identified in line with government’s aim to promote value addition
also. Such projects can then be presented to investors- domestic as well as international.
Here also, a cluster based approach, as described in previous section, can be dovetailed.
Government can also establish a JV unit with an international partner, with the state-of-the-art
technology. Successful functioning of such unit will prove the techno-commercial viability of technology,
thus working as a model unit which others can follow. The unit will be more beneficial to the industry if
it is modeled as a common facility center for the use of industry stakeholders e.g. a processing house
where a weaving house or a garment unit can get its fabric processed on job work basis.
$1,128 $973$293 $320 $731
$1,633 $3,340
$14,718
$4,426
$12,379
$6,136
-
4,000
8,000
12,000
16,000
1999-00 2000-01 2001-02 2002-03 2003-04 2004-05 2005-06 2006-07 2007-08 2008-09 2009-10
No. of projects sanctioned
Total project cost (US$ million)

Page 131 of 154
5.5. Logistics
In today’s price and time sensitive markets, logistics holds the key to make or break an exporter’s
position in its target market. Lack of logistical infrastructure can make economies unable to take
advantage of resources with which they have been endowed.
Out of the target countries, Uganda is a land locked country and utilizes Kenyan port of Mombasa for
exports. The intercity connectivity from port to manufacturing locations is satisfactory with lot of
highway development happening all across. The issue sometimes is of paperwork and hassles at border
post (from Uganda to Kenya) and delays for clearances at the port itself. However, from the feedback
received during primary research, it came out that there are very few such instances at Port Sudan,
Sudan and Dar-es-Salaam, Tanzania; whereas in Mombasa port, which handles much larger volumes
than the other two, a lot remains desirable in terms of efficiency. In all the ports, because of smaller
size, berth availability and vessel schedules are sometimes a deterrent to timely deliveries.
Table 55: Transit Time for Imports and Exports by Target Countries Values In days
INBOUND
To From
Mombasa, Kenya Port Sudan, Sudan Dar es Salaam, Tanzania
Shenzhen, China 17 20 18
Mumbai, India 08 10 08
OUTBOUND
To From
New York, USA Los Angeles, USA London, UK
Mombasa, Kenya 25 36 19
Port Sudan, Sudan 18 30 19
Dar es Salaam, Tanzania 25 36 20
Mumbai, India 25 31 19
Shenzhen, China 34 20 30
Source: Sea rates
Improvement in logistics is a broader issue that affects the country beyond the CTA sector.
Improvement in infrastructure for logistics is a key area of focus for all the countries around the world.
The availability of international funding to do this may also be explored by governments of individual
countries in view of their policy and larger vision for the nation’s development. The cluster based
approach, as mentioned above, can also address this issue albeit in a limited manner, being constrained
to the zone’s physical expanse.

Page 132 of 154
5.6. Power Scenario
There are two aspects related to power scenario of a country – cost of power and quality of power. In
terms of cost of power, a comparative analysis of target countries with some of the large textile and
apparel producing nations show that the power cost in Tanzania is quite competitive whereas that in
Kenya is highest
Figure 36: Power Costs in Selected Countries
Source: Primary Research and Industry Reports
Among the four country analyzed, the quality of power was reported satisfactory only in Kenya; whereas
in other countries the availability was erratic and fluctuation was common.
The model followed by some of the countries to promote captive power generation to improve the
power scenario is allowing manufacturers to produce, say hydro-based, power at one place in the
country, sell it to the main grid and purchase at its manufacturing location at same cost. Similarly some
countries promote alternative power sources like windmills by providing appropriate incentives e.g.
subsidies, accelerated depreciation, tax exemption, etc.
Recommendations
In order to improve the power scenario, first thing a government can do is to invest in large power
projects, either alone or in partnership with an investor. Another way to address this issue is to
encourage businesses to set-up their own power generation stations by providing fiscal and non-fiscal
incentives like:
Capital and interest subsidy for procurement of equipment
0.06 0.060.08
0.10.12 0.12
0.2
Bangladesh(Taka 4.11/unit)
Tanzania(TSH 85/unit)
Sri Lanka(Rs. 9.10/unit)
India (Rs. 4.50/unit)
Sudan(SDG 0.32/unit)
Uganda(UGX 287/unit)
Kenya(KES 16/unit)
Values in US$cents/Unit

Page 133 of 154
Facilitate partnership process with any international player
Policies supporting generation and consumption at different places
In addition, policy to establish CTA clusters can take into account the power requirement for the
proposed cluster and establish a power station exclusive for the cluster

Page 134 of 154
5.7. Business Financing
High cost coupled with low availability of business financing is one of the major issues in the region that
has resulted in low investment in CTA sector.
Table 56: Business Financing Status in Target Countries
Country Status
Kenya Bank lending rate is in range of 16 to 18%, plus other charges to an extent of 5% (bank charges, negotiation charges, commitment fee, ledger fee, a/c maintenance fee, etc. Credit availability, specifically to textile businesses, is low.
Sudan Long term loans are not made available by banks. Certain donor loans from Arab countries are available, which are very few. Loans are available only for working capital for up to 3 months at an interest rate of 9 to 12% p.a.
Tanzania Bank interest rates are in range of 14 to 16%. Ginners have a comparative easier access to credit lines, whereas the textile businesses face issues in the same.
Uganda Credit availability is very less. Long term loans are available at an interest rate of 18 to 20% with a repayment period of 3 years. Foreign currency loans may be available to businesses with at least 20% of earnings in foreign currency, at an interest rate of 7 to 12%. However, the availability is very less.
Source: Primary Research findings
Figure 37: Comparison of PLR of Selected Countries
The lending rates in countries are quite high in
comparison to other nations which have got
significant investments in the CTA sector, as shown in
adjoining figures comparing PLR (Prime Lending rate)
of target countries with some of the bigger textile
and apparel producing nations and a neighboring
country, Ethiopia which is making significant inroads
to attract investment in different segments in the
country. PLR is the annual interest rate that
commercial banks charge on new loans,
denominated in the national currency, to their most
credit-worthy customers. Without reduction in
lending rates and improvement of credit flow, large
scale investments are bound not to happen. Source: CIA world fact book
The rate of interest charged by banks is more related to the macroeconomic environment of the country
and policies. The effective rates to any sector may however be reduced by the Government by
identifying it as a priority segment and providing interest subsidies on loans offered by banks to
2.6%
5.3%
6.0%
7.0%
11.2%
12.3%
13.3%
14.0%
15.0%
20.5%
Taiwan
China
Thailand
Ethiopia
Vietnam
Egypt
India
Kenya
Tanzania
Uganda

Page 135 of 154
businesses in that sector. On one hand where investors will have a reduction in their interest burden,
lenders will be more comfortable with government backing to the loan. This will also improve the credit
availability. However, a proper policy with strict guidelines regarding the nature of business to be
financed needs to be formulated beforehand.
In India, for example, the scheme of Technological Upgradation Fund Scheme (TUFS), as mentioned in
previous section on Technology Level, provides interest reimbursement of 5 percentage points to
eligible projects on selected plant and machinery. Before a commitment of support by the government,
a complete due diligence of the project is done either by the financial institute or a third party
empanelled consultant in order to ensure the project viability.
Recommendations
The CTA business financing scenario can improve in a country in two ways. First is on automatic mode,
when the businesses start performing consistently and cater their financial commitments on time. The
second is when the sector itself is recognized as priority sector by government and financial institutes
get some commitment by government on behalf of borrowers as well. Hence, an intervention to
improve the credit flow should start with government backing up CTA sector business and instructing
financial institutes to operate special schemes for it. These schemes may be phased out in due course of
time, when the businesses start performing above a certain financial benchmark level.

Page 136 of 154
5.8. Supply Chain Linkages
An analysis of operational capacities in each of the target country reveals an unbalanced supply chain:
Table 57: Operational CTA Capacities of the Target Countries
Kenya Sudan Tanzania Uganda
Cotton 2010 Production: 49,000 bales Smallest producer among four; possibility of improvement in area under cotton cultivation and productivity exists
2010 Production: 100,000 bales Large scope of increase; current production is 80% lower than peak production level of 525,000 bales (2004)
2010 production: 275,000 bales Largest production among four; still half of the peak production level of 575,000 bales (2005)
2010 Production: 125,000 bales 38% below the peak production level of 200,000 bales (2004)
Ginning Largely underutilized
Largely underutilized
Largely underutilized
Largely underutilized
Yarn manufacturing
2010 Mill use of cotton: 50,000 bales Capacity is more than of cotton production, some imports are also there. But yarn production is insufficient to cater to fabric producers.
2010 Mill use of cotton: 8,000 bales Negligible capacity
2010 Mill use of cotton: 150,000 bales Mill use has improved in last few years, but still is way below the own cotton production capacity
2010 Mill use of cotton: 20,000 bales Very less capacity
Fabric manufacturing and processing
Very less capacity. Most of the fabrics used by apparel manufacturers are imported.
Negligible capacity Limited capacities, major focus is on traditional fabrics like kitenge and kanga
Very less capacity. Only two manufacturing units exist
Garmenting Largest capacity in the region
Negligible capacity Negligible capacity Very less capacity. Only two manufacturing units exist
Source: Primary Research Findings
Kenya has a strong garment manufacturing capacity but no backward linkages within the country to
support it. Uganda and Sudan produces cotton, but lacks further downstream processes. Tanzania has

Page 137 of 154
some capacities from cotton to fabrics, but lacks value addition in terms of fabric type as well as
garment conversion.
For countries where substantial benefits for exports are available, it becomes important to have a
complete supply chain as buyers prefer integrated supply bases. Importing yarn or fabric leads to higher
costs, higher lead time and loss of employment opportunity.
Figure 38: Textile and Apparel Supply Chain
The countries which have emerged as the leading manufacturer – exporter of textile and apparel
products like China and India, feature a complete supply chain, from fiber to finished goods.
Table 58: Supply Chain Analysis of China and India
China India
Fiber Largest producer of Cotton 2nd largest producer of wool Largest producer of polyester filament yarn and staple fiber 3rd largest producer of polypropylene Largest producer of acrylic Largest producer of nylon
2nd largest producer of Cotton 2nd largest producer of Silk 3rd largest producer of Cellulosic fibre/yarn 5th largest producer of Synthetic fibers/yarn Home to Largest Producer of Polyester Largest producer of Jute

Page 138 of 154
Yarn 110 million ring spindles 2.2 million rotors Fiber consumption: 38 Mn. MT
42 million short staple spindles 0.7 million rotors Fiber consumption: 7 Mn. MT
Weaving 522,000 shuttle less looms 690,700 shuttle looms
18,000 shuttle less looms 53,000 shuttle looms
Garments Largest manufacturers and exporter in the world. Apparel exports: US$ 120 Bn.
Apparel Exports: US$ 10 Bn
Source: ITMF, UN Comtrade, Oerlikon Fiber Year Report 2009 and various country reports
Recommendations
Improvement in supply chain linkages is a broader concept which will encompass a lot of other
interventions like identifying key value chain bottlenecks and encouraging investments in it; promote
capacity expansion and technology upgradation, improving HR skills for the sector, improving the overall
infrastructure level in the country, attracting Foreign Direct Investments, etc. Here also, a cluster based
development approach can prove useful. The main idea should be recognizing CTA sector as a priority
segment and taking various steps to ensure that existing businesses are profitable and they re-invest in
businesses, in addition new investments also happen from domestic as well as international investors.

Page 139 of 154
5.9. Training and Education
Cotton, Textile and Apparel sector is one largest employment providers in developing nations. The
sector has potential to employ manpower in significant quantum specifically at the start of value
chain (farming and ginning) and towards the end (apparel manufacturing).
In order to support the increase in production base of the sector, it essential to focus on training and
educating the human resources so that they may take up positions at different levels of machine
operators, supervisors, technical staff, managerial staff, designers, etc.
Countries like India have paid special attention to this aspect and have built up a strong education
infrastructure, and also have launched several capacity building programs. The educational
institutes in India provide 3 year diploma, 4 year degrees (B. Tech or B.E.), 2 year post graduate
degrees (M.Tech.) and doctorate (Ph. D.) level programs. There are about 20 major textile
engineering colleges by government with a capacity of providing 1500+ graduate and post graduate
engineers to the industry every year. Some of the better known colleges include Technological
Institute of Textile and Sciences, New Delhi branch of Indian Institute of Technology, DKTE Society’s
Textile & Engineering Institute, etc. In addition there are several other institutes for other programs.
For education in fashion designing, Ministry of Textiles in India has established National Institute of
Fashion Technology, which has completed 25 years this year with 15 institutes across India. Every
year over 1500 graduates and some 500 post graduates pass from college and join the industry. NIFT
has set academic standards and excellence in thought leadership by providing a pool of creative
genius designers who have achieved global success like Ritu Beri, Rohit Bal, Manish Arora, Ritu
Kumar, etc. Apart from NIFT there are other well-known institutes like National Institute of Design,
Pearl Academy of Fashion, Lady Irwin College, etc.
To promote vocational training in the sector, Apparel Export Promotion Council (AEPC)
conceptualized the Apparel Training & Design centers (ATDC) to meet the industry’s growing
requirement for a steady supply to trained workforce and professionals with domain expertise
especially in apparel manufacturing technology. From an initial strength of a mere 195 student
trained in 1996, number of students passing out every year has risen to over 5000. Overall more
than 50,000 students have been trained in different centres of the ATDC since its inception. The
students trained at various centres of ATDCs are suitably employed in the garment industry units
and clusters.
There are a host of schemes launched by various Government arms for development of skills
required in the textile sector, like:
Ministry of Textile’s Integrated Skill Development Program, which aims to train and employ
additional 12 million people in textile sector. This will be done in partnership with private
firms, consulting agencies and social workers.

Page 140 of 154
Ministry of Textile’s Mega Cluster Scheme for Powerloom, Handlooms and Handicrafts,
wherein government supports establishment of world-class infrastructure for various
manufacturing and support activities, including training.
Ministry of Labour & employment’s dress making and fashion technology scheme which is
specifically run for female workforce and managed by Women training Directorate
Ministry of Rural Development’s
Ministry of Agriculture’s extension program to support cotton production in India by
“Promotion and Strengthening of Agricultural Mechanization through Training, Testing &
Demonstration” that basically covers:
o Need based skill oriented training in agricultural machinery and farm mechanization
to farmers, trainers, rural youth, technicians, etc.
o Testing of machines with a view to ascertaining their performance characteristics
and suggesting improvement thereon for their quality upgradation.
o Demonstration of equipment with a view to increase productivity, production and
profitability of farmers by the way of induction of new technology in the agricultural
production system.
In addition to this, industry has also been supportive to the various colleges and institutes and support
government programs in different ways like accepting trainees for a short span of time, providing
infrastructure to conduct training programs, etc.
In each of the target countries there exist educational institutes but the focus on training is largely
missing. Considering the need of productivity improvement and providing employment, importance of
having a structured training program cannot be over emphasized. The education infrastructure also
needs up gradation in terms of syllabus, equipment’s, labs, industry collaboration, etc.
Recommendations
For improvement of education institutes, it is recommended that they tie up with three types of
stakeholders:
Industry – for getting students trained at the factories while they are studying and getting them
placed when their courses are complete.
Technology suppliers – for getting sponsorships, maybe in form of factory equipment like
carding machine, air-jet weaving technology, etc. on which students can be trained so that they
are readily absorbed by companies on completion of courses
International institutes – for knowledge exchange as well as student exchange program. The
former will help institutes to improve their course curriculums and own body of knowledge,
whereas the latter will provide international exposure to the students.
Page 141 of 154
The existing institutes may not be able to do the above activities on their own, government department
or an international development body may empanel a consultant for these activities on a deliverable
basis. Government should also think of financially supporting the textile and design institutes on a per
student basis, which will effectively be sponsoring students to take up courses in such institutes.
On the training issue, the implementing agency (government or international development agency)
need to establish an umbrella scheme for training manpower at various levels - operators, supervisors
and middle level. To impart the training, national and international consultants should be empanelled
and should be engaged on a per trainee basis. In line with the requirements, establishment of training
institutes may also be required. The industry also needs to support training programs by providing their
infrastructure for the same.
Organizing an annual design competition for students in the region will help improve the sector’s
visibility and encourage students to take up a career in this segment.

Page 142 of 154
5.10. Market Development
The domestic markets of all the target nations are dominated by imports of yarn, fabrics, finished goods
and second hand clothing (except in Sudan). An analysis of imports of individual country is given earlier
in this report in the foreign trade overview section of each country. The data basically indicates heavy
dependence on imports at all levels. An analysis of imports of second hand clothes is given ahead.
Figure 39: Imports of Second Hand Clothing in Target Countries
Source: UN Comtrade
Among the four nations, Kenya imports most of the second hand clothing, to the tune of 65 million kg. It
is also important to note that the unit price is US$ 1 / kg, which implies that for US$ 1 one can import a
pair of trousers and a shirt. Such low cost imports may benefit those who are unable to afford new
clothing; but the actual situation in all countries is that many other consumers also buy second hand
clothes because of various reasons, including their better design and styles. As a result there is a
perpetual downfall in region’s apparel manufacturing segment. Banning imports of these clothes (or any
other commodity) is neither advisable nor feasible on account of various factors; the answer lies in
developing own competencies to substitute / phase out imports progressively.
For development of exports market, it is important to showcase the product range, manufacturing
capacities, etc. to buyers who have not yet made inroads in the region. Such buyer-seller meets /
programs are run all over the world by trade and government bodies. For example, in India there are 10
export promotion councils in CTA sector, entrusted with export market development of specific
products:
Apparel Export Promotion Council
Carpet Export Promotion Council
Cotton Textile Export Promotion Council
57
66 65
1 3 0
1118
10
48 5144
2008 2009 2010
Kenya Sudan
Uganda Tanzania
Values in Mn. kg.
1.3
2.1
1.4
1.1
1.21.1
1.21.1
1.2
1.8
1.4
1.1
Kenya Sudan Uganda Tanzania
2008 2009 2010
Values in $ / kg.

Page 143 of 154
Export Promotion Council For Handicrafts
Powerloom Development and Export Promotion Council
Handloom Export Promotion Council
The Indian Silk Export Promotion Council
Wool Industry Export Promotion Council
Synthetic & Rayon Textile Export Promotion Council
Wool & Woolens Export Promotion Council
They carry out a number of functions like:
Arranging visit of foreign delegation in the country
Arranging Buyer-Seller Meets in India and abroad
Maintaining close liaison with relevant international bodies
Arranging trade fairs and exhibitions in order to project the quality and variety of Indian
products
Research foreign markets and arranging delegation/study tour abroad
Advocacy related to improve the production base of the Industry
Maintain and sharing supplier databases with overseas buyers and vice a versa.
Resolving shipping & transport problems
Publicity in India &abroad
Recommendations
A detailed study is required to assess the impact of second hand clothing on the consumers, economy,
trade and local manufacturing industry. Such a study should be aimed to bring out the mechanism to
control second hand clothing (if at all) so that the local industry’s growth is not hampered.
For development of export markets, a separate export promotion council can be formed to carry out
activities in line with those mentioned above.
One of the most important steps that can be taken for market development is organizing an annual
mega trade show / buyer seller in the region inviting all the prospective regional and international
buyers.

Page 144 of 154
5.11. Investment Promotion
In each of the target countries special cells exists for investment promotion, albeit not exclusively for
CTA sectors:
Kenya: Kenya Investment Authority
Sudan: Ministry of Investment
Tanzania: Tanzania Investment center
Uganda: Uganda Investment Authority
The key benefits provided by each country for investment is as below:
Kenya
Investment Protection Guarantee -The constitution of Kenya guarantees protection of life and
private property. The Foreign Investment Protection Act guarantees against expropriation of private
property by government.
Expropriation- Kenyan law provides protection against the expropriation of private property except where due process is followed and adequate and prompt compensation is provided.
Further protection is also guaranteed by the various bilateral agreements with other countries. Regional or zonal restrictions do not exist. Investors are free to invest in any part of the country
subject to the observation of environmental laws The key policy initiatives include:
o Liberalizing the exchange controls o Removing price controls o Freeing the shilling exchange rate to be market driven o Abolishing import licensing except for cases that impact directly on national security,
health, and environment. o Opening up of the capital markets to foreign participation o Generous Investment and capital allowance o Remission of duty and Value Added Tax (VAT) o Manufacture under Bond status o Export processing zones status. o Double taxation agreements o Signatory of a range of tax treaties , Investment Protection Agreements and bilateral
investment treaties
Sudan
The Ministry of Investment provides services to investors among which the following are the most
important:
Complete exemption from customs fees for capital projects
Freedom of capital transfer

Page 145 of 154
Simplify procedures through a single outlet “One Stop Shop”
Grant exemptions from profit taxes of 5 to 10 years for investment projects
Grant customs exemptions for strategic projects and non-strategic capital goods
Strategic projects are given the necessary land free-of-charge
Non-strategic projects are given land at an encouragement price
The investor has the right to operate without a Sudanese partner
The investment law has provided the following fundamental guarantees:
No confiscation of property will occur except through the legal system and after payment of a
reasonable compensation
the investor has the right to re-transfer the capital in case the project isn’t executed or is liquidated
Transfer of profits and costs of finance will be executed in the currency of import and on the date
due (after payment of the legal duties)
The project is automatically included in the registry of importers and exporters.
Tanzania
Investments in Tanzania are guaranteed against nationalization and expropriation.
Tanzania is a signatory of several multilateral and bilateral agreements on protection and promotion
of foreign investment.
Tanzania is a member of Multilateral Investment Guarantee Agency (MIGA) and International Centre
for Settlement of Investment Disputes (ICSID).
Fiscal incentives:
o Import duty and VAT exemption on project/capital goods.
o Import Duty Draw Back Scheme
o Refund of duty charged on imported inputs used for producing goods for export and
goods sold to foreign institutions like UN and its agencies operating in Tanzania.
Non-fiscal incentives
o Immigration quota of up to 5 people
o Guaranteed transfer of:-
Net profits or dividends of the investment
Payment in respect of foreign loans
Remittance of proceeds net of all taxes and other obligations
Royalties fees and other charges
Payment of emolument and other benefits to foreign personnel
Strategic Investor Status: For a big project of over US$ 20 million offering specific/great impact to
the society or economy, Investors can request for special incentives from the Government.
Import Duty Draw Back Scheme: Refund of duty charged on imported inputs used for producing
goods for export and goods sold to foreign institutions like UN and its agencies operating in
Tanzania.

Page 146 of 154
Export Processing Zone Act, 2002: Under this act, all inputs like raw materials and machinery which
are imported and used to process or manufacture goods in the designated areas as EPZ are
exempted from import duty and other taxes.
Special Economic Zone(SEZ) Act, 2005: Economic activities under SEZ are not subjected to customs
duty; value added tax and any other tax payable in respect of goods purchased for use as raw
materials, equipment, machinery including all goods and services used in undertaking the licensed
businesses.
Uganda
Investment Capital Allowances
Initial capital allowance on plant and machinery 50-75%
Start-up cost spread over 4 years 25% p.a.
Scientific research expenditure 100%
Training expenditure 100%
Mineral exploration expenditure 100%
Initial Allowance on hotel, hospitals and Industrial buildings 20%
Deductible annual Allowances (depreciable assets)Depreciation rates of assets range
20-40%
Depreciation rate for Hotels, Industrial Buildings and Hospitals
5%
Investors who register as investment traders are entitled to VAT refund on building materials for
industrial/commercial buildings.
Duty and Tax free import of Plant & Machinery.
First Arrival Privileges in the form of duty exemptions for personal effects and motor vehicle
(previously owned for at least 12 months) to all investors and expatriates coming to Uganda.
Export Promotion Incentives and Facilities
o Manufacturing Under Bond.
o Duty exemption on plant and machinery and other inputs
o Stamp duty exemption
o Duty draw back – a refund of all or part of any duty paid on materials, inputs imported
to produce for export
o Withholding tax exemptions on plant & machinery, scholastic materials, human &
animal drugs and raw materials.
o Ten year tax holiday
o Duty remission scheme for exporters involved in value addition.

Page 147 of 154
Recommendations
The incentives provided by large textile and apparel manufacturing nations of China, India, Bangladesh
and Turkey are mentioned in the annexure to this report. In line with learning from these nations, a
larger intervention to attract FDI in CTA sector which can cover:
Organize annual investor summit showcasing business opportunity in the country
Leading trade and industry delegation to key countries from where investment can happen
Creating awareness about the country’s CTA sector, the advantages it offers and existing
opportunities through international media and forums.

Page 148 of 154
5.12. Government Support
Growth of any sector, anywhere in the world may be catalyzed by Governments through a range of fiscal
and non-fiscal promotion policies. Governments may act as facilitator to promote sectors, which will
eventually bring significant returns to the nation in terms of increased employment, foreign exchange
earnings, growth of allied sectors, less dependence on imports, increased tax collection, etc. Across the
globe, different states have focused on different sectors and formulated policies to aid the sector
growth, like Singapore-Financial sector, Middle East nations-Oil, China-manufacturing, India-Services,
Malaysia- Tourism, etc.
Many times, it has happened that the well-defined policy initiatives were drafted for upliftment of the
sector but were left mid-way in absence of any implementing cum monitoring agency. Likewise, there
are certain initiatives which needs to be undertaken on regular basis like maintaining supplier database,
export performance statistics, etc.
Any of the initiatives described in previous sections, would first of all require an institution for its
implementation and for monitoring the ongoing performance and measure the deviations of the results
achieved versus the planned outputs. In absence of a strong institute, none of the interventions can
bring results.
In an ideal scenario, following should be the institutional framework for implementing various
initiatives:
In cotton, textile and apparel sector an entire gamut of sector promotion methods are employed by
different countries like:
Figure 40: Institutional framework for CTA Sector Development

Page 149 of 154
1. Providing suitable infrastructure for doing businesses e.g. connectivity to ports, good quality
power at subsidized rates
2. Incentives for investments like land availability at subsidized cost, capital subsidy, interest
subsidy, tax free period, etc.
3. Making the entire investment process – faster, easier and better by establishing single window
clearance authorities, easier land acquisition, supporting credit flow to industry, etc.
4. Incentives for exports like duty free imports of inputs, fiscal benefits related to foreign exchange
earned, etc.
5. Promoting Public Private Partnership (PPP) model to encourage large scale investments
6. Special support to handhold the business for few initial years
7. Virtual integration of supply chain by adopting a cluster based approach e.g. textile parks
8. Trade agreements with major suppliers and markets
9. Marketing support by establishment of Trade promotion bodies, arranging buyer seller meets,
supporting industries to showcase their products overseas, branding a countries products, etc.
10. Supporting research and product development activities by establishing such centres and
providing benefits to businesses that do this.
Specific support provided by governments in China, India, Bangladesh and Turkey are mentioned in the
annexure to this report.
For nations like Kenya, Uganda, Sudan and Tanzania; CTA sector is an apt choice for being selected as
the priority sector by governments because of various reasons. First of all the basic raw material, cotton
is available in the region and the prospects to increase the productivity and land under cultivation exists.
It makes natural sense to focus on promotion of a sector whose raw material is available locally (or
regionally). Secondly, all these countries have preferential market access for textile and apparel goods to
USA, EU and other major markets under various agreements. Thirdly, CTA sector holds the key for
providing big employment opportunities, which is important considering the high unemployment rates
in all four nations: Kenya~40%: Sudan~19%, Tanzania~12% and Uganda~3.5% (urban
unemployment~12%).
Recommendations
Most of the interventions mentioned in the different preceding subsections talk about government
support. In order to implement them successfully, the utmost importance is of establishing strong
institutions in the country.
Considering the necessity and benefits of development of CTA sector to the country, government can
take up various developmental plans to be implemented in short term, medium term and long term, and
then phased out successively after achievement of the desired results.

Page 150 of 154
6. Proposed Interventions
6.1. Cluster Development
6.1.1. Objective
Establishment of industrial zones in the country attracting investments by providing special incentives
for the same.
6.1.2. Broad contours of the intervention
Units inside the cluster will be provided -
Interest and capital subsidy on selected plant and machinery
Fiscal incentives for exports
Exemption from customs duty, VAT, corporate tax, etc. for a period of 10 years
Providing readymade infrastructure to the businesses e.g. roads, ETP, power station, training
center, display halls, residential complex etc.
Single window clearances for investments
6.1.3. Implementation framework
Engagement of a Cluster Development Support Agency (CDSA) for:
Identification of location within the country to establish the cluster
Developing the vision and broad concept for the cluster
Identification of infrastructure requirements
Identification of key investors (domestic and abroad) and sensitize them for investment in
the cluster
Development of required infrastructure
Inviting potential investors and showcasing the infrastructure
6.1.4. Impact
Large scale investment in the sector addressing issues of supply chain linkages, technology upgradation,
capacity addition, value addition, credit availability, cost of finance, infrastructure, etc.
6.1.5. Cost Estimate
US$ 10-15 million per cluster for infrastructure development plus relinquishing of certain sources of
revenue to government.

Page 151 of 154
6.2. Training Program
6.2.1. Objective
Imparting large scale vocational training and employment assistance at operator and supervisor level for
textile and garment manufacturing processes
6.2.2. Implementation framework
Government to create certain training institutes in coordination with the industry
Engagement of Training Agency who will have the following role:
Identification of skill gap
Development of course curriculum
Identification and mobilization of employable youth
Selection and training (classroom, shop-floor and soft skills)
Placement assistance in manufacturing units
Follow-up exercise of all recruited people
6.2.3. Impact
Large scale availability of skilled manpower to the CTA sector
Increase in employment and earnings
6.2.4. Cost Estimate
US$ 300-400 per trainee
Page 152 of 154
6.3. Upgradation of Education Institutes
6.3.1. Objective
Improvement in delivery mechanism of fashion and technical institutes by improvement in course
curriculum and international partnerships.
6.3.2. Broad contours of the intervention
Revision of course curriculum in line with industry requirement
Partnerships with international institutes for student exchange, knowledge exchange and visiting
faculty program
Liaison with machinery and equipment manufacturers
Association with industry to sponsor students, accepting students for industrial training, sponsor
research work at universities and employ the locally educated students
6.3.3. Implementation framework
Formation of a consortium of technical, fashion, educational and industry experts drawn from across
the world to identify the industry need and revise the existing curriculum accordingly.
Engagement of a external agency to
Develop various partnership models with probable partners
Identify probable partner
‐ Institutes
‐ Industry
‐ Machinery and equipment, manufactures
Facilitate partnership process with identified organizations
6.3.4. Impact
Revitalization of the entire textile and fashion education infrastructure
6.3.5. Cost Estimate
US$ 1 to 2 million per country

Page 153 of 154
6.4. Creating various Networking Platforms
6.4.1. Objective
Providing opportunities to various stakeholders of the industry to interact with global and regional
stakeholders others like buyers, investors, subject matter experts, etc.
6.4.2. Broad contours of the intervention
A fund may be created for organizing events targeted to provide interactive platform to 3 types of
stakeholders
6.4.3. Implementation framework
The fund may be made available to selected, eligible organizations called Implementing Agency (IA)
which will be responsible for entire conception and execution of the interventions.
IA will then appoint external agencies like Knowledge Partner, Event Management Companies, PR
agencies, etc. to successfully conduct the event
6.4.4. Impact
Increase in trade and investment
Establishment of long term business linkages
Awareness among entrepreneurs about benefits of investment in CTA sector
Increase in buyer awareness
Development of coordination among different sector stakeholders
6.4.5. Cost Estimate
US$ 100,000 to US$ 200,000 per event depending on scope of the initiative.
• Aim: To bring awareness amonginternational buyers about thecapabilities of the region’s CTAsector and also to generateunderstanding among regionalmanufacturers about thebuyer’s requirements
• Event type: Mega Trade Show,Buyer Seller Meets and BuyerTrips
• Aim: To showcase investmentopportunities to global investorswho are looking to diversify inother geographies
• Event type: Investor Summit andIn-bound delegation visits,International road shows
• Aim: To allow deliberations ofregional issues amongstakeholders in order toformulate action plans toaddress them effectively
• Event type: Theme basedconferences
a) International buyers b) International investorsc) Regional / international “thought leaders” or subject matter experts

Page 154 of 154
6.5. Investment Support Scheme
6.5.1. Objective
Encouragement of investments in CTA sector by private players, both local and international by
providing various benefits for the same
6.5.2. Broad contours of the intervention
A scheme can be envisaged that provides fiscal incentives for investments e.g. -
Interest subsidy on selected plant and machinery
Capital subsidy on selected plant and machinery
Duty free import of modern machinery
Provision of land at notional value to projects generating a minimum employment level
Other incentives e.g. subsidized power cost, allowing accelerated depreciation of machinery,
duty drawback or exemptions, tax exemptions, etc.
6.5.3. Implementation framework
The Government Bodies need to draft these schemes by benchmarking against global best practices
and taking opinion of local businesses as well.
For this, a third party agency may be engaged who can coordinate directly with the local industry
and authorities to formulate the scheme. The agency will arrange various workshops involving
industry, government authorities, experts, etc. to arrive at best fit model for sustainable industry
growth.
6.5.4. Impact
Increased focus of investors in the regional CTA sector adding capacities which will generate
employment, foreign exchange earnings, etc.
6.5.5. Cost Estimate
To start with, a fund of US$ 25 million per country may be earmarked for such intervention, which can
be increased as investor interest grows. It will also encompass relinquishing of certain sources of
revenue to government.