uganda - finclusion.orgfinclusion.org/uploads/file/reports/uganda wave 4 report_20-june... ·...
TRANSCRIPT
UGANDA
June 2017
WAVE 4 REPORTFII TRACKER SURVEYConducted July-August 2016
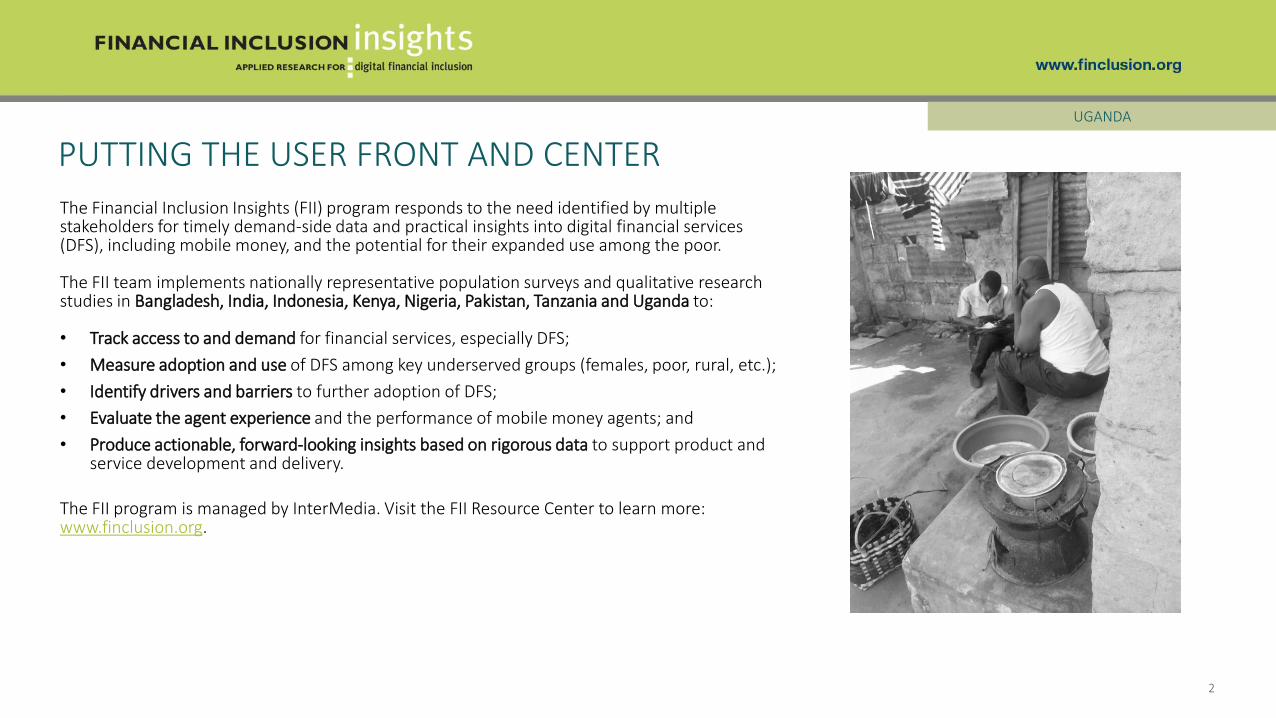
PUTTING THE USER FRONT AND CENTER
2
UGANDA
The Financial Inclusion Insights (FII) program responds to the need identified by multiple stakeholders for timely demand-side data and practical insights into digital financial services (DFS), including mobile money, and the potential for their expanded use among the poor.
The FII team implements nationally representative population surveys and qualitative research studies in Bangladesh, India, Indonesia, Kenya, Nigeria, Pakistan, Tanzania and Uganda to:
• Track access to and demand for financial services, especially DFS;
• Measure adoption and use of DFS among key underserved groups (females, poor, rural, etc.);
• Identify drivers and barriers to further adoption of DFS;
• Evaluate the agent experience and the performance of mobile money agents; and
• Produce actionable, forward-looking insights based on rigorous data to support product and service development and delivery.
The FII program is managed by InterMedia. Visit the FII Resource Center to learn more: www.finclusion.org.
CONTENTS
3
Executive Summary 4
Customer Journey 13
Preconditions 19
Access & Trial 29
Registration 35
Active Use 40
Advanced Active Use 43
Special Topic: Financial Lives 45
Key Indicators Summary 50
Methodology & Research Description 52
Glossary 54
UGANDA
EXECUTIVE SUMMARY
4
UGANDA
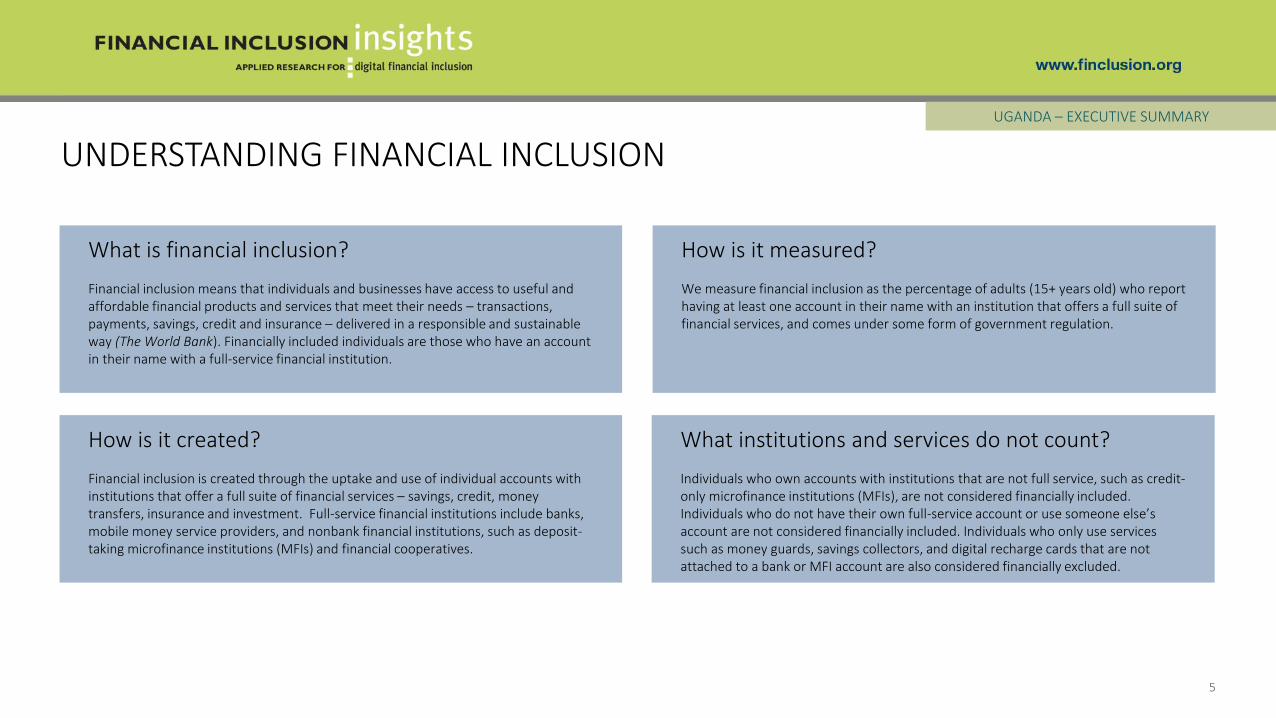
What is financial inclusion?
Financial inclusion means that individuals and businesses have access to useful and affordable financial products and services that meet their needs – transactions, payments, savings, credit and insurance – delivered in a responsible and sustainable way (The World Bank). Financially included individuals are those who have an account in their name with a full-service financial institution.
How is it measured?
We measure financial inclusion as the percentage of adults (15+ years old) who report having at least one account in their name with an institution that offers a full suite of financial services, and comes under some form of government regulation.
How is it created?
Financial inclusion is created through the uptake and use of individual accounts with institutions that offer a full suite of financial services – savings, credit, moneytransfers, insurance and investment. Full-service financial institutions include banks, mobile money service providers, and nonbank financial institutions, such as deposit-taking microfinance institutions (MFIs) and financial cooperatives.
What institutions and services do not count?
Individuals who own accounts with institutions that are not full service, such as credit-only microfinance institutions (MFIs), are not considered financially included. Individuals who do not have their own full-service account or use someone else’s account are not considered financially included. Individuals who only use servicessuch as money guards, savings collectors, and digital recharge cards that are not attached to a bank or MFI account are also considered financially excluded.
UNDERSTANDING FINANCIAL INCLUSIONUGANDA – EXECUTIVE SUMMARY
5
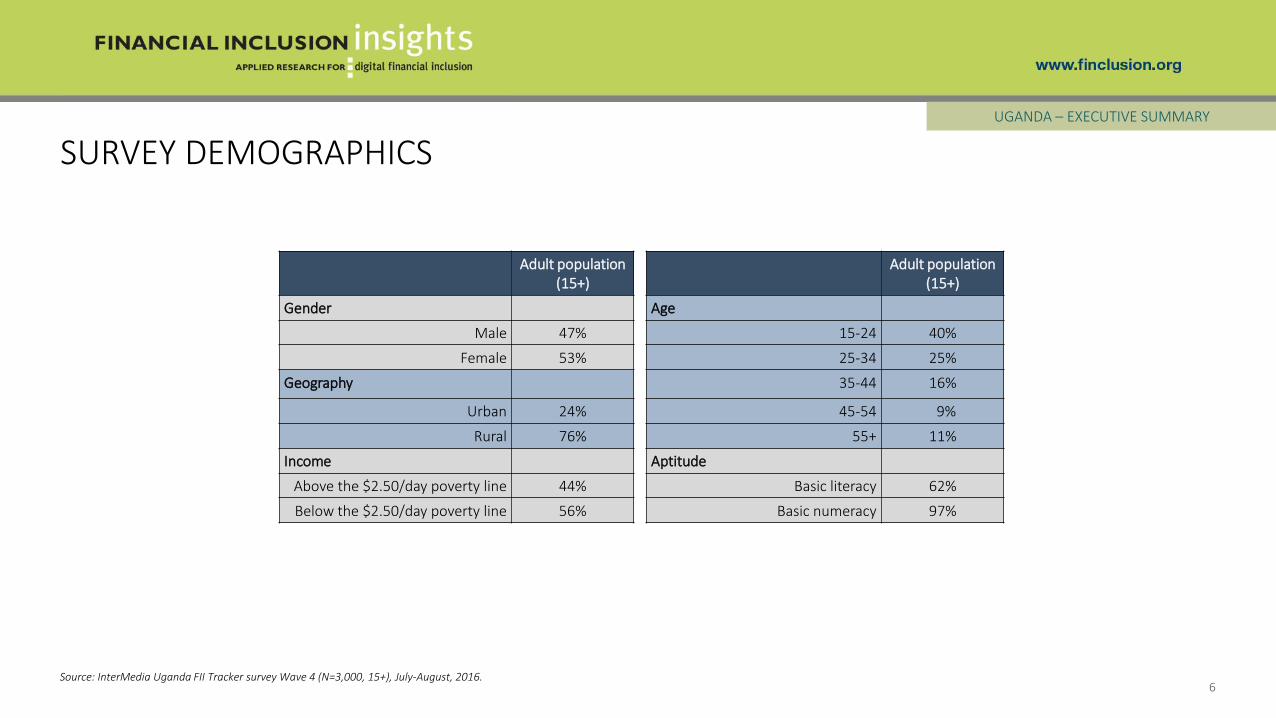
Adult population (15+)
Adult population (15+)
Gender Age
Male 47% 15-24 40%
Female 53% 25-34 25%
Geography 35-44 16%
Urban 24% 45-54 9%
Rural 76% 55+ 11%
Income Aptitude
Above the $2.50/day poverty line 44% Basic literacy 62%
Below the $2.50/day poverty line 56% Basic numeracy 97%
SURVEY DEMOGRAPHICS
6Source: InterMedia Uganda FII Tracker survey Wave 4 (N=3,000, 15+), July-August, 2016.
UGANDA – EXECUTIVE SUMMARY
Financial inclusion increased in Uganda from 2015 to 2016. The year witnessed positive developments in the marketplace, including new financial services products and changes in the regulatory environment, along with growth in the proportion of the population that holds a mobile money account. These developments are likely to lead to more active use of digital accounts, and more use of advanced services such as digital credit.
• MoKash is the first digital credit product to be offered in the Ugandan market. Launched in August 2016, MoKash is the result of a partnership between the Commercial Bank of Africa (CBA) and MTN Uganda.
• MoKash provides customers a suite of virtual banking products built on MTN’s mobile money platform, including the ability to save and borrow microloans from the CBA. This is a positive sign for digital financial services (DFS) providers.
• Uganda’s regulatory entities are recognizing the need to develop products and services that satisfy specific customer needs. Compared with Kenya and Tanzania, the limited digital financial products offered in Uganda, to date, have provided little incentive for customer uptake and continued use. Digital products such as MoKash may bode well for the expanded use of digital financial services if tailored digital products, such as bill pay and online school fee payments, continue to be made available to customers.
The Bank of Uganda maintained a strong focus on promoting financial inclusion in 2016 through reforms to the legal and regulatory environment.
• The Financial Institution (Amendment) Act 2, enacted in February 2016, provides regulations for agency banking, Islamic banking, additional Credit Reference Bureaus, insurance (referred to as: Bancassurance), and reform of the Deposit Protection Fund.
o Agency banking is aimed at increasing access to formal financial services by allowing bank institutions to offer basic banking services to the unbanked.
o Islamic banking promises to offer interest-free financing under Shariah Law and more Islamic products.
o Bancassurance allows banks to sell customers insurance services and products (such as auto insurance) on behalf of insurance companies. Banks receive a commission on the insurance products they sell.
o These three components give financial institutions greater latitude to not only offer more, but better and more convenient, services to clients, thus enhancing financial inclusion.
COUNTRY CONTEXT
7
UGANDA – EXECUTIVE SUMMARY
Source: InterMedia Uganda FII Tracker survey Wave 4 (N=3,000, 15+), July-August 2016.
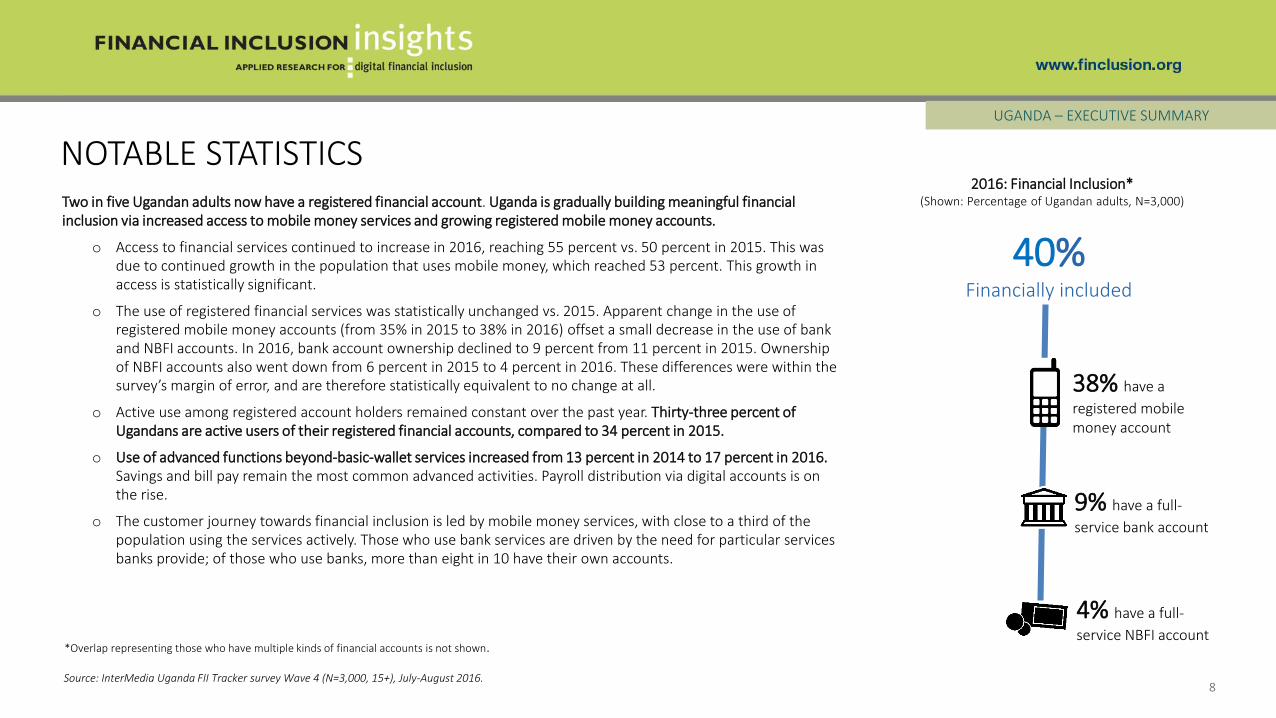
Two in five Ugandan adults now have a registered financial account. Uganda is gradually building meaningful financial inclusion via increased access to mobile money services and growing registered mobile money accounts.
o Access to financial services continued to increase in 2016, reaching 55 percent vs. 50 percent in 2015. This was due to continued growth in the population that uses mobile money, which reached 53 percent. This growth in access is statistically significant.
o The use of registered financial services was statistically unchanged vs. 2015. Apparent change in the use of registered mobile money accounts (from 35% in 2015 to 38% in 2016) offset a small decrease in the use of bank and NBFI accounts. In 2016, bank account ownership declined to 9 percent from 11 percent in 2015. Ownership of NBFI accounts also went down from 6 percent in 2015 to 4 percent in 2016. These differences were within the survey’s margin of error, and are therefore statistically equivalent to no change at all.
o Active use among registered account holders remained constant over the past year. Thirty-three percent of Ugandans are active users of their registered financial accounts, compared to 34 percent in 2015.
o Use of advanced functions beyond-basic-wallet services increased from 13 percent in 2014 to 17 percent in 2016.Savings and bill pay remain the most common advanced activities. Payroll distribution via digital accounts is on the rise.
o The customer journey towards financial inclusion is led by mobile money services, with close to a third of the population using the services actively. Those who use bank services are driven by the need for particular services banks provide; of those who use banks, more than eight in 10 have their own accounts.
NOTABLE STATISTICS
8
UGANDA – EXECUTIVE SUMMARY
Source: InterMedia Uganda FII Tracker survey Wave 4 (N=3,000, 15+), July-August 2016.
*Overlap representing those who have multiple kinds of financial accounts is not shown.
4% have a full-
service NBFI account
9% have a full-
service bank account
38% have a
registered mobile money account
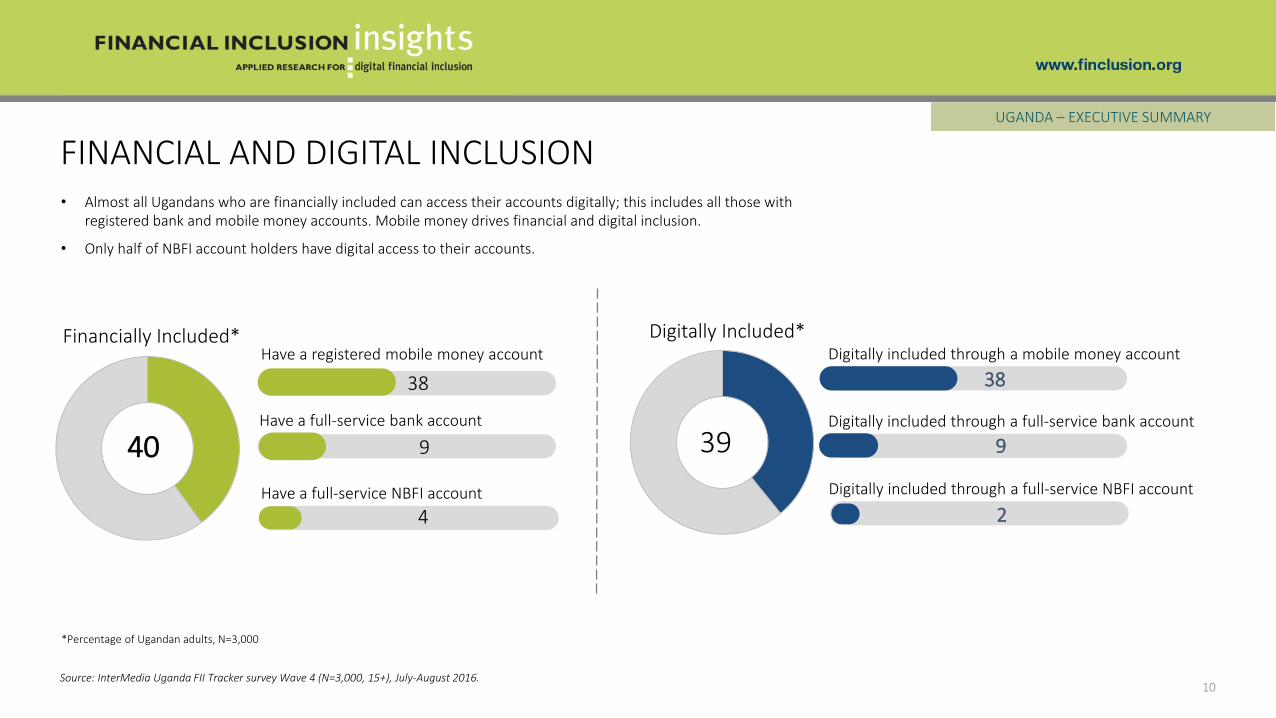
40% Financially included
2016: Financial Inclusion*(Shown: Percentage of Ugandan adults, N=3,000)
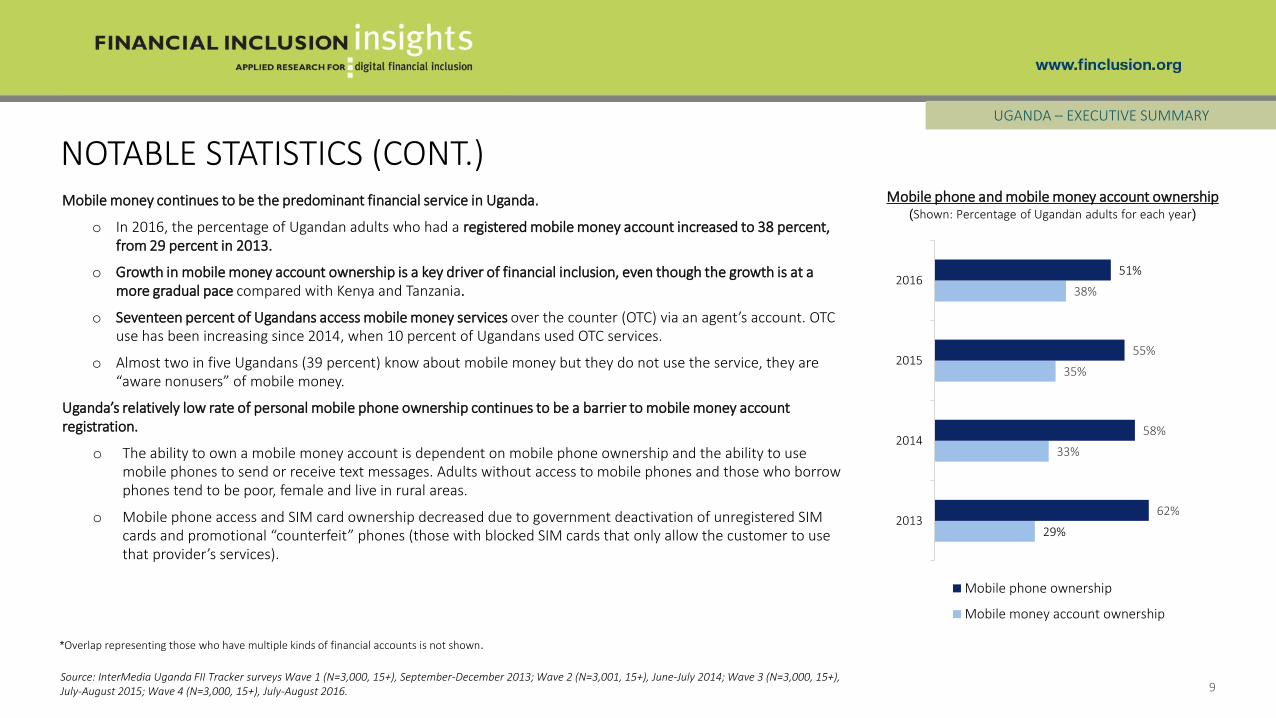
Mobile money continues to be the predominant financial service in Uganda.
o In 2016, the percentage of Ugandan adults who had a registered mobile money account increased to 38 percent, from 29 percent in 2013.
o Growth in mobile money account ownership is a key driver of financial inclusion, even though the growth is at a more gradual pace compared with Kenya and Tanzania.
o Seventeen percent of Ugandans access mobile money services over the counter (OTC) via an agent’s account. OTC use has been increasing since 2014, when 10 percent of Ugandans used OTC services.
o Almost two in five Ugandans (39 percent) know about mobile money but they do not use the service, they are “aware nonusers” of mobile money.
Uganda’s relatively low rate of personal mobile phone ownership continues to be a barrier to mobile money account registration.
o The ability to own a mobile money account is dependent on mobile phone ownership and the ability to use mobile phones to send or receive text messages. Adults without access to mobile phones and those who borrow phones tend to be poor, female and live in rural areas.
o Mobile phone access and SIM card ownership decreased due to government deactivation of unregistered SIM cards and promotional “counterfeit” phones (those with blocked SIM cards that only allow the customer to use that provider’s services).
NOTABLE STATISTICS (CONT.)
9
UGANDA – EXECUTIVE SUMMARY
Source: InterMedia Uganda FII Tracker surveys Wave 1 (N=3,000, 15+), September-December 2013; Wave 2 (N=3,001, 15+), June-July 2014; Wave 3 (N=3,000, 15+), July-August 2015; Wave 4 (N=3,000, 15+), July-August 2016.
*Overlap representing those who have multiple kinds of financial accounts is not shown.
29%
33%
35%
38%
62%
58%
55%
51%
2013
2014
2015
2016
Mobile phone ownership
Mobile money account ownership
Mobile phone and mobile money account ownership (Shown: Percentage of Ugandan adults for each year)
FINANCIAL AND DIGITAL INCLUSION
10Source: InterMedia Uganda FII Tracker survey Wave 4 (N=3,000, 15+), July-August 2016.
UGANDA – EXECUTIVE SUMMARY
*Percentage of Ugandan adults, N=3,000
• Almost all Ugandans who are financially included can access their accounts digitally; this includes all those with registered bank and mobile money accounts. Mobile money drives financial and digital inclusion.
• Only half of NBFI account holders have digital access to their accounts.
40
Digitally included through a mobile money account
39
38
9Digitally included through a full-service bank account
Digitally included through a full-service NBFI account
2
Financially Included* Digitally Included*Have a registered mobile money account
38
Have a full-service bank account
9
Have a full-service NBFI account
4
12
2933
5
14
3338
611
3539
49
38 40
Nonbank financialinstitution
Bank Mobile money NBFI, bank, and/ormobile money
14
4347
7
15
4347
812
4750
611
53 55
Nonbank financialinstitution
Bank Mobile money NBFI, bank, and/ormobile money
NA NA
ACCESS AND REGISTRATION AT A GLANCE
11Source: InterMedia Uganda FII Tracker surveys Wave 1 (N=3,000, 15+), September-December 2013; Wave 2 (N=3,001, 15+), June-July 2014; Wave 3 (N=3,000, 15+),July-August 2015; Wave 4 (N=3,000, 15+), July-August 2016.
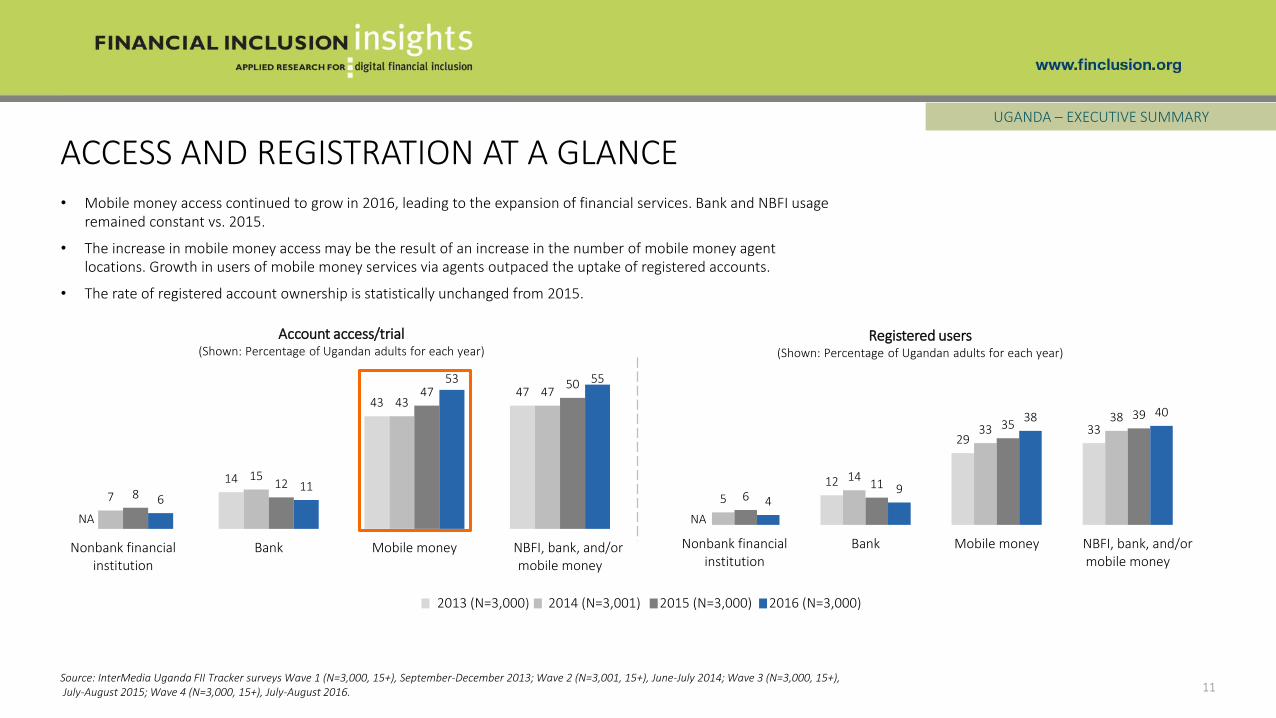
• Mobile money access continued to grow in 2016, leading to the expansion of financial services. Bank and NBFI usage remained constant vs. 2015.
• The increase in mobile money access may be the result of an increase in the number of mobile money agent locations. Growth in users of mobile money services via agents outpaced the uptake of registered accounts.
• The rate of registered account ownership is statistically unchanged from 2015.
UGANDA – EXECUTIVE SUMMARY
Account access/trial(Shown: Percentage of Ugandan adults for each year)
Registered users(Shown: Percentage of Ugandan adults for each year)
2016 (N=3,000)2015 (N=3,000)2014 (N=3,001)2013 (N=3,000)

ACTIVE USE AND ADVANCED USE AT A GLANCE
12Source: InterMedia Uganda FII Tracker surveys Wave 1 (N=3,000, 15+), September-December 2013; Wave 2 (N=3,001, 15+), June-July 2014; Wave 3 (N=3,000, 15+),July-August 2015; Wave 4 (N=3,000, 15+), July-August 2016.
• A third of Ugandans who hold financial accounts use them actively in their day-to-day lives; financial services active use has remained constant for the past three years.
• Mobile money advanced active users showed no growth vs. 2015, but tripled vs. 2013. Saving and bill payment products are the most frequent advanced use cases.
UGANDA – EXECUTIVE SUMMARY
5 59
46
8
14
36
1317
25
1517
Nonbank financialinstitution
Bank Mobile money NBFI, bank, and/ormobile money
10
2630
4
11
29
34
59
3134
37
32 33
Nonbank financialinstitution
Bank Mobile money NBFI, bank and/ormobile money
Active registered users(Shown: Percent of Ugandan adults for each year)
Advanced active registered users(Shown: Percent of Ugandan adults for each year)
NA NA
2016 (N=3,000)2015 (N=3,000)2014 (N=3,001)2013 (N=3,000)
CUSTOMER JOURNEY
13
PRECONDITIONS ACCESS & TRIAL REGISTRATION ACTIVE USE ADVANCED ACTIVE USE
UGANDA
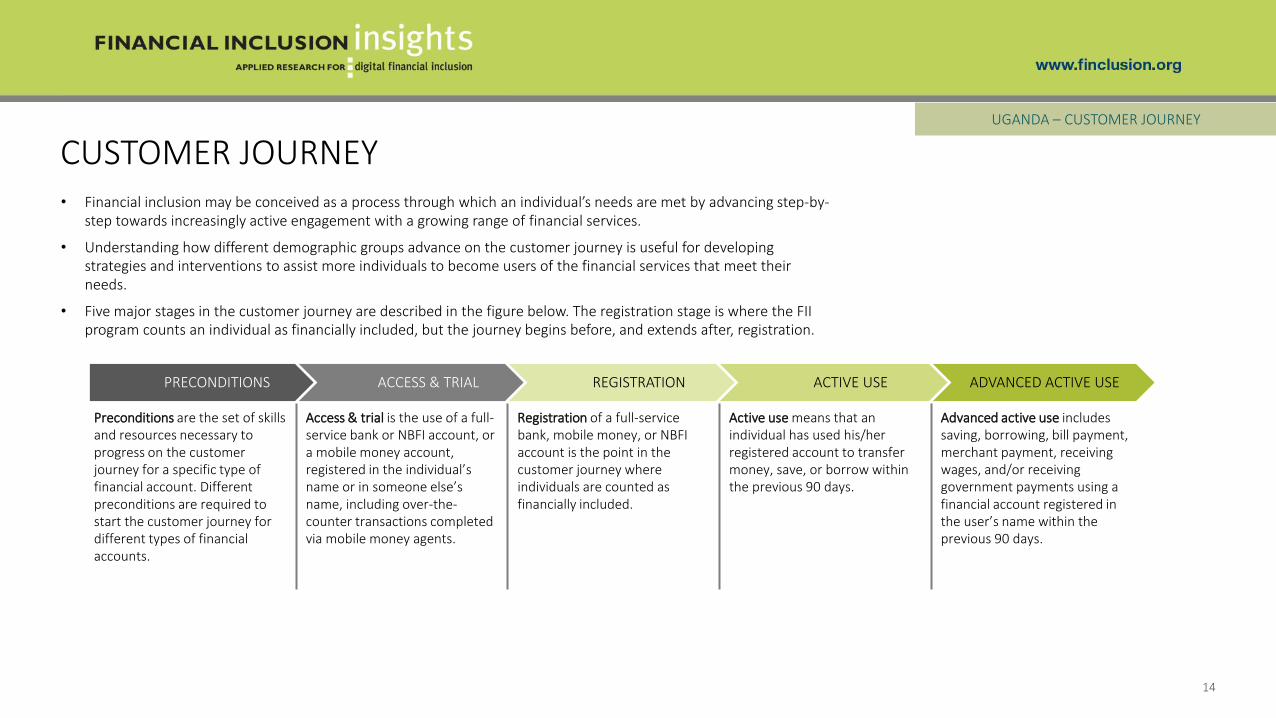
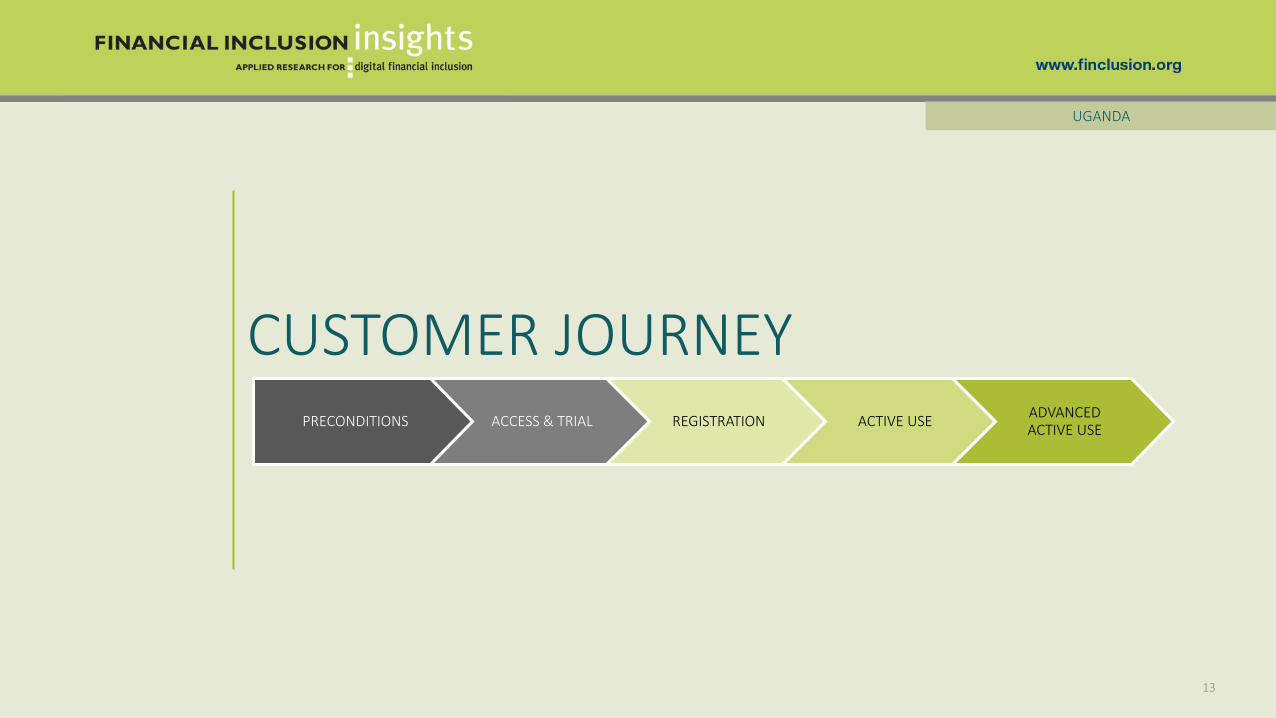
• Financial inclusion may be conceived as a process through which an individual’s needs are met by advancing step-by-step towards increasingly active engagement with a growing range of financial services.
• Understanding how different demographic groups advance on the customer journey is useful for developing strategies and interventions to assist more individuals to become users of the financial services that meet their needs.
• Five major stages in the customer journey are described in the figure below. The registration stage is where the FII program counts an individual as financially included, but the journey begins before, and extends after, registration.
CUSTOMER JOURNEY
14
UGANDA – CUSTOMER JOURNEY
PRECONDITIONS ACCESS & TRIAL REGISTRATION ACTIVE USE ADVANCED ACTIVE USE
Preconditions are the set of skills and resources necessary to progress on the customer journey for a specific type of financial account. Differentpreconditions are required to start the customer journey fordifferent types of financial accounts.
Access & trial is the use of a full-service bank or NBFI account, or a mobile money account, registered in the individual’s name or in someone else’s name, including over-the-counter transactions completed via mobile money agents.
Registration of a full-service bank, mobile money, or NBFI account is the point in the customer journey where individuals are counted as financially included.
Active use means that an individual has used his/her registered account to transfer money, save, or borrow within the previous 90 days.
Advanced active use includes saving, borrowing, bill payment, merchant payment, receiving wages, and/or receiving government payments using a financial account registered in the user’s name within the previous 90 days.

Source: InterMedia Uganda FII Tracker survey Wave 4 (N=3,000, 15+), July-August 2016.
Mobile Money
Banks
ACCESS & TRIAL REGISTRATION ACTIVE USE ADVANCED ACTIVE USE
53% 38% 32% 15%
11% 9% 7% 5%
NBFIs 6% 4% 3% 2%
PATHWAYS TOWARDS FINANCIAL INCLUSION
15
UGANDA – CUSTOMER JOURNEY
(Percentage of Ugandan adults, N=3,000)
• In Uganda, mobile money drives financial inclusion. More than half of Ugandans are using mobile money services, with close to a third using the services actively. Mobile money services enjoy a high customer retention rate as customers move from access/trial to active registered use.
• The rate of use of bank and NBFI services remained relatively low. The lack of proximity to access points is one of the challenges to greater use of these services.
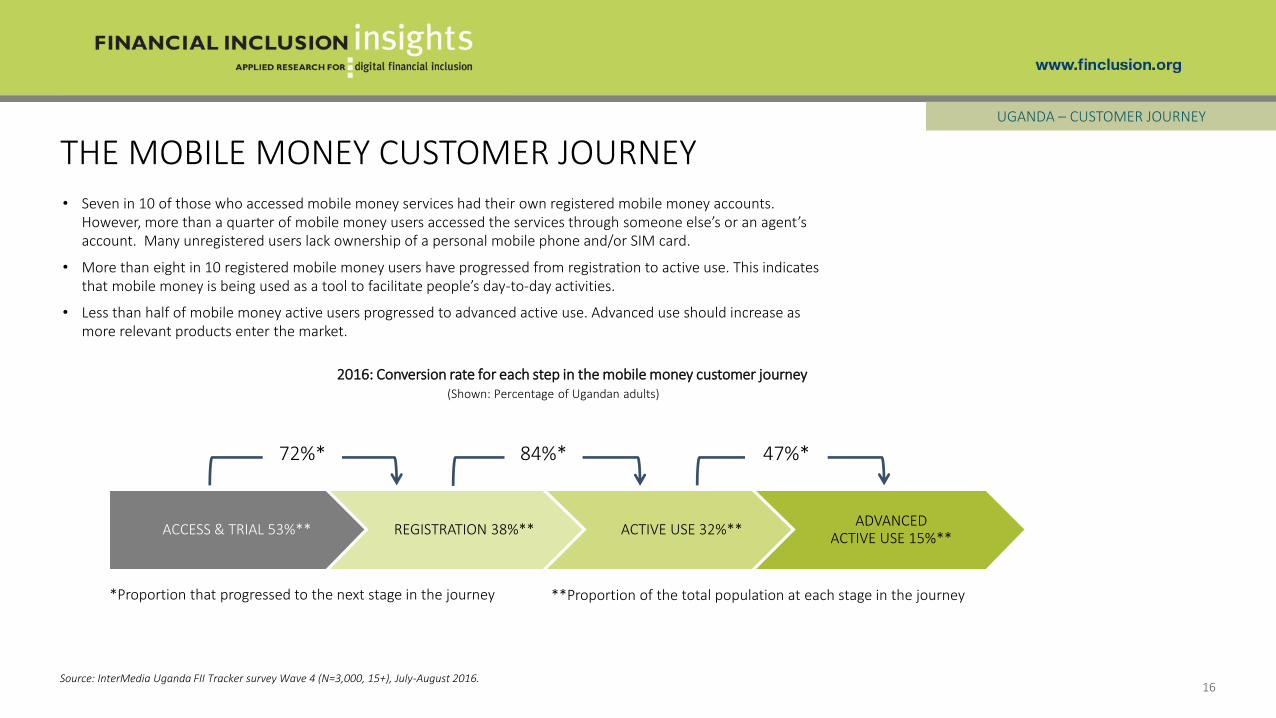
THE MOBILE MONEY CUSTOMER JOURNEY
16
ACCESS & TRIAL 53%** REGISTRATION 38%** ACTIVE USE 32%** ADVANCED
ACTIVE USE 15%**
72%* 84%* 47%*
2016: Conversion rate for each step in the mobile money customer journey(Shown: Percentage of Ugandan adults)
• Seven in 10 of those who accessed mobile money services had their own registered mobile money accounts. However, more than a quarter of mobile money users accessed the services through someone else’s or an agent’s account. Many unregistered users lack ownership of a personal mobile phone and/or SIM card.
• More than eight in 10 registered mobile money users have progressed from registration to active use. This indicates that mobile money is being used as a tool to facilitate people’s day-to-day activities.
• Less than half of mobile money active users progressed to advanced active use. Advanced use should increase as more relevant products enter the market.
Source: InterMedia Uganda FII Tracker survey Wave 4 (N=3,000, 15+), July-August 2016.
UGANDA – CUSTOMER JOURNEY
**Proportion of the total population at each stage in the journey*Proportion that progressed to the next stage in the journey
THE BANKING CUSTOMER JOURNEY
17
UGANDA – CUSTOMER JOURNEY
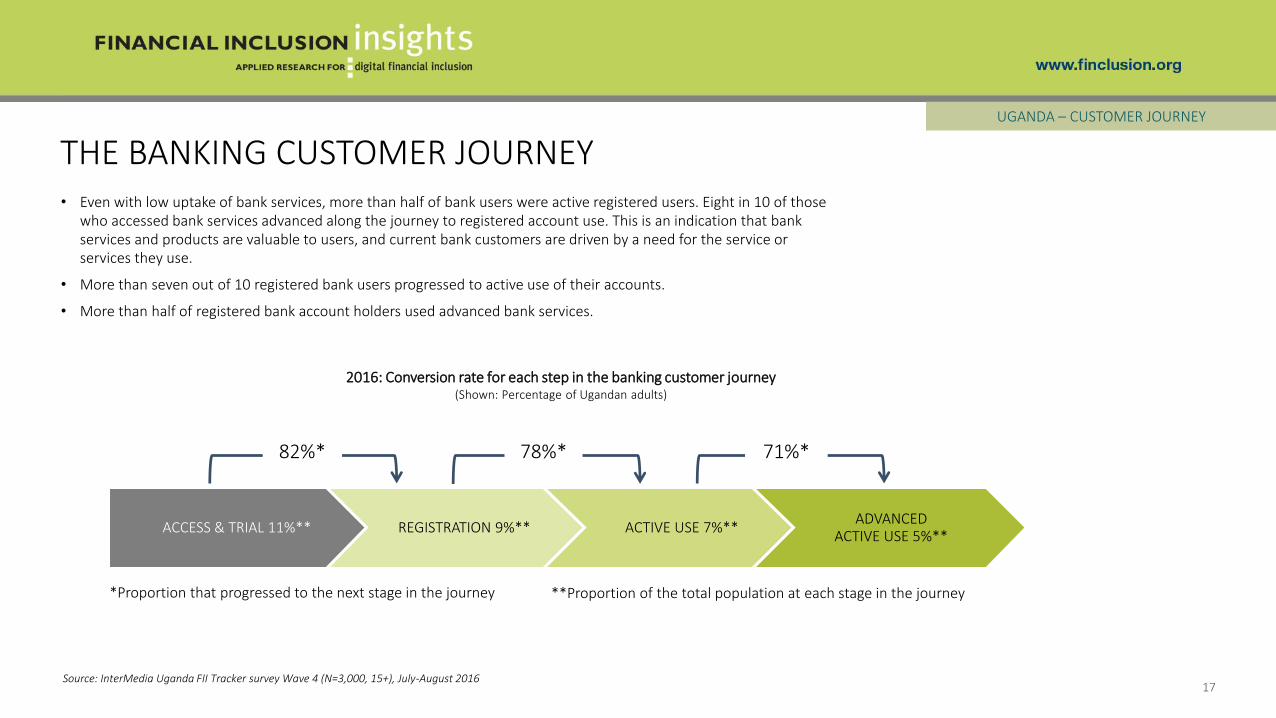
ACCESS & TRIAL 11%** REGISTRATION 9%** ACTIVE USE 7%**ADVANCED
ACTIVE USE 5%**
82%* 78%* 71%*
2016: Conversion rate for each step in the banking customer journey(Shown: Percentage of Ugandan adults)
• Even with low uptake of bank services, more than half of bank users were active registered users. Eight in 10 of those who accessed bank services advanced along the journey to registered account use. This is an indication that bank services and products are valuable to users, and current bank customers are driven by a need for the service or services they use.
• More than seven out of 10 registered bank users progressed to active use of their accounts.
• More than half of registered bank account holders used advanced bank services.
Source: InterMedia Uganda FII Tracker survey Wave 4 (N=3,000, 15+), July-August 2016
**Proportion of the total population at each stage in the journey*Proportion that progressed to the next stage in the journey
THE NBFI CUSTOMER JOURNEY
18
UGANDA – CUSTOMER JOURNEY
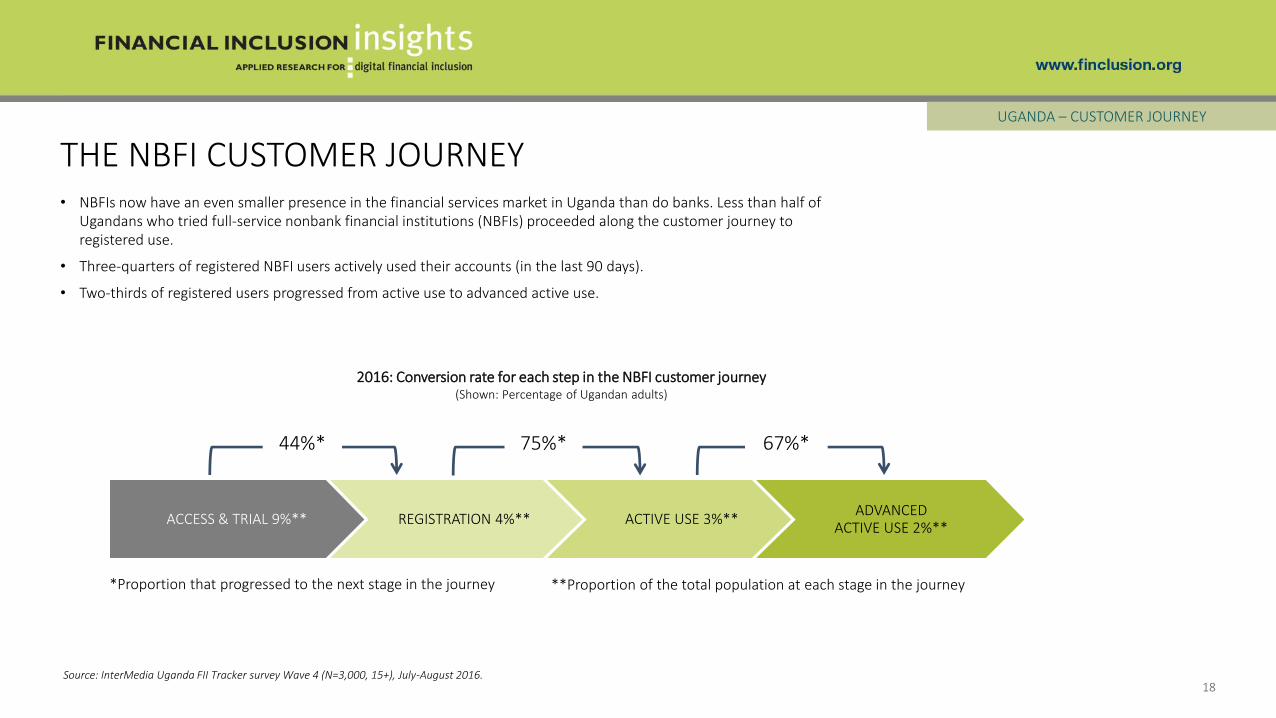
ACCESS & TRIAL 9%** REGISTRATION 4%** ACTIVE USE 3%**ADVANCED
ACTIVE USE 2%**
44%* 75%* 67%*
2016: Conversion rate for each step in the NBFI customer journey(Shown: Percentage of Ugandan adults)
• NBFIs now have an even smaller presence in the financial services market in Uganda than do banks. Less than half of Ugandans who tried full-service nonbank financial institutions (NBFIs) proceeded along the customer journey to registered use.
• Three-quarters of registered NBFI users actively used their accounts (in the last 90 days).
• Two-thirds of registered users progressed from active use to advanced active use.
Source: InterMedia Uganda FII Tracker survey Wave 4 (N=3,000, 15+), July-August 2016.
**Proportion of the total population at each stage in the journey*Proportion that progressed to the next stage in the journey
PRECONDITIONS ACCESS & TRIAL REGISTRATION ACTIVE USE ADVANCED ACTIVE USE
PRECONDITIONS
19
UGANDA
PRECONDITIONS FOR FINANCIAL INCLUSION
20
UGANDA – PRECONDITIONS
Source: InterMedia Uganda FII Tracker survey Wave 4 (N=3,000, 15+), July-August 2016.
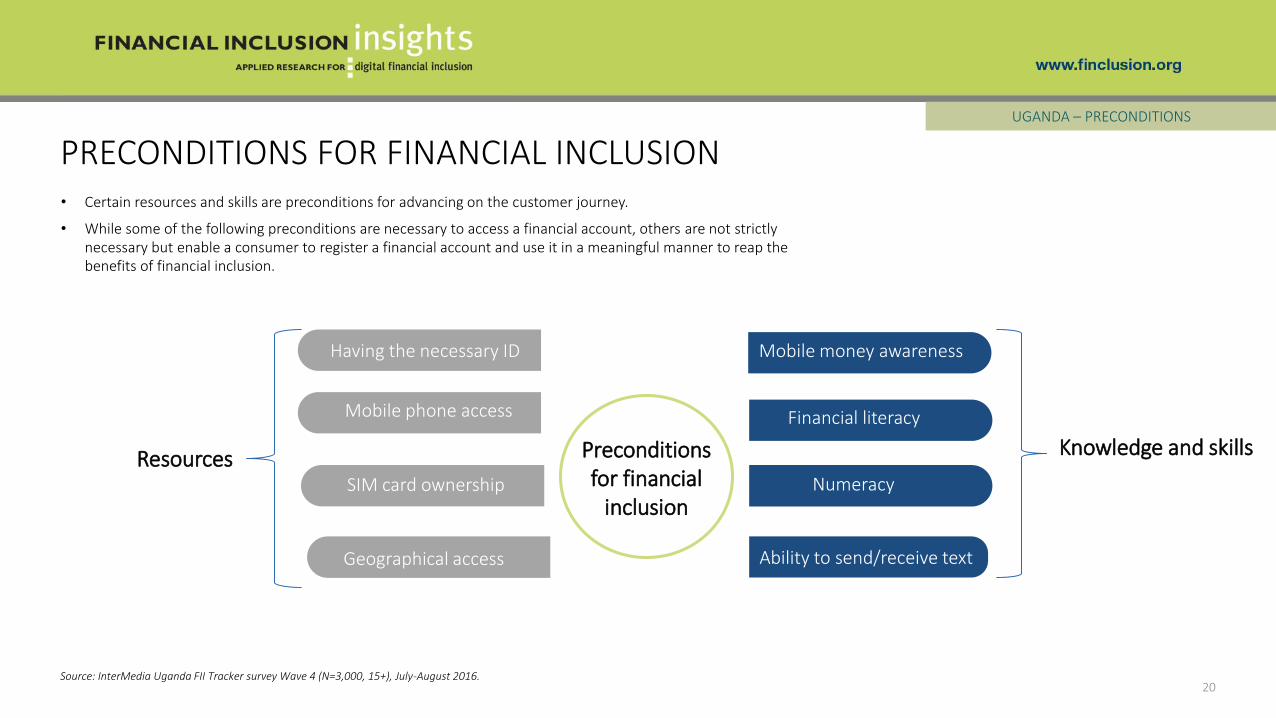
Having the necessary ID
Resources
Mobile phone access
SIM card ownership
Geographical access
Financial literacy
Numeracy
Ability to send/receive text
Knowledge and skillsPreconditions for financial
inclusion
• Certain resources and skills are preconditions for advancing on the customer journey.
• While some of the following preconditions are necessary to access a financial account, others are not strictly necessary but enable a consumer to register a financial account and use it in a meaningful manner to reap the benefits of financial inclusion.
Mobile money awareness
PRECONDITIONS: KEY INDICATOR TRENDS
21
UGANDA – PRECONDITIONS
2016: Key indicators of preparedness for digital financial services (Shown: Percentage of Ugandan adults, N=3,000)
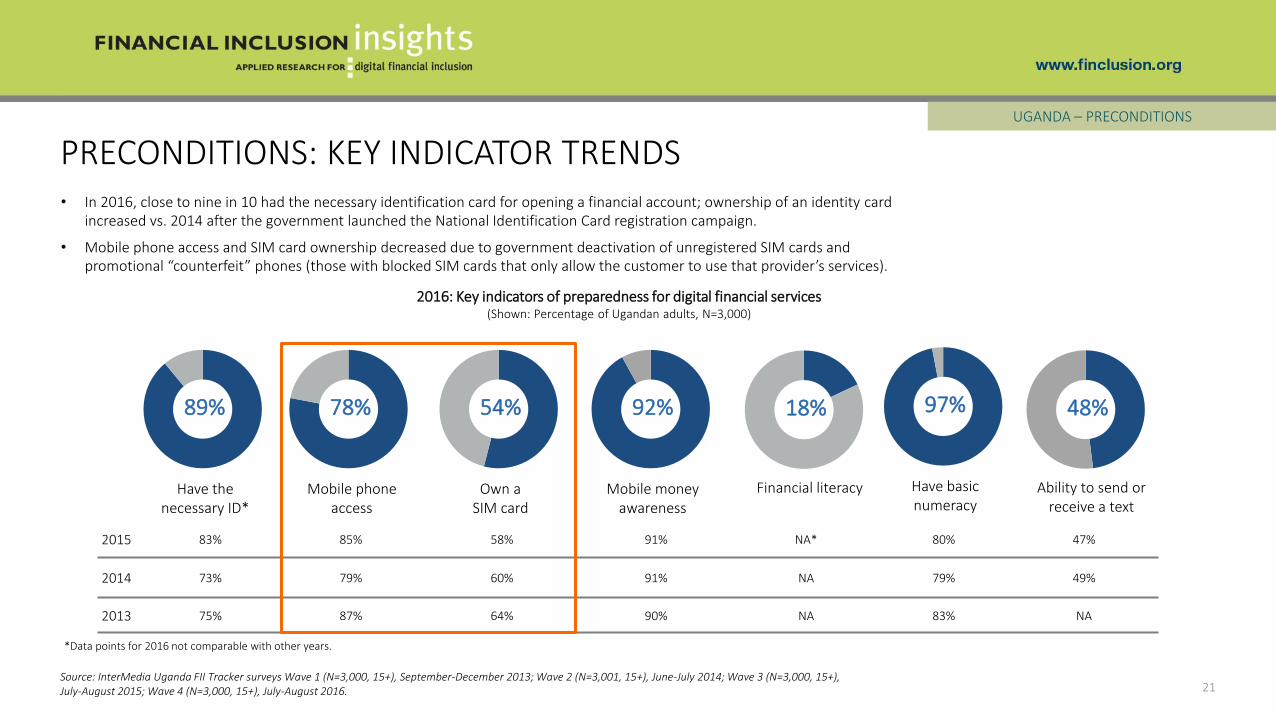
2015 83% 85% 58% 91% NA* 80% 47%
2014 73% 79% 60% 91% NA 79% 49%
2013 75% 87% 64% 90% NA 83% NA
97%
Have basic numeracy
89%
Have the necessary ID*
92%
Mobile money awareness
18%
Financial literacy
54%
Own a SIM card
78%
Mobile phone access
48%
Ability to send or receive a text
Source: InterMedia Uganda FII Tracker surveys Wave 1 (N=3,000, 15+), September-December 2013; Wave 2 (N=3,001, 15+), June-July 2014; Wave 3 (N=3,000, 15+), July-August 2015; Wave 4 (N=3,000, 15+), July-August 2016.
• In 2016, close to nine in 10 had the necessary identification card for opening a financial account; ownership of an identity card increased vs. 2014 after the government launched the National Identification Card registration campaign.
• Mobile phone access and SIM card ownership decreased due to government deactivation of unregistered SIM cards and promotional “counterfeit” phones (those with blocked SIM cards that only allow the customer to use that provider’s services).
*Data points for 2016 not comparable with other years.
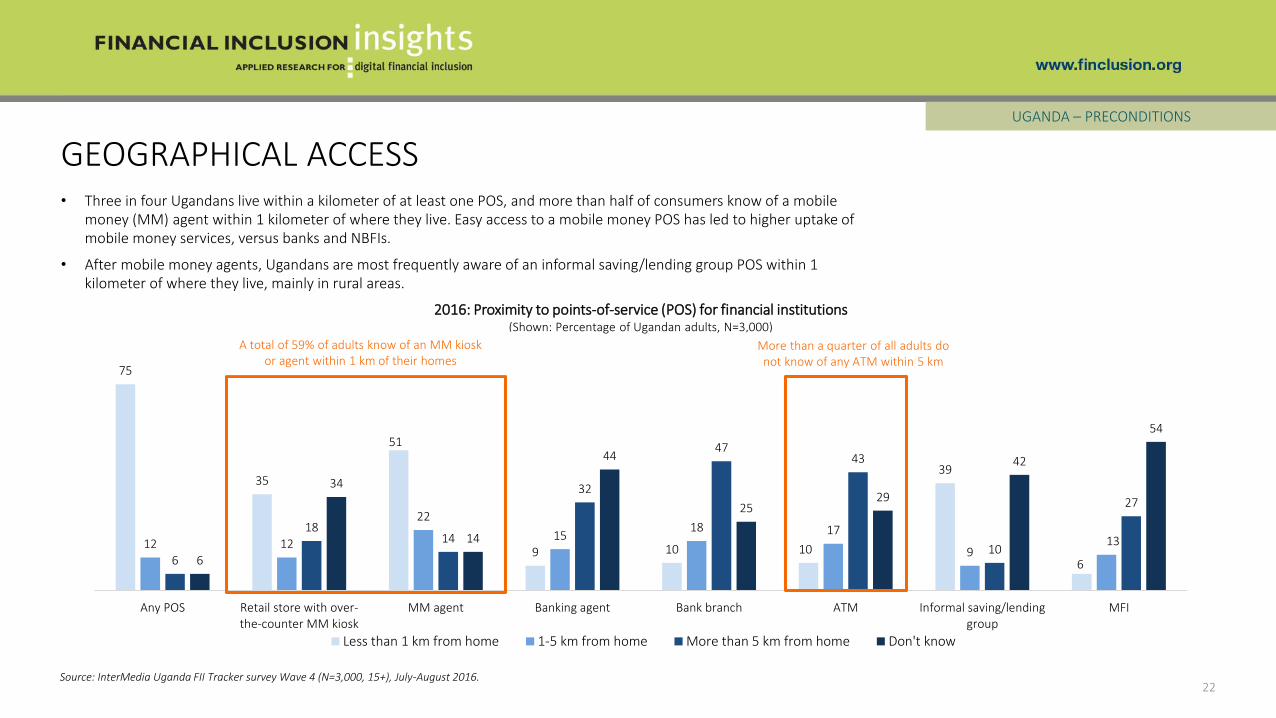
• Three in four Ugandans live within a kilometer of at least one POS, and more than half of consumers know of a mobile money (MM) agent within 1 kilometer of where they live. Easy access to a mobile money POS has led to higher uptake of mobile money services, versus banks and NBFIs.
• After mobile money agents, Ugandans are most frequently aware of an informal saving/lending group POS within 1 kilometer of where they live, mainly in rural areas.
75
35
51
9 10 10
39
6
12 12
22
1518 17
913
6
1814
32
4743
10
27
6
34
14
44
2529
42
54
Any POS Retail store with over-the-counter MM kiosk
MM agent Banking agent Bank branch ATM Informal saving/lendinggroup
MFI
Less than 1 km from home 1-5 km from home More than 5 km from home Don't know
GEOGRAPHICAL ACCESS
22
2016: Proximity to points-of-service (POS) for financial institutions(Shown: Percentage of Ugandan adults, N=3,000)
A total of 59% of adults know of an MM kiosk or agent within 1 km of their homes
More than a quarter of all adults do not know of any ATM within 5 km
UGANDA – PRECONDITIONS
Source: InterMedia Uganda FII Tracker survey Wave 4 (N=3,000, 15+), July-August 2016.

MOBILE MONEY AWARENESS
23
UGANDA – PRECONDITIONS
90 91 91 92
2013 2014 2015 2016
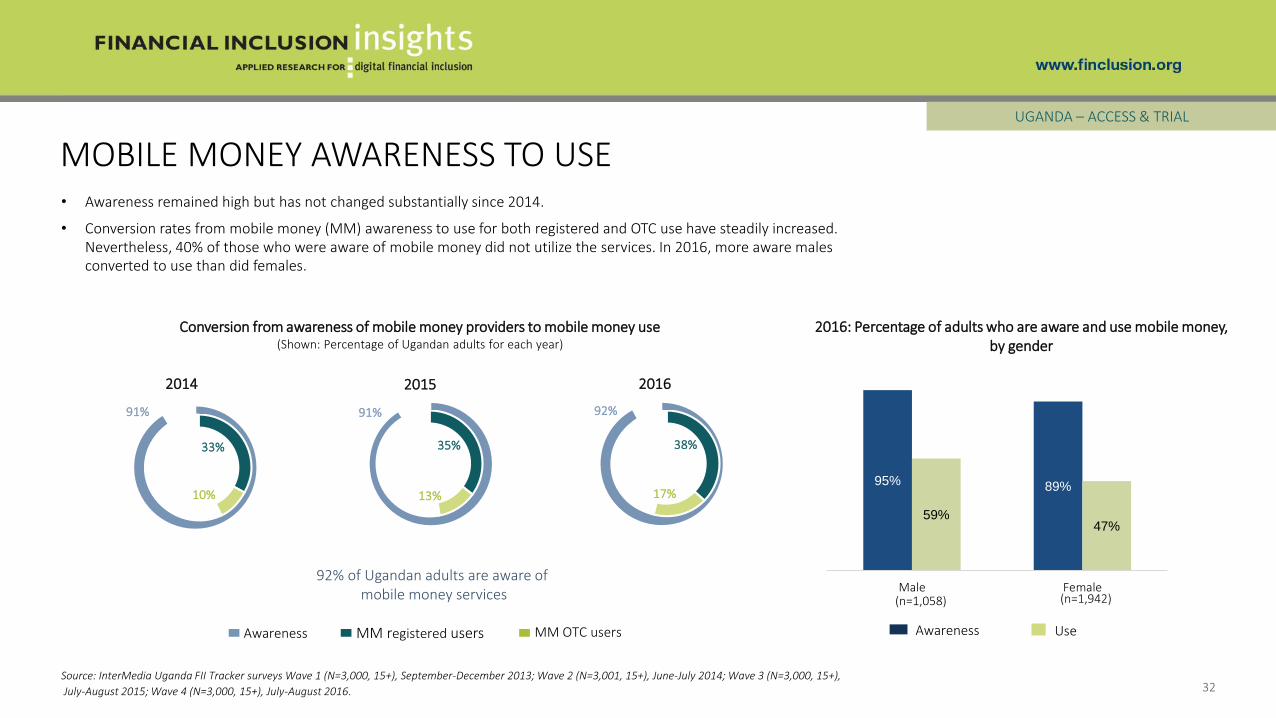
Mobile money provider awareness(Shown: Percentage of Ugandan adults for each year)
• Ninety-two percent of all adults can name at least one mobile money provider. Awareness has remained relatively constant for the past four years.
• Almost two-thirds of those who are unaware of mobile money do not use a phone; over three-quarters of those who are unaware are illiterate.
2016: Awareness by poverty level(Shown: Percentage of Ugandan adults, N=3,000)
87% of adults living below the $2.5/day poverty line
98% of adults living above the $2.5/day poverty line
2016: Awareness by gender
89% of females
95% of males
2016: Unaware of mobile money
13% lack basic numeracy
82% lack basic literacy
65% have no access to a phone
Source: InterMedia Uganda FII Tracker surveys Wave 1 (N=3,000, 15+), September-December 2013; Wave 2 (N=3,001, 15+), June-July 2014; Wave 3 (N=3,000, 15+), July-August 2015; Wave 4 (N=3,000, 15+), July-August 2016.

24
AWARE NONUSERS PROFILEUGANDA – PRECONDITIONS
• Aware nonusers of mobile money decreased vs. 2015; but more than a third of Ugandans who knew about mobile money still did not use the services.
• The majority of those who are aware nonusers are poor, living in rural areas, less educated and younger.
Source: InterMedia Uganda FII Tracker survey Wave 4 (N=3,000, 15+), July-August 2016.
39%aware nonusers of
mobile money
2016: Aware nonusers of mobile money (Shown: Percentage of Ugandan adults, N=3,000)
2016: Profile of aware nonusers of mobile money (Shown: Percentage of aware nonusers of mobile money, n=1,147)
Younger than 35 years
65%
35 years and older
35%
Male
43%
Female
57%
Above the poverty line
26%
Below the poverty line
74%
None/primary education
82%
Secondary education and above
18%
Urban
14%
Rural
86%
Employed
60%
43% in 2015

25
FEMALE AWARE NONUSERS UGANDA – PRECONDITIONS
• More than half of aware nonusers are females. Lack of control over their finances is a significant barrier for the uptake of mobile money services among women in Uganda. Making private decisions about how to save and spend money without male involvement is a challenge.
Source: InterMedia Uganda FII Tracker survey Wave 4 (N=3,000, 15+), July-August 2016.
39% aware nonusers of
mobile money
2016: Aware nonusers of mobile money (Shown: Percentage of Ugandan adults, N=3,000)
Concerns of female aware nonusers of mobile money (Shown: Percentage of female aware nonusers of mobile money, n=781)
57% female
53% do not have
money to spend or save without consent
from a husband or father or anyone else
81% cannot use
their own money privately
26% are worried
about male family members interfering
with how they use their money
75
54
68
54
69
49
62
46
Men Women
NA NA
59
41
56
41
55
41
Men Women
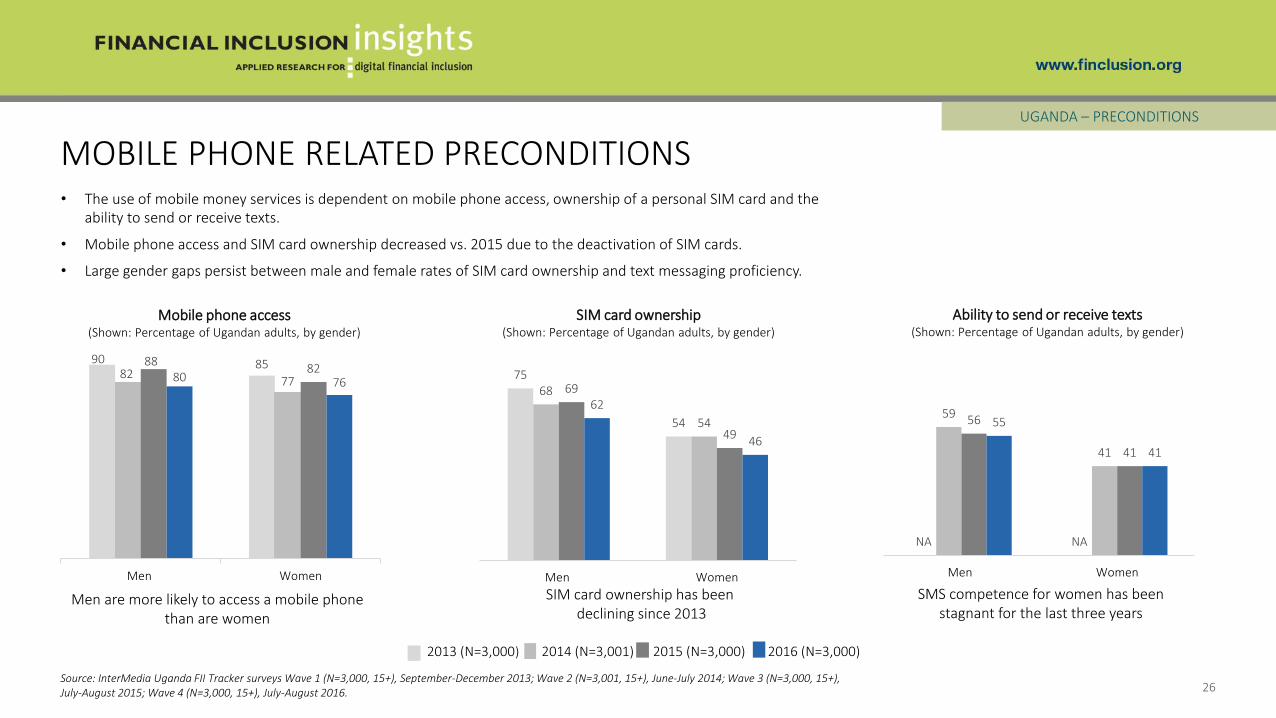
MOBILE PHONE RELATED PRECONDITIONS
26
UGANDA – PRECONDITIONS
2016 (N=3,000)2015 (N=3,000)2014 (N=3,001)2013 (N=3,000)
• The use of mobile money services is dependent on mobile phone access, ownership of a personal SIM card and the ability to send or receive texts.
• Mobile phone access and SIM card ownership decreased vs. 2015 due to the deactivation of SIM cards.
• Large gender gaps persist between male and female rates of SIM card ownership and text messaging proficiency.
Source: InterMedia Uganda FII Tracker surveys Wave 1 (N=3,000, 15+), September-December 2013; Wave 2 (N=3,001, 15+), June-July 2014; Wave 3 (N=3,000, 15+),July-August 2015; Wave 4 (N=3,000, 15+), July-August 2016.
90 8582
77
8882
80 76
Men Women
Mobile phone access (Shown: Percentage of Ugandan adults, by gender)
SIM card ownership (Shown: Percentage of Ugandan adults, by gender)
Ability to send or receive texts(Shown: Percentage of Ugandan adults, by gender)
Men are more likely to access a mobile phone than are women
SIM card ownership has beendeclining since 2013
SMS competence for women has been stagnant for the last three years
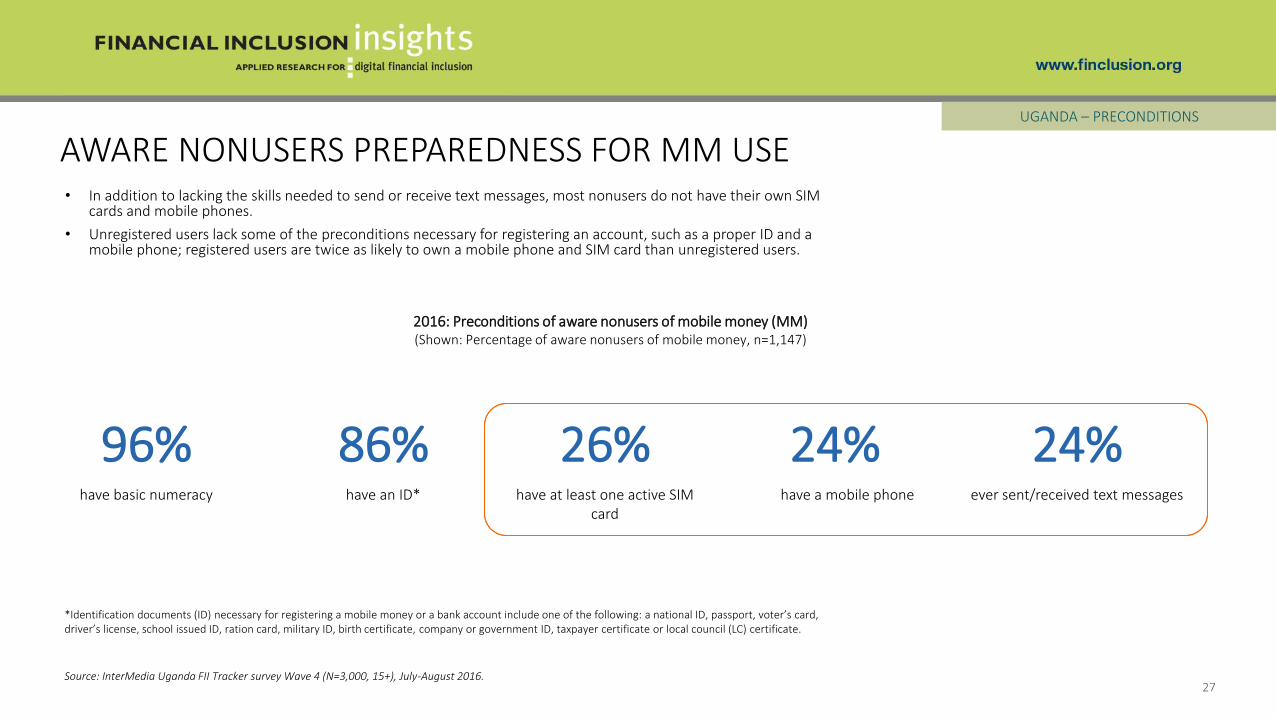
96% 86% 26% 24% 24%have basic numeracy have an ID* have at least one active SIM
cardhave a mobile phone ever sent/received text messages
2016: Preconditions of aware nonusers of mobile money (MM) (Shown: Percentage of aware nonusers of mobile money, n=1,147)
27
AWARE NONUSERS PREPAREDNESS FOR MM USEUGANDA – PRECONDITIONS
• In addition to lacking the skills needed to send or receive text messages, most nonusers do not have their own SIM cards and mobile phones.
• Unregistered users lack some of the preconditions necessary for registering an account, such as a proper ID and a mobile phone; registered users are twice as likely to own a mobile phone and SIM card than unregistered users.
Source: InterMedia Uganda FII Tracker survey Wave 4 (N=3,000, 15+), July-August 2016.
*Identification documents (ID) necessary for registering a mobile money or a bank account include one of the following: a national ID, passport, voter’s card, driver’s license, school issued ID, ration card, military ID, birth certificate, company or government ID, taxpayer certificate or local council (LC) certificate.
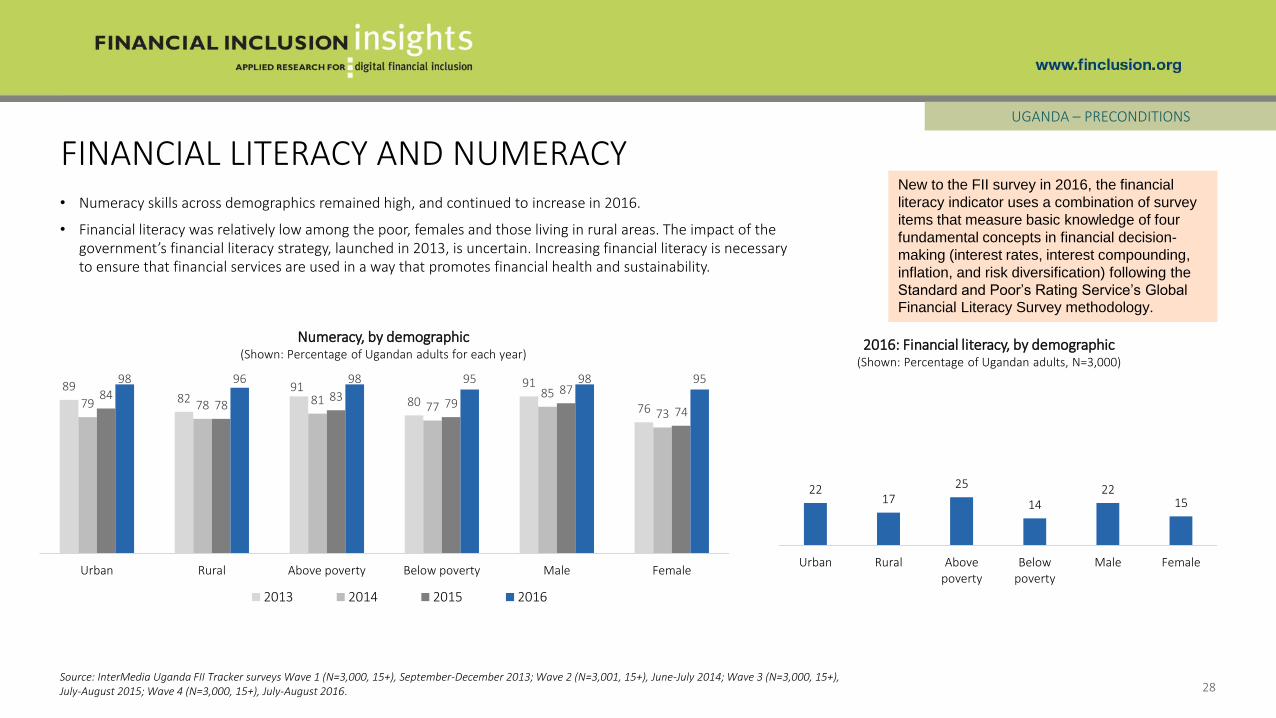
FINANCIAL LITERACY AND NUMERACY
28
UGANDA – PRECONDITIONS
8982
9180
91
7679 78 8177
85
73
8478
8379
87
74
98 96 98 95 98 95
Urban Rural Above poverty Below poverty Male Female
2013 2014 2015 2016
Numeracy, by demographic(Shown: Percentage of Ugandan adults for each year)
• Numeracy skills across demographics remained high, and continued to increase in 2016.
• Financial literacy was relatively low among the poor, females and those living in rural areas. The impact of the government’s financial literacy strategy, launched in 2013, is uncertain. Increasing financial literacy is necessary to ensure that financial services are used in a way that promotes financial health and sustainability.
Source: InterMedia Uganda FII Tracker surveys Wave 1 (N=3,000, 15+), September-December 2013; Wave 2 (N=3,001, 15+), June-July 2014; Wave 3 (N=3,000, 15+), July-August 2015; Wave 4 (N=3,000, 15+), July-August 2016.
2217
25
1422
15
Urban Rural Abovepoverty
Belowpoverty
Male Female
2016: Financial literacy, by demographic(Shown: Percentage of Ugandan adults, N=3,000)
New to the FII survey in 2016, the financial
literacy indicator uses a combination of survey
items that measure basic knowledge of four
fundamental concepts in financial decision-
making (interest rates, interest compounding,
inflation, and risk diversification) following the
Standard and Poor’s Rating Service’s Global
Financial Literacy Survey methodology.
ACCESS & TRIAL
UGANDA
29
PRECONDITIONSACCESS &
TRIALREGISTRATION ACTIVE USE
ADVANCED ACTIVE USE
ACCESS AND TRIAL OF FINANCIAL SERVICES
30
UGANDA – ACCESS & TRIAL
Source: InterMedia Uganda FII Tracker surveys Wave 1 (N=3,000, 15+), September-December 2013; Wave 2 (N=3,001, 15+), June-July 2014; Wave 3 (N=3,000, 15+),July-August 2015; Wave 4 (N=3,000, 15+), July-August 2016.
14
4347
7
15
4347
812
4750
611
53 55
Nonbank financialinstitution
Bank Mobile money NBFI, bank, and/ormobile money
2013 (N=3,000) 2014 (N=3,001) 2015 (N=3,000) 2016 (N=3,000)
Access and trial of financial services(Shown: Percentage of Ugandan adults for each year)
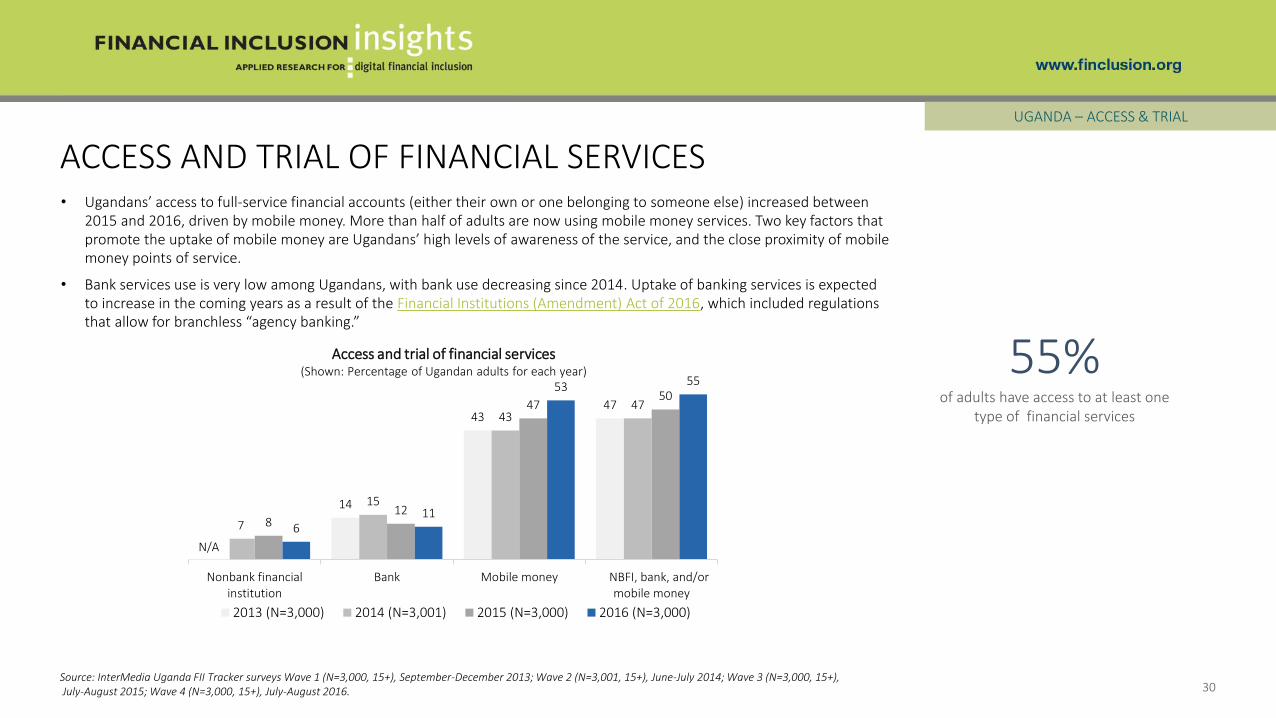
N/A
• Ugandans’ access to full-service financial accounts (either their own or one belonging to someone else) increased between 2015 and 2016, driven by mobile money. More than half of adults are now using mobile money services. Two key factors that promote the uptake of mobile money are Ugandans’ high levels of awareness of the service, and the close proximity of mobile money points of service.
• Bank services use is very low among Ugandans, with bank use decreasing since 2014. Uptake of banking services is expected to increase in the coming years as a result of the Financial Institutions (Amendment) Act of 2016, which included regulations that allow for branchless “agency banking.”
55%of adults have access to at least one
type of financial services
DEMOGRAPHICS AND FINANCIAL ACCESS
31
UGANDA – ACCESS & TRIAL
Source: InterMedia Uganda FII Tracker survey Wave 4 (N=3,000, 15+), July-August 2016.
Total
Mobile money
Bank
NBFI
37%
35%
48%
47%
47%
45%
4%
4%
7%
5%
7%
5%
Rural (n=2,190)Women (n=1,942)Poor (n=1,680)
2016: Access to financial services(Shown: Percentage of Ugandan adults)
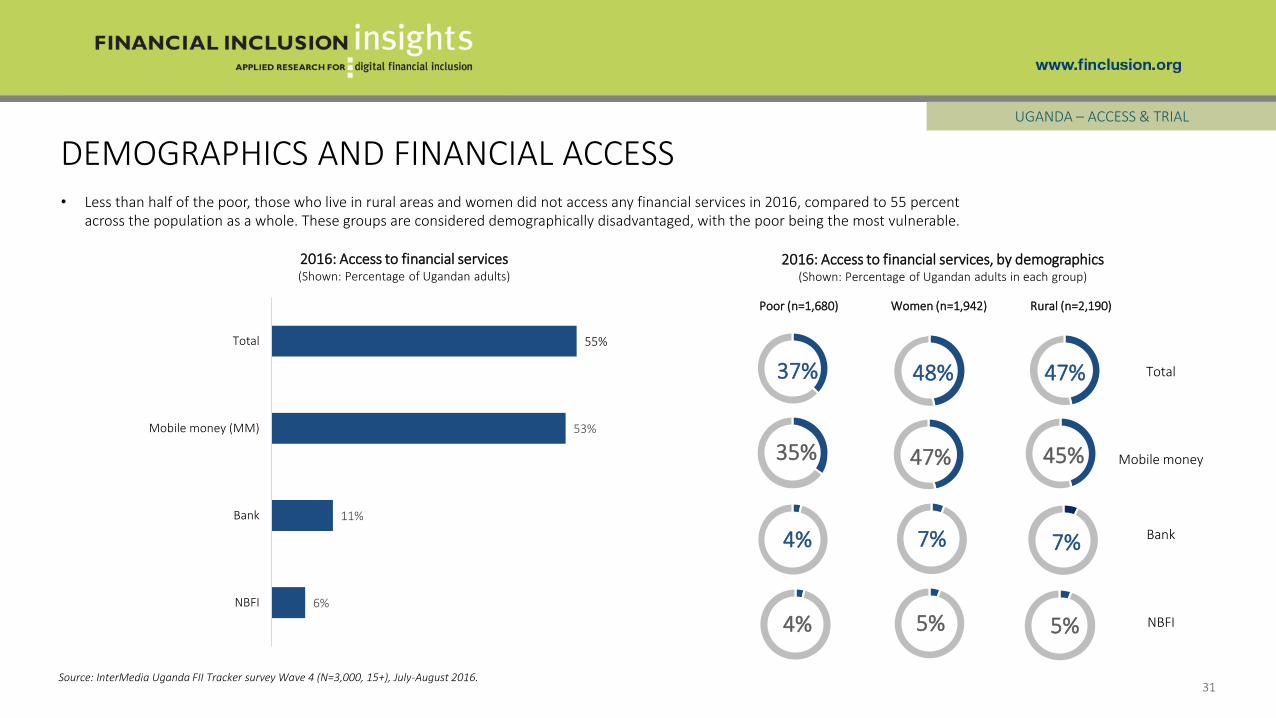
• Less than half of the poor, those who live in rural areas and women did not access any financial services in 2016, compared to 55 percent across the population as a whole. These groups are considered demographically disadvantaged, with the poor being the most vulnerable.
2016: Access to financial services, by demographics(Shown: Percentage of Ugandan adults in each group)
6%
11%
53%
55%
NBFI
Bank
Mobile money (MM)
Total
MOBILE MONEY AWARENESS TO USE
32
UGANDA – ACCESS & TRIAL
Source: InterMedia Uganda FII Tracker surveys Wave 1 (N=3,000, 15+), September-December 2013; Wave 2 (N=3,001, 15+), June-July 2014; Wave 3 (N=3,000, 15+),
July-August 2015; Wave 4 (N=3,000, 15+), July-August 2016.
Conversion from awareness of mobile money providers to mobile money use(Shown: Percentage of Ugandan adults for each year)
91%
2014
33%
91%
2015
35%
92%
2016
38%
92% of Ugandan adults are aware ofmobile money services
Awareness MM registered users MM OTC users
10% 13% 17%
• Awareness remained high but has not changed substantially since 2014.
• Conversion rates from mobile money (MM) awareness to use for both registered and OTC use have steadily increased. Nevertheless, 40% of those who were aware of mobile money did not utilize the services. In 2016, more aware males converted to use than did females.
95% 89%
59%47%
Male Female
2016: Percentage of adults who are aware and use mobile money, by gender
Awareness Use
(n=1,058) (n=1,942)
OVER-THE-COUNTER USE
33
UGANDA – ACCESS & TRIAL
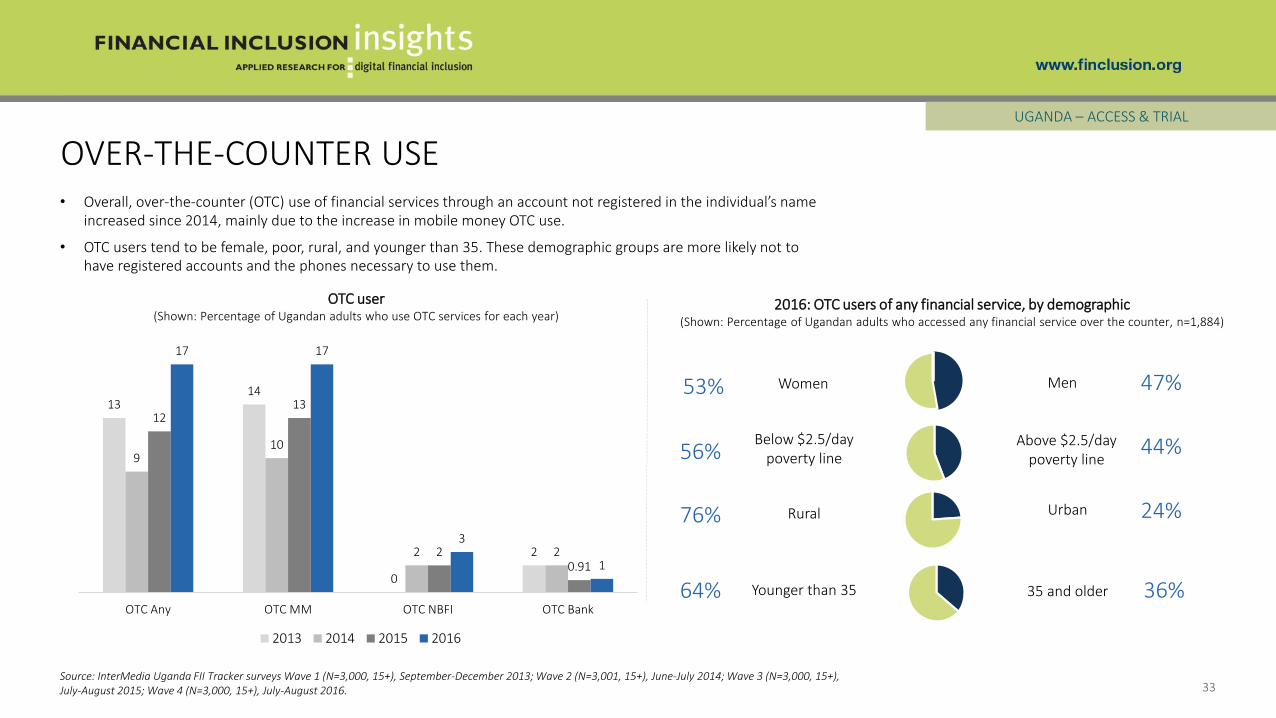
• Overall, over-the-counter (OTC) use of financial services through an account not registered in the individual’s name increased since 2014, mainly due to the increase in mobile money OTC use.
• OTC users tend to be female, poor, rural, and younger than 35. These demographic groups are more likely not to have registered accounts and the phones necessary to use them.
2016: OTC users of any financial service, by demographic(Shown: Percentage of Ugandan adults who accessed any financial service over the counter, n=1,884)
Urban
Above $2.5/day poverty line
Rural
MenWomen
Below $2.5/day poverty line
53%
44%
47%
56%
76% 24%
64% 36%Younger than 35 35 and older
OTC user(Shown: Percentage of Ugandan adults who use OTC services for each year)
1314
0
2
910
2 2
1213
20.91
17 17
3
1
OTC Any OTC MM OTC NBFI OTC Bank
2013 2014 2015 2016
Source: InterMedia Uganda FII Tracker surveys Wave 1 (N=3,000, 15+), September-December 2013; Wave 2 (N=3,001, 15+), June-July 2014; Wave 3 (N=3,000, 15+),July-August 2015; Wave 4 (N=3,000, 15+), July-August 2016.

Registered MM users (n=1,133)
Unregistered MMusers (n=520)
Own a phone 94% 42%
Own a SIM card 97% 46%
Ever sent/received an SMS 82% 49%
Basic literacy 81% 68%
Basic numeracy 99% 97%
34
OTC USE AND MOBILE MONEY READINESSUGANDA – ACCESS & TRIAL
• Registered users are twice as likely to own a mobile phone and SIM card than are unregistered users.
• Eighty-seven percent of unregistered users started using mobile money (MM) services as a result of P2P transactions.
Source: InterMedia Uganda FII Tracker survey Wave 4 (N=3,000, 15+), July-August 2016.
Top reasons for not registering an account(Shown: Percentage of unregistered MM users, n=520)
2016: Top reasons for starting to use mobile money (MM)(Shown: Percentage of unregistered MM users, n=520)
11%I do not have a state ID or other required document
2016: Registered and unregistered mobile money users, by technical skills and equipment ownership
(Shown: Percentage by each subgroup)34%
I had to send money to another person
53%I had to receive money from another person
9%Someone in my family already has an account
8%There is no point of
service/agent close to where I live
8%I never have money to make a transaction with such an
account

REGISTRATION
35
PRECONDITIONS ACCESS & TRIAL REGISTRATION ACTIVE USE ADVANCED ACTIVE USE
UGANDA
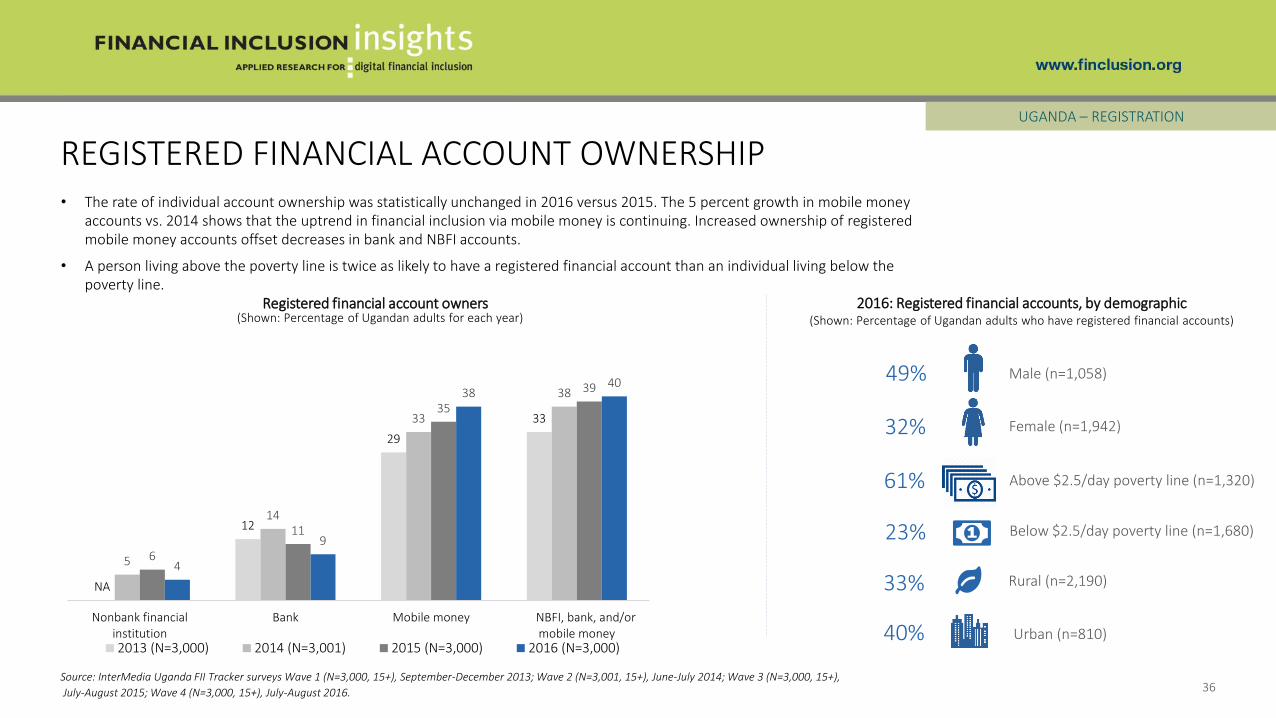
REGISTERED FINANCIAL ACCOUNT OWNERSHIP
36
UGANDA – REGISTRATION
Rural (n=2,190)
Below $2.5/day poverty line (n=1,680)
Urban (n=810)
Female (n=1,942)
Male (n=1,058)
Above $2.5/day poverty line (n=1,320)
49%
23%
32%
61%
40%
33%
2016: Registered financial accounts, by demographic(Shown: Percentage of Ugandan adults who have registered financial accounts)
NA
12
29
33
5
14
33
38
6
11
35
39
4
9
3840
Nonbank financialinstitution
Bank Mobile money NBFI, bank, and/ormobile money
2013 (N=3,000) 2014 (N=3,001) 2015 (N=3,000) 2016 (N=3,000)
Registered financial account owners(Shown: Percentage of Ugandan adults for each year)
Source: InterMedia Uganda FII Tracker surveys Wave 1 (N=3,000, 15+), September-December 2013; Wave 2 (N=3,001, 15+), June-July 2014; Wave 3 (N=3,000, 15+),
July-August 2015; Wave 4 (N=3,000, 15+), July-August 2016.
• The rate of individual account ownership was statistically unchanged in 2016 versus 2015. The 5 percent growth in mobile money accounts vs. 2014 shows that the uptrend in financial inclusion via mobile money is continuing. Increased ownership of registered mobile money accounts offset decreases in bank and NBFI accounts.
• A person living above the poverty line is twice as likely to have a registered financial account than an individual living below the poverty line.
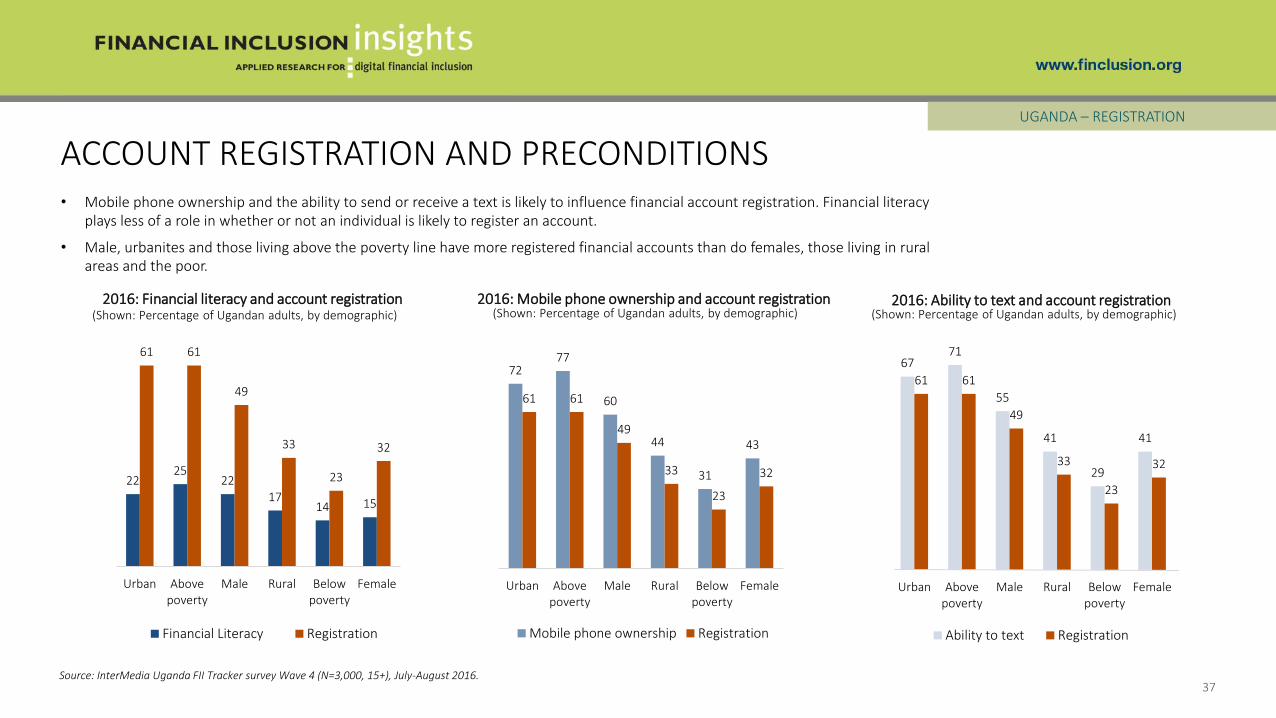
ACCOUNT REGISTRATION AND PRECONDITIONS
37
UGANDA – REGISTRATION
Source: InterMedia Uganda FII Tracker survey Wave 4 (N=3,000, 15+), July-August 2016.
2225
2217
14 15
61 61
49
33
23
32
Urban Abovepoverty
Male Rural Belowpoverty
Female
Financial Literacy Registration
2016: Financial literacy and account registration 2016: Mobile phone ownership and account registration 2016: Ability to text and account registration(Shown: Percentage of Ugandan adults, by demographic) (Shown: Percentage of Ugandan adults, by demographic) (Shown: Percentage of Ugandan adults, by demographic)
• Mobile phone ownership and the ability to send or receive a text is likely to influence financial account registration. Financial literacy plays less of a role in whether or not an individual is likely to register an account.
• Male, urbanites and those living above the poverty line have more registered financial accounts than do females, those living in rural areas and the poor.
7277
60
44
31
43
61 61
49
33
23
32
Urban Abovepoverty
Male Rural Belowpoverty
Female
Mobile phone ownership Registration
6771
55
41
29
41
61 61
49
33
23
32
Urban Abovepoverty
Male Rural Belowpoverty
Female
Ability to text Registration

• The majority of bank and mobile money nonusers perceived the lack of money as a barrier to opening an account. This is due to nonusers’ assumptions that both of these services have high account registration and transaction fees.
• There are no major gender-based differences in why nonusers do not open accounts.
TOP REASONS FOR NOT REGISTERING ACCOUNTS
38
UGANDA – REGISTRATION
Source: InterMedia Uganda FII Tracker survey Wave 4 (N=3,000, 15+), July-August 2016.
2016: Reasons for not registering a bank account(Shown: Percentage of Ugandan adults who do not have bank accounts, by gender)
2016: Reasons for not registering a mobile money account(Shown: Percentage of Ugandan adults who never use mobile money services, by gender)
1
2
4
5
12
1
3
6
6
14
There is no point-of-service/agent closeto where I live
I do not know what it is/I do notunderstand what I can use it for
I do not know how to use the services
I do not need one, I do not make anytransactions
I do not have money/I do not havemoney to make any transactions with
such an account
Women (N=1,942) Men (N=1,058)
*Questions allowed for multiple responses
3
4
3
5
52
3
4
3
5
61
I do not know what it is
There no banks close to where I live
I do not need one, I do not make anytransactions
I do not know how to open one
I do not have money/I do not havemoney to make any transactions with
such an account
Women (N=1,942) Men (N=1,058)
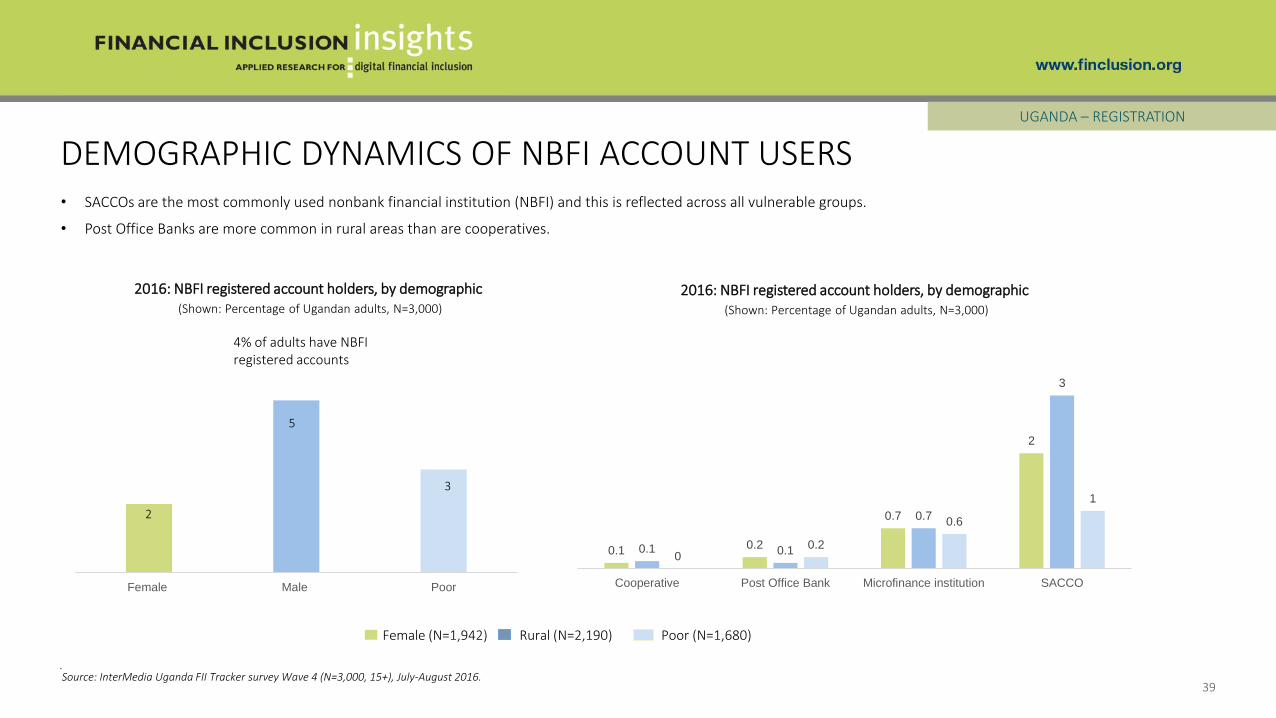
DEMOGRAPHIC DYNAMICS OF NBFI ACCOUNT USERS
39
UGANDA – REGISTRATION
.
• SACCOs are the most commonly used nonbank financial institution (NBFI) and this is reflected across all vulnerable groups.
• Post Office Banks are more common in rural areas than are cooperatives.
Source: InterMedia Uganda FII Tracker survey Wave 4 (N=3,000, 15+), July-August 2016.
Female Male Poor
3
5
2
4% of adults have NBFI registered accounts
2016: NBFI registered account holders, by demographic(Shown: Percentage of Ugandan adults, N=3,000)
2016: NBFI registered account holders, by demographic(Shown: Percentage of Ugandan adults, N=3,000)
Female (N=1,942) Rural (N=2,190) Poor (N=1,680)
0.10.2
0.7
2
0.1 0.1
0.7
3
00.2
0.6
1
Cooperative Post Office Bank Microfinance institution SACCO
ACTIVE USE
40
PRECONDITIONS ACCESS & TRIAL REGISTRATION ACTIVE USE ADVANCED ACTIVE USE
UGANDA
ACTIVE USE
41
UGANDA – ACTIVE USE
Source: InterMedia Uganda FII Tracker surveys Wave 1 (N=3,000, 15+), September-December 2013; Wave 2 (N=3,001, 15+), June-July 2014; Wave 3 (N=3,000, 15+),July-August 2015; Wave 4 (N=3,000, 15+), July-August 2016.
10
26
30
4
11
29
34
5
9
3134
3
7
32 33
Nonbank financialinstitution
Bank Mobile money NBFI, bank, and/ormobile money
2013 (N=3,000) 2014 (N=3,001) 2015 (N=3,000) 2016 (N=3,000)
N/A
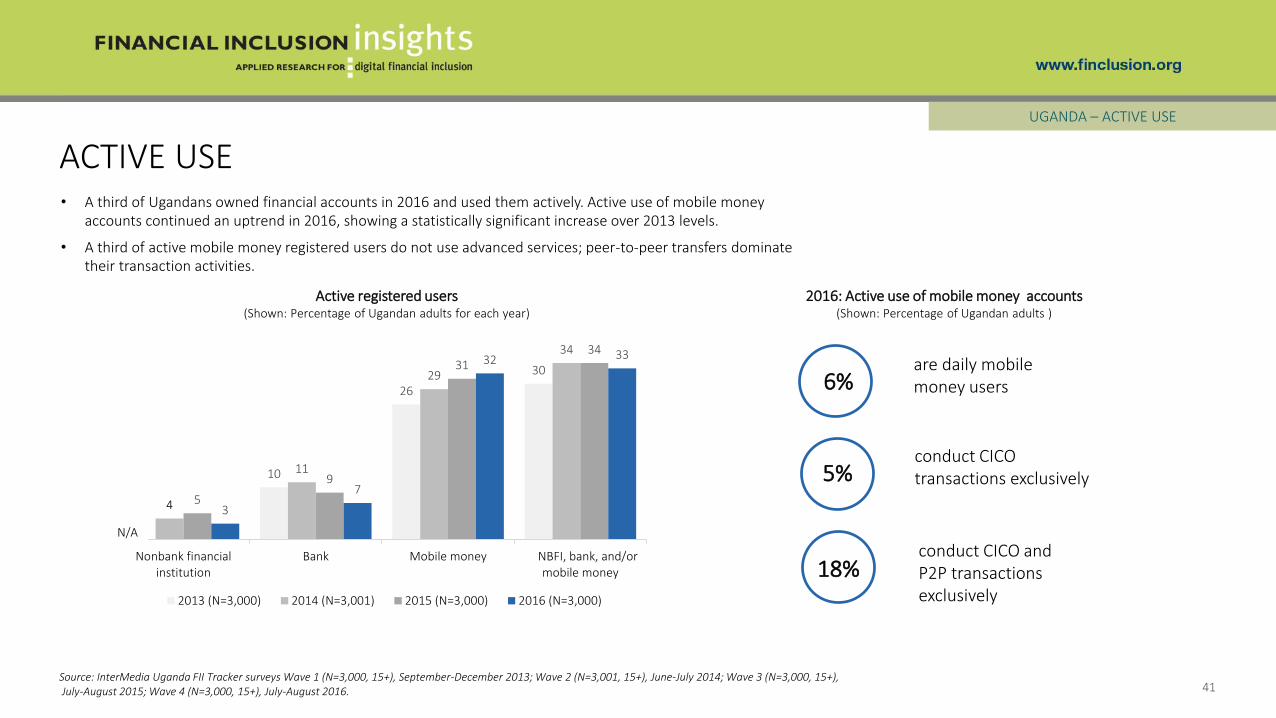
are daily mobile money users6%
conduct CICO transactions exclusively5%
conduct CICO and P2P transactions exclusively
18%
• A third of Ugandans owned financial accounts in 2016 and used them actively. Active use of mobile money accounts continued an uptrend in 2016, showing a statistically significant increase over 2013 levels.
• A third of active mobile money registered users do not use advanced services; peer-to-peer transfers dominate their transaction activities.
Active registered users(Shown: Percentage of Ugandan adults for each year)
2016: Active use of mobile money accounts (Shown: Percentage of Ugandan adults )
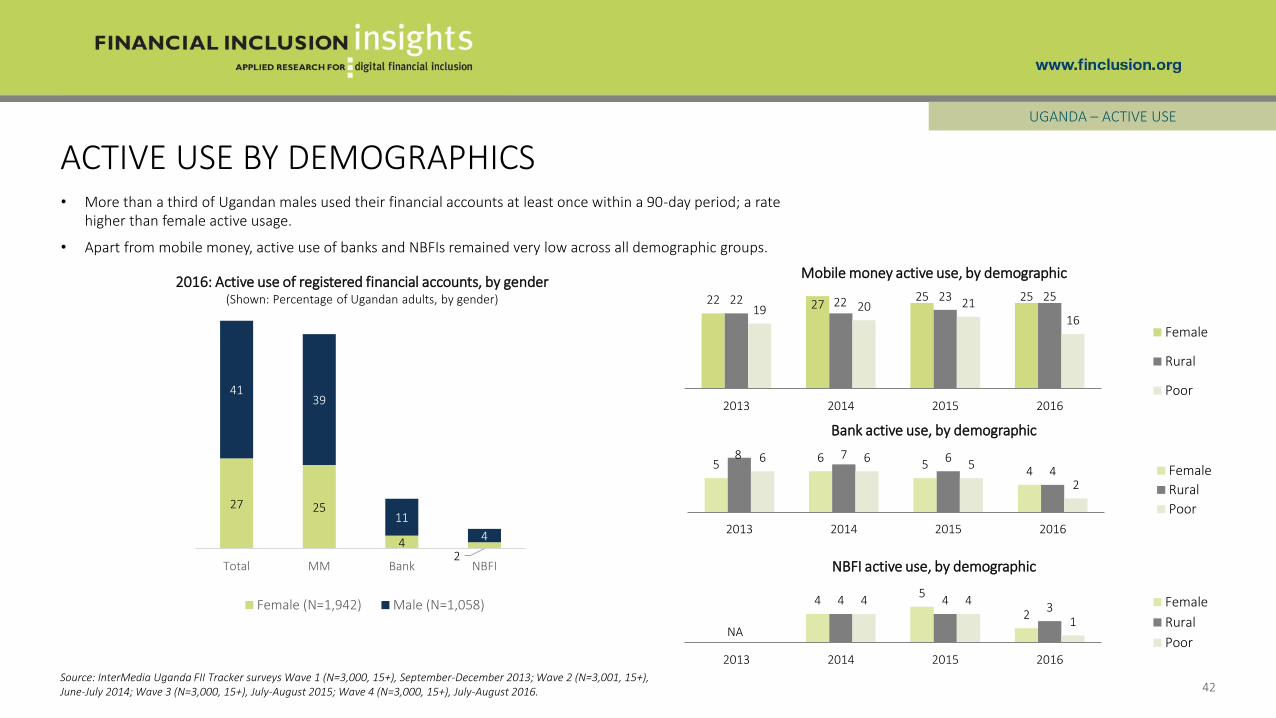
• More than a third of Ugandan males used their financial accounts at least once within a 90-day period; a rate higher than female active usage.
• Apart from mobile money, active use of banks and NBFIs remained very low across all demographic groups.
27 25
42
4139
11
4
Total MM Bank NBFI
Female (N=1,942) Male (N=1,058) 45
24 4
34 4
1
2013 2014 2015 2016
Female
Rural
PoorNA
ACTIVE USE BY DEMOGRAPHICS
42
UGANDA – ACTIVE USE
Source: InterMedia Uganda FII Tracker surveys Wave 1 (N=3,000, 15+), September-December 2013; Wave 2 (N=3,001, 15+),June-July 2014; Wave 3 (N=3,000, 15+), July-August 2015; Wave 4 (N=3,000, 15+), July-August 2016.
Bank active use, by demographic
Mobile money active use, by demographic
NBFI active use, by demographic
2016: Active use of registered financial accounts, by gender(Shown: Percentage of Ugandan adults, by gender)
56
54
8 7 64
6 65
2
2013 2014 2015 2016
Female
Rural
Poor
22 2725 2522 22 23 25
19 20 21
16
2013 2014 2015 2016
Female
Rural
Poor

ADVANCED ACTIVE USE
43
PRECONDITIONS ACCESS & TRIAL REGISTRATION ACTIVE USE ADVANCED ACTIVE USE
UGANDA
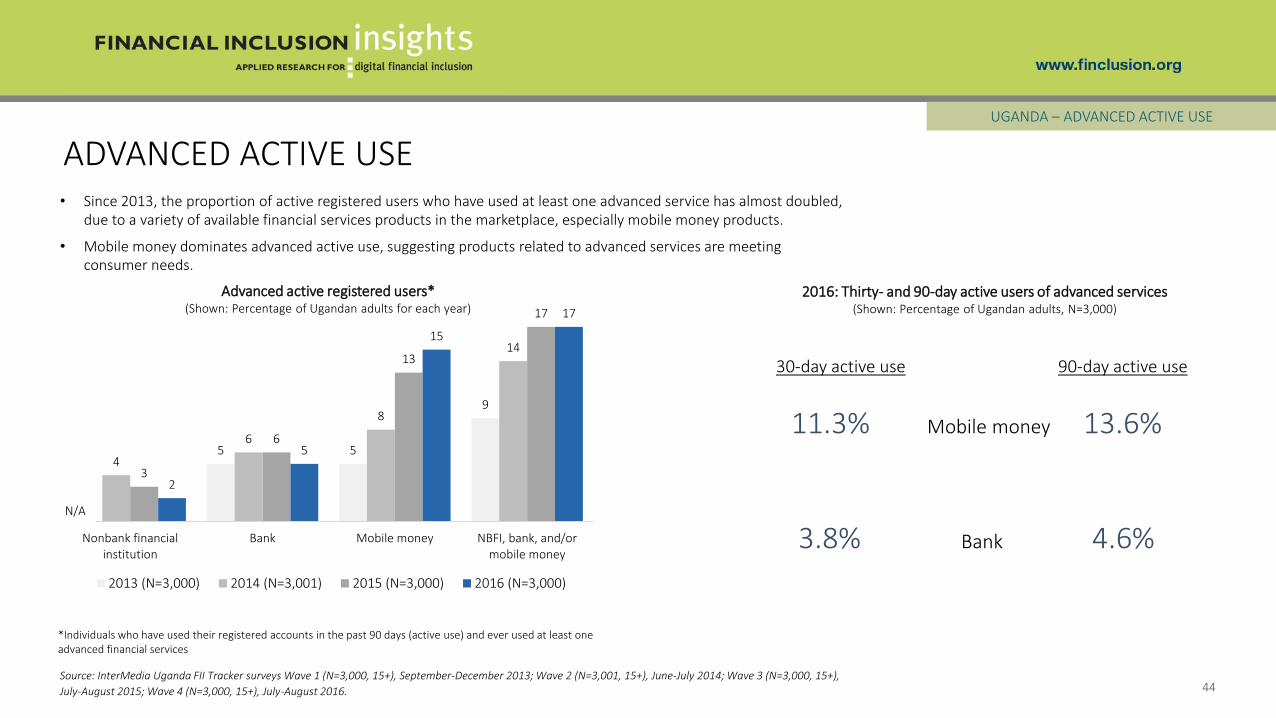
• Since 2013, the proportion of active registered users who have used at least one advanced service has almost doubled, due to a variety of available financial services products in the marketplace, especially mobile money products.
• Mobile money dominates advanced active use, suggesting products related to advanced services are meeting consumer needs.
ADVANCED ACTIVE USE
44
UGANDA – ADVANCED ACTIVE USE
5 5
9
4
6
8
14
3
6
13
17
2
5
15
17
Nonbank financialinstitution
Bank Mobile money NBFI, bank, and/ormobile money
2013 (N=3,000) 2014 (N=3,001) 2015 (N=3,000) 2016 (N=3,000)
Advanced active registered users*(Shown: Percentage of Ugandan adults for each year)
N/A
Source: InterMedia Uganda FII Tracker surveys Wave 1 (N=3,000, 15+), September-December 2013; Wave 2 (N=3,001, 15+), June-July 2014; Wave 3 (N=3,000, 15+),
July-August 2015; Wave 4 (N=3,000, 15+), July-August 2016.
*Individuals who have used their registered accounts in the past 90 days (active use) and ever used at least one advanced financial services
2016: Thirty- and 90-day active users of advanced services(Shown: Percentage of Ugandan adults, N=3,000)
30-day active use 90-day active use
11.3% Mobile money 13.6%
3.8% Bank 4.6%
SPECIAL TOPIC: FINANCIAL LIVES
UGANDA
45

46
SOURCES OF INCOMEUGANDA – FINANCIAL LIVES
• Close to seven in 10 adults said they have an income. The majority of those who are poor, male and living in rural areas also had regular incomes.
• Agriculture is the largest sector of the economy, employing more than half of working adults.
18%housewife/househusband
or student
4% unemployed, seeking jobs
3% retired or disabled
6%not declared, other
68%Gainfully employed
Source: InterMedia Uganda FII Tracker survey Wave 4 (N=3,000, 15+), July-August 2016.
2016: Sources of income(Shown: Percentage of Ugandan adults)
47
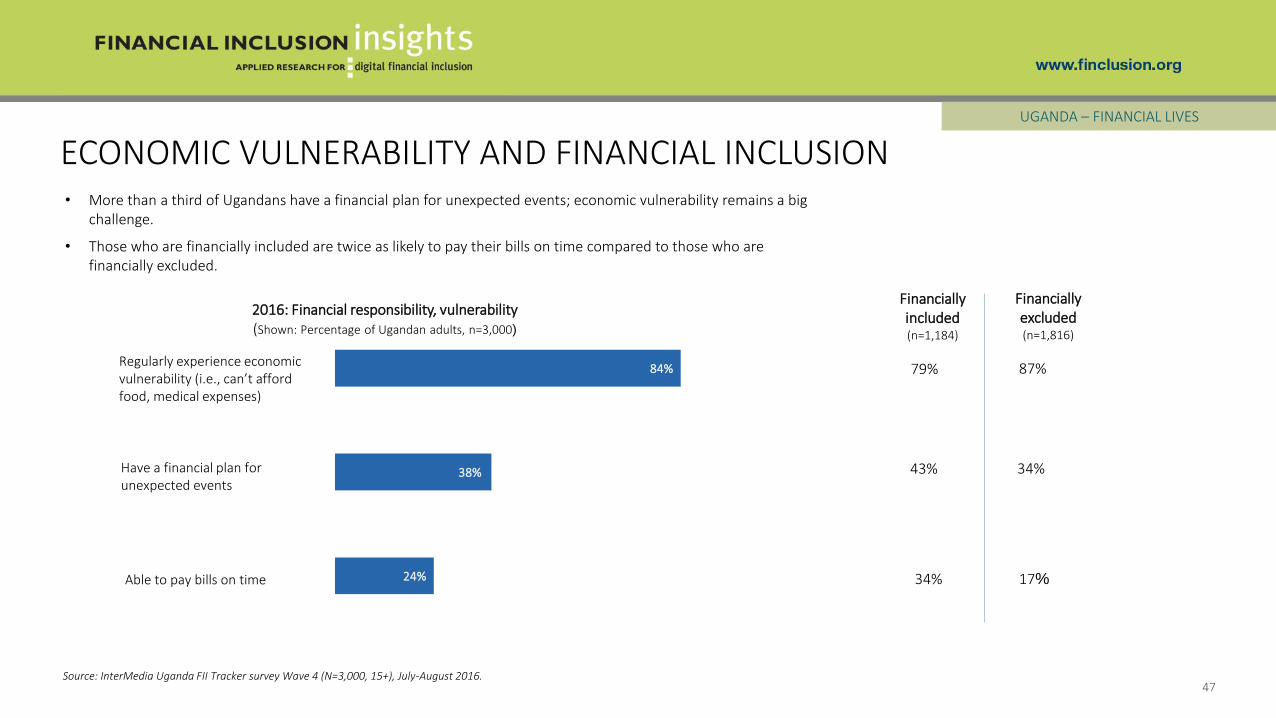
ECONOMIC VULNERABILITY AND FINANCIAL INCLUSIONUGANDA – FINANCIAL LIVES
• More than a third of Ugandans have a financial plan for unexpected events; economic vulnerability remains a big challenge.
• Those who are financially included are twice as likely to pay their bills on time compared to those who are financially excluded.
Source: InterMedia Uganda FII Tracker survey Wave 4 (N=3,000, 15+), July-August 2016.
Able to pay bills on time
Regularly experience economic vulnerability (i.e., can’t afford food, medical expenses)
Have a financial plan for unexpected events
24%
38%
84%
2016: Financial responsibility, vulnerability(Shown: Percentage of Ugandan adults, n=3,000)
Financially included(n=1,184)
Financially excluded(n=1,816)
43% 34%
34% 17%
79% 87%

48
ECONOMIC VULNERABILITYUGANDA – FINANCIAL LIVES
• Over four in five Ugandans experience economic vulnerability.
• Foregoing medical help is the most common form of vulnerability.
Source: InterMedia Uganda FII Tracker survey Wave 4 (N=3,000, 15+), July-August 2016.
84%Regularly experience some
form of economic vulnerability
2016: Economic vulnerability(Shown: Percentage of Ugandan adults, n=3,000)
Form of economic vulnerability (Shown: Percentage of vulnerable adults, n=2,534) %
Needed a doctor but delayed or went without 69
Gone without food 54
Miss an important family event
(i.e., funeral, wedding, etc.) 52
Couldn’t pay school fees 48
Gone without cooking fuel 36
Gone without fertilizer for the farm 25
Gone without help from a veterinarian 22
Had to close down business temporarily or completely 19
49
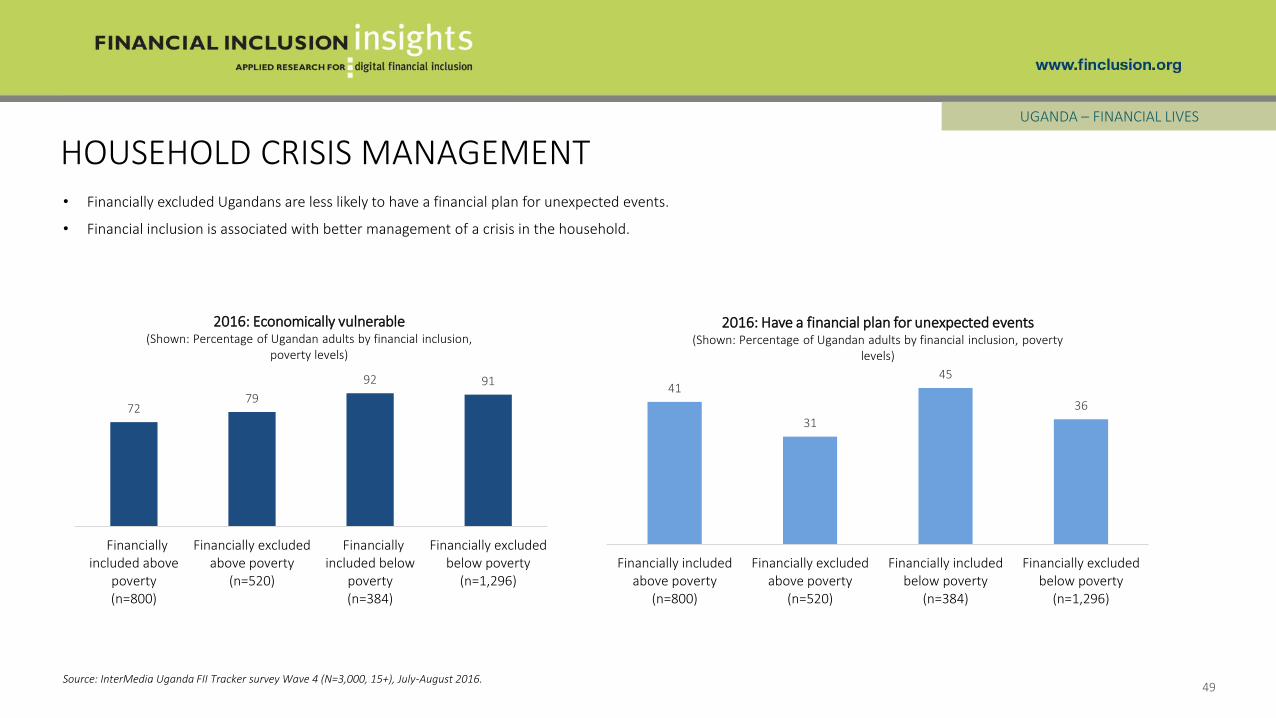
HOUSEHOLD CRISIS MANAGEMENTUGANDA – FINANCIAL LIVES
• Financially excluded Ugandans are less likely to have a financial plan for unexpected events.
• Financial inclusion is associated with better management of a crisis in the household.
Source: InterMedia Uganda FII Tracker survey Wave 4 (N=3,000, 15+), July-August 2016.
7279
92 91
Financiallyincluded above
poverty(n=800)
Financially excludedabove poverty
(n=520)
Financiallyincluded below
poverty(n=384)
Financially excludedbelow poverty
(n=1,296)
2016: Economically vulnerable(Shown: Percentage of Ugandan adults by financial inclusion,
poverty levels)
41
31
45
36
Financially includedabove poverty
(n=800)
Financially excludedabove poverty
(n=520)
Financially includedbelow poverty
(n=384)
Financially excludedbelow poverty
(n=1,296)
2016: Have a financial plan for unexpected events(Shown: Percentage of Ugandan adults by financial inclusion, poverty
levels)

KEY INDICATORS SUMMARY
UGANDA
50
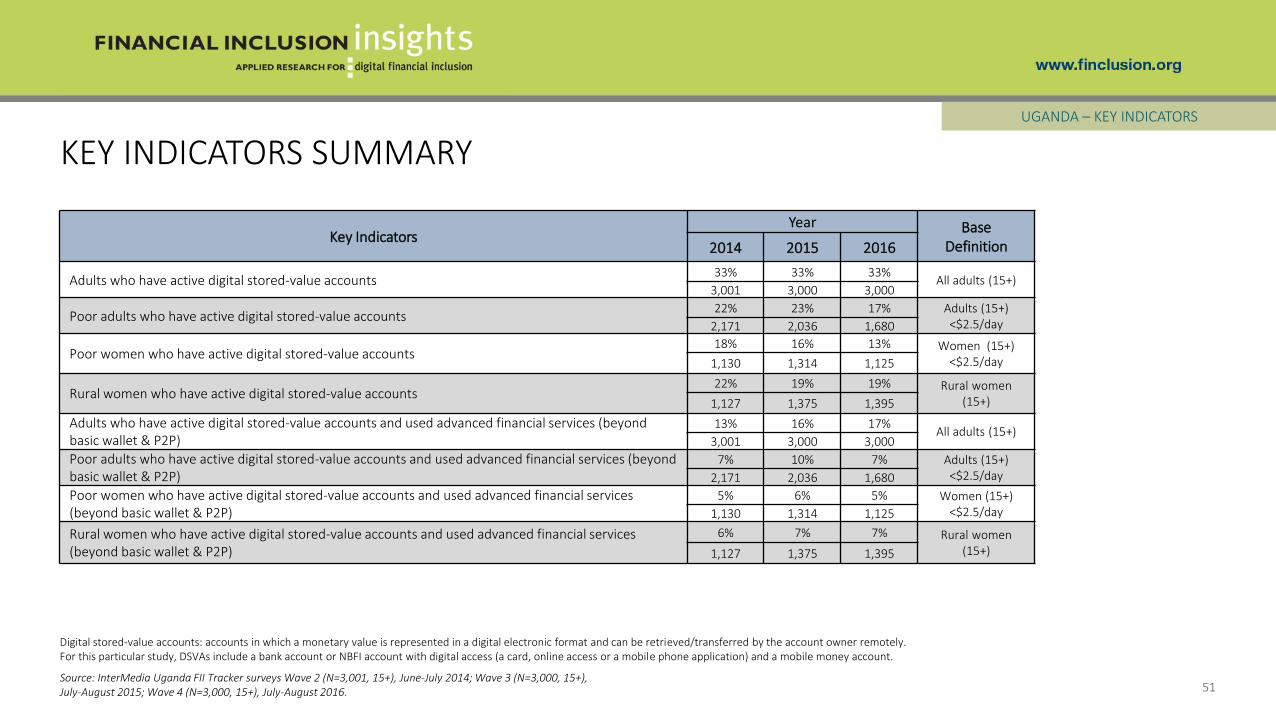
51Source: InterMedia Uganda FII Tracker surveys Wave 2 (N=3,001, 15+), June-July 2014; Wave 3 (N=3,000, 15+), July-August 2015; Wave 4 (N=3,000, 15+), July-August 2016.
Key IndicatorsYear Base
Definition2014 2015 2016
Adults who have active digital stored-value accounts33% 33% 33%
All adults (15+)3,001 3,000 3,000
Poor adults who have active digital stored-value accounts22% 23% 17% Adults (15+)
<$2.5/day2,171 2,036 1,680
Poor women who have active digital stored-value accounts18% 16% 13% Women (15+)
<$2.5/day1,130 1,314 1,125
Rural women who have active digital stored-value accounts 22% 19% 19% Rural women
(15+)1,127 1,375 1,395
Adults who have active digital stored-value accounts and used advanced financial services (beyond basic wallet & P2P)
13% 16% 17%All adults (15+)
3,001 3,000 3,000
Poor adults who have active digital stored-value accounts and used advanced financial services (beyond basic wallet & P2P)
7% 10% 7% Adults (15+) <$2.5/day2,171 2,036 1,680
Poor women who have active digital stored-value accounts and used advanced financial services (beyond basic wallet & P2P)
5% 6% 5% Women (15+) <$2.5/day1,130 1,314 1,125
Rural women who have active digital stored-value accounts and used advanced financial services (beyond basic wallet & P2P)
6% 7% 7% Rural women (15+)1,127 1,375 1,395
Digital stored-value accounts: accounts in which a monetary value is represented in a digital electronic format and can be retrieved/transferred by the account owner remotely. For this particular study, DSVAs include a bank account or NBFI account with digital access (a card, online access or a mobile phone application) and a mobile money account.
KEY INDICATORS SUMMARYUGANDA – KEY INDICATORS
METHODOLOGY & RESEARCH DESCRIPTION
52
UGANDA

SURVEY SUMMARY
• Annual, nationally representative survey (N=3,000) of Ugandans adults aged 15+
• Face-to-face interviews lasting, on average, 80 minutes
• Fourth survey (Wave 4) conducted from 7/25/2016 to 8/31/2016
• Tracks trends and market developments in DFS based on the information gathered in the first survey, conducted in 2013, second survey, conducted in 2014 and third survey, conducted in 2015
DATA COLLECTION
• Basic demographics and poverty measurement (Grameen Progress Out of Poverty Index)
• Access/use of mobile devices
• Access/use of mobile money
• Access/use of formal financial services (e.g., bank accounts)
• Access/use of semi-formal and informal financial services (e.g., MFIs, cooperatives, village savings groups)
• Financial literacy and preparedness
• General financial behaviors
FII UGANDA TRACKER SURVEY DETAILS
53
UGANDA – METHODOLOGY & RESEARCH
Source: InterMedia Uganda FII Tracker survey Wave 4 (N=3,000, 15+), July-August 2016.

GLOSSARYAccess to banks – Counts individuals who have a full-service bank account registered in their name or report use of a full-service bank account that belongs to someone else.
Access to mobile money or an NBFI – Counts individuals who have ever used a mobile money service or a full-service NBFI account.
Active registered user – An individual who has an account registered in their name and has used it in the last 90 days.
Adults with DFS access – Adults (15+) who either own a DFS account or have access to someone else’s account.
Advanced active registered user – An active registered user who has ever used at least one advanced financial service.
Advanced DFS use – Advanced use of digital financial services includes activities other than basic cash-in, cash-out and person-to-person transfers, such as savings, bill pay, investment, and insurance.
Basic use – The use of an account to cash-in (deposit) or cash-out (withdraw), transfer money to another individual, or conduct account maintenance.
Below the poverty line – In this particular study, adults living on less than $2.50 per day, as classified by the Grameen Foundation’s Progress out of Poverty Index.
Cooperative – Typically, a business or other professional organization that is owned and run jointly by its members, who share profits or benefits. Cooperatives may release some of the profits/funds as loans to its members.
Customer journey – An illustration of progressive stages through which consumers become more active users of more sophisticated financial services.
Credit-only nonbank financial institutions – Financial institutions that only disburse loans to their customers.
Digital financial services (DFS) – Financial services provided through an electronic platform (e.g., mobile phones, debit or credit electronic cards, internet).
Financial inclusion – Individuals who have an account with an institution that provides a full suite of financial services and comes under some form of government regulation. Services include savings, money transfers, insurance or investment. Institutions that only offer loans to consumers, such as some MFIs, are not considered to be full-service institutions.
Financial literacy – Basic knowledge of four fundamental concepts in financial decision-making (interest rates, interest compounding, inflation, and risk diversification) as measured by the Standard and Poor’s Rating Service’s Global Financial Literacy Survey.
Full-service financial institutions – Financial institutions that offer loans to their customers and at least one of the followingadditional services: savings, money transfers, insurance, or investments.
Grameen Progress out of Poverty Index (PPI) – A poverty measurement tool from the Grameen Foundation wherein a set of country-specific questions are used to compute the likelihood that a household is living below a specific income threshold.
Microfinance institution (MFI) – An organization that offers financial services to low-income populations. Almost all give loans to their members, and many offer insurance, deposit and other services.
Mobile money (MM) – A service in which a mobile phone is used to access financial services.
Nonbank financial institution (NBFI) – A financial organization that is not formally licensed as a bank or a mobile money provider, but whose activities are regulated, at least to some extent, by the central bank within the country. Such financial institutions include microfinance institutions (MFI), cooperatives, Post Office (Savings) Banks and savings and credit cooperatives (SACCOs).
Numeracy – The ability to use basic math skills, including counting, addition, division, multiplication and computing short-and long-term interest rates.
Post Office (Savings) Bank – A bank that offers savings and money transfers and has branches at local post offices.
Registered user – Counts individuals who have a financial account registered in their name.
Savings and credit cooperative (SACCO) – A unique member-driven, self-help group owned and managed by its members, who have a common bond. Its main purpose is to build up funds through regular contributions by each member, with the aim of providing affordable credit and collective investments to its members.
Unregistered/over-the-counter (OTC) user – An individual who has used DFS through someone else’s account, including a mobile money agent’s account or the account of a family member or a neighbor.
Urban/rural – Urban and rural persons are defined according to their residence in urban or rural areas as prescribed by the national bureau of statistics.
54
TANZANIA

For more information, contact:
Lucy Kaaria, Senior Research Associate, Africa [email protected]
Samuel Schueth, Director of Research [email protected]