uir.unisa.ac.zauir.unisa.ac.za/bitstream/handle/10500/3532/dissertation_stretch_l.pdf · i...
TRANSCRIPT

i
DECLARATION
I declare that, „The effects of cognitive stimulation in the development of Mathematics,
Literacy and Life-skills concepts in early childhood‟ is my own work, that it has not been
submitted for any degree or examination in any other university, and that all the sources I
have used or quoted have been indicated and acknowledged by complete references.
Lauren Stretch November 2009
Signed ..............................................................
ii
ACKNOWLEDGEMENTS
I wish to extend my sincere appreciation to the following people for their assistance and
support during the duration of this study:
My supervisor, Prof. M.W De Witt, for her tremendous patience, guidance,
supervision and encouragement during this study.
The principals, educators, parents and participants at the Early Childhood Centres for
their willingness to co-operate, as well as their enthusiastic interest in this study.
Mr Danie Venter for helping me with the vital statistics needed for this study.
My dad, Richard Stretch, for the many hours he spent reviewing, correcting and
assisting me in constructing a legible document, and for always encouraging me to
keep going.
To my family and friends for their support and encouragement.
iii
ABSTRACT
THE EFFECTS OF COGNITIVE STIMULATION IN THE DEVELOPMENT OF
MATHEMATICS, LITERACY AND LIFE-SKILLS CONCEPTS IN EARLY
CHILDHOOD
By: L.K. Stretch
Degree: Master of Education
University of South Africa
Subject: Psychology of Education
Supervisor: M.W De Witt
Summary
This study was conducted in order to assess the effects of cognitive stimulation in early
childhood. The quantitative study set out to test a target group of 40 children, ranging in age
from two years to three and a half years, in order to determine the importance of stimulation
and intervention from a young age. A pre-test evaluated the initial level of each child‟s
cognitive abilities (mathematics, literacy and life skills). This was followed by a random
selection of the subjects into experimental and control groups.
The experimental group underwent an eight-week intervention programme which focused on
the primary concepts in each area of cognitive development. The control and experimental
groups continued with their normal school learning programmes.
The results indicate that the impact of stimulation on young children is significant and there
is a great difference in the abilities and understanding of concepts for those children which
were stimulated individually, as compared with those children who were not so stimulated.

iv
THE EFFECTS OF COGNITIVE STIMULATION IN THE DEVELOPMENT OF
MATHEMATICS, LITERACY AND LIFE-SKILL CONCEPTS IN EARLY
CHILDHOOD
Key Words:
Cognitive development
Stimulation
Mathematics
Literacy
Life skills
Concepts
Early childhood
Early childhood development
Education
Parental stimulation

v
Cognitive development
According to Woolfolk (2007: p22), Cognitive development refers to changes in thinking. It
comprises the „gradual orderly changes by which mental processes become more complex
and sophisticated‟.
Stimulation
Stimulation refers to different concepts and exercises that one can do with children, in order
to enhance their abilities and understanding. It involves time and effort, and is a long-term
and an ongoing process (http://extension.oregonstate.edu/catalog/pdf/ec/ec1301-e.pdf,
23/07/08).
Mathematics
Mathematical concepts are those which need to be developed in order to take part in day-to-
day activities. Mathematical concepts are in the world around us, and children need to
develop an understanding of these concepts and to be able to manipulate and effectively work
with them (Metlina, 1991: p1-2).
Literacy
The development of language concepts is a process that begins very early in life. Humans are
constantly communicating with one another and language development often results when
children experiment with language in the world around them (http://en.wikipedia.org/wiki/
Language_development, 15/03/2009).
Life skills
Life skills prepare and equip the child to deal with day-to-day challenges. They educate the
child as to how one should act and react. Life skills teach morals and values, and also
represent the psycho-social skills which develop reflective skills, such as problem-solving
and critical thinking. They also assist in the development of self-awareness and they help to
enhance positive self-esteem and self-actualization, sociability and the ability of children to
deal with other people.

vi
Concepts
According to Woolfolk (2007: p286), the definition of a concept comprises a „general
category of ideas, objects, people, or experiences whose members share certain properties‟.
Early childhood
According to Gordon and Browne (2008: p8), early childhood refers to the period from birth
to eight years old. For the purpose of this study, early childhood will refer to children in the
age gap from conception to five years old.
Early childhood development
The early years of a child‟s life are years of rapid development and change (De Witt and
Booysen, 2009: p10). According to McAfee and Leong (2007: p36), there are various facets
of a child‟s early development, namely the physical, emotional, social, cognitive, normative
and also the spiritual aspects of development.
Education
Education, according to Ornstein and Hunkins (2004: p273), is the process whereby children
can gain competencies which enable them to be effective citizens in an ever-changing
society. Education equips children through the provision of knowledge, skills, attitudes and
values.
Parental stimulation
The role that parents play in their child‟s development is monumentous and has great
implications on the child‟s totality, including his/her cognitive, physical, emotional, social
and spiritual development (De Witt, 2009: p106). Awareness needs to be raised regarding the
importance of parental involvement and interest. Very often the parents‟ role in stimulation is
not seen as important, but research has shown that there is a clear and long-lasting benefit to
be derived from parental involvement in the education system (Eliason, et al., 2004: p49).
vii
TABLE OF CONTENTS
Page
DECLARATION BY STUDENT i
ACKNOWLEDGEMENTS ii
ABSTRACT iii
KEY WORDS iv
TABLE OF CONTENTS viii
LIST OF TABLES xv
LIST OF FIGURES xvii
CHAPTER 1
INTRODUCTORY ORIENTATION 1
1.1 BACKGROUND 1
1.2 PROBLEM ANALYSIS 3
1.2.1 Exposition of the problem 4
1.2.2 Preliminary exploration of the problem 7
1.2.3 Research question 8
1.2.4 Aim of study 9
1.3 DEFINITIONS AND EXPLANATION OF IMPORTANT CONCEPTS 9
1.3.1 Early childhood 10
1.3.2 Stimulation 1-
1.3.3 Mathematical development 10
1.3.4 Language development 10
1.3.5 Life-skills development 11
1.3.6 Cognitive development 11
viii
1.4 RESEARCH DESIGN AND METHOD 11
1.4.1 Literature study 12
1.4.2 Empirical research 13
1.4.3 Research design and methodology 13
1.4.3.1 Ethical method 14
1.4.4 Reliability 14
1.4.5 Method 15
1.5. DEMARCATION OF THE STUDY 16
1.6 THE RESEARCH LAYOUT 16
1.7. SUMMARY AND CONCLUSION 17
CHAPTER 2
REVIEW OF RELATED LITERATURE 18
2.1 FRAMEWORK BEHIND STUDY 18
2.1.1 Historical framework 18
2.2 BASIC DEVELOPMENTAL LEVELS 18
2.3 INTELLIGENCE 21
2.4 COGNITIVE DEVELOPMENT 22
2.5 DEVELOPMENT OF THE BRAIN 23
2.6 GIFTEDNESS 27
2.7 EARLY MATHEMATICS 28
2.8 WHAT EARLY NUMERACY AND MATHEMATICS ENTAIL 32
2.9 THE DIFFERENCE BETWEEN ARITHMETIC AND MATHEMATICS 34
2.9.1 Mathematics 34
2.9.2 Arithmetic 34
2.10 ELEMENTS OF EARLY NUMERACY 34
2.10.1 Counting 35
2.10.2 Classification 36
Page
ix
2.10.3 One-to-one correspondence 37
2.10.4 Sequencing and seriation 38
2.10.5 Geometry 39
2.11 THE PROMOTION OF MATHEMATICAL KNOWLEDGE, PROCESSES
AND STRATEGIES 39
2.12 EARLY LITERACY 41
2.13 THE DEVELOPMENT OF EARLY LANGUAGE 44
2.14 THE DIFFERENCE BETWEEN LANGUAGE AND LITERACY 45
2.14.1 Language 45
2.14.2 Literacy 46
2.15 ELEMENTS OF EARLY LANGUAGE AND LITERACY
DEVELOPMENT 46
2.15.1 Vocabulary 47
2.15.2 Oral language (speech and listening) 47
2.15.3 Reading 48
2.15.4 Writing 49
2.16 CREATING A LITERACY-RICH ENVIRONMENT 51
2.16.1 The physical arrangement of classroom 51
2.16.2 Materials 52
2.16.3 Daily schedule and routine activities 52
2.16.4 Continuous assessment 52
2.16.5 Culturally sensitive and integrated curriculum 53
2.16.6 Developmentally appropriate curriculum 53
2.17 LIFE-SKILLS DEVELOPMENT 53
2.18 THE IMPORTANCE OF TEACHING CONCEPTS TO THE
YOUNG CHILD 56
2.18.1 The child‟s cognitive development 57
Page

x
2.18.2 Language and cognitive development 57
2.19 LACK OF STIMULATION 58
2.20 THE TEACHER’S ROLE IN STIMULATION 59
2.21 THE IMPORTANCE OF PARENTAL INVOLVEMENT 64
2.22 PROBLEM AREAS BETWEEN PARENTS AND TEACHERS 67
2.23 SUGGESTIONS ON HOW TO ENHANCE PARENTAL INVOLVEMENT
IN THE SCHOOL OR COMMUNITY 68
2.24 CONCLUDING REMARKS 70
CHAPTER 3
THE THEORETICAL FRAMEWORK 72
3.1 INTRODUCTION 72
3.2 CONCEPTUAL METHOD 72
3.3 THEORIES AND MODELS 73
3.3.1 Psychodynamic theory 73
3.3.2 Behaviorist theory 75
3.3.3 Constructivist theory 76
3.3.3.1 Dewey 77
3.3.3.2 Piaget 77
3.3.3.3 Montessori 80
3.3.4 Sociocultural theory 81
3.3.5 Ecological theory 82
3.3.6 Multiple-intelligences theory 83
3.3.7 Maturation theory 85
3.3.8 Humanistic theory 85
3.3.9 Environmentalist theory 85
Page

xi
3.4 THEORIES, METHODS AND MODELS USED IN THIS STUDY 85
3.4.1 John Dewey 85
3.4.2 Model used for the purposes of this research 87
3.5 HYPOTHESES 97
3.6 CONCLUSION 99
CHAPTER 4
METHODOLOGY AND PROCEDURE 100
4.1 INTRODUCTION 100
4.2 THE RESEARCH PROBLEM 101
4.3 THE AIM OF RESEARCH 101
4.3.1 The nature of quantitative research 102
4.4 THE RESEARCH DESIGN 102
4.4.1 The Research method 103
4.4.2 The Data collection 104
4.4.3 Sampling methods 104
4.4.4 Ethical measures 105
4.4.5 Informed consent 105
4.4.6 Confidentiality and privacy 106
4.4.7 Participants in the study 106
4.4.8 Processing the results 107
4.4.9 Procedure of research project 107
4.4.10 Validity and reliability 108
4.4.10.1 Validity 108
4.4.10.2 Reliability 111
4.4.11 The questionnaire 111
4.5 DATA ANALYSIS 112
4.6 THE LIMITATIONS OF THE STUDY 113
Page
xii
4.7 CONCLUSIONS 113
CHAPTER 5
DATA ANALYSIS AND FINDINGS 115
5.1 INTRODUCTION 115
5.2 SAMPLE DISTRIBUTION 116
5.2.1 Age of subjects 116
5.2.2 Gender distribution of subjects 117
5.2.3 Subjects‟ home language distribution 118
5.2.4 Subjects‟ race distribution 118
5.2.5 Control and experimental groups 118
5.3 DEMOGRAPHICAL DIFFERENCES BETWEEN THE CONTROL
AND EXPERIMENTAL GROUPS 119
5.3.1 Differences between control and experimental groups 120
5.3.1.1 Difference in gender distribution of the control and
experimental subjects 122
5.3.1.2 Differences in home language distribution of the
control and experimental subjects 124
5.3.1.3 Differences in race distribution of the control and
experimental subjects 125
5.3.2 Reliability 127
5.4 FREQUENCY DISTRIBUTIONS FOR PRE-TEST AND POST-TEST
SCORES 130
5.4.1 CONTROL GROUP 130
5.4.1.1 Pre-test frequency distribution 131
5.4.1.2 Post-test frequency distribution 135
5.4.2 EXPERIMENTAL GROUP 139
5.4.2.1 Pre-test frequency distribution 139
Page
xiii
5.4.2.2 Post-test frequency distribution 143
5.4.3 Difference in frequency distributions 147
5.5 DESCRIPTIVE AND INFERENTIAL STATISTICS 153
5.5.1 Difference (Experimental – Control) 158
5.5.2 T-test Statistic 159
5.5.3 P-value 162
5.5.4 Cohen‟s d statistic 165
5.5.5 Analysis of Co-variance 166
5.6 SUMMARY 167
CHAPTER 6
CONCLUSIONS AND RECOMMENDATIONS 168
6.1 INTRODUCTION 168
6.2 SUMMARY OF THE RESULTS 168
6.2.1 Demographics of the subjects 169
6.2.2 Reliability of instruments 169
6.2.3 Effects of early cognitive intervention 169
6.3 CONCLUSIONS 171
6.4 RECOMMENDATIONS 172
6.4.1 Intervention Programme 172
6.4.2 Parental Involvement 172
6.5 RECOMMENDATIONS FOR FURTHER STUDIES 173
6.6 LIMITATIONS OF THE STUDY 174
6.7 CLOSING REMARKS 174
Page

xiv
REFERENCE LIST 176
LIST OF APPENDICES
APPENDIX A Letter to principal 187
APPENDIX B Study information letter 188
APPENDIX C Informed consent form 189
APPENDIX D Questionnaire for subjects‟ parents/care-givers 190
APPENDIX E Pre-test assessment form 194
APPENDIX F Post-test assessment form 197
APPENDIX G Mathematics scoring scale 200
APPENDIX I Literacy scoring scale 203
APPENDIX I Life-skills scoring scale 206
APPENDIX J Language Quality Assurance Certificate 208
Page
xv
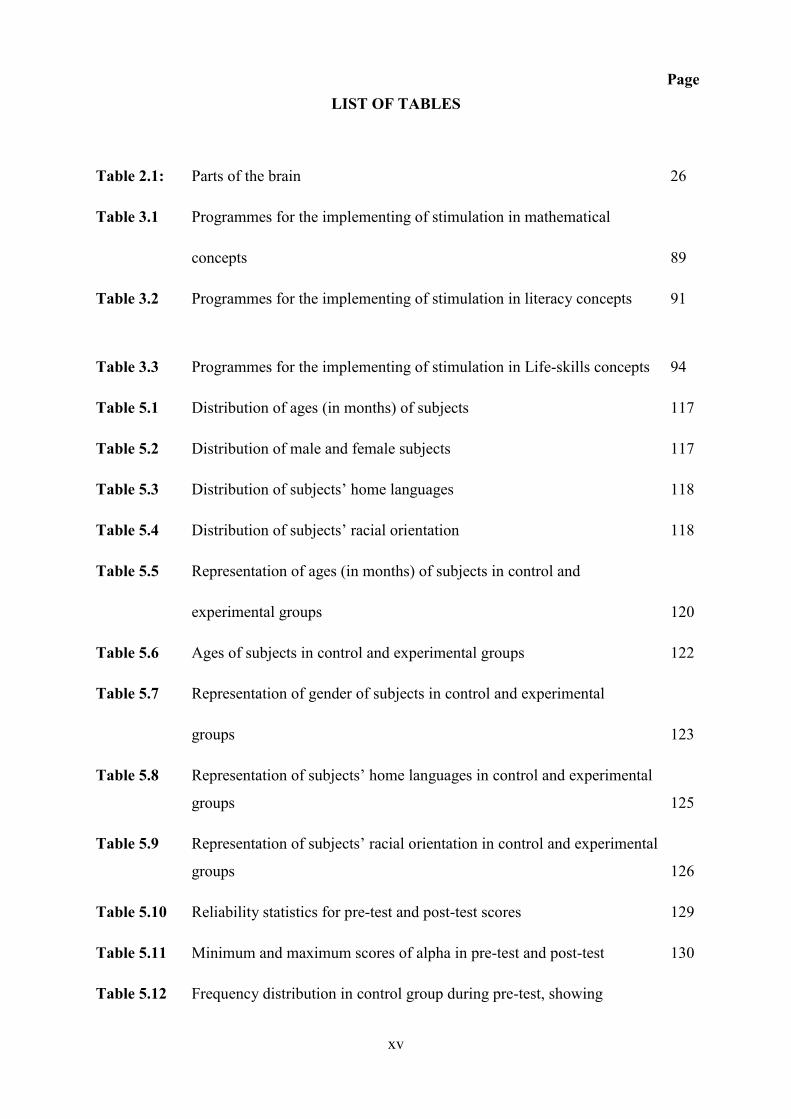
LIST OF TABLES
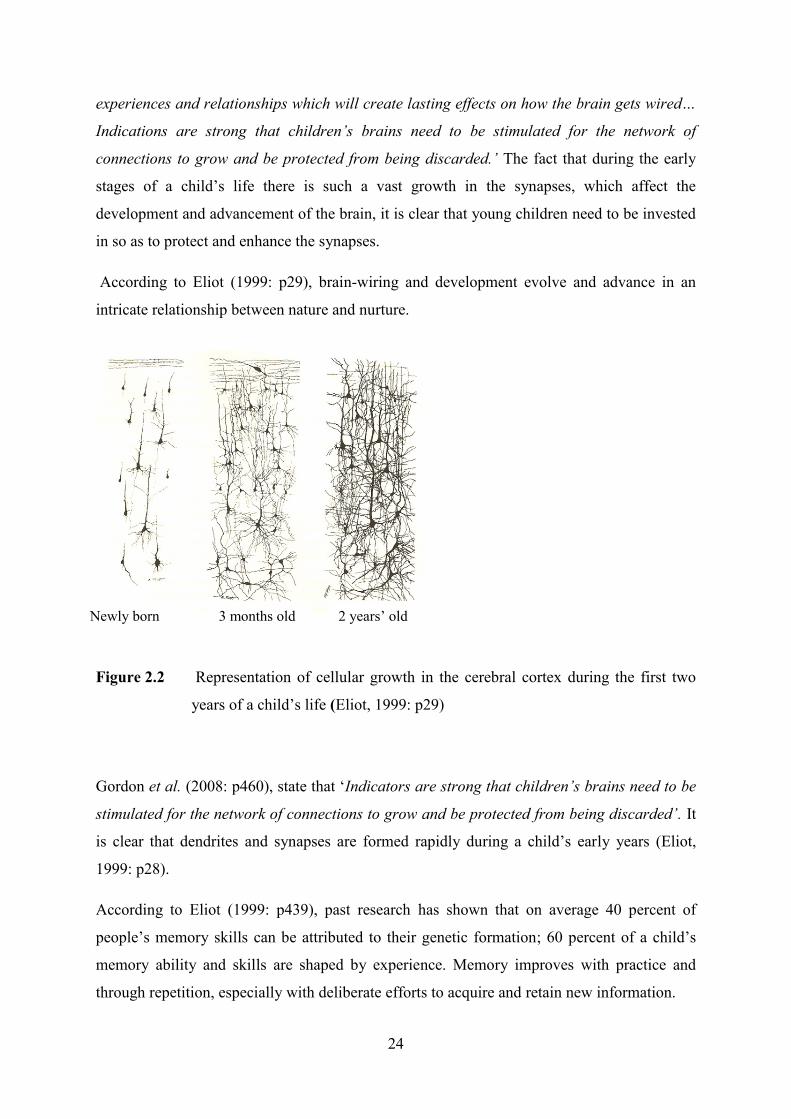
Table 2.1: Parts of the brain 26
Table 3.1 Programmes for the implementing of stimulation in mathematical
concepts 89
Table 3.2 Programmes for the implementing of stimulation in literacy concepts 91
Table 3.3 Programmes for the implementing of stimulation in Life-skills concepts 94
Table 5.1 Distribution of ages (in months) of subjects 117
Table 5.2 Distribution of male and female subjects 117
Table 5.3 Distribution of subjects‟ home languages 118
Table 5.4 Distribution of subjects‟ racial orientation 118
Table 5.5 Representation of ages (in months) of subjects in control and
experimental groups 120
Table 5.6 Ages of subjects in control and experimental groups 122
Table 5.7 Representation of gender of subjects in control and experimental
groups 123
Table 5.8 Representation of subjects‟ home languages in control and experimental
groups 125
Table 5.9 Representation of subjects‟ racial orientation in control and experimental
groups 126
Table 5.10 Reliability statistics for pre-test and post-test scores 129
Table 5.11 Minimum and maximum scores of alpha in pre-test and post-test 130
Table 5.12 Frequency distribution in control group during pre-test, showing
Page

xvi
literacy, mathematics and life skills 131
Table 5.13 Most common score range in control groups pre-test 132
Table 5.14 Frequency distribution in control group during post-test, showing literacy,
mathematics and life skills 135
Table 5.15 Most common score range in control groups post-test 136
Table 5.16 Frequency distribution in experimental group during pre-test, showing
literacy, mathematics and life skills 139
Table 5.17 Most common score range in experimental group‟s pre-test 140
Table 5.18 Frequency distribution in experimental group during post-test, showing
literacy, mathematics and life skills 143
Table 5.19 Most common score range in experimental group‟s pre-test 146
Table 5.20 Frequency distribution differences in control group, showing literacy,
mathematics and life skills 147
Table 5.21 Frequency distribution differences in experimental group, showing literacy,
mathematics and life skills 148
Table 5.22 Comparison of control group and experimental group‟s scores 154
Table 5.23 Descriptive and inferential statistics for differences between control and
experimental difference scores 157
Table 5.24 A description of the Cohen‟s correlations 165
Page
xvii
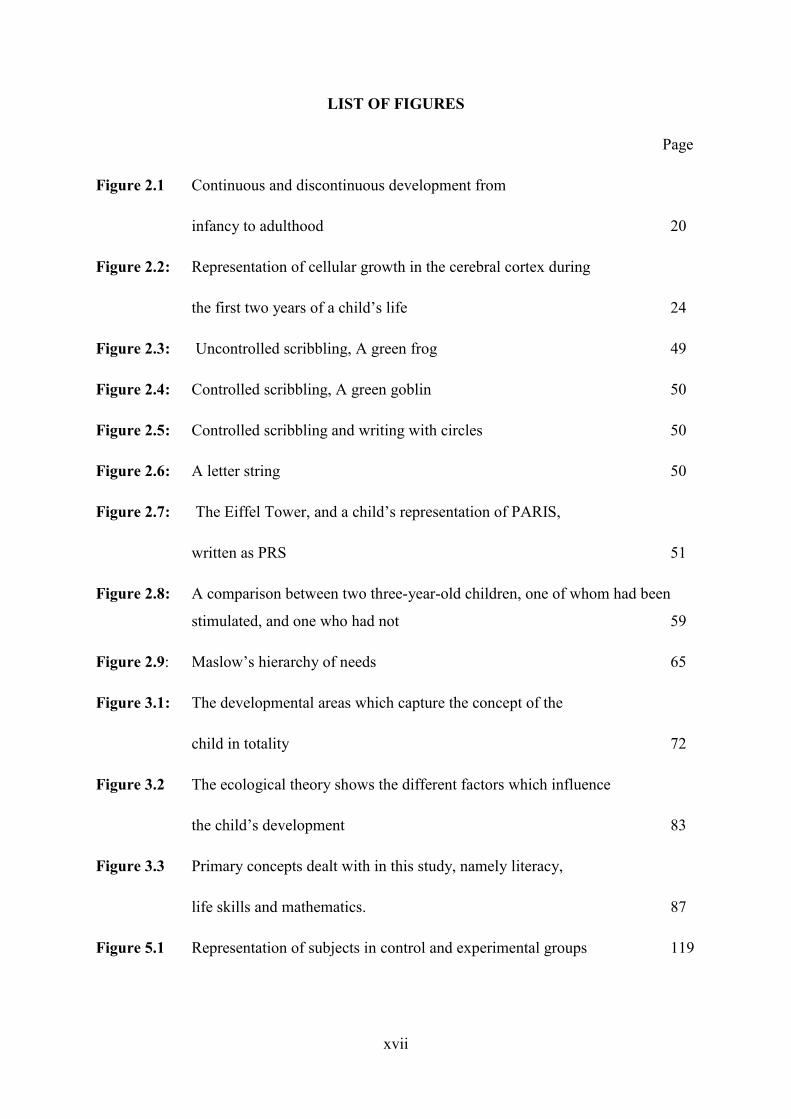
LIST OF FIGURES
Page
Figure 2.1 Continuous and discontinuous development from
infancy to adulthood 20
Figure 2.2: Representation of cellular growth in the cerebral cortex during
the first two years of a child‟s life 24
Figure 2.3: Uncontrolled scribbling, A green frog 49
Figure 2.4: Controlled scribbling, A green goblin 50
Figure 2.5: Controlled scribbling and writing with circles 50
Figure 2.6: A letter string 50
Figure 2.7: The Eiffel Tower, and a child‟s representation of PARIS,
written as PRS 51
Figure 2.8: A comparison between two three-year-old children, one of whom had been
stimulated, and one who had not 59
Figure 2.9: Maslow‟s hierarchy of needs 65
Figure 3.1: The developmental areas which capture the concept of the
child in totality 72
Figure 3.2 The ecological theory shows the different factors which influence
the child‟s development 83
Figure 3.3 Primary concepts dealt with in this study, namely literacy,
life skills and mathematics. 87
Figure 5.1 Representation of subjects in control and experimental groups 119

xviii
Figure 5.2 Representation of the ages of subjects in control and experimental
groups 121
Figure 5.3 Representation of the gender distribution in control and experimental
groups 124
Figure 5.4 Representation of home language distribution in control and experimental
groups 125
Figure 5.5 Representation of subject‟s racial orientation in control and experimental
groups 127
Figure 5.6 Total alpha scores of the instrument used, representing internal
reliability 129
Figure 5.7 Total frequency distribution in control group during pre-test 133
Figure 5.8 Representation of total mean score for life skills, mathematics and literacy
in the control group during the pre-test 133
Figure 5.9 Comparison of distribution of scores for literacy, mathematics and
life skills in the pre-test 134
Figure 5.10 Mean scores of aspects of intellectual development in control group
during the pre-test 134
Figure 5.11 Total frequency distribution in control group during the post-test 137
Figure 5.12 Representation of total mean score for life skills, mathematics and literacy
in the control group during the post-test 137
Figure 5.13 Comparison of distribution of scores for literacy, mathematics and
life skills in the post-test 138
Page
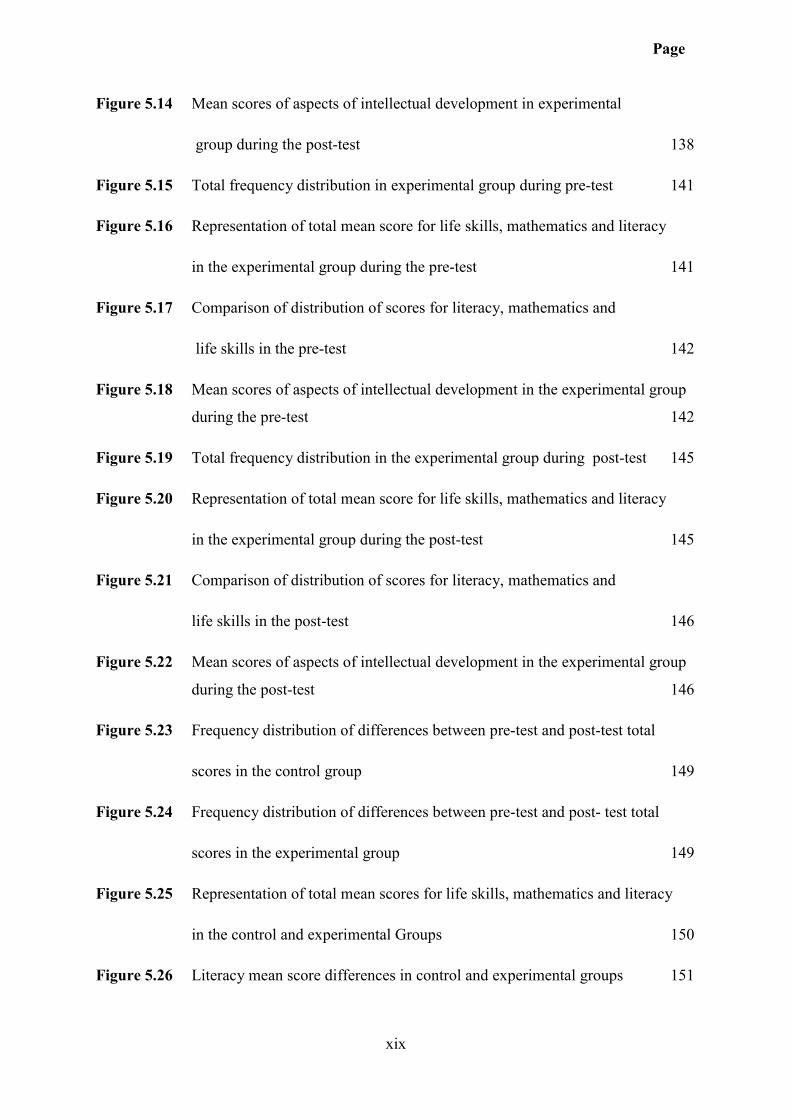
xix
Figure 5.14 Mean scores of aspects of intellectual development in experimental
group during the post-test 138
Figure 5.15 Total frequency distribution in experimental group during pre-test 141
Figure 5.16 Representation of total mean score for life skills, mathematics and literacy
in the experimental group during the pre-test 141
Figure 5.17 Comparison of distribution of scores for literacy, mathematics and
life skills in the pre-test 142
Figure 5.18 Mean scores of aspects of intellectual development in the experimental group
during the pre-test 142
Figure 5.19 Total frequency distribution in the experimental group during post-test 145
Figure 5.20 Representation of total mean score for life skills, mathematics and literacy
in the experimental group during the post-test 145
Figure 5.21 Comparison of distribution of scores for literacy, mathematics and
life skills in the post-test 146
Figure 5.22 Mean scores of aspects of intellectual development in the experimental group
during the post-test 146
Figure 5.23 Frequency distribution of differences between pre-test and post-test total
scores in the control group 149
Figure 5.24 Frequency distribution of differences between pre-test and post- test total
scores in the experimental group 149
Figure 5.25 Representation of total mean scores for life skills, mathematics and literacy
in the control and experimental Groups 150
Figure 5.26 Literacy mean score differences in control and experimental groups 151
Page
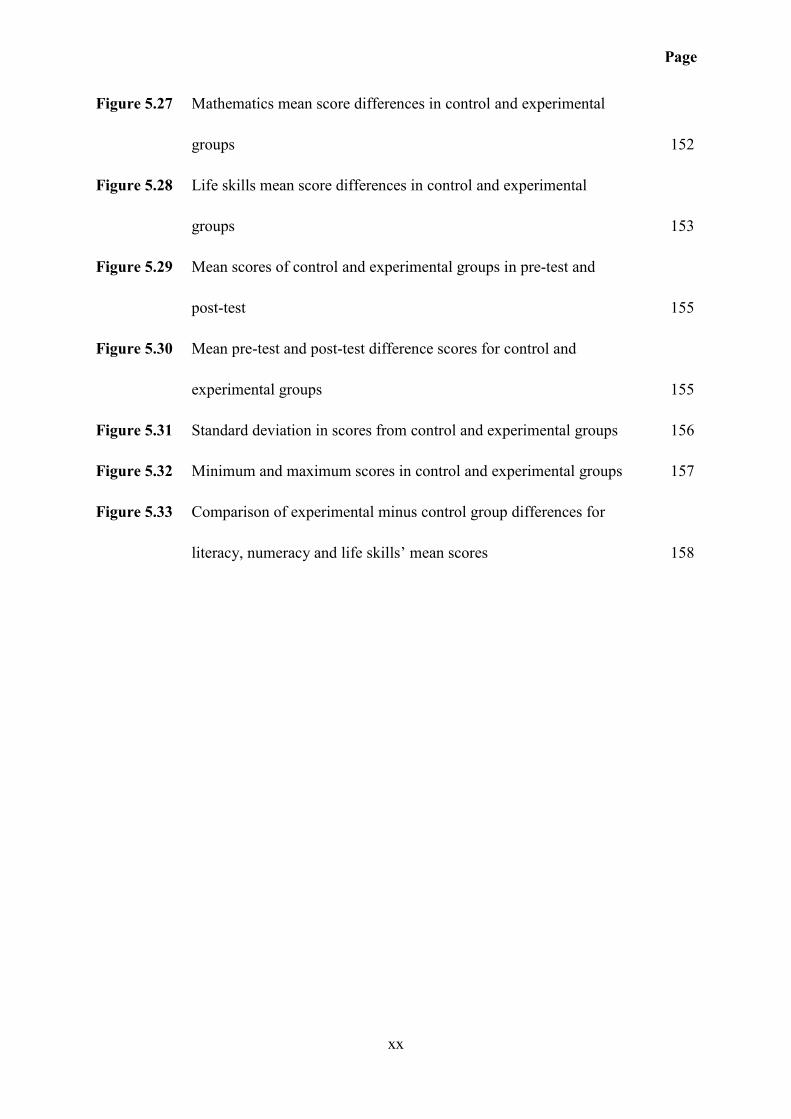
xx
Figure 5.27 Mathematics mean score differences in control and experimental
groups 152
Figure 5.28 Life skills mean score differences in control and experimental
groups 153
Figure 5.29 Mean scores of control and experimental groups in pre-test and
post-test 155
Figure 5.30 Mean pre-test and post-test difference scores for control and
experimental groups 155
Figure 5.31 Standard deviation in scores from control and experimental groups 156
Figure 5.32 Minimum and maximum scores in control and experimental groups 157
Figure 5.33 Comparison of experimental minus control group differences for
literacy, numeracy and life skills‟ mean scores 158
Page
1
CHAPTER 1
INTRODUCTORY ORIENTATION
1.1 BACKGROUND
In order for children to flourish, the development and enhancement of their maximum
capabilities and potential, as well as making the most of their period of existence, are of the
utmost importance. The early years of a child‟s life are years of rapid development and
change (De Witt and Booysen, 1995: p10). According to McAfee and Leong (2007: p36),
there are various facets of a child‟s development, namely the physical, emotional, social,
cognitive, normative and also the spiritual aspects.
A child should, by the age of three, have a strong foundation for his/her physical
development, have developed the basis of his/her language skills and should be starting to
develop an understanding and reasoning ability in regard to the surrounding world. Children
at this age are ready and willing to learn. They thrive on knowledge and skills and are eager
and willing to develop new abilities (De Witt, 2009: p11; Lindberg & Swedlow, 1985: p181).
According to Hendrick and Weissman (2007: p 2-3, p71), each child consists of five „selves‟
or domains. These exist for the child in the context of his/her family and environment, as
opposed to mere subject matter in the objective world around them. The five selves include
the physical, emotional, social, creative and cognitive facets of selfhood. These five domains
need to be viewed in conjunction with one another, as all domains affect and influence one
another, resulting in the importance of the child being viewed in totality (Hendrick et al.,
2007: p2-3, p71).
In this research project the researcher will deal with three aspects of cognitive development,
namely mathematics, literacy and life skills.
Most children are exposed to some form of mathematics from birth and are constantly
exposed to people discussing things from their environment, including shopping, shapes,
numbers, age, sequence, and more. Although the child acquires mathematical concepts
through experiencing the numbers in context, it cannot be assumed that the child has
developed an understanding of numbers, merely because he/she has encountered numbers and
counting (Seefeldt & Barbour, 1998: p452-453).
2
Mathematics is a part of our daily lives and it helps to develop logical thinking; it also
requires a sense of drive and motivation. Mathematics has an appeal for children and adults
because there is a cognitive or aesthetic response. This feeling of satisfaction will drive
children to deepen their mathematical knowledge and ability and will aid educators in their
understanding of the processes associated with learning and understanding the development
of mathematical skills (Metlina, 1991: p2; Lindberg et al., 1985: p181-182).
According to Metlina (1991: p7), „The important task on forming elementary mathematical
notions beginning in the three-year-old group. The children’s later mathematical
development depends on how successfully their first perception of the quantitative
relationships and the spatial forms of real objects is organised. The development of such
fundamental concepts as number and geometric figure are based in modern mathematics on
set theory’.
The importance of the development of mathematical concepts in early childhood is
imperative for future learning to be successful in all the other areas too. In early childhood
children should be taught and given an opportunity to experience numbers and abstract
concepts, in order to provide them with an understanding, as well as to develop their thinking
and reasoning.
De Witt (2009: p98) quotes McConnell and Rabe (1999: p2), when she maintains that early
literacy can be described as, ‘The skills, competencies and attitudes that precede, but directly
influence, a child’s beginning to read’. Reading and literacy need to be things that are
enjoyable for children from a young age. The roles of the parent and family are monumentous
in developing a healthy literacy experience for the young child, which will prepare them for
future language development. Lilly et al. (2004: p36), believe that the role that families take
on in laying a groundwork for a future of successful reading and writing is imperative.
According to Soderman and Farrell (2008: p108), open communication between parents and
teachers is absolutely mandatory.
The development of language starts from a very young age, even before children begin
speaking. According to Soderman et al. (2008: p9), children that have been exposed to the
practicalities of a print-rich environment with good stimulation from a young age, are able to
distinguish patterns and correlate sounds with intangible symbols more efficiently. Receptive
and expressive language form a major portion of language development and understanding.
3
Receptive language underpins the understanding of words and their meanings, and expressive
language is the child‟s ability to express himself vocally (Lilly et al., 2004: p16). According
to Lilly et al. (2004: p16), „Children’s receptive language learning is usually several months
ahead of their expressive language.’ This is clear with a young child – they are able to follow
instructions and can understand what is being said to them long before they are able to
express themselves fully.
Young children determine their own concepts of words, alphabet letters and the meaning of
words; they are able to be creative and imaginative. Over time these concepts become
increasingly more predictable and conventional. The journey of a child in becoming a mature
reader and writer is very important. In order for one to understand the child‟s reading and
writing, knowledge of the journey and concept development are both critical (McGee &
Richgels, 2008: p11).
Life-skills development and general knowledge refer not only to knowledge which the child
possesses, but also to their view on self, life itself and those in their milieu. According to
Gordon and Browne (2007: p526), there are four primary areas with which children struggle
that cater for their affective development: 1) They are unable to control their emotions; 2)
They are unaware of the importance of developing good social skills and etiquette; 3)
Children have a deep creative urge that needs to be satisfied; 4) Children need to
acknowledge their Creator and have an understanding of where they are from, how they are
loved and why there are here.
These concepts of development take place in the context of personal identity and encompass
self-concept, self-esteem, body image and identity (De Witt, 2009: p119 – 120).
According to De Witt (2009: p250), „Life skills and their transmission have become buzz
words, and qualities such as self-assertion, adaptiveness, creativity, independence, positive
thinking and survival are now the norm’.
1.2 PROBLEM ANALYSIS
Prior to identifying the problem, the analysis of the problem needs to first be presented. This
analysis illuminates some surrounding issues and clarifies the context of the study. It is a
4
stepwise process, consisting of exposition, exploration and the formal statement of the
problem (http://www.idrc.ca/en/ev-56596-201-1-DO_TOPIC.html, 16/05/09).
1.2.1 Exposition of the problem
Parents want the best for their children, and want to see their children succeed and excel.
Gordon et al. (2008: p596), have stated that, „When a society values its children, it takes the
responsibility for providing a quality of life for them‟. Parents and families are the child‟s
first educators; they not only teach language and day-to-day concepts, but also instil values,
morals, religious beliefs, and ethics (Gordon et al., 2008: p307). There is little preparation
involved in becoming a parent, and so many parents feel inadequate and uneducated in their
role as a parent.
It seems that many parents and care-givers are unaware of the developmental levels and steps
in the development of children and thus feel ill-equipped and unable to effectively stimulate
and enhance their children‟s development (Gordon et al. 2008: p315).
Parents and families often incorrectly think that because their young child can count to 50 by
rote and write the number names they have a deep understanding of mathematics (Lindberg,
1985: p182). During the early stages of a child‟s life they need to understand words and
concepts, such as more, less, several and some, bigger and biggest, and suchlike (Aubrey,
1997: p21). Parents and care-givers need to be equipped and educated regarding their
childrens‟ cognitive development, how to stimulate the child, various symptoms that may
need to be recognized, basic developmental steps which need to be reached, as well as
programmes and activities which enhance cognitive development.
This is necessary in order to monitor the development of the young child, as well as to
provide the best means possible and enhance the child‟s opportunities, broaden its scope and
influence, through challenging the child by means of individual stimulation and enhancement
of his/her abilities.
According to Metlina, the, ‘Successful mastery of mathematical concepts depends directly on
the development of perception’ (Metlina, 1991: p1). According to Seefeldt and Barbour
(1998: p456-459), the value of learning, the content behind mathematics, languages and life
skills, as well as the ability to become active in any understanding of these concepts and
confident in facing a challenge, would require the active involvement of young children, by
means of the following four key elements:
5
i) First-hand experiences
Case and Okamoto (1996) (as in Seefeldt et al., 1998: p455) stated, „Because mathematical
knowledge is a relationship constructed by the mind, direct teaching alone will not build it.
Children have to develop or construct it for themselves through their own experiences and
reflections on them‟. Although aid and stimulation from the teacher and parents are vitally
important in teaching any cognitive concepts, the child needs to experience the concepts
being taught in order to truly understand them.
Children cannot learn mathematics by rote, but rather need to develop an understanding of
the numbers (Seefeldt et al., 1998: p455 - 456).
Eliason and Jenkins (2008: p191) state that language is the primary concept of understanding
– it forms the basis for all other learning and development. „Language is the instrument of
thought, personal expression, and social communication’ (Eliason et al., 2008: p191).
Language cannot be seen in isolation; it is seen as the tool whereby children are able to
translate experiences into understanding and create meanings. As experience broadens and
also deepens, so language acquires meanings. These meanings result in deeper learning and
in further meaning taking place (Hendrick et al., 2007: p270).
Children begin the learning process slowly, and only gradually begin to develop and enhance
their thinking through day-to-day dealings and by means of language. Children develop
understanding through their exposure to everyday life and through daily experiences. Seefeldt
et al. (1998: p456), believe the knowledge that is gained through interaction is acquired
through the physical world, as well as incidences of reflection within the physical world. This
interaction enhances understanding and logical thought.
Dewey‟s (as in Metlina, 1991: p2) focal point is that children should not be taught knowledge
by memorizing lessons and activities, but rather through experiences, and by being
challenged, by gaining skills and knowledge which they can incorporate into their daily lives.
With advances in technology and the rapid direction of change, the curriculum design and
ways of implementing the curriculum need to be analysed critically and effectively.
ii) Interaction with others
The school and its curriculum, as well as the society and cultures of the learners and their
families that are a part of the school body all have an apparent link and implicate one another

6
directly. The social contribution is to make educators aware that education exists in a social
context and has an influence on the culture of people. It is important for parents, teachers and
care-givers to realise that the school, as well as the learners‟ culture, both have an equal
impact on the learner. The role of the educator should be to prepare learners for the future by
providing them with the knowledge and values they will need in order to make wise decisions
within their context (Ornstein & Hunkins, 2004: p167).
It is equally important for children to interact with teachers and parents, as it is for them to
interact with their peers. In Seefeldt et al. (1998: p457), „When children hold misconceptions,
the teacher can often help them come to new insights… or provide them with opportunities to
confide, notice and draw conclusions’ (Richardson & Salkeld,1995:29). Parents and teachers
need to provide opportunities for children to learn; they need to create a teaching situation
where children can develop an understanding of the world around them; where they can
develop a way of thinking that will challenge their thought patterns and create new learning
opportunities for children.
iii.) The use of language
Language is vital in the learning process. It provides a basis and framework for children to
grow and develop. Children are constantly communicating; throughout their day they are
talking and responding (Seefeldt et al., 1998: p458). It is of fundamental importance to
incorporate educational concepts into the general conversation throughout the day. Simple
statements, such as, „Look at the big, yellow square blocks. Let‟s build with them and see
how tall we can make our tower,‟ refer to colour, shape and measurement, and the children
begin to understand and recognise all the different elements.
According to Seefeld et al. (1998: p458), „The processes of speaking and listening are the
first steps in the representation of mathematical ideas through language’. These authors are
of the contention that the use of language helps the child organize his/her thinking and
experiences. Children can put into words what has happened, and if they have a question or
misunderstanding, through language and communication these problem can be solved.
This aids in their understanding of the abstract world, with the development of problem-
solving strategies, and with an understanding of mathematical, literacy and life-skill concepts
(Gordon et al., 2008: p471).
7
iiiv) Reflection
Reflection is a key component in the understanding of all cognitive concepts, as it provides a
means for the child to reflect on his/her experiences and develop an understanding of abstract
concepts (Seefeld et al., 1998: p459). Providing opportunities for the child to experience
mathematics, languages and life skills would be ineffectual without the ability to reflect and
develop an understanding at a later stage. ‘To reason, solve problems, to see mathematical
connections, children think about their actions in the world. They need to reflect on the things
that they have experienced and to draw abstract patterns and see regularities from these
experiences’ (Seefeld et al., 1998: p459). Teachers and parents should recall occurrences and
instances in a child‟s life, so as to remind him/her of any learning that has taken place.
Children‟s language development is one of the most important aspects of learning that takes
place in the early years of a child‟s life. As the child develops the ability to express
himself/herself by means of words, as well as to show understanding, are ways whereby
communication is made possible. Early intervention should comprise activities such as verbal
interactions with people of all ages, story-telling, reading books, singing, playing games, and
early stimulation (Eliason et al., 2009: p191).
Language development directly influences academic and social abilities (Hendrick et al.,
2007: p271). Therefore a child‟s language skills and abilities should be recognised and
stimulated from a young age, since these skills will positively affect their scholastic abilities
and social successes later on in life. The rate of a child‟s language development, as with any
other development, takes place at his/her own pace, and in his/her own particular manner
(Eliason et al., 2009: p193).
Early intervention is imperative; parents and care-givers need to be speaking, communicating
and encouraging their children from a young age. Teachers need to ensure rich curricular
activities and challenging opportunities for children, while valuing enquiry and
thoughtfulness (Hendrick et al., 2007: p275; Eliason et al., 2008: p190).
1.2.2 Preliminary exploration of the problem
The principal aim of this study is to gain a comprehensive understanding of the cognitive
development of the young child, so as to develop a suitable programme that can be used to
enhance the development of young children. This will be done by means of a literature study
as well as an empirical investigation.
8
It is important to have a full understanding of the individual development of children in their
early childhood, referring specifically to the development of cognitive concepts. Theories
explaining the importance of teaching these concepts to the young child and what early
cognitive stimulation entails will be critically reviewed. The development of early
mathematics, literacy and life skills, the promotion of these programmes, processes and
strategies will all need to be evaluated as a basis for early mathematics, literacy and life
skills. This will need to be done in order to create an integrated cognitive approach and
programme to promote early learning.
In order to fully understand the effects and results of development and stimulation, the purpose
of this study will be to examine the effects of stimulation and development regarding
mathematical, language and life-skill concepts in early childhood.
This study will be conducted:
To develop and evaluate a programme of mathematical skills, language and literacy
development, including general knowledge and life-skills stimulation, to enhance the
ability of young children in order to provide a better understanding of the cognitive
development and abilities of these learners, as well as providing insight into the
benefits of and the rate of individual development of the young learners‟ intelligence,
To assess the validity of the programme of cognitive development, and
To establish the reliability of the application of such a programme of cognitive
development.
1.2.3 Research question
After interrogating the research problem using the preliminary literature study, it became
apparent that the influence of stimulation and the enhancement of cognitive development
needs to be examined. Various programmes and activities need to be logically planned in
order to aid cognitive development and to enhance children‟s abilities. Thus, the research
question for this study can be formulated as follows:
What are the effects of cognitive stimulation (mathematical, language, general
knowledge) on the young child, and how can these effects be enhanced?
The research will provide confirmation on the importance of stimulation in the early
childhood years and the long-term effects of this stimulation. Thus educators, primary care-

9
givers, teachers and parents that are dealt with in this study will become more aware of the
importance of early childhood care and the long-term effects and their implications.
Once an understanding of the effectiveness of the development of these cognitive abilities has
been gained, further secondary questions will arise, such as:
“What is the child‟s ability to learn and develop numeracy and mathematical
concepts, literacy and language development, general knowledge and life skills
development?”
“How can the various cognitive concepts be provided for in the early childhood
programme? What can teachers and parents do to enhance their children‟s
mathematical, language, life skills and general knowledge ability?”
An understanding of the stimulation and development of cognitive abilities in the young child
will provide an understanding of the different developmental levels and methods of learning,
as well as the ability of the young child to learn and develop abstract ideas and knowledge. It
could further add to the body of knowledge with regard to what should be done by teachers
and parents to enhance the young child‟s development.
1.2.4 Aim of the study
The primary aim of this study will be:
To develop a programme to enhance cognitive development in order to examine the
effects of the stimulation of mathematical, literacy, life skills and general knowledge
concepts in young children;
To evaluate the methods of implementation that will assist in the development of the
cognitive concepts;
To indicate how such concepts can be provided for in the early childhood centre.
1.3 DEFINITIONS AND EXPLANATION OF IMPORTANT CONCEPTS
It is necessary that the concepts occurring frequently in this dissertation be defined before
commencing with the literature study. These principal concepts are:
10
1.3.1 Early childhood
According to Gordon et al. (2008: p8), early childhood refers to children from birth to eight
years old. For the purpose of this study, early childhood will refer to children in the age group
from conception to five years old.
1.3.2 Stimulation
Stimulation refers to different concepts and exercises that one can do with children, in order
to enhance their abilities and understanding. It involves time and effort, and is a long-term
and ongoing process. Stimulation is a process of constantly challenging children to think and
reason more deeply and to become creative thinkers. (http://extension.oregonstate.edu/
catalog/pdf/ec/ec1301-e.pdf, 23/07/08)
During the contact time between researcher and participant, the child will be stimulated
cognitively in three aspects, namely literacy, mathematics and life skills. Various exercises
will be done with children. These exercises will challenge their way of thinking and broaden
their horizons.
1.3.3 Mathematical development
Mathematical concepts are those which need to be developed in order to take part in day-to-
day activities. Mathematical concepts are in the world around us, and children need to
develop an understanding of these concepts and be able to manipulate and effectively work
with them (Metlina, 1991: p1-2).
„It is believed by neuropsychologists that humans are born with “number sense”, or an innate
ability to perceive, process, and manipulate numbers. It is an intuitive ability to attach
meaning to numbers and number relationships, in order to understand the magnitude of
numbers, as well as the relativity of numbers, and to use logical reasoning for estimation‟
(http://s22318.tsbvi.edu/mathproject/ch1.asp, 18/03/2009).
1.3.4 Language development
The development of language concepts is a process that begins very early in life. Humans are
constantly communicating with one another and often language development results „When a
person begins to acquire language by learning it as it is spoken and by mimicry‟.
(http://en.wikipedia.org/wiki/Language_development, 15/03/2009)
11
As with anything, the child‟s language development moves from simple to complex.
According to the article in http://en.wikipedia.org/wiki/Language_development (15/03/2009),
language usually starts off by means of recalling simple words that are commonly said or
heard. These words generally have no meaning, but as the child grows older, so the words
acquire meanings and connections between these words are formed. Sentences are then
formed to create logical meaning; new meanings are associated with words and vocabulary is
extended and increased.
1.3.5 Life-skills development
According to http://www.selfgrowth.com/articles/Definition_Life_Skills.html (18/03.2009),
life skills can be defined as the „abilities for adaptive and positive behaviour that enable
individuals to deal effectively with the demands and challenges of everyday life‟. Life skills
prepare and equip the child to deal with day-to-day challenges. They educate the child as to
how one should act and react; life skills teach morals and values and also represent the
psycho-social skills which develop reflective skills such as problem-solving and critical
thinking, as well as developing self-awareness and enhancing positive self-esteem and self-
actualisation, sociability and they equip children to deal with other people.
1.3.6 Cognitive development
According to Woolfolk (2007: p22), children from the ages of three to eight years old
develop a number of cognitive concepts. These include time, speech, reading and reasoning.
Piaget has developed a theory that embraces the different stages of cognitive development,
which he believes all children develop. Children do however go through the stages at
different rates.
1.4 RESEARCH DESIGN AND METHOD
This study employs the quantitative approach to explore the effects of cognitive development
in the early childhood. In quantitative research, researchers are aware of the outcomes they
are expecting, and strive to remain objectively separated from the subject matter being
researched. „Designing quantitative research involves choosing subjects, data collection
techniques (e.g. questionnaires, observations, or interviews), procedures for gathering the
data, and procedures for implementing treatments‟ (McMillan & Schumacher, 2006: p117).

12
All aspects of the study will be very carefully designed before the data are collected and
analysed.
An outline of the literature study, empirical research and the research instruments used to
conduct this study will be furnished in this section. Quantitative research involves an analysis
of numerical data. The reason for this study being quantitative is because the aim is to
determine the relationships between one phenomenon (independent variable) and another
(dependant variable) in a population. (McMillan et al., 2006: p117–119;
http://www.socialresearch methods.net/tutorial/Abrahams/sbk16.htm)
1.4.1 Literature study
The primary reason for doing a literature study is because it compares any new research with
previous research in the same field. It can be used to create awareness of the topic, to shed
light on already existing knowledge, on the theoretical paradigms which have already been
developed and previously researched. The literature review is educative; it enables us to
identify areas of uncertainty, differences and any confusion within the field of study. It also
provides for a scientific discussion of the deductions from the literature.
Many sources, including published books, journal articles and electronic sources from the
Internet were employed to obtain an in-depth understanding of the nature and meaning of the
problem in this study on cognitive development (McMillan, et al., 2006: p75-77).
1.4.2 Empirical research
The effects of the stimulation of cognitive abilities in early childhood can best be described in
quantitative terms. Therefore, in order to understand the development and cognitive abilities
of young children, it is necessary that questions be posed to provide quantitative descriptions
(McMillan et al., 2006: p10).
The research will be performed by means of the „True Experimental Design‟, whereby the
subjects will be measured before and after the treatment. It is believed that True
Experimental Design is „the preferred method of research‟. It provides the highest degree of
control over an experiment, enabling the researcher the ability to draw casual inferences with
a high degree of confidence‟. (http://www.socialresearchmethods
net/tutorial/Abrahams/sbk16.htm, 10/10/09)
13
This is the only design that can effectively determine the cause and effect, as it involves a
control group and an experimental group (McMillan et al., 2006: p24).
All subjects who take part in this research will be assigned to either the control group or the
experimental group by probability sampling, based on randomisation. All subjects in the
population (Early Childhood Centre) have the same chance of being selected. The subjects
will be selected by systematic random sampling, where each individual has an equal chance
of being selected.
Systematic sampling selects subjects from a population by firstly selecting only one case
randomly, by using a random table with each individual representing a number. All
subsequent subjects will be selected according to a particular interval.
1.4.3 Research design and methodology
The research design will be a quantitative method of capturing and analysing data. It will be
an ongoing process of working with children and gaining a deeper understanding of their
development as individuals. The home environment, emotional, physical, social and spiritual
development will form part of this investigation, as the child always needs to be seen as a
whole, and there is no way of separating the child from the environment.
The literature will be reviewed to identify the cognitive activities which aid stimulation in
young children; and the most suitable ones will be included in a battery of tests. The
programme will cover all mathematical, language and life-skill concepts suitable to the young
learner. In order to determine the validity of the test, 40 subjects will be selected from three
Early Childhood Centres and will be assigned to either the experimental or control groups
through random selection.
Both groups will undergo an initial test to determine their understanding and knowledge of
the mathematical, literacy and life-skill concepts and other skills and abilities. Thereafter, for
the next eight weeks, both the experimental and control groups will undergo their normal
daily programmes. In addition to this, the experimental group will undergo daily sessions of
mathematical stimulation, language development and life skills and their stimulation,
whereby cognitive concepts and ideas are understood and developed.
After the eight-week intervention programme, both groups will again undergo a post-test to
determine their understanding and knowledge of the cognitive concepts and skills learnt.
14
The following analysis of the data was employed:
1. Single variable descriptive statistics (mean, standard deviation and frequency
distributions) will give insight into the pre-test and post-intervention scores.
2. The reliability of the scores for the pre-tests and post-tests will be determined by item
analysis consisting of factor analysis and the calculation of Cronbach‟s coefficient of
alpha (McMillan et al., 2006: p54, p185-186).
3. T-tests will be implemented in order to determine the level of significance in the
control and experimental groups, as well as to compare the two groups‟ mean scores
(p < .001 at 0.1% level of significance).
4. The level of significance of the study will be determined by the p-level or level of
probability (McMillan et al., 2006: p292). A critical value at the five-percent level of
confidence (p > .05) is required for significance to be achieved.
5. Analysis of co-variance, using the statistical software package program used by
BMDP2007 in addition to the analysis of co-variance, where the treatment was the
grouping variant and the pre-test was the co-variant, used to test the level of
improvement in the scores as a result of the intervention programme (McMillan et al.,
2006: p165).
A number of hypotheses have been postulated which will be dealt with in detail in Chapter 5.
1.4.3.1 Ethical measures
In order to ensure that this research meets the necessary ethically requirements the required
ethical clearance will be obtained from UNISA, the relevant Education Department (if
necessary) and then parents will be provided with a letter explaining in detail the aims and
objectives of the research and the method to be used to achieve these. Full confidentiality will
be guaranteed at all times as the wellbeing of the children is of paramount importance.
The process of conducting this research will in no way put the child at risk (Neuman, 2006:
p340).
1.4.4 Reliability
‘Reliability refers to the consistency of measurement – the extent to which the results are
similar over different forms of the same instrument or occasions of data collection’
15
(McMillan et al., 2006: p183). If the instrument does not show much error, then it is taken to
be reliable. If the instrument has a great number of errors, it is seen as being unreliable.
Validity, according to McMillan et al. (2006: p188), suggests truthfulness and refers to how
the investigation fits into the greater reality of day-to-day occurrences. Reliability is essential
for validity to take place, and these two are often seen to complement one another. Reliability
and validity can however sometimes conflict with one another (McMillan et al., 2006: p196-
197).
There are five types of reality, namely: Stability which refers to the consistency of test scores
over a period of time; equivalence which occurs when two or more measures prove a
common result in a test at roughly the same time. Equivalence and stability occur when the
measures show a common interest over a period of time. Internal Consistency is used to
measure a single trait or aspect by means of comparing specific measurements. Agreement on
the reliability is the consistency of the ratings and findings of the observation (McMillan et
al., 2006: p183; Neuman, 2006: p188-190).
An acceptable range of reliability for most instruments is 0,7 to 0,9. This is normally the
permissible range for the Cronbach alpha reliability coefficient (using the split-halves
method). (Reliability can be 0,65 for personality tests, 0,8 for achievement tests and 0,5 for
exploratory tests) [McMillan et al., 2006: p183].
1.4.5 Method
The following methods will be used to obtain the information required for this study:
i.) Sampling
For the purpose of this study all participants will be selected by means of systematic random
sampling, where each individual has an equal chance of being selected. Systematic sampling
selects subjects from a population by firstly selecting only one case randomly, by using a
random table with each individual representing a number. All subsequent subjects will be
selected according to a particular interval (Neuman, 2006: p230).
The participants in this study are children between the ages of two and three-and-a-half years
old that attend one of three Early Childhood Centres in Port Elizabeth.
16
ii) Data collection
Data will be collected by means of post-testing and pre-testing. All participants will be given
a pre-test; and under the same conditions, after the period of stimulation, the post-test will
take place. Parent interviews and questionnaire forms will also be completed.
1.5 DEMARCATION OF THE STUDY
This study entails a quantitative investigation of the effects of cognitive development in
children in their early childhood. It involves a large group of 40 learners between the ages of
two and three-and-a-half years old. The research will take place in three Early Childhood
Centres in Port Elizabeth. Both boys and girls will be evaluated.
1.6 THE RESEARCH LAYOUT
This study will contain six primary chapters, each consisting of sub-sections and headings
which will include an Introduction, which covers a basic introductory outline of the work;
this will include a clear statement of the problem, the significance of the study, the various
aims of the study, the research hypotheses and the limitations of the study. It will also
highlight the importance of cognitive development and stimulation in early childhood.
The Literature Review will include the framework of mathematical concepts, elements of
early cognitive development, including mathematics, literacy and life-skills development, the
development of early mathematics, literacy and life-skills, and what each of these entails,
various elements of early mathematics, literacy and life-skills. Differences between
arithmetic and mathematics, the importance of teaching cognitive concepts to the young
child, and the development of the brain will all be reviewed.
The basis for early mathematics, literacy and life-skills, the promotion of cognitive
knowledge and strategies will also be discussed. They will be explained and referred to the
teacher‟s role in the stimulation of the child, the importance of parental involvement, possible
problem areas between parents and teachers, and suggestions on how to enhance parental
involvement in the school or community will also be reviewed.
17
The Conceptual framework will provide a basic outline of influential theories in the history of
education. A focus will be placed on those theories which are the foundation and cornerstone of
the intervention programme used in this study. The intervention programme will be discussed in
detail focusing on the different themes and primary developmental concepts.
The Research Design and Methodology chapter will report on a deeper investigation and study
of cognitive development in early childhood. This comprises a programme to enhance the
cognitive development in the early childhood and the reasons for the approaches taken. This
chapter will also include the ethical research approach and the reasons for using this approach,
as well as the various instruments used and the reliability and validity of the study.
Reference will be made to the sampling strategies, the demographic details of the group and a
data analysis of the study. Close examination through a process of exploration will be conducted
using those methods considered most suitable to the development of intelligence in early
childhood.
The fourth chapter will include an Analysis of the data and findings and a discussion
thereof. It will also include a design and description of the study methods used. The sixth
chapter will culminate in the Conclusion of the study, including various recommendations
based on the findings of the study.
1.7 SUMMARY AND CONCLUSION
This chapter has offered a background to the research. It has stated the research problem at
hand and described the study‟s aims and objectives. The research methodology which the
researcher plans on using to implement the research has also been stated. The terms that will
be used in the following chapters have been clearly defined and the demarcation of the study
briefly clarified. Lastly, the study layout has been provided.
Chapter Two will focus on the literature review relevant to the impact of stimulation on
cognitive development in early childhood.
18
CHAPTER 2
REVIEW OF RELATED LITERATURE
2.1 FRAMEWORK BEHIND STUDY
History is a way of recording human achievement and it provides information about
relationships between people, events, places and times. According to The South African
Oxford Dictionary, history is „a continuous record of events, a study of the past involving
human affairs…‟ (Ed. Branford, 1994: p353).
2.1.1 Historical framework
The history of our education helps provide an explanation of where our present education is
at. It aids us in determining a broad journey, so that we can note the progress made and
challenges that yet need to be faced. All aspects of history need to be considered when
developing educational programmes which will impact and affect young children (Gordon et
al., 2008: p8).
The history of education aids us in explaining the reasons for the development of our
education system - the reasons why it has developed into what it is today, and a strategy to
aid development in the future. According to Gordon et al., (2008: p8), „Drawing upon the
knowledge of the past creates an awareness and understanding of changes in education‟. The
history of education helps one realise in which direction we are progressing and it also
provides one with prospects for the future of education.
Success in the education system would be to know and recognise our strengths and
weaknesses, and at the same time to be able to predict future problems and successes from
the knowledge gained from past challenges and successes in history. By being provided with
the past principles and values of the educational system, educators have a set of guidelines for
the improvement of the educational system, as well as thereby being able to assist present
educators to define solutions to their problems (Woolfolk, 2007: p8).
2.2. BASIC DEVELOPMENTAL LEVELS
As suggested by Gordon et al., (2008: p100), there are six basic developmental areas that we
need to focus on in development regarding young children. The aspects, as suggested by

19
Gordon et al., (2008: p100), need to be dealt with together, and not in isolation, as the child
needs to develop and be seen in totality and as a „whole.‟ The areas of development include
the following:
i) Physical-motor development
Physical development is imperative as it enhances and promotes the changes in brain
structure and function in young children. It is essential to ensure sensory development,
through physical activities which aid in the growth and development of the nervous system
(De Witt, 2009: p90; Gordon et al., 2008: p435-436; Kostelnik, Soderman & Whiren, 1999:
p398).
ii) Social-emotional development
Social–emotional development refers to the child‟s relationship that he possesses with
himself, as well as the way in which he relates to his peers, teachers, parents, and others he
may be in contact with. It also refers to the child‟s self-concept, self-esteem and the ability
one has to express oneself on how one may be feeling (De Witt, 2009: p21 & p27; Gordon et
al., 2008: p100).
iii) Play development
The importance of play in the education of young children is universally appreciated (Eliason
et al., 2008: p25; Gordon et al., 2008: p167; Maree & Ford, 1987: p8). According to Eliason
et al. (2008:p25), play in the early childhood is reflected by the teacher‟s knowledge and
understanding of play. The environment and curriculum will be a clear representation of the
teacher‟s understanding of play in a developmentally appropriate curriculum.
iv) Cognitive Development
Cognitive development, according to Gordon et al. (2008: p457), refers not only to the
development of the mind, but also to all areas of the child‟s growth, including changes in
mental structures that occur as children discover and interact with the world around them.
After much research in the 1980s, a conclusion was reached by Harris and Cooper (1985; in
Cooper & Levine, Ed. Presseisen, 2008), that teaching practices need to be adapted, and more
focused on „concept development, cognitive development, reasoning, thinking, higher-order
comprehension skills and advanced subject matter. Cognition is the mental process which is
used by children to acquire knowledge, where they exercise skills such as conscious thought
and memory (De Witt, 2009: p20; Gordon et al., 2008: p456).
20
v) Language and speech development
The development of language and speech is imperative to the overall development, as all
learning needs to take place with language and communication. The ability for children to
understand and speak a language is therefore vital (De Witt, 2009: p98; Gordon et al, 2008:
p100).
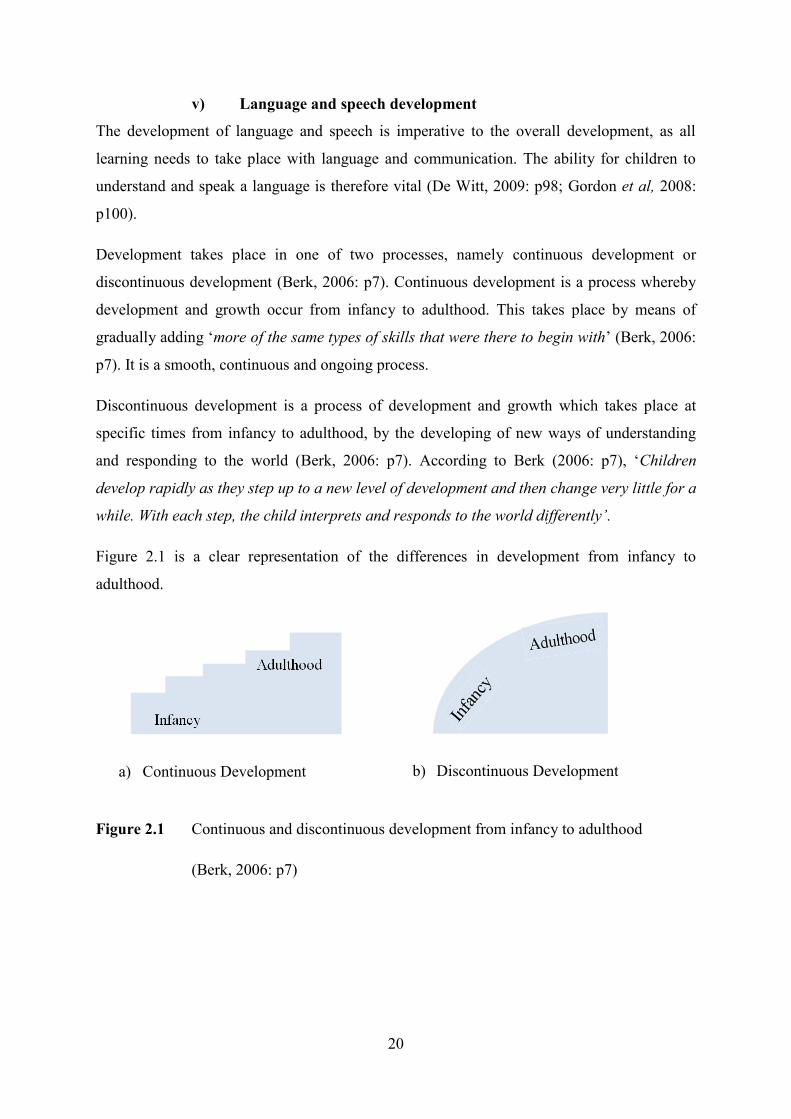
Development takes place in one of two processes, namely continuous development or
discontinuous development (Berk, 2006: p7). Continuous development is a process whereby
development and growth occur from infancy to adulthood. This takes place by means of
gradually adding „more of the same types of skills that were there to begin with‟ (Berk, 2006:
p7). It is a smooth, continuous and ongoing process.
Discontinuous development is a process of development and growth which takes place at
specific times from infancy to adulthood, by the developing of new ways of understanding
and responding to the world (Berk, 2006: p7). According to Berk (2006: p7), „Children
develop rapidly as they step up to a new level of development and then change very little for a
while. With each step, the child interprets and responds to the world differently’.
Figure 2.1 is a clear representation of the differences in development from infancy to
adulthood.
Figure 2.1 Continuous and discontinuous development from infancy to adulthood
(Berk, 2006: p7)
a) Continuous Development b) Discontinuous Development
21
2.3 INTELLIGENCE
‘Intelligence is the ability to understand and manipulate facts and ideas using language and
mathematics‟ (Spillane, Ed. Presseisen, 2008: p139). Intelligence is an indispensable part of
human development which determines individual differences (De Witt, 2009: p147).
Sternberg (Ed. Presseisen, 2008: p65) also states that intelligence is a vital aspect of cognitive
development, and something that schools should be zoning in on, focusing not only on
knowledge to be learned, but also on being able to apply knowledge and skills to real-life
situations, and in everyday life (Sternberg, 2008: p65).
Intelligence is not only about having knowledge, but rather about being able to use and utilise
the knowledge and intelligence that one gains (Spillane, Ed. Presseisen, 2008: p140).
According to Spillane (Ed. Presseisen, 2008: p141), ‘A curriculum that teaches for
intelligence must provide many opportunities for students to use what they have learned in
order to investigate, understand, discuss and comment on significant matters.’
The education process is not only one of imparting knowledge, but rather one of equipping
and enabling young children to use their skills and abilities in life situations (Berk, 2006:
p314; Spillane, Ed. Pressiesen, 2008: p140; Sternberg, Ed. Presseisen, 2008: p65; Hendrick,
1986: p308).
Through an intense research study done by Rosenzweig (1966) and Krech (1969), a
conclusion was drawn that not only did the environment impact intelligence and abilities, but
they found that these changes were consistent with the levels of intelligence developed in the
children (Whitmore, 1986: p6). The impact of a stimulating environment has been found to
directly affect the growth of the brain in a significant way.
Whitmore (1986: p7), also believes that, ‘prior to conception, the health of the mother can
directly support or limit the growth of the child. Studies from third world countries have
shown that, when severely deprived, it will take three generations of both proper nutrition
and stimulation to return the human brain to a normal level of cognitive growth‟. This is an
alarming fact, especially in a country like South Africa which has a large number of children
living in poverty.
According to Kostelnik et al. (2004: p9), as early childhood educators, we are becoming
increasingly aware that in addition to what children learn, we must consider how children

22
learn, so that we can best promote the development of these core abilities (Slentz & Krogh,
2001a).
IQ is seen as an important aspect of intelligence, but educators are also aware that there are
other characteristics which reveal intelligence, such as: ‘perseverance, reasoning ability,
motivational level, ingenuity, originality, fluency, good concentration ability, the ability to
work with acquired insight, good powers of retention and the ability to generalise’ (De Witt,
2009: p148).
In 1992 Bredekamp and Rosegrant (as quoted in Eliason et al., 2008: p319) suggested that a
learning style that is repetitive is necessary for early childhood teaching. This comprises four
phases: awareness, exploration, enquiry and utilisation. Awareness is the ability to recognize
people, objects and events. This facility is developed from the child‟s experiences.
Exploration is the ability to observe, investigate, discover and create meaning. Enquiry is the
ability to refine and create understanding through investigating, examining, comparing and
generalising; and Utilisation is the ability to apply prior knowledge to new situations.
According to De Witt (2009: p147), there are different aspects of intelligence by which it can
be defined:
The ability to adapt to the environment in which one finds oneself ;
One‟s ability to learn;
One‟s ability to think abstractly, working with symbols and problem-solving;
Holistically, developing an understanding of the child in his/her totality;
One‟s verbal and language abilities, memory skills, problem-solving and dealing with
the demands of day-to-day experiences.
2.4 COGNITIVE DEVELOPMENT
According to Woolfolk (2007: p37), Robbie Case (1992, 1998) suggests that children develop
in phases within specific fields, such as numerical concepts, spatial perception, social tasks,
storytelling, reasoning about physical objects, and motor development. As children practise
these phases and become more familiar with them, achieving the tasks requires less time and
attention.

23
According to Cunningham and Stanovich (1997) in Dockrell and Messer (Ed. Berman, 2004:
p35), ‘Vocabulary knowledge is a strong predictor of academic success, and it plays a
central role in cognitive development’.
Brody (Ed. Kyllonen, Roberts & Stankov, 2008: p71) justifies the teaching and learning
process by stressing the importance of the development of intelligence, „What is learned
(self-evidently) depends on what is taught. Individuals with the same intelligence may acquire
different levels of expertise and knowledge if they are taught in different ways’.
2. 5 DEVELOPMENT OF THE BRAIN
The brain is an extremely complex and comprehensive part of the human body. Brain cells
are formed within the first three weeks after conception, and play an indispensable role in the
development of the child, with between 100 and 200 billion neurons or nerve cells still to be
developed (De Witt. 2009: p78-79). According to Brierley (1994: p5), the brain has full
control over the body and its functions. The brain is made up of many parts which all play a
different, yet vital role in the day-to-day functioning of a human being (Brierley, 1994: p6).
Every sight, sound, touch, smell and thought leaves an imprint on specific neuronal circuits
and pathways, altering and transforming the way future sights, sounds, smells and thoughts
will be registered. According to (Eliot, 1999: p4) „Brain hardware is not fixed, but living,
dynamic tissue that is constantly updating itself to meet the sensory, motor, emotional, and
cognitive demands at hand’.
The child becomes aware of its environment and surroundings by means of the most
complicated system in its body, the nervous system. The child‟s senses and muscles create
awareness and allow it to adjust to its milieu (De Witt. 2009: p77). While genetics plays a
great role in the sequence of neural development, the quality and eminence of development is
formed by environmental factors (Eliot, 1999: p9). The primary role of the nervous system is
to „control, integrate and co-ordinate‟ the responses to stimuli, which enhance the child‟s
ability for the acquisition of learning and language (De Witt. 2009: p78, Hendrick, et al.
2007: p10-11).
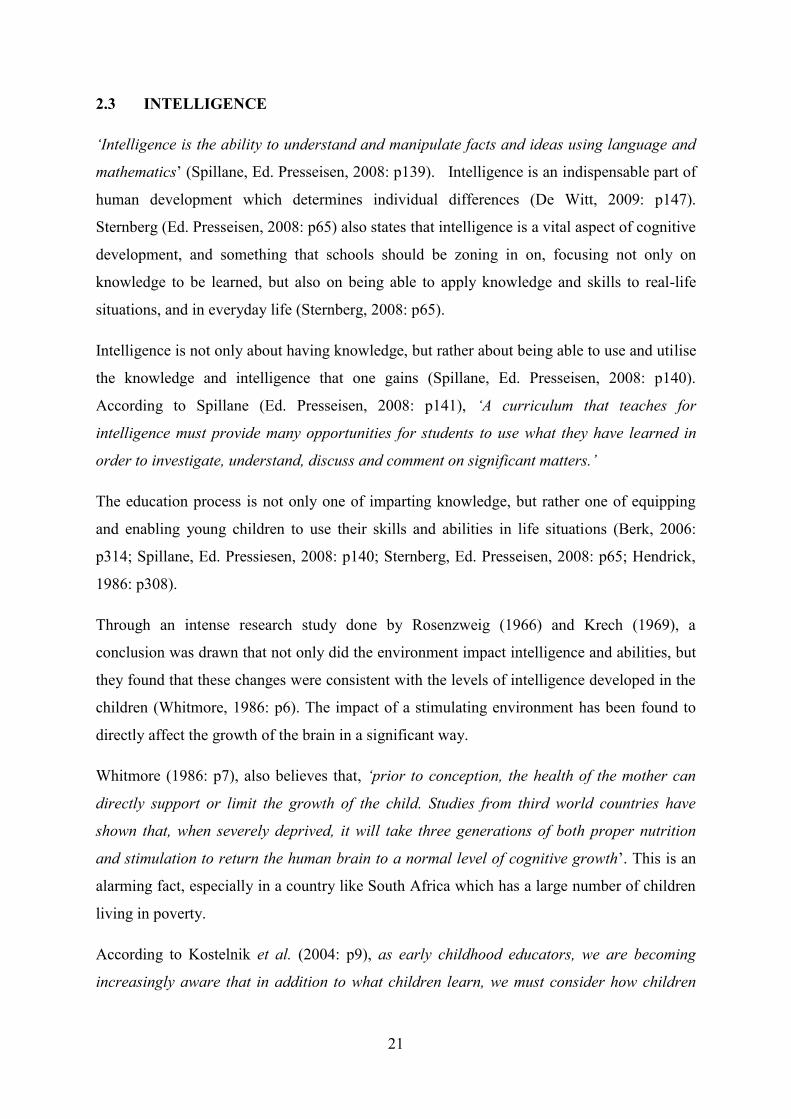
Gordon and Browne (2008: p460) believe that, ‘During the first three years of life, an
infant’s brain creates an estimated 1000 billion synapses. Providing thereby quality
24
experiences and relationships which will create lasting effects on how the brain gets wired…
Indications are strong that children’s brains need to be stimulated for the network of
connections to grow and be protected from being discarded.’ The fact that during the early
stages of a child‟s life there is such a vast growth in the synapses, which affect the
development and advancement of the brain, it is clear that young children need to be invested
in so as to protect and enhance the synapses.
According to Eliot (1999: p29), brain-wiring and development evolve and advance in an
intricate relationship between nature and nurture.
Figure 2.2 Representation of cellular growth in the cerebral cortex during the first two
years of a child‟s life (Eliot, 1999: p29)
Gordon et al. (2008: p460), state that „Indicators are strong that children’s brains need to be
stimulated for the network of connections to grow and be protected from being discarded’. It
is clear that dendrites and synapses are formed rapidly during a child‟s early years (Eliot,
1999: p28).
According to Eliot (1999: p439), past research has shown that on average 40 percent of
people‟s memory skills can be attributed to their genetic formation; 60 percent of a child‟s
memory ability and skills are shaped by experience. Memory improves with practice and
through repetition, especially with deliberate efforts to acquire and retain new information.
Newly born 3 months old 2 years‟ old

25
There are a number of representative characteristics of a three-year-old child; these are
related to their cognitive development and include: (Althouse, 1981: p126; http://www.all
thedaze.com/pdevelopment.html, 20/06/09; http://www.musckids.com/health_library/growth/
threeyo.htm, 18/06/09; http://www.child-development-guide.com/child-development-3years.
html, 18/06/09)
* The child likes to experiment with concrete apparatus, often repeating actions;
* The child now focuses on and attends to one aspect of an object – his thinking is
centred;
* The child is unable to complete a process from start to finish, and then retrace his
steps to the starting point;
* The child‟s reasoning is transductive. He will use his reasoning to make sense of the
world around him;
* The child now begins to gain understanding regarding position, order, sequence and
simple classification;
* The child can verbally compare two or more objects;
* The child can finish basic puzzles;
* The child is able to copy a circle;
* The child can recognise and name basic shapes and colours;
* The child can use personal pronouns and plurals correctly;
* The child is able to take part in simple conversations, with the ability to describe
present and past experiences;
* The child is able to speak more than one language if he repeatedly hears more than
one language spoken around him as he grows up;
* The child tends to talk to himself when playing;
* The child enjoys listening to and making music;
* The child can count up to ten or more by simple repetition.
26
Table 2.1 Parts of the brain
(Berk, 2007: p219; Brierley, 1994: p6; De Witt, 2009: p81-84; Woolfolk,
2007: p24-25; http://serendip.brynmawr.edu/bb/kinser/Structure1.html,
29/06/09)
RIGHT
HEMISPHERE
Part of the Brain Function
Corpus Callosum Inter-hemispheric connexion
Thalamus Central „switchboard‟ of sensations
Visual Cortex Sight
Cerebellum Equilibrium
Reticular Activating system Sleep, wakefulness, alertness
Pituitary Gland Hormonal equilibrium
Amygdals Regulation of instinctive behaviour
Cerebral Cortex Outer layer of the brain. 3mm thick
Hypothalamus Instinctive behaviour: thirst, hunger,
aggression, sex, fear
Hippocampus Concerned in memory
LEFT
HEMISPHERE
Frontal Lobe Decision-making
Broca‟s Area Motor speech
Olfactory Bulb Smell and taste
Temporal Lobe Memory in language
Auditory Cortex Hearing
Wernicke‟s Area Understanding speech
Spinal Cord Transmission of inputs and outputs
Cerebellum Equilibrium
Occipital Lobe Sight
Parietal Lobe Seems to control relationship between body and
mind
It is clear that the brain is an indispensable part of the human body – one that affects and
influences all other parts of the body.
27
2.6 GIFTEDNESS
Giftedness refers to children who may be „exceptional, superior, brilliant, geniuses, talented,
keen-witted and a quick learner‟ (De Witt, 2009: p145). There is a group of children that is
very often overlooked in the school situation (Woolfolk, 2007: p148). Gifted children have
special needs – they thrive in a classroom situation that is enriched; one that does not look
down on the extremely talented child. A study done by Tomlinson-Keasey in 1990 (in
Woolfolk, 2007: p149) states that more than one-half of all gifted children do not achieve in
school at a level equal to their ability.
Every opportunity needs to be taken to encourage the understanding of gifted children, as
well as to equip educators and care-givers to enhance the development of each child
individually, irrespective of their level of intellect or their abilities. Giftedness forms a great
part of cognitive development – one that can no longer be overlooked and ignored.
According to Slater and Bremner (in De Witt, 2009: p145), giftedness is generally a term
used to describe a person with high cognitive abilities, as seen through verbal abilities,
memory, problem-solving skills, and the daily demands of life. Kokot (In Landsberg, Kruger
& Nel, 2005: p470) gives his interpretation of giftedness from a South African perspective.
He believes that „giftedness is biologically rooted in the child and develops as an expression
of a system of interrelated influences within the child’s inner and outer environment’.
Accordingly, giftedness can be explained in terms of an interrelated system. Children may be
born with the genetic potential for giftedness in one or more fields in the neurological
structures, but it is necessary to nurture this potential to full fruition in order to create the best
opportunities for the child.
The following are characteristics of giftedness, as mentioned by Landsberg, Kruger and Nel
(2005: p472-473):
There is early use of advanced vocabulary;
Many gifted children begin with language development, by communicating and using words
before they are 12 months old.
Keen observation and curiosity;
A potentially gifted child could ask questions and show intrigue around topics that would not
normally interest young children.
28
Retention of an above-average amount of information;
Gifted children have a great memory and are able to recall past events and experiences with
great detail.
Periods of intense concentration;
A potentially gifted young child can sit and listen inventively to instructions, a story or any
conversation without getting distracted or bored.
Ability to understand complex concepts, perceive relationships and think
abstractly;
Young children are able to show understanding by observing and noting concepts. These
children can think abstractly and conceptualize situations and relationships in the world
around them.
A broad and changing spectrum of interests;
Gifted children often show an extreme interest in a subject, and then an extreme interest in
another subject a little while later.
Strong critical thinking skills and self-criticism;
Gifted children evaluate themselves and others critically. They notice inconsistencies when
people say something and do another thing, and often tend to get disappointed and let down
when people do not do as they say. Gifted children are also very critical of themselves.
2.7 EARLY MATHEMATICS
Numeracy and numbers are all around us; every day, teachers and care-givers have the
opportunity to enhance and encourage each child‟s mathematics abilities, so as thereby to
enhance the young child‟s cognitive skills and development. ‘Children’s early mathematical
experiences play an enormous role in the development of their understanding of mathematics,
and serve as a foundation for their cognitive development‟ (Tudge et al., in Perret-Clermont,
2004: p21). Mathematics plays a great part in cognitive development, and an understanding
of mathematics is an indispensable foundation for the teaching of concepts.
According to De Witt (2009: p184), concepts form the foundation for reasoning,
interpretation and thinking; these are the groundwork of a learner‟s understanding of maths
and science.

29
In an article written by Swets and Zeitlinger (2002: p252), early numeracy is defined as „the
acquisition of mathematical knowledge and skills which can be viewed as a developmental
process that starts long before the beginning of formal mathematics education in the primary
school. In the years prior to formal schooling in Grade 1, children are exposed to simple
mathematics concepts, especially those that are interested in numbers and facts about
numbers. They develop understanding regarding shapes, colours, patterns, counting in
sequence, groups, and comparing objects (De Witt, 2009: p184).
Saracho and Spodek (Ed. Saracho, O & Spodek, B. 2008 : p viii), stated that children „build
considerable informal knowledge of mathematics before entering school and can extend their
knowledge if provided with appropriate experiences at all ages’.
Swets et al. (2002: p250) have categorized this type of learning as, „informal mathematical
concepts,’ and believe they are developed and enhanced over a period of time, based on
children‟s experiences with numbers, in school as well as in their day-to-day experiences.
Saracho and Spodek believe that mathematics not only includes numbers, but also geometry,
measurement, algebra and patterns (2008: p1).
In early childhood, teachers and parents should enhance the development of these
mathematical notions by creating learning situations through spontaneously occurring
situations which seem unintentional, yet are planned and systematic educational activities
(Swets et al., 2002: p250).
According to Brooks-Gunn (Ed. Chase-Lansdale, Kiernan, Friedman. 2004: p295), all
children have the potential to develop mathematical concepts, and the amount of
development that occurs before formal teaching varies from child to child. In an article
written by Dockett and Perry (2007: p871), it states that through thorough research, it has
been recognised that young children are capable of learning mathematics, as well as of
developing a deep understanding of mathematical concepts, and in turn relating them to their
current life situation.
Swets et al. (2002: p250) believe that there are three major views on mathematical concepts
in early childhood which can be distinguished. They include the following:
30
i) Logical mathematical foundations
The concept of logical-mathematical foundations was greatly influenced by Piaget. He
believed that the development of number concepts and early mathematical skills that can be
envisaged as the amalgamation of the logical operations of number conservation,
classification and seriation (Woolfolk, 2007: p26-28). „A child who has acquired these
logical operations, has a true understanding of what numbers are, and is ready to start to do
mathematical operations with them in a meaningful way (Swets et al., 2002: p251).
In an article written by Swets et al, (2002: p251), Piaget (1965) notes his belief in the
development of logical operations. He believes that the development of these operations is a
direct reflection on the child‟s contact and relations with the concrete materials in his/her
environment. Piaget believes that the development of mathematics concepts can be attributed
to one experiencing the number, interacting with mathematical concepts and for mathematical
concepts to be constant in their environment and surroundings, so that mathematics becomes
a regular part of a child‟s daily life.
In Swets et al. (2002: p251), Piaget also states that teaching a child to count by rote is not of
vital importance – it will in no way aid in his/her development and understanding of
numerical concepts.
Although rote counting is important, and may provide us with a familiarity on number names
and the sequence of numbers, it does not provide us with an understanding of numbers,
number concepts and abstract ideas. Piaget (1952) blatantly stated that ‘Counting has no
operational value’ (Swets et al., 2002: p251).
ii.) Children’s counting skills
In contrast to Piaget‟s previous statement, the importance of developing children‟s counting
skills is also stressed as an indispensable part of the development of mathematical concepts.
This contradicts Piaget‟s logical operations theory. According to those that support this view,
counting skills are essential and also aid in the development and understanding of the
numbers concept. The repetition of counting by rote reinforces the child‟s ability to memorise
sequences and sounds, even if done without any understanding (Eliason et al., 2008: p325).
31
According to Swets et al. (2002: p251), ‘Frequent and varied experiences with counting are
considered to be necessary for the development of the concept of numbers, and of the
concepts of addition and subtraction’.
For children to fully gain an understanding of numbers and to have number sense, they need
to continually experience numbers in the world around them.
iii) Synthetic approach
The idea of the synthetic approach integrates the ideas of the Logical Mathematical
Foundations approach and the Children‟s Counting Skills approach into one synthetic model.
Here, both theories are to be considered vital in the development and understanding of early
numeracy, mathematics concepts and abstract notions. Swets et al. (2002: p252), state that
eight closely knit aspects of numeracy were devised by Van de Rijt (1996).
These eight aspects include the following, and will be dealt with in more detail later on:
* Concepts of comparison
* Classification
* One-on-one correspondence
* Seriation
* The use of number words
* Structured counting
* Resultative counting
* General understanding of numbers
Subsequent to a study performed by Aubrey (1997: p27), it is now recognised that there are
four related assumptions regarding early numeracy and the development of mathematical
concepts in early childhood. These assumptions include:
* Children develop their own knowledge and understanding of mathematics.
* Mathematics needs to be organised in such a manner as to facilitate the development
of mathematical knowledge and an understanding of concepts.
32
* The topics and starting point for mathematical instruction should be developed
according to the children‟s level of development.
* Mathematical skills need to be taught concurrently with developing understanding and
problem-solving skills (Aubrey, 1997: p27). Schoenfeld (1989, 1994, in Woolfolk
2007: p358) did a study where all the learners were given problem sums. The
beginner and novice problem solvers began unproductive explanation routes when
problem-solving and very often continued on these paths, even though they were not
aimed towards a resolution. In comparison, expert problem-solvers move towards
solutions by using a range of cognitive processes, such as „planning, implementing
and verifying‟ and altering their conclusion. These are based on the process of
discovery.
According to De Witt (2009: p106), Piaget was originally of the opinion that language
development and cognitive development go hand in hand and work simultaneously. He also
stated the notion that thinking develops before language does. Vygotsky believed that
language development and cognitive development are usually seen in isolation until the child
reaches the age of two years, when a sudden spurt in development occurs.
2.8 WHAT EARLY NUMERACY AND MATHEMATICS ENTAIL
Children are exposed to some form of numeracy from birth. The child is constantly exposed
to people discussing things from their environment, including shopping, shapes, numbers,
ages and sequences. Numeracy is all around us. Although it cannot be assumed that the child
has developed an understanding of numbers, merely because he has encountered numbers and
counting, the child does acquire mathematical concepts through experiencing the numbers in
various context (Swets, et al., 2002: p251-252).
Often parents and families think that because their young child can count to 50 by rote and
write the number names they have a deep understanding of mathematics. This is most
definitely not the case; before a child truly understands abstract numbers and concepts, he/she
needs to have experienced numbers through his/her senses in a concrete format. Only then
will the concepts begin to be understood.

33
According to Lansdown and Walker (1991: p312) during the early stages of a child‟s life,
they „need to understand words like more, less, several and some; then come bigger, biggest,
taller, heavier, between and so on‟.
There are six major aspects of early numeracy teaching and learning that are important in the
understanding of mathematics concepts in the early childhood (Wright 2002: p35). These
include:
* Children need to have a deep understanding of mathematics, through identifying
strategies and a conceptual knowledge of numbers.
* Early childhood teachers and workers need to be provided with an explanatory model
and guide to young children‟s number development.
* The guides and explanatory models can be used by teachers to observe and assess the
child‟s early number knowledge.
* The models and guides can be used across a broad range of schooling systems,
stimulation centres and communities.
* Together with learning frameworks, instructional frameworks are also available. The
instructional frameworks and learning frameworks go hand in hand to enhance the
learning experience.
* Teachers and professionals need to undergo development courses which will enable
them to effectively implement the learning and teaching frameworks and gain positive
results with the development of children.
In a recent study done by Griffin (2004: p175-176), to note the effects and develop an
understanding of number sense, the following guidelines need to be taken into consideration
when implementing a mathematics programme for young children. This will enable the child
to use his/her existing knowledge, as well as to construct new knowledge on the next level, so
as to enhance his/her abilities and thinking.
Each individual child‟s needs should be met, by means of the following:
* The child‟s current knowledge should always be noted and taken account of, so that
progress and development can be assured.
34
* Activities should be multi-levelled, so that children with different base knowledge can
take part in activities and the programme at hand, with an understanding of the activities,
ensuring that all the children will benefit from the exposure to concepts (Griffin, 2004: p 175-
176).
2.9 THE DIFFERENCE BETWEEN ARITHMETIC AND MATHEMATICS
2.9.1 Mathematics
Mathematics is, „The study of the measurement, properties, and relationships of quantities
and sets, using numbers and symbols‟ (http://www.answers.com/topic/arithmetic.1/10/08).
Mathematics evolved from simple concepts, such as counting and measuring. ‘It deals with
logical reasoning and quantitative calculation’ (http://www.answers.com/topic/arithmetic.
1/10/08).
2.9.2 Arithmetic
Arithmetic is a branch of mathematics. It deals with numbers, operations and computations of
numbers. Arithmetic is used in many practical situations, such as buying, selling, counting,
statistics and day-to-day occurrences. „The usual numbers of arithmetic are whole numbers,
fractions, decimals, and percentages. The numbers used in arithmetic are negative numbers,
rational numbers, and irrational numbers. The rational and irrational numbers together
constitute the real numbers’ (http://www.answers.com/topic/arithmetic. 1/10/08).
2.10 THE ELEMENTS OF EARLY NUMERACY
Toddlers sort things. They put them in piles—of the same colour, the same size, the same
shape, or with the same use. Young children pour sand and water into containers of different
sizes. They pile blocks into tall structures and see them fall and become small parts again.
The free exploring and experimentation of a child’s first two years help to develop muscle co-
ordination and the senses of taste, smell, sight, and hearing—skills and senses that serve as a
basis for all their future learning (http://www.project2061.org/publications/earlychild/
online/experience/Lind.htm, 1/10/08).
35
Although young children may not be doing math‟s sums and equations, they are still
developing mathematical concepts and gaining valuable insights into numeracy. From their
earliest days children are exposed to numbers, shapes, colours and structures in their daily
lives. Teachers and educators thus need to ensure that children are gaining the most insight
possible from the world around them.
According to an article written by Sophian (2004: p59), although mathematics instruction for
young children should be age-appropriate, in both format and content, it should at the same
time prepare the child conceptually for the kinds of mathematics that they will be exposed to
in the future.
2.10.1 Counting
There are many ways in which we can include counting in the development of mathematics
concepts, so that counting is not merely a memory activity, but rather so that children may
develop an understanding of numbers and extend their concept of understanding (Young-
Loveridge, 2002: p37). Counting is a very important aspect of mathematics. It is the
foundation for all future mathematical knowledge, and it is part of daily life (Clarke, Clarke
& Cheeseman, 2006: p83-84; De Witt, 2009: p184; Tudge et al., 2004: p21).
We are surrounded by counting and mathematics every day (Clarke et al., 2006: p84).
If learners merely recite numbers, and learn the names of numbers by rote, they are not
gaining anything; and later on in their mathematical careers they will suffer greatly.
According to Mc Dermott and Rakagokong (1996: p51), the ability to recite numbers does
not mean a child can count. Counting skills are skills which are learned gradually and after a
great deal of counting experiences.
Counting involves the following aspects (Mc Dermott et al., 1996: p51):
The ability to distinguish a selection of objects.
The ability to connect a number name to a collection of similar objects
representing the total number of objects in that collection.
The ability to know that the last number name used in counting represents the
number of that specific arrangement.
36
There are many stories and poems that refer to numbers and counting. Stories such as, „The
Three Little Pigs‟, „Snow White and the Seven Dwarfs‟, and poems such as, „One, Two,
Three, Four, Five once I caught a fish alive… Six, Seven, Eight, Nine, Ten, then I let it go
again‟. These can all be used when teaching children the concept of counting.
2.10.2 Classification
Classification is an important aspect in the development of mathematical concepts, and
according to Micklo (1995; as in Seefeldt et al., 1998: p469), it deals directly with „putting
together things that are alike or that belong together’. Classification occurs when one groups
together like objects, or objects which belong together. Classification helps the young child to
develop the concept of numbers (De Witt, 2009: p186; Eliason et al., 2008: p240, 332).
Throughout the child‟s first year, infants use their senses to sort and classify their experiences
(Gordon et al., 2008: p463).
In order for a child to be able to sort and classify objects by placing them in groups, they first
need to be able to observe an object, identify similarities and dissimilarities, and thus
compare characteristics (Hendrick et al., 2007: p225). It also implies noting specific
attributes and characteristics which are associated with purpose, position, appearance or
location (Seefeldt et al., 1998: p469). Children should constantly be encouraged to take note
of the similarities between the things they see and with which they interact throughout their
day.
Children should also be encouraged to collect things – rocks, shells, marbles, flowers, money
and creatures. This should be performed as a fun activity, so as to encourage learning in a fun
environment (Gordon et al., 2008:463).
Seefeldt et al. (1998: p470), firmly believe that the classification process is segmented into
the following stages:
Sorting into collections without any plan in mind;
Children will begin the sorting process without a plan in mind, but as they „play‟ they realise
that they are sorting objects, and will continue. There is no reason behind the sorting. It was
by chance that the sorting process took place (Seefeldt et al., 1998: p469; Lindberg, 1985:
p185).
37
Grouping with no apparent plan;
Children have their own idea of grouping, often unable to be seen by the adult, but when
explained by the child, there is a deeper understanding of the child‟s reasoning (Seefeldt et
al., 1998: p469).
Sorting on the basis of some criterion;
Children are often able to sort objects according to one criterion, but often struggle to sort
more than one. All the green things or all the round things go together, but not all objects that
are green and round necessarily do go together (Gordon et al., 2008: p463; Seefeldt et al.,
1998: p469).
Sorting on the basis of two or more properties;
Once children have mastered the technique of sorting according to one criterion, they are then
able to create groupings on the basis of two or more criteria, putting together all the green and
round objects together in a group (Eliason et al., 2008: p332; Swedlow, 1985: p185).
Sorting on the basis of function, use or concept.
Finally, children are able to sort objects or events according to their function, use or concept
(Seefeldt et al., 1998:469).
2.10.3 One-to-one correspondence
One-to-one correspondence is an ability that a child develops, which enables them to match
an object to a number. One-to-one correspondence is the most important element in the
concept of numbers. One-to-one correspondence is a deliberate way of counting, and will
only become evident in the child‟s mathematical ability, once they have developed the
concept of this counting technique (Clarke et al., 2006: p94; Eliason, 2008: p325; Gordon et
al., 2008: p464; McDermott et al., 1996: p52).
According to Benigno and Ellis (2004: p17), ‘Reciting strings of numbers, pointing, and
emphasising the final count are likely to reinforce preschoolers’ understanding of number
sequence, one-to-one correspondence, and cardinality.‟

38
By developing a link between the number and the number of objects that are being counted,
the child begins to develop an understanding of this concept, which later allows children to
match the number of objects to number names. One-to-one correspondence would be evident
and understood, should a child have five sweets in front of him; he counts them, and as he
counts them, he touches each sweet, counts it only once, and can state that there are five
sweets in front of him.
Should the child count the sweets, but counts one sweet twice, doesn‟t count one, skips one
out or counts beyond the number of sweets that there actually are, the concept of one-to-one
correspondence has most likely not yet been acquired (Eliason et al., 2008: p325, McDermott
et al., 1996: p52).
Counters are a great teaching aid to use whilst demonstrating one-to-one correspondence, as
they are concrete objects that the learners can feel and touch (Eliason et al., 2008: p325). This
is easy for them to comprehend, as the counters are physical, tangible objects in front of
them. The number chart is also a very important teaching aid, as it is very multifunctional,
and can be used in many activities to reach different outcomes.
Counting pictures is a semi-concrete teaching aid, whereby the learners can count the
numbers of a specific type of object. This is also a great teaching aid, for the younger and
earlier days of mathematics, as it is still introducing the numbers and number concepts to the
learners (Seefeldt et al., 1998:469).
2.10.4 Sequencing and seriation
In Gordon et al. (2008: p464), Geist (2001) states that ‘Seriation is the ability to put an object
or group of objects in a logical series based on a property of those objects.’ This involves
being able to identify objects from the biggest to the smallest, tallest to shortest, fattest to
thinnest, darkest to lightest, and so on (Clarke et al., 2006: p86; Eliason et al., 2008: p332;
Hendrick, 2007: p339). Before a child is able to put objects in a sequence, he first needs to be
able to order objects by evaluating them according to some form of contrast and similarity
(Althouse, 1981: p124).
39
2.10.5 Geometry
„Geometry is the area of mathematics that involves shape, size, space, position, direction, and
movement, and describes and classifies the physical world in which we live.‟
(http://www.ed.gov/pubs/EarlyMath/whatis.html, 2/10/08). The ability for young children to
have an understanding of shapes and structures is imperative (Clements & Sarama, 2008:
p184; Eliason et al., 2008: p335). A simple exercise such as taking a small box apart and
putting it back together again is a monumentous achievement if a young child can do it.
Children need to be exposed to shapes and different dimensions so that their abstract thinking
and their understanding of representation may be enhanced. There are so many aspects of
geometry and shapes that can be learnt in our daily lives, including angles, shapes, and solids
by merely observing the world around us (Gordon et al., 2008: p465).
According to Clements et al., (2004: p187), „Geometry and patterning are foundational for
mathematics learning’.
2.11 THE PROMOTION OF MATHEMATICAL KNOWLEDGE, PROCESSES
AND STRATEGIES
McDermott et al. (1996: p2) believe that the development of mathematical concepts comes
from a model of teaching and learning that was formed by research, conducted in South
Africa. „This concept is strongly South African in context’ (Mc Dermott et al., 1996: p2). The
acronym, EXCELL stands for the five stages of the process for the development of
mathematical concepts.
EX stands for Experience. Mc Dermott et al. (1996: p2), believe, together with many other
theorists, that children need to experience mathematics and numeracy before they can
develop any understanding of it. De Witt (2009: p185) states that basic learning experiences
which develop mathematical concepts are essential for further mathematical development.
According to Gordon et al. (2008: p464), an awareness and understanding of numbers is
neither complete nor absolute unless children have direct experiences with materials and
objects. When children are exposed to numbers and experiences they adopt the concept and
develop an understanding. This process is called „accommodation‟, and results from an
interaction between the learner and his/her environment (Mc Dermott et al., 1996: p3;
40
Gordon et al., 2008: p143). Very often children do not adopt the new concept, but rather take
it in, and allow for the new concept to fit into their current understanding. This process is
called assimilation (Mc Dermott et al., 1996: p3; Gordon et al., 2008: p143).
C stands for Context. This refers to the understanding and learning of mathematics concepts
which take place in the context of the child‟s real world and the various needs he may have.
Mathematics which is based on the young child‟s reality and life-experiences has more
meaning for the child than that based on the unknown and the uncommon.
Mathematics needs to be fun and relevant to the child (Mc Dermott et al., 1996: p3;
Woolfolk, 2007: p263).
E stands for Environment. Mathematics should encourage intrigue and interest in the child‟s
environment. It should provide learners with a means to explore and discover (Mc Dermott et
al., 1996: p3; Gordon et al., 2008: p328). According to Petrill and Wilkerson (2000), in
Woolfolk (2007: p121), differences in intelligence are the result of both heredity and
environment, so both the child‟s home and school environment aid in the development and
learning of mathematics concepts (Mc Dermott et al., 1996: p3).
The first L in EXCELL represents Language. Mc Dermott et al. (1996: p4), believe that
‘Language is an essential component in the formulation, as well as the expression of
mathematical ideas.’ Children begin using mathematical terms and developing mathematical
concepts from a young age, before they even know that they are using mathematical terms.
Expressions such as bigger than, more, shorter, taller are all expressions that enable them to
articulate and express their opinions and thoughts. Because of the differences in children‟s
cultures, religions, beliefs, socio-economic status, all children‟s levels of understanding and
development are at a different level. Because of this, some children grasp concepts
immediately, while other children struggle with the concept (Mc Dermott et al., 1996: p4;
Eliason, et al., 2008: p191).
The final L represents Learning. Cognitive learning is a very important process occurring in
the brain. Knowledge is a two-way process, where the learners recognise and identify the
features that are significant to their experience and make those features their own (De Witt,
2009: p185; Mc Dermott et al., 1996: p4; Woolfolk, 2007: p206).
41
Mc Dermott et al. (1996: p2-4), believe that all assimilation of new knowledge takes place
within the context of the above-mentioned criteria – Experience, Context, Environment,
Language and Learning.
2.12 EARLY LITERACY
Early literacy and language development begin with experiencing language through verbal
interactions, books, rhyming, activities, storytelling, singing and games (Eliason, et al., 2008:
p191). Language is a means of expression, a way in which people can communicate and
interact with the world around them (De Witt, 2009: p5). Communication and language are
the cornerstones of cognitive learning and development. ‘Language is thus the device through
which raw experiences are translated into meaningful symbols that can be dealt with
coherently and used for both thinking and communicating’ (Eliason, et al.,2008: p191).
In an article by De Witt, Lessing and Lenayi (2008), a statement by Al Otaiba and Fuchs
(2002) is endorsed, stating that, ‘Given the pivotal role reading plays in and out of school and
the cumulative long-term cost of literacy, early literacy intervention is critical’.
As a child‟s experience intensifies, his/her language obtains meaning and therefore further
growth and learning become achievable, also allowing for children to express their feelings
and emotions. Language is a fundamental concept for further development and learning (De
Witt, 2009: p5; Eliason, et al., 2008: p191). According to Gordon et al. (2008: p505),
successful readers are able to note an association between the spoken language and the
written word, they are aware that language is formed with a number of sounds and symbols,
and are thus able to make the connections between the spoken word and the written word.
According to Estes (1975), McKenna & Kear (1990) (in Cunningham, 2008: p20), a child‟s
attitude towards reading and language plays a vital role in establishing a love for literacy.
Between 19 months and four years, the child has an intrinsic and natural ability available for
language learning, called the Language Acquisition Device. According to Kostelnik,
Soderman and Whiren (2004: p315), „During this period, the environment of the child must
be rich in language experience.’ The child should be exposed to as much verbal interaction,
communication, reading, reasoning, learning poems and songs and make-believe as possible.

42
Cunningham (2008: p28) believes that it should be every teacher, administrator, reading
specialist and care-giver‟s role to promote and encourage children to love language, as well
as encourage a passion for literature and books, thus creating a life-long reader. According to
an article written by Schmitt and Gregory (p1), „Without intervention on the part of the
educational system, the prospect of very real and negative consequences for future success in
school and life are what lie in store for these children’.
Arnold Gesell (1925) was the chief proponent of a theory that compared cognitive maturation
to physical maturation. This was called the Maturationist Movement, and it stated that
children were ready to read once they had developed certain prerequisite skills and abilities
(Gordon et al., 2008: p155; Lilly et al., 2004: p2). The Behaviorist Theory is one that is still
used in some school situations today. It is teacher-centred and fast-paced, where children
learn through repeating words and sentences that have been constructed by their teachers
(Gordon et al., 2007: p138, 174; Lilly et al., 2004: p2).
The Connectionist Theory functions on the cornerstone that literacy knowledge is built on a
series of skills and experiences. The alphabet, reading words and fluency are all taught and an
emphasis is placed on the mastery of these techniques (Lilly et al., 2004: p3). The Social
Constructivist Theory is based on Vygotskian principles, and is largely based on the child‟s
environment from a cultural perspective. The cornerstone of this theory is that parents and
care-givers should model language, so that children might acquire knowledge through their
experiences with more experienced peers or adults (Gordon et al., 2007: p149, 174; Lilly et
al., 2004: p3).
The Critical Theory encourages developing a deep understanding of each child, their
environment and home situation, supporting a multi-cultural approach to teaching. It
addresses issues of social justice, poverty, malnutrition, non-violence and helps children to
become creative and critical thinkers and readers (Higgs & Smith, 2006: p66; Lilly et al.
2004: p4).
Emergent literacy involves the formation of literacy concepts through informal experiences,
where skills, knowledge and attitudes are developmental indications to conventional forms of
reading and writing (Berk, 2006: p300-301; Gordon et al., 2008: p506). Emergent literacy
forms the building blocks for future learning, reading and writing. It is developed from birth,
through interactions with people, participation with adults and peers and through both non-
intentional and intentional stimulation (Lilly et al., 2004: p4).

43
Some of the important characteristics of language, according to De Witt (2009: p100),
include:
Language is a means of communication
In order for children to communicate with other humans in the world around them, there
needs to be a common ground and understanding of words, symbols and expressions, in order
to make verbal or non-verbal communication possible. Verbal interaction and communication
take place through language (De Witt, 2009: p100; Hoff, 2005: p254; Lilly et al., 2004:
p126).
Language is a means of socialisation
Language is the cornerstone of communication and interaction. It is also important for
maintaining and sustaining interpersonal relationships and communicating morals, values,
attitudes and beliefs through sensitivity, understanding and clear communication (De Witt,
2009: p100; Lilly et al., 2004: p124).
Language as a means of exploration
Children explore and gain insight by asking questions, by examination and through
discovery. This expands their insight and knowledge (De Witt, 2009: p49, p100).
Language is a medium of thought
We think and reason in our minds through language. Without vocabulary and words we
would not be able to form cognitive thought patterns (De Witt, 2009: p100).
Language is a medium of learning
Language is a means of learning and gaining understanding, not only through verbal
explanations, but also by gaining access to culture, daily occurrences and learning
possibilities (Lilly et al., 2004: p124). Engelbrecht et al. (in De Witt, 2009: p5), believe that
‘Many learning problems are a result of the child’s language problems: the child is taught
through the medium of language, he must understand, processes and memorise information
through language, and he must also give answers in his language’.

44
Language as a medium of expression
Language is the way whereby children are able to express themselves, their feelings,
thoughts, ideas and beliefs (De Witt, 2009: p100).
Language is culture-bound
Each culture has its own, preferred ways of communicating, its language preferences,
pronunciation, and dialects (De Witt, 2009: p100; Lilly et al., 2004: p128).
2.13 THE DEVELOPMENT OF EARLY LANGUAGE
Reading is defined by Ruddell and Ruddell (1995) as, „The use of one’s language to decode
and comprehend text’ (Eliason et al., 2008: p191). Eliason also states that the foundation of
literacy is language development. Children need to have a deep understanding of language
before they are able to read and write. According to Bishop (2002; as in Carr 2006: p18),
some children‟s cognitive development is of a normal standard, while their language
development is delayed.
De Witt (2009: p106) states that information is received through reception, or communicated
through expression, by means of language. Children need to be able to communicate in
sentences, have a vast vocabulary, clear pronunciation, have an understanding for words, be
able to use proper sentence structure, syntax or grammar, and be able to express themselves,
their needs, wants and desires (Eliason et al., 2008: p191-192; Gordon et al., 2008: p100).
Matlin (in De Witt 2009: p106), states that there are four components of language that need
to be understood and mastered for one to be able to communicate meaningfully. They
include:
i.) Phonology
Phonology refers specifically to the basic sounds that are used to make up a language. Each
language has a specific set of phonological rules and norms, which determine how the
phonemes will be combined in order to create meaning in a language (De Witt, 2009: p106;
Hoff, 2007: p238; Lilly et al., 2004: p17, McGuinness, 2005: p23). Phonology also refers to
the ability to hear and discriminate between sounds, as well as the articulation of sounds in
speech (De Witt, 2009: p106).
45
ii.) Morphology
A morpheme is the smallest component of sound which has significance and importance.
Sound units are combined together to create words that have meaning (De Witt, 2009: p107;
http://www.wisegeek.com/what-is-morphology.htm; 30/06/09).
iii.) Syntax
Syntax refers to the grammatical set of rules and regulations that exist in a language. It refers
to the way in which words are arranged in sentences. Firstly, understandable words need to
be constructed from sounds; then words are placed in a particular order to make a sentence
that conveys meaning. Then complete sentence structure and overall composition is done
according to the child‟s understanding of syntax (De Witt, 2009: p107; Eliason et al., 2008:
p193; Lilly et al., 2004: p20, McGuinness, 2005: p329).
iv.) Semantics
Semantics refers to the meanings of words, which have been connected through language.
Abilities such as understanding vocabulary, phrases, the ability to define and to categorise,
the identification of synonyms, antonyms, absurdities and ambiguities, all play an important
role in semantics. This aspect of language is indispensable in ensuring that thought processes
are possible. Semantics is vital in ensuring that speech is meaningful and purposeful (De
Witt, 2009: p107; Eliason et al., 2008: p193; Lilly et al., p20).
According to Vander Zanden (in De Witt 2009: p108), ‘The level of the child’s
developmental process is determined by his vocabulary. Not only is the scope of his
vocabulary involved here, but also his ability to use language as an instrument of thought’.
2.14 THE DIFFERENCE BETWEEN LANGUAGE AND LITERACY
All areas of the curriculum should encompass language and literacy as essential aspects of
development.
2.14.1 Language
Language should be seen as a mechanism of thought, personal expression and social
communication (Eliason et al., 2008: p191). „Language acquisition is not only important for
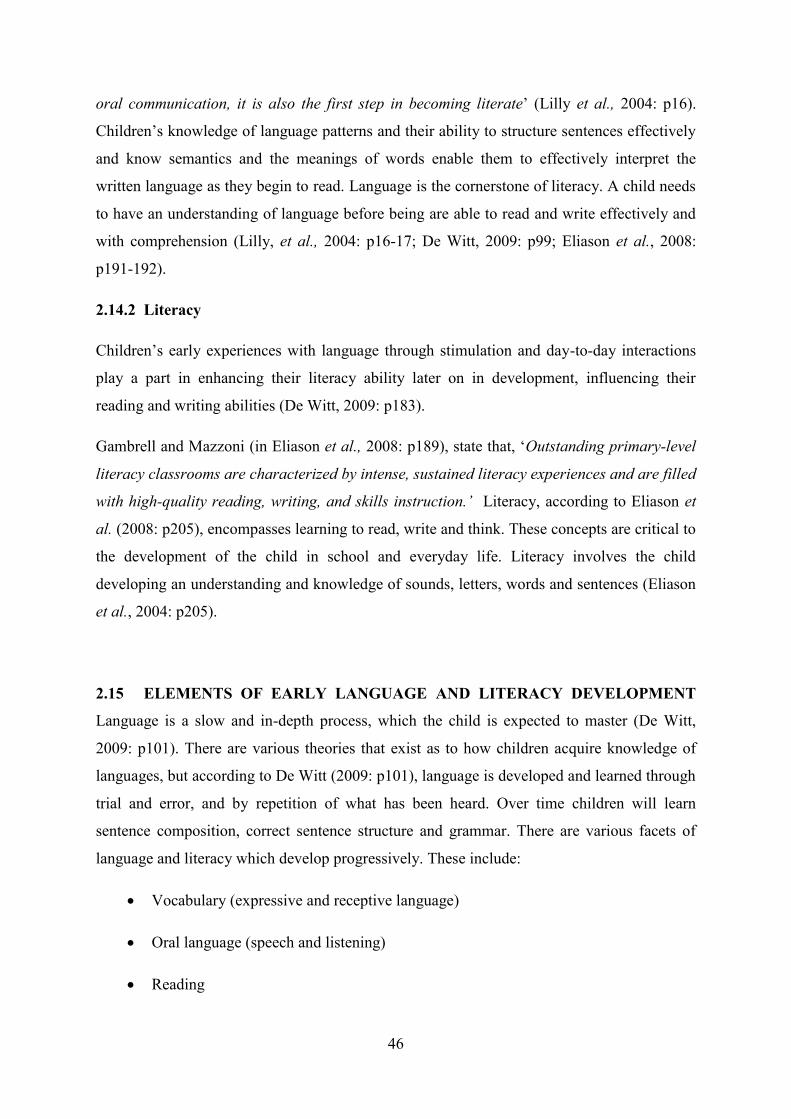
46
oral communication, it is also the first step in becoming literate‟ (Lilly et al., 2004: p16).
Children‟s knowledge of language patterns and their ability to structure sentences effectively
and know semantics and the meanings of words enable them to effectively interpret the
written language as they begin to read. Language is the cornerstone of literacy. A child needs
to have an understanding of language before being are able to read and write effectively and
with comprehension (Lilly, et al., 2004: p16-17; De Witt, 2009: p99; Eliason et al., 2008:
p191-192).
2.14.2 Literacy
Children‟s early experiences with language through stimulation and day-to-day interactions
play a part in enhancing their literacy ability later on in development, influencing their
reading and writing abilities (De Witt, 2009: p183).
Gambrell and Mazzoni (in Eliason et al., 2008: p189), state that, „Outstanding primary-level
literacy classrooms are characterized by intense, sustained literacy experiences and are filled
with high-quality reading, writing, and skills instruction.’ Literacy, according to Eliason et
al. (2008: p205), encompasses learning to read, write and think. These concepts are critical to
the development of the child in school and everyday life. Literacy involves the child
developing an understanding and knowledge of sounds, letters, words and sentences (Eliason
et al., 2004: p205).
2.15 ELEMENTS OF EARLY LANGUAGE AND LITERACY DEVELOPMENT
Language is a slow and in-depth process, which the child is expected to master (De Witt,
2009: p101). There are various theories that exist as to how children acquire knowledge of
languages, but according to De Witt (2009: p101), language is developed and learned through
trial and error, and by repetition of what has been heard. Over time children will learn
sentence composition, correct sentence structure and grammar. There are various facets of
language and literacy which develop progressively. These include:
Vocabulary (expressive and receptive language)
Oral language (speech and listening)
Reading
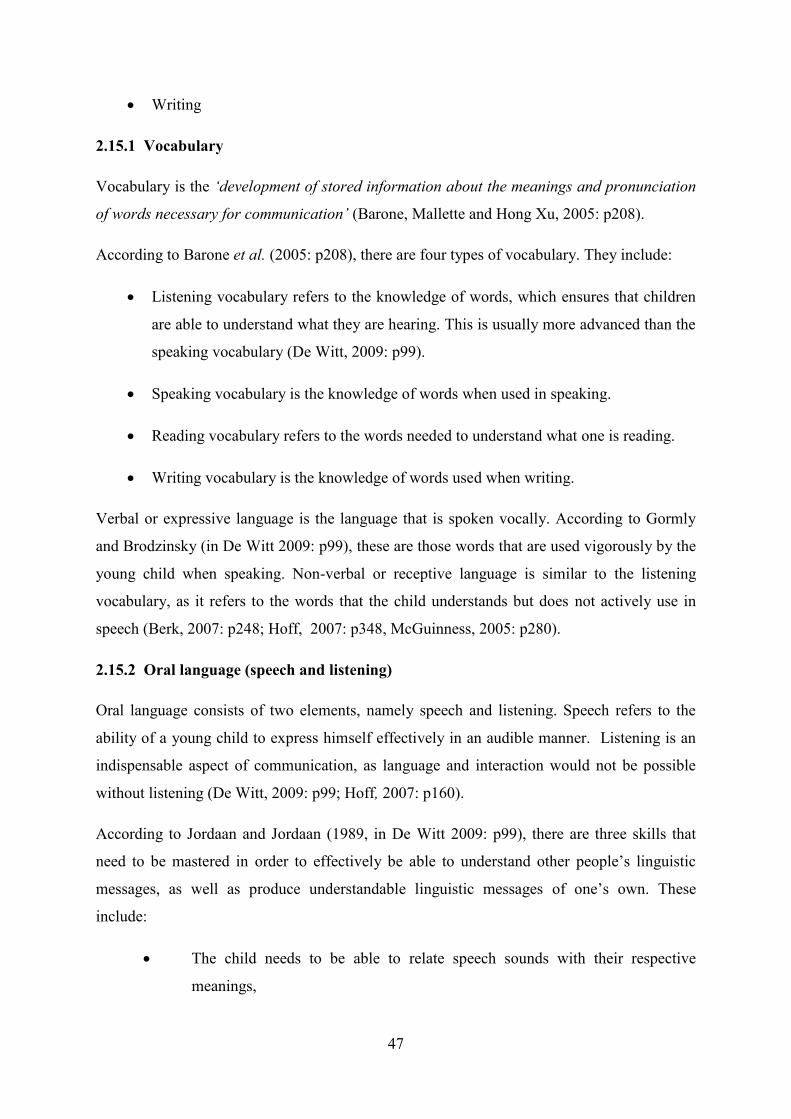
47
Writing
2.15.1 Vocabulary
Vocabulary is the ‘development of stored information about the meanings and pronunciation
of words necessary for communication’ (Barone, Mallette and Hong Xu, 2005: p208).
According to Barone et al. (2005: p208), there are four types of vocabulary. They include:
Listening vocabulary refers to the knowledge of words, which ensures that children
are able to understand what they are hearing. This is usually more advanced than the
speaking vocabulary (De Witt, 2009: p99).
Speaking vocabulary is the knowledge of words when used in speaking.
Reading vocabulary refers to the words needed to understand what one is reading.
Writing vocabulary is the knowledge of words used when writing.
Verbal or expressive language is the language that is spoken vocally. According to Gormly
and Brodzinsky (in De Witt 2009: p99), these are those words that are used vigorously by the
young child when speaking. Non-verbal or receptive language is similar to the listening
vocabulary, as it refers to the words that the child understands but does not actively use in
speech (Berk, 2007: p248; Hoff, 2007: p348, McGuinness, 2005: p280).
2.15.2 Oral language (speech and listening)
Oral language consists of two elements, namely speech and listening. Speech refers to the
ability of a young child to express himself effectively in an audible manner. Listening is an
indispensable aspect of communication, as language and interaction would not be possible
without listening (De Witt, 2009: p99; Hoff, 2007: p160).
According to Jordaan and Jordaan (1989, in De Witt 2009: p99), there are three skills that
need to be mastered in order to effectively be able to understand other people‟s linguistic
messages, as well as produce understandable linguistic messages of one‟s own. These
include:
The child needs to be able to relate speech sounds with their respective
meanings,

48
Associating words with the symbols,
Mastering the rules of the language structure, so as to create a level of
understanding.
2.15.3 Reading
When learning about reading, young children‟s reading not only refers to the written
language, but to books, print and illustrations (Barone et al., 2005: p9). Emergent reading
occurs in the early years of development; it refers to concepts such as colour, shape and
sound. According to Eliason et al. (2008: p216), children need to have numerous reading
experiences, which sharpen their visual and aural perceptions, before they are able to develop
a reading facility. It is important that when children begin the reading process, that they first
develop an understanding of reading, why we read, and what we read (Berk, 2006: p300;
Hoff, 2007: p454).
When starting to read, children are unaware that each page follows on from the previous one.
They merely observe the illustrations on each page. After a while, they will begin to realise
that the book carries a story line, and that each page follows on from the previous one
(Barone et al., 2005: p9). According to Barone et al. (2005: p9), „As young children develop,
they begin to read a book by using book language’.
According to Raines and Canady (1990: p5, in Eliason, et al., 2008: p216), the reading
process is no longer considered as a ‘word-by-word decoding process designed to unlock the
meaning embedded in the print.’ They state, however, that comprehensive literacy teachers
view reading as a process ‘of constructing meaning from interacting with the print, relating
the information on what one already knows, and teaching specific skills’.
Once children have developed an understanding of the alphabet and letter sounds, they are
able to gradually begin the reading process in a more in-depth way. According to Barone et
al. (2005: p11), there are three dominant reading behaviours which are portrayed by
beginning readers. Firstly, they begin by reading aloud, by hearing the words out loud it helps
them decipher and de-code the words. Secondly, children often use their finger as a pointer at
the words they are reading. Thirdly, children begin by reading word by word, and often have
no understanding and meaning of what is being read, they are merely de-coding the words.

49
2.15.4 Writing
Since Clay (1975) and Read (1975) completed their research in the 1970s, we have come to
understand the importance of children‟s writing from a young age. They helped teachers and
parents to understand the development of writing in young children, emphasising the
importance of scribbles and early writing (Gordon et al., 2008: p511; Barone et al., 2005:
p33). Research done by Labbo (1996), Rowe (1994) and Dyson (1992), has shown the
importance of the social context in the writing situation (Barone et al., 2005: p33).
Scribbling is the first form of writing that emerges in the young child (Gordon et al., 2008:
p511). These scribbles progress through a series of developments, beginning at uncontrolled
scribbles, which refer to random marks on the paper. Figure 2.2 is a clear representation of
uncontrolled scribbling. This representation of scribbling clearly shows that there is no
„order‟ to the picture. By looking at the picture we would not be able to recognize the image
as a green frog. The figures below show a comprehensible illustration of the stages of writing
that children go through, starting at scribbling, moving on to writing with meaning and
purpose. Children have an idea in mind when scribbling and they can often name the scribble,
although this frequently changes each time the child is questioned (Barone et al., 2005: p33-
37).
Figure 2.3 Uncontrolled scribbling, A green frog
(Barone et al., 2005: p27)
Following uncontrolled scribbling is controlled scribbling, where the child is able to show
objects in a more systematic manner. Figure 2.2 is a representation of a green goblin.
Children‟s images at this stage gradually become more noticeable and recognisable.
Distinctions are also able to me made between their drawing scribbles which are larger, and
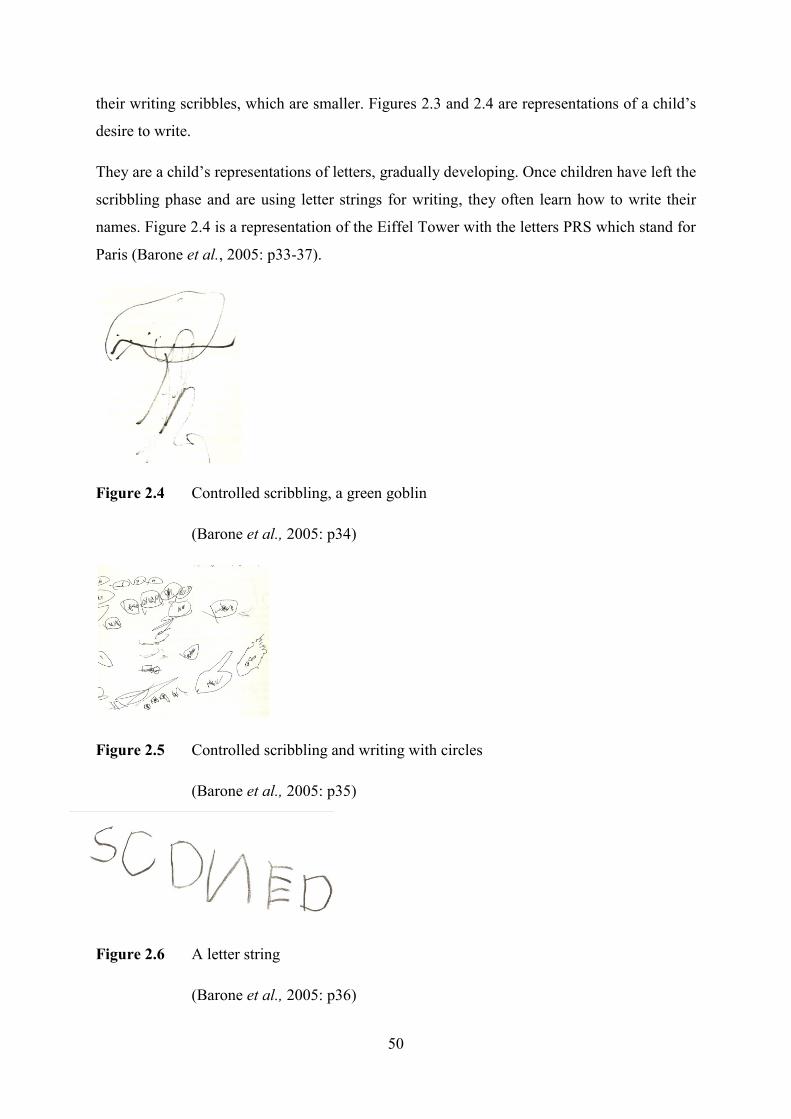
50
their writing scribbles, which are smaller. Figures 2.3 and 2.4 are representations of a child‟s
desire to write.
They are a child‟s representations of letters, gradually developing. Once children have left the
scribbling phase and are using letter strings for writing, they often learn how to write their
names. Figure 2.4 is a representation of the Eiffel Tower with the letters PRS which stand for
Paris (Barone et al., 2005: p33-37).
Figure 2.4 Controlled scribbling, a green goblin
(Barone et al., 2005: p34)
Figure 2.5 Controlled scribbling and writing with circles
(Barone et al., 2005: p35)
Figure 2.6 A letter string
(Barone et al., 2005: p36)
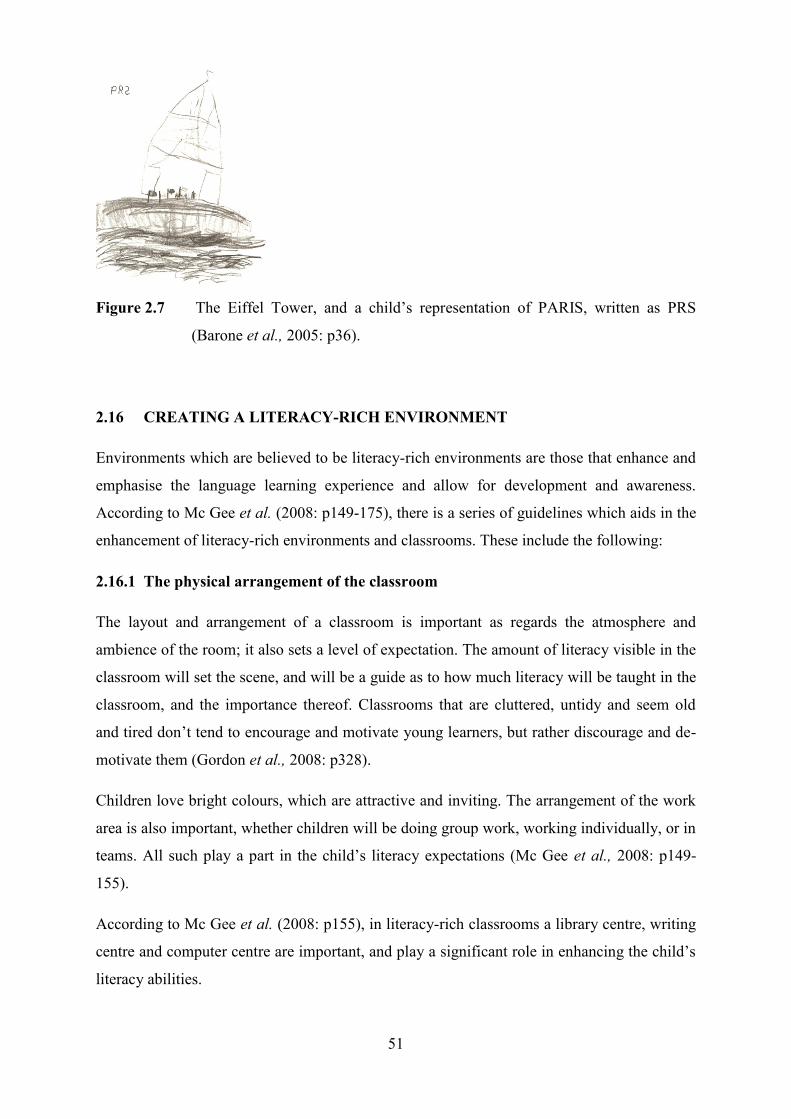
51
Figure 2.7 The Eiffel Tower, and a child‟s representation of PARIS, written as PRS
(Barone et al., 2005: p36).
2.16 CREATING A LITERACY-RICH ENVIRONMENT
Environments which are believed to be literacy-rich environments are those that enhance and
emphasise the language learning experience and allow for development and awareness.
According to Mc Gee et al. (2008: p149-175), there is a series of guidelines which aids in the
enhancement of literacy-rich environments and classrooms. These include the following:
2.16.1 The physical arrangement of the classroom
The layout and arrangement of a classroom is important as regards the atmosphere and
ambience of the room; it also sets a level of expectation. The amount of literacy visible in the
classroom will set the scene, and will be a guide as to how much literacy will be taught in the
classroom, and the importance thereof. Classrooms that are cluttered, untidy and seem old
and tired don‟t tend to encourage and motivate young learners, but rather discourage and de-
motivate them (Gordon et al., 2008: p328).
Children love bright colours, which are attractive and inviting. The arrangement of the work
area is also important, whether children will be doing group work, working individually, or in
teams. All such play a part in the child‟s literacy expectations (Mc Gee et al., 2008: p149-
155).
According to Mc Gee et al. (2008: p155), in literacy-rich classrooms a library centre, writing
centre and computer centre are important, and play a significant role in enhancing the child‟s
literacy abilities.

52
2.16.2 Materials
According to Roskos and Neuman (in Mc Gee et al., 2008: p159), in each classroom there
needs to be an abundance of materials which are diverse, wide-ranging, authentic, accessible
and located in areas where they will be utilised. The materials in a classroom should grab the
young child‟s attention; they should intrigue them and keep their interest. Materials should be
age-specific, and should meet the child‟s developmental level, the areas of interest and the
instructional needs (Lilly et al., 2004: p84-85; Mc Gee et al., 2008: p159).
The various elements of early literacy need to be accounted for. So provision needs to be
made for the child‟s literature and the materials needed for early writing. According to
Chomsky (1972, in Mc Gee et al., 2008: p160), the child‟s language development is directly
proportional to the child‟s experience with literature. According to a study done by Morrow
(1992, in Mc Gee et al., 2008: p160), children that are exposed to good quality, and varied
literature tend to have a higher level of reading achievement.
2.16.3 Daily schedule and routine literacy activities
The daily schedule, and the amount of time each day that the children are exposed to literacy
greatly influences the child‟s literacy development. Time for reading, writing and allowing
children to become creative and experience literacy is crucial. Children need to understand
the importance of literacy and should also regard this time as precious. Literacy activities can
take place in three, equally important structures, namely small groups, whole-class interaction
or one-to-one (Mc Gee et al., 2008: p162-166).
2.16.4 Continuous assessment
Assessment is critical in determining each individual child‟s abilities. All children learn and
develop in their own way and at their own pace. Teachers and parents assess children, in
order to find out the child‟s level of development, the way in which the child learns, various
skills and behaviours and whether the educational goals are being met (Mc Gee et al., 2008:
p167).
According to Hills (1993) and others, (in Gordon, et al., 2007: p246), the purpose of
assessing children is primarily for:
Planning education (DAP) and communicating with the parents;
Identifying children with special needs;

53
Program evaluation and accountability.
Monitoring a child‟s development and learning is also an important aspect of assessment in
early childhood.
2.16.5 Culturally sensitive and integrated curriculum
The curriculum consists of a programme for learning, related to the disciplines of „language
arts and literature, including reading, writing, spelling, social studies, science, mathematics,
art, music, health and physical education’ (Mc Gee et al., 2008: p168). The curriculum needs
to be integrated, working together for overall achievement. Units of education and teaching
are pre-arranged around a broad theme that incorporates learning concepts across the
curriculum (Mc Gee et al., 2008: p169-171).
2.16.6 Developmentally appropriate curriculum
The programme that is being used for any child needs to be appropriate to the child‟s level of
development, abilities and needs. The ways in which focus areas, such as literacy,
mathematics and life skills develop also need to be considered (Gordon et al., 2008: p333-
336; Mc Gee et al., 2008: p172-173).
According to Mc Gee et al. (2008: p173), there are three critical roles of teachers, in helping
children achieve challenging goals:
Teachers need to be knowledgeable about the range and variety of development;
Teachers need to be able to assess individual children, and establish their position
in the range of development;
Teachers need to be able to devise goals and prepare instruction that will help
children reach their goals.
2.17 LIFE-SKILLS DEVELOPMENT
Teaching children the value of life may seem too much to comprehend, but through a broken-
down approach and step-by-step programme, one is able to educate them in terms of the basic
attitudes and values of life (Hendrick et al., 2007: p166). Life skills and concepts aid in the
overall development of the young child. Concepts of being and belonging, as well as
54
encouraging enquiry and intrigue, questioning, social interaction, self-esteem and self-worth,
all play an important role in the development of the child in totality.
Each child needs to be seen as an individual, with specific needs and abilities. It is imperative
that all children be catered for and that each child be seen as a whole. Life skills and basic
concepts are important in the cognitive development of children. This aspect of cognitive
development plays a significant role in the development of the child in totality.
Children have a desire to learn and gain knowledge and abilities; this zest often increases as
the child matures. It is imperative to preserve the child‟s desire to learn by providing learning
situations, fostering curiosity and allowing for inquisitiveness in young children (Eliason et
al., 2004: p41).
A developmentally appropriate practice is one that is suitable for young children. It ensures
the provision of a curriculum and environment that are right for the developmental needs of
children, characterized by their age, gender, personalities, abilities, likes and dislikes
(Hendrick et al., 2007: p9). Gordon et al. (2008: p50-51), state that a Developmentally
Appropriate Practice (DAP) is one that is based on young children‟s development, after
observing their interests, abilities and needs.
Education is then provided for in an activity-based learning environment which is learner-
centred, teacher-directed and facilitated; it promotes academic preparation and is focused on
skills and abilities‟ development.
Some essential aspects of development in early childhood include the following which need
to be developed and encouraged in early childhood, in order to assist in enhancing life skills:
Experiences
Because early childhood education forms such a strong foundation for future learning, the
need for experiencing and understanding is paramount. Children learn through experiencing;
they need to use their senses and gain insight by means of touch, taste, sight, smell and sound
(De Witt, 2009: p122; Gordon et al., 2008: p567). Concepts need to be taught using different
methods of explanation. Repetition is the key to enhancing deep understanding and insight
(Eliason et al., 2004: 41-42). According to Eliason et al., (2004: p42), children need
experiences that encourage them to manipulate, explore, use their senses, build, create,
discover, construct, take apart, question and understand the world that they live in.
55
Experiences allow for a child to interpret, understand, conceptualise and categorise through
active, engaged and involved learning.
Choices and decisions
An important aspect of development and „growing up‟ involves the ability to make decisions
through critical thinking and analysis. By allowing children to make a limited amount of
decisions, it engages them in the learning process, as well as giving them responsibility and
accountability. According to Elliason et al. (2004: p42), Glasser (1997) suggests that teachers
should not place too much emphasis on the students, but rather on the curriculum. Glasser
proposes that at least one block period should be set aside each day in which children can
choose how they want to spend their time.
According to Hendrick et al. (2007: p244), encouraging children to make their own decisions
fosters creativity. Creativity needs to be engineered from within a child, rather than the child
be told what they need to do and when. By the child being able to make his/her own decisions
the teacher is not only empowering the child, but also allowing for the child‟s creativity and
personality to shine through.
Curiosity and questioning or enquiry
Children are inquisitive beings, they thrive on gaining knowledge and understanding of how
things work and gaining insight into the unknown. Most people are born with a curiosity to
learn, explore and understand the world (De Witt, 2009: p113; Eliason et al., 2004: p43).
Teachers, care-givers and carers can enhance and encourage children‟s curiosity by
encouraging them to answer any questions which the children may have. Exploring their
surroundings can also be useful in raising their curiosity and intrigue (De Witt, 2009: p115).
Through exploration and enquiry the attention span of a child increases (Gordon et al., 2008:
p462). There should be many concrete, tactile, sensory experiences which children can
encounter and use to make sense of their world (Gordon et al., 2008: p462). Adults should
always encourage children to think creatively and concretely about any challenges they may
encounter, supporting children when their ideas fail, encouraging them to pursue the
challenge and enhance their critical thinking (Eliason et al., 2004: p43).
56
Modelling
Modelling is an aspect of teaching and learning which is vital, as it enables the teacher to
model concepts that are yet to be understood, as well as the correct use of language (De Witt,
2009: p218; Gordon et al., 2008: p139; Woolfolk, 2007: p233). Teachers not only model
knowledge that is to be taught to the learners, but also model good skills, attitudes and values
which the learners observe and adopt (Gordon et al., 2008: p196; Eliason et al., 2004: p45).
Often children are able to understand concepts and ideas more effectively once having had
the concept demonstrated to them (Gordon et al., 2008: p139; Eliason et al, 2004: p45).
Rich socio-cultural heritage
According to New (1999 in Eliason et al., 2004: p45), ‘Cultural habits and traditions in
homes and communities serve as contexts for children’s development; they also provide
content as well as opportunities for learning.’ The way in which young children learn and
what they learn will depend on their environment, their culture and their life-experiences.
Each family and culture has its specific traditions, norms, beliefs and ways of doing things.
These all need to be considered when dealing with young children.
Diversities need to be seen as a positive attribute in children, as they can teach and educate
others in terms of their own heritage (Eliason et al., 2004: p45; Gordon et al., 2008: p462).
Interaction with others
Through interaction, children learn from one another. This enhances their affective and
cognitive perceptions and abilities. Oral and listening abilities are enhanced through
interaction; children learn to become sensitive to one another, they learn basic life skills, and
they learn what is acceptable and what is not. This is an important aspect of development for
the young child in his/her totality (Eliason et al., 2004: p45; De Witt, 2009: p227-228).
2.18 THE IMPORTANCE OF TEACHING CONCEPTS TO THE YOUNG CHILD
Aubrey (1997: p29) believes that „Teaching which focuses on fine-grained analysis of the
way teaching and learning interact will contribute to the development of teachers’ and
children’s understanding.‟ Teaching is not merely a process of reciting knowledge, but is

57
rather an interactive process which enhances the child‟s understanding and so aid in his/her
development (De Witt, 2009: p212).
The learning of concepts forms the structure and foundation of knowledge. It equips children,
enabling them to organise and categorise any information. During early childhood, children
are constantly acquiring fundamental concepts and learning fundamental process skills.
Haydon (2006: p6) believes that education, both at home and in the school situation, should
be seen as a route to the spiritual, moral, social, cultural, physical and mental development of
the child, and it therefore influences the wellbeing of the individual.
Concepts are the cornerstone required in the gaining of knowledge and understanding
(Gordon et al., 2008: p192, Woolfolk, 2007: p286-287; http://www.project2061.
org/publications/earlychild/online/experience/lind.htm, 01/ 10/08).
2.18.1 The child’s cognitive development
Children begin the process of learning from a very young age, and move from one stage of
cognitive development to the next, where they are constantly being stimulated by their
environment and the happenings therein (De Witt, 2009: p159 & p277; Gordon et al., 2008:
p456). Cognitive development, according to Maxim (1992: p91), ‘refers to the changes in
mental structures that occur as children explore the world around them’.
Developing and encompassing an understanding of children‟s thought patterns, their
understanding and reflections are essential aspects of teaching and educating (Gordon, et al.,
2008: p456). Although each child is born with his/her own capacity and intelligence, the
circumstances and situations into which one is born plays, a vital role in the child‟s
development and advancement as human beings (Eliason et al., 2004: p45).
A teacher needs to have an understanding of the children in the class, and needs to be aware
of their thinking patterns. The process of cognitive development, according to Piaget, is
exceptionally interesting, and one that creates a way of understanding and clarifying the
world into which they have been born.
2.18.2 Language and cognitive development
The relationship that exists between language and cognition is important, as language is our
means for understanding the child‟s thinking patterns and thoughts. ‘Cognition and language

58
generally become more interdependent when development progresses’ (Gordon et al., 2008:
p457).
2.19 LACK OF STIMULATION
According to a web address dedicated to the wellbeing of young children
(http://www.childwelfare.gov/pubs/focus/earlybrain/earlybraina.cfm: 07/07/08), there are
major negative effects that result from a lack of stimulation in young children. According to
Perry (1998: http://www.childtrauma.org/ctamaterials/biolo_relativity.asp, 10/7/08), at the
age of three, the brain has reached 90 percent of its adult size and the child‟s emotional,
behavioural, cognitive and social foundation is in place for the rest of the individual‟s life
(Perry, 1998: http://www.childtrauma.org/ctamaterials/biolo_relativity.asp, 10/7/08).
According to Starkey and Klein (Ed. Saracho & Spodek, 2008: p270), if sufficient cognitive
enrichment is not provided during the early years, a gap in the child‟s knowledge and ability
to cope with life takes root. A detrimental result of a lack of stimulation is when the neuronal
pathways whither and die. This has devastating effects on young children, as they may not be
able to achieve any further development and growth
(http://www.childwelfare.gov/pubs/focus/earlybrain/ earlybraina.cfm: 07/07/08; De Witt.
2009: p78-79; Brierley, 1994: p6).
The lack of stimulation in the child can negatively affect the child physically, permanently
disabling the child and detrimentally affecting his/her progress and growth. Children need to
be exposed to learning situations repeatedly in order to ensure and build the brain circuitry
which will enable the young child to develop (Gordon et al., 2008: p460).
The following type of drastic, global neglect can have detrimental effects on the child. The
extreme neglect of stimulation can cause the neuronal pathways, whose primary objective is
to provide for learning, to narrow and eventually disintegrate, causing permanent dysfunction
(http://www.childtrauma.org/ctamaterials/neuros~1.asp, 14/06/09). Intelligence is both a
result of genetic activity, and of stimulation. Even in children with high genetic cognitive
abilities, a lack of stimulation can be severely detrimental to their development, resulting in a
permanent cognitive disadvantage (http://www.childtrauma.org/ctamaterials/neuros ~1.asp,
14/06/09, http://www.childtrauma.org/ctamaterials/brain_II.asp, 14/06/09).
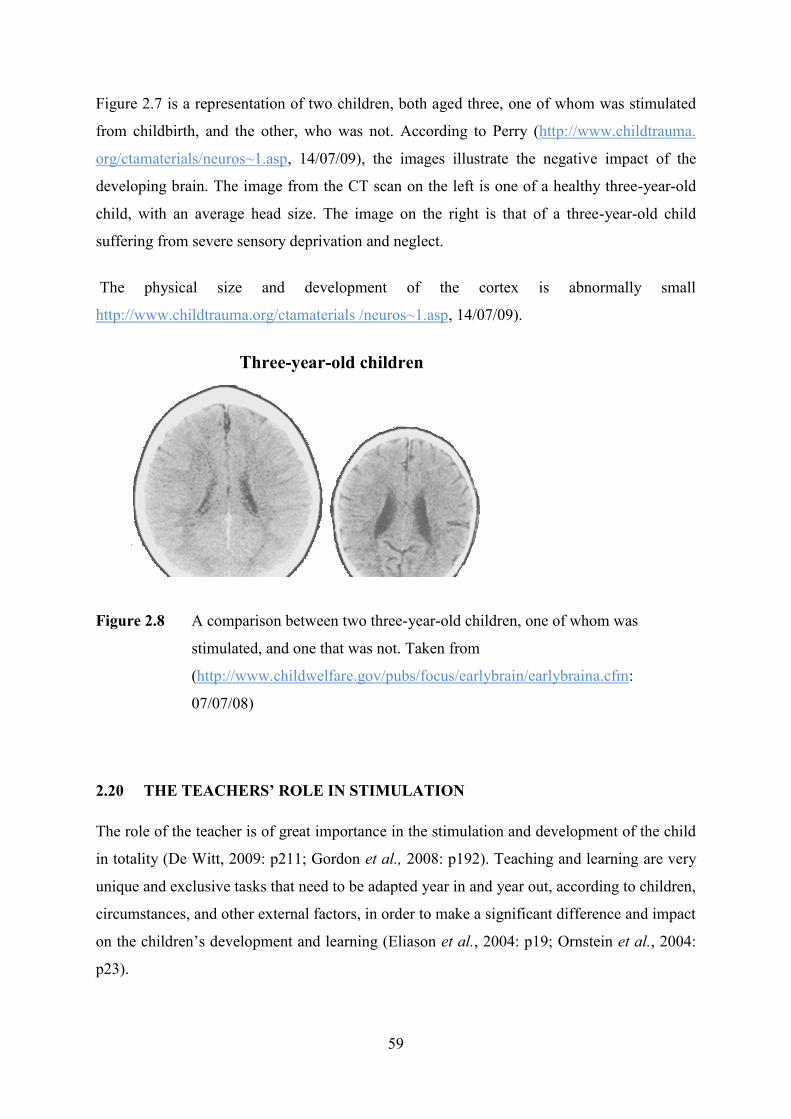
59
Figure 2.7 is a representation of two children, both aged three, one of whom was stimulated
from childbirth, and the other, who was not. According to Perry (http://www.childtrauma.
org/ctamaterials/neuros~1.asp, 14/07/09), the images illustrate the negative impact of the
developing brain. The image from the CT scan on the left is one of a healthy three-year-old
child, with an average head size. The image on the right is that of a three-year-old child
suffering from severe sensory deprivation and neglect.
The physical size and development of the cortex is abnormally small
http://www.childtrauma.org/ctamaterials /neuros~1.asp, 14/07/09).
Three-year-old children
Figure 2.8 A comparison between two three-year-old children, one of whom was
stimulated, and one that was not. Taken from
(http://www.childwelfare.gov/pubs/focus/earlybrain/earlybraina.cfm:
07/07/08)
2.20 THE TEACHERS’ ROLE IN STIMULATION
The role of the teacher is of great importance in the stimulation and development of the child
in totality (De Witt, 2009: p211; Gordon et al., 2008: p192). Teaching and learning are very
unique and exclusive tasks that need to be adapted year in and year out, according to children,
circumstances, and other external factors, in order to make a significant difference and impact
on the children‟s development and learning (Eliason et al., 2004: p19; Ornstein et al., 2004:
p23).

60
The approaches that individual children take, their reactions and perspectives are different
from one another; the ways in which they learn are different, and the entire ethos in the
classroom is experienced differently from child to child. These all need to be accounted for.
Leinhardt (2001: p334), believes that teaching „is specific with respect to task, time, place,
participants, and content, and that different subjects vary in those specifics’.
According to Seefeldt et al. (1998: p479), the role of the teacher is to organize and position
the child‟s environment and conditions of learning to enable the child to develop formal
knowledge. Vygotsky (in Hendrick et al. 2007: p314), believes that the teacher‟s role is to be
a sensitive observer and guide. By doing this, the teacher needs to be aware of the child‟s
abilities and current developmental level, as well as the future potential development and
learning that are going to take place, and how to conceptualise this learning in order to create
a real learning experience for the child (Hendrick et al., 2007: p314).
Early childhood education is primarily aiding the movement from the lower mental functions
to the higher mental abilities. This educational activity needs to be facilitated by the teacher,
by providing leading activities (Hendrick et al., 2007: p314). Haydon (2006: p6) states that
education should be viewed as a „route to equality of opportunity for all, a healthy and just
democracy, and productive economy, and sustainable development.‟
According to the „Policy for Early Childhood Development Centres‟ in the Western Cape, an
ECD Centre (Early Childhood Development Centre) is any „building or premises maintained
or used for the care of children’ (2003: p2). Early Childhood Development Centres include
playgroups, crèches, aftercare centres, pre-schools and nursery schools (ECD Centre Policy
Document, 2003: p2).
The National Curriculum Statement gives a clear and detailed outline of what the Council of
Education Ministers desire to see happening in modern South African classrooms regarding
teaching and learning. This however refers to the formal schooling situation, from Grade 1.
The National Curriculum Statement (2002: p9) envisages teachers who are "qualified,
competent, dedicated and caring and who will be able to fulfil the various roles outlined in
the Norms and Standards for Educators’ (Government Gazette No 20844, 2002: p9).
Teachers are envisaged as „mediators of learning, interpreters and designers of learning
programmes and materials, leaders, administrators and managers, scholars, researchers and
lifelong learners, community members, citizens and pastors, assessors and learning
area/phase specialists‟ (NCS, 2002: p9).
61
With regards to the envisaged learner in the modern classroom, the curriculum aims to
develop the maximum potential of each learner, encouraging and ensuring effective and
active citizens of South Africa (Ornstein et al., 2004: p24). It also aims to create lifelong
learners who are confident and independent, literate, numerate and multi-skilled, who are also
compassionate and respect their environment (NCS, 2002: p8). This is such wonderful news,
that it should be the cornerstone of the leaders in this country to develop future leaders which
are educated and equipped to make a difference in this nation.
By stimulation and development from an early age, one can aid in the developmental level of
children, and effectively make a difference for them in the future (De Witt, 2009: p211;
Gordon et al., 2008: p192).
The National Curriculum Statement (2002) builds on the vision and values of the
Constitution and Curriculum 2005. These fundamental values of the Constitution include the
following (NCS, 2002: p7):
Social Justice and Equity;
Democracy;
Non-racism and non-sexism;
Ubuntu (human dignity);
An open society;
Accountability (responsibility);
Respect;
The rule of law;
Reconciliation.
The curriculum can play a vital role in creating awareness of the relationship between human
rights, a healthy environment, social justice and inclusivity. In particular, the curriculum
attempts to be sensitive to issues of poverty, inequality, race, gender, age, disability, and
HIV/AIDS (NCS, 2002: p8).
IQMS is an Integrated Quality Management System that consists of three programmes which
are aimed at enhancing and monitoring performance in the South African Education system.
According to http://www.elrc.co.za/UploadedDocuments/IQMS%20Training%20Manual.doc
(10/06/09), the three programmes which work in an inter-related manner with each other
include:

62
Developmental appraisal
This exists to appraise individual educators in a transparent manner with a view to
determining their areas of strength and weakness, as well as to draw up programmes for
individual development.
Performance measurement
The purpose of performance measurement is to evaluate the individual educators and teachers
for salary progression, grade progression, affirmation of appointments and rewards with
incentives.
Whole School Evaluation
This is to evaluate the overall effectiveness of a school, as well as the teaching and learning
that take place in the school.
For many years teachers in South African Schools have had no accountability processes in
place, and so scholars‟ unsatisfactory results have increased dramatically. IQMS exists to
benefit the school and the day-to-day effectiveness of efficient education (Cele, 2008: p35;
Howard, 2005: p4). The IQMS aids educators, teachers, schools and district offices to receive
support and aid should they have any needs, since they believe that the teacher is fundamental
in the procedure of educating and stimulating young children, and therefore a performance-
based teacher assessment and evaluation system is critical in improving the teaching and
learning process.
The cornerstone of the IQMS programme is „The performance of educators is the foundation
for achieving the goal of increased learner achievement. Evaluation of programmes and
practices is essential to any ongoing effort to improve any profession. Evaluation is not apart
from, but is a part of the educational process’. IQMS also exists to support and to promote
accountability, so that the weight of educating not only lies on the shoulders of the teacher,
but that they have accountability processes in place.
The monitoring of the institution or school‟s overall effectiveness is also an important facet
of the IQMS, as well as the evaluation and assessment of the educator‟s performance and
successes (Hayward, 2006: p4).
In doing this, it is vital that the IQMS ensures fairness, as well as seeking to maximise
transparency, so that the schools do not put on a show of teaching, but that their day-to-day

63
lessons and processes are of a high standard. There needs to be a spirit of excellence and
professionalism, as well as consistency in the schools (Hayward, 2006: p4).
According to Lindberg et al., (1985: p190), there are three primary roles of the teacher:
i.) „Create a climate conducive to investigation‟;
The attitude of the teacher towards the child and his/her abilities is one of great importance.
The teacher needs to be continually observing and to be taking note of what the child is
experiencing (Gordon et al., 2008: p193). The teacher needs to be aware of the
developmental level of the child regarding his/her cognitive understanding and abilities, as
well as make provision and gain access to more resources and stimuli to keep the child
entertained and enthralled (De Witt, 2009: p220).
ii.) „Observe cognitive comprehension in children‟s play'
It is very important for the teacher to observe the child during play and general day-to-day
activities, in order to see how he/she deals with problem-solving. Teachers and parents
should never interfere immediately after seeing a child struggling to complete a task
(Lindberg et al., 1985: p190). Children need to try, try and try again. There needs to be some
form of a fight and determination for children to attempt new tasks. After a while, when the
teacher can see that the child has struggled and is now becoming frustrated, the teacher can
then aid, support and advise.
The teacher should never tell the child what to do, but merely provide the child with
suggestions, and allow the child to make all the final decisions. It is imperative to support the
child emotionally; he/she needs to feel safe and secure. Praising the child, giving him/her
responsibilities and helping the child realise his/her strengths will all aid in the development
of independence (De Witt, 2009: p215).
iii.) „Ask questions to heighten a child‟s awareness‟
Very often when children complete a task, they are unaware of how they actually completed
the task, what steps they took to achieve the success, and in the same way, often children that
complete a task unsuccessfully are unaware why they are not succeeding. The role of the
teacher in such an instance is of great importance, as it is the teacher‟s strategic questioning
that will aid the child in understanding any concepts and principles (Lindberg et al., 1985:
p190). It is the role of the teacher to ask the child how the task had been completed. Why did
64
you do it that way? What made you think that would work? Did they have any advice for
their peers? And what had they tried prior to the success? (De Witt, 2009: p218)
2.21 THE IMPORTANCE OF PARENTAL INVOLVEMENT
Parents have specific rights and responsibilities in terms of directing, caring for and educating
their children. They are also mediators and legal guardians who act on behalf of their
children. In an article written by De Witt (2007: p2), it was stated that, from previous
research, it has become clear that ‘the participation and involvement of the caregiver
contributes to the quality of the implementation‟ of the intervention. The role that parents
play in their child‟s development is enormous and has great implications on the child in
his/her totality, including the cognitive, physical, emotional, social and spiritual development
(De Witt, 2009: p106).
According to Eliason et al., (2004: p49), it is the teacher‟s as well as the parents‟
responsibility to provide learning opportunities for children. Parents need to become involved
in their children‟s schooling, forming partnerships with teachers and educators. According to
Vygotsky (in De Witt, 2009: p106), adults and care-givers play a major role in the learning of
each child. Adults aid the child in constructing meaning and understanding, which in turn
assist in the process of discovery.
As part of parents‟ duties, they are required to take care of and sustain their children by
maintaining their physical, emotional, cognitive and social wellbeing. For this, meticulous
care and support need to be implemented. The basic provision of their physical and emotional
needs in the form of protection, nourishment, physical set-up, education and security is
necessary (Carr, 2006: p4; Meier et al., 2007: p143).
Finn (1998) in Eliason et al., has devised four parental interactions which he believes have
influence on the child‟s achievements:
The child‟s time needs to be structured and monitored. The child cannot merely be
left in front of the television all day. They need to have boundaries and set times for
activities, while also allowing time for freedom, exploration and discovery.

65
Self-actialization
Self-esteem
Social needs - belonging
Safety and Security
Physical survival needs
The child needs to be assisted with his/her homework. Children need guidance and
support. They need to be assured that they are on the right track, and also appreciate
their parents‟ input and direction.
It is important that parents discuss school matters with their child. These include
communication about activities at school, what the children are learning, friends and
basic day-to-day happenings.
A fundamental foundation of cognitive development and academic success is the
child developing a love and desire for reading. Reading in the home should be seen as
a fun activity that children and parents both enjoy.
As indicated in Abraham Maslow‟s Hierarchy of Needs (Figure 2.8), physical survival needs
are basic necessities in development and wellbeing, as well as forming the foundation of
human needs (http://www.pateo.com/images/maslowmaster4ts.gif, 10/8/08). Without that
basic foundation, further development and encouragement would not be possible and the
need for safety and security could not be met. Should this need for safety and security not be
met, the child will not be able to have a sense of belonging and acceptance. They will
therefore have a low level of self–esteem and sense of worth, with their need for self–
actualization not being adequately met (http://www.pateo.com/images/maslowmaster4ts.gif,
10/8/08).
Figure 2.9 Maslow‟s hierarchy of needs
(http://www.pateo.com/images/maslowmaster4ts.gif, 10/8/08;
Air, water, food, exercise,
sleep, warmth
Safety, security, shelter,
stability
Need to be loved, inclusion,
acceptance
Recognition, prestige,
status
Need to be innovative,
creative and learn

66
http://www.ruralhealth.utas.edu.au/comm-lead/images/Maslows-needs-
Pyramid.jpg, 24/06/09;
http://www.omafra.gov.on.ca/english/rural/facts/96-001f1.gif, 24/06/09)
In South Africa, some form of education is compulsory from the age of 7 to 15 years
(http://www.southafrica.info/about/education/education.htm, 11/6/09). This is however not
sufficient and will not provide the best opportunities for future leaders should they only begin
their learning careers at the age of seven. The effects of parental involvement in South Africa,
together with classroom education have been recognized not only to have a positive influence
on the child, but also to be a necessity (http://www.southafrica.info/about/
education/education.htm, 11/06/09).
According to Meier et al., (2007: p143), parental involvement in the School Governing Body
is imperative as various issues that affect children are brought to the light. Parents need to be
seen as active partners in education. They do not merely pay school fees, but need to interact
and to be a part of the school process. Investment in early childhood development from the
parents needs to commence at birth and to be incorporated with health care, nutrition and
attention to both the cognitive and the social aspects of child development.
This will enable the children to deal with the transition into Grade 1 and beyond (Meier et al.,
2007: p143).
According to the Department of Education (1997: p2) in Meier et al., (2007: p143), with the
implementation of Outcomes-based Education taking place in our schools, a greater level of
parental involvement and participation is required in order to develop a productive education
system, as parents and teachers are expected to share the responsibility of their children‟s
education. An increasing level of parental involvement is closely linked to greater academic
achievement, as well as implementing positive perceptions on parenting skills.
This includes maintaining a good relationship between the child and the parent, ensuring
emotional security for the child, as well as a strong connection of trust (Eliason et al., 2008:
p54; Gordon et al., 2008: p322).
67
Eliason, et al. (2000), together with Epstein, have devised a list of benefits for the parental
involvement with children (2008: p54), benefits of parental involvement for parents (2008:
p54) and the benefits of parental involvement for teachers (2008: p55).
Recommendations and ways in which parents can be actively involved in the education
process, as well as the benefits of parental involvement will be dealt with in Chapter 6.
2.22 PROBLEM AREAS BETWEEN PARENTS AND TEACHERS
Although a strong working relationship between parents and teachers is envisaged; very often
it is not quite as easily implemented. Often parents and teachers have uninformed
misperceptions about one another, and these more often than not tend to hinder the
development of a harmonious parent-teacher relationships (Kostelnik, et al. 1999: p240). As
teachers are dealing with little lives and their futures, the role they play is not merely a job,
but an ongoing continual process that not only involves the child‟s cognitive, but also his
emotional, social, physical and spiritual development (McAfee et al., 2007: p36).
Teachers need to remember not to be over-critical and to give solutions to every problem the
child may face. Rather, they should be a support for the parents and offer advice when asked,
as very often the circumstances are far beyond the teacher‟s control and understanding
(Eliason et al., 2007: p55). Educators also experience many problems in facilitating parental
involvement and continually feel that they need to „walk on egg-shells‟ around the parents of
the learners (Gordon et al., 2008: p306). In some cases, parents are unwilling to implement
any advice and recommendations made by teachers, as they feel that they know better. This
may cause teachers to feel undermined and ridiculed (Stretch, 2008: p10-11).
As a result of South Africa being such a diverse country with many cultures, races and ways
of doing things, teachers need to be aware of each individual child‟s family set-up and
subsequent ways of life. Teachers need to be sensitive towards the decisions that parents
implement and not have judgmental attitudes as a result of their culture.
Poverty is a serious factor that affects families in South Africa, especially in a single-parent
family. Often in single-parent families there is little time to get involved in the school as the
parent‟s primary focus is on earning a sustainable income to support their family. ‘Parents
can feel burdened by their parenting and work roles and may feel they do not have time to get

68
involved in their child’s school activities’ (Eliason et al., 2007: p55; Meier et al., 2007:
p144).
Through implementing previous research, it has now become clear that parents often
experience problems with the school system and structure, and as a result they develop
negative attitudes towards teachers and may feel unwelcome in the school. Some parents feel
there is not enough opportunity for them to get involved, and may feel that because of this
they are unwanted. Many parents feel they are uninformed about happenings in and around
the school, which is made worse by the poor communication between parents and teachers.
This communication gap causes negative and challenging situations. Often parents seem
unwilling to help children with their homework and activities they are given to complete at
home, since they feel that it is the teacher‟s duty to educate the child.
2.23 SUGGESTIONS ON HOW TO ENHANCE PARENTAL INVOLVEMENT IN
THE SCHOOL OR COMMUNITY
Parents need to not only keep in contact with children and their school education, but also to
focus on good relationships at home (Mindes, 2007: p47). Parents need to be involved in their
child‟s life from the early years, continually having the child‟s best interests at heart. Parents
constantly need to be encouraging their children, being consistent and loving, yet firm at the
same time. It is vital for parents to be involved in the classroom activities, as well as the
school programme, governing body and even school resources (Gordon et al., 2008: p307).
According to Singh, in Meier & Marais (2007: p148), ‘Parents, especially those from
impoverished environments need to be empowered if they are to make a meaningful
contribution to the education of their children‟. Parents need to be given the tools and shown
what to do to stimulate their children. They need to be educated as to what can be done to
provide their child with the best means possible. There are different exercises they can do that
will aid in their child‟s development (Meier et al., 2007: p148).
The role of a parent is not merely to provide the child with physical means such as food,
clothing and an education – but rather the role that parents play in a child‟s overall
development is enormous and irreplaceable.
There are various strategies that can be put into place, to encourage parental involvement:
69
Parents need to be informed of the happenings at the school, the progress and
development of their child, as well as to be involved with continuous assessment
(Meier et al., 2007: p149). Parents could get involved in transporting to and from
outings, as well as providing the other parents with a layout of the themes for the
term, and parents can research the theme, get books out the library for their children,
discuss the topic and reinforce what was learnt at school.
In this way parents are aware of what is being taught at school, and at the same time
allowing their child to pass on knowledge and any interesting facts they have learnt at
school. Teachers can inform the parents about various activities taking place that
create opportunities for the involvement of the parents (Meier et al., 2007: p149).
Teachers need to make the parents feel needed and wanted in the school environment.
Teachers should notify the parents on the importance of their involvement in the
development process. This will enable parents to understand that their role is of the
utmost importance, and the teacher and parents need to work hand in hand (Eliason et
al., 2007: p55).
Teachers need to understand the circumstances of the children in their class. They
need to be aware than in many cases both parents work, and it would be unreasonable
to expect projects to be done in one day, resources to be brought to school
immediately and to find instant gratification. The school should not place extra stress
and tension on the home situation and other relationships (Morrison, 1998: p474).
It is imperative that teachers and parents be given the opportunity to work together
and to discuss important issues. Time needs to be given for parent-teacher interaction
where both parties express their thoughts and worries regarding their child‟s social,
physical, cognitive and emotional development (Morrison, 1998: p474).
It is imperative for both the teacher and the parent to remember never to run down or
undermine the other in front of the child. Teachers desperately need parental support
and vice versa (Eliason et al., 2007: p55).
Teachers need to remember to always be professional and friendly to parents,
grandparents and family members. All parents need to be treated fairly and no
prejudice should be evident (Meier et al, 2007: p149).
There needs to be a great level of respect between teachers and parents. Personal
opinions need to be respected and appreciated, and no undermining and discouraging
should be allowed. Teachers need to respect parents and their views. Parents must
70
know that their opinions are appreciated, and must be aware that teachers are
available for any concerns or anxieties they may be feeling (Eliason et al., 2007: p56).
It is imperative for teachers to know each parent well. Teachers should refer to
parents on a first-name basis, and develop an interest in their lives, while at the same
time remaining professional. Parents should not merely be known as „Sarah‟s
mother‟, but rather as „Jenna‟ or Mrs Vosloo. Each person has a name, and as a sign
of respect teachers should refer to parents by their name (Eliason et al., 2007: p56;
Morrison, 1998: p474).
Make the school vision and mission statement clear to all parents, so that they are
aware of school ambitions and goals. Get the parents on-board, so as to take part in
the implementation of the school‟s mission statement (Meier et al, 2007: p149).
Clear lines of communication between the school and parents are imperative (Eliason
et al., 2007: p57).
According to Eliason et al (2007: p55), teachers should follow the same set of guidelines
when interacting with parents, as they would when interacting with children. These
guidelines include: „Be positive, supportive, interested, caring, objective, friendly and warm.
Work hard, using a variety of techniques to motivate, teach, build and strengthen’.
2.24 CONCLUDING REMARKS
The need for early childhood development and intervention has proven to be of great
importance and one that plays a fundamental role in the total development of the child. The
child needs to be seen in his/her totality, focusing on the cognitive, physical, emotional,
spiritual and social development (De Witt, 2009; Eliason et al., 2008; Gordon et al., 2008;
Seefeldt et al., 1998; Sternberg, 2008).
Cognitive development consists primarily of the following three aspects:
Mathematics
Literacy
Life skills

71
Each of the above aspects has been dealt with in detail regarding effective and valuable
elements of stimulation which influence development. Literacy, mathematics and life skills
should not be seen in isolation. And thus when educating, an integrated approach needs to be
taken focusing on the combined elements of each aspect.
Parental involvement plays a role in child development. Various parenting strategies,
techniques and beliefs all directly or indirectly influence the child‟s growth and development.
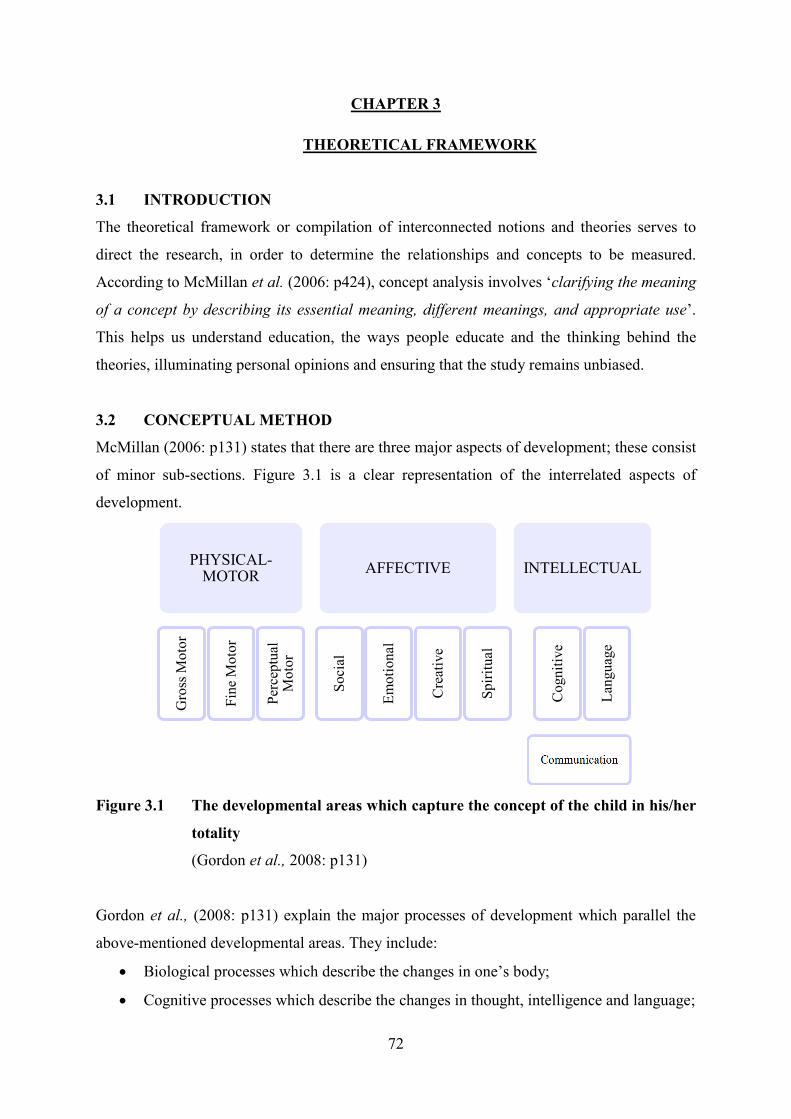
72
CHAPTER 3
THEORETICAL FRAMEWORK
3.1 INTRODUCTION
The theoretical framework or compilation of interconnected notions and theories serves to
direct the research, in order to determine the relationships and concepts to be measured.
According to McMillan et al. (2006: p424), concept analysis involves „clarifying the meaning
of a concept by describing its essential meaning, different meanings, and appropriate use‟.
This helps us understand education, the ways people educate and the thinking behind the
theories, illuminating personal opinions and ensuring that the study remains unbiased.
3.2 CONCEPTUAL METHOD
McMillan (2006: p131) states that there are three major aspects of development; these consist
of minor sub-sections. Figure 3.1 is a clear representation of the interrelated aspects of
development.
Figure 3.1 The developmental areas which capture the concept of the child in his/her
totality
(Gordon et al., 2008: p131)
Gordon et al., (2008: p131) explain the major processes of development which parallel the
above-mentioned developmental areas. They include:
Biological processes which describe the changes in one‟s body;
Cognitive processes which describe the changes in thought, intelligence and language;
PHYSICAL-MOTOR
Gro
ss M
oto
r
Fin
e M
oto
r
Per
ceptu
al
Moto
r
AFFECTIVE
Soci
al
Em
oti
on
al
Cre
ativ
e
Spir
itual
INTELLECTUALC
ognit
ive
Lan
guag
e
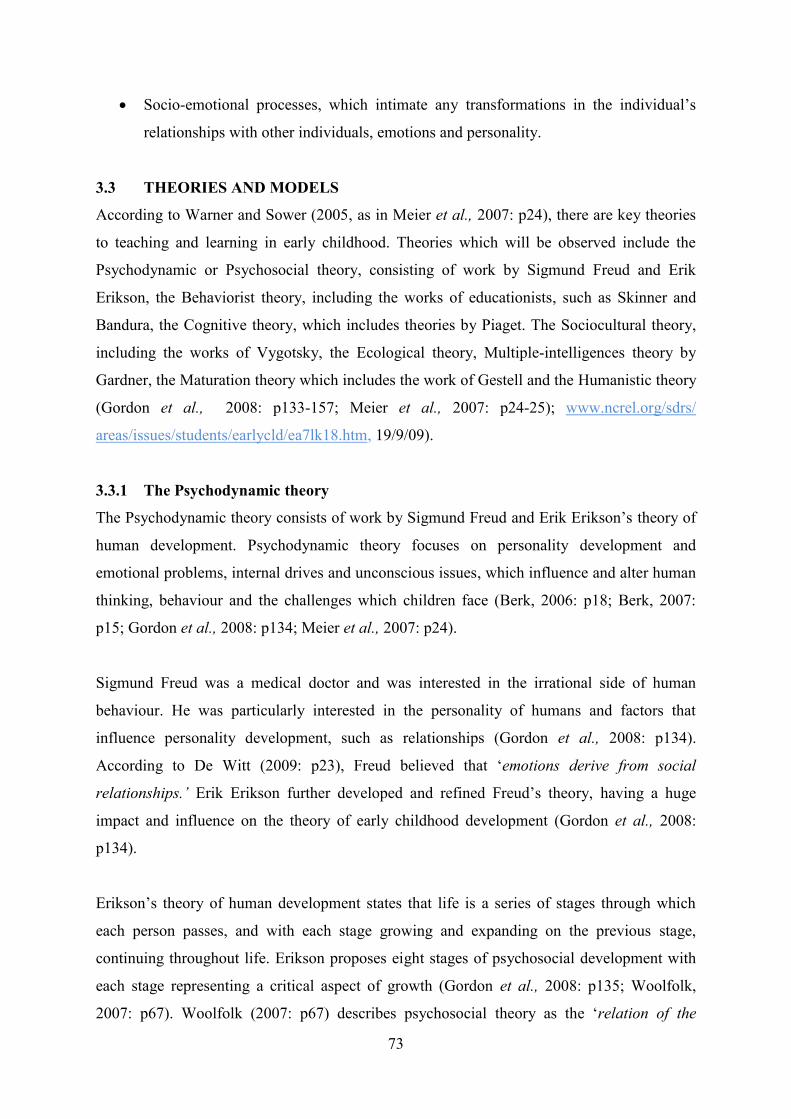
73
Socio-emotional processes, which intimate any transformations in the individual‟s
relationships with other individuals, emotions and personality.
3.3 THEORIES AND MODELS
According to Warner and Sower (2005, as in Meier et al., 2007: p24), there are key theories
to teaching and learning in early childhood. Theories which will be observed include the
Psychodynamic or Psychosocial theory, consisting of work by Sigmund Freud and Erik
Erikson, the Behaviorist theory, including the works of educationists, such as Skinner and
Bandura, the Cognitive theory, which includes theories by Piaget. The Sociocultural theory,
including the works of Vygotsky, the Ecological theory, Multiple-intelligences theory by
Gardner, the Maturation theory which includes the work of Gestell and the Humanistic theory
(Gordon et al., 2008: p133-157; Meier et al., 2007: p24-25); www.ncrel.org/sdrs/
areas/issues/students/earlycld/ea7lk18.htm, 19/9/09).
3.3.1 The Psychodynamic theory
The Psychodynamic theory consists of work by Sigmund Freud and Erik Erikson‟s theory of
human development. Psychodynamic theory focuses on personality development and
emotional problems, internal drives and unconscious issues, which influence and alter human
thinking, behaviour and the challenges which children face (Berk, 2006: p18; Berk, 2007:
p15; Gordon et al., 2008: p134; Meier et al., 2007: p24).
Sigmund Freud was a medical doctor and was interested in the irrational side of human
behaviour. He was particularly interested in the personality of humans and factors that
influence personality development, such as relationships (Gordon et al., 2008: p134).
According to De Witt (2009: p23), Freud believed that „emotions derive from social
relationships.’ Erik Erikson further developed and refined Freud‟s theory, having a huge
impact and influence on the theory of early childhood development (Gordon et al., 2008:
p134).
Erikson‟s theory of human development states that life is a series of stages through which
each person passes, and with each stage growing and expanding on the previous stage,
continuing throughout life. Erikson proposes eight stages of psychosocial development with
each stage representing a critical aspect of growth (Gordon et al., 2008: p135; Woolfolk,
2007: p67). Woolfolk (2007: p67) describes psychosocial theory as the „relation of the
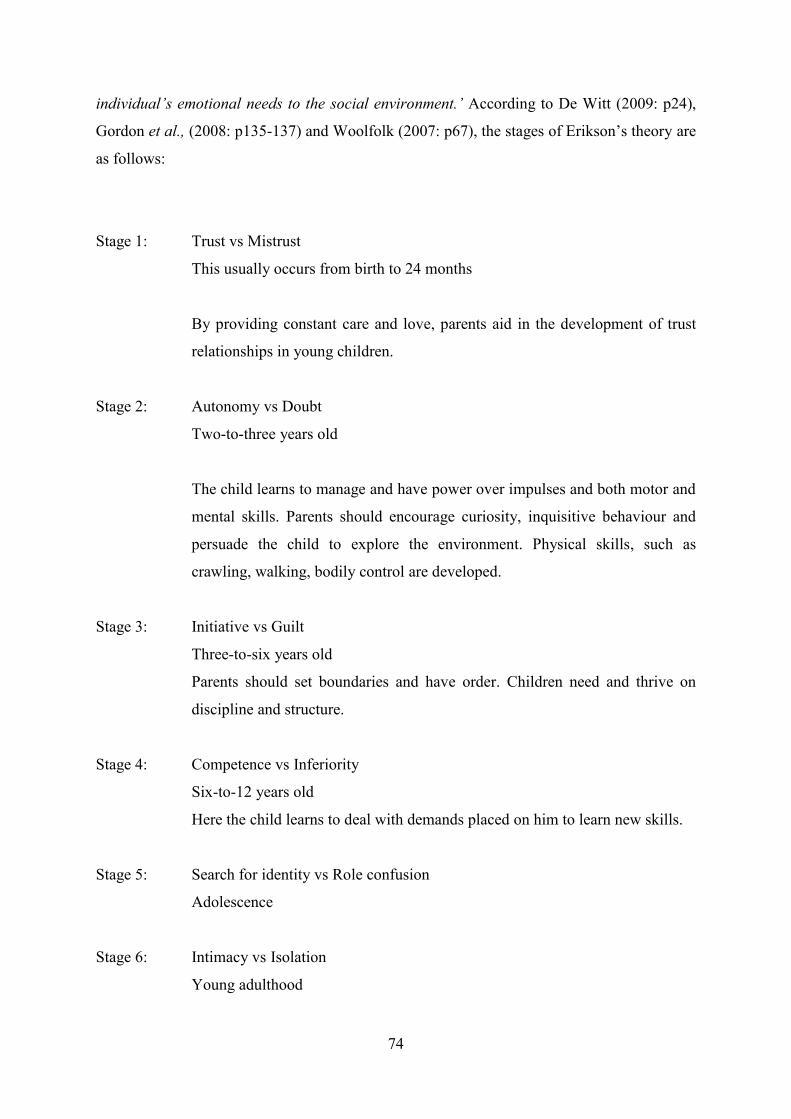
74
individual’s emotional needs to the social environment.’ According to De Witt (2009: p24),
Gordon et al., (2008: p135-137) and Woolfolk (2007: p67), the stages of Erikson‟s theory are
as follows:
Stage 1: Trust vs Mistrust
This usually occurs from birth to 24 months
By providing constant care and love, parents aid in the development of trust
relationships in young children.
Stage 2: Autonomy vs Doubt
Two-to-three years old
The child learns to manage and have power over impulses and both motor and
mental skills. Parents should encourage curiosity, inquisitive behaviour and
persuade the child to explore the environment. Physical skills, such as
crawling, walking, bodily control are developed.
Stage 3: Initiative vs Guilt
Three-to-six years old
Parents should set boundaries and have order. Children need and thrive on
discipline and structure.
Stage 4: Competence vs Inferiority
Six-to-12 years old
Here the child learns to deal with demands placed on him to learn new skills.
Stage 5: Search for identity vs Role confusion
Adolescence
Stage 6: Intimacy vs Isolation
Young adulthood
75
Stage 7: Generativity vs Stagnation
Grown-ups
Stage 8: Integrity vs Despair
Old age
Erikson‟s eight stages of development assist parents in providing guidelines for the roles that
adults should play in the lives of young children. He encourages play and emphasises the
importance of the adult as an emotional base for the child (Gordon et al., 2008: p137).
3.3.2 Behaviorist theory
The Behaviorist theory includes the works of educationists such as Skinner and Bandura, and
the theory describes both learning and development (Gordon et al., 2008: p138). According
to Woolfolk (2007: p206), behavioral learning theories are „explanations of learning that
focus on external events as the cause of changes in observable behaviors’. Gordon et al.
(2008: p138) state that the cornerstone of Behaviorism is that each child is born with a „clean
slate‟ on which they will expand and grow. According to Berk (2006: p19), in behaviorism
the focus of learning is on stimuli and responses.
Skinner developed a doctrine which states that a person can be compared with a vessel that
needs to be filled by carefully designed experiences. The environment controls all
experiences and all learned behaviour (Gordon et al., 2008: p139).
Bandura has developed another type of learning theory called social learning, which refers to
the socialisation of the young child (Berk, 2006: p20; Gordon et al., 2008: p139). This theory
observes the ways whereby the environment influences how children learn and then they
implement what has been learnt in their peer groups specifically. According to De Witt
(2009: p30 & p230), a principal way for children to obtain new prototypes of social
behaviour is through observational learning, where children learn vast amounts of new social
reactions simply by observing the actions of other people in their environment.
These responses are then stored in their memory in the form of mental images.
76
There are three primary types of learning which occur in the theory of behaviorism, namely
classical conditioning, operant conditioning and observational learning or modelling.
i.) Classical conditioning
This theory, discovered by Ivan Pavlov in the 1920s focuses on the acquisition of involuntary
emotional or physiological reactions, such as fear, muscle tension, salivation, sweating,
which are all automatic responses to stimuli (Woolfolk, 2007: p208). Shaffer and Kipp (2007,
in De Witt, 2009: p53) describe classical conditioning as „a conditioned reflex.’ Classical
conditioning trains humans to respond involuntarily to stimuli, through association (Gordon
et al., 2008: p139).
ii.) Operant conditioning
In operant conditioning, a connection is produced between two incidences, where the subject
learns that if he does something he can acquire a particular outcome (De Witt, 2009: p53).
Woolfolk describes operant conditioning as „learning in which voluntary behaviour is
strengthened or weakened by consequences or antecedents‟. Should the subject act in a
specific manner, he will either receive a reward or be punished. This behaviour is reinforced
through rewards, where the subject will learn that should they desire a specific result, a
specific action needs to first take place (De Witt, 2009: p53).
iii.) Observational learning or modelling
According to Gordon et al., (2008: p141), modelling is „a special kind of observational
learning; children learn from a teacher how to use materials and how to behave in group
settings’.
3.3.3 Constructivist theory
In contrast to the behaviourist theory which encourages learning in a stimulus-response
manner with learning by association, the Constructivist theory is based on the ideas of
Dewey, Piaget and Maria Montessori. Although the notions of these theorists vary greatly,
each expresses a comparable framework to learning and development (Gordon et al., 2008:
p146).
Hunt (1969) believed that the theorists are „consistent in their belief that learning and
development occur when young children interact with the environment and people around
77
them’ (www.ncrel.org/sdrs/areas/issues/students/earlycld/ea7lk18.htm, 19/9/09).
Constructivist theory views children as being active participants in the learning process
through interaction and participation (Ornstein et al., 2004: p117), where through learned
adaptation, what the children learn or adapt to is directly influenced by the people, materials
and situations with which they come into contact (Gordon et al., 2007: p147).
3.3.3.1 Dewey
Dewey firmly believed that education was not merely the passing on of knowledge about
specific historic events or the biology of a plant, but rather the learning of skills and
knowledge that children could incorporate into their daily lives through the integration of
education and life, and so developing integrity (Gordon et al., 2008: p22).
3.3.3.2 Piaget
Jean Piaget, after close interaction and dealings with many children, stated that people
progress through four stages which occur in sequence. Piaget believed that only when a child
reaches the age of 15, and has progressed into the 4th
and final stage of development, will the
child be able to reason like an adult (Berk, 2006: p21; Berk, 2007: p233; Carr, 2006: p14;
Gordon et al., 2008: p143; Hendrick, 1986: p303).
Generally, there are ages that are assigned to the stages. This is not definite, as children grow
and develop at different paces, but it serves as a good guideline (Ornstein et al., 2004: p109).
The four stages of cognitive development, as stated by Piaget are in accordance with the
brain‟s major developments in growth. The brain is constantly growing throughout
childhood, and even sometimes into early adulthood (Berk, 2006: p21; Gordon et al., 2008:
p143; Ornstein et al., 2004: p109; Seefeldt et al., 1998: p453; Woolfolk, 2007: p28).
The four stages of cognitive development are: the sensorimotor, the preoperational, the
concrete operational and formal operational stage. Piaget stated that there are periods where a
person may show various characteristics from more than one stage in different situations
(Formanek & Gurain, 1981: p5; Gordon et al., 2008: p143).
A child in this age group of early childhood would be in the pre-operational stage of
cognitive development, where the child is usually between the ages of 2 to 7 years. They
78
begin to talk by applying the knowledge gained over the past two years. The child begins to
use symbols to represent objects, but generally has difficulty conceptualising and
understanding the concept of time.
The child also has a very egocentric viewpoint, where he feels that others see everything from
his viewpoint. His thinking patterns are influenced by fantasy (Berk, 2006: p252; Gordon et
al., 2008: p143; Hendrick, 1986: p305; Ornstein et al., 2004: p109; Seefeldt, et al., 1998:
p453).
Characteristics of the stages of Piaget’s theory
According to Berk (2006: p 21 & p222-250), Seefeldt et al. (1998: p 453-454), Gordon et al.,
(2008: p145), Hendrick (1986: p304-306), Ornstein et al. (2004: p109) and Woolfolk (2007:
p29-36) the following are characteristic of the stages in Piaget‟s theory:
i.) The sensorimotor stage
The child is usually between the ages of 0 – 2 years.
The child starts to learn about himself, his surroundings and various motor and
reflex actions are performed for a specific reason and with a goal in mind.
The child begins to imitate those around him/her, remembers things and faces and
starts to develop thought patterns.
The child will begin to understand that although objects or people are not within
his reach, they still exist.
These children start to develop mathematical concepts by noticing that some
objects are small, while others are large.
They play with blocks or with movable objects like cars and trains, thus
familiarising themselves with the concepts of shape and movement.
Piaget believes that mathematical understanding begins when children develop object
permanence – when a child realises that an object exists, although he cannot see the whole
object or even part of the object, the object is still there (Berk, 2006: p21; Seefeldt et al.,
1998: p454).

79
ii.) Pre-operational
The child is usually between the ages of 2 – 7 years.
The child begins to talk by applying knowledge he/she has gained over the past
two years.
The child begins to use symbols to represent objects. Pre-concepts are developed.
The child has difficulty conceptualising and understanding the concept of time.
Children are able to influence and manoeuvre symbols or representations of the
world around them.
The child has a very egocentric viewpoint, where he feels that others see
everything from his viewpoint. His thinking patterns are influenced by fantasy.
Children learn to conserve, which aids in their mathematical understanding later
on in life. According to Seefeldt et al. (1998: p454), conservation comprises three
levels:
* When a child is able to understand and reason that the shape or form of
an object changes according to the arrangement, shape or container
that the object is in.
* Children understand that although the arrangement of the matter may
alter the amount of matter remains constant.
* Children are able to preserve qualities, volume and mass.
iii.) Concrete operational
The child is usually between the ages of 7 – 11 years.
The child now begins to think abstractly and starts to develop the understanding
and viewpoint of another child or person. They continue to expand their
mathematical thought processes.
The child needs to be able to manipulate and solve concrete problems. Children, at
this stage, are operational in their thinking, and often need objects to handle and
manipulate while they are thinking.
This child is able to classify and sequence objects.
The child is now able to reverse problems that he/she is faced with.
80
Here, children are able to sequence and classify objects according to class, numbers, colours,
and more, with understanding. Children at the age of about 11 are also able to reverse
thought, complete calculations and develop logical ideas of numbers, weight, area and time
(Berk, 2006: p21; Gordon et al, 2007: p145; Seefeldt et al, 1998: p454; Woolfolk, 2007:
p34).
iv) Formal operational
The child is usually between the ages of 11 – adulthood.
This child no longer requires problems to be concretely displayed.
The child can think logically and abstractly.
The child is aware of the world around him/her and problems he/she may be
facing.
The child becomes more scientific in his/her thinking patterns and thoughts.
This is the ultimate level of cognitive development.
These children are able to deal with problems concerning time, distance, probability and
geometry. They are able to use conceptual thinking, and can relate different concepts using
abstract thinking and problem-solving (Berk, 2006: p21; Seefeldt et al, 1998: p454;
Woolfolk, 2009: p35).
3.3.3.3 Montessori
Maria Montessori was the founder of the Montessori method of teaching and learning and she
aided in the revival of education in the early childhood stage. From as early as 1965,
Montessori has had incredible outcomes and great feedback, working with poor and mentally
disabled children (Meier et al., 2007: p22). The Montessori approach takes on and
encourages the individual to be free and creative in his/her choices of materials and activities
(Gordon et al., 2008: p18-19; Meier et al., 2007: p22).
The child is not expected to be able to achieve any task or to master any skill, should his/her
development not allow for this. The work and tasks are adapted for each child so that he/she
is allowed freedom and not pressurised to develop, but can rather develop at his/her own pace
(Gordon et al., 2008: p18-19). Basic life-lessons and practical experiences are dealt with in a
Montessori school which educates the child on how to deal with real situations and teach
them good values and principles.
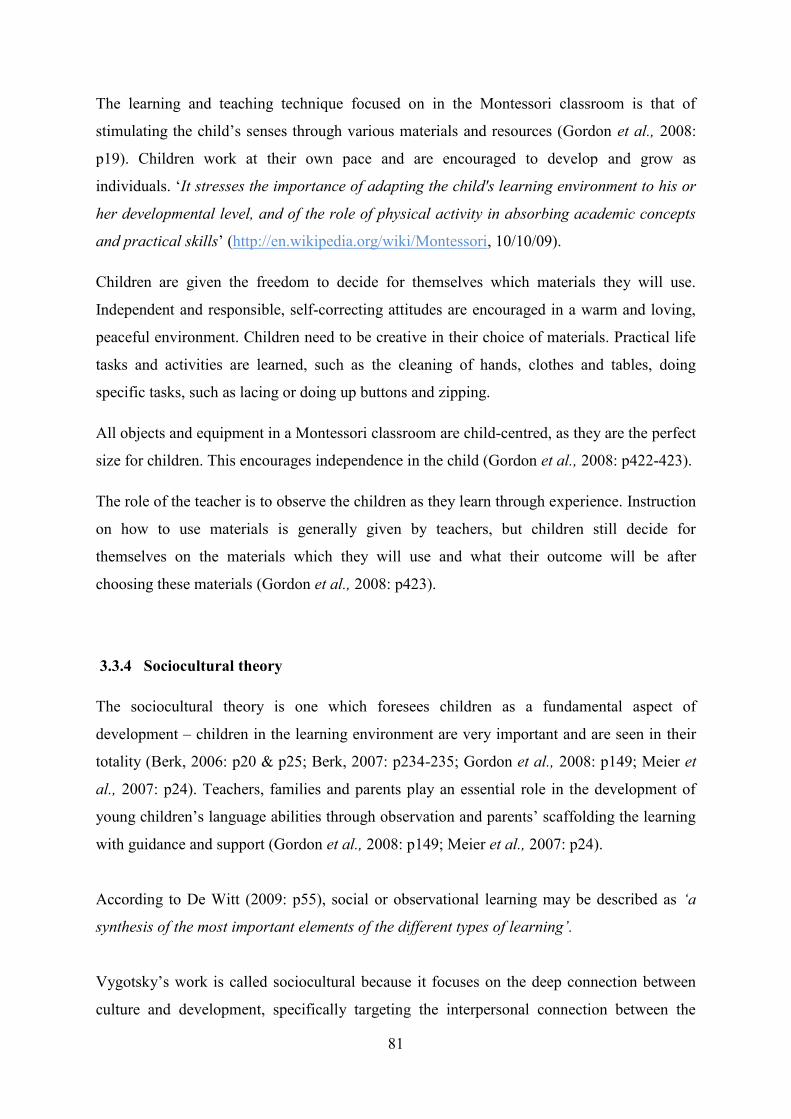
81
The learning and teaching technique focused on in the Montessori classroom is that of
stimulating the child‟s senses through various materials and resources (Gordon et al., 2008:
p19). Children work at their own pace and are encouraged to develop and grow as
individuals. „It stresses the importance of adapting the child's learning environment to his or
her developmental level, and of the role of physical activity in absorbing academic concepts
and practical skills‟ (http://en.wikipedia.org/wiki/Montessori, 10/10/09).
Children are given the freedom to decide for themselves which materials they will use.
Independent and responsible, self-correcting attitudes are encouraged in a warm and loving,
peaceful environment. Children need to be creative in their choice of materials. Practical life
tasks and activities are learned, such as the cleaning of hands, clothes and tables, doing
specific tasks, such as lacing or doing up buttons and zipping.
All objects and equipment in a Montessori classroom are child-centred, as they are the perfect
size for children. This encourages independence in the child (Gordon et al., 2008: p422-423).
The role of the teacher is to observe the children as they learn through experience. Instruction
on how to use materials is generally given by teachers, but children still decide for
themselves on the materials which they will use and what their outcome will be after
choosing these materials (Gordon et al., 2008: p423).
3.3.4 Sociocultural theory
The sociocultural theory is one which foresees children as a fundamental aspect of
development – children in the learning environment are very important and are seen in their
totality (Berk, 2006: p20 & p25; Berk, 2007: p234-235; Gordon et al., 2008: p149; Meier et
al., 2007: p24). Teachers, families and parents play an essential role in the development of
young children‟s language abilities through observation and parents‟ scaffolding the learning
with guidance and support (Gordon et al., 2008: p149; Meier et al., 2007: p24).
According to De Witt (2009: p55), social or observational learning may be described as ‘a
synthesis of the most important elements of the different types of learning’.
Vygotsky‟s work is called sociocultural because it focuses on the deep connection between
culture and development, specifically targeting the interpersonal connection between the

82
child and other people. According to Gordon et al. (2008: p149), Vygotsky believed that the
child is planted in a specific family and culture of his society and community, which results
in much of a child‟s development being defined according to his/her culture.
Sociocultural theory also focuses on how children‟s values, attitudes, skills, traditions and
beliefs are passed on from one generation to the next (Berk, 2006: p259; Gordon et al., 2008:
p149; De Witt, 2009: p55). Vygotsky believed that adults and people in the child‟s
surroundings have the authority to aid and refine children‟s language knowledge, by
preparing their external environment (Meier et al., 2007: p24).
According to De Witt (2009: p55), Vygotsky‟s theory is not merely a theory of learning, but
also one of teaching and instruction. Children rely greatly on the adults in their milieu to
extend knowledge and thus facilitate understanding.
3.3.5 Ecological theory
The ecological theory is one which, like the Sociocultural theory, is based on the assumption
that development is significantly influenced by external forces outside of the child, and in
their environment (Berk, 2006: p26). Physical factors, such as climate, space, home, school
and the social environment, including family, culture and the larger society all play a large
role in the development of the young child (Gordon et al., 2008: p152).
Bronfenbrenner designed a general theory of human development which includes an
amalgamation of environment and person (Gordon et al., 2008: p152). The model describes
four systems which impact and influence human development. The four circles in the centre
represent the four primary areas of influence in the young child‟s life, namely: family, school,
peers and religious setting. The mesosystem, microsystem, exosystem, macrosystem, and
chronosystem are all intertwined and have great influence on one another (Berk, 2006: p27-
29; Gordon et al., 2008: p152; Woolfolk, 2007: p72-73).
According to Gordon et al. (2008: p152), the values of the community (exosystem) and the
influence of the social conditions (macrosystem) can, in turn, be influenced by the individual
family or programme (microsystem).
83
Figure 3.2 The Ecological theory shows the different factors which influence the child‟s
development
(Berk, 2006: p28; Gordon et al., 2008: p152; Woolfolk, 2007: p73)
3.3.6 Multiple-intelligences theory
Howard Gardner‟s theory of Multiple-intelligences was greatly influenced by the works of
Piaget and Bruner. The theory exists to ‘distinguish whether intelligence is a single, broad
ability (as measured by an IQ test) or is a set of specific abilities (more than one intelligence)
(Gordon et al., 2008: p153). Gardner emphasises that there is reliable confirmation and
verification from brain-based research and from the study of genius, that there are a minimum
of eight basic different intelligences (Gordon et al., 2008: p153).

84
Intelligence is developed as the ability to solve problems or to create a product in the
particular cultural setting. So the child‟s area of development depends largely on their
external environment and context (Gordon et al., 2008: p154; Woolfolk, 2007: p114).
The eight areas of intelligence, as stated by Gardner, include (De Witt, 2009: p14 & p148;
Gordon et al., 2008: p154; Woolfolk, 2007: p114):
1. Musical intelligence
2. Bodily-kinesthetic intelligence
3. Logical-mathematical intelligence
4. Linguistic intelligence
5. Spatial intelligence
6. Interpersonal intelligence
7. Intrapersonal intelligence
8. Naturalist intelligence
3.3.7 Maturation theory
The Maturationist theory was primarily devised by Arnold Gessell. Gessell was concerned
with the ways in which children grow and mature from a medical point of view, and viewed it
as an imperative and crucial aspect of development (Gordon et al., 2008: p30). According to
Gordon, et al., (2008: p30) maturation may be defined as the „process of physical and mental
growth that is determined by heredity,‟ and Woolfolk (2007: p22) defines maturation as
„genetically programmed, naturally occurring changes over time.’
According to Hunt (1969), http://www.ncrel.org/sdrs/areas/issues/students/earlycld/
ea7lk18.htm 19/9/09), maturationists believe that a child‟s development is a biological
process which occurs automatically; it is conventional, and consists of a series of sequential
stages which occur in due course. The cornerstone of this theory considers a child to be
healthy, their development in totality will take place when the child is biologically ready to
develop and grow (www.ncrel.org/sdrs/areas/issues/students/earlycld/ea 7lk18.htm,
(19/9/09).
The parents‟ role in stimulating and aiding the cognitive development and ensuring that the
child is school-ready include teaching the foundational concepts for future learning by

85
equipping the child to recite the alphabet and to be able to count by rote (www.ncrel.org/sdrs
/areas/issues/students/earlycld/ea7lk18.htm (19/9/09).
3.3.8 The Humanistic theory
The humanistic theory is one which exists to explain what motivates people (Gordon et al.,
2008: p156). It is a theory which is centred on people‟s goals, ambitions, desires, needs,
successes and the urges which motivate and drive people (Gordon et al., 2008: p156,
Ornstein et al., 2004: p124).
3.3.9 The Environmentalist theory
According to www.ncrel.org/sdrs/areas/issues/students/earlycld/ea7lk18.htm (19/9/09), the
environmentalist theory is one which stresses the importance of the child‟s milieu and
environment, and how it shapes and affects the child‟s learning and behaviour patterns.
3.4 THEORIES, METHODS AND MODELS USED IN THIS STUDY
The theories, methods and models used in this study are based upon those by John Dewey.
The following section examines the development of the research tool, as well as the work
done by Dewey.
3.4.1 John Dewey
The primary cornerstone of John Dewey's view of education was that a greater amount of
effort and emphasis should be placed on enhancing and strengthening the child‟s intellect and
mental understanding, and stimulating and challenging the problem-solving and critical-
thinking skills so that learners develop and learn to stand for their own opinions and views on
issues (Gordon et al., 2008: p22; Meier et al., 2007: p26). This view of education is Dewey‟s
focal point which prevents children from learning and gaining knowledge by memorising
lessons and activities, but rather through experiences, and being challenged with concrete
experiences in a child-oriented and child-involved situation (Pellegrini, Symons & Hoch,
2004: p7; Meier et al., 2007: p23,25).
Read and Paterson (1980, in Gordon et al., 2008: p24), state Dewey believed that ‘real
objects and real situations within the child’s own social setting’ should be used.
86
According to Gordon et al. (2008: p22-23), Dewey believed that schools should focus on the
nature and uniqueness of each child, with education becoming an integrated aspect of life,
training and equipping young children. Creating an interest and awareness of the child‟s
world, through co-operative living, encouraging experimentation and group work under adult
supervision and intervention plays an imperative part in the teaching process (Woolfolk,
2007: p385).
An important document (Gordon et al., 2008: p22) written by Dewey titled, My Pedagogic
Creed (1897) states five primary aspects of his theory.
1. „I believe that only true education comes through the stimulation of the child’s powers
by the demands of the social situations in which he finds himself.’ This ensures that
children learn to manage themselves in groups, to make and share friendships, to
solve problems, and to cooperate.
2. ‘The child’s own instinct and powers furnish the material and give the starting point
for all education.’ We need to create a place that is child-centred, a place that values
the skills and interests of each child and each group.
3. I believe that education is a process of living and not a preparation for future living’
Prepare children for what is to come by enriching and interpreting the present to them.
Find educational implications in everyday experiences.
4. ‘I believe that... the school like should grow gradually out of the home life... It is the
business of the school to deepen and extend the child’s sense of the values bound up
in his home life.’ This sets the rationale for relationships between teachers and
parents. Values established and created in the home should be enhanced by teaching
in the schools.
5. ‘I believe, finally, that the teacher is engaged not simply in the training of individuals,
but in the formation of a proper social life. I believe that every teacher should realise
the dignity of his calling.’ This says that the work teachers do is important and
valuable. They teach more than academic content, they must also teach how to live.
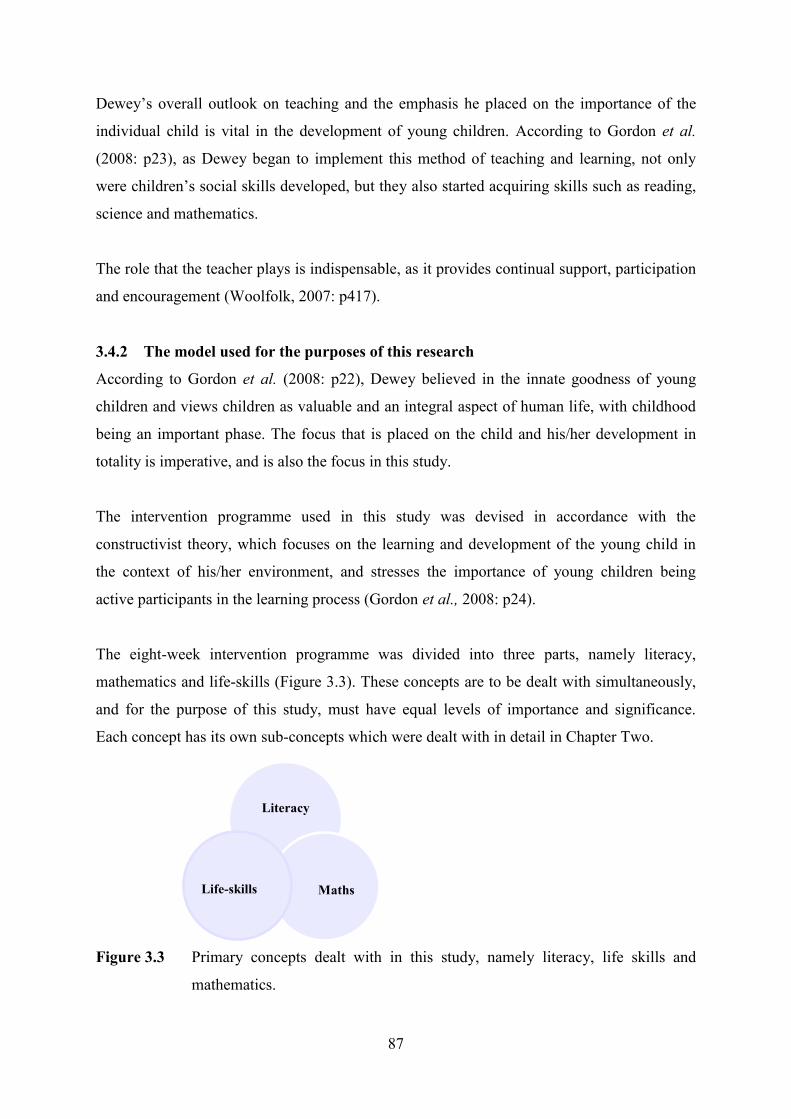
87
Literacy
MathsLife-skills
Dewey‟s overall outlook on teaching and the emphasis he placed on the importance of the
individual child is vital in the development of young children. According to Gordon et al.
(2008: p23), as Dewey began to implement this method of teaching and learning, not only
were children‟s social skills developed, but they also started acquiring skills such as reading,
science and mathematics.
The role that the teacher plays is indispensable, as it provides continual support, participation
and encouragement (Woolfolk, 2007: p417).
3.4.2 The model used for the purposes of this research
According to Gordon et al. (2008: p22), Dewey believed in the innate goodness of young
children and views children as valuable and an integral aspect of human life, with childhood
being an important phase. The focus that is placed on the child and his/her development in
totality is imperative, and is also the focus in this study.
The intervention programme used in this study was devised in accordance with the
constructivist theory, which focuses on the learning and development of the young child in
the context of his/her environment, and stresses the importance of young children being
active participants in the learning process (Gordon et al., 2008: p24).
The eight-week intervention programme was divided into three parts, namely literacy,
mathematics and life-skills (Figure 3.3). These concepts are to be dealt with simultaneously,
and for the purpose of this study, must have equal levels of importance and significance.
Each concept has its own sub-concepts which were dealt with in detail in Chapter Two.
Figure 3.3 Primary concepts dealt with in this study, namely literacy, life skills and
mathematics.

88
Mathematics
Counting
One-to-one correspondence
Classifying
Sequencing
Geometry
Literacy
Vocabulary
Speech
Listening
Reading
Writing
Life skills
Visual-motor
Foreground/Background
Discrimination
Sensory awareness
A day-by-day planning which focuses on literacy, mathematics and life skills was devised as
a guide to be used to stimulate and educate the experimental group in the study. Weekly
themes were followed, which created a sense of formality and structure.
All interaction with the participants of the study was child-centred and developmentally
based. The primary aim was to educate and equip young children by means of applying and
enabling participants to understand the concepts of mathematics, literacy and life skills.
The themes which were followed include:
Week 1: Me
Week 2: Family and friends
Week 3: Homes and weather
Week 4: Animals
Week 5: Transport
Week 6: Health
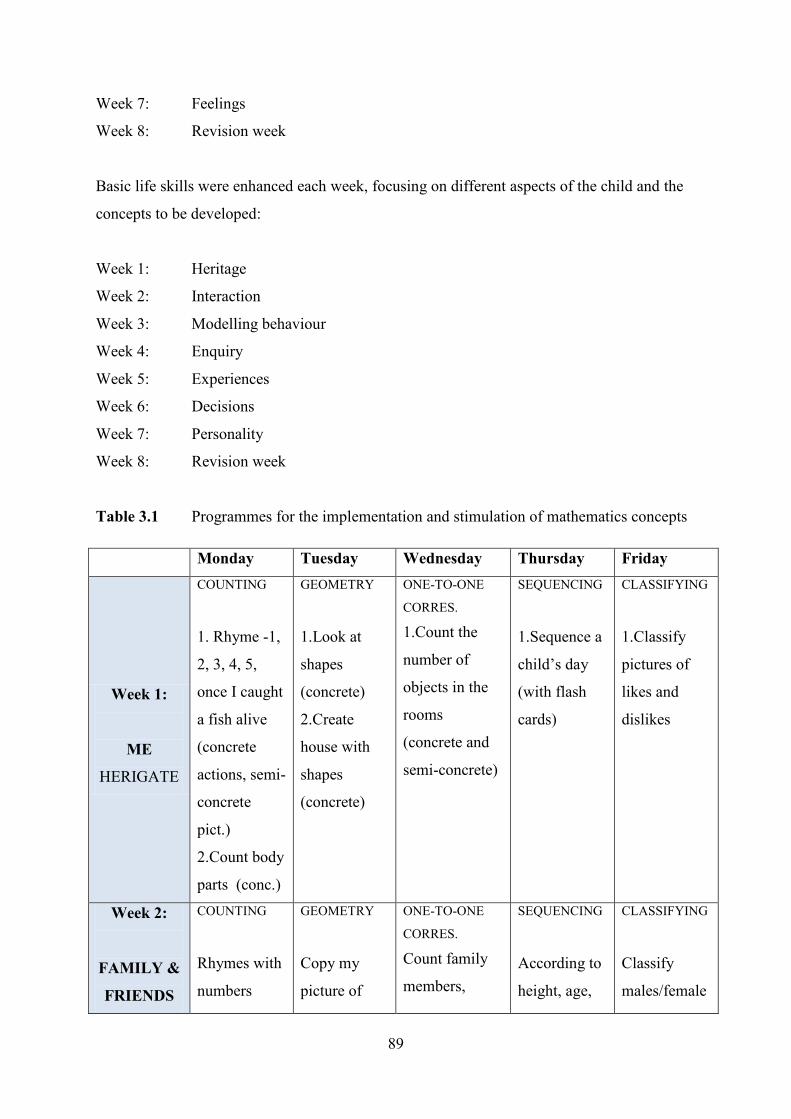
89
Week 7: Feelings
Week 8: Revision week
Basic life skills were enhanced each week, focusing on different aspects of the child and the
concepts to be developed:
Week 1: Heritage
Week 2: Interaction
Week 3: Modelling behaviour
Week 4: Enquiry
Week 5: Experiences
Week 6: Decisions
Week 7: Personality
Week 8: Revision week
Table 3.1 Programmes for the implementation and stimulation of mathematics concepts
Monday Tuesday Wednesday Thursday Friday
Week 1:
ME
HERIGATE
COUNTING
1. Rhyme -1,
2, 3, 4, 5,
once I caught
a fish alive
(concrete
actions, semi-
concrete
pict.)
2.Count body
parts (conc.)
GEOMETRY
1.Look at
shapes
(concrete)
2.Create
house with
shapes
(concrete)
ONE-TO-ONE
CORRES.
1.Count the
number of
objects in the
rooms
(concrete and
semi-concrete)
SEQUENCING
1.Sequence a
child‟s day
(with flash
cards)
CLASSIFYING
1.Classify
pictures of
likes and
dislikes
Week 2:
FAMILY &
FRIENDS
COUNTING
Rhymes with
numbers
GEOMETRY
Copy my
picture of
ONE-TO-ONE
CORRES.
Count family
members,
SEQUENCING
According to
height, age,
CLASSIFYING
Classify
males/female
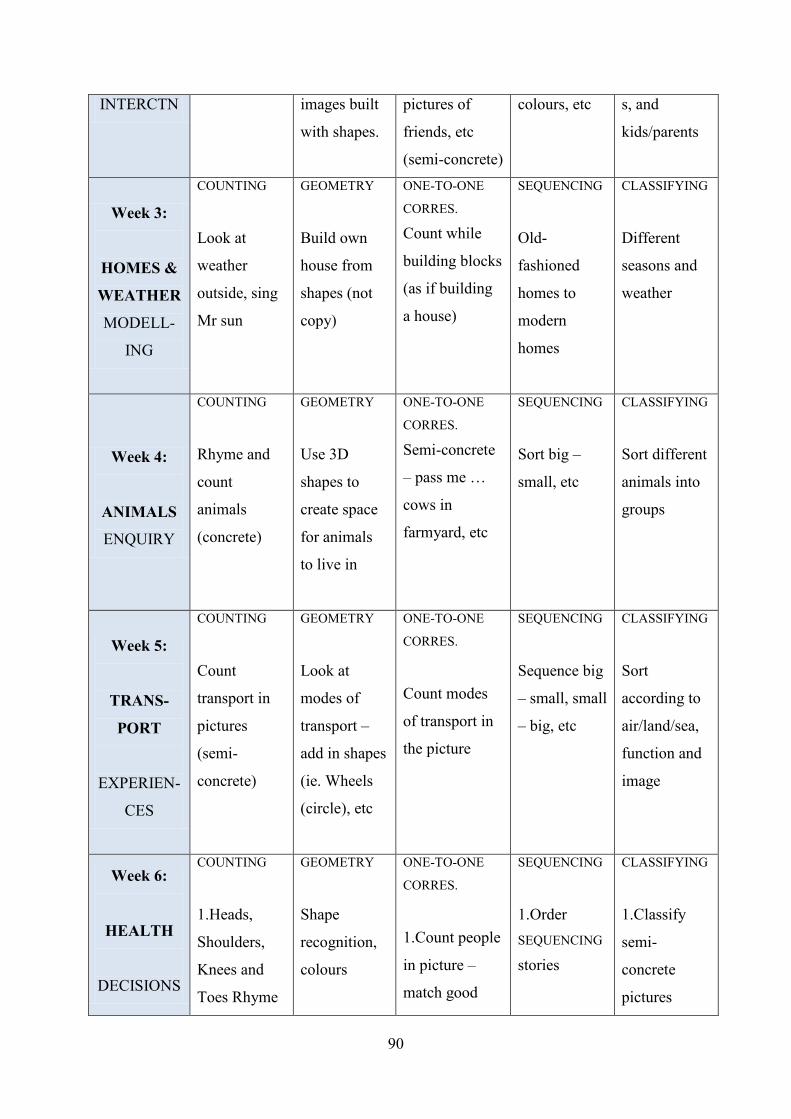
90
INTERCTN images built
with shapes.
pictures of
friends, etc
(semi-concrete)
colours, etc s, and
kids/parents
Week 3:
HOMES &
WEATHER
MODELL-
ING
COUNTING
Look at
weather
outside, sing
Mr sun
GEOMETRY
Build own
house from
shapes (not
copy)
ONE-TO-ONE
CORRES.
Count while
building blocks
(as if building
a house)
SEQUENCING
Old-
fashioned
homes to
modern
homes
CLASSIFYING
Different
seasons and
weather
Week 4:
ANIMALS
ENQUIRY
COUNTING
Rhyme and
count
animals
(concrete)
GEOMETRY
Use 3D
shapes to
create space
for animals
to live in
ONE-TO-ONE
CORRES.
Semi-concrete
– pass me …
cows in
farmyard, etc
SEQUENCING
Sort big –
small, etc
CLASSIFYING
Sort different
animals into
groups
Week 5:
TRANS-
PORT
EXPERIEN-
CES
COUNTING
Count
transport in
pictures
(semi-
concrete)
GEOMETRY
Look at
modes of
transport –
add in shapes
(ie. Wheels
(circle), etc
ONE-TO-ONE
CORRES.
Count modes
of transport in
the picture
SEQUENCING
Sequence big
– small, small
– big, etc
CLASSIFYING
Sort
according to
air/land/sea,
function and
image
Week 6:
HEALTH
DECISIONS
COUNTING
1.Heads,
Shoulders,
Knees and
Toes Rhyme
GEOMETRY
Shape
recognition,
colours
ONE-TO-ONE
CORRES.
1.Count people
in picture –
match good
SEQUENCING
1.Order
SEQUENCING
stories
CLASSIFYING
1.Classify
semi-
concrete
pictures

91
hygiene to bad
hygiene
according to
healthy food
and junk food
Week 7:
FEELINGS
PERSON-
ALTY
COUNTING
1. Listen to
story about
emotions
GEOMETRY
1. Complete
other half of
a picture.
Complete it –
visual closure
ONE-TO-ONE
CORRES.
1.Count the
happy people,
sad people, etc
SEQUENCING
1.Sequencing
stories
CLASSIFYING
1.Classify
pictures of
good/bad
feelings
Week 8:
REVISION
In the 8th
week, I focused on any revision that needed to be made, focusing on
concepts which children struggled with.
Table 3.2 Programmes for the implementing of stimulation of literacy concepts
Monday Tuesday Wednesday Thursday Friday
Week 1:
ME
HERITAGE
VOCAB
1.Rhyme
2.Parts of the
body
SPEECH
1.Speak
about self &
home
environment
2.Family
LISTENING
1. Teacher
tells a story
with a
picture. They
must note the
mistakes in
the story (by
looking at the
picture)
READING
1.Show a
picture, child
describes
what is
happening in
the picture
(also vocab
& speech)
WRITING
1.Draw a
picture of
self
Week 2:
FAMILY&
VOCAB
Look at cue
SPEECH
Talk about
LISTENING
Tell story of
READING
Read pictures
WRITING
Draw picture

92
FRIENDS
INTERACT
cards of
family
members –
name
members and
sort who
goes where
who lives in
their homes.
Discuss
family
a little girl‟s
family – ask
questions
after.
comprehensi
on
and say what
is happening
in each
picture
of family
Week 3:
HOMES &
WEATHER
MODELL-
ING
VOCAB
Where we
live, types of
homes, my
home
SPEECH
Animals
homes
LISTENING
Listen to
sounds on
computer –
discriminate
between
sounds.
READING
Read pictures
of weather –
what they
think it
means
WRITING
Copy my
picture of a
home – draw
same
Week 4:
ANIMALS
ENQUIRY
VOCAB
Naming
animals by
looking at
picture
SPEECH
Talking
about
animals at
home, in the
book, etc
LISTENING
Listen to
story of
animals,
answer
questions as
we go along
READING
Look at
picture, tell
me what is
happening in
the picture
WRITING
Draw a
picture of
favorite
animal
Week 5:
TRANS-
PORT
EXPERIEN-
CES
VOCAB
Look at
pictures and
discuss
different
modes of
SPEECH
Name the
modes of
transport
used in SA
and world
LISTENING
Listen to
different
forms of
transport and
discriminate
READING
Read and
match
pictures
together
WRITING
Draw wheels
on the forms
of transport
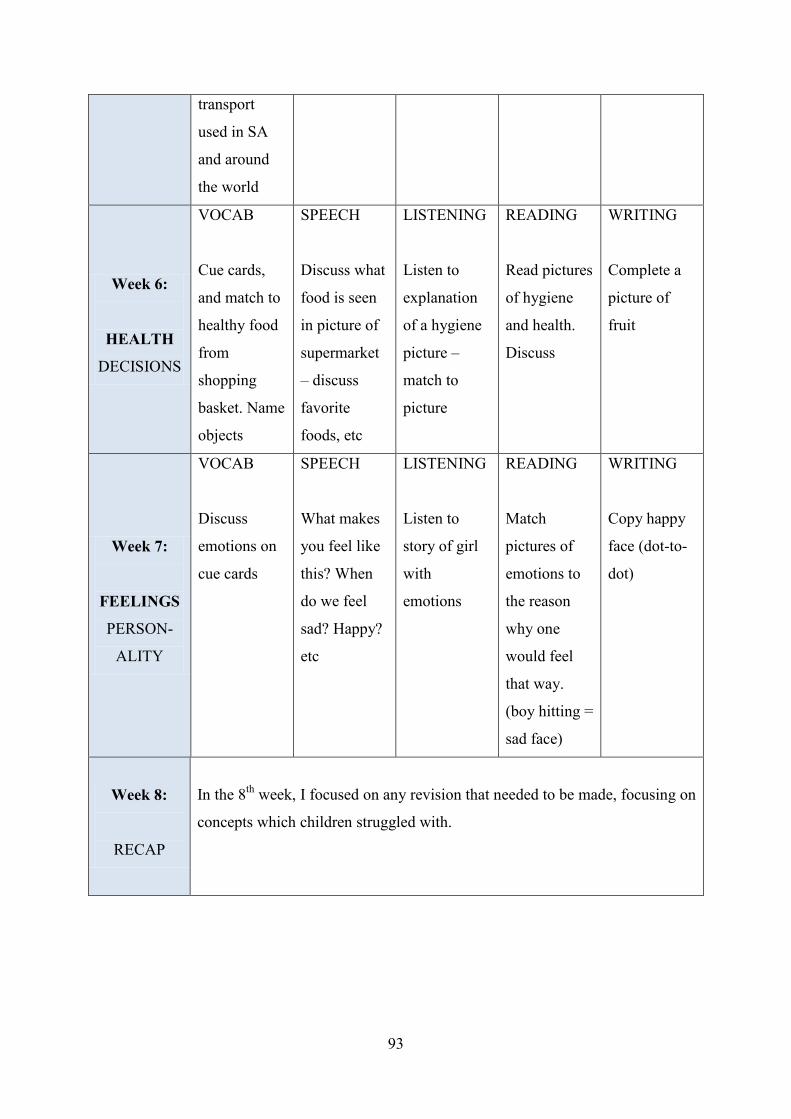
93
transport
used in SA
and around
the world
Week 6:
HEALTH
DECISIONS
VOCAB
Cue cards,
and match to
healthy food
from
shopping
basket. Name
objects
SPEECH
Discuss what
food is seen
in picture of
supermarket
– discuss
favorite
foods, etc
LISTENING
Listen to
explanation
of a hygiene
picture –
match to
picture
READING
Read pictures
of hygiene
and health.
Discuss
WRITING
Complete a
picture of
fruit
Week 7:
FEELINGS
PERSON-
ALITY
VOCAB
Discuss
emotions on
cue cards
SPEECH
What makes
you feel like
this? When
do we feel
sad? Happy?
etc
LISTENING
Listen to
story of girl
with
emotions
READING
Match
pictures of
emotions to
the reason
why one
would feel
that way.
(boy hitting =
sad face)
WRITING
Copy happy
face (dot-to-
dot)
Week 8:
RECAP
In the 8th
week, I focused on any revision that needed to be made, focusing on
concepts which children struggled with.
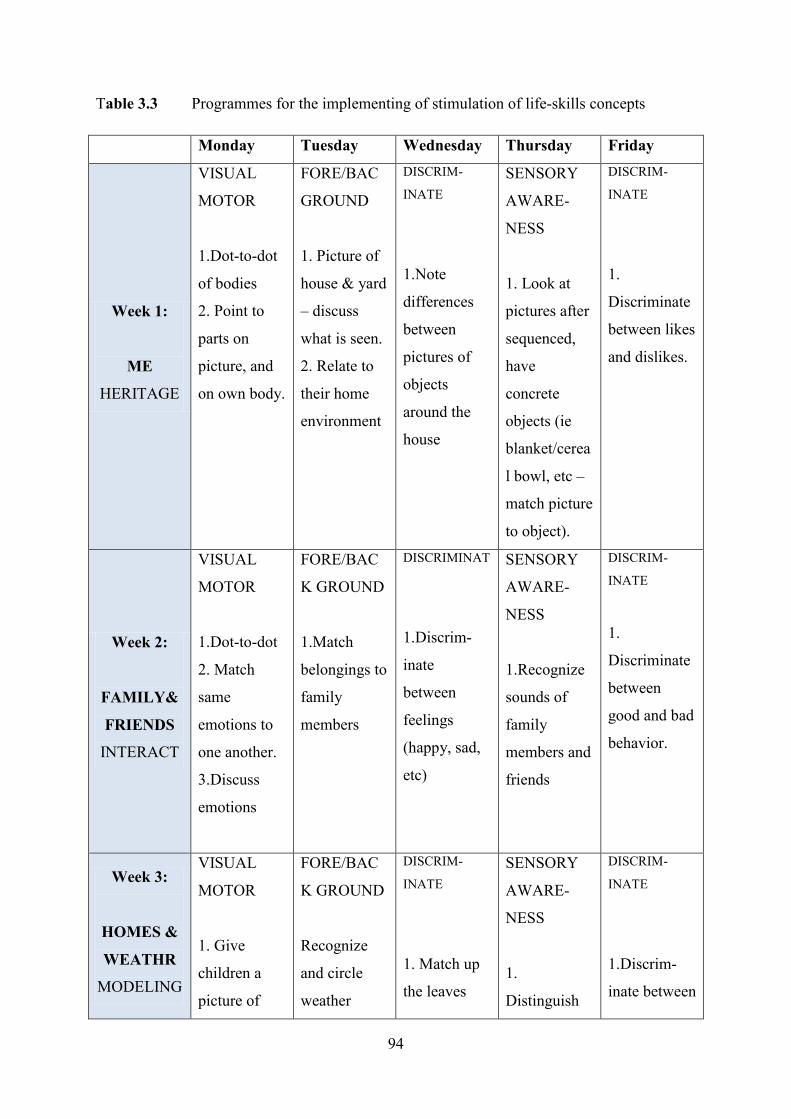
94
Table 3.3 Programmes for the implementing of stimulation of life-skills concepts
Monday Tuesday Wednesday Thursday Friday
Week 1:
ME
HERITAGE
VISUAL
MOTOR
1.Dot-to-dot
of bodies
2. Point to
parts on
picture, and
on own body.
FORE/BAC
GROUND
1. Picture of
house & yard
– discuss
what is seen.
2. Relate to
their home
environment
DISCRIM-
INATE
1.Note
differences
between
pictures of
objects
around the
house
SENSORY
AWARE-
NESS
1. Look at
pictures after
sequenced,
have
concrete
objects (ie
blanket/cerea
l bowl, etc –
match picture
to object).
DISCRIM-
INATE
1.
Discriminate
between likes
and dislikes.
Week 2:
FAMILY&
FRIENDS
INTERACT
VISUAL
MOTOR
1.Dot-to-dot
2. Match
same
emotions to
one another.
3.Discuss
emotions
FORE/BAC
K GROUND
1.Match
belongings to
family
members
DISCRIMINAT
1.Discrim-
inate
between
feelings
(happy, sad,
etc)
SENSORY
AWARE-
NESS
1.Recognize
sounds of
family
members and
friends
DISCRIM-
INATE
1.
Discriminate
between
good and bad
behavior.
Week 3:
HOMES &
WEATHR
MODELING
VISUAL
MOTOR
1. Give
children a
picture of
FORE/BAC
K GROUND
Recognize
and circle
weather
DISCRIM-
INATE
1. Match up
the leaves
SENSORY
AWARE-
NESS
1.
Distinguish
DISCRIM-
INATE
1.Discrim-
inate between

95
homes to
discuss.
2.Dot the
page with
Koki‟s
(creating
rain/snow)
types and
symbols in
picture
that are the
same as the
ones in the
column. And
match to
concrete.
which
clothing is
worn when
the weather
is hot, and
when the
weather is
cool.
weather
symbols
Week 4:
ANIMALS
ENQUIRY
VISUAL
MOTOR
1. Make a
porcupine
out of play
dough – stick
tooth picks in
as quills.
FORE/BAC
K GROUND
1. Circle all
the animals
in the
picture.
DISCRIM-
INATE
1. Circle
objects
which we can
hear.
SENSORY
AWARE-
NESS
1. Look at
picture of
animal. What
sound does it
make?
(choose from
recorded list)
What does it
feel like?
(choose from
concrete
materials)
DISCRIM-
INATE
1.Discrim-
inate between
animals
which fly,
walk, swim
Week 5:
TRANS-
PORT
EXPER-
IENCE
VISUAL
MOTOR
1. Follow the
dots on the
line.
FOREBACK
GROUND
1. Circle all
the forms of
transport in
the picture.
DISCRIM-
INATE
1.Colour in
the correct
one
SENSORY
AWARE-
NESS
1. Listen to
sounds, does
this sounds
like traffic?
Match sound
DISCRIM-
INATE
1. Match the
cut outs onto
the parts of
the pictures.
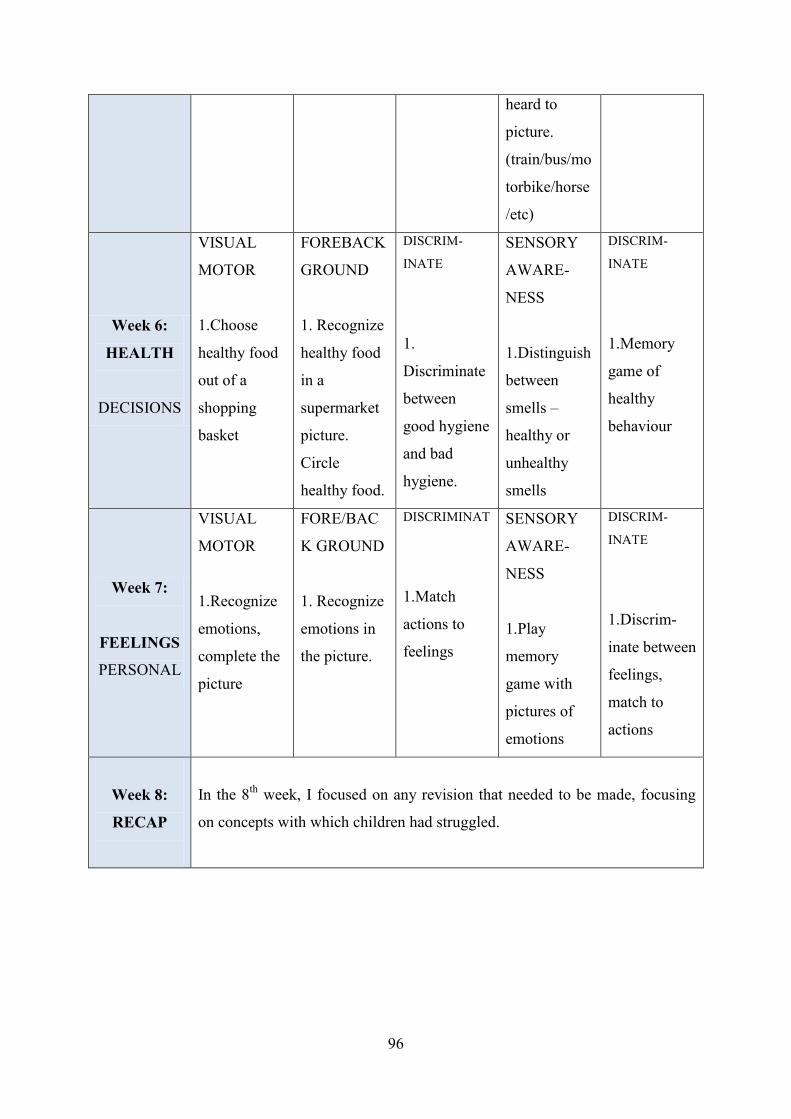
96
heard to
picture.
(train/bus/mo
torbike/horse
/etc)
Week 6:
HEALTH
DECISIONS
VISUAL
MOTOR
1.Choose
healthy food
out of a
shopping
basket
FOREBACK
GROUND
1. Recognize
healthy food
in a
supermarket
picture.
Circle
healthy food.
DISCRIM-
INATE
1.
Discriminate
between
good hygiene
and bad
hygiene.
SENSORY
AWARE-
NESS
1.Distinguish
between
smells –
healthy or
unhealthy
smells
DISCRIM-
INATE
1.Memory
game of
healthy
behaviour
Week 7:
FEELINGS
PERSONAL
VISUAL
MOTOR
1.Recognize
emotions,
complete the
picture
FORE/BAC
K GROUND
1. Recognize
emotions in
the picture.
DISCRIMINAT
1.Match
actions to
feelings
SENSORY
AWARE-
NESS
1.Play
memory
game with
pictures of
emotions
DISCRIM-
INATE
1.Discrim-
inate between
feelings,
match to
actions
Week 8:
RECAP
In the 8th
week, I focused on any revision that needed to be made, focusing
on concepts with which children had struggled.

97
3.5 HYPOTHESES
The primary aim of this study was:
To develop a programme to enhance cognitive development in order to examine the
effects of stimulation of mathematical, literacy, life skills and general knowledge
concepts in young children;
To evaluate the methods of implementation that aid development of the cognitive
concepts.
Hypothesis 1: Intervention
The null hypothesis (H0
) and alternative hypothesis (H1
) for significance of intervention,
comparing control and experimental groups:
H0
: There is no significant difference between the overall cognitive development of the
subjects in the control and experimental groups.
H1
: There is a significant difference between the overall cognitive development of the
subjects in the control and experimental groups.
Hypothesis 2: Literacy
The null hypothesis (H0
) and alternative hypothesis (H1
) for the significance of
implementation of literacy concepts, comparing control and experimental groups:
H0
: There is no significant difference between the literacy development of the subjects in the
control and experimental groups.
H1
: There is a significant difference between the literacy development of the subjects in the
control and experimental groups.
98
Hypothesis 3: Mathematics
The null hypothesis (H0
) and alternative hypothesis (H1
) for significance of implementation
of mathematics concepts, comparing control and experimental groups:
H0
: There is no significant difference between the mathematics development of the subjects
in the control and experimental groups.
H1
: There is a significant difference between the mathematics development of the subjects in
the control and experimental groups.
Hypothesis 4: Life skills
The null hypothesis (H0
) and alternative hypothesis (H1
) for significance of implementation
of life-skills concepts, comparing control and experimental groups:
H0
: There is no significant difference between the life-skills development of the subjects in
the control and experimental groups.
H1
: There is a significant difference between the life-skills development of the subjects in the
control and experimental groups.
A hypothesis that states the programme that has been developed according to the work of
Dewey and the constructivist theory is one which will provide positive results and will prove
to have had a large impact on the cognitive development of young children and to have aided
in their stimulation over the eight-week intervention process.
Dewey‟s work is well-recognized worldwide and is the cornerstone of the intervention
programme used in this study.

99
3.6 CONCLUSION
This chapter has dealt with the theory behind the development of the research tool by
referring to various previous models, theories, methods and concepts of early childhood
development. The finished research tool in the form of an eight-week intervention
programme has been fully discussed.

100
CHAPTER 4
METHODOLOGY AND PROCEDURE
4.1 INTRODUCTION
The purpose of this study is to develop and field-test an instrument which provides a means
of cognitive stimulation for early childhood children, through mathematics, literacy and life
skills. This chapter describes the methods that will be used to develop an early childhood
cognitive stimulation and development programme, including methods for exploring the
validity and reliability of the study.
The literature was reviewed to establish the existing curricular approaches used in early
childhood education. Furthermore, ethical issues to be considered in order to conduct the
research in a sound and professional capacity are stipulated.
From the review, it is clear that young children‟s cognitive development is permanently
enhanced by means of stimulation. The three major aspects of cognitive development include
mathematics, literacy and life skills which are all equally important, and need to be enhanced
simultaneously and by means of integration (De Witt, 2009; Eliason et al., 2008; Gordon et
al., 2008; Seefeldt et al., 1998; Sternberg, 2008).
The child‟s environment and family situation have proven to be of great importance and have
a huge influence in the child‟s development (De Witt, 2009; Eliason et al., 2004; Gordon et
al; Hendrick et al; Meier et al., 2007).
This section encompasses a complete description of the research design of the methods and
procedures employed in this study, the aim of which was to note the effects of cognitive
stimulation (mathematical, literacy, life skills) on the young child, and the programmes used
for intervention. Selection methods for the participants, measures to ensure trustworthiness,
ethical issues, data collection and analysis, and the limitations of the study are included in
this chapter.

101
4.2 THE RESEARCH PROBLEM
Various programmes and activities need to be logically planned in order to aid cognitive
development and enhance children‟s cognitive abilities. Thus, the research question for this
study can be formulated as follows:
What are the effects of cognitive stimulation (mathematical, literacy and life skills
on the young child, and how can they be enhanced?
The principal aim of this study is to gain a comprehensive understanding of the cognitive
development of the young child, so as to develop a suitable programme that can be used to
stimulate their development. This will be done by means of a literature study, as well as an
empirical investigation.
This study will be conducted in order to:
Develop and evaluate a programme of mathematical skills, language and literacy
development and general knowledge, as well as life-skills stimulation, to enhance the
ability of young children in order to provide a better understanding of the cognitive
development and abilities of these learners, as well as providing insight into the
benefits of and the rate of individual development of the young learners‟ cognitive
abilities;
Assess the validity of the programme of cognitive development; and
Establish the reliability of the application of the programme of cognitive
development.
4.3 THE AIM OF THE RESEARCH
This study aims to provide scientific knowledge of the impact of early intervention in
children‟s cognitive development through stimulation.
The aim of the empirical study is:
To develop a programme to enhance cognitive development in order to examine the
effects of stimulation of mathematical, literacy and life-skills concepts in young
children;
102
To evaluate the methods of implementation which aid development of the cognitive
concepts;
To indicate how the concepts can be provided for in early childhood centres.
McMillan et al., (2006: p22) define research design as a comprehensive plan for creating
empirical evidence which will be used to answer the research questions, aims and objectives.
For the purpose of this research, this study uses a quantitative, experimental research design.
4.3.1 The nature of quantitative research
A quantitative research method will be used. The quantitative approach is value-free and
focuses on variables, while measuring objective facts rather than social and cultural contexts.
According to McMillan et al., (2006: p23), quantitative fields of study „adopt a positivist
philosophy that emphasizes objectivity and the quantification of phenomena’.
Objectivity is maximized as a result of data being in the form of numbers, statistics, structure
and control, and the information is then transferred into a computer-readable format
(Neuman, 2006: p41). Once the data have been collected, the analysis of the data commences.
This stage typically involves manipulating the data or numbers using computer software to
create charts, tables, graphs and statistics (Neuman, 2006: p14).
Once the researcher has all the information graphically represented, an interpretation of the
data is necessary. By looking at the analyzed data and with background knowledge on the
research topic, the original research question can be answered and insight can thereby be
arrived at (Neuman, 2006: p14).
In an experimental research design, the researcher has, in some manner, control over some
subjects and is able to manipulate their experiences (McMillan et al., 2006: p23). The
researcher is then able to investigate cause-and-effect relationships by making comparisons
between the control and experimental groups through statistical analysis (McMillan et al.,
2006: p24).
4.4 THE RESEARCH DESIGN
„The quality of action research depends on the reflexive sensitivity of the researchers, whose
data collection, analysis and interpretations will all be mediated by their sense of self and
identity’ (Somekh, 2006: p14). The study will be conducted by means of a true experimental

103
design, whereby the subjects will be measured before and after the treatment. This is the only
design that can effectively determine the cause-and-effect procedure as it involves a control
group and an experimental group (McMillan et al., 2006: p24).
4.4.1 The research method
This research method involves data collection, sampling method, the researcher as the
instrument, ethical issues, and a suitable method to ensure trustworthiness and data analysis.
The research design which will be implemented is a quantitative method of capturing and
analysing data. Quantitative research is based on logical positivism, where one single reality
is measured (Neuman, 2006: p13). Previous data were thoroughly researched and literature
was consulted so that procedures would be able to follow a step-by-step plan.
The quantitative approach will also create a means to establish a relationship between the
measured variables and thus explain the cause of this change (McMillan et al., 2006: p24).
All subjects that will participate in this research will be assigned to either the control group
(independent variable) or the experimental group (dependent variable) by probability
sampling, based on randomisation (Neuman, 2006: p251). All subjects in the population
(Early Childhood Centres) have the same probability of being selected. Pre-tests and post-
tests will be done with both the control and experimental groups, and thorough intervention
and stimulation need to take place with the experimental group.
A questionnaire will be used to provide valuable subject history and parental objectives.
Questionnaires ensure anonymity, and are economical (McMillan et al., 2006: p194).
Correlational research determines and analyses the relationships between variables
(McMillan et al., 2006: p25). Using this method, certain predictions may be made on the
basis of these relationships. It is however important to note that this design will not
necessarily determine cause and effect. As this study intends to determine the relationship
and effects of early intervention and stimulation in the cognitive development of young
children, statistical analysis of the mathematical, literacy and life-skills development of
young children will be conducted.
The home environment, emotional, physical, social and spiritual development will form part
of this investigation, as the child always needs to be seen in his/her totality and as a whole,
and there is no way of separating the child from the environment.

104
4.4.2 Data collection
The data collection period will consist of a week of pre-testing (T1: Appendix E), which will
take place prior to the commencement of the intervention programme, an eight-week
intervention programme, and a final week of post-testing (T2: Appendix F) after the
intervention period. Questionnaires will be sent out to the subject‟s teachers and parents or
care-givers.
The questionnaires will enable the researcher to gain background information from each
family, as well as to provide a large amount of information in a short period of time (Koshy,
2005: p87).
4.4.3 Sampling methods
A population refers to „a group of elements or cases, whether individuals, objects, or events,
that conform to specific criteria and to which we intend to generalise the results of the
research‟ (McMillan et al., 2006: p119).
In many cases the population is so large and unreachable that it cannot be used in its entirety
due to the inability of the researcher to control the group. In the case of this research, a useful
division of the population was used. The research population of this study can be defined as:
selected children between the ages of two and three-and-a-half years old, attending middle
class early childhood centres in the Port Elizabeth region.
A group of the population from whom the data have been collected is called a sample group
(McMillan et al., 2006: p119).
Neuman (2006: p227) explains random sampling as being one that truly represents the
population, and allows for the researcher to statistically compute and analyse the relationship
between the sample and the population. Systematic random sampling takes place when the
researcher calculates the sampling interval. The interval then becomes the quasi-random
selection method.
The sampling interval suggests how to select the elements from a sampling frame starting
from a randomly selected element. The sampling frame needs to be arranged randomly for
systematic random sampling to take place effectively (McMillan et al., 2006: p121; Neuman,
2006: p230).
105
The systematic random sampling method was relevant and appropriate for this study that had
a specific task to accomplish. The population was not arranged according to any systematic
pattern; the list is arranged randomly, which ensures that there were no possible weaknesses
in the selection of participants (McMillan et al., 2006: p121).
The study explored the effects of stimulation on cognitive development in children ranging
from two to three-and-a-half years.
4.4.4 Ethical measures
According to Koshy (2005: p83), it is imperative to carry out ethical guidelines during
research projects. All information gathered will be coded to ensure the anonymity of the
subjects involved in the study. According to Neuman (2006: p139), anonymity ensures that
the participants remain nameless and their identity is thus protected from being disclosed. All
information gathered will remain confidential with the identity of the subjects only known to
the researcher.
All the subjects will be required to sign an informed consent form (Appendix C), agreeing to
participate in the study (Neuman, 2006: p135). Ethical requirements will be fulfilled for the
purpose of this study.
4.4.5 Informed consent
Attaining informed consent implies that the researcher ensures that the participants will be
treated with anonymity and confidentiality at all times. The intended use of all information
gained and acquired during the investigation, the various actions and events that will be
followed during the execution of the investigation, any possible advantages, disadvantages or
dangers to which participants may be exposed, will all be provided to the participants prior to
the investigation (McMillan et al., 2006: p334).
Further, it is emphasized that precise and absolute information is to be provided to all
subjects so that they are fully aware of the steps of completion in the investigation, and they
are therefore able to make an informed and critically analyzed decision regarding their
participation in the study (Mouton, 2001: p244; Neuman, 2006: p135).
Written informed consent will be obtained from the participant‟s parents and the principals of
the three early childhood centres (Appendix C) after they have received a letter explaining the
intentions and programme for the research project (Appendix A: Letter to Principles,
Appendix B: Study Information Letter). No participant will be allowed to participate in the
106
study without having completed and returned a consent form, which needs to be signed by a
parent or guardian.
All names will be removed to protect the participant‟s identity and the schools at which this
research will be implemented. The informed consent form for all participants, teachers,
parents and principals will ensure the anonymity of the children in the classrooms, using
pseudonyms to classify the participating schools, teachers and children throughout the study
and in all succeeding periodicals and presentations thereof.
4.4.6 Confidentiality and privacy
According to the Oxford Dictionary (Ed. Branford: p602), privacy refers to ‘freedom from
disturbance or public attention’. In the case of research it refers to anything that is normally
not intended for others to observe or analyze (McMillan et al., 2006: p334). Confidentiality is
a prolongation and extension of privacy. Privacy refers to a contract between people that
limits others from accessing private information (McMillan et al., 2006: p335).
As a result of the above, the names of participants who were analyzed during the eight-week
intervention programme are not given in the study. That is, the researcher has kept details of
early childhood participants confidential.
4.4.7 Participants in the study
For the purpose of this study all participants will be selected by means of systematic random
sampling, where each individual has an equal chance of being selected (Neuman, 2006:
p230). The participants in this study will be children between the ages of two and three-and-
a-half years old that attend one of three Early Childhood Centres across Port Elizabeth. Forty
(40) children between the ages of two and three-and-a-half will be selected to participate in
the study; both males and females were included.
The participants will be classified, by means of systematic random sampling into two main
categories:
Control Group (20 participants)
Experimental Group (20 participants)

107
4.4.8 Processing the results
When analysing data it is imperative that data should be organised in a clear and concise
manner. According to McMillan et al. (2006: p417), quantitative data are summarised using
simple descriptive statistics, such as the mean, frequencies, mode, range and graphs.
4.4.9 Procedure of the research project
In the initial phase of this research study, before direct interaction with children, the
researcher will contact the early childhood centre principals and consult with them regarding
their approaches to teaching, their motivation to make a difference, and their current teaching
beliefs and practices. Various aspects of the practice will be discussed with the principals,
including class schedules, room arrangements, materials used in the classroom, and the
curriculum currently being implemented.
This will be done in order to gain a perspective on the children‟s abilities, as well as a
guideline of the input that both the experimental and the control groups will receive during
the class teaching.
The researcher will provide insight into the day-to-day happenings of each early childhood
centre, and the procedures of this research project will be explained to the principal in detail.
The expectations of the early childhood centre will be discussed; the eight-week intervention
programme which is to be implemented will be discussed, as well as the centre‟s expectations
of the research, the project and the intervention programme.
Data will be collected by means of pre-testing and post-testing. All 40 participants involved
will be given a pre-test which is to be performed under the same conditions for all
participants. Pre-tests and post-tests are to be implemented in a one-on-one format. The
duration of the pre-test will be roughly 10 minutes per subject, over a five-day period. The
experimental group (20 participants) will then undergo a process of eight weeks of cognitive
development and stimulation intervention.
Questionnaire forms will be completed by all parents (McMillan et al., 2006: p194; Neuman,
2006: p292).
During the eight-week intervention programme, a series of concepts and abilities will be
stimulated. Together with their daily routines, the experimental group subjects will have an

108
additional stimulation session, one-on-one with the researcher for a period of roughly ten
minutes per day. In this contact session, literacy, mathematics and life-skills concepts (dealt
with in Chapter 2) will be focused on.
Integration is a key component in the programme, and literacy, mathematics and life skills
will be taught as an amalgamation of all these cognitive concepts.
The post-test (T2) will be completed by both the experimental and the control groups after
the eight-week intervention process. The questionnaires sent out to all participants‟ parents
(Appendix D) will provide the parents‟ views on early intervention and the importance
thereof, as well as the parents‟ views on the importance of parental involvement with
stimulation and developmental programmes.
4.4.10 Validity and reliability
The results of the subjective and objective evaluations on the 40 subjects will be assessed and
observed. Although these scores may appear to be similar, each child‟s level of development
is different and specific for each individual. The manner of learning and attaining knowledge
is different from child to child. Reliability and validity are essential in scientific research, as
they „help to ensure that our measures are objective’ (Pellegrini et al., 2004: p140).
4.4.10.1 Validity
Instrument validity refers to the consistency of measurements and results on different
occasions (McMillan et al., 2006: p130). Validity usually refers to the reliability and
truthfulness of the measure (Pellegrini et al., 2004: p140). The pre-tests and the post-tests are
the same, so no deviation will take place in the instrument used to assess the learners. The
researcher will test all the subjects, at a similar time of day, which ensures a fair standard of
assessment. The two aspects focused on consist of content validity and face validity.
Face validity ensures that the concepts tested all follow a developmental pattern and structure
– for example that if a child cannot count from 1-5, he/she would therefore not be able to
count from 6-10.
Content validity ensures that after a thorough investigation of the literature regarding the
cognitive concepts, including the sub-sections of mathematics, literacy and life skills, that all
the aspects of the sub-sections are taken into account in the study. Tests devised and
109
programmes implemented for the intervention are all based on the theory discussed in the
conceptual framework.
i.) Internal validity
Internal validity is the degree to which conclusions and assumptions about the cause-and-
effect relationships arising from an experiment are accurate and correct. There are many
types of threats which could affect the internal validity of a research design. (McMillan et
al., 2006: p134, 260). According to Polgar and Thomas (http://www.qmu.ac.uk/psyc
h/RTrek/study_notes/web/sn3.htm, 18/03/09), „Internal validity concerns the soundness of an
investigation‟.
Possible threats, which may affect the internal validity of this trial include the following:
History
The history refers to various possible incidents that could occur outside or inside the context
of the study. These incidents are out of the researcher‟s control, and they can influence the
results of the study (McMillan et al., 2006: p136, p261).
There is a possibility that incidents outside of the researchers control can occur. The
effectiveness of the intervention programme relies heavily on the children‟s school
attendance. Children in the experimental group that are not at school on a regular basis may
tend to have less effective results than those that are at school more consistently.
Instrumentation
Instrumentation refers to a visible change in the results. This is because of changes in the
instrument itself, or changes in the person who is implementing the research (Neuman, 2006:
p262; McMillan et al., 2006: p262).
Instrumentation refers to a visible change in the results (Neuman, 2006: p262; McMillan et
al., 2006: p262). The instrument used for the pre-tests and the post-tests will remain constant.
The same scoring sheet will be used for all children and the person implementing the research
will also remain constant throughout the research process, so no deviation will take place.
110
Subject attrition
Often there is a difference noted should the number of subjects present for the pre-test be
different from that of the post-test (McMillan et al., 2006: p138). Only subjects present for
both the pre-test and the post-test will be submitted and analysed.
Maturation
Maturation refers to changes in the individual subject that take place between the pre-test and
the post-test. Children are constantly changing and growing. From one month to the next,
they also become more mature. Factors such as the time of day, the weather, the child‟s
health and even their moods all affect their results in the tests (McMillan et al., 2006: p138-
139, 261; Neuman, 2006: p261).
Maturation refers to changes in the individual subjects between their pre-test and their post-
test scores. Because all children are constantly changing and growing, the fact that children
may develop would be a common occurrence in all the children, and one which cannot be
prevented. Every precaution will be taken to ensure that factors, such as the time of day, the
weather, the child‟s health will be considered when implementing the research.
ii.) External validity
Population external validity
Population external validity is the extent to which the results can be generalised to all other
people, not only people with similar characteristics. The results of a study should only be
generalised should the population have similar characteristics to those of the subject group.
These characteristics include features such as age, race, sex, ability (McMillan et al., 2006:
p141; http://www.gifted.uconn.edu/siegle/research/Samples/externalvalidity.html, 10/11/09).
All children in both experimental and control groups are between the ages of two and three-
and-a-half years. They attend one of three early childhood centres in Port Elizabeth, and
come from a similar socio-economic sector.
The racial breakdown of the participants includes one Indian child, one coloured and 38
white children. There are 23 males and 17 females in the experimental and control groups.
38 of the 40 children speak English at home, while the remaining two participants speak
Afrikaans.

111
4.4.10.2 Reliability
Reliability refers to the consistency of the uniformity in an experiment. It suggests that the
same thing can be reproduced by different researchers under similar conditions and reach the
same results (McMillan et al., 2006: p130, p188 & p198;
http://www.socialresearchmethods.net/kb/reliable.php, 3/11/09). In order to determine
whether the tests would be reliable when administered at different times, the group of 40
subjects from three early childhood centres will be tested over a period of five days.
4.4.11 The questionnaire
According to McMillan et al. (2006: p194), a questionnaire is the most widely used method
to obtain information. The questionnaire was developed according to a step-by-step plan in
McMillan et al. (2006: p194), whereby the following steps need to be followed:
Establish justification
Define the objectives
Write the items
Review items
Construct the general format of the questionnaire
Conduct a pilot test
Revise the questionnaire and responses
Insight into the steps of cognitive development, various strategies which are able to enhance
development and concept understanding, as well as understanding each individual‟s
development are all important. The parent or caregiver‟s understanding of their child‟s level
of development is also important. The purpose of the questionnaire was to gain an
understanding of the importance that parents or care-givers place on the cognitive
development of their child.
A questionnaire (Appendix D) will be distributed to each participant‟s parent or caregiver
that had returned a consent form agreeing to the terms of the study (Appendix C). Each
subject is given clear instructions on completing the questionnaire.
The questionnaire provides insight into the parents‟ feelings regarding their responsibilities in
regard to the cognitive development of the young child, and the responsibilities of the

112
children‟s teachers. Insight will be provided to gain a greater sense of understanding on how
parents rate their child‟s development, the necessary stages of development, the amount of
importance they place on cognitive development, activities that they would use to aid and
enhance cognitive development, and factors they believe play a role in this development.
4.5 DATA ANALYSIS
Once the pre-tests and post-tests have been implemented, and the data have been collected,
this data needs to be formatted in a way that is meaningful prior to drawing conclusions and
implementing the appropriate action (Koshy, 2005: p109). According to McMillan et al.,
(2006: p417), „quantitative data are summarized using simple descriptive statistics (eg.
frequencies, mean, mode, range) and graphs‟. The aim of data analysis is for the researcher
to determine whether they provide the needed information, in order to achieve the goals and
aims of the study (Koshy, 2005: p109).
A number of hypotheses have been postulated which will be dealt with in detail in Chapter 5.
As the aim of this study is to develop a programme that can be used to enhance cognitive
development in order to examine the effects of stimulation of mathematical, literacy and life-
skills concepts in young children, to evaluate the methods of implementation that aid
development of the cognitive concepts, and to indicate how the concepts can be provided for in
the early childhood centre, descriptive statistical procedures are utilised to investigate the
relationship between early childhood intervention and cognitive development.
The following tests were employed to test the hypotheses:
1. Single variable statistics (mean, standard deviation and coefficients of variance),
frequency histograms and one independent variable regression were used to give
greater insight into the pre-test and post-intervention scores. The reliability of the
scores for the pre-tests and the post-tests was determined by the item-analysis-factor
analysis and the calculation of Cronbach„s Coefficient of alpha (McMillan et al.,
2006: p54, p185-186).
2. T-tests were implemented in order to determine the level of significance in the control
and experimental groups, as well as to compare the two groups‟ mean scores (p > .001
at 0.1% level of significance).
113
3. The level of significance of the study was determined by the p-level or level of
probability (McMillan et al., 2006: p292). A critical value at the five-percent level of
confidence (p > .05) was required for significance.
4. Analysis of co-variance, using the statistical software package program used by
BMDP2007 in addition to the analysis of co-variance, where the treatment was the
grouping variant and the pre-test was the co-variant, used to test the level of
improvement in the scores as a result of the intervention programme (McMillan et al.,
2006: p165).
5. The item-analysis-factor analysis and the calculation of Cronbach‟s coefficient of
alpha were used to test the reliability of the pre-test and post-intervention test scores
(McMillan et al., 2006: p185-186).
4.6 THE LIMITATIONS OF THE STUDY
The study was limited to the selected children aged between two and three-and-a-half years
from the three selected early childhood centres in the middle class socio-economic status
group of Port Elizabeth. Other centres and age-groups were not explored. Further, the length
of the dissertation had a constraining and limited time frame which resulted in speeding up
the research process so that the due date of the dissertation could be met.
4.7 CONCLUSIONS
To test the ability of understanding and the development of mathematical, literacy and life-
skills concepts of children in their early childhood a programme has been designed and will
be implemented, which focuses on the primary cognitive concepts. A test will be conducted
on a Group of 40 subjects. Twenty of these subjects will be worked with for a further eight
weeks, during which time the primary cognitive concepts are to be taught, according to the
child‟s level of understanding. After the eight-week study, the same test will be carried out
on all the original 40 subjects.
The effects of the children which were stimulated and those that were not stimulated will be
assessed. The effectiveness of the intervention programme will also be tested, and the results
of success or failure noted.

114
In this chapter an overview had been given on the research methodology used for this study.
In the following chapter, a more in-depth description will be given of the plan for analysing
the collected data, as well as the research results obtained from the analysis.
115
CHAPTER 5
DATA ANALYSIS AND FINDINGS
5.1 INTRODUCTION
This chapter presents the results of a study conducted to gain a comprehensive understanding
of the effects of cognitive stimulation (mathematics, literacy and life skills) on the
development of the young child, in order to develop a suitable programme that can be used to
enhance the development of young children. This was done by means of a literature study, as
well as an empirical investigation.
The secondary aims of this study were to:
Develop and evaluate a programme of mathematical skills, language and literacy
development and general knowledge and life-skills stimulation; to enhance the ability
of young children in order to provide a better understanding of the cognitive
development and abilities of these learners, as well as providing insight into the
benefits of and the rate of individual development of the young learners‟ cognitive
abilities,
Assess the validity of the programme of cognitive development; and
Establish the reliability of the application of the programme of cognitive
development.
The following analysis of the data was employed:
1. Single variable descriptive statistics (mean, standard deviation and frequency
distributions) give insight into the pre and post-intervention scores.
2. The reliability of the scores for the pre-test and post-test procedures were determined
by item analysis consisting of factor analysis and the calculation of Cronbach‟s
coefficient of alpha (McMillan et al., 2006: p54, p185-186).
3. T-tests were carried out in order to determine the level of significance in the control
and experimental groups, as well as to compare the two groups‟ mean scores (p < .001
at 0.1% level of significance).

116
4. The level of significance of the study was determined by the p-level or level of
probability (McMillan et al., 2006: p292). A critical value at the five-percent level of
confidence (p > .05) was required for significance.
5. The level of improvement in the scores as a result of the intervention programme were
tested by using the statistical software package program (BMDP2007). In testing the
analysis of co-variance, the treatment was the grouping variant and the pre-test was
the co-variant (McMillan et al., 2006: p165).
The concept of significance, both statistical (based on p-value) and practical (either Cohen‟s
d or Cramérs V) mention that where it is reported that p = .000, it does not mean that p is
equal to zero, but on account of rounding, that p is less than 0.0005 (SOURCE). When
significance is mentioned, it refers to both statistical significance and practical significance.
5.2 SAMPLE DISTRIBUTION
Literature was reviewed to identify the importance of early childhood intervention, as well as
to gain an understanding of the major theoretical advances in the history of education.
According to McAfee and Leong (2007: p36), there are various facets of a child‟s
development, namely the physical, emotional, social, cognitive, normative and spiritual. The
cognitive aspect of development was the focal point of this study, emphasising the
importance of literacy, mathematics and life skills.
For the purpose of this study all participants were selected by means of systematic random
sampling, where each individual had an equal chance of being selected (Neuman, 2006:
p230). Children had to be between the ages of two years (24 months) and three-and-a-half
years (42 months) old, and to attend one of three Early Childhood Centres in Port Elizabeth.
5.2.1 Age of subjects
The subjects‟ included in this study ranged from two years old (24 months) to three-and-a-
half years old (42 months). Table 5.1 represents the age distribution of the 40 subjects (in
months). The greatest number of subjects in one age group is five subjects (13%) at 37
months old.
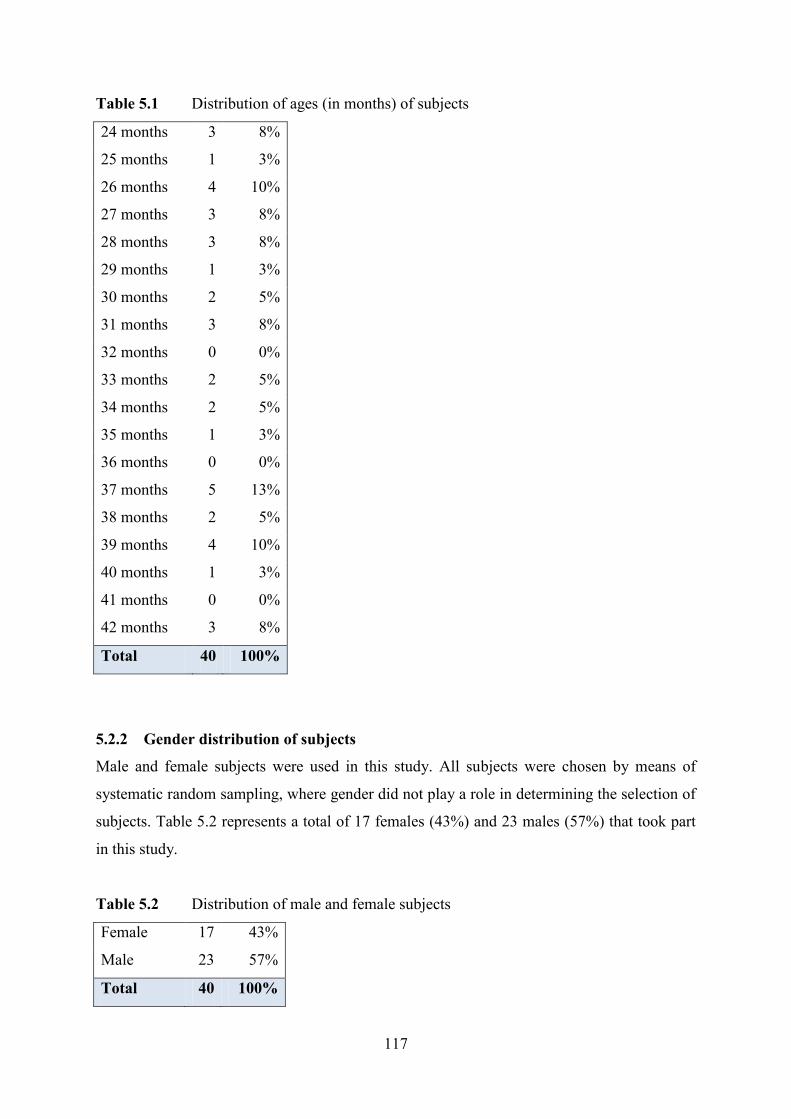
117
Table 5.1 Distribution of ages (in months) of subjects
24 months 3 8%
25 months 1 3%
26 months 4 10%
27 months 3 8%
28 months 3 8%
29 months 1 3%
30 months 2 5%
31 months 3 8%
32 months 0 0%
33 months 2 5%
34 months 2 5%
35 months 1 3%
36 months 0 0%
37 months 5 13%
38 months 2 5%
39 months 4 10%
40 months 1 3%
41 months 0 0%
42 months 3 8%
Total 40 100%
5.2.2 Gender distribution of subjects
Male and female subjects were used in this study. All subjects were chosen by means of
systematic random sampling, where gender did not play a role in determining the selection of
subjects. Table 5.2 represents a total of 17 females (43%) and 23 males (57%) that took part
in this study.
Table 5.2 Distribution of male and female subjects
Female 17 43%
Male 23 57%
Total 40 100%
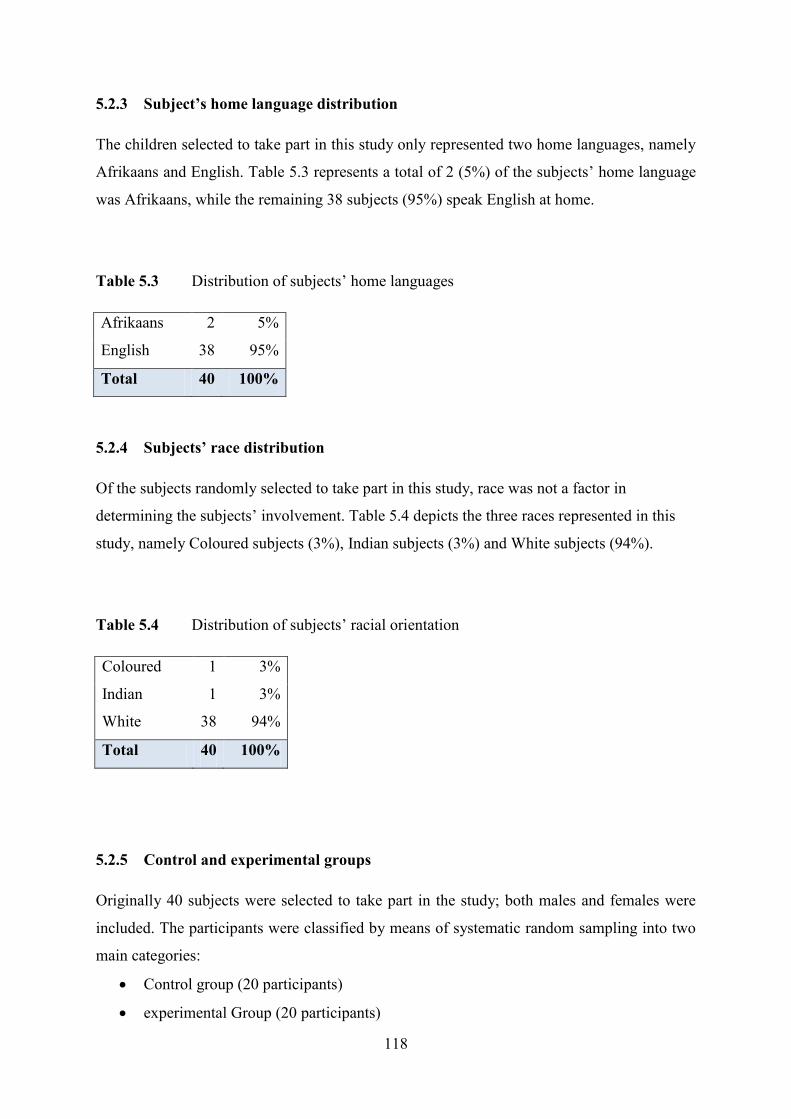
118
5.2.3 Subject’s home language distribution
The children selected to take part in this study only represented two home languages, namely
Afrikaans and English. Table 5.3 represents a total of 2 (5%) of the subjects‟ home language
was Afrikaans, while the remaining 38 subjects (95%) speak English at home.
Table 5.3 Distribution of subjects‟ home languages
Afrikaans 2 5%
English 38 95%
Total 40 100%
5.2.4 Subjects’ race distribution
Of the subjects randomly selected to take part in this study, race was not a factor in
determining the subjects‟ involvement. Table 5.4 depicts the three races represented in this
study, namely Coloured subjects (3%), Indian subjects (3%) and White subjects (94%).
Table 5.4 Distribution of subjects‟ racial orientation
Coloured 1 3%
Indian 1 3%
White 38 94%
Total 40 100%
5.2.5 Control and experimental groups
Originally 40 subjects were selected to take part in the study; both males and females were
included. The participants were classified by means of systematic random sampling into two
main categories:
Control group (20 participants)
experimental Group (20 participants)
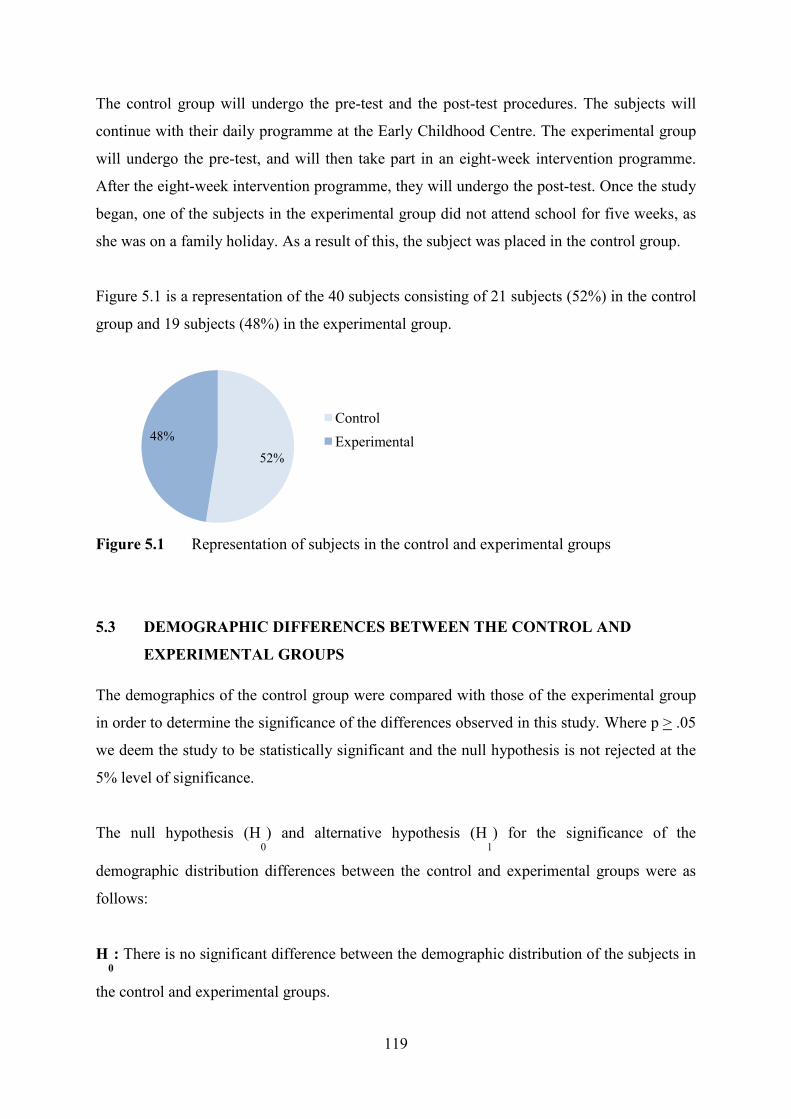
119
The control group will undergo the pre-test and the post-test procedures. The subjects will
continue with their daily programme at the Early Childhood Centre. The experimental group
will undergo the pre-test, and will then take part in an eight-week intervention programme.
After the eight-week intervention programme, they will undergo the post-test. Once the study
began, one of the subjects in the experimental group did not attend school for five weeks, as
she was on a family holiday. As a result of this, the subject was placed in the control group.
Figure 5.1 is a representation of the 40 subjects consisting of 21 subjects (52%) in the control
group and 19 subjects (48%) in the experimental group.
Figure 5.1 Representation of subjects in the control and experimental groups
5.3 DEMOGRAPHIC DIFFERENCES BETWEEN THE CONTROL AND
EXPERIMENTAL GROUPS
The demographics of the control group were compared with those of the experimental group
in order to determine the significance of the differences observed in this study. Where p > .05
we deem the study to be statistically significant and the null hypothesis is not rejected at the
5% level of significance.
The null hypothesis (H0
) and alternative hypothesis (H1
) for the significance of the
demographic distribution differences between the control and experimental groups were as
follows:
H0
: There is no significant difference between the demographic distribution of the subjects in
the control and experimental groups.
52%
48%
Control
Experimental
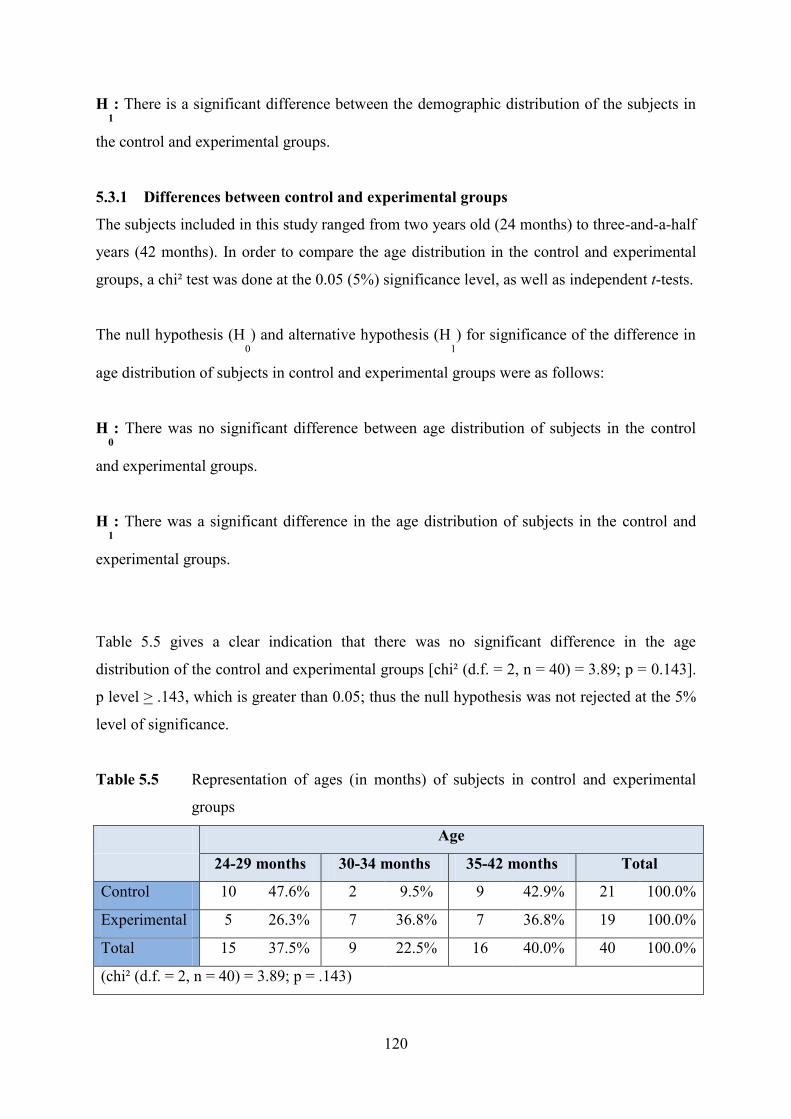
120
H1
: There is a significant difference between the demographic distribution of the subjects in
the control and experimental groups.
5.3.1 Differences between control and experimental groups
The subjects included in this study ranged from two years old (24 months) to three-and-a-half
years (42 months). In order to compare the age distribution in the control and experimental
groups, a chi² test was done at the 0.05 (5%) significance level, as well as independent t-tests.
The null hypothesis (H0
) and alternative hypothesis (H1
) for significance of the difference in
age distribution of subjects in control and experimental groups were as follows:
H0
: There was no significant difference between age distribution of subjects in the control
and experimental groups.
H1
: There was a significant difference in the age distribution of subjects in the control and
experimental groups.
Table 5.5 gives a clear indication that there was no significant difference in the age
distribution of the control and experimental groups [chi² (d.f. = 2, n = 40) = 3.89; p = 0.143].
p level > .143, which is greater than 0.05; thus the null hypothesis was not rejected at the 5%
level of significance.
Table 5.5 Representation of ages (in months) of subjects in control and experimental
groups
Age
24-29 months 30-34 months 35-42 months Total
Control 10 47.6% 2 9.5% 9 42.9% 21 100.0%
Experimental 5 26.3% 7 36.8% 7 36.8% 19 100.0%
Total 15 37.5% 9 22.5% 16 40.0% 40 100.0%
(chi² (d.f. = 2, n = 40) = 3.89; p = .143)

121
Figure 5.2 provides a comparison between the ages of subjects (in months) in the control and
experimental groups. The age distribution within the two groups shows that there is no
significant difference between the ages of the two groups, so the results of the study have not
been influenced by the age distribution differences between the control and experimental
groups.
Figure 5.2 Representation of the ages of subjects in control and experimental groups
An independent t-test was also conducted to determine whether there was a significant
difference between the average age of the subjects in the control group and the average age of
the subjects in the experimental group.
The null hypothesis (H0
) and alternative hypothesis (H1
) for significance of the difference in
age distribution of subjects in control and experimental groups were as follows:
H0
: There is no significant difference between the average age of subjects in the control and
experimental groups.
26.3%
36.8%
36.8%
Experimental Group
24-29 months
30-34 months
35-42 months
47.6%
9.5%
42.9%
Control Group
24-29 months
30-34 months
35-42 months
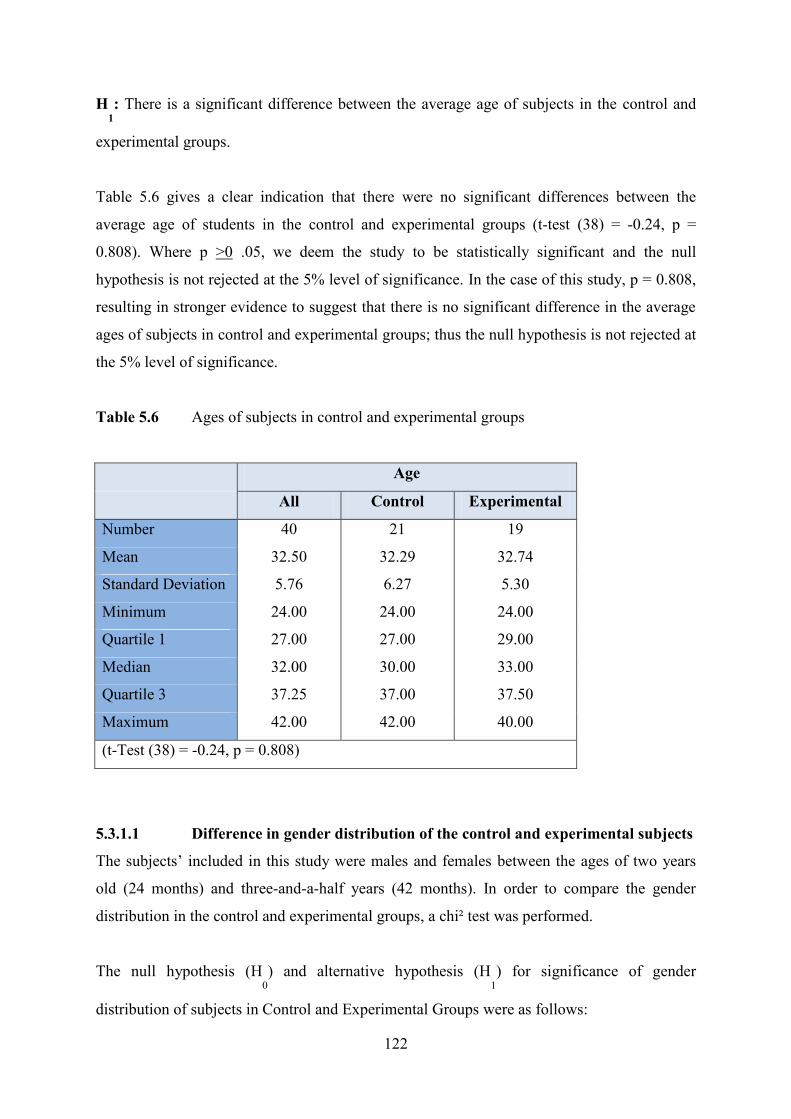
122
H1
: There is a significant difference between the average age of subjects in the control and
experimental groups.
Table 5.6 gives a clear indication that there were no significant differences between the
average age of students in the control and experimental groups (t-test (38) = -0.24, p =
0.808). Where p >0 .05, we deem the study to be statistically significant and the null
hypothesis is not rejected at the 5% level of significance. In the case of this study, p = 0.808,
resulting in stronger evidence to suggest that there is no significant difference in the average
ages of subjects in control and experimental groups; thus the null hypothesis is not rejected at
the 5% level of significance.
Table 5.6 Ages of subjects in control and experimental groups
Age
All Control Experimental
Number 40 21 19
Mean 32.50 32.29 32.74
Standard Deviation 5.76 6.27 5.30
Minimum 24.00 24.00 24.00
Quartile 1 27.00 27.00 29.00
Median 32.00 30.00 33.00
Quartile 3 37.25 37.00 37.50
Maximum 42.00 42.00 40.00
(t-Test (38) = -0.24, p = 0.808)
5.3.1.1 Difference in gender distribution of the control and experimental subjects
The subjects‟ included in this study were males and females between the ages of two years
old (24 months) and three-and-a-half years (42 months). In order to compare the gender
distribution in the control and experimental groups, a chi² test was performed.
The null hypothesis (H0
) and alternative hypothesis (H1
) for significance of gender
distribution of subjects in Control and Experimental Groups were as follows:

123
H0
: There is no significant difference between the gender distribution of subjects in the
control and experimental groups.
H1
: There is a significant difference between the gender distribution of the subjects in the
control and experimental groups.
In Table 5.7, p = 0.967 which gives a clear indication that there is no significant difference in
the gender distribution of the control and experimental groups (chi² (d.f. = 1, n = 40) = 0.00;
p = 0.967). There is strong evidence to suggest that there was no significant difference in the
gender distribution of subjects in control and experimental groups; thus the null hypothesis is
not rejected at the 5% level of significance and the study is deemed as being statistically
significant.
Table 5.7 Representation of gender of subjects in control and experimental groups
Figure 5.3 provides a comparison between the gender distribution in the control and
experimental groups. The gender distribution within the two groups shows that there was no
significant difference; so the results of the study have not been influenced by gender
distribution in the control and experimental groups.
Gender
Female Male Total
Control 9 42.9% 12 57.1% 21 100.0%
Experimental 8 42.1% 11 57.9% 19 100.0%
Total 17 42.5% 23 57.5% 40 100.0%
(chi² (d.f. = 1, n = 40) = 0.00; p = 0.967)

124
42.1%
57.9%
Experimental Group
Female
Male42.9%
57.1%
Control Group
Female
Male
Figure 5.3 Representation of the gender distribution in control and experimental groups
5.3.1.2 Differences in home language distribution in the control and experimental
subjects
The subjects included in this study represented only two (2) home language options, namely
English and Afrikaans. In order to compare the language distribution in the control and
experimental groups, a chi² test was done.
The null hypothesis (H0
) and alternative hypothesis (H1
) for significance of home language
distribution of subjects in Control and Experimental Groups were as follows:
H0
: There is no significant difference between the subjects‟ home language distribution in the
control and experimental groups.
H1
: There is a significant difference between the subjects‟ home language distribution in the
control and experimental groups.
Table 5.8 indicates the two languages represented by the control and experimental groups, as
well as the number and percentage of subjects which represent each home language.
Table 5.8, p = 0.897 gives a clear indication that there was no significant difference in the
subjects‟ home language distribution between the control and experimental groups (chi² (d.f.
= 1, n = 40) = 0.02; p = 0.897), p=0.897. This is significantly greater than 0.05. The null
hypothesis is therefore not rejected at the 5% level of significance and the study is deemed as
being statistically significant.

125
Table 5.8 Representation of subjects‟ home languages in the control and experimental
groups
Home Language
Afrikaans English Total
Control 1 4.8% 20 95.2% 21 100.0%
Experimental 1 5.3% 18 94.7% 19 100.0%
Total 2 5.0% 38 95.0% 40 100.0%
(chi² (d.f. = 1, n = 40) = 0.02; p = 0.897)
Figure 5.4 provides a comparison between the distribution of home languages in the control
and experimental groups. The home language distribution within the two groups shows that
there was no significant difference; so the results of the study have not been influenced by
home language distribution in either the control or the experimental groups.
Figure 5.4 Representation of home language distribution in control and experimental
groups
5.3.1.3 Differences in race distribution of the control and experimental subjects
The subjects included in this study represented three racial orientations, namely Coloured,
Indian and White. In order to compare the racial orientation of subjects in the control and
experimental groups, a chi² test was done.
94.7%
5.3%
Experimental Group
EnglishAfrikaans
95.2%
4.8%
Control Group
English
Afrikaans
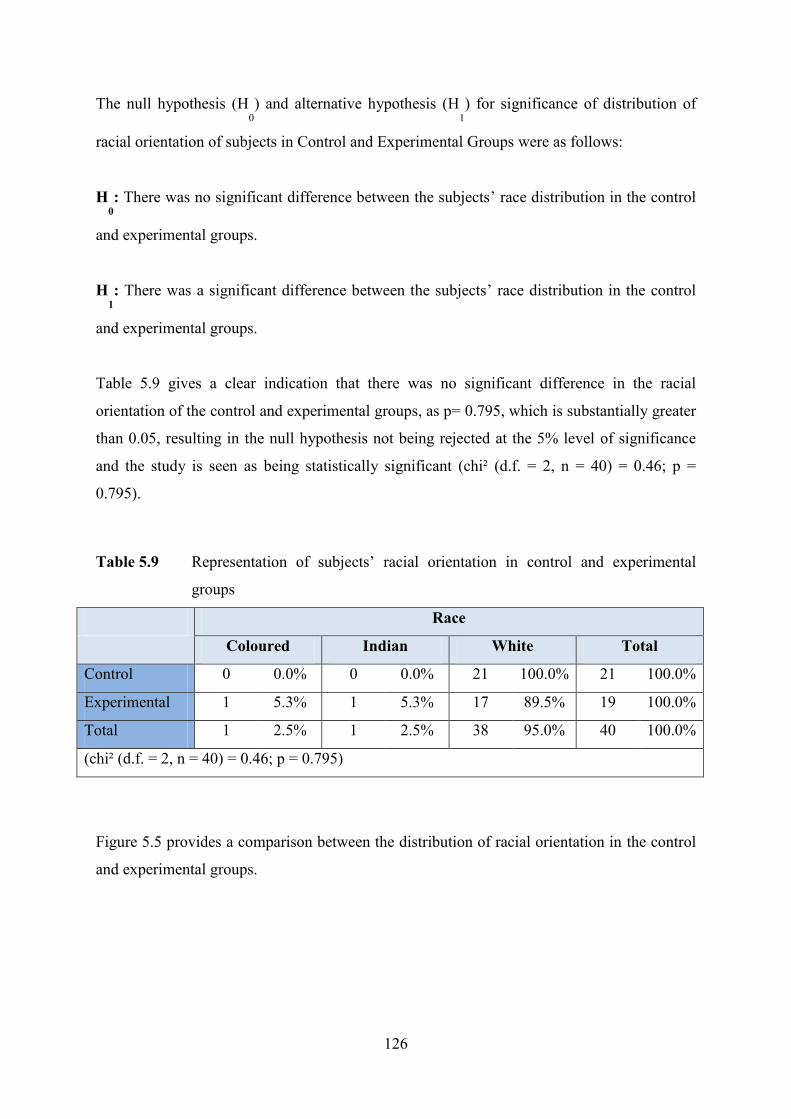
126
The null hypothesis (H0
) and alternative hypothesis (H1
) for significance of distribution of
racial orientation of subjects in Control and Experimental Groups were as follows:
H0
: There was no significant difference between the subjects‟ race distribution in the control
and experimental groups.
H1
: There was a significant difference between the subjects‟ race distribution in the control
and experimental groups.
Table 5.9 gives a clear indication that there was no significant difference in the racial
orientation of the control and experimental groups, as p= 0.795, which is substantially greater
than 0.05, resulting in the null hypothesis not being rejected at the 5% level of significance
and the study is seen as being statistically significant (chi² (d.f. = 2, n = 40) = 0.46; p =
0.795).
Table 5.9 Representation of subjects‟ racial orientation in control and experimental
groups
Race
Coloured Indian White Total
Control 0 0.0% 0 0.0% 21 100.0% 21 100.0%
Experimental 1 5.3% 1 5.3% 17 89.5% 19 100.0%
Total 1 2.5% 1 2.5% 38 95.0% 40 100.0%
(chi² (d.f. = 2, n = 40) = 0.46; p = 0.795)
Figure 5.5 provides a comparison between the distribution of racial orientation in the control
and experimental groups.

127
Figure 5.5 Representation of subjects‟ racial orientation in control and experimental
groups
The results in the notation of sample distribution in control and experimental groups were:
H0
: There is no significant difference between the sample distribution of subjects in the
control and experimental groups; therefore the null hypothesis is true at the 5% level of
significance.
H1
: There is a significant difference between the sample distribution of the subjects in the
control and experimental groups; therefore the alternate hypothesis is not true at the 5% level
of significance.
5.3.2 Reliability
Reliability refers to the consistency in the uniformity of an experiment. It suggests that the
same thing can be reproduced by different researchers under similar conditions and gain the
same results (McMillan et al., 2006: p130, 188, 198). If the instrument does not show much
error, then it is reliable. If the instrument has a considerable amount of error, it is seen as
being unreliable.
94.7%5.3%
90%
Experimental Group
Coloured
Indian
White
100%
Control Group
Coloured
Indian
White
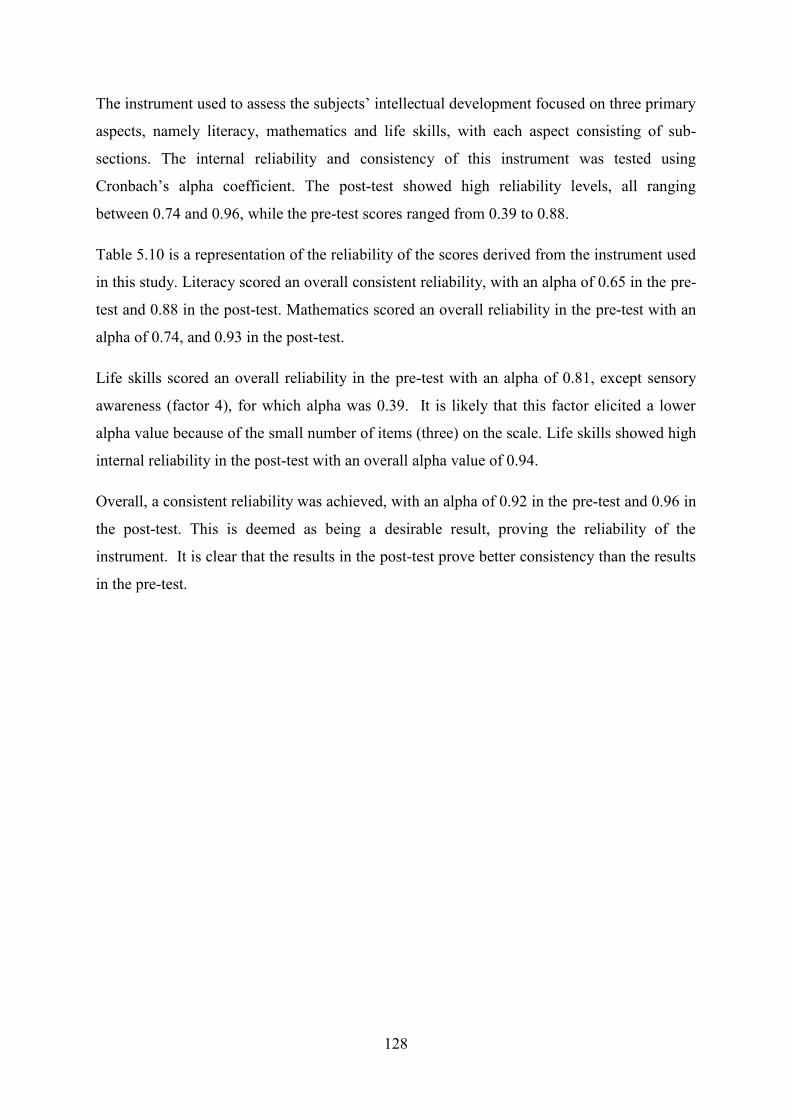
128
The instrument used to assess the subjects‟ intellectual development focused on three primary
aspects, namely literacy, mathematics and life skills, with each aspect consisting of sub-
sections. The internal reliability and consistency of this instrument was tested using
Cronbach‟s alpha coefficient. The post-test showed high reliability levels, all ranging
between 0.74 and 0.96, while the pre-test scores ranged from 0.39 to 0.88.
Table 5.10 is a representation of the reliability of the scores derived from the instrument used
in this study. Literacy scored an overall consistent reliability, with an alpha of 0.65 in the pre-
test and 0.88 in the post-test. Mathematics scored an overall reliability in the pre-test with an
alpha of 0.74, and 0.93 in the post-test.
Life skills scored an overall reliability in the pre-test with an alpha of 0.81, except sensory
awareness (factor 4), for which alpha was 0.39. It is likely that this factor elicited a lower
alpha value because of the small number of items (three) on the scale. Life skills showed high
internal reliability in the post-test with an overall alpha value of 0.94.
Overall, a consistent reliability was achieved, with an alpha of 0.92 in the pre-test and 0.96 in
the post-test. This is deemed as being a desirable result, proving the reliability of the
instrument. It is clear that the results in the post-test prove better consistency than the results
in the pre-test.

129
0.650.74
0.810.88
0.93 0.94
0
0.2
0.4
0.6
0.8
1
Literacy Numeracy Life Skills
Pre-test Post-test
Table 5.10 Reliability statistics for pre-test and post-test scores
Cronbach's alpha
Pre-test Post-test
TOTAL 0.92 0.96
LITERACY 0.65 0.88
Vocabulary 0.69 0.82
Speech 0.66 0.88
Listening 0.77 0.91
Writing 0.60 0.79
MATHEMATICS 0.74 0.93
Counting 0.88 0.91
One-to-one correspondence 0.76 0.96
Classifying 0.55 0.87
Sequencing 0.49 0.90
Geometry 0.67 0.74
LIFE SKILLS 0.81 0.94
Visual Motor 0.65 0.91
Foreground/Background 0.68 0.88
Discrimination 0.77 0.92
Sensory Awareness 0.39 0.81
Figure 5.6 is a graphical representation of the total alpha scores in each aspect of the
instrument used to test reliability, namely literacy, mathematics and life skills in the pre-test
and post-test procedures.
Figure 5.6 Total alpha scores of the instrument used, representing internal reliability

130
The minimum score obtained in the pre-test was 0.39 (life skills - sensory awareness) and the
maximum score was 0.88 (mathematics - counting). The minimum score obtained in the post-
test was 0.74 (mathematics-geometry) and the maximum 0.96 (mathematics – one-to-one
correspondence). The results in the post-test were more consistent.
Table 5.11 Minimum and maximum scores of alpha in pre-test and post-test
Pre-test Post-test
Min 0.39 0.74
Max 0.88 0.96
5.4 FREQUENCY DISTRIBUTIONS FOR PRE-TEST AND POST-TEST SCORES
A frequency distribution represents the number of scores in each of the several ranges of
values (http://davidmlane.com/hyperstat/A26308.html, 22/10/09). Frequency distributions
were calculated on all results from pre-tests and post-tests performed on all 40 subjects. The
frequency distribution of scores for the control group and experimental groups during the pre-
test and post-test scores are represented in Table 5.12, Table 5.13, Table 5.14 and Table 5.15.
Scores‟ range in categories presented were as follows:
[1.0, 1.8) Starting at 1.0 until (but not including) 1.8
[1.8, 2.6) From (and including) 1.8 until (but not including) 2.6
[2.6, 3.4] From (and including) 2.6 until (and including) 3.4
(3.4, 4.2] From (and not including) 3.4, until (and including) 4.2
(4.2, 5] From (and not including) 4.2, until and including) 5
5.4.1 CONTROL GROUP
The control group consisted of 21 subjects from three Early Childhood Centres. The control
(group completed the pre-test; thereafter they were subjected to their regular daily routine at
the Early Childhood Centre. After the intervention process was complete with the
experimental group, the control and experimental group completed the post-test.

131
5.4.1.1 Pre-test frequency distribution
The frequencies of scores of the control group during their pre-test were determined and are
presented in Table 5.12.
Table 5.12 Frequency distribution in control group during the pre-test, showing literacy,
mathematics and life skills
CONTROL GROUP [1.0, 1.8) [1.8, 2.6) [2.6, 3.4] (3.4, 4.2] (4.2, 5] Mean S.D.
Total PRE-TEST 14 67% 6 29% 1 5% 0 0% 0 0% 1.69 0.43
LITERACY 10 48% 7 33% 4 19% 0 0% 0 0% 2.00 0.57
Vocabulary 6 29% 7 33% 8 38% 0 0% 0 0% 2.26 0.82
Speech 5 24% 9 43% 2 10% 5 24% 0 0% 2.50 0.92
Listening 10 48% 4 19% 6 29% 1 5% 0 0% 2.07 0.91
Reading 15 71% 0 0% 6 29% 0 0% 0 0% 1.57 0.93
Writing 13 62% 5 24% 2 10% 0 0% 1 5% 1.62 1.02
MATHEMATICS 16 76% 4 19% 1 5% 0 0% 0 0% 1.50 0.46
Counting 16 76% 1 5% 3 14% 1 5% 0 0% 1.81 0.79
One-to-one
Correspondence 16 76% 3 14% 1 5% 1 5% 0 0% 1.48 0.73
Classifying 19 90% 2 10% 0 0% 0 0% 0 0% 1.10 0.30
Sequencing 20 95% 0 0% 1 5% 0 0% 0 0% 1.13 0.45
Geometry 11 52% 6 29% 3 14% 0 0% 1 5% 1.98 0.89
LIFE SKILLS 18 86% 2 10% 1 5% 0 0% 0 0% 1.56 0.40
Visual-Motor 5 24% 12 57% 4 19% 0 0% 0 0% 1.95 0.61
Fore/Background 17 81% 3 14% 0 0% 1 5% 0 0% 1.54 0.69
Discrimination 18 86% 3 14% 0 0% 0 0% 0 0% 1.33 0.43
Sensory Awareness 19 90% 1 5% 1 5% 0 0% 0 0% 1.41 0.54
The range [1.0, 1.8) was the most frequent range of scores overall. 48% of the scores were in
the range [1.0, 1.8) for literacy, while 76% of the mathematics scores were in the range [1.0,
1.8), and 86% of the life skills scores were also in the range [1.0, 1.8).
The most common score range in the pre-test for each concept in literacy, mathematics and
life skills in the control group are represented in Table 5.13.

132
Table 5.13 Most common score range in control group‟s pre-test
Range Percentage
LITERACY [1.0, 1.8) 48%
Vocabulary [2.6, 3.4] 38%
Speech [1.8, 2.6) 43%
Listening [1.0, 1.8) 48%
Reading [1.0, 1.8) 71%
Writing [1.0, 1.8) 62%
MATHEMATICS [1.0, 1.8) 76%
Counting [1.0, 1.8) 76%
One-to-one Correspondence [1.0, 1.8) 76%
Classifying [1.0, 1.8) 90%
Sequencing [1.0, 1.8) 95%
Geometry [1.0, 1.8) 52%
LIFE SKILLS [1.0, 1.8) 86%
Visual-Motor [1.8, 2.6) 57%
Fore/Background [1.0, 1.8) 81%
Discrimination [1.0, 1.8) 86%
Sensory Awareness [1.0, 1.8) 90%
It is interesting to note that each case of mathematics scored the highest frequency
distribution in the range [1.0, 1.8). In four out of the five concepts, namely counting (76%),
one-to-one correspondence (76%), classifying (90%) and sequencing (95%), more than ¾
(75%) of the mean scores were in this range. In literacy, three out of the four concepts,
namely visual-motor (57%), foreground and background (81%) and discrimination (86%),
more than 80% of the mean scores were in the range [1.0, 1.8).
Figure 5.7 represents the total frequency distribution (%) of scores for the control group in
the pre-test. It is evident that the most common result scored was in the range: [1.0, 1.8),
comprising 67% of all scores for the pre-test in the control group.
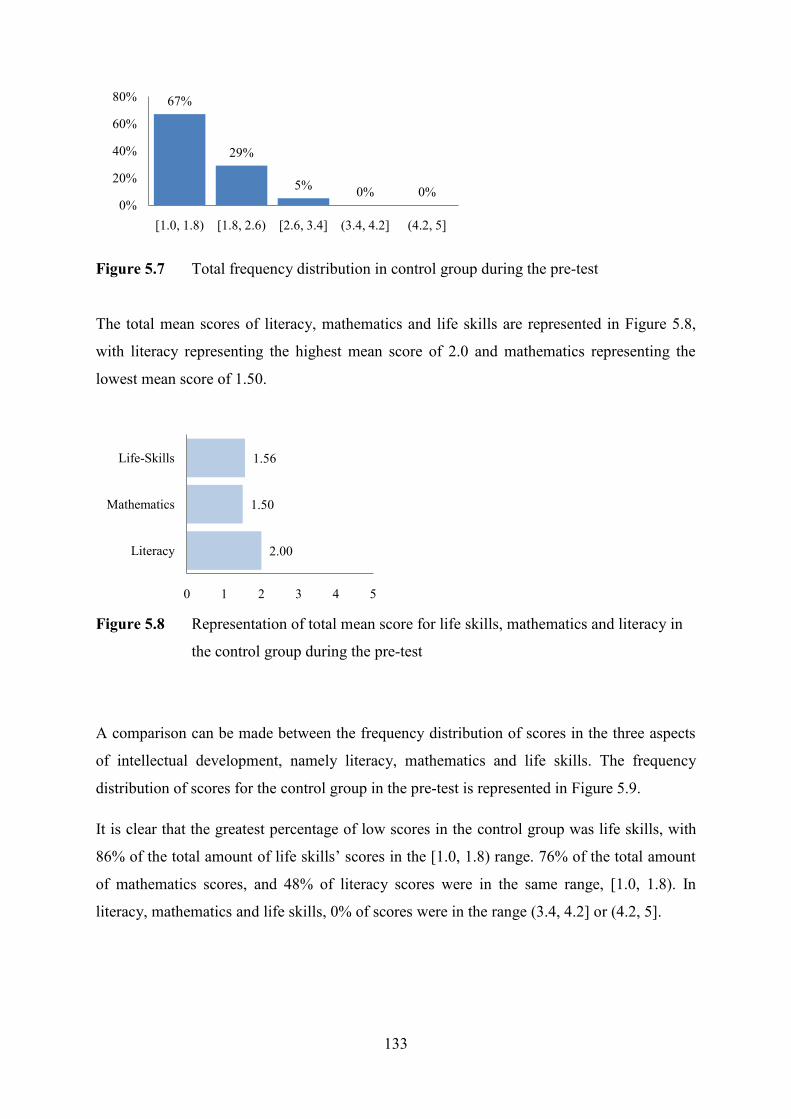
133
2.00
1.50
1.56
0 1 2 3 4 5
Literacy
Mathematics
Life-Skills
Figure 5.7 Total frequency distribution in control group during the pre-test
The total mean scores of literacy, mathematics and life skills are represented in Figure 5.8,
with literacy representing the highest mean score of 2.0 and mathematics representing the
lowest mean score of 1.50.
Figure 5.8 Representation of total mean score for life skills, mathematics and literacy in
the control group during the pre-test
A comparison can be made between the frequency distribution of scores in the three aspects
of intellectual development, namely literacy, mathematics and life skills. The frequency
distribution of scores for the control group in the pre-test is represented in Figure 5.9.
It is clear that the greatest percentage of low scores in the control group was life skills, with
86% of the total amount of life skills‟ scores in the [1.0, 1.8) range. 76% of the total amount
of mathematics scores, and 48% of literacy scores were in the same range, [1.0, 1.8). In
literacy, mathematics and life skills, 0% of scores were in the range (3.4, 4.2] or (4.2, 5].
67%
29%
5%0% 0%
0%
20%
40%
60%
80%
[1.0, 1.8) [1.8, 2.6) [2.6, 3.4] (3.4, 4.2] (4.2, 5]

134
Figure 5.9 Comparison of distribution of scores for literacy, mathematics and life skills n
the pre-test
The mean scores of each aspect of intellectual development (literacy, mathematics, life skills)
in the control group during the pre-test are represented in Figure 5.10.
The literacy concepts which the control group found most challenging were reading (1.57)
and writing (1.62), while speech (2.50) was a strong point.
In mathematics, geometry (1.98) and counting (1.81) were the strongest concepts, while
classifying (1.1) and sequencing (1.13) showed poor results.
The most challenging life-skills concept was discrimination (1.33), while visual-motor (1.95)
was the strongest life-skills concept.
Figure 5.10 Mean scores of aspects of intellectual development in Control Group during
the Pre-test.
48%
33%
19%
Literacy
[1.0, 1.8)
[1.8, 2.6)
[2.6, 3.4]
(3.4, 4.2]
(4.2, 5]76%
19%
5%
Mathematics
[1.0, 1.8)
[1.8, 2.6)
[2.6, 3.4]
(3.4, 4.2]
(4.2, 5] 86%
10% 5%
Life-skills
[1.0, 1.8)
[1.8, 2.6)
[2.6, 3.4]
(3.4, 4.2]
(4.2, 5]
2.26
2.50
2.07
1.57
1.62
0 1 2 3 4 5
Vocabulary
Speech
Listening
Reading
Writing
Literacy
1.81
1.48
1.10
1.13
1.98
0 1 2 3 4 5
Counting
One-to-One
Classifying
Sequencing
Geometry
Mathematics
1.95
1.54
1.33
1.41
0 1 2 3 4 5
Visual-Motor
Fore/Backgrnd
Discrimination
Sensory
Life-skills
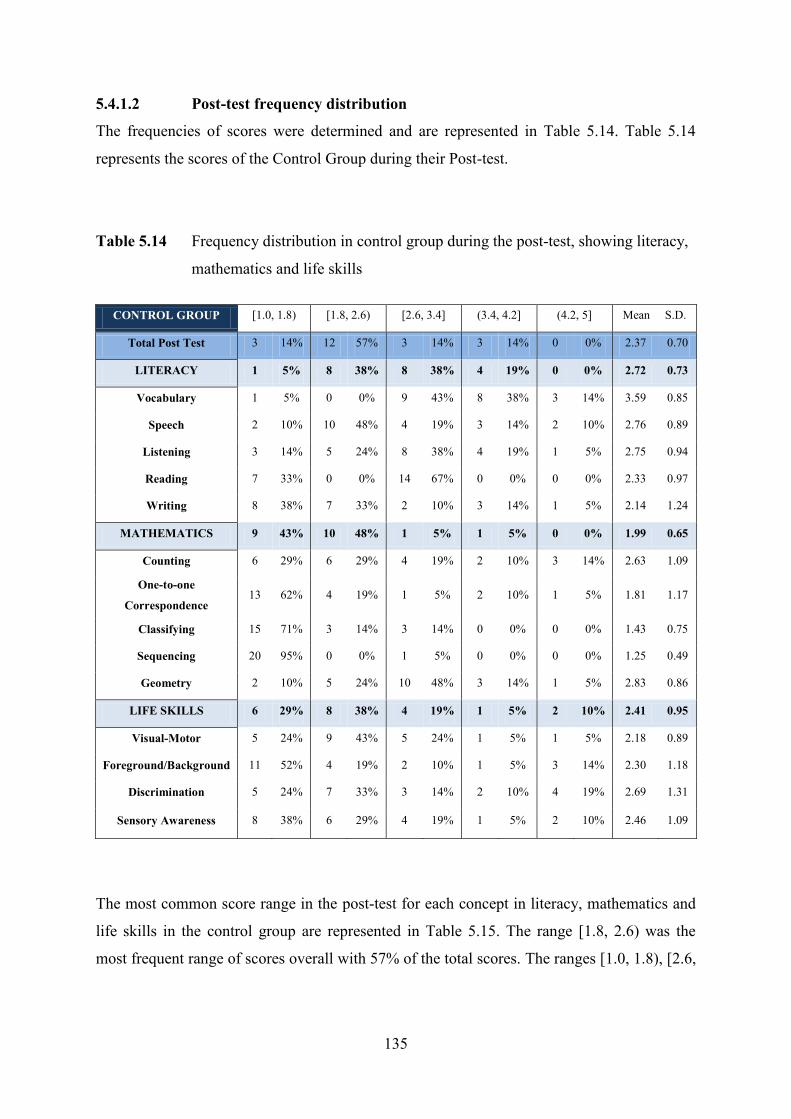
135
5.4.1.2 Post-test frequency distribution
The frequencies of scores were determined and are represented in Table 5.14. Table 5.14
represents the scores of the Control Group during their Post-test.
Table 5.14 Frequency distribution in control group during the post-test, showing literacy,
mathematics and life skills
The most common score range in the post-test for each concept in literacy, mathematics and
life skills in the control group are represented in Table 5.15. The range [1.8, 2.6) was the
most frequent range of scores overall with 57% of the total scores. The ranges [1.0, 1.8), [2.6,
CONTROL GROUP [1.0, 1.8) [1.8, 2.6) [2.6, 3.4] (3.4, 4.2] (4.2, 5] Mean S.D.
Total Post Test 3 14% 12 57% 3 14% 3 14% 0 0% 2.37 0.70
LITERACY 1 5% 8 38% 8 38% 4 19% 0 0% 2.72 0.73
Vocabulary 1 5% 0 0% 9 43% 8 38% 3 14% 3.59 0.85
Speech 2 10% 10 48% 4 19% 3 14% 2 10% 2.76 0.89
Listening 3 14% 5 24% 8 38% 4 19% 1 5% 2.75 0.94
Reading 7 33% 0 0% 14 67% 0 0% 0 0% 2.33 0.97
Writing 8 38% 7 33% 2 10% 3 14% 1 5% 2.14 1.24
MATHEMATICS 9 43% 10 48% 1 5% 1 5% 0 0% 1.99 0.65
Counting 6 29% 6 29% 4 19% 2 10% 3 14% 2.63 1.09
One-to-one
Correspondence 13 62% 4 19% 1 5% 2 10% 1 5% 1.81 1.17
Classifying 15 71% 3 14% 3 14% 0 0% 0 0% 1.43 0.75
Sequencing 20 95% 0 0% 1 5% 0 0% 0 0% 1.25 0.49
Geometry 2 10% 5 24% 10 48% 3 14% 1 5% 2.83 0.86
LIFE SKILLS 6 29% 8 38% 4 19% 1 5% 2 10% 2.41 0.95
Visual-Motor 5 24% 9 43% 5 24% 1 5% 1 5% 2.18 0.89
Foreground/Background 11 52% 4 19% 2 10% 1 5% 3 14% 2.30 1.18
Discrimination 5 24% 7 33% 3 14% 2 10% 4 19% 2.69 1.31
Sensory Awareness 8 38% 6 29% 4 19% 1 5% 2 10% 2.46 1.09
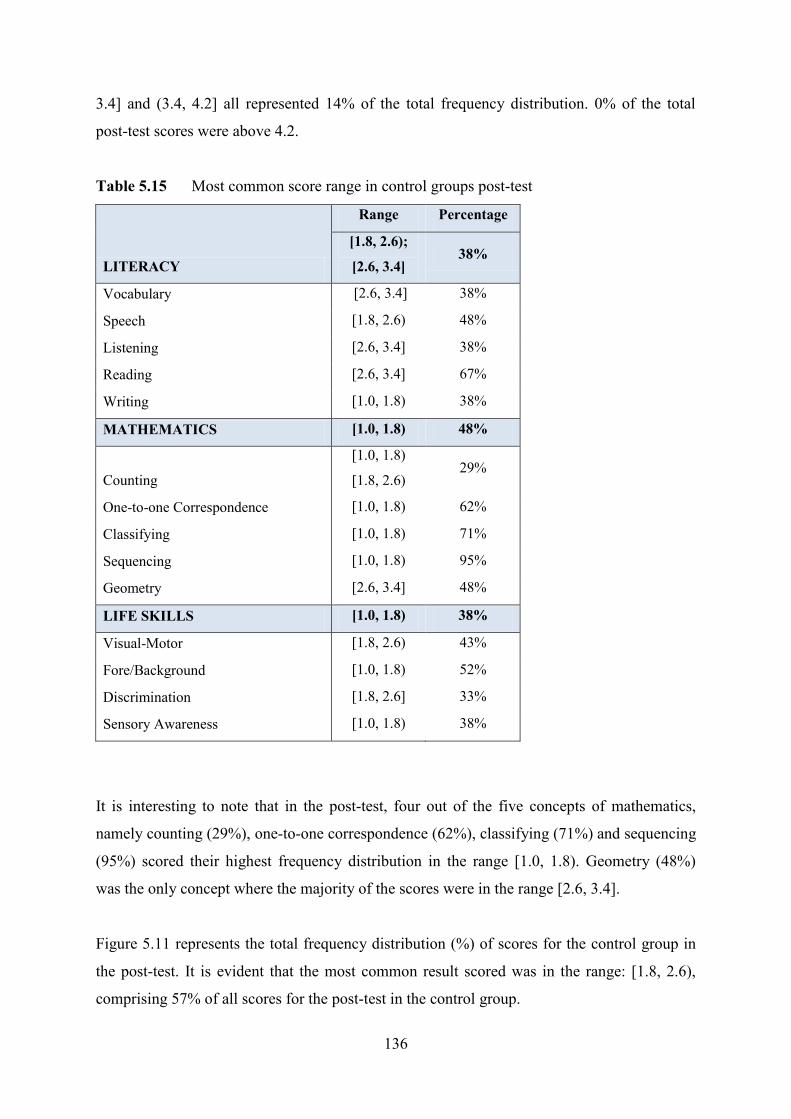
136
3.4] and (3.4, 4.2] all represented 14% of the total frequency distribution. 0% of the total
post-test scores were above 4.2.
Table 5.15 Most common score range in control groups post-test
LITERACY
Range Percentage
[1.8, 2.6);
[2.6, 3.4] 38%
Vocabulary [2.6, 3.4] 38%
Speech [1.8, 2.6) 48%
Listening [2.6, 3.4] 38%
Reading [2.6, 3.4] 67%
Writing [1.0, 1.8) 38%
MATHEMATICS [1.0, 1.8) 48%
Counting
[1.0, 1.8)
[1.8, 2.6) 29%
One-to-one Correspondence [1.0, 1.8) 62%
Classifying [1.0, 1.8) 71%
Sequencing [1.0, 1.8) 95%
Geometry [2.6, 3.4] 48%
LIFE SKILLS [1.0, 1.8) 38%
Visual-Motor [1.8, 2.6) 43%
Fore/Background [1.0, 1.8) 52%
Discrimination [1.8, 2.6] 33%
Sensory Awareness [1.0, 1.8) 38%
It is interesting to note that in the post-test, four out of the five concepts of mathematics,
namely counting (29%), one-to-one correspondence (62%), classifying (71%) and sequencing
(95%) scored their highest frequency distribution in the range [1.0, 1.8). Geometry (48%)
was the only concept where the majority of the scores were in the range [2.6, 3.4].
Figure 5.11 represents the total frequency distribution (%) of scores for the control group in
the post-test. It is evident that the most common result scored was in the range: [1.8, 2.6),
comprising 57% of all scores for the post-test in the control group.

137
Figure 5.11 Total frequency distribution in control group during the post-test
The total mean scores in literacy, mathematics and life skills are represented in Figure 5.12,
with literacy representing the highest mean score of 2.72 and mathematics representing the
lowest mean score of 1.99.
Figure 5.12 Representation of total mean score for life skills, mathematics and literacy in
the control group during the post-test
A comparison can be made between the frequency distribution of scores in the three aspects
of intellectual development, namely literacy, mathematics and life skills. The frequency
distribution of scores for the control group in the post-test is represented in Figure 5.13.
It is clear that the greatest percentage of low scores in the control group was mathematics,
with 43% of the total amount of mathematics scores ranging from [1.0. 1.8). 5% of the total
amount of literacy scores, and 29% of life skills scores were in the same range, [1.0, 1.8).
14%
57%
14% 14%
0%0%
10%
20%
30%
40%
50%
60%
[1.0, 1.8) [1.8, 2.6) [2.6, 3.4] (3.4, 4.2] (4.2, 5]
2.72
1.99
2.41
0 1 2 3 4 5
Literacy
Mathematics
Life-Skills
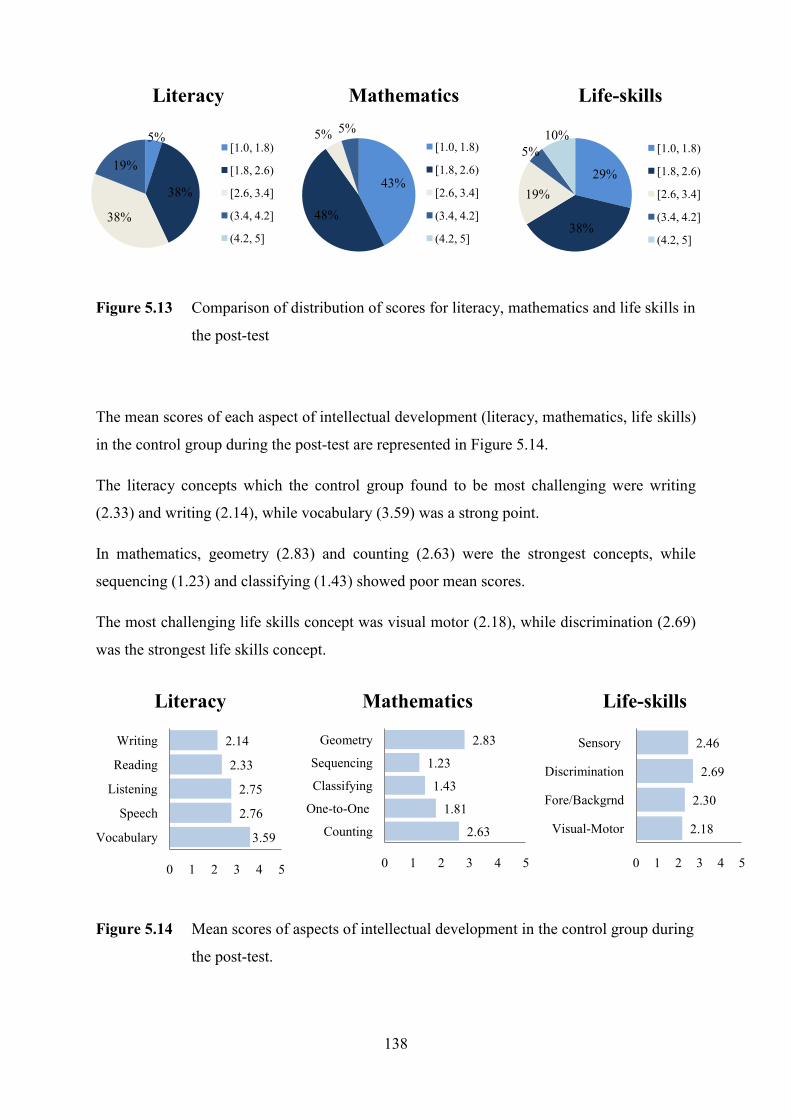
138
Figure 5.13 Comparison of distribution of scores for literacy, mathematics and life skills in
the post-test
The mean scores of each aspect of intellectual development (literacy, mathematics, life skills)
in the control group during the post-test are represented in Figure 5.14.
The literacy concepts which the control group found to be most challenging were writing
(2.33) and writing (2.14), while vocabulary (3.59) was a strong point.
In mathematics, geometry (2.83) and counting (2.63) were the strongest concepts, while
sequencing (1.23) and classifying (1.43) showed poor mean scores.
The most challenging life skills concept was visual motor (2.18), while discrimination (2.69)
was the strongest life skills concept.
Figure 5.14 Mean scores of aspects of intellectual development in the control group during
the post-test.
2.18
2.30
2.69
2.46
0 1 2 3 4 5
Visual-Motor
Fore/Backgrnd
Discrimination
Sensory
Life-skills
2.63
1.81
1.43
1.23
2.83
0 1 2 3 4 5
Counting
One-to-One
Classifying
Sequencing
Geometry
Mathematics
5%
38%
38%
19%
Literacy
[1.0, 1.8)
[1.8, 2.6)
[2.6, 3.4]
(3.4, 4.2]
(4.2, 5]
43%
48%
5% 5%
Mathematics
[1.0, 1.8)
[1.8, 2.6)
[2.6, 3.4]
(3.4, 4.2]
(4.2, 5]
29%
38%
19%
5%
10%
Life-skills
[1.0, 1.8)
[1.8, 2.6)
[2.6, 3.4]
(3.4, 4.2]
(4.2, 5]
3.59
2.76
2.75
2.33
2.14
0 1 2 3 4 5
Vocabulary
Speech
Listening
Reading
Writing
Literacy
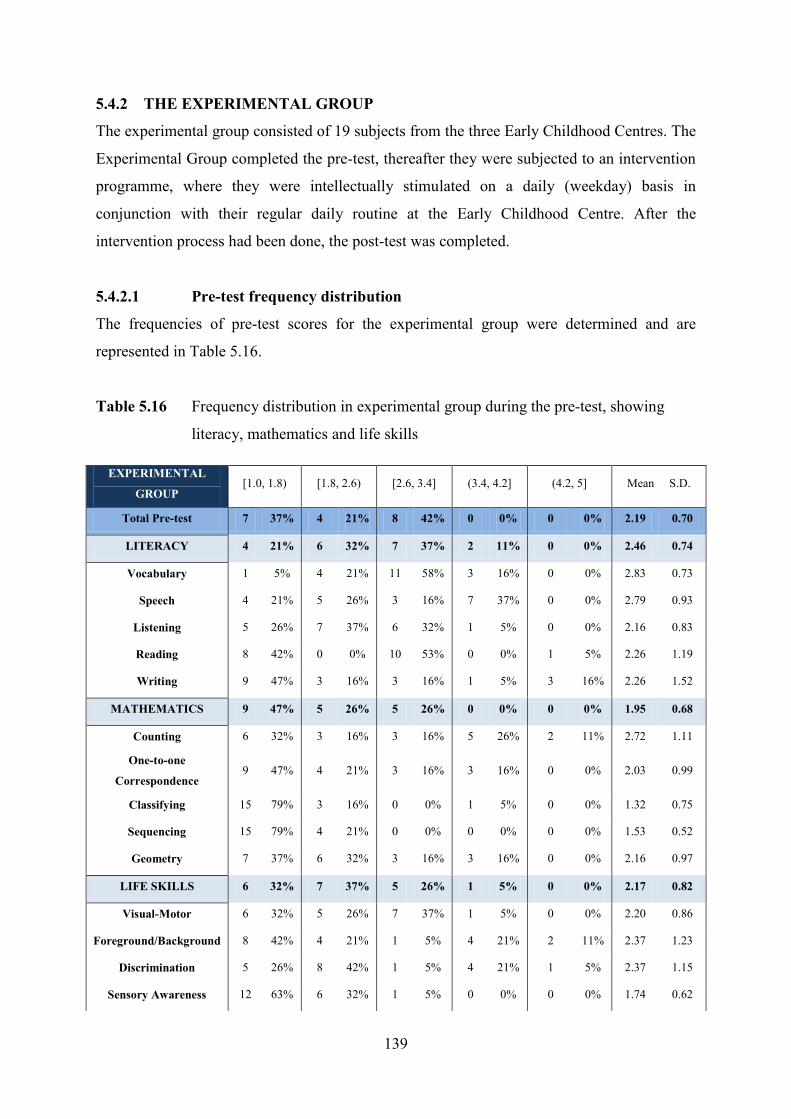
139
5.4.2 THE EXPERIMENTAL GROUP
The experimental group consisted of 19 subjects from the three Early Childhood Centres. The
Experimental Group completed the pre-test, thereafter they were subjected to an intervention
programme, where they were intellectually stimulated on a daily (weekday) basis in
conjunction with their regular daily routine at the Early Childhood Centre. After the
intervention process had been done, the post-test was completed.
5.4.2.1 Pre-test frequency distribution
The frequencies of pre-test scores for the experimental group were determined and are
represented in Table 5.16.
Table 5.16 Frequency distribution in experimental group during the pre-test, showing
literacy, mathematics and life skills
EXPERIMENTAL
GROUP [1.0, 1.8) [1.8, 2.6) [2.6, 3.4] (3.4, 4.2] (4.2, 5] Mean S.D.
Total Pre-test 7 37% 4 21% 8 42% 0 0% 0 0% 2.19 0.70
LITERACY 4 21% 6 32% 7 37% 2 11% 0 0% 2.46 0.74
Vocabulary 1 5% 4 21% 11 58% 3 16% 0 0% 2.83 0.73
Speech 4 21% 5 26% 3 16% 7 37% 0 0% 2.79 0.93
Listening 5 26% 7 37% 6 32% 1 5% 0 0% 2.16 0.83
Reading 8 42% 0 0% 10 53% 0 0% 1 5% 2.26 1.19
Writing 9 47% 3 16% 3 16% 1 5% 3 16% 2.26 1.52
MATHEMATICS 9 47% 5 26% 5 26% 0 0% 0 0% 1.95 0.68
Counting 6 32% 3 16% 3 16% 5 26% 2 11% 2.72 1.11
One-to-one
Correspondence 9 47% 4 21% 3 16% 3 16% 0 0% 2.03 0.99
Classifying 15 79% 3 16% 0 0% 1 5% 0 0% 1.32 0.75
Sequencing 15 79% 4 21% 0 0% 0 0% 0 0% 1.53 0.52
Geometry 7 37% 6 32% 3 16% 3 16% 0 0% 2.16 0.97
LIFE SKILLS 6 32% 7 37% 5 26% 1 5% 0 0% 2.17 0.82
Visual-Motor 6 32% 5 26% 7 37% 1 5% 0 0% 2.20 0.86
Foreground/Background 8 42% 4 21% 1 5% 4 21% 2 11% 2.37 1.23
Discrimination 5 26% 8 42% 1 5% 4 21% 1 5% 2.37 1.15
Sensory Awareness 12 63% 6 32% 1 5% 0 0% 0 0% 1.74 0.62
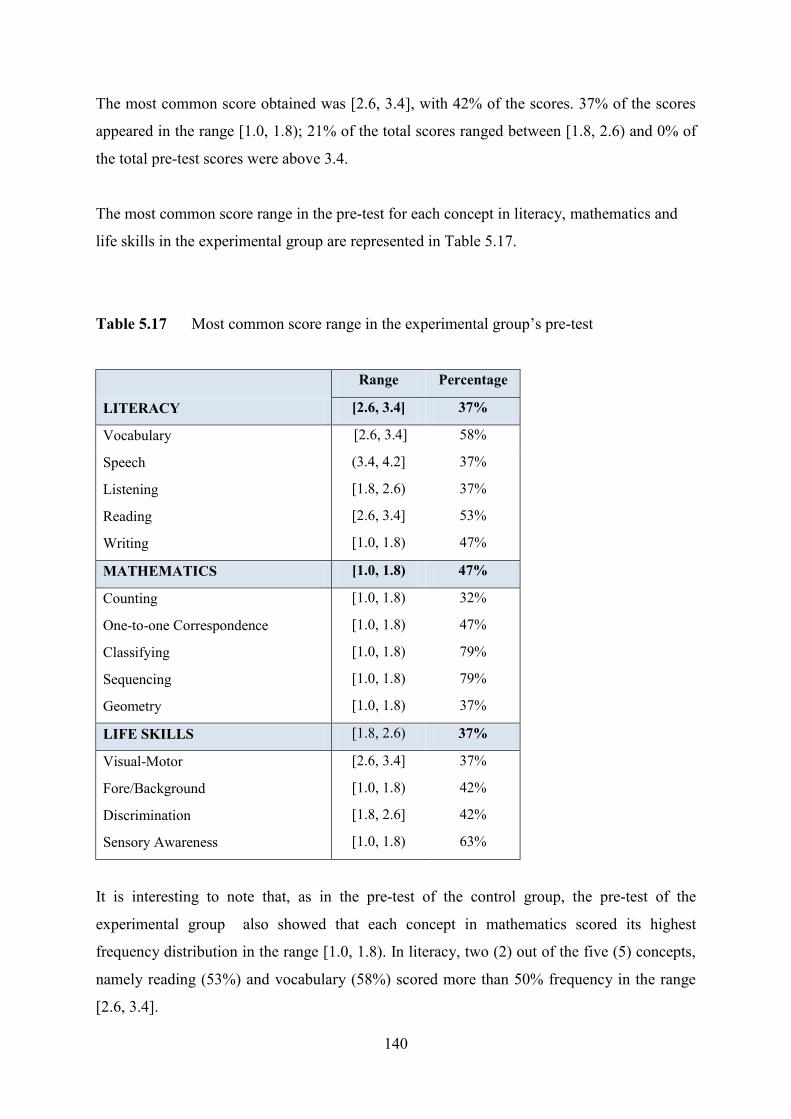
140
The most common score obtained was [2.6, 3.4], with 42% of the scores. 37% of the scores
appeared in the range [1.0, 1.8); 21% of the total scores ranged between [1.8, 2.6) and 0% of
the total pre-test scores were above 3.4.
The most common score range in the pre-test for each concept in literacy, mathematics and
life skills in the experimental group are represented in Table 5.17.
Table 5.17 Most common score range in the experimental group‟s pre-test
Range Percentage
LITERACY [2.6, 3.4] 37%
Vocabulary [2.6, 3.4] 58%
Speech (3.4, 4.2] 37%
Listening [1.8, 2.6) 37%
Reading [2.6, 3.4] 53%
Writing [1.0, 1.8) 47%
MATHEMATICS [1.0, 1.8) 47%
Counting [1.0, 1.8) 32%
One-to-one Correspondence [1.0, 1.8) 47%
Classifying [1.0, 1.8) 79%
Sequencing [1.0, 1.8) 79%
Geometry [1.0, 1.8) 37%
LIFE SKILLS [1.8, 2.6) 37%
Visual-Motor [2.6, 3.4] 37%
Fore/Background [1.0, 1.8) 42%
Discrimination [1.8, 2.6] 42%
Sensory Awareness [1.0, 1.8) 63%
It is interesting to note that, as in the pre-test of the control group, the pre-test of the
experimental group also showed that each concept in mathematics scored its highest
frequency distribution in the range [1.0, 1.8). In literacy, two (2) out of the five (5) concepts,
namely reading (53%) and vocabulary (58%) scored more than 50% frequency in the range
[2.6, 3.4].
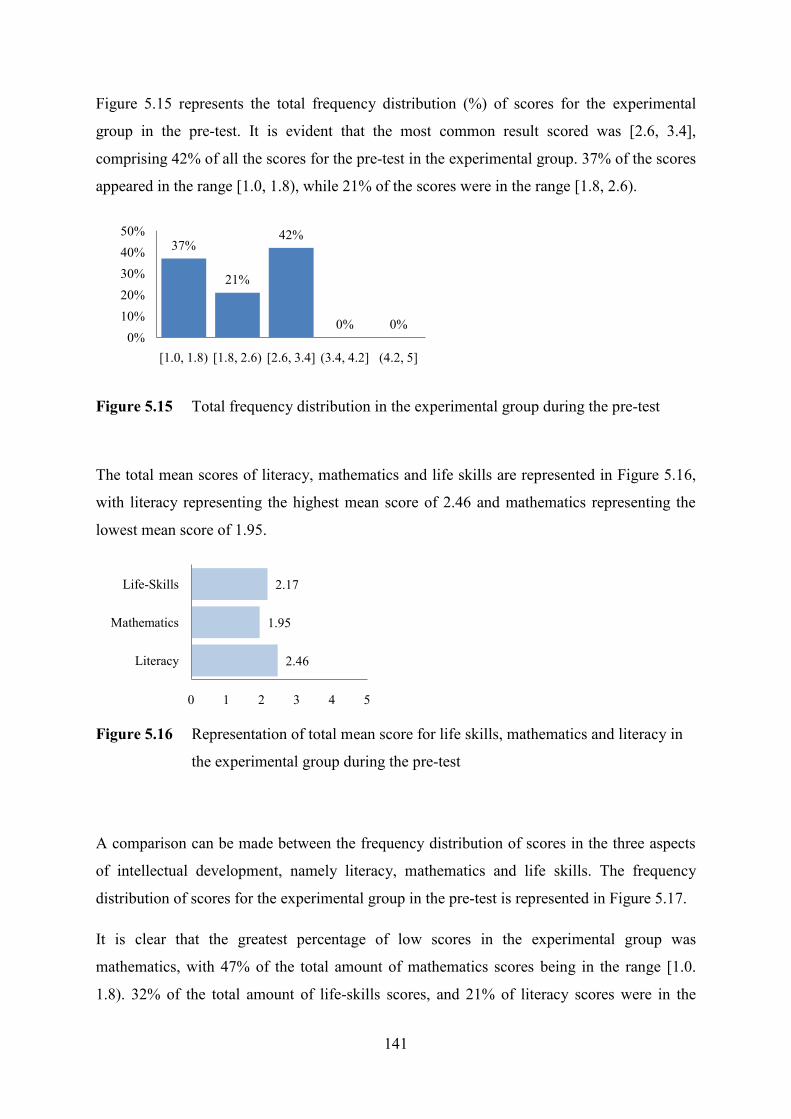
141
2.46
1.95
2.17
0 1 2 3 4 5
Literacy
Mathematics
Life-Skills
37%
21%
42%
0% 0%0%
10%
20%
30%
40%
50%
[1.0, 1.8) [1.8, 2.6) [2.6, 3.4] (3.4, 4.2] (4.2, 5]
Figure 5.15 represents the total frequency distribution (%) of scores for the experimental
group in the pre-test. It is evident that the most common result scored was [2.6, 3.4],
comprising 42% of all the scores for the pre-test in the experimental group. 37% of the scores
appeared in the range [1.0, 1.8), while 21% of the scores were in the range [1.8, 2.6).
Figure 5.15 Total frequency distribution in the experimental group during the pre-test
The total mean scores of literacy, mathematics and life skills are represented in Figure 5.16,
with literacy representing the highest mean score of 2.46 and mathematics representing the
lowest mean score of 1.95.
Figure 5.16 Representation of total mean score for life skills, mathematics and literacy in
the experimental group during the pre-test
A comparison can be made between the frequency distribution of scores in the three aspects
of intellectual development, namely literacy, mathematics and life skills. The frequency
distribution of scores for the experimental group in the pre-test is represented in Figure 5.17.
It is clear that the greatest percentage of low scores in the experimental group was
mathematics, with 47% of the total amount of mathematics scores being in the range [1.0.
1.8). 32% of the total amount of life-skills scores, and 21% of literacy scores were in the

142
1.95
1.54
1.33
1.41
0 1 2 3 4 5
Visual-Motor
Fore/Backgrnd
Discrimination
Sensory
Life-skills
21%
32%
37%
11%
Literacy
[1.0, 1.8)
[1.8, 2.6)
[2.6, 3.4]
(3.4, 4.2]
(4.2, 5]
47%
26%
26%
Mathematics
[1.0, 1.8)
[1.8, 2.6)
[2.6, 3.4]
(3.4, 4.2]
(4.2, 5]
32%
37%
26%
Life-skills
[1.0, 1.8)
[1.8, 2.6)
[2.6, 3.4]
(3.4, 4.2]
(4.2, 5]
2.72
2.03
1.32
1.53
2.16
0 1 2 3 4 5
Counting
One-to-One
Classifying
Sequencing
Geometry
Mathematics
2.83
2.79
2.16
2.26
2.26
0 1 2 3 4 5
Vocabulary
Speech
Listening
Reading
Writing
Literacy
same range, [1.0, 1.8). In mathematics and life skills 0% of scores were in the range (3.4, 4.2]
or (4.2, 5], whereas in literacy, 11% of the scores were in the range (3.4, 4.2].
Figure 5.17 Comparison of distribution of scores for literacy, mathematics and life skills in
the pre-test
The mean scores of each aspect of intellectual development (literacy, mathematics, life-skills)
in the experimental group during the pre-test are represented in Figure 5.18.
The literacy concepts which the experimental group found to be most challenging were
listening (2.16), reading (2.26) and writing (2.26), while speech (2.70) and vocabulary (2.8)
were marginally stronger.
In mathematics, geometry (2.61) and counting (2.72) were the strongest concepts, while
classifying (1.32) and sequencing (1.53) showed poor results. The most challenging life-skills
concept was discrimination (1.33), while visual-motor (1.95) was the strongest life-skills
concept.
Figure 5.18 Mean scores of aspects of intellectual development in Experimental Group
during the pre-test.
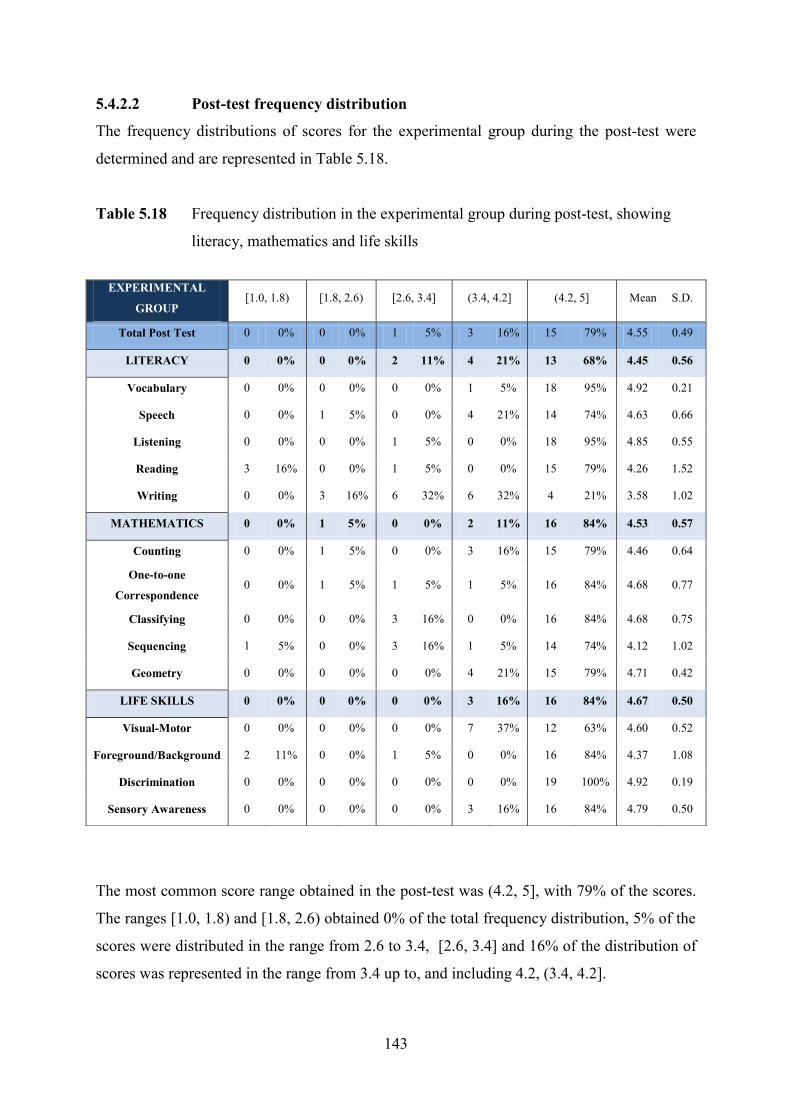
143
5.4.2.2 Post-test frequency distribution
The frequency distributions of scores for the experimental group during the post-test were
determined and are represented in Table 5.18.
Table 5.18 Frequency distribution in the experimental group during post-test, showing
literacy, mathematics and life skills
The most common score range obtained in the post-test was (4.2, 5], with 79% of the scores.
The ranges [1.0, 1.8) and [1.8, 2.6) obtained 0% of the total frequency distribution, 5% of the
scores were distributed in the range from 2.6 to 3.4, [2.6, 3.4] and 16% of the distribution of
scores was represented in the range from 3.4 up to, and including 4.2, (3.4, 4.2].
EXPERIMENTAL
GROUP [1.0, 1.8) [1.8, 2.6) [2.6, 3.4] (3.4, 4.2] (4.2, 5] Mean S.D.
Total Post Test 0 0% 0 0% 1 5% 3 16% 15 79% 4.55 0.49
LITERACY 0 0% 0 0% 2 11% 4 21% 13 68% 4.45 0.56
Vocabulary 0 0% 0 0% 0 0% 1 5% 18 95% 4.92 0.21
Speech 0 0% 1 5% 0 0% 4 21% 14 74% 4.63 0.66
Listening 0 0% 0 0% 1 5% 0 0% 18 95% 4.85 0.55
Reading 3 16% 0 0% 1 5% 0 0% 15 79% 4.26 1.52
Writing 0 0% 3 16% 6 32% 6 32% 4 21% 3.58 1.02
MATHEMATICS 0 0% 1 5% 0 0% 2 11% 16 84% 4.53 0.57
Counting 0 0% 1 5% 0 0% 3 16% 15 79% 4.46 0.64
One-to-one
Correspondence 0 0% 1 5% 1 5% 1 5% 16 84% 4.68 0.77
Classifying 0 0% 0 0% 3 16% 0 0% 16 84% 4.68 0.75
Sequencing 1 5% 0 0% 3 16% 1 5% 14 74% 4.12 1.02
Geometry 0 0% 0 0% 0 0% 4 21% 15 79% 4.71 0.42
LIFE SKILLS 0 0% 0 0% 0 0% 3 16% 16 84% 4.67 0.50
Visual-Motor 0 0% 0 0% 0 0% 7 37% 12 63% 4.60 0.52
Foreground/Background 2 11% 0 0% 1 5% 0 0% 16 84% 4.37 1.08
Discrimination 0 0% 0 0% 0 0% 0 0% 19 100% 4.92 0.19
Sensory Awareness 0 0% 0 0% 0 0% 3 16% 16 84% 4.79 0.50

144
The most common score range in the pre-test for each concept in literacy, mathematics and
life-skills in the experimental group are represented in Table 5.19.
Table 5.19 Most common score range in experimental group‟s pre-test
LITERACY
Range Percentage
(4.2, 5] 68%
Vocabulary (4.2, 5] 95%
Speech (4.2, 5] 74%
Listening (4.2, 5] 95%
Reading (4.2, 5] 79%
Writing (3.4, 4.2] 32%
MATHEMATICS (4.2, 5] 84%
Counting (4.2, 5] 79%
One-to-one Correspondence (4.2, 5] 84%
Classifying (4.2, 5] 84%
Sequencing (4.2, 5] 74%
Geometry (4.2, 5] 79%
LIFE SKILLS (4.2, 5] 84%
Visual-Motor (4.2, 5] 63%
Fore/Background (4.2, 5] 84%
Discrimination (4.2, 5] 100%
Sensory Awareness (4.2, 5] 84%
It is interesting to note that in each primary aspect of cognitive development, namely literacy
(68%), mathematics (84%) and life skills (84%), in the post-test more than 65% of the total
mean scores were in the range (4.2, 5].
Although the most common frequency range in the experimental group‟s pre-test
mathematics score was [1.0, 1.8), the most common score range in mathematics in the post-
test is now (4.2, 5], with a total of 84% frequency in the same range.
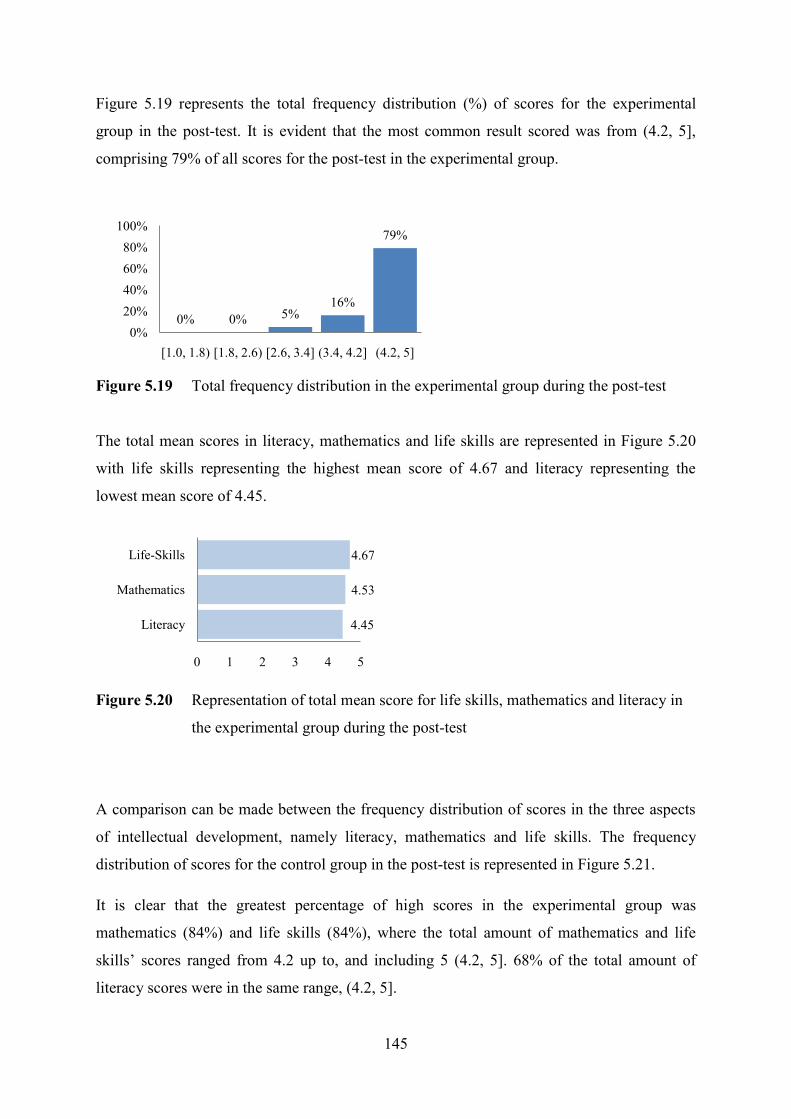
145
4.45
4.53
4.67
0 1 2 3 4 5
Literacy
Mathematics
Life-Skills
0% 0% 5%16%
79%
0%
20%
40%
60%
80%
100%
[1.0, 1.8) [1.8, 2.6) [2.6, 3.4] (3.4, 4.2] (4.2, 5]
Figure 5.19 represents the total frequency distribution (%) of scores for the experimental
group in the post-test. It is evident that the most common result scored was from (4.2, 5],
comprising 79% of all scores for the post-test in the experimental group.
Figure 5.19 Total frequency distribution in the experimental group during the post-test
The total mean scores in literacy, mathematics and life skills are represented in Figure 5.20
with life skills representing the highest mean score of 4.67 and literacy representing the
lowest mean score of 4.45.
Figure 5.20 Representation of total mean score for life skills, mathematics and literacy in
the experimental group during the post-test
A comparison can be made between the frequency distribution of scores in the three aspects
of intellectual development, namely literacy, mathematics and life skills. The frequency
distribution of scores for the control group in the post-test is represented in Figure 5.21.
It is clear that the greatest percentage of high scores in the experimental group was
mathematics (84%) and life skills (84%), where the total amount of mathematics and life
skills‟ scores ranged from 4.2 up to, and including 5 (4.2, 5]. 68% of the total amount of
literacy scores were in the same range, (4.2, 5].
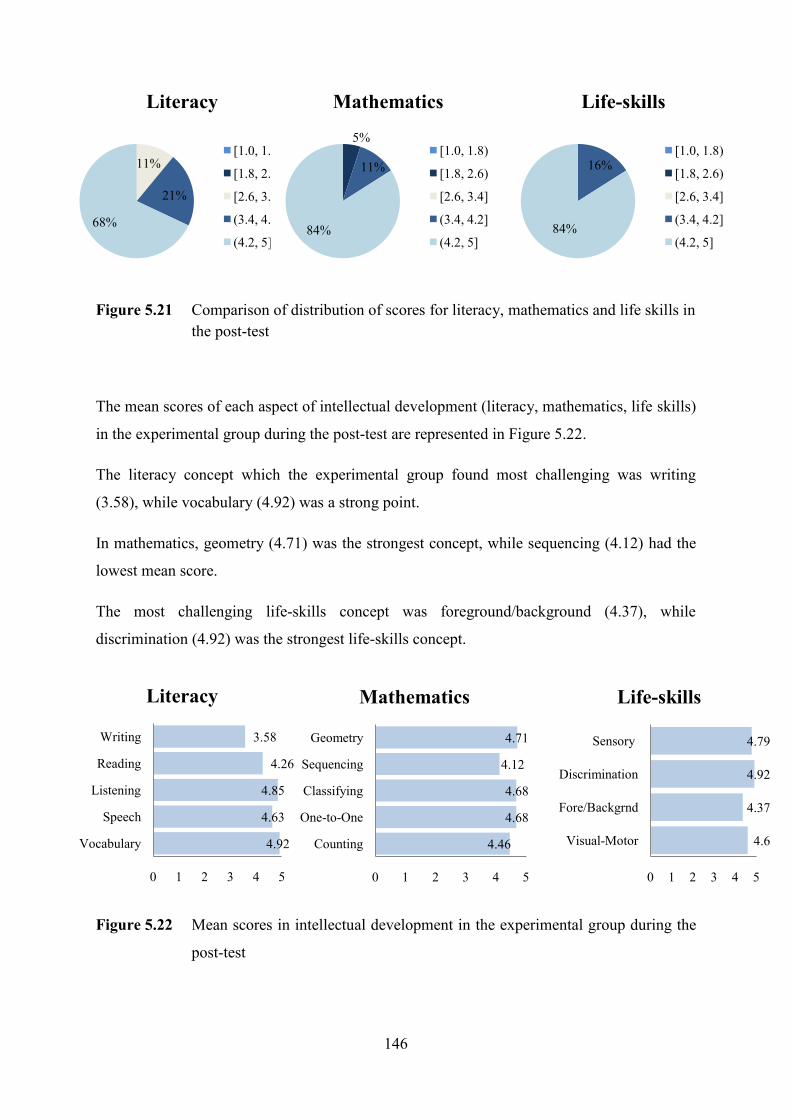
146
11%
21%
68%
Literacy
[1.0, 1.8)
[1.8, 2.6)
[2.6, 3.4]
(3.4, 4.2]
(4.2, 5]
16%
84%
Life-skills
[1.0, 1.8)
[1.8, 2.6)
[2.6, 3.4]
(3.4, 4.2]
(4.2, 5]
4.46
4.68
4.68
4.12
4.71
0 1 2 3 4 5
Counting
One-to-One
Classifying
Sequencing
Geometry
Mathematics
4.6
4.37
4.92
4.79
0 1 2 3 4 5
Visual-Motor
Fore/Backgrnd
Discrimination
Sensory
Life-skills
4.92
4.63
4.85
4.26
3.58
0 1 2 3 4 5
Vocabulary
Speech
Listening
Reading
Writing
Literacy
Figure 5.21 Comparison of distribution of scores for literacy, mathematics and life skills in
the post-test
The mean scores of each aspect of intellectual development (literacy, mathematics, life skills)
in the experimental group during the post-test are represented in Figure 5.22.
The literacy concept which the experimental group found most challenging was writing
(3.58), while vocabulary (4.92) was a strong point.
In mathematics, geometry (4.71) was the strongest concept, while sequencing (4.12) had the
lowest mean score.
The most challenging life-skills concept was foreground/background (4.37), while
discrimination (4.92) was the strongest life-skills concept.
Figure 5.22 Mean scores in intellectual development in the experimental group during the
post-test
5%
11%
84%
Mathematics
[1.0, 1.8)
[1.8, 2.6)
[2.6, 3.4]
(3.4, 4.2]
(4.2, 5]
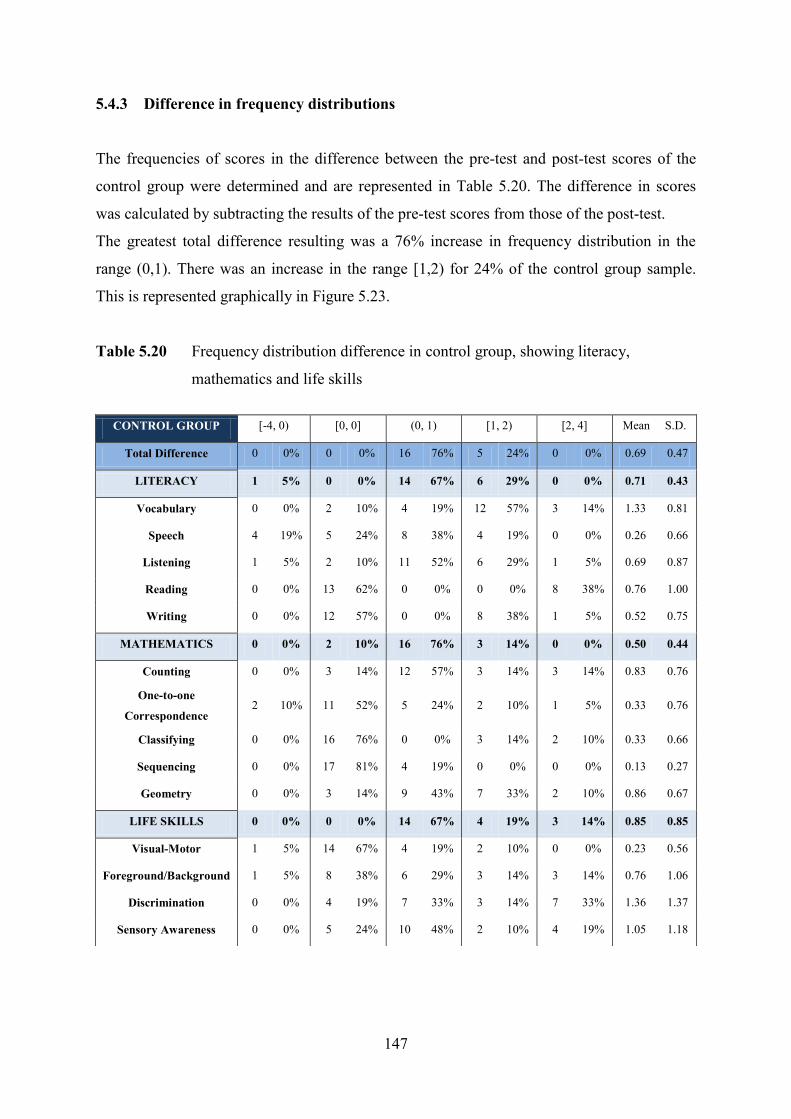
147
5.4.3 Difference in frequency distributions
The frequencies of scores in the difference between the pre-test and post-test scores of the
control group were determined and are represented in Table 5.20. The difference in scores
was calculated by subtracting the results of the pre-test scores from those of the post-test.
The greatest total difference resulting was a 76% increase in frequency distribution in the
range (0,1). There was an increase in the range [1,2) for 24% of the control group sample.
This is represented graphically in Figure 5.23.
Table 5.20 Frequency distribution difference in control group, showing literacy,
mathematics and life skills
CONTROL GROUP [-4, 0) [0, 0] (0, 1) [1, 2) [2, 4] Mean S.D.
Total Difference 0 0% 0 0% 16 76% 5 24% 0 0% 0.69 0.47
LITERACY 1 5% 0 0% 14 67% 6 29% 0 0% 0.71 0.43
Vocabulary 0 0% 2 10% 4 19% 12 57% 3 14% 1.33 0.81
Speech 4 19% 5 24% 8 38% 4 19% 0 0% 0.26 0.66
Listening 1 5% 2 10% 11 52% 6 29% 1 5% 0.69 0.87
Reading 0 0% 13 62% 0 0% 0 0% 8 38% 0.76 1.00
Writing 0 0% 12 57% 0 0% 8 38% 1 5% 0.52 0.75
MATHEMATICS 0 0% 2 10% 16 76% 3 14% 0 0% 0.50 0.44
Counting 0 0% 3 14% 12 57% 3 14% 3 14% 0.83 0.76
One-to-one
Correspondence 2 10% 11 52% 5 24% 2 10% 1 5% 0.33 0.76
Classifying 0 0% 16 76% 0 0% 3 14% 2 10% 0.33 0.66
Sequencing 0 0% 17 81% 4 19% 0 0% 0 0% 0.13 0.27
Geometry 0 0% 3 14% 9 43% 7 33% 2 10% 0.86 0.67
LIFE SKILLS 0 0% 0 0% 14 67% 4 19% 3 14% 0.85 0.85
Visual-Motor 1 5% 14 67% 4 19% 2 10% 0 0% 0.23 0.56
Foreground/Background 1 5% 8 38% 6 29% 3 14% 3 14% 0.76 1.06
Discrimination 0 0% 4 19% 7 33% 3 14% 7 33% 1.36 1.37
Sensory Awareness 0 0% 5 24% 10 48% 2 10% 4 19% 1.05 1.18
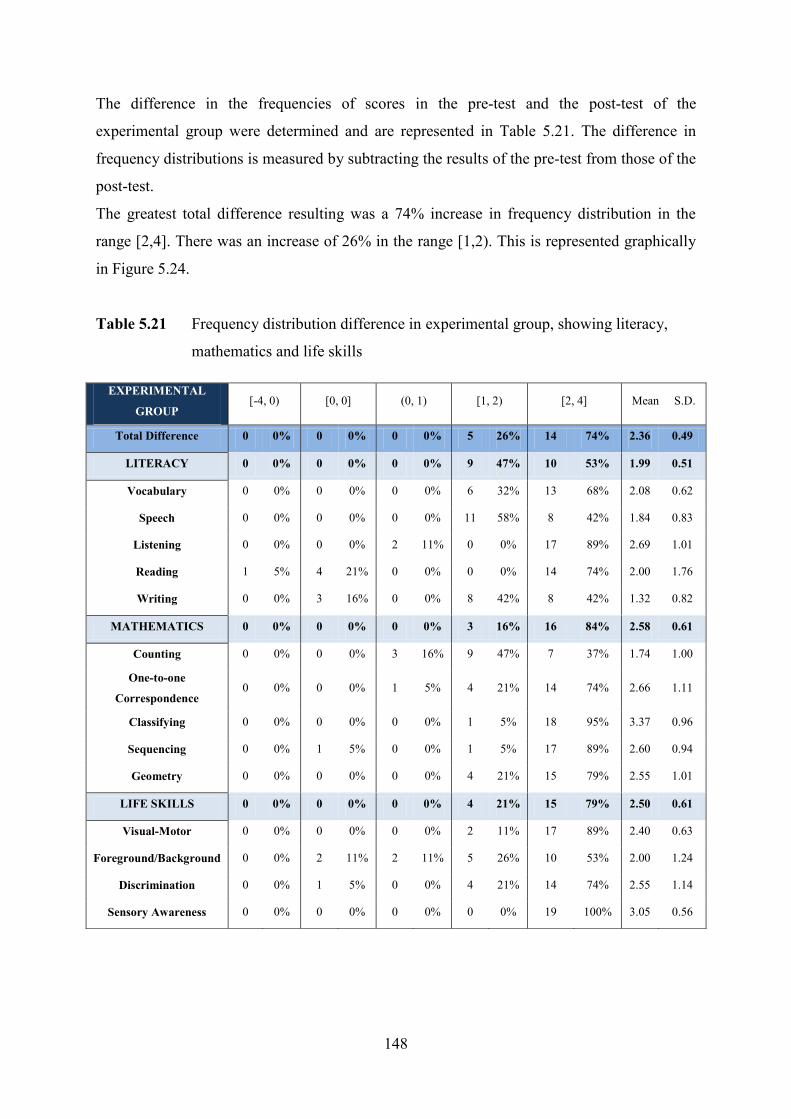
148
The difference in the frequencies of scores in the pre-test and the post-test of the
experimental group were determined and are represented in Table 5.21. The difference in
frequency distributions is measured by subtracting the results of the pre-test from those of the
post-test.
The greatest total difference resulting was a 74% increase in frequency distribution in the
range [2,4]. There was an increase of 26% in the range [1,2). This is represented graphically
in Figure 5.24.
Table 5.21 Frequency distribution difference in experimental group, showing literacy,
mathematics and life skills
EXPERIMENTAL
GROUP [-4, 0) [0, 0] (0, 1) [1, 2) [2, 4] Mean S.D.
Total Difference 0 0% 0 0% 0 0% 5 26% 14 74% 2.36 0.49
LITERACY 0 0% 0 0% 0 0% 9 47% 10 53% 1.99 0.51
Vocabulary 0 0% 0 0% 0 0% 6 32% 13 68% 2.08 0.62
Speech 0 0% 0 0% 0 0% 11 58% 8 42% 1.84 0.83
Listening 0 0% 0 0% 2 11% 0 0% 17 89% 2.69 1.01
Reading 1 5% 4 21% 0 0% 0 0% 14 74% 2.00 1.76
Writing 0 0% 3 16% 0 0% 8 42% 8 42% 1.32 0.82
MATHEMATICS 0 0% 0 0% 0 0% 3 16% 16 84% 2.58 0.61
Counting 0 0% 0 0% 3 16% 9 47% 7 37% 1.74 1.00
One-to-one
Correspondence 0 0% 0 0% 1 5% 4 21% 14 74% 2.66 1.11
Classifying 0 0% 0 0% 0 0% 1 5% 18 95% 3.37 0.96
Sequencing 0 0% 1 5% 0 0% 1 5% 17 89% 2.60 0.94
Geometry 0 0% 0 0% 0 0% 4 21% 15 79% 2.55 1.01
LIFE SKILLS 0 0% 0 0% 0 0% 4 21% 15 79% 2.50 0.61
Visual-Motor 0 0% 0 0% 0 0% 2 11% 17 89% 2.40 0.63
Foreground/Background 0 0% 2 11% 2 11% 5 26% 10 53% 2.00 1.24
Discrimination 0 0% 1 5% 0 0% 4 21% 14 74% 2.55 1.14
Sensory Awareness 0 0% 0 0% 0 0% 0 0% 19 100% 3.05 0.56
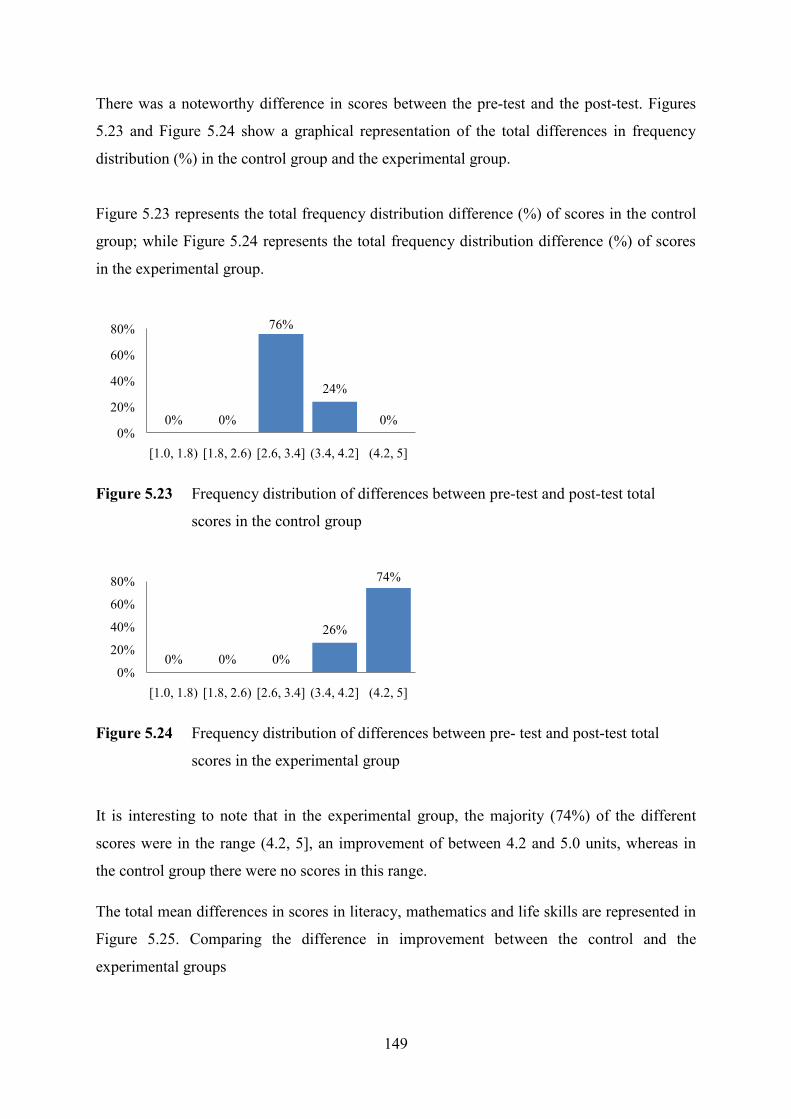
149
There was a noteworthy difference in scores between the pre-test and the post-test. Figures
5.23 and Figure 5.24 show a graphical representation of the total differences in frequency
distribution (%) in the control group and the experimental group.
Figure 5.23 represents the total frequency distribution difference (%) of scores in the control
group; while Figure 5.24 represents the total frequency distribution difference (%) of scores
in the experimental group.
Figure 5.23 Frequency distribution of differences between pre-test and post-test total
scores in the control group
Figure 5.24 Frequency distribution of differences between pre- test and post-test total
scores in the experimental group
It is interesting to note that in the experimental group, the majority (74%) of the different
scores were in the range (4.2, 5], an improvement of between 4.2 and 5.0 units, whereas in
the control group there were no scores in this range.
The total mean differences in scores in literacy, mathematics and life skills are represented in
Figure 5.25. Comparing the difference in improvement between the control and the
experimental groups
0% 0%
76%
24%
0%0%
20%
40%
60%
80%
[1.0, 1.8) [1.8, 2.6) [2.6, 3.4] (3.4, 4.2] (4.2, 5]
0% 0% 0%
26%
74%
0%
20%
40%
60%
80%
[1.0, 1.8) [1.8, 2.6) [2.6, 3.4] (3.4, 4.2] (4.2, 5]
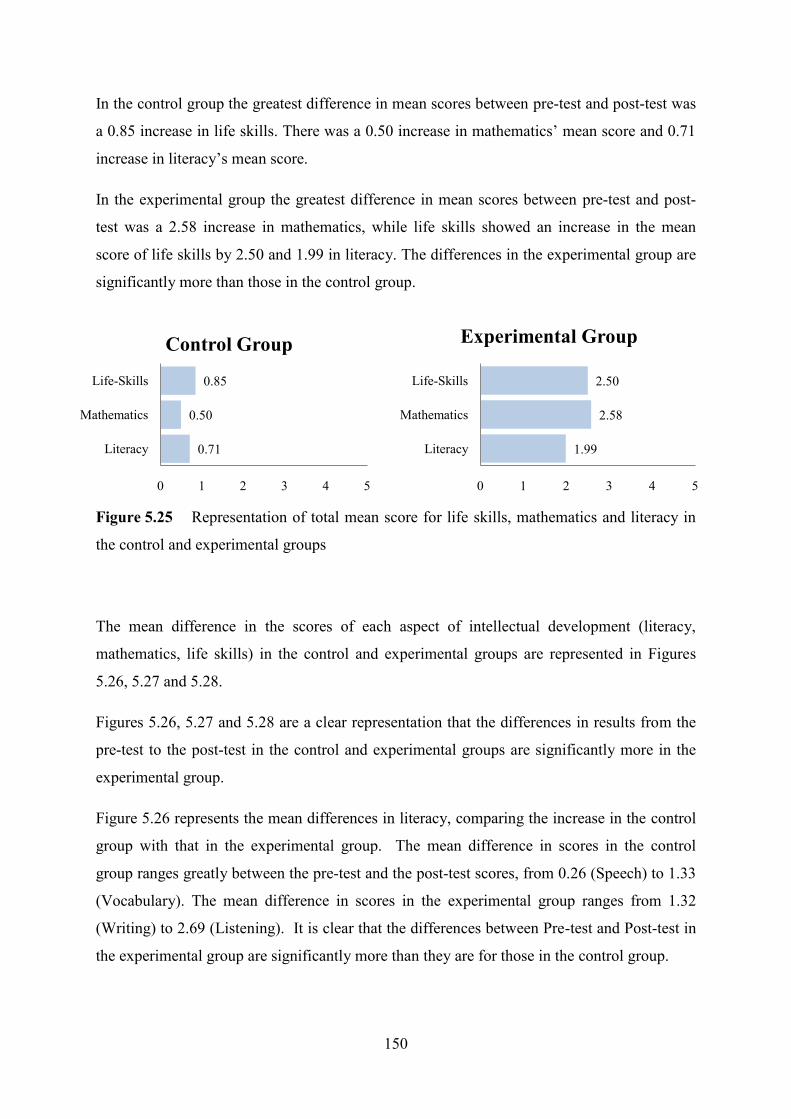
150
In the control group the greatest difference in mean scores between pre-test and post-test was
a 0.85 increase in life skills. There was a 0.50 increase in mathematics‟ mean score and 0.71
increase in literacy‟s mean score.
In the experimental group the greatest difference in mean scores between pre-test and post-
test was a 2.58 increase in mathematics, while life skills showed an increase in the mean
score of life skills by 2.50 and 1.99 in literacy. The differences in the experimental group are
significantly more than those in the control group.
Figure 5.25 Representation of total mean score for life skills, mathematics and literacy in
the control and experimental groups
The mean difference in the scores of each aspect of intellectual development (literacy,
mathematics, life skills) in the control and experimental groups are represented in Figures
5.26, 5.27 and 5.28.
Figures 5.26, 5.27 and 5.28 are a clear representation that the differences in results from the
pre-test to the post-test in the control and experimental groups are significantly more in the
experimental group.
Figure 5.26 represents the mean differences in literacy, comparing the increase in the control
group with that in the experimental group. The mean difference in scores in the control
group ranges greatly between the pre-test and the post-test scores, from 0.26 (Speech) to 1.33
(Vocabulary). The mean difference in scores in the experimental group ranges from 1.32
(Writing) to 2.69 (Listening). It is clear that the differences between Pre-test and Post-test in
the experimental group are significantly more than they are for those in the control group.
0.71
0.50
0.85
0 1 2 3 4 5
Literacy
Mathematics
Life-Skills
Control Group
1.99
2.58
2.50
0 1 2 3 4 5
Literacy
Mathematics
Life-Skills
Experimental Group
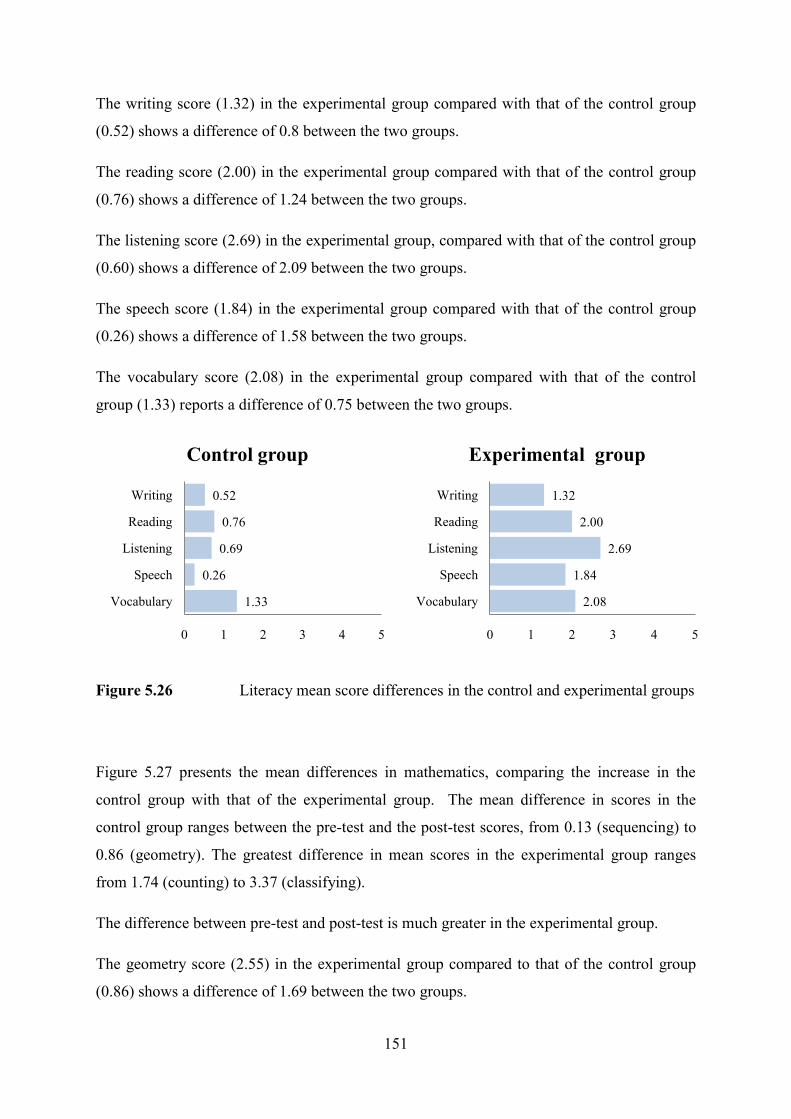
151
1.33
0.26
0.69
0.76
0.52
0 1 2 3 4 5
Vocabulary
Speech
Listening
Reading
Writing
Control group
2.08
1.84
2.69
2.00
1.32
0 1 2 3 4 5
Vocabulary
Speech
Listening
Reading
Writing
Experimental group
The writing score (1.32) in the experimental group compared with that of the control group
(0.52) shows a difference of 0.8 between the two groups.
The reading score (2.00) in the experimental group compared with that of the control group
(0.76) shows a difference of 1.24 between the two groups.
The listening score (2.69) in the experimental group, compared with that of the control group
(0.60) shows a difference of 2.09 between the two groups.
The speech score (1.84) in the experimental group compared with that of the control group
(0.26) shows a difference of 1.58 between the two groups.
The vocabulary score (2.08) in the experimental group compared with that of the control
group (1.33) reports a difference of 0.75 between the two groups.
Figure 5.26 Literacy mean score differences in the control and experimental groups
Figure 5.27 presents the mean differences in mathematics, comparing the increase in the
control group with that of the experimental group. The mean difference in scores in the
control group ranges between the pre-test and the post-test scores, from 0.13 (sequencing) to
0.86 (geometry). The greatest difference in mean scores in the experimental group ranges
from 1.74 (counting) to 3.37 (classifying).
The difference between pre-test and post-test is much greater in the experimental group.
The geometry score (2.55) in the experimental group compared to that of the control group
(0.86) shows a difference of 1.69 between the two groups.
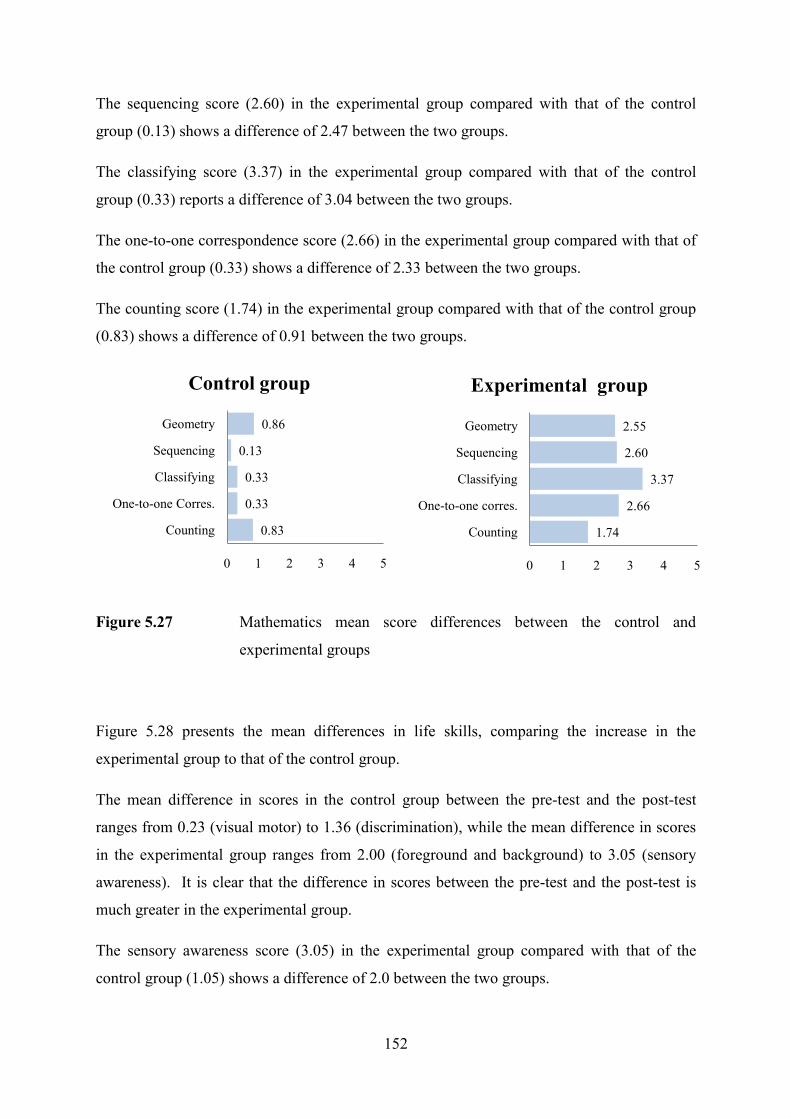
152
0.83
0.33
0.33
0.13
0.86
0 1 2 3 4 5
Counting
One-to-one Corres.
Classifying
Sequencing
Geometry
Control group
1.74
2.66
3.37
2.60
2.55
0 1 2 3 4 5
Counting
One-to-one corres.
Classifying
Sequencing
Geometry
Experimental group
The sequencing score (2.60) in the experimental group compared with that of the control
group (0.13) shows a difference of 2.47 between the two groups.
The classifying score (3.37) in the experimental group compared with that of the control
group (0.33) reports a difference of 3.04 between the two groups.
The one-to-one correspondence score (2.66) in the experimental group compared with that of
the control group (0.33) shows a difference of 2.33 between the two groups.
The counting score (1.74) in the experimental group compared with that of the control group
(0.83) shows a difference of 0.91 between the two groups.
Figure 5.27 Mathematics mean score differences between the control and
experimental groups
Figure 5.28 presents the mean differences in life skills, comparing the increase in the
experimental group to that of the control group.
The mean difference in scores in the control group between the pre-test and the post-test
ranges from 0.23 (visual motor) to 1.36 (discrimination), while the mean difference in scores
in the experimental group ranges from 2.00 (foreground and background) to 3.05 (sensory
awareness). It is clear that the difference in scores between the pre-test and the post-test is
much greater in the experimental group.
The sensory awareness score (3.05) in the experimental group compared with that of the
control group (1.05) shows a difference of 2.0 between the two groups.
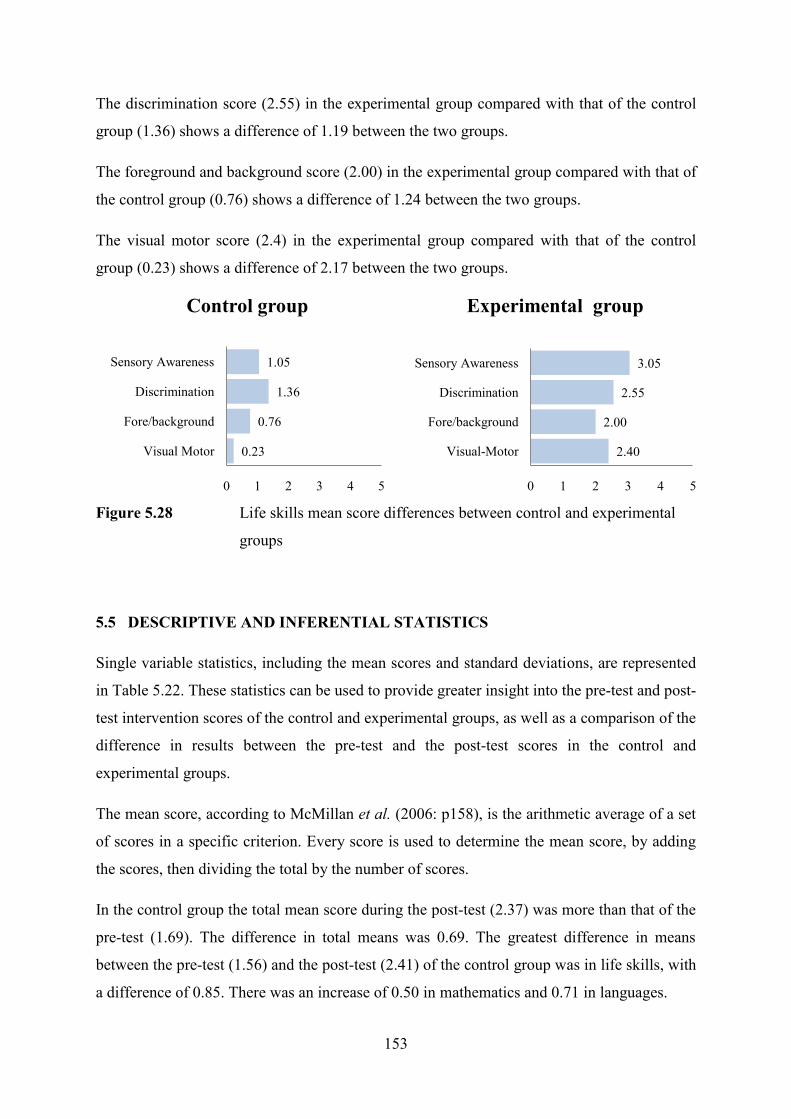
153
0.23
0.76
1.36
1.05
0 1 2 3 4 5
Visual Motor
Fore/background
Discrimination
Sensory Awareness
Control group
2.40
2.00
2.55
3.05
0 1 2 3 4 5
Visual-Motor
Fore/background
Discrimination
Sensory Awareness
Experimental group
The discrimination score (2.55) in the experimental group compared with that of the control
group (1.36) shows a difference of 1.19 between the two groups.
The foreground and background score (2.00) in the experimental group compared with that of
the control group (0.76) shows a difference of 1.24 between the two groups.
The visual motor score (2.4) in the experimental group compared with that of the control
group (0.23) shows a difference of 2.17 between the two groups.
Figure 5.28 Life skills mean score differences between control and experimental
groups
5.5 DESCRIPTIVE AND INFERENTIAL STATISTICS
Single variable statistics, including the mean scores and standard deviations, are represented
in Table 5.22. These statistics can be used to provide greater insight into the pre-test and post-
test intervention scores of the control and experimental groups, as well as a comparison of the
difference in results between the pre-test and the post-test scores in the control and
experimental groups.
The mean score, according to McMillan et al. (2006: p158), is the arithmetic average of a set
of scores in a specific criterion. Every score is used to determine the mean score, by adding
the scores, then dividing the total by the number of scores.
In the control group the total mean score during the post-test (2.37) was more than that of the
pre-test (1.69). The difference in total means was 0.69. The greatest difference in means
between the pre-test (1.56) and the post-test (2.41) of the control group was in life skills, with
a difference of 0.85. There was an increase of 0.50 in mathematics and 0.71 in languages.
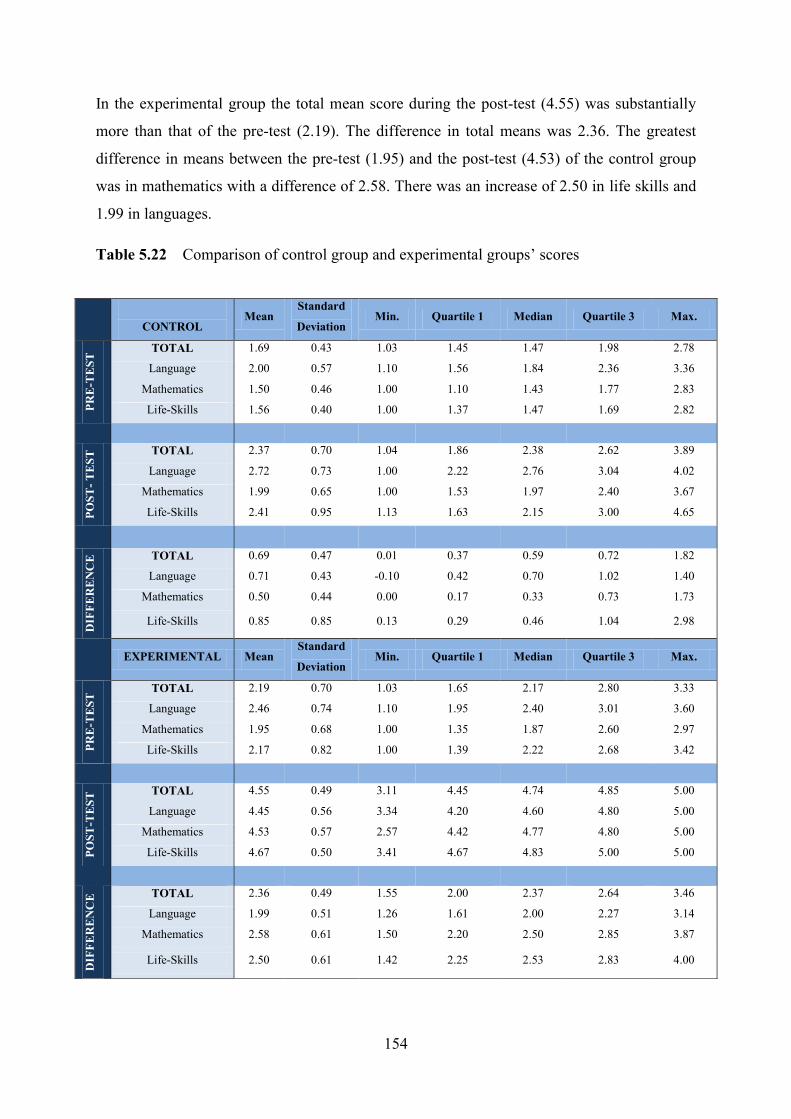
154
In the experimental group the total mean score during the post-test (4.55) was substantially
more than that of the pre-test (2.19). The difference in total means was 2.36. The greatest
difference in means between the pre-test (1.95) and the post-test (4.53) of the control group
was in mathematics with a difference of 2.58. There was an increase of 2.50 in life skills and
1.99 in languages.
Table 5.22 Comparison of control group and experimental groups‟ scores
CONTROL Mean
Standard
Deviation Min. Quartile 1 Median Quartile 3 Max.
PR
E-T
ES
T TOTAL 1.69 0.43 1.03 1.45 1.47 1.98 2.78
Language 2.00 0.57 1.10 1.56 1.84 2.36 3.36
Mathematics 1.50 0.46 1.00 1.10 1.43 1.77 2.83
Life-Skills 1.56 0.40 1.00 1.37 1.47 1.69 2.82
PO
ST
- T
ES
T TOTAL 2.37 0.70 1.04 1.86 2.38 2.62 3.89
Language 2.72 0.73 1.00 2.22 2.76 3.04 4.02
Mathematics 1.99 0.65 1.00 1.53 1.97 2.40 3.67
Life-Skills 2.41 0.95 1.13 1.63 2.15 3.00 4.65
DIF
FE
RE
NC
E TOTAL 0.69 0.47 0.01 0.37 0.59 0.72 1.82
Language 0.71 0.43 -0.10 0.42 0.70 1.02 1.40
Mathematics 0.50 0.44 0.00 0.17 0.33 0.73 1.73
Life-Skills 0.85 0.85 0.13 0.29 0.46 1.04 2.98
EXPERIMENTAL Mean
Standard
Deviation Min. Quartile 1 Median Quartile 3 Max.
PR
E-T
ES
T TOTAL 2.19 0.70 1.03 1.65 2.17 2.80 3.33
Language 2.46 0.74 1.10 1.95 2.40 3.01 3.60
Mathematics 1.95 0.68 1.00 1.35 1.87 2.60 2.97
Life-Skills 2.17 0.82 1.00 1.39 2.22 2.68 3.42
PO
ST
-TE
ST
TOTAL 4.55 0.49 3.11 4.45 4.74 4.85 5.00
Language 4.45 0.56 3.34 4.20 4.60 4.80 5.00
Mathematics 4.53 0.57 2.57 4.42 4.77 4.80 5.00
Life-Skills 4.67 0.50 3.41 4.67 4.83 5.00 5.00
DIF
FE
RE
NC
E TOTAL 2.36 0.49 1.55 2.00 2.37 2.64 3.46
Language 1.99 0.51 1.26 1.61 2.00 2.27 3.14
Mathematics 2.58 0.61 1.50 2.20 2.50 2.85 3.87
Life-Skills 2.50 0.61 1.42 2.25 2.53 2.83 4.00
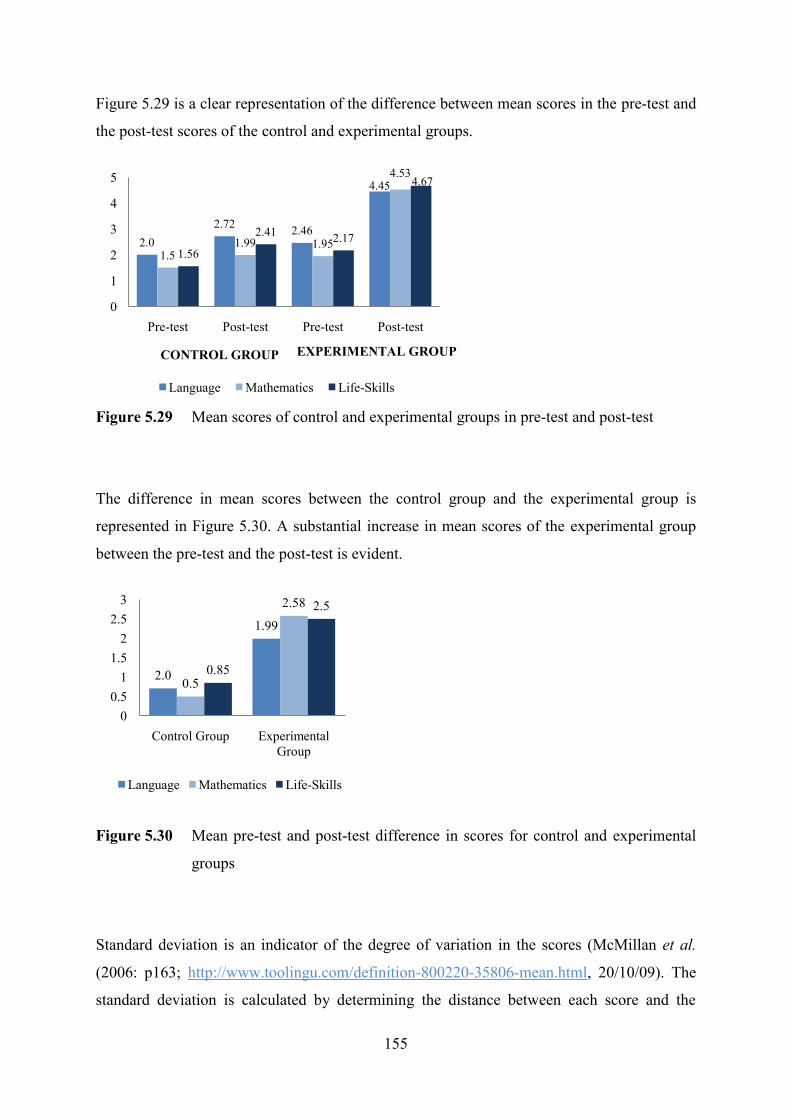
155
2.0
2.722.46
4.45
1.51.99 1.95
4.53
1.56
2.412.17
4.67
0
1
2
3
4
5
Pre-test Post-test Pre-test Post-test
CONTROL GROUP
Language Mathematics Life-Skills
Figure 5.29 is a clear representation of the difference between mean scores in the pre-test and
the post-test scores of the control and experimental groups.
Figure 5.29 Mean scores of control and experimental groups in pre-test and post-test
The difference in mean scores between the control group and the experimental group is
represented in Figure 5.30. A substantial increase in mean scores of the experimental group
between the pre-test and the post-test is evident.
Figure 5.30 Mean pre-test and post-test difference in scores for control and experimental
groups
Standard deviation is an indicator of the degree of variation in the scores (McMillan et al.
(2006: p163; http://www.toolingu.com/definition-800220-35806-mean.html, 20/10/09). The
standard deviation is calculated by determining the distance between each score and the
2.0
1.99
0.5
2.58
0.85
2.5
0
0.5
1
1.5
2
2.5
3
Control Group Experimental
Group
Language Mathematics Life-Skills
EXPERIMENTAL GROUP
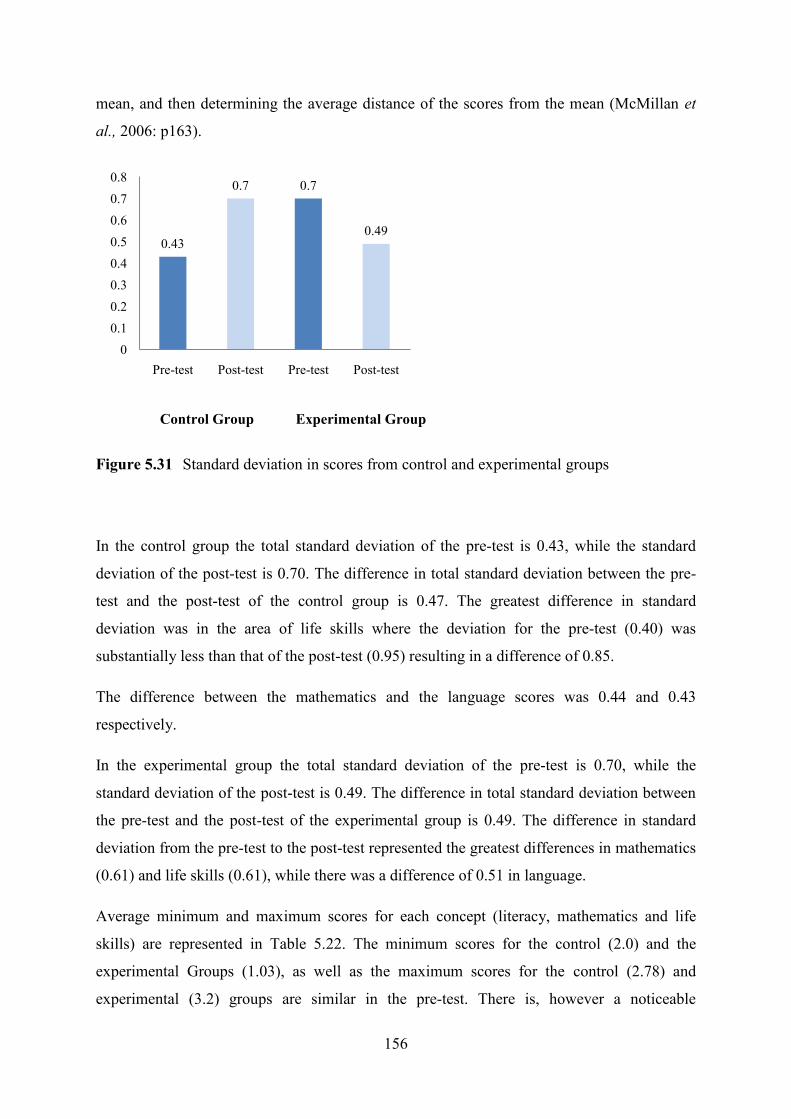
156
Control Group Experimental Group
mean, and then determining the average distance of the scores from the mean (McMillan et
al., 2006: p163).
Figure 5.31 Standard deviation in scores from control and experimental groups
In the control group the total standard deviation of the pre-test is 0.43, while the standard
deviation of the post-test is 0.70. The difference in total standard deviation between the pre-
test and the post-test of the control group is 0.47. The greatest difference in standard
deviation was in the area of life skills where the deviation for the pre-test (0.40) was
substantially less than that of the post-test (0.95) resulting in a difference of 0.85.
The difference between the mathematics and the language scores was 0.44 and 0.43
respectively.
In the experimental group the total standard deviation of the pre-test is 0.70, while the
standard deviation of the post-test is 0.49. The difference in total standard deviation between
the pre-test and the post-test of the experimental group is 0.49. The difference in standard
deviation from the pre-test to the post-test represented the greatest differences in mathematics
(0.61) and life skills (0.61), while there was a difference of 0.51 in language.
Average minimum and maximum scores for each concept (literacy, mathematics and life
skills) are represented in Table 5.22. The minimum scores for the control (2.0) and the
experimental Groups (1.03), as well as the maximum scores for the control (2.78) and
experimental (3.2) groups are similar in the pre-test. There is, however a noticeable
0.43
0.7 0.7
0.49
0
0.1
0.2
0.3
0.4
0.5
0.6
0.7
0.8
Pre-test Post-test Pre-test Post-test
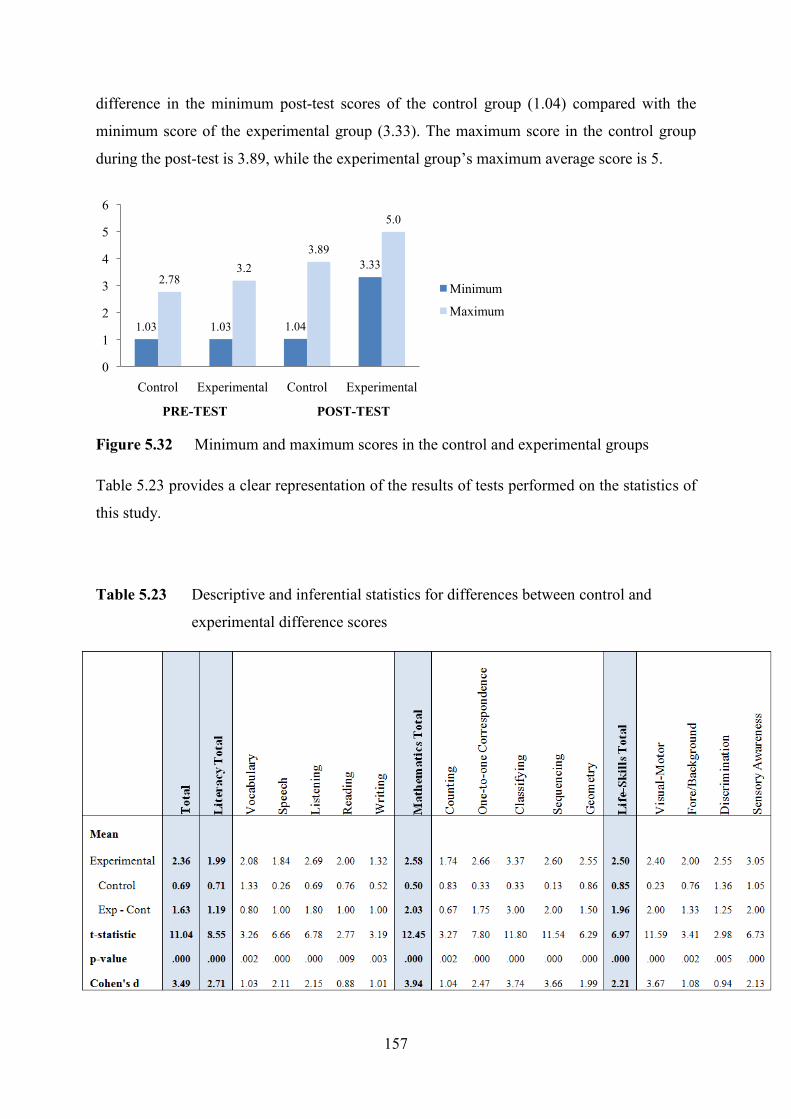
157
1.03 1.03 1.04
3.33
2.783.2
3.89
5.0
0
1
2
3
4
5
6
Control Experimental Control Experimental
Minimum
Maximum
difference in the minimum post-test scores of the control group (1.04) compared with the
minimum score of the experimental group (3.33). The maximum score in the control group
during the post-test is 3.89, while the experimental group‟s maximum average score is 5.
Figure 5.32 Minimum and maximum scores in the control and experimental groups
Table 5.23 provides a clear representation of the results of tests performed on the statistics of
this study.
Table 5.23 Descriptive and inferential statistics for differences between control and
experimental difference scores
PRE-TEST POST-TEST

158
1.27
2.09
1.65
0.00
0.50
1.00
1.50
2.00
2.50
Literacy
Difference
Numeracy
Difference
Life-Skills
Difference
5.5.1 Difference (Experimental – Control)
The difference between the control group‟s mean total score and that of the experimental
group is 1.67. This is calculated by subtracting the mean total score of the control group from
the total mean score of the experimental group.
There was a significant difference between the control group and the experimental group‟s
individual categories of literacy, mathematics and life skills. Figure 5.33 gives a clear
representation that the most significant difference was noted in the mathematics results, with
a difference of 2.09. The difference in life skills results was a mean score of 1.65 and the
difference in literacy results was a mean score of 1.27.
Figure 5.33 Comparison of experimental minus control group differences for literacy,
mathematics and life skills mean scores
The aspect of literacy which represented the greatest difference in results between the control
and experimental groups was listening (2.01), and the aspect which represented the smallest
difference was vocabulary (0.75).
The aspect of mathematics which presented the greatest difference in results between the
control and experimental groups was classifying (3.04), and the aspect which presented the
smallest difference was geometry (1.70).
The aspect of life skills which presented the greatest difference in results between the control
and experimental groups was visual-motor (2.17); and the aspect which presented the
smallest difference was discrimination (1.20).

159
Overall, the aspect which presented the greatest difference in results between the control and
experimental groups was mathematics - classifying (3.04), and the aspect which represented
the smallest difference overall was literacy – vocabulary (0.75).
5.5.2 T-test statistic
T-tests for independent groups were conducted to determine the level of statistical
significance of the difference between the control and experimental group mean scores. In
Figure 5.2.3, t-statistic scores are presented, focusing on literacy (8.55), mathematics (12.45)
and life skills (6.97), as well as the mean scores for each aspect thereof.
In order to test the significance of the study, the t-test statistic, as well as the corresponding
degrees of freedom needed to be represented, in order to determine the significant level of the
results. The degrees of freedom as a statistical concept is calculated by adding the sample size
of the control group to that of the experimental group, and then subtracting 2 from the total.
In this case the degrees of freedom (df) is 38.
Hypothesis 1: Intervention
The null hypothesis (H0
) and alternative hypothesis (H1
) for significance of intervention,
comparing control and experimental Groups:
H0
: There is no significant difference between the overall cognitive development of the
subjects in the control and experimental groups.
H1
: There is a significant difference between the overall cognitive development of the
subjects in the control and experimental groups.
A total t-statistic of 11.04 with 38 df, is significant at p < .001 (0.1% level). This suggests that
the study is considerably significant, and that the results will be evident in 99.9% of the
cases. The null hypothesis is rejected at the 0.1% level of significance.

160
Hypothesis 2: Literacy
The null hypothesis (H0
) and alternative hypothesis (H1
) for the significance of
implementation of literacy concepts, comparing control and experimental groups:
H0
: There is no significant difference between the literacy development of the subjects in the
control and experimental groups.
H1
: There is a significant difference between the literacy development of the subjects in the
control and the experimental groups.
The total t-statistic for literacy is 8.55 with 38 df, and is significant where p < .001 (0.1%
level of significance). This suggests that the study is considerably significant, and that the
same results will be evident in 99.9% of the cases. The null hypothesis is rejected at the 0.1%
level of significance.
The smallest t-value for literacy was for a reading with a t-statistic of 2.77 and 38 df. It is
significant where p < .001 (0.1% level of significance). This suggests that the study is
considerably significant, and that the same results will be evident in 99% of the cases.
The largest t-value for literacy was for listening with a t-statistic of 6.78, and 38 df. It is
significant where p < .001 (0.1% level of significance). This suggests that the study is
considerably significant, and that the same results will be evident in 99.9% of the cases.
Hypothesis 3: Mathematics
The null hypothesis (H0
) and alternative hypothesis (H1
) for significance of implementation
of mathematics concepts, comparing control and experimental groups:
H0
: There is no significant difference between the mathematics development of the subjects
in the control and experimental groups.
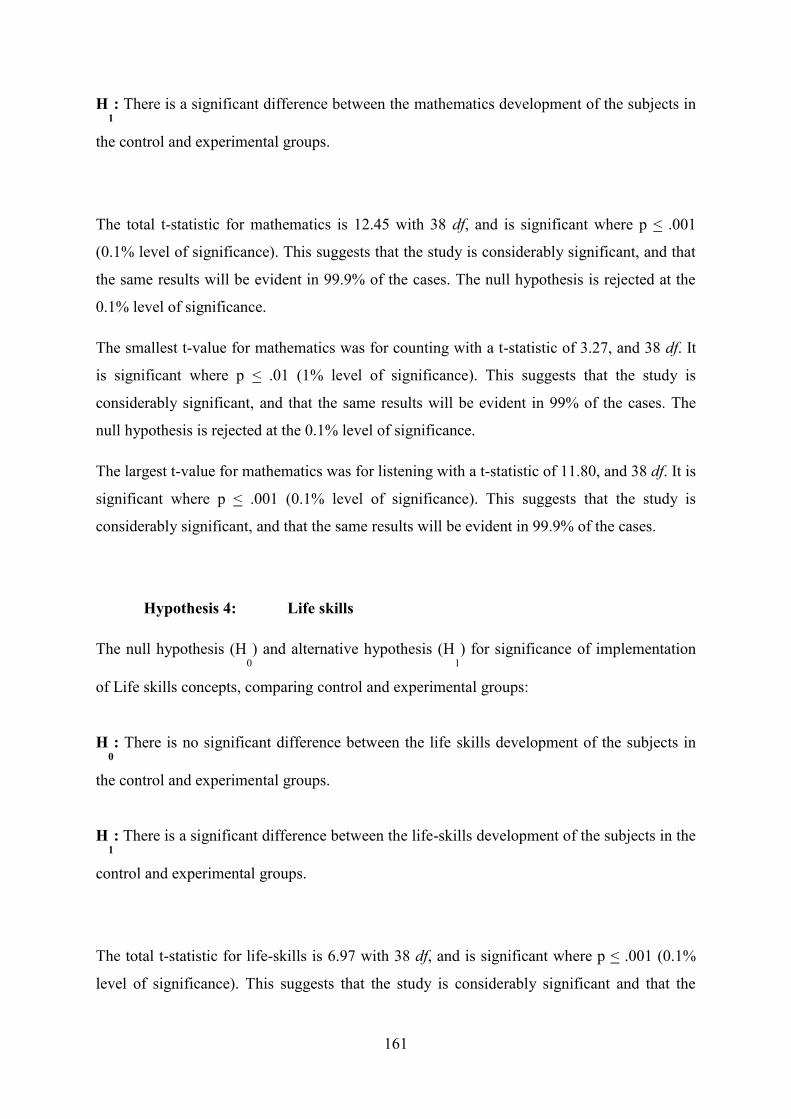
161
H1
: There is a significant difference between the mathematics development of the subjects in
the control and experimental groups.
The total t-statistic for mathematics is 12.45 with 38 df, and is significant where p < .001
(0.1% level of significance). This suggests that the study is considerably significant, and that
the same results will be evident in 99.9% of the cases. The null hypothesis is rejected at the
0.1% level of significance.
The smallest t-value for mathematics was for counting with a t-statistic of 3.27, and 38 df. It
is significant where p < .01 (1% level of significance). This suggests that the study is
considerably significant, and that the same results will be evident in 99% of the cases. The
null hypothesis is rejected at the 0.1% level of significance.
The largest t-value for mathematics was for listening with a t-statistic of 11.80, and 38 df. It is
significant where p < .001 (0.1% level of significance). This suggests that the study is
considerably significant, and that the same results will be evident in 99.9% of the cases.
Hypothesis 4: Life skills
The null hypothesis (H0
) and alternative hypothesis (H1
) for significance of implementation
of Life skills concepts, comparing control and experimental groups:
H0
: There is no significant difference between the life skills development of the subjects in
the control and experimental groups.
H1
: There is a significant difference between the life-skills development of the subjects in the
control and experimental groups.
The total t-statistic for life-skills is 6.97 with 38 df, and is significant where p < .001 (0.1%
level of significance). This suggests that the study is considerably significant and that the

162
results will be evident in 99.9% of the cases. The null hypothesis is rejected at the 0.1% level
of significance.
The smallest t-value for life skills was for discrimination with a t-statistic of 2.98, and 38 df.
It is significant where p < .001 (0.1% level of significance). This suggests that the study is
considerably significant, and that the same results will be evident in 99% of the cases.
The largest t-value for life skills was for visual-motor with a t-statistic of 11.59, and 38 df. It
is significant where p < .001 (0.1% level of significance). This suggests that the study is
considerably significant and that the same results will be evident in 99.9% of the cases.
5.5.3 P-value
In Figure 5.23, p-value scores for all aspects of literacy, mathematics and life skills are
presented.
Hypothesis 1: Intervention
The null hypothesis (H0
) and alternative hypothesis (H1
) for significance of intervention,
comparing control and experimental groups:
H0
: There is no significant difference between the overall cognitive development of the
subjects in the control and experimental groups.
H1
: There is a significant difference between the overall cognitive development of the
subjects in the control and experimental groups.
Table 5.23 gives a clear indication that the total p-value was 0.000. Where p > .05 we deem
the study to be statistically significant. In the case of this study, p (0.000) is significantly
smaller than 0.05, resulting in strong evidence to suggest that the null hypothesis is rejected
at the 5% level of significance. Therefore, there is evidence to suggest that there is a
significant difference between the cognitive development of the subjects in the control and
experimental groups at the 5% level of significance.
163
Hypothesis 2: Literacy
The null hypothesis (H0
) and alternative hypothesis (H1
) for significance of implementation
of literacy concepts, comparing control and experimental groups:
H0
: There is no significant difference between the literacy development of the subjects in the
control and experimental groups.
H1
: There is a significant difference between the literacy development of the subjects in the
control and experimental groups.
Table 5.18 gives a clear indication that the total p-value for literacy was 0.000, where p > .05
we deem the study to be statistically significant. In the case of this study, p (.000) is
significantly smaller than 0.05, resulting in strong evidence to suggest that the null hypothesis
is rejected at the 5% level of significance. Therefore, there is evidence to suggest that there is
a significant difference between the literacy development of the subjects in the control and
experimental groups at the 5% level of significance.
The greatest p-value for literacy is 0.009, should the significance level have been 0.01 (1%
level), a type-1 error would still not have been committed; there would still be significance at
the 1% level.
Hypothesis 3: Mathematics
The null hypothesis (H0
) and alternative hypothesis (H1
) for significance of implementation
of mathematics concepts, comparing control and experimental groups:
H0
: There is no significant difference between the mathematics development of the subjects
in the control and experimental groups.
H1
: There is a significant difference between the mathematics development of the subjects in
the control and experimental groups.
164
Table 5.23 gives a clear indication that the total p-value for mathematics was 0.000, Where p
> .05 we deem the study to be statistically significant. In the case of this study, p (0.000) is
significantly smaller than 0.05, resulting in strong evidence to suggest that the null hypothesis
is rejected at the 5% level of significance. Therefore, there is evidence to suggest that there is
a significant difference between the mathematics development of the subjects in the control
and experimental groups at the 5% level of significance.
The greatest p-value for mathematics is 0.002. Should the significance level have been 0.01
(1% level), a type-1 error would still not have been committed, Therefore there would still be
significance at 1% level.
Hypothesis 4: Life skills
The null hypothesis (H0
) and alternative hypothesis (H1
) for significance of implementation
of Life skills concepts, comparing control and experimental groups:
H0
: There is no significant difference between the life-skills development of the subjects in
the control and experimental groups.
H1
: There is a significant difference between the life-skills development of the subjects in the
control and experimental groups.
Table 5.23 gives a clear indication that the total p-value for life skills was 0.000. Where p >
0.05 we deem the study to have been statistically significant. In the case of this study, p
(0.000) is significantly smaller than 0.05, resulting in strong evidence to suggest that the null
hypothesis is rejected at the 5% level of significance. Therefore, there is evidence to suggest
that there is a significant difference between the life-skills development of the subjects in the
control and experimental groups at the 5% level of significance.
The greatest p-value for mathematics is 0.005, should the significance level have been 0.01
(1% level), a type-1 error would still not have been committed; there would still be
significance at 1% level.
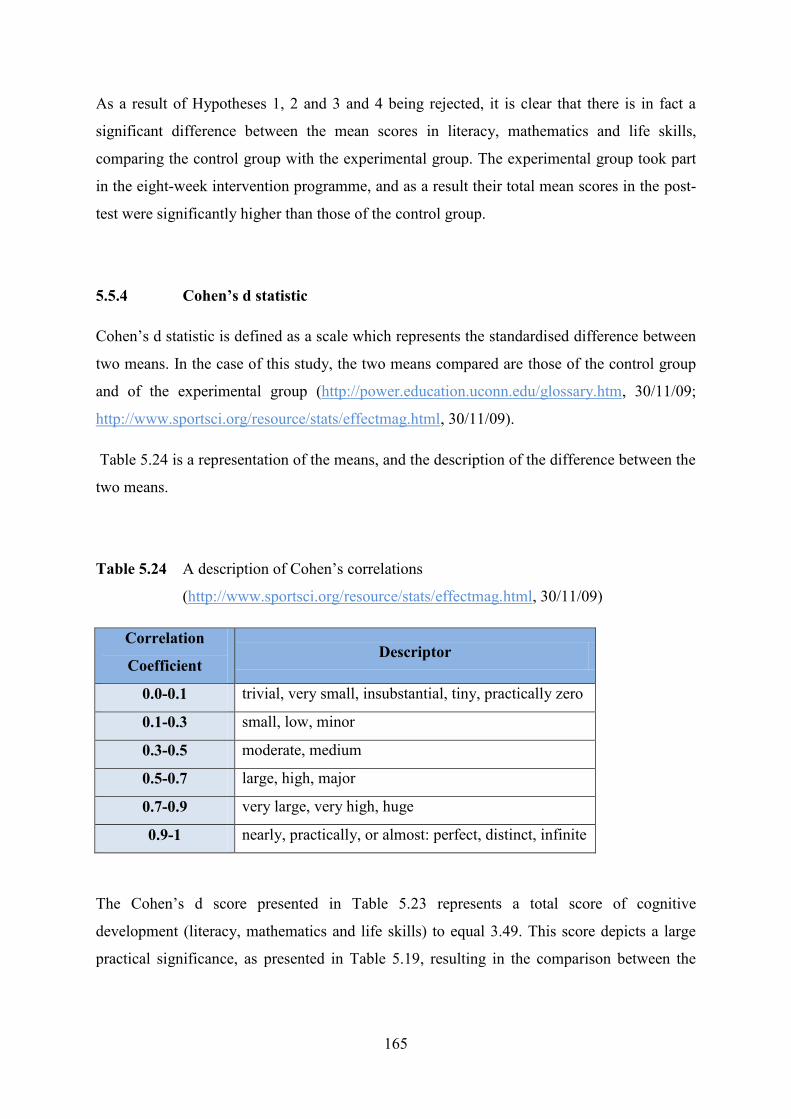
165
As a result of Hypotheses 1, 2 and 3 and 4 being rejected, it is clear that there is in fact a
significant difference between the mean scores in literacy, mathematics and life skills,
comparing the control group with the experimental group. The experimental group took part
in the eight-week intervention programme, and as a result their total mean scores in the post-
test were significantly higher than those of the control group.
5.5.4 Cohen’s d statistic
Cohen‟s d statistic is defined as a scale which represents the standardised difference between
two means. In the case of this study, the two means compared are those of the control group
and of the experimental group (http://power.education.uconn.edu/glossary.htm, 30/11/09;
http://www.sportsci.org/resource/stats/effectmag.html, 30/11/09).
Table 5.24 is a representation of the means, and the description of the difference between the
two means.
Table 5.24 A description of Cohen‟s correlations
(http://www.sportsci.org/resource/stats/effectmag.html, 30/11/09)
Correlation
Coefficient Descriptor
0.0-0.1 trivial, very small, insubstantial, tiny, practically zero
0.1-0.3 small, low, minor
0.3-0.5 moderate, medium
0.5-0.7 large, high, major
0.7-0.9 very large, very high, huge
0.9-1 nearly, practically, or almost: perfect, distinct, infinite
The Cohen‟s d score presented in Table 5.23 represents a total score of cognitive
development (literacy, mathematics and life skills) to equal 3.49. This score depicts a large
practical significance, as presented in Table 5.19, resulting in the comparison between the
166
control and experimental group‟s overall score to be significantly large. The difference is
distinct and the results are infinite.
The Cohen‟s total d score for literacy is 2.71. This score is significantly higher than the
scores presented in Table 5.24, resulting in the comparison between the control and
experimental group‟s literacy score to be significantly large. The difference is distinct and the
results are infinite.
The Cohen‟s total d score for mathematics 3.94. This score is significantly higher than the
scores presented in Table 5.24, resulting in the comparison between the control and
experimental group‟s mathematics score to be significantly large. The difference is distinct
and the results are infinite.
The Cohen‟s total d score for life skills is 2.21. This score is significantly higher than the
scores presented in Table 5.24, resulting in the comparison between the control and
experimental group‟s life-skills score to be significantly large. The difference is distinct and
the results are infinite.
The smallest Cohen‟s d score was for literacy – writing is 1.01. This score is slightly greater
than the scores presented in Table 5.24, resulting in the comparison between the control and
experimental group‟s literacy - writing score to be significantly large. The difference is
distinct and the results are infinite.
5.5.5 Analysis of co-variance
Analysis of co-variance, using the statistical software package programme BMDP2007 in
addition to the analysis of co-variance, where the treatment was the grouping variant and the
pre-test was done with the co-variant, with the assumption that the two groups (control and
experimental) represent parallel slopes of improvement. The level of improvement in the
scores of the experimental group was phenomenal, while the control group‟s level of
improvement was minimal.
As a result the slopes were not parallel, and the test could not be employed.

167
5.6 SUMMARY
The aim of data analysis is for the researcher to determine whether the data provide the
needed information, in order to achieve the goal and aims of the study (Koshy, 2005: p109).
The initial phases of the study addressed the sample distribution of all subjects taking part in
the study, as well as a comparison of the biographical details between the subjects in the
control and experimental groups.
Single variable descriptive statistics (mean, standard deviation and frequency distributions)
give insight into the pre-test and post-intervention scores. To assess the internal consistency
and the reliability of the scores for the pre-test and post-tests, alpha coefficients for each were
computed. Statistical analyses were conducted to assess the criteria and construct validity.
The internal reliability of the instrument was evaluated via Cronbach‟s alpha, using both
control and experimental group‟s pre-test and post-test scores. Concluding remarks will be
discussed in Chapter 6.
168
CHAPTER 6
CONCLUSIONS AND RECOMMENDATIONS
6.1 INTRODUCTION
Children begin the process of learning from a very young age, and move from one stage of
cognitive development to the next, where they are constantly being stimulated by their
environment and the happenings therein (Chapter 2.18.1: p56). ‘Education is the most
powerful weapon which you can use to change the world’ (Nelson Mandela,
http://www.allgreat quotes.com/graduation_quotes.shtml, 9/11/09). Learning is an ongoing
lesson in life, one with which we need to be equipping young children.
The principal aim of this study was to gain a comprehensive understanding of the cognitive
development of the young child, by developing a suitable programme that could be used to
enhance the cognitive development of young children. The results of this study, in
conjunction with others cited in previous chapters, suggest that the influence that quality
cognitive intervention has on the development of young children is extensive.
Chapter 6 deals with an overview of the investigation, the findings and recommendations on
the effects of cognitive stimulation in the development of mathematics, literacy and life-skills
concepts in early childhood.
6.2 SUMMARY OF THE RESULTS
An eight-week programme was developed in order to examine the effects of early intervention
on cognitive development. Cognitive development was enhanced by means of stimulation in
mathematics, literacy and life-skills concepts.
From the findings discussed in Chapter 5, it has become clear that the effects of early
intervention and stimulation of cognitive concepts are greatly beneficial to the young child.
The results provide encouraging evidence on the viability of stimulation and the development
of cognitive concepts in the early years.
169
From Table 5.22 (p149) it becomes clear that subjects who received the intervention
programme (experimental group) consistently outperformed those who did not receive
additional intervention (the control group).
6.2.1 Demographics of the subjects
Irrespective of race, gender, age and language, early intervention and stimulation of cognitive
concepts will have a positive effect on children‟s understanding and the comprehension of
concepts. This study did not set out to compare the results between the demographic groups,
but rather to recognise that the effects of cognitive intervention and stimulation are greatly
beneficial to the young child‟s cognitive development, irrespective of race, gender, age or
language.
6.2.2 Reliability of instruments
Another aim of this investigation was to evaluate the methods of implementation which aid the
development of the cognitive concepts. The eight-week intervention programme that was
designed for this study proved to be reliable and effective. In Table 5.10 (p123) the reliability
statistics for the pre-test and post-test scores are recorded. The results of subjects in the
respective groups displayed scores which were consistent with one another. The increase of
results in the experimental group in the course of the post-test was to be found in each
subject, while the results of the control group remained similar to those of the pre-test.
As a result of the substantial difference in results of the experimental group‟s pre-test and
post-test scores (Table 5.21: p143), it can be deduced that not only does intervention have
great effects on cognitive development, but that the method of implementation designed for
the purposes of this study was effective in developing and enhancing cognitive concepts.
6.2.3 Effects of early cognitive intervention
Brody (Ed. Kyllonen, Roberts & Stankov, 2008: p71) justifies the teaching and learning
process by stressing the importance of the development of intelligence, „What is learned
(self-evidently) depends on what is taught. Individuals with the same intelligence may acquire
different levels of expertise and knowledge if they are taught in different ways’.
170
In Table 5.22 (p149), it is clear that there was a significant difference between the scores of
the control group and the experimental group‟s individual categories of literacy, mathematics
and life skills.
T-tests for independent groups were conducted to determine the level of statistical
significance of the difference between the control and experimental group‟s mean score. T-
statistics are represented in Table 5.23 (p153), where a total t-statistic of 11.04 with 38 df, is
significant at p < .001 (0.1% level).
This suggests that the study is highly significant, and that the results will be evident in 99.9%
of the cases. The null hypothesis is rejected at the 0.1% level of significance. Therefore, there
is a significant difference between the overall cognitive development of the subjects in the
control and experimental groups.
In Table 5.23 (p153) it is clear that there is in fact a significant difference between the mean
scores on literacy, mathematics and life skills, when comparing the control group with the
experimental group. The experimental group took part in the eight-week intervention
programme, and as a result their total mean scores in the post-test were significantly higher
than those of the control group.
Figure 5.26 (p146) represents the differences in mean scores between the control group and
the experimental group. Each concept of literacy was compared (writing, reading, listening,
speech and vocabulary), and a significant increase in mean scores in each concept was clearly
evident.
Figure 5.27 (p147) represents the differences in mean scores between the control group and
the experimental group. Each concept of mathematics was compared (geometry, sequencing,
classifying, one-to-one correspondence and counting), and a significant increase in mean
scores in each concept was clearly evident.
Figure 5.28 (p148) represents the differences in mean scores between the control group and
the experimental Group. Each concept of life skills was compared (sensory awareness,
discrimination, foreground/background and visual motor skills), and a significant increase in
mean scores in each concept was clearly evident.
171
Cohen‟s d statistic represented a similar result, where the comparison between the results of
the two groups is infinite. Table 5.23 (p153) shows that the difference in results is extremely
large, again stressing the positive effects of early intervention. It is clear that the effects of
early intervention and cognitive stimulation have positive effects on the development of
young children.
It is clear from the results of this study that there is a great need for early intervention which
caters for each child uniquely and in his/her totality. Parents play a significant role in the
development of mathematics, literacy and life-skills concepts during early childhood, and as a
result, parents need to be trained and equipped regarding the role they can play and the
importance thereof, allowing parents to create the best possible learning environments for
their children.
In Chapter 2 (2.21: p62) the importance of parental involvement was discussed, emphasizing
that the child‟s achievements and successes are greatly influenced by parental input and
interaction.
6.3 CONCLUSIONS
In 99.9% of the cases of early cognitive intervention, the results are positive (Table 5.23:
p153). This is an outstanding result, encouraging the development of intervention
programmes for cognitive concepts from an early age. Early intervention will enable young
children to gain an understanding of cognitive concepts from an early age. This will possibly
prevent future barriers to learning resulting in a smaller number of children in schools
struggling with foundational concepts.
It is assumed that with a decrease in the number of learners struggling with foundational
concepts, the need for specialists such as Occupational Therapists and Remedial Therapists
will become substantially less.
Parents, teachers, social workers, therapists, extended family and siblings all play a vital role
in the upbringing of children in today‟s society. These stakeholders all form part of an

172
important hierarchy and the children‟s emotional, social, physical and intellectual advances
will always need to be attended to (Chapter 2.21: pg62).
6.4 RECOMMENDATIONS
6.4.1 Intervention programme
Cognitive development programmes should be readily available to parents and early childhood
educators. Ideally, a programme should be devised which caters for young children‟s cognitive
development, in the different stages of their growth.
A step-by-step plan could be devised which focuses on the various developmental levels
(Chapter 2.2: p18-19), an understanding of how children learn (Chapter 2.4 and 2.5), as well as
the various aspects of cognitive development, namely mathematics (Chapter 2.8-2.11), literacy
(Chapter 2.12-2.16) and life skills (Chapter 2.17), with their various sub-sections.
This programme, as well as an indication of manners in which concept development can be
provided for in the classroom, should be explained to parents and care-givers. It is clear that the
concepts discussed in Chapter 2 need to be provided for in Early Childhood Centres, as concept
development has clearly proved to be crucial in the intervention programmes discussed in this
study.
6.4.2 Parental involvement
As discussed in Chapter 2 (2.21), parental involvement in the education process is of
paramount importance. Feedback from the questionnaires raised the issue that many parents
are ignorant of the fact that their involvement is so important, and are unaware of possible
ways to get involved in the child‟s cognitive development process.
Awareness needs to be raised regarding the importance of parental involvement and interest,
as well as equipping parents on their child‟s developmental levels and expectations. Very
often the parents‟ role in stimulation is not seen as important, but research shows that there is
a clear long-lasting benefit from parental involvement in the education system (Eliason, et al.,
2004: p49).
173
i.) Benefits of parental involvement for children
Their reading ability increases
Children have a much more positive attitude towards school and education
Children have a higher rate of class attendance
Their homework habits are healthy
Good home-school communication
Children see their parents as an important part of the education system
ii.) Benefits of parental involvement for parents
Parents that are involved are more willing to help children with homework and extra
activities
Parents have a more positive attitude towards school activities
Parents tend to appreciate teachers and their efforts more, and show more support and
encouragement towards teachers
Parents are more familiar with the curriculum
Parents also have more confidence in their parenting abilities
Parents have a deeper understanding of their child, their child‟s development and their
expectations of the child.
iii.) Benefits of parental involvement for teachers
Teachers appreciate parental involvement
Teachers gain respect for parents and develop a deeper understanding of the child
Teachers feel more respected by parents
A more harmonious environment for all can be created.
6.5 RECOMMENDATIONS FOR FURTHER STUDIES
Kay (2005), Tolbert and Theobald (2006, in De Witt, 2008: p1), state that in order for there to
be a sustainable, long-term beneficial outcome in children‟s development, intervention is
imperative, including programmes that enhance child development from the early stages, as
well as ensuring that intervention and stimulation are maintained for as long as possible,
since children are constantly developing and maturing.

174
This study indicates the immediate development of cognitive growth and understanding of
concepts after young children undergo an eight-week intervention programme. There is a
clear comparison between the subjects which underwent the intervention programme and
those that did not. Results were clear after the intervention process that positive development
had taken place in the experimental group.
Early intervention enables young children to gain an understanding of the cognitive concepts
from an early age. We can assume that the immediate effects of intervention and concept
development form the foundations for future learning.
The field of early childhood intervention strategies provides a great opportunity for further
investigation. Although studies have shown that there is a great need for early intervention, a
strategic plan and design for early childhood stimulation would be of great benefit for Early
Childhood Development Centres, as referred to in Chapter 2 (2.20: p59).
Like the NCS (Chapter 2.20: p59), which suggests guidelines and standards for formal
teaching strategies, so an intervention strategy and plan should be implemented in Early
Childhood Centres across South Africa. The development and implementation of this
programme would be of great benefit to education in South Africa.
6.6 LIMITATIONS OF THE STUDY
The study was limited to children aged between two (24 months) and three-and-a-half years
(42 months). The subjects were selected from three Early Childhood Centres in the middle-
class socio-economic status group of Port Elizabeth (Chapter 4.6: p108). Although the study
presented rich quantitative data, the participants were not numerous enough to generalise the
findings to other contexts (i.e. other ages). Nonetheless, this investigative study presents an
important perspective on the development of cognitive concepts in the early childhood.
6.7 CLOSING REMARKS
The early years of a child‟s life are years of rapid development and change (Chapter 2.21:
p62). Each child is born with infinite potential and possibilities, and as individuals of the

175
human race, it is our duty to help these children grow and flourish, and by so doing, we stoke
the power within that truly makes us powerful. In order for children to flourish, the
development and enhancing of their maximum capabilities and potentials, as well as making
the most of their period of existence are of the utmost importance (http://jmm.
aaa.net.au/articles/4564.htm, 1/11/09).
Nelson Mandela, in his Inaugural Speech in 1994 suggested the following proclamation
(Marianne Williamson, http://jmm.aaa. net.au/articles/4564.htm, 1/11/09):
"Our deepest fear is not that we are inadequate. Our deepest fear is that we are
powerful beyond measure. It is our light, not our darkness, that most frightens us. We ask
ourselves, who am I to be brilliant, gorgeous, talented, and fabulous? Actually, who are you
not to be? You are a child of God. Your playing small doesn't serve the world. There's
nothing enlightened about shrinking so that other people won't feel insecure around you. We
are all meant to shine, as children do. We are born to make manifest the glory of God that is
within us. It's not just in some of us; it's in everyone. And as we let our own light shine, we
unconsciously give other people permission to do the same. As we are liberated from our own
fears, our presence automatically liberates others."
176
REFERENCE LIST
1. Althouse, R., 1981. The Young Child – Learning with Understanding. New York:
Teachers College Press
2. Aubrey, C. 1997. Children's early learning of numbers in school and out. In
Thompson, I (Ed.). Teaching and learning early numbers (p20-32). Philadelphia:
Open University Press
3. Barone, D., Mallette, M. & Hong Xu, S. 2005. Teaching Early Literacy:
Development, Assessment and Instruction. New York: Guildford Press
4. Benigno, J. & Ellis, S. 2004. Two is greater than three: effects of older siblings on
parental support of preschoolers‟ counting in middle-income families. Early
Childhood Research Quarterly. Volume 19. (p4-20)
5. Berk, L. 2006. Child Development. Seventh Edition. Boston: Allyn and Bacon.
6. Berk, L. 2007. Development through the lifespan. Fourth Edition. Boston: Allyn and
Bacon
7. Branford (Ed.). 1994. Privacy. The South African Pocket Oxford Dictionary. Seventh
Edition (p602)
8. Brierley, J. 1994. Give me a child until he is 7: Brain Studies and Early Childhood
Education. Second Edition. Washington, DC: Famler Press
9. Brody, N. 2008. Does Education Influence Intelligence? In Kyllonen, P., Roberts, R.
& Stankov, L. (Eds). Extending intelligence: enhancement and new constructs (p85-
93). New York: Lawrence Erlbaum Associates
10. Brooks-Gunn, J. 2004. Intervention and policy as change agents for young children.
In Friedman, R., Chase-Lansdale, P. & Kiernan, K. (Eds). Human development across
lives and generations: the potential for change (p293-343). New York: Cambridge
University Press
177
11. Carr, A. 2006. The handbook of child and adolescent clinical psychology: a
contextual approach. Second Edition. New York: Routledge Publishers
12. Cele, V. 2008. The Management of the Implementation of Quality Assurance
Policies: The Case of Integrated Quality Management Systems (IQMS) in secondary
schools in KwaZulu-Natal.
13. Clarke, B., Clarke, D. & Cheeseman, J. 2006. The Mathematical Knowledge and
Understanding Young Children Bring to School. Mathematics Education Research
Journal. Volume 18, No. 1. (p78-102)
14. Cooper, E., Levine, D. 2008. Teaching for Intelligence: Parameters for Change. In
Presseisen (Ed.). Teaching for intelligence (p186-193). California: Corwin Press
15. Cunningham, D. 2008. Literacy Environment Quality in Preschool and Children‟s
Attitudes towards Reading and Writing. Literacy Teaching and Learning. Volume 12,
No. 2. (p19-36)
16. Department of Education. 2002. The Revised National Curriculum Statement
Grades R-9 (Schools). Pretoria: Department of Education
17. De Witt, M. 2007. Emergent literacy: why should we be concerned? Early Child
Development and Care. First Article. (p1-10)
18. De Witt, M. 2008. The implementation of Community-based care: a case study. Early
Learning Development and Care. (p1-14)
19. De Witt, M. 2009. The young child in context: a thematic approach : perspectives
from educational psychology and sociopedagogics. Pretoria: Van Schaik.
20. De Witt, M. & Booysen, M. (1995). Focusing on the Small Child: insights from
Psychology of Education. First Edition. Pretoria: Acacia.
21. De Witt, M., Lessing, A. & Lenayi, L. 2008. An investigation into the state of early
literacy of preschool learners. Journal for Language Teaching. Volume 42/2. (p1-10)

178
22. Department of Education. 2002. The Revised National Curriculum Statement
Grades R-9 (Schools). Pretoria: Department of Education
23. Directorate: Planning & Environment. 2003. Policy for Early Childhood Development
Centres (ECD Centres). City of Cape Town, South Africa.
24. Dockett, S. & Perry, B. 2007. Early Childhood Mathematics Education Research:
What is Needed Now? Mathematics: Essential Research, Essential Practice. Volume
2. (p870-874)
25. Dockrell, J., Messer, D., 2004. Lexical acquisition in the early school years. In
Berman (Ed.) Language Development across Childhood and Adolescence. (p35-52)
Philadelphia: John Benjamins Publishers
26. Eliason, C. 2008. A practical guide to early childhood curriculum. Eighth Edition.
New Jersey: Pearson Merrill/Prentice Hall
27. Eliot, L. 1999. What's going on in there?:How the brain and mind develop in the first
five years of life. New York: Bantam Books.
28. Formanek, R, Gurain, A. 1981. Charting Intellectual development: A practical guide
to Piagetian tasks. Second Edition. Springfield: Thomas Publishers
29. Gordon, A., & Browne, K. 2008. Beginnings and beyond: Foundations in Early
Childhood Education. Seventh Edition. New York: Thomson Delmar Learning
30. Griffin, S. 2004. Building number sense with Number Words: a mathematics
programme for young children. Early Childhood Research Quarterly. Volume 19.
(p173-180)
31. Haydon, G. 2006. Values in education. New York: Continuum Publishers
32. Hayward, R. 2006. Quality Schools (Part II) Editorial. Management Today
33. Hendrick, J. 1986. Total learning: curriculum for the young child. Second Edition.
Columbus: Merrill Publishing Company
179
34. Hendrick, J., Weissman, P. 2007. Total learning: developmental curriculum for the
young child. Seventh Edition. New Jersey: Pearson Merril
35. Higgs, P. & Smith, J. 2006. Rethinking our World. Second Edition. Kenwyn: Juta
36. Hoff, E. 2005. Language Development. Third edition. Australia: Wadsworth Thomson
Learning
37. Koshy, V. 2005. Action research for improving practice: a practical guide. London:
P. Chapman Publishers
38. Kostelnik, M., Soderman, A., & Whiren, A. 1999. Developmentally Appropriate
Programs in Early Childhood Education. Second Edition. New Jersey: Merrill
39. Kostelnik, M., Soderman, A. & Whiren, A. 2004. Developmentally Appropriate
Curriculum: Best practices in Early Childhood Education. (Third Edition). New
Jersey: Prentice Hall
40. Landsberg, E., Kruger, D. & Nel, N. 2005. Addressing Barriers to learning: a South
African Perspective. (First Edition). Pretoria: Van Schaik
41. Lansdown, R., Walker, M. 1991. Your Child’s Development: From birth through
adolescence: a complete guide for Parents. (First American Edition). New York:
Knopf Publishers
42. Leinhardt, G. 2001. Instructional explanations: A commonplace for
teaching and location for contrasts (in Richardson, V. [Ed.], Handbook of
research on teaching. 4th edition. Washington: American Educational
Research Association)
43. Liebeck, P. 1984. How children learn Mathematics: A guide for Parents and
Teachers. England: Penguin Books
44. Lilly, E., & Green, C. 2004. Developing partnerships with families through children's
literature. New Jersey: Pearson Merrill/Prentice Hall

180
45. Lindberg, L. & Swedlow, R. 1985. Young Children: Exploring and Learning. First
Edition. Boston: Allyn and Bacon
46. Maree, D. & Ford, M. 1987. Bridging with a Smile. South Africa: Smile Education
Systems
47. Maxim, G. 1992. The Very Young: Guiding children from Infancy through the early
years. Fourth Edition. New York: Macmillan Publishing Company
48. Mc Dermott & Rakgokong. 1996. EXCELL in Teaching Mathematics. Pretoria:
Kagiso Publishers
49. McAfee, O., Leong, D. (2007) Assessing and guiding young children's development
and learning. Fourth Edition. Boston: Pearson Allyn & Bacon
50. McGee, L., & Richgels, D. 2008. Literacy's beginnings: supporting young readers
and writers. Fifth Edition. Boston: Allyn and Bacon Publishers
51. McGuinness, D. 2005. Language development and learning to read : the scientific
study of how language development affects reading skill. Cambridge: MIT Press
Publishers
52. McMillan, J., Schumacher, S. 2006. Research in education: evidence-based inquiry.
Boston: Pearson
53. Meier, C. & Marais, P. 2007, Education management in early childhood development.
Pretoria: Van Schaik
54. Metlina, L. 1991. Mathematics in Preschool: An Aid for the Preschool educator.
Virginia: National Council of Teachers of Mathematics
55. Mindes, G. 2007. Assessing young children. Third Edition. New Jersey: Pearson
Merrill/Prentice Hall
56. Morrison, G.S. 1998. Early Childhood Education Today. Seventh Edition. New
Jersey: Macmillan Publishing Company
181
57. Mouton, J. 2001. How to succeed in your master's and doctoral studies: a South
African guide and resource book. Pretoria: Van Schaik Publishers
58. Neuman, W. 2006. Social research methods: qualitative and quantitative approaches.
Sixth Edition. London: Allyn and Bacon
59. Ornstein, A. & Hunkins, F. 2004. Curriculum – foundations, principles, and issues.
Fourth Edition. Boston: Allyn & Bacon
60. Pellegrini, A., Symons, J., & Hoch, J. 2004. Observing children in their natural
worlds: a methodological primer. Second Edition. New Jersey: L. Erlbaum
Associates
61. Sarama, J. & Clements, D. 2008. Mathematics in Early Childhood. In Saracho, O. &
Spodek, B. (Eds). Contemporary perspectives on Mathematics in Early Childhood
Education. (p67-94). Charlotte: Information Age Publishers
62. Schmitt, M. & Gregory, A. The Impact of an Early Literacy Intervention: Where Are
the Children Now? Literacy Teaching and Learning. Volume 10, No. 1. (p1-20)
63. Seefeldt, C. & Barbour, N. 1998. Early Childhood Education: an introduction. Fourth
Edition. New York: Merril Publishers
64. Soderman, A., Farrell, P. 2008. Creating literacy-rich preschools and kindergartens.
Boston: Allyn & Bacon
65. Sophian, C. 2004. Mathematics for the future, developing a Head-Start curriculum to
support mathematics learning. Early Childhood Research Quarterly. Volume 19. (p59-
81)
66. Somekh, B. 2006. Action research: a methodology for change and development.
Maidenhead: Open University Press.
67. Spillane, R. 2008. Teaching for Intelligence: The Intellectual Life of Schools. In
Presseisen (Ed.). Teaching for intelligence (p139-141). California: Corwin Press
182
68. Spodek, B., Saracho, O. & Davis, M. 1991. Foundations of Early Childhood
Education: teaching three-, four- and five-year-old children. Second Edition. Boston:
Allyn & Bacon
69. Starkey, P. & Klein, A. 2008. Sociocultural Influences on Young Children's
Mathematical Knowledge (In Saracho, O. & Spodek, B. (Ed.). Contemporary
perspectives on mathematics in early childhood education. Charlotte: Information Age
Publishers
70. Sternberg, R. 2008. Schools Should Nurture Wisdom. In Presseisen (Ed.). Teaching
for intelligence (p61-88). California: Corwin Press
71. Stretch, L. 2008. Investigating the Impact of Stimulation in Mathematical Concepts in
the Early Childhood, Unpublished Manuscript
72. Swets & Zeitlinger. 2002. Development of Early Numeracy in 5 to 7 Year Old
children: a comparison between Flanders and the Netherlands. Volume 8.
Educational Research and Evaluation
73. Tudge, R., Doucet, F. (2004). Early mathematical experiences: observing young
Black and White children‟s everyday activities. Early Childhood Research Quarterly.
Volume 19. (p21-39)
74. Whitmore, J. 1986. Intellectual Giftedness in young children: Recognition and
Development. New York: Haworth Press
75. Woolfolk, A. 2007. Educational Psychology. 10th
Edition. Boston: Allyn & Bacon
76. Wright, R.J. 2002. Assessing young children’s arithmetical strategies and knowledge:
Providing learning opportunities for teachers. Volume 27. No 3 September. School of
Education, Southern Cross University
77. Young-Loveridge, J. 2008. Development of Children's Mathematical Thinking in
Early School Years. In Saracho, O., Spodek, B. (Ed.). Contemporary perspectives on
mathematics in early childhood education. Charlotte: Information Age Publishers
183
78. A Scale of Magnitudes for Effect Statistics. Retrieved 30/11/09 from World Wide
Web: http://www.sportsci.org/resource/stats/effectmag.html
79. Abrahams, D. Introduction to Research Design. Retrieved 10/10/09 from World Wide
Web: http://www.socialresearchmethods.net/tutorial/Abrahams/sbk16.htm
80. Analysis and Statement of the Problem. Retrieved 16/05/09 from World Wide Web:
http://www.idrc.ca/en/ev-56596-201-1-DO_TOPIC.html
81. Arithmetic. Retrieved 1/10/08 from World Wide Web:
http://www.answers.com/topic/arithmetic
82. Arpin, M. 2002. Child Development. Retrieved 20/06/09 from the World Wide Web:
http://www.all thedaze.com/development3.html
83. Bailey, C. 2006. Providing Early Stimulation. (p1-2). Retrieved 23/07/08 from the
World Wide Web: http://extension.oregonstate.edu/catalog/pdf/ec/ec1301-e.pdf
84. Brain Structures and their Functions. Retrieved 29/06/09 from World Wide Web:
http://serendip.brynmawr.edu/bb/kinser/Structure1.html
85. Child Welfare Information. 2001. Understanding the Effects of Maltreatment on Early
Brain Development. Retrieved 07/07/08 from World Wide Web:
http://www.childwelfare.gov/pubs/focus/earlybrain/earlybraina.cfm
86. Cognitive Child Development Three Years: Intellectual Development of Your Three-
Year-Old Child. Retrieved from World Wide Web: http://www.child-development-
guide.com/cognitive-child-development-three-years.html
87. Early Childhood: Where Learning Begins - Mathematics: What is Mathematics?
1999. Retrieved 2/10/08 from World Wide Web:
http://www.ed.gov/pubs/EarlyMath/whatis.html
88. Education in South Africa. 2006. Retrieved 07/07/08 from World Wide Web:
http://www.southafrica.info/about/education/education.htm

184
89. External Validity. Retrieved 10/11/09 from World Wide Web:
http://www.gifted.uconn.edu/siegle/research/Samples/externalvalidity.html
90. Glossary: Cohen’s d. Retrieved 30/11/09 from World Wide Web:
http://power.education.uconn.edu/glossary.htm
91. Growth and Development: The Growing Child: 3-Year-Olds. Retrieved 18/06/09 from
World Wide Web: http://www.musckids.com/health_library/growth/threeyo.htm
92. Integrated Quality Management Systems (IQMS) For School-Based Educators.
Retrieved 10/06/09 from World Wide Web:
http://www.elrc.co.za/UploadedDocuments/IQMS%20Training%20Manual.doc
93. Language Development. Retrieved 15/03/2009 from World Wide Web:
http://en.wikipedia.org/wiki/Language_development
94. Lie, K. Validity & Reliability in Quantitative Research. Retrieved 18/03/09 from
World Wide Web: http://www.qmu.ac.uk/psych/RTrek/study_notes/web/sn3.htm
95. Lind, K. 1999. Dialogue on Early Childhood Science, Mathematics, and Technology
Education. Retrieved 01/10/08 from World Wide Web:
http://www.project2061.org/publications/earlychild/online/experience/Lind.htm
96. Maslow’s Hierarchy of Needs. Retrieved 10/8/08 from World Wide Web:
http://www.pateo.com/images/maslowmaster4ts.gif
97. Maslow’s Hierarchy of Needs. Retrieved 24/06/09 from World Wide Web:
http://www.omafra.gov.on.ca/english/rural/facts/96-001f1.gif
98. Maslow’s Hierarchy of Needs. Retrieved 24/06/09 from World Wide Web:
http://www.ruralhealth.utas.edu.au/comm-lead/images/Maslows-needs-Pyramid.jpg
99. McGuigan, B. What is Morphology? Retrieved 30/06/09 from World Wide Web:
http://www.wisegeek.com/what-is-morphology.htm
185
100. Montessori Method. Retrieved 10/10/09 from World Wide Web:
http://en.wikipedia.org/wiki/Montessori
101. Perry, B. & Pollard, R. 1997. Altered brain development following global
neglect in early childhood. Retrieved 14/06/09 from World Wide Web:
http://www.childtrauma.org/ctamaterials/neuros~1.asp
102. Perry, B. 1998. Biological Relativity: Time and the Developing Child.
Retrieved 10/7/08 from World Wide Web:
http://www.childtrauma.org/ctamaterials/biolo_relativity.asp
103. Perry, B. 2002. Brain Structure and Function II: Special Topics Informing
Work with Maltreated Children. Volume 2, No. 2. Retrieved 14/06/09 from World
Wide Web: http://www.childtrauma.org/ctamaterials/brain_II.asp
104. Quotes. Retrieved 5/11/09 from World Wide Web:
http://www.allgreatquotes.com/graduation_quotes.shtml
105. Reliability.2006. Retrieved 3/11.09 from World Wide Web:
http://www.socialresearchmethods.net/kb/reliable.php
106. Schneider, B. 2006. Definition: Life-Skills. Retrieved 18/03.2009 from World
Wide Web: http://www.selfgrowth.com/articles/Definition_Life_Skills.html
107. Teaching Mathematical Concepts: Number Sense. 2006. Retrieved 18/03/2009
from the World Wide Web: http://s22318.tsbvi.edu/mathproject/ch1.asp
108. The Healing Light Institute of Spirituality. Retrieved 1/11/09 from World
Wide Web: http://jmm.aaa.net.au/articles/4564.htm
109. Theories of Child Development and Learning. Retrieved 19/9/09 from World
Wide Web: www.ncrel.org/sdrs/areas/issues/students/earlycld/ea7lk18.htm
186
LIST OF APPENDICES
APPENDIX A
Letter to Principal
APPENDIX B
Study information letter
APPENDIX C
Informed consent form
APPENDIX D
Questionnaire for subject‟s parents/care-givers
APPENDIX E
Pre-test assessment form : Mathematics
: Literacy
: Life skills
APPENDIX F
Post-test assessment form : Mathematics
: Literacy
: Life skills
APPENDIX G
Mathematics scoring scale
APPENDIX H
Literacy scoring scale
APPENDIX I
Life-skills scoring scale
APPENDIX J
Language Quality Assurance Certificate
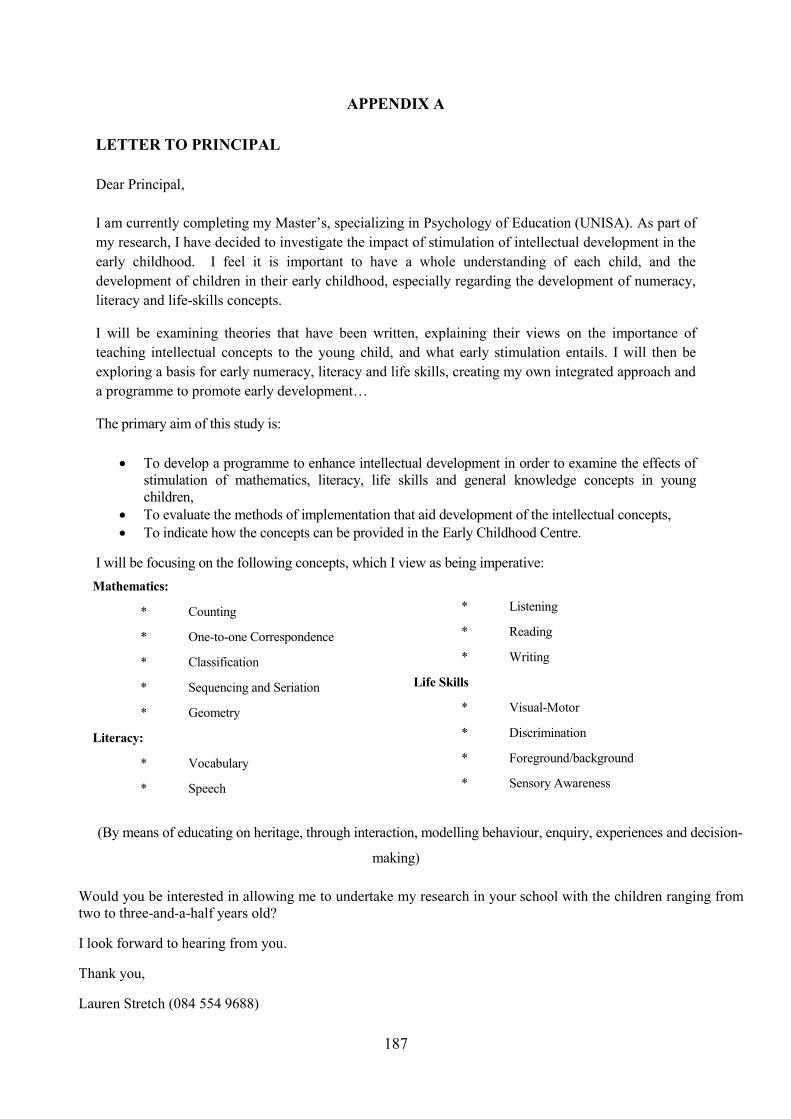
187
APPENDIX A
LETTER TO PRINCIPAL
Dear Principal,
I am currently completing my Master‟s, specializing in Psychology of Education (UNISA). As part of
my research, I have decided to investigate the impact of stimulation of intellectual development in the
early childhood. I feel it is important to have a whole understanding of each child, and the
development of children in their early childhood, especially regarding the development of numeracy,
literacy and life-skills concepts.
I will be examining theories that have been written, explaining their views on the importance of
teaching intellectual concepts to the young child, and what early stimulation entails. I will then be
exploring a basis for early numeracy, literacy and life skills, creating my own integrated approach and
a programme to promote early development…
The primary aim of this study is:
To develop a programme to enhance intellectual development in order to examine the effects of
stimulation of mathematics, literacy, life skills and general knowledge concepts in young
children,
To evaluate the methods of implementation that aid development of the intellectual concepts,
To indicate how the concepts can be provided in the Early Childhood Centre.
I will be focusing on the following concepts, which I view as being imperative:
(By means of educating on heritage, through interaction, modelling behaviour, enquiry, experiences and decision-
making)
Would you be interested in allowing me to undertake my research in your school with the children ranging from
two to three-and-a-half years old?
I look forward to hearing from you.
Thank you,
Lauren Stretch (084 554 9688)
* Listening
* Reading
* Writing
Life Skills
* Visual-Motor
* Discrimination
* Foreground/background
* Sensory Awareness
Mathematics:
* Counting
* One-to-one Correspondence
* Classification
* Sequencing and Seriation
* Geometry
Literacy:
* Vocabulary
* Speech

188
APPENDIX B
STUDY INFORMATION LETTER
Dear Parent/Care-giver of participant,
This letter serves to inform you about the study that will be conducted at your child‟s Early
Childhood Centre. The study is entitled: Intellectual development in the Early Childhood.
This study conforms to all the standards of a Master‟s study as set out by the University of
South Africa (UNISA).
The participants in this study are children between the ages of two and four years old that
attend one of three Early Childhood Centres across Port Elizabeth. Forty (40) children
between the ages of 2 and 4 were selected to participate in the study; both males and females
were included.
The testing will consist of:
A week of pre-testing, which will take place prior to the commencement of the
intervention programme,
An eight-week intervention programme,
A final week of post-testing after intervention period.
The primary aim of this study will be:
To develop a programme to enhance intellectual development in order to examine the
effects of stimulation of mathematics, literacy, life skills and general knowledge
concepts in young children,
To evaluate the methods of implementation that aid the development of the intellectual
concepts,
To indicate how these concepts can be provided for in the early Childhood Centre.
At no stage during the course of the study will any participants be placed at risk. Each
participant‟s name will be coded and only the codes will be used during the data analysis
stage of the study in order to maintain a high level of confidentiality. The identity of
participants will not be made public.
Thank you for your willingness to participate.
Yours sincerely,
Lauren Stretch
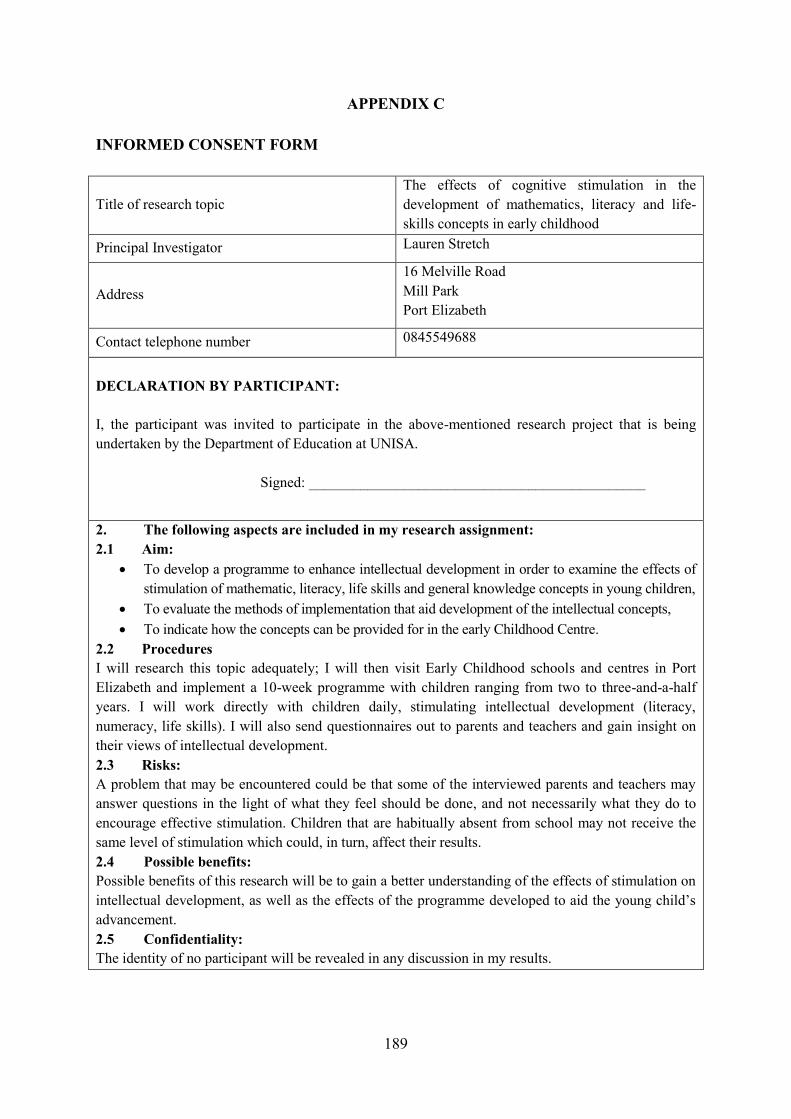
189
APPENDIX C
INFORMED CONSENT FORM
Title of research topic
The effects of cognitive stimulation in the
development of mathematics, literacy and life-
skills concepts in early childhood
Principal Investigator Lauren Stretch
Address
16 Melville Road
Mill Park
Port Elizabeth
Contact telephone number 0845549688
DECLARATION BY PARTICIPANT:
I, the participant was invited to participate in the above-mentioned research project that is being
undertaken by the Department of Education at UNISA.
Signed: ______________________________________________
2. The following aspects are included in my research assignment:
2.1 Aim:
To develop a programme to enhance intellectual development in order to examine the effects of
stimulation of mathematic, literacy, life skills and general knowledge concepts in young children,
To evaluate the methods of implementation that aid development of the intellectual concepts,
To indicate how the concepts can be provided for in the early Childhood Centre.
2.2 Procedures
I will research this topic adequately; I will then visit Early Childhood schools and centres in Port
Elizabeth and implement a 10-week programme with children ranging from two to three-and-a-half
years. I will work directly with children daily, stimulating intellectual development (literacy,
numeracy, life skills). I will also send questionnaires out to parents and teachers and gain insight on
their views of intellectual development.
2.3 Risks:
A problem that may be encountered could be that some of the interviewed parents and teachers may
answer questions in the light of what they feel should be done, and not necessarily what they do to
encourage effective stimulation. Children that are habitually absent from school may not receive the
same level of stimulation which could, in turn, affect their results.
2.4 Possible benefits:
Possible benefits of this research will be to gain a better understanding of the effects of stimulation on
intellectual development, as well as the effects of the programme developed to aid the young child‟s
advancement.
2.5 Confidentiality:
The identity of no participant will be revealed in any discussion in my results.
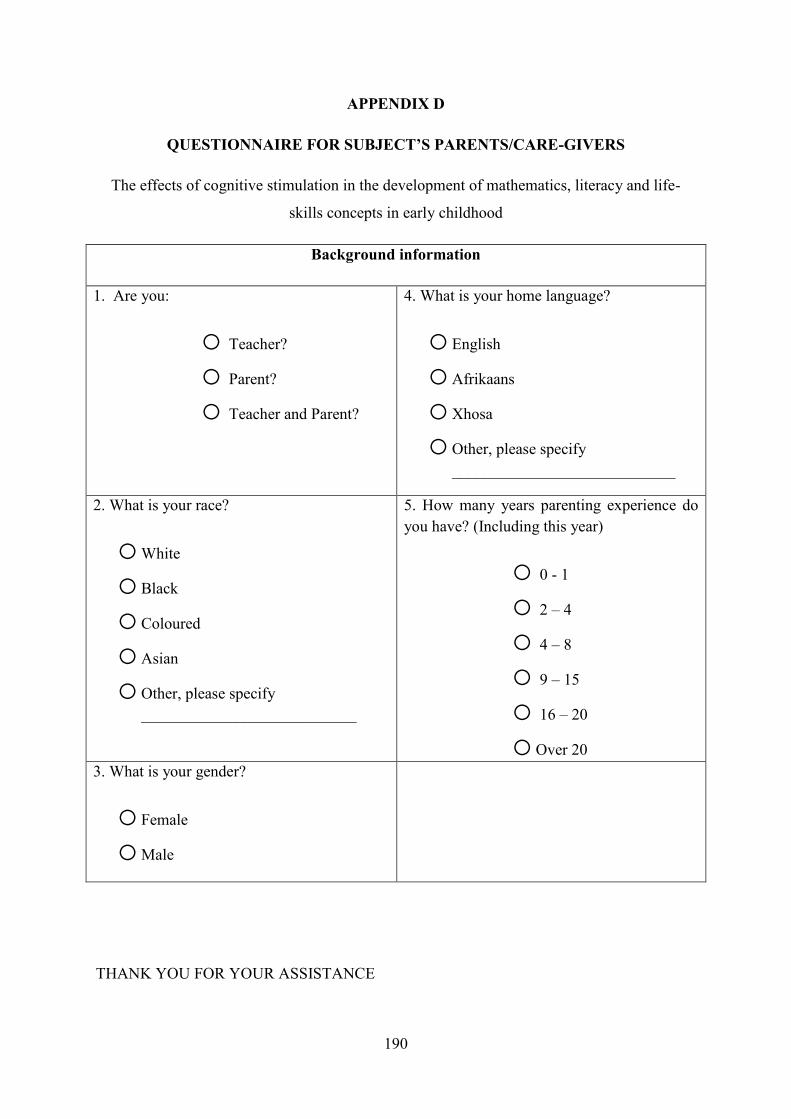
190
APPENDIX D
QUESTIONNAIRE FOR SUBJECT’S PARENTS/CARE-GIVERS
The effects of cognitive stimulation in the development of mathematics, literacy and life-
skills concepts in early childhood
Background information
1. Are you:
o Teacher?
o Parent?
o Teacher and Parent?
4. What is your home language?
o English
o Afrikaans
o Xhosa
o Other, please specify
____________________________
2. What is your race?
o White
o Black
o Coloured
o Asian
o Other, please specify
___________________________
5. How many years parenting experience do
you have? (Including this year)
o 0 - 1
o 2 – 4
o 4 – 8
o 9 – 15
o 16 – 20
o Over 20
3. What is your gender?
o Female
o Male
THANK YOU FOR YOUR ASSISTANCE

191
1. What do you feel are parents’ responsibilities with regard to their child‟s learning and
development?
__________________________________________________________________________________
__________________________________________________________________________________
__________________________________________________________________________________
__________________________________________________________________________________
2. What do you feel are teachers’ primary responsibilities with regards to education and
learning?
__________________________________________________________________________________
__________________________________________________________________________________
__________________________________________________________________________________
__________________________________________________________________________________
_________________________________________________________________________________
3. Who do you feel is the child’s primary educator – physically, cognitively, emotionally,
spiritually and socially?
__________________________________________________________________________________
Give reasons for your response:
__________________________________________________________________________________
__________________________________________________________________________________
_________________________________________________________________________________
4. Do you feel there is a need for early intervention and stimulation for young children?
Yes No
__________________________________________________________________________________
_________________________________________________________________________________
Give reasons for your response:
__________________________________________________________________________________
__________________________________________________________________________________
_________________________________________________________________________________
5. Rate the percentage of the importance you place on stimulating your child cognitively
_____%
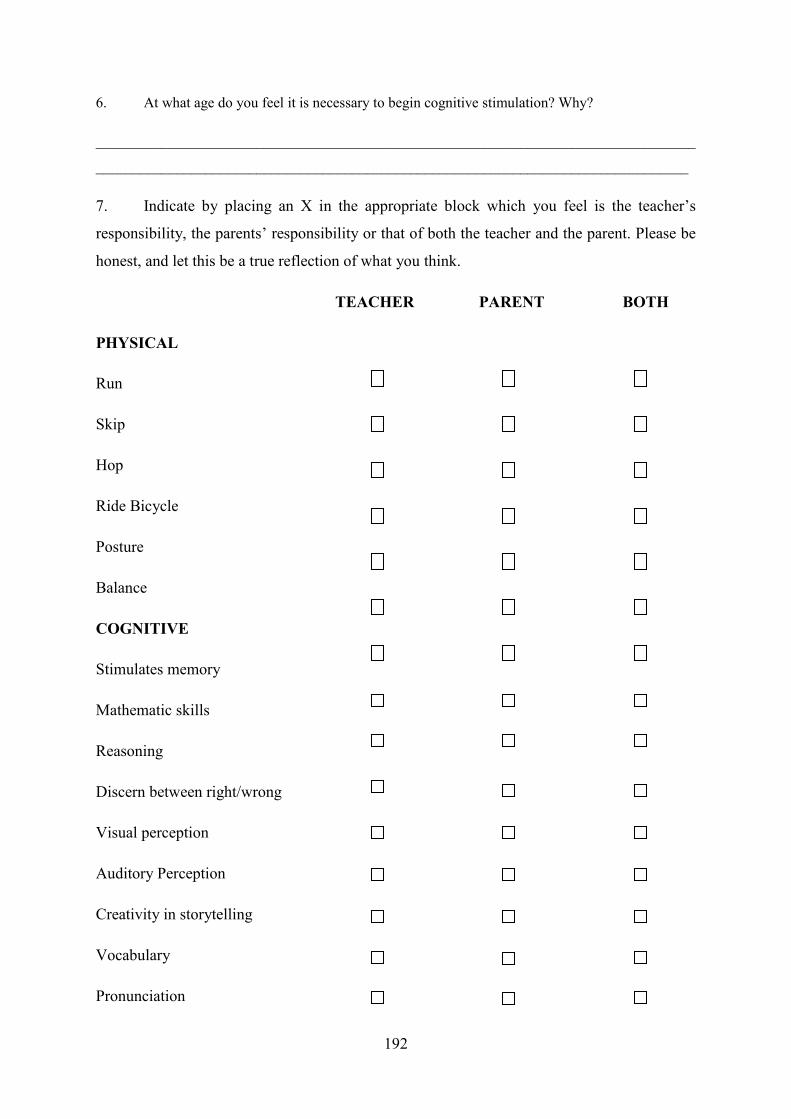
192
6. At what age do you feel it is necessary to begin cognitive stimulation? Why?
__________________________________________________________________________________
_________________________________________________________________________________
7. Indicate by placing an X in the appropriate block which you feel is the teacher‟s
responsibility, the parents‟ responsibility or that of both the teacher and the parent. Please be
honest, and let this be a true reflection of what you think.
TEACHER PARENT BOTH
PHYSICAL
Run
Skip
Hop
Ride Bicycle
Posture
Balance
COGNITIVE
Stimulates memory
Mathematic skills
Reasoning
Discern between right/wrong
Visual perception
Auditory Perception
Creativity in storytelling
Vocabulary
Pronunciation
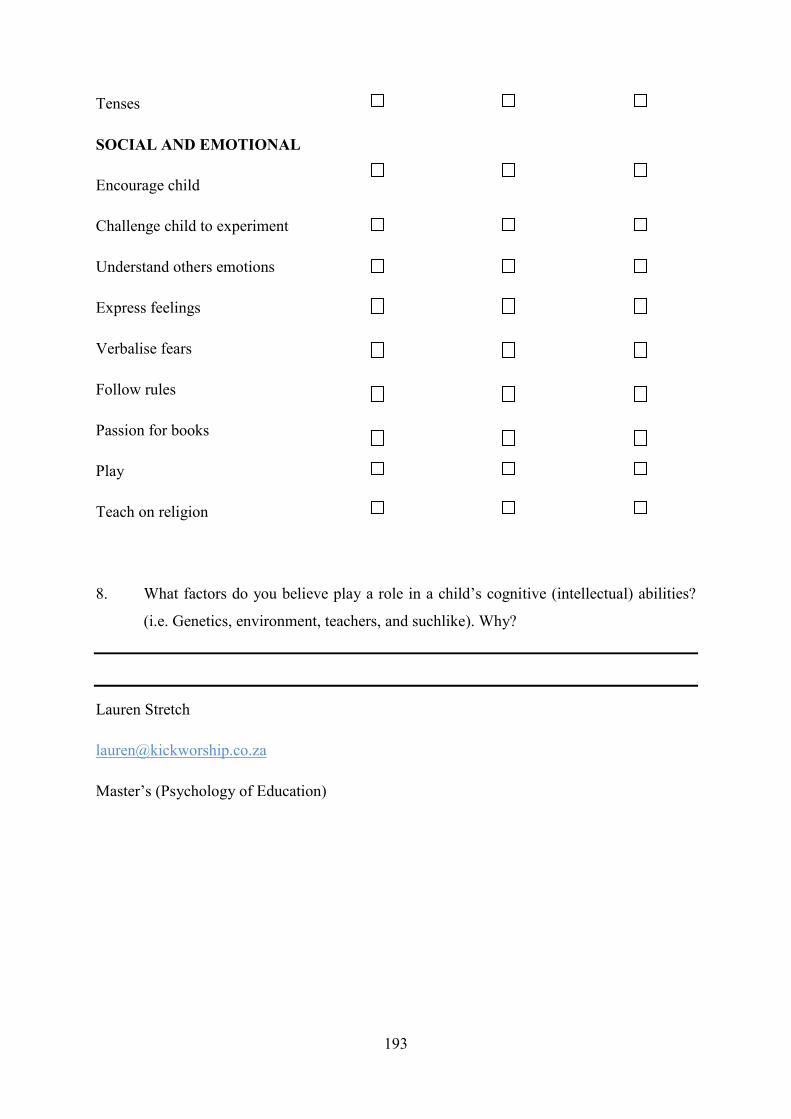
193
Tenses
SOCIAL AND EMOTIONAL
Encourage child
Challenge child to experiment
Understand others emotions
Express feelings
Verbalise fears
Follow rules
Passion for books
Play
Teach on religion
8. What factors do you believe play a role in a child‟s cognitive (intellectual) abilities?
(i.e. Genetics, environment, teachers, and suchlike). Why?
Lauren Stretch
Master‟s (Psychology of Education)
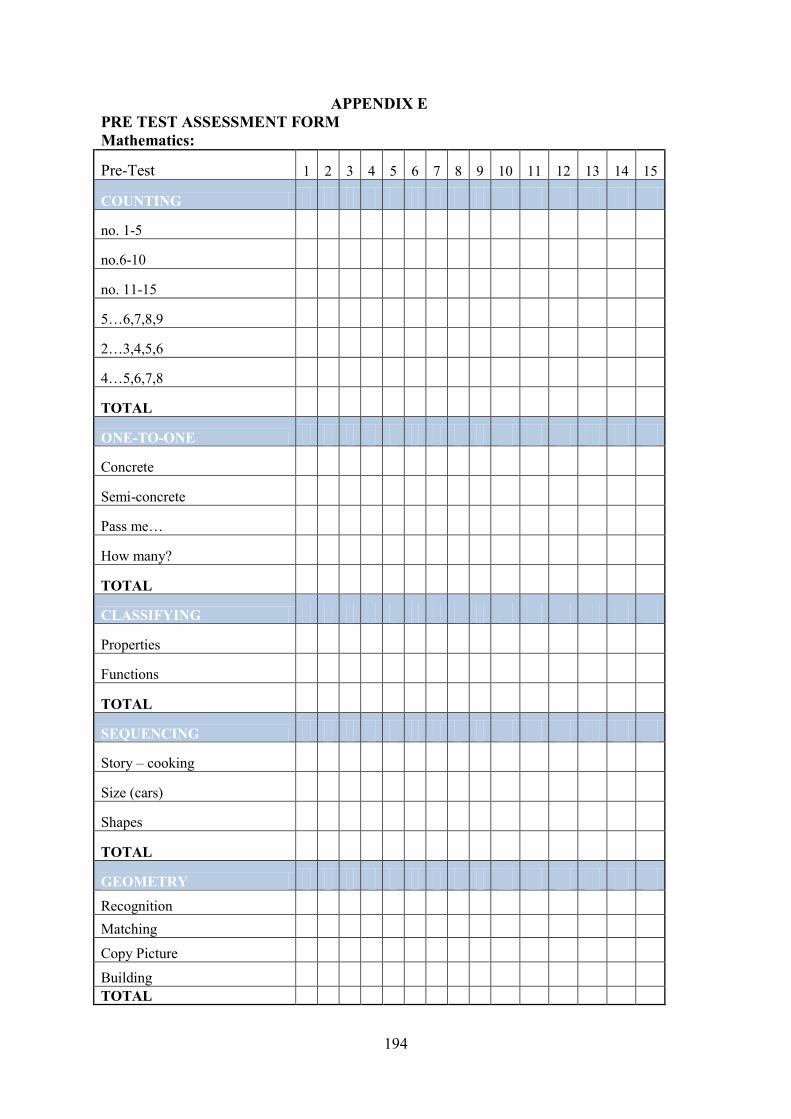
194
APPENDIX E
PRE TEST ASSESSMENT FORM
Mathematics:
Pre-Test 1 2 3 4 5 6 7 8 9 10 11 12 13 14 15
COUNTING
no. 1-5
no.6-10
no. 11-15
5…6,7,8,9
2…3,4,5,6
4…5,6,7,8
TOTAL
ONE-TO-ONE
Concrete
Semi-concrete
Pass me…
How many?
TOTAL
CLASSIFYING
Properties
Functions
TOTAL
SEQUENCING
Story – cooking
Size (cars)
Shapes
TOTAL
GEOMETRY
Recognition
Matching
Copy Picture
Building
TOTAL

195
Language:
Pre-Test 1 2 3 4 5 6 7 8 9 10 11 12 13 14 15
VOCABULARY
Rhyme
Name Body parts
Answer q's
things at the beach
name what see
Animal names
TOTAL
SPEECH
answer q's
clarity of speech
sentence structure
pronunciation
TOTAL
LISTENING
note mistakes
instrcutions - 1
instructions- 2
instrcutions - 3
animal sounds - match
TOTAL
READING
Read picture
TOTAL
WRITING
Draw pic of self
Copy picture
TOTAL
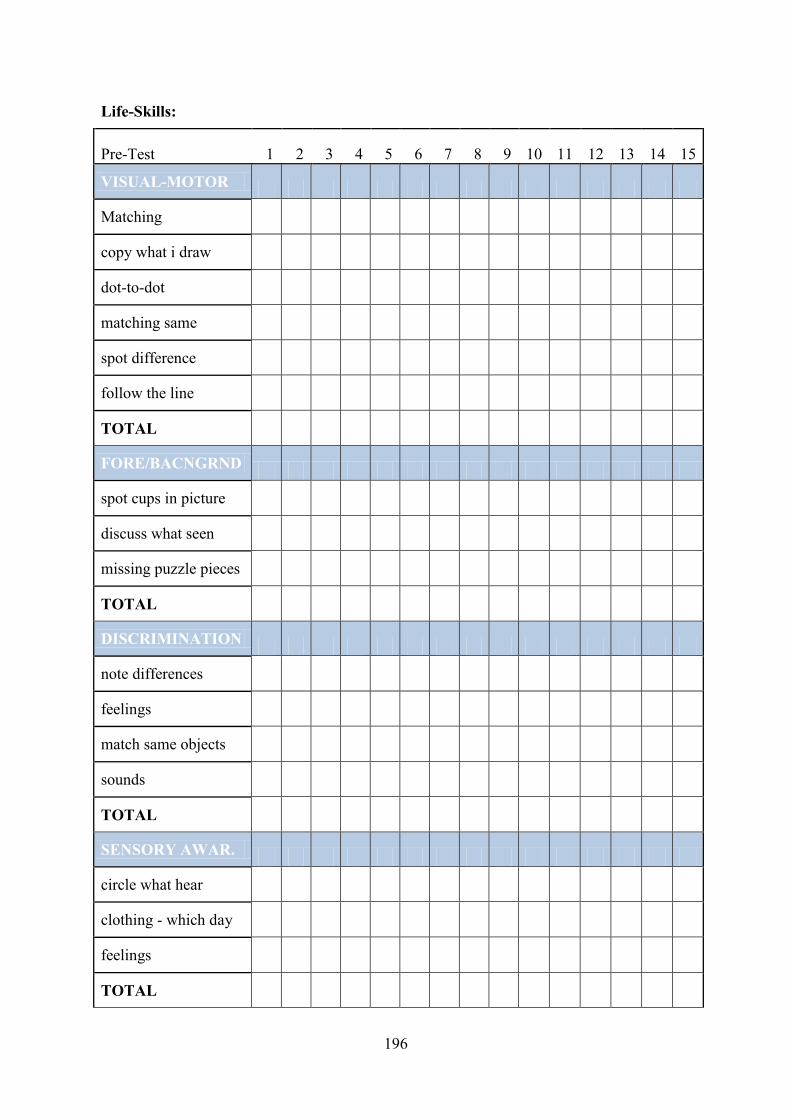
196
Life-Skills:
Pre-Test 1 2 3 4 5 6 7 8 9 10 11 12 13 14 15
VISUAL-MOTOR
Matching
copy what i draw
dot-to-dot
matching same
spot difference
follow the line
TOTAL
FORE/BACNGRND
spot cups in picture
discuss what seen
missing puzzle pieces
TOTAL
DISCRIMINATION
note differences
feelings
match same objects
sounds
TOTAL
SENSORY AWAR.
circle what hear
clothing - which day
feelings
TOTAL
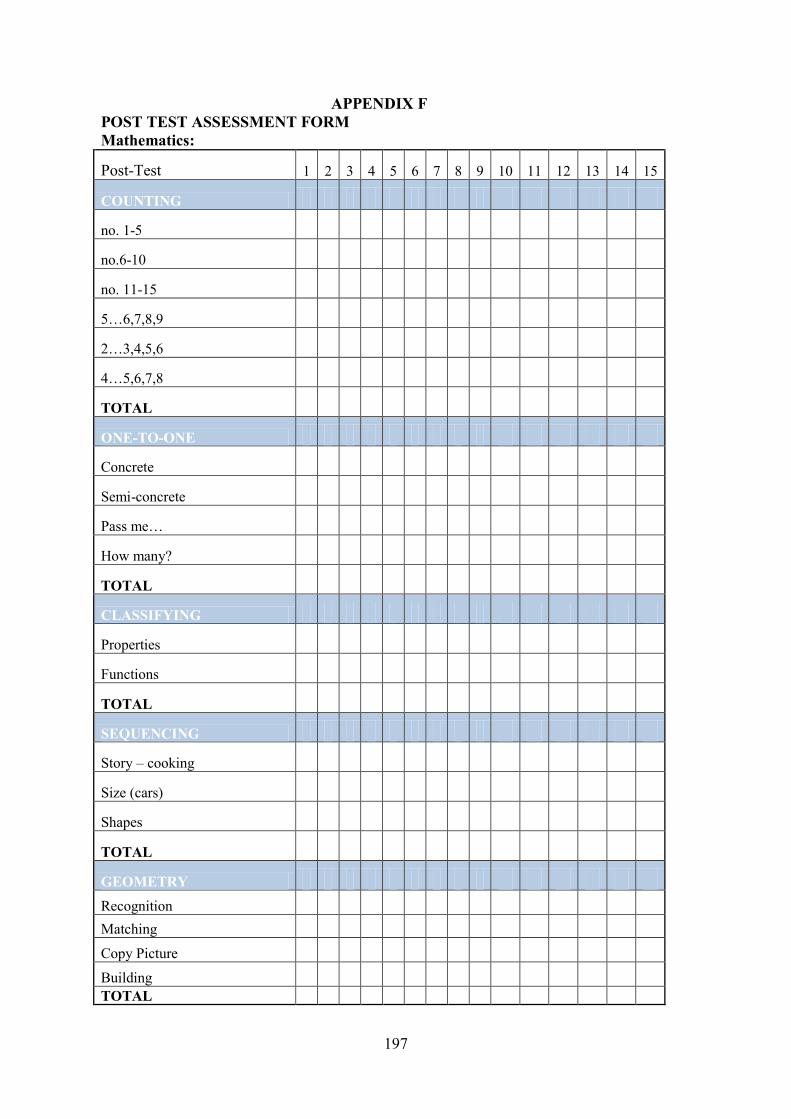
197
APPENDIX F
POST TEST ASSESSMENT FORM
Mathematics:
Post-Test 1 2 3 4 5 6 7 8 9 10 11 12 13 14 15
COUNTING
no. 1-5
no.6-10
no. 11-15
5…6,7,8,9
2…3,4,5,6
4…5,6,7,8
TOTAL
ONE-TO-ONE
Concrete
Semi-concrete
Pass me…
How many?
TOTAL
CLASSIFYING
Properties
Functions
TOTAL
SEQUENCING
Story – cooking
Size (cars)
Shapes
TOTAL
GEOMETRY
Recognition
Matching
Copy Picture
Building
TOTAL
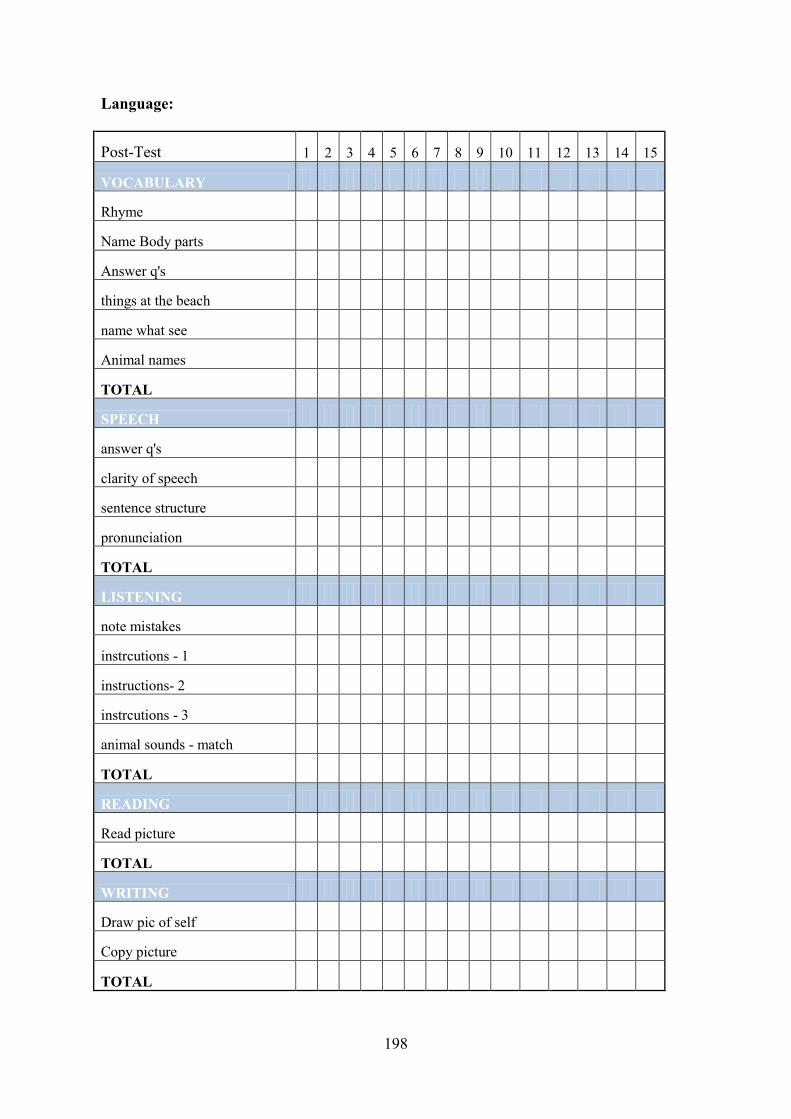
198
Language:
Post-Test 1 2 3 4 5 6 7 8 9 10 11 12 13 14 15
VOCABULARY
Rhyme
Name Body parts
Answer q's
things at the beach
name what see
Animal names
TOTAL
SPEECH
answer q's
clarity of speech
sentence structure
pronunciation
TOTAL
LISTENING
note mistakes
instrcutions - 1
instructions- 2
instrcutions - 3
animal sounds - match
TOTAL
READING
Read picture
TOTAL
WRITING
Draw pic of self
Copy picture
TOTAL

199
Life-Skills:
Post-Test 1 2 3 4 5 6 7 8 9 10 11 12 13 14 15
VISUAL-MOTOR
Matching
copy what i draw
dot-to-dot
matching same
spot difference
follow the line
TOTAL
FORE/BACNGRND
spot cups in picture
discuss what seen
missing puzzle pieces
TOTAL
DISCRIMINATION
note differences
feelings
match same objects
sounds
TOTAL
SENSORY AWAR.
circle what hear
clothing - which day
feelings
TOTAL

200
APPENDIX G
MATHEMATICS SCORING SCALE
COUNTING
1. No 1-5
1= cannot count from 1 to 5, did not attempt counting
3= counts from 1 to 5, but with errors
5= can count from 1 to 5 with ease
2. No 6-10
1= cannot count from 6 to 10, did not attempt counting
3= counts from 6 to 10, but with errors
5= can count from 6 to 10 with ease
3. No 11-15
1= cannot count from 11 to 15, did not attempt counting
3= counts from 11 to 15, but with errors
5= can count from 11 to 15 with ease
4. 5... 6,7,8,9
1= cannot carry on counting from 5, did not attempt counting on
3= attempts counting on from 5, but with errors
5= can count on from 5 with ease
5. 2...3,4,5,6
1= cannot carry on counting from 2, did not attempt counting on
3= attempts counting on from 2, but with errors
5= can count on from 2 with ease
6. 4...5,6,7,8
1= cannot carry on counting from 4, did not attempt counting on
3= attempts counting on from 4, but with errors
5= can count on from 4 with ease
ONE-TO-ONE CORRESPONDENCE
1. Concrete
1= cannot count concrete objects, did not attempt counting
3= counts concrete objects, but with errors
5= can count concrete objects with ease
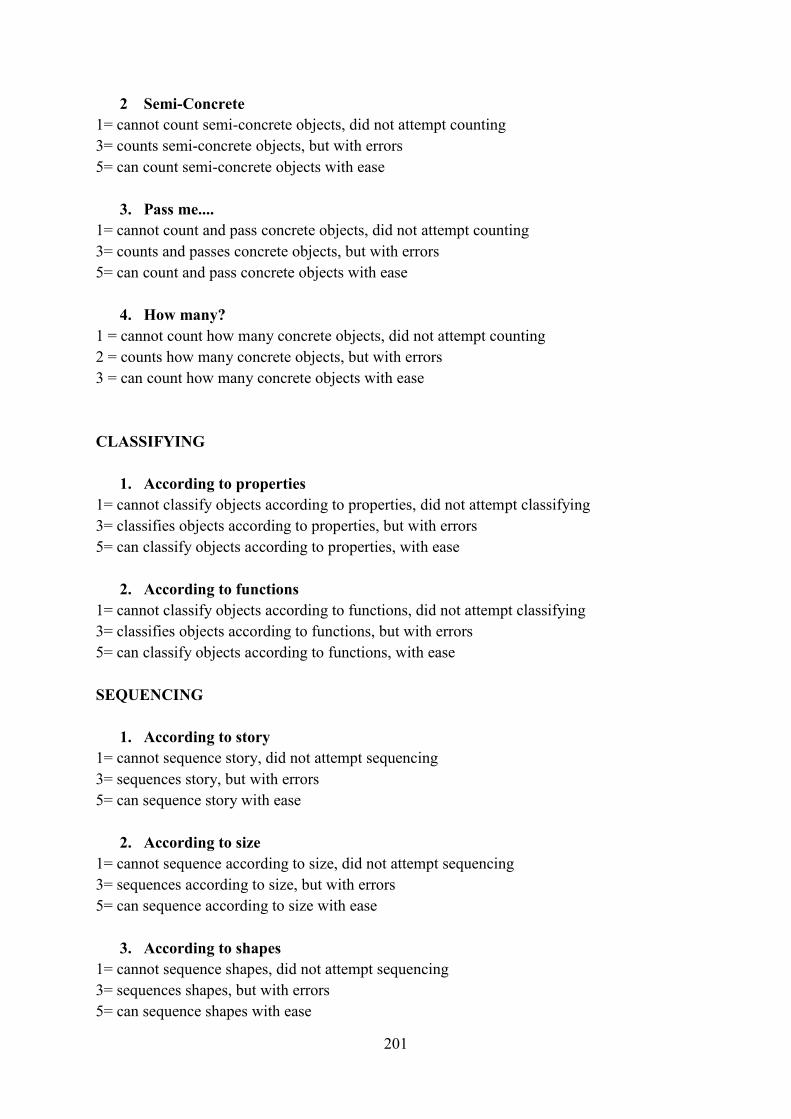
201
2 Semi-Concrete
1= cannot count semi-concrete objects, did not attempt counting
3= counts semi-concrete objects, but with errors
5= can count semi-concrete objects with ease
3. Pass me....
1= cannot count and pass concrete objects, did not attempt counting
3= counts and passes concrete objects, but with errors
5= can count and pass concrete objects with ease
4. How many?
1 = cannot count how many concrete objects, did not attempt counting
2 = counts how many concrete objects, but with errors
3 = can count how many concrete objects with ease
CLASSIFYING
1. According to properties
1= cannot classify objects according to properties, did not attempt classifying
3= classifies objects according to properties, but with errors
5= can classify objects according to properties, with ease
2. According to functions
1= cannot classify objects according to functions, did not attempt classifying
3= classifies objects according to functions, but with errors
5= can classify objects according to functions, with ease
SEQUENCING
1. According to story
1= cannot sequence story, did not attempt sequencing
3= sequences story, but with errors
5= can sequence story with ease
2. According to size
1= cannot sequence according to size, did not attempt sequencing
3= sequences according to size, but with errors
5= can sequence according to size with ease
3. According to shapes
1= cannot sequence shapes, did not attempt sequencing
3= sequences shapes, but with errors
5= can sequence shapes with ease
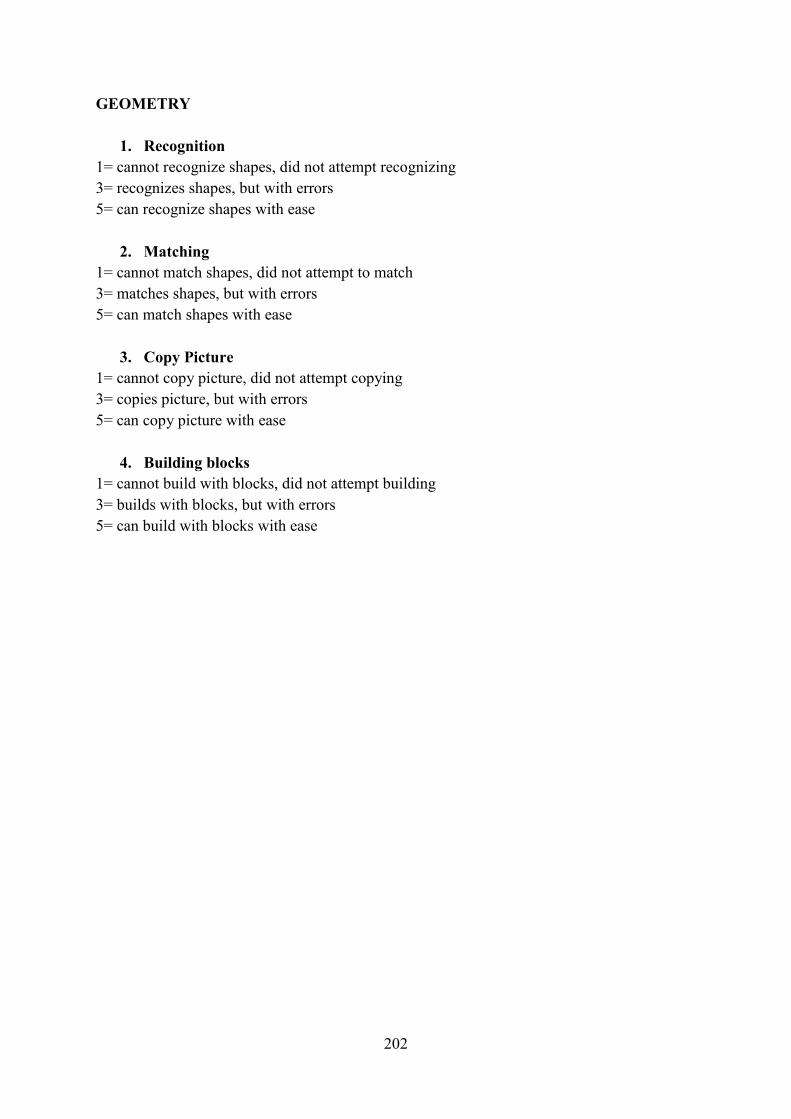
202
GEOMETRY
1. Recognition
1= cannot recognize shapes, did not attempt recognizing
3= recognizes shapes, but with errors
5= can recognize shapes with ease
2. Matching
1= cannot match shapes, did not attempt to match
3= matches shapes, but with errors
5= can match shapes with ease
3. Copy Picture
1= cannot copy picture, did not attempt copying
3= copies picture, but with errors
5= can copy picture with ease
4. Building blocks
1= cannot build with blocks, did not attempt building
3= builds with blocks, but with errors
5= can build with blocks with ease
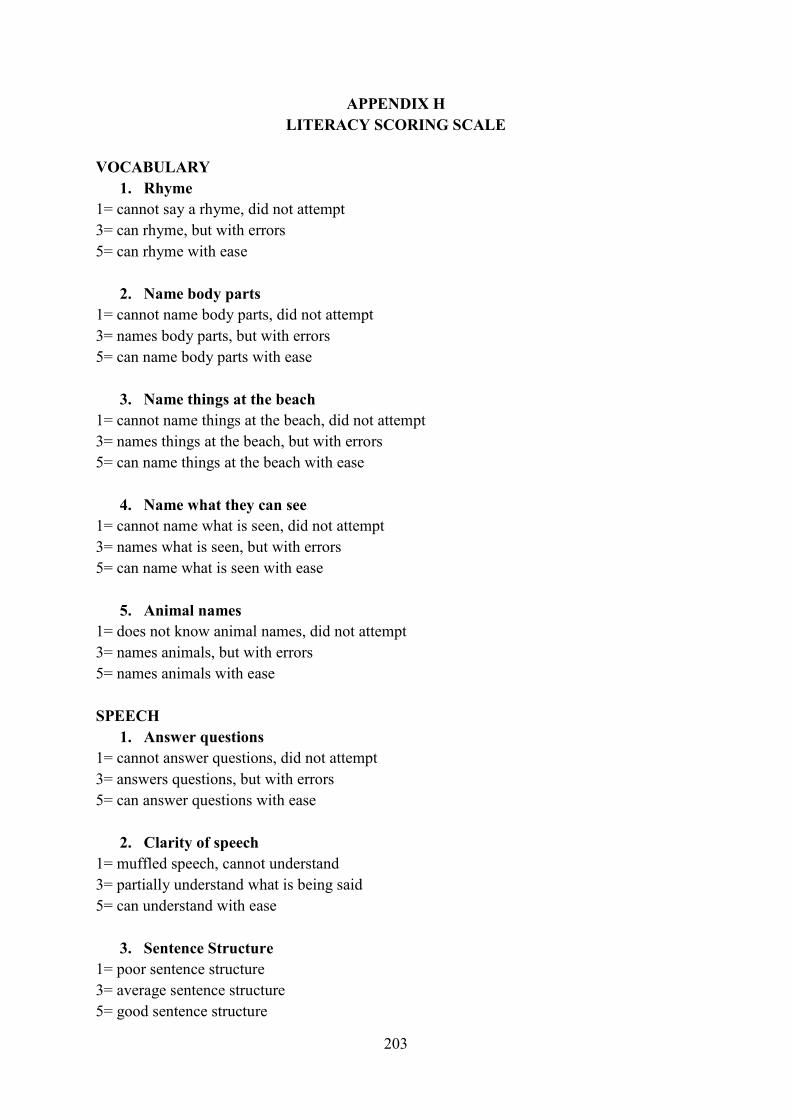
203
APPENDIX H
LITERACY SCORING SCALE
VOCABULARY
1. Rhyme
1= cannot say a rhyme, did not attempt
3= can rhyme, but with errors
5= can rhyme with ease
2. Name body parts
1= cannot name body parts, did not attempt
3= names body parts, but with errors
5= can name body parts with ease
3. Name things at the beach
1= cannot name things at the beach, did not attempt
3= names things at the beach, but with errors
5= can name things at the beach with ease
4. Name what they can see
1= cannot name what is seen, did not attempt
3= names what is seen, but with errors
5= can name what is seen with ease
5. Animal names
1= does not know animal names, did not attempt
3= names animals, but with errors
5= names animals with ease
SPEECH
1. Answer questions
1= cannot answer questions, did not attempt
3= answers questions, but with errors
5= can answer questions with ease
2. Clarity of speech
1= muffled speech, cannot understand
3= partially understand what is being said
5= can understand with ease
3. Sentence Structure
1= poor sentence structure
3= average sentence structure
5= good sentence structure
204
4. Pronunciation
1= poor pronunciation
3= average pronunciation
5= good pronunciation
LISTENING
1. Notes mistakes
1= cannot note a mistake when listening to a story
3= notes some mistakes when listening to a story
5= notes mistakes with ease
2. Listens to instructions (1)
1= cannot listen to instructions
3= attempts to listen to instructions
5= listens to instructions with ease
3. Listens to instructions (2)
1= cannot listen to instructions
3= attempts to listen to instructions
5= listens to instructions with ease
4. Listens to instructions (3)
1= cannot listen to instructions
3= attempts to listen to instructions
5= listens to instructions with ease
5. Listens to and identifies animal sounds
1= cannot identify sound
3= attempts to identify the sound
5= identifies sounds with ease
READING
1. Read and interpret a picture
1= cannot read and interpret a picture, did not attempt
3= attempts to read and interpret, but with errors
5= can read and interpret pictures with ease
WRITING
1. Draw a picture of self
1= cannot draw a picture of self, did not attempt
3= attempts to draw picture of self, not very recognizable
5= draws picture of self with ease

205
2. Draw a picture of self
1= cannot copy a picture, did not attempt
3= attempts to copy a picture, not very recognizable
5= copy picture with ease

206
APPENDIX I
LIFE-SKILLS SCORING SCALE
VISUAL MOTOR
1. Matching
1= cannot match like concepts, did not attempt
3= can match, but with errors
5= can match concepts with ease
2. Copy what I draw
1= cannot copy what I draw, did not attempt
3= can copy, but with errors
5= can copy with ease
3. Dot-to-Dot
1= cannot do dot-to-dot, did not attempt
3= can do dot-to-dot, but with errors
5= can do dot-to-dot with ease
4. Matching same
1= cannot match the same, did not attempt
3= can match the same, but with errors
5= can match the same with ease
5. Spot the difference
1= cannot spot the difference, did not attempt
3= can spot the difference, but with errors
5= can spot the difference with ease
6. Follow the line
1= cannot follow the line, did not attempt
3= can follow the line, but with errors
5= can follow the line with ease
FOREGROUND/BACKGROUND
1. Spot objects in a picture
1= cannot spot objects in a picture, did not attempt
3= can spot objects in a picture, but with errors
5= can spot objects in a picture with ease
2. Discuss what is seen in a picture
1= cannot discuss what is seen, did not attempt
3= can discuss what is seen, but with errors
5= can discuss what is seen with ease

207
3. Fit in missing puzzle pieces
1= cannot fit in the missing puzzle pieces, did not attempt
3= can fit in the missing puzzle pieces, but with errors
5= can fit in the missing puzzle pieces with ease
DISCRIMINATION
1. Note differences
1= cannot note differences, did not attempt
3= can note differences, but with errors
5= can note differences with ease
2. Express feelings
1= cannot express feelings, did not attempt
3= can express feelings, but with errors
5= can express feelings with ease
3. Match similar objects
1= cannot match similar objects, did not attempt
3= can match similar objects, but with errors
5= can match similar objects with ease
4. Recognize sounds
1= cannot recognize sounds, did not attempt
3= can recognize sounds, but with errors
5= can recognize sounds with ease
SENSORY AWARENESS
1. Circle the objects which are audible
1= cannot note audible objects, did not attempt
3= can note audible objects, but with errors
5= can note audible objects with ease
1. Clothing – summer/winter, day/night
1= cannot recognize clothing types, did not attempt
3= can recognize clothing types, but with errors
5= can recognize clothing types with ease
1. Recognize feelings
1= cannot recognize feelings, did not attempt
3= can recognize feelings, but with errors
5= can recognize feelings with ease
208
APPENDIX J
LANGUAGE QUALITY ASSURANCE CERTIFICATE