uk audit annual report insights14 full survey
TRANSCRIPT

8/10/2019 Uk Audit Annual Report Insights14 Full Survey
http://slidepdf.com/reader/full/uk-audit-annual-report-insights14-full-survey 1/144
Annual report insights 2014
Providing a clear steerwww.deloitte.co.uk/AnnualReportInsights @DeloitteUK #DeloitteReportInsights

8/10/2019 Uk Audit Annual Report Insights14 Full Survey
http://slidepdf.com/reader/full/uk-audit-annual-report-insights14-full-survey 2/144
8/10/2019 Uk Audit Annual Report Insights14 Full Survey
http://slidepdf.com/reader/full/uk-audit-annual-report-insights14-full-survey 3/144
Contents
1. Executive summary 2
2. How to use this document 5
3. Regulatory overview 7
4. Survey objectives 20
5. Overall impressions 21
6. Summary material 29
7. The strategic report 37
8. Principal risks 58
9. Key performance indicators 67
10. Going concern 80
11. Effective company stewardship 86
12. The work of the audit committee 96
13. The auditor’s report 102
14. Primary statements 111
15. Notes to the nancial statements 122
Appendix 1 – Key messages on directors’ remuneration reports 135
Appendix 2 – Glossary of terms and abbreviations 138
Other resources available 141

8/10/2019 Uk Audit Annual Report Insights14 Full Survey
http://slidepdf.com/reader/full/uk-audit-annual-report-insights14-full-survey 4/144
Welcome to the latest edition of our annual report insights report, ‘Providing a clear steer’.It has been an eventful year with the introduction of the new strategic report,debate around going concern and risk reporting and the need for directors tostate that their annual report and accounts as a whole were ‘fair, balanced andunderstandable’.
Our report looks at how companies have gone about dealing with these challenges,the extent to which they have met the requirements and innovated, plus how wellthey have linked the narrative reporting to the nancial reporting. And from thismass of information we have identied areas for improvement as well as providingbest practice examples, enabling companies to tell their stories effectively andprovide a clear steer to their readers.
Here Veronica Poole, head of UK corporate reporting within Deloitte, and WilliamTouche, UK head of corporate governance within Deloitte, draw from theirexperience of the year, share their insight and thoughts on the highlights from thesurvey and look at the challenges ahead.
Narrative reportingQ: Companies were really up against it last year. How well did they cope withall the changes they had to face?A: Overall I think they have done well. All hundred companies surveyed includeda strategic report although they really struggled to cut clutter. While we hadhoped that the size of reports would start to fall, instead they have risen again.The average length of an annual report is up from 122 to 132 pages, much of itdriven by an increase in the length of narrative reporting, in particular the newstyle remuneration reports. But on the plus side some companies have used theopportunity presented by all the changes to restructure their narrative reporting.This is important and it will hopefully give them a good foundation to embrace theFinancial Reporting Council’s latest messages on clear and concise reporting.
Q: With reports getting longer how cohesive did they tend to be in tellingtheir story? Were preparers managing to link together all the differentcomponents?A: Somewhat disappointingly there was a continued lack of cohesiveness, or inthe FRC’s words linkage, between the story told in the narrative and the numbersin the back. Whilst the majority of companies made efforts to link some parts oftheir annual report, in particular the discussion around strategy to their KPIs, only29% showed up-front, in their summary pages, how their report as a whole linkedtogether. But all in all, companies are making steps in the right direction.
Q: What does the survey tell us about non-GAAP measures? They have beenexercising regulators recently and there is a raft of proposals from variousregulators and other bodies.A: Non-GAAP measures continue to be an important feature of annual reports:86% of companies presented them in their summary pages and of those over 60%gave them greater prominence than associated GAAP measures. Furthermore, mostcompanies use them on the face of the income statement. These ndings will notplease regulators. IOSCO is currently consulting on the use of non-GAAP measuresand ESMA is expected to publish its guidelines on the subject before the year is out,so this is certainly an area that companies need to think about carefully when theyprepare this year’s accounts.
Q: As we move into the new reporting season what other corporate reporting
issues should companies be focusing on at this time?A: The new proposals around the reporting of going concern and risk reporting willcome into effect for periods commencing on or after 1 October this year and meritclose attention. Country-by-country reporting also comes into force from 1 January2015 and will have a big impact for those in the extractive industries.
1. Executive summary
2

8/10/2019 Uk Audit Annual Report Insights14 Full Survey
http://slidepdf.com/reader/full/uk-audit-annual-report-insights14-full-survey 5/144

8/10/2019 Uk Audit Annual Report Insights14 Full Survey
http://slidepdf.com/reader/full/uk-audit-annual-report-insights14-full-survey 6/144
Financial statementsQ: Moving back through the book to the nancial statements what were thehighlights amongst the back half of the report?A: A few companies are innovating in areas like presentation of accounting policiesand are including narrative reporting in their nancial statements. And non-GAAPmeasures are proving as popular as ever. As mentioned, some 68% included suchmetrics in their income statements. Encouragingly, many were adhering to the FRC’sreminders at the end of last year about the use of exceptional items, in that theywere not describing recurring items as exceptional. And, even though there waspressure to cut clutter, some companies still included voluntary disclosures. Some44% included net debt reconciliations or similar information and 10% includedinsight on tax governance and strategy.
Q: And what are the challenges ahead?A: 2014 will be the rst year that many companies have had the IASB’s package onconsolidations to deal with, including all the new disclosures required byIFRS 12. Looking further ahead there is the newly published standard on revenuerecognition to prepare for.
And nallyQ: Integrated reporting was a much discussed topic through the year. Howfar did the discussions make it through into the reporting?A: With the focus on growth, long term investment and the broader role ofbusiness in the society, integrated reporting offers an excellent opportunityfor companies to tell their value creation story. Although only ve companiessurveyed mentioned integrated reporting, the vast majority, 80%, already discussvalue creation in their reports. Of course, integrated reporting is not really justabout reporting, it is about integrated thinking and behaviours, integrated fromstrategy and business model to business performance, from internal performancemanagement measures to external reporting.
The strategic report framework in the UK creates an excellent enabling environment
and allows companies to experiment and innovate. Our survey and its ndings willalso help companies to innovate and enhance their reporting by drawing on themany best practice examples we have provided. Hopefully, with the developmentsaround integrated reporting and the FRC’s encouragement for clear and concisereporting companies will feel empowered in their efforts to provide a clear steer tothe readers of their reports.
4

8/10/2019 Uk Audit Annual Report Insights14 Full Survey
http://slidepdf.com/reader/full/uk-audit-annual-report-insights14-full-survey 7/144
This publication has been written with two main aims in mind. As well as being a survey, looking athistorical trends in corporate reporting, it is also designed as a tool to help preparers develop andimprove the structure and content of their annual report.
Therefore, whether you’re an audit committee member, you work in investorrelations, you’re a company secretary or a nance director, there is something inhere for you.
As well as statistics and insight into historical trends and current reporting practice,there are thoughts and ideas around the impact of current and future changes inreporting requirements, along with plenty of examples of better practice identied
from companies across the FTSE.
In our accompanying guide, ‘A clear steer for your annual report’ , we havedistilled a wealth of ideas of pitfalls to avoid, regulatory developments to watchout for, ways in which you can choose to go above and beyond the minimumrequirements and nally, areas that could be pruned to ‘cut the clutter’.
What are the benets of a good annual report?The new narrative reporting legislation introduced last year provided preparerswith an opportunity to revitalise their reports and improve communication withstakeholders. With a period of relative stability now upon us, at least in terms ofnarrative reporting, this publication provides inspiration on how to build on these
existing reports, drawing in best practice and suggestions on how to successfullyinnovate. Investing time and effort to prepare a good annual report brings with itmany benets, a few of which are briey outlined below.
• Investors are one of the main users of annual reports, but it’s not just existinginvestors who look at it, it’s potential investors too – a good annual report withclear communication of a business’s performance and its prospects can helpattract additional investment, while a bad report could make a potential investorthink twice.
• A strong annual report will provide good publicity with other stakeholders too,whether it be employees, customers, suppliers or society at large.
• The directors are responsible for preparing an annual report, including thenancial statements, and under the 2012 UK Corporate Governance Code arerequired to state that they consider the annual report and the accounts, taken asa whole, is “fair, balanced and understandable”. A strong report will therefore
reect well on a company’s governance.
• The FRC’s Conduct Committee and its Financial Reporting Review Panel areresponsible for monitoring the quality of corporate reporting in the UK.For obvious reasons it is desirable to avoid criticism from the regulator andthe bad publicity this can bring.
• On a more positive note, prizes are awarded by a number of bodies for the bestannual reports, bringing with them prestige and good publicity.
2. How to use this document
Annual report insights 2014 5

8/10/2019 Uk Audit Annual Report Insights14 Full Survey
http://slidepdf.com/reader/full/uk-audit-annual-report-insights14-full-survey 8/144
Which parts of this document are most relevant to me?The table below will help you identify those areas of the publication likely to be of most interest to you. For those looking for a quick steer on a specic disclosure issue,the electronic version of this pdf contains links to further guidance and examples of good practice within annual reports in all of the chapters listed below.
Theme Chapter What is examined
Backgroundinformation
3 Regulatory overview Sets out the backdrop for the requirements that UK listed companies are subject to, including regulatory hotspots and items that are newfor 2014.
4 Survey objectives Provides an overview of the survey methodology and aims.
Annual reportas a whole
5 Overall impressions Trends in overall report structure, from the length of the report and its various sections to the speed of reporting timetables, thecohesiveness of the report as a whole and the extent to which reports are “integrated reports”.
Narrativereporting
6 Summary material How companies set the scene with an introductory summary section, covering the presentation of both nancial and narrative informationand the ways of linking this effectively to the rest of the report.
7 Strategic report Disclosures in the new strategic report, including the business model, objectives, strategy, presentation of business performance and newcorporate social responsibility information such as gender analysis and human rights issues. Directors’ reports including carbon disclosuresare also examined.
8 Principal risks Principal risks and uncertainties – commonly identied items, mitigating activities, ways of presenting the required information and linkingto other parts of the annual report.
9 Key performanceindicators
Key performance indicators – commonly identied measures, their understandability and linkage to other areas, including directors’remuneration.
10 Going concern The assessment and reporting of going concern, including the impact of the Sharman report and the latest proposals in this area.
Corporategovernance
11 Effective companystewardship
Compliance with the 2012 UK Corporate Governance Code. There are examples of good practice in report ing compliance and presentin gthis information in an interesting and engaging way.
12 The work of the auditcommittee
Audit committee reporting, in particular looking at the impact of the 2012 Code and FRC Guidance on Audit Committees and theinformation around signicant issues the committee has considered in connection with the nancial statements.
Financialstatements
13 The auditor’s report An insight into the new style of enhanced auditor reports, including consistency with audit committee reports.
14 Primary statements The primary statements, use of non-GAAP measures, IAS 1 compliance and tax governance disclosures amongst other items.
15 Notes to the nancialstatements
The notes to the nancial statements, including ideas for cutting clutter, impairment disclosures, discount rates, consistency with narrativereporting and much more.
6

8/10/2019 Uk Audit Annual Report Insights14 Full Survey
http://slidepdf.com/reader/full/uk-audit-annual-report-insights14-full-survey 9/144

8/10/2019 Uk Audit Annual Report Insights14 Full Survey
http://slidepdf.com/reader/full/uk-audit-annual-report-insights14-full-survey 10/144
The world of corporate reporting in the UK
1 Jan 2014 1 Oct 2014 1 Jan 2015 1 Jan 2016 1 Jan 2017 1 Jan 2018
New IFRS consolidation Corporate Governance Proposed date for CMA’s Proposed date for EU’s New revenue IFRS New IFRS for nancialstandards Code changes on going FTSE 350 audit non-nancial plan reporting Instruments concern, risk reporting and tendering changes directors’ remuneration Proposed date for country for country by country reporting
Old UK GAAP superseded
Periods beginning on or after:
Other signicant initiatives underway:
FRC’s clear and conciseinitiative
IASB disclosure initiative ESMA, IOSCO and IFACnon- GAAP measuresconsultaions
Financial reporting labprojects on dividendpolicy and digital reporting
IIRC integrated repotringframework issued inDecember 2013
IASB conceptual frameworkand FRC/Europeancontribution to ‘getting abetter framework’
8

8/10/2019 Uk Audit Annual Report Insights14 Full Survey
http://slidepdf.com/reader/full/uk-audit-annual-report-insights14-full-survey 11/144
Narrative reporting
Existing requirementsSection 415 of the Companies Act 2006 (CA06) requires a directors’ report tobe prepared as part of any UK company’s annual report. All UK companies otherthan those that meet the CA06 denition of “small” are also required to prepare aseparate strategic report, which should be approved by the directors, although thisapproval may be combined with that of the directors’ report, as long as it is clearthat each report has been approved by the board. The strategic report is requiredto contain:
• a fair review of the company’s business;
• a description of the principal risks and uncertainties facing the company; and
• to the extent necessary for an understanding of the development, performanceor position of the company, analysis using nancial key performance indicators(KPIs) and where appropriate, analysis using other KPIs, including informationrelating to environmental and employee matters.
For quoted companies the strategic report should also contain the following(although the rst two items are only required to the extent necessary for anunderstanding of the company’s development, performance or position):
• information on the main trends and factors likely to affect the futuredevelopment, performance and position of the company’s business;
• information on environmental matters, employees and social and communityissues, including any policies in these areas and their effectiveness (if any of thesedisclosures are omitted this should be stated);
• a description of the company’s business model and its strategy (plus its
objectives, as suggested by the UK Corporate Governance Code and the FRC’sguidance on the strategic report – see below); and
• a gender analysis of the parent company’s directors, the group’s seniormanagement and the group’s employees as a whole.
Nowadays, this leaves relatively little content for inclusion in the directors’ report,but for quoted companies one substantial requirement is for certain information ongreenhouse gases emissions to be disclosed therein. Often this is included alongsidecorporate social responsibility disclosures in the strategic report, and cross-referredto from the directors’ report.
Companies have the option to provide shareholders with the strategic report andother specied supplementary material, in place of the full annual report. Thisreplaced the option of providing summary nancial statements.
New
New for 2014The FRC has published nalised guidance on how to prepare astrategic report and providing examples of ways the differentelements can successfully be linked together.
For years ending on or after 1 September 2014, there is a new requirement thata company’s report must either contain all of the information required by ListingRule 9.8.4R in a single identiable section or it must include a cross-reference tableindicating where that information is set out. There are also extensive new disclosurerequirements for companies with a ‘controlling shareholder’ as dened by theListing Rules – broadly one who acting alone, or in concert with others, controlsmore than 30% of the voting rights. Otherwise, it is a relatively quiet year with fewchanges for preparers of narrative reporting to contend with.
Annual report insights 2014 9
8/10/2019 Uk Audit Annual Report Insights14 Full Survey
http://slidepdf.com/reader/full/uk-audit-annual-report-insights14-full-survey 12/144
Hotspots
Regulatory hotspots in 2014The following reect areas that regulators are likely to focus on inreviewing 2014 accounts:
1. The use of non-GAAP measures has been the subject of several recentpronouncements. The FRC has been focusing on how companies determine whatto strip out when presenting such measures, with challenges being raised whererecurring items such as amortisation of intangible assets are excluded. Consistentapplication of a policy in this regard and provision of comparatives is important.Where exceptional debits are stripped out, so should be any similar credits, such asthe reversal of an impairment, even if they arise in different periods.
ESMA’s proposals, expected to be nalised before the year is out, focused moreon the presentation of non-GAAP measures in a company’s communications,in particular their prominence compared to GAAP measures. Other concernsinclude situations where measures used in the narrative reporting are differentfrom those presented to management (as disclosed in the IFRS 8 note) and thosepresented on the face of the income statement. A balanced commentary frommanagement is expected in discussions that utilise adjusted measures.
2. KPIs should be clearly and consistently dened year on year, with an explanationof their calculation and reconciliations to statutory measures where appropriate.Linking them to the company’s strategy, business model, objectives andremuneration policy is a current hot topic.
3. Despite improvements in risk reporting in recent years, principal risks anduncertainties remain an area of regulatory focus. Companies should take care tomake clear their “principal” risks and uncertainties and to describe their mitigatingactivities.
4. Directors’ remuneration reporting was expanded signicantly last year andregulators will continue to scrutinise reports in the second year of the new regulations.Investors are likely to take a continued interest, particularly as this is the rst year inwhich pay will be governed by policies that were subject to a binding vote.
What the future holds
Going concern and risk reportingChanges to the reporting of going concern and risks will be required under therevised version of the UK Corporate Governance Code, effective for periodscommencing on or after 1 October 2014, and are discussed below.
EU proposals for non-nancial reportingIn April 2014 the European Parliament adopted an amendment to the EUAccounting Directive, which would apply to large public interest entities withmore than 500 employees. Although these include listed companies the rules willalso apply to unlisted companies such as banks, insurance companies and othercompanies that are designated as such by Member States. The amendment has stillto be formally adopted but is likely to come into force in the UK by 2016.
Companies within the scope of the directive will be required to disclose informationin their annual reports on environmental, social and employee matters, respectfor human rights, anti-corruption and bribery matters. The disclosure will needto include a description of the policy pursued by the company related to thesematters, the results of these policies and the risks related to these matters and howthe company manages those risks.
To a large extent, these new rules complement the narrative reporting regulationsalready in force in the UK. However, the new Directive will extend the level ofdisclosures required on diversity (for example policies on age, gender, educationaland professional background) and will specically require reporting on bribery andcorruption matters for the rst time. For large unquoted public interest companies,which are not required to include this information in their annual report under theexisting regulations, the implementation of this Directive will represent a biggerchange.
10

8/10/2019 Uk Audit Annual Report Insights14 Full Survey
http://slidepdf.com/reader/full/uk-audit-annual-report-insights14-full-survey 13/144
Integrated reporting
In December 2013 the International Integrated Reporting Council (IIRC) publishedthe rst version of its International Integrated Reporting Framework (<IR>). This setsout a framework for a more holistic approach to business reporting, encompassingnot just the nancial aspects of a business but the human, social and environmentalaspects as well. The Framework is based around three fundamental concepts – thesix capitals (nancial, manufactured, intellectual, human, social and relationship andnatural), the business model and value creation.
Currently there are no plans to mandate the application of integrated reportingin the UK. However, in the FRC’s view following the Guidance should result inreporting that is consistent with the International <IR> Framework.
Further details can be found at www.theiirc.org .
Country-by-country reportingIn August 2014 the Department for Business, Innovation and Skills (BIS) publishedthe response to their March 2014 consultation on the implementation of EU countryby country reporting requirements for “extractive industries”. The requirementsinclude a provision for requiring large undertakings and all public-interest entitiesactive in the extractive industry or the logging of primary forests to prepare andmake public a report on payments made to governments on an annual basis.
Although the EU Directive permits the information either to be contained in thecompany’s annual nancial report or in a separate stand-alone report, BIS willrequire that UK companies prepare a separate stand-alone report. The UK willintroduce the new requirement for nancial years beginning on or after 1 January2015, one year earlier than required by the Directive.
The Financial Conduct Authority has also consulted on the implementation of theequivalent change to the Transparency Directive. This will require all “extractiveindustries” companies with securities admitted to trading on an EEA RegulatedMarket for which the FCA is the competent authority to prepare and le a similarreport; again, the FCA proposes that these requirements will apply for nancialyears beginning on or after 1 January 2015.
Link to survey ndings
Chapters 6 to 10 of this publication examine the existing practices around narrativereporting, excluding corporate governance disclosures.
Where to nd out more
FRC’s guidance on preparing a strategic report
Need to know newsletter on FRC’s guidance on preparing a strategic report
Deloitte’s practical guide to preparing a strategic report
FRC Financial Reporting Lab projects and reports
www.ukaccountingplus.co.uk also has the latest news on non-GAAP measures,country by country reporting and integrated reporting. Corporate governanceExisting requirementsListed companies are required by the Listing Rules to make certain disclosures aboutcorporate governance in their annual reports. Companies with a premium listingare required to state how they have applied the main principles set out in the UKCorporate Governance Code (the Code), providing explanations for any failures tocomply. The Code is accompanied by “Internal Control: Guidance to Directors” andthe FRC’s “Guidance on Audit Committees”, both of which recommend variousdisclosures for inclusion in the annual report.
Under the Code the directors are required to state in the annual report that theyconsider “the annual report and accounts, taken as a whole, is fair, balanced andunderstandable and provides the information necessary for shareholders to assessthe company’s performance, business model and strategy”. The board may ask theaudit committee for advice in this area, but the board as a whole must form this
judgement.
Annual report insights 2014 11
8/10/2019 Uk Audit Annual Report Insights14 Full Survey
http://slidepdf.com/reader/full/uk-audit-annual-report-insights14-full-survey 14/144
The Code also requires the audit committee’s report within the annual report to
include information on the signicant issues that it considered in relation to thenancial statements and how these were addressed. An explanation of how theeffectiveness of the external audit process was assessed should be provided aswell. The FRC Financial Reporting Lab has published a report on audit committeereporting, which may prove useful in considering how best to prepare and presentthe required information.
Under the Code, FTSE 350 companies also need to put the audit out to tenderat least every ten years, subject to transitional provisions – see below for furtherimpending requirements around audit tendering and rotation.
In describing the work of the nomination committee the annual report should
also include a description of the board’s policy on diversity, including gender, anymeasurable objectives it has set for implementing the policy, and progress onachieving the objectives.
The DTR also requires companies listed on the main market, amongst others, toinclude certain corporate governance disclosures, such as a description of the mainfeatures of the company’s internal control and risk management systems in relationto the nancial reporting process.
The Listing Rules and the Code both require a statement by the directors that thebusiness is a going concern, together with supporting assumptions or qualicationsas necessary.
For periods commencing prior to 1 October 2014 this disclosure should be prepared
in accordance with the “Going Concern and Liquidity Risk: Guidance for Directorsof UK Companies 2009” published by the FRC in October 2009, which focuses onthree key principles, discussed below.
• Assessing going concern: directors should make and document a rigorousassessment of whether the company is a going concern when preparing annualand half-yearly nancial statements.
• The review period: directors should consider all available information about thefuture when concluding whether the company is a going concern at the datethey approve the nancial statements. Their review should usually cover a periodof at least twelve months from the date of approval of the annual and half-yearly
nancial statements.
• Disclosures: directors should make balanced, proportionate and clear disclosuresabout going concern for the nancial statements to give a true and fair view.Directors should disclose if the period they have reviewed is less than twelvemonths from the date of approval of the annual report and explain their
justication for l imiting the re view period.
An updated version of this guidance was published in September 2014 and isdiscussed below.
12
8/10/2019 Uk Audit Annual Report Insights14 Full Survey
http://slidepdf.com/reader/full/uk-audit-annual-report-insights14-full-survey 15/144

8/10/2019 Uk Audit Annual Report Insights14 Full Survey
http://slidepdf.com/reader/full/uk-audit-annual-report-insights14-full-survey 16/144

8/10/2019 Uk Audit Annual Report Insights14 Full Survey
http://slidepdf.com/reader/full/uk-audit-annual-report-insights14-full-survey 17/144
Financial statements
Existing requirementsListed groups are required to prepare consolidated accounts under IFRSs as adoptedby the EU. Listed entities that are not parent companies, such as many investmenttrusts, can still prepare UK GAAP nancial statements, with the replacementstandard, FRS 102 The Financial Reporting Standard applicable in the UK andRepublic of Ireland , available for early adoption. In June 2014 the FRC publisheda statement reconrming that the presentation of a true and fair view remains afundamental requirement of nancial reporting.
The separate nancial statements of a ‘qualifying entity’ can be prepared underFRS 101 Reduced Disclosure Framework , which closely reects IFRS accountingbut with reduced disclosures. If eligible, this may be an attractive option for many
parent companies’ separate nancial statements and for their subsidiaries. Anotheroption is to apply FRS 102 with reduced disclosure. To apply FRS 101 or FRS 102with reduced disclosure a company must notify its shareholders in writing and theymust not object to its use. Companies could provide this written notication in anote to their current nancial statements, proposing FRS 101’s use in the followingyear’s nancial statements.
The auditor’s report on the nancial statements must comply with the requirementsof ISA (UK and Ireland) 700. For those companies reporting under the Code,the auditor’s report includes material on the most signicant risks of materialmisstatement, materiality and the scoping of their audit work.
New
New for 2014
At the time of writing ESMA were expected to publish nalisedguidance on the use of non-GAAP measures before the end of2014 (see the narrative reporting regulatory hotspots above).IOSCO have also released a consultation on proposals regarding
the use of such measures.
Preparers may also wish to inspect the FRC Financial Reporting Lab’s 2014 report on“Accounting policies and integration of related nancial information” for inspirationin preparing disclosures around accounting policies.
For many UK companies, this will be the year of adoption for the new IFRSconsolidation standards, each of which brings its own challenges. Notably:
• IFRS 10 Consolidated Financial Statements necessitates a reconsideration ofwhich entities form part of a consolidated group, based on a single denitionof control and new guidance on concepts such as ‘de facto’ control, protectiverights and decision making as ‘agent’ for another investor; and
• IFRS 11 Joint Arrangements requires a determination of the rights and obligationsof the parties to such an arrangement. This is then used to decide whether equityaccounting or a method similar to proportionate consolidation is applied to thearrangement.
• IFRS 12 Disclosure of Interests in Other Entities introduces extensive newdisclosure requirements on the make up of a group, including describing thesignicant judgements made in applying its sister standards IFRS 10 and IFRS 11.
Annual report insights 2014 15

8/10/2019 Uk Audit Annual Report Insights14 Full Survey
http://slidepdf.com/reader/full/uk-audit-annual-report-insights14-full-survey 18/144
See the table below for a comprehensive listing of newly issued IFRSs becoming effective for the rst time in 2014.
TitlePer IASB IFRSs, mandatory foraccounting periods starting on
or after:
Per EU-endorsed IFRSs, mandatoryfor accounting periods starting on
or after:
Relevant for periods commencin g before 1 Januar y 2014 (e.g. September 2014 year-ends)
Amendments to IFRS 1 (Dec 2010) – Severe Hyperination and Removal of Fixed Dates for First-time Adopters 1 July 2011 1 January 2013
Amendments to IAS 12 (Dec 2010) – Deferred Tax: Recovery of Underlying Assets 1 January 2012 1 January 2013
IFRS 13 – Fair Value Measurement 1 January 2013 1 January 2013
IAS 19 (revised June 2011) – Employee Benets 1 January 2013 1 January 2013
IFRIC 20 – Stripping Costs in the Production Phase of a Surface Mine 1 January 2013 1 January 2013
Amendments to IFRS 7 (Dec 2011) – Disclosures – Offsetting Financial Assets and Financial Liabilities 1 January 2013 1 January 2013
Amendments to IFRS 1 (March 2012) – Government Loans 1 January 2013 1 January 2013
Annual Improvements to IFRSs: 2009-2011 Cycle (May 2012) 1 January 2013 1 January 2013
Relevant for periods commencing on or after 1 January 2014
IFRS 10 – Consolidated Financial Statements 1 January 2013 1 January 2014
IFRS 11 – Joint Arrangements 1 January 2013 1 January 2014
IFRS 12 – Disclosure of Interests in Other Entities 1 January 2013 1 January 2014
IAS 27 (revised May 2011) – Separate Financial Statements 1 January 2013 1 January 2014
IAS 28 (revised May 2011) – Investments in Associates and Joint Ventures 1 January 2013 1 January 2014
Amendments to IFRS 10, IFRS 12 and IAS 27 (Oct 2012) – Investment Entities 1 January 2014 1 January 2014
Amendments to IAS 32 (Dec 2011) – Offsetting Financial Assets and Financial Liabilities 1 January 2014 1 January 2014
Amendments to IAS 36 (May 2013) – Recoverable Amount Disclosures for Non-Financial Assets 1 January 2014 1 January 2014
Amendments to IAS 39 (Jun 2013) – Novation of Derivatives and Continuation of Hedge Accounting 1 January 2014 1 January 2014
IFRIC 21 – Levies 1 January 2014 17 June 2014
Annual Improvements to IFRSs: 2010-12 Cycle (Dec 2013) * – See p.17 TBC – endorsement expected Q4 2014
16

8/10/2019 Uk Audit Annual Report Insights14 Full Survey
http://slidepdf.com/reader/full/uk-audit-annual-report-insights14-full-survey 19/144
* Annual im provement s to IFRSs 2010-2012 Cycle issued in December 2013 amended a
number of standards. The amendments to IFRS 2 apply prospectively to share-basedpayment transactions with a grant date on or after 1 July 2014. The amendments to IFRS 3apply prospectively to business combinations for which the acquisition date is on or after1 July 2014. All the other amendments have a mandatory effective date of periodsbeginning on or after 1 July 2014. Earlier application is permitted in all instances (subject toEU endorsement). Where applicable, entities should disclose if certain amendments withinthe improvements are effective whilst others are not.
Hotspots
Regulatory hotspots in 2014In addition to non-GAAP measures, described in the narrativereporting section of this regulatory overview, the list below reectsareas that regulators are likely to focus on in reviewing 2014 accounts:
1. Impairment models , particularly those ‘value in use models’ incorporating
a ‘hockey stick’ growth forecast (high growth in the early years). Wherecompanies have a model which has such a prole, they should be particularlyprepared for regulatory scrutiny. Regulators will focus on value in usecalculations they perceive to have a higher risk of impairment, challenging keyassumptions and any applicable missing sensitivity disclosures.
Impairment is also an area which highlights the need for consistency in anannual report. Are the forecasts and other assumptions in testing goodwill forimpairment the same as those used for other areas such as deciding whether torecognise deferred tax assets? If not, could you explain why?
2. Revenue recognition , particularly in cases where there has been a change in
business model, is another area where regulators will be on the lookout forunusual policies and for aggressive revenue recognition, particularly when a newline of business may be taking time to build momentum.
3. Critical judgements and key sources of estimation uncertainty – these shouldclearly identify where management has exercised judgement and its effect.Boilerplate should not be used. See also the linkage points below.
4. In the second year of application of the revised version of IAS 19, pensionsaccounting and disclosures under scrutiny. Regulators are also set to focus onany pensions “structuring” that has been set up for a desired accounting effectand on disclosure of minimum funding requirements.
5. When going about the task of preparing a cash ow statement , it is temptingto assume that, since IAS 7 Statement of Cash Flows contains fewer headlinecategories than FRS 1 Cash ow statements, it is more exible but in realitythere is unlikely to be much of a grey area as to whether a transaction isoperating, investing or nancing in nature. Also, make sure that all numberspurporting to be cash ows actually are cash ows!
6. Fair value measurements under IFRS 13 and disclosure of related risks underIFRS 13 and IFRS 7 continue to be particularly relevant for nancial institutions.
Impairment is also an area which highlights the need for consistency in an annual report. Are theforecasts and other assumptions in testing goodwill for impairment the same as those used for otherareas such as deciding whether to recognise deferred tax assets?
Annual report insights 2014 17

8/10/2019 Uk Audit Annual Report Insights14 Full Survey
http://slidepdf.com/reader/full/uk-audit-annual-report-insights14-full-survey 20/144
What the future holds
Various new IFRSs will come into effect in the coming years as set out in the table below, with each item ‘clickable’ for further information. As described above, old UKGAAP will cease to exist for periods commencing on or after 1 January 2015.
TitlePer IASB IFRSs, mandatory foraccounting periods startingon or after:
Per EU-endorsed IFRSs, mandatoryfor accounting periods starting onor after:
Amendments to IAS 19 (Nov 2013) – Dened Benet Plans: Employee Contributions 1 July 2014 TBC – endorsement expected Q4 2014
Annual Improvements to IFRSs: 2011-13 Cycle (Dec 2013) – Annual Improvements to IFRSs: 2011-13 Cycle 1 July 2014 TBC – endorsement expected Q4 2014
Amendments to IFRS 10 and IAS 28 (Sept 2014) – Sale or Contribution of Assets between an Investor and itsAssociate or Joint Venture
1 January 2016 TBC – endorsement expected Q3 2015
A me nd me nt s t o I FR S 11 ( May 2014) – A cco un ti ng f or A cq ui si ti on s o f I nt er es ts i n J oi nt Op er at io ns 1 J an ua ry 2016 T BC – en do rs em en t e xp ec te d Q1 2015
IFRS 14 – Regulatory Deferral Accounts 1 January 20166) TBC
Amendments to IAS 16 and IAS 38 (May 2014) – Clarication of Acceptable Methods of Depreciation andAmortisation
1 January 2016 TBC – endorsement expected Q1 2015
Amendments to IAS 16 and IAS 41 (Jun 2014) – Agriculture: Bearer Plants 1 January 2016 TBC – endorsement expected Q1 – 2015
Amendments to IAS 27 (Aug 2014) – Equity Method in Separate Financial Statements 1 January 2016 TBC – endorsement expected Q3 2015
Annual Improvements to IFRSs 2012-2014 Cycle 1 January 2016 TBC
IFRS 15 – Revenue from Contracts with Customers 1 January 2017 TBC – endorsement expected Q2 2015
IFRS 9 – Financial Instruments 1 January 2018 TBC
18
8/10/2019 Uk Audit Annual Report Insights14 Full Survey
http://slidepdf.com/reader/full/uk-audit-annual-report-insights14-full-survey 21/144
Other signicant projects being undertaken by the IASB at the time of writing
included the following:
• a new standard for insurance accounting;• a new standard for lease accounting;• the conceptual framework; and• the disclosure initiative, a broad-based initiative to explore how IFRS disclosures
can be improved.
Link to survey ndingsChapters 13 to 15 examine existing practices around disclosures in nancialstatements.
Where to nd out morewww.ukaccountingplus.co.uk has all the latest information on IFRSs as well asresources for transitioning to new UK GAAP, plus IASB and FRC projects.
Annual report insights 2014 19

8/10/2019 Uk Audit Annual Report Insights14 Full Survey
http://slidepdf.com/reader/full/uk-audit-annual-report-insights14-full-survey 22/144
The main objectives of the survey were to discover:
• the level of cohesiveness in annual reports where companies link together acompany’s strategy, KPIs, business model, remuneration and nancial results;
• the way companies are structuring their narrative reporting, and the extent towhich the new strategic report has provided an opportunity for innovation;
• the content of strategic reports, including the level of detail provided, the waysthat business models are described and common themes on key performanceindicators and principal risks and uncertainties;
• the use of non-GAAP measures in both narrative and nancial reporting andwhich items are commonly being excluded from adjusted earnings measures;
• the level of compliance reported by companies with the UK CorporateGovernance Code and common areas of non-compliance;
• how well companies deal with the signicant volume of disclosures required byIFRSs, including areas of regulatory focus such as critical accounting judgmentsand key sources of estimation uncertainty; and
• how the results varied depending on the size of the company and compared withsimilar surveys performed in previous years.
The annual reports of 100 UK listed companies were surveyed to determine currentpractice. This sample of 100 excluded investment trusts due to their specialisednature. Investment trusts are those companies classied by the London StockExchange in the non-equity or equity investment instruments sectors (this excludesreal estate investment trusts).
In certain instances, example disclosures have been included from companies thatwere not included within our survey but which, having become aware of them,were deemed suitable for inclusion as a result of their usefulness and innovation.
In the current year we have aligned our larger category of companies sampledto reect those in the FTSE 350 as at 30 April 2014. The “other” group capturescompanies outside of the FTSE 350. We have also rebalanced the number ofcompanies selected in each of these categories to better reect the proportionof companies other than investment trusts in the FTSE 350 (55) and outside theFTSE 350 (45). In previous years the large number of small investment trusts
listed on the main market meant that we picked a greater proportion of smallcompanies. This year’s revised approach means that our overall averages now moreaccurately reect an “average” company that is not an investment trust. Our overallcomparatives have also been restated to reect this re-balancing and the differingtrends between those in the FTSE 350 and those outside.
The overall sample is, as far as possible, consistent with that used in last year’ssurvey. As a result of takeovers, mergers, de-listings and changes in marketcapitalisations over the last 12 months, the sample could not be identical.Replacements and additional reports were selected evenly across both categories.The annual reports used those for years ending on or after 30 September 2013 andpublished before 15 August 2014. Any companies within our sample that failed tomeet the DTR requirement to publish their annual report within four months of theiryear end were removed from our sample and replacements chosen at random.
4. Survey objectives
20
8/10/2019 Uk Audit Annual Report Insights14 Full Survey
http://slidepdf.com/reader/full/uk-audit-annual-report-insights14-full-survey 23/144

8/10/2019 Uk Audit Annual Report Insights14 Full Survey
http://slidepdf.com/reader/full/uk-audit-annual-report-insights14-full-survey 24/144
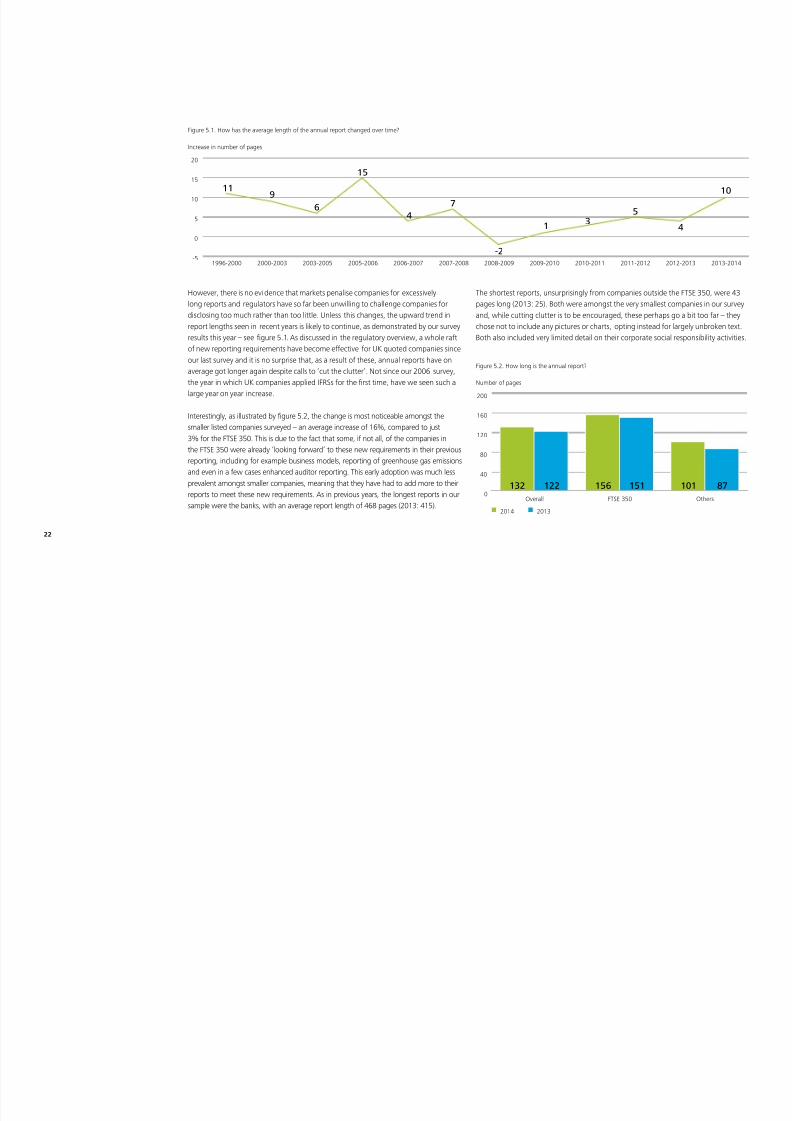
However, there is no evi dence that markets penalise companies for excessivelylong reports and regulators have so far been unwilling to challenge companies fordisclosing too much rather than too little. Unless this changes, the upward trend inreport lengths seen in recent years is likely to continue, as demonstrated by our surveyresults this year – see gure 5.1. As discussed in the regulatory overview, a whole raftof new reporting requirements have become effective for UK quoted companies sinceour last survey and it is no surprise that, as a result of these, annual reports have onaverage got longer again despite calls to ‘cut the clutter’. Not since our 2006 survey,the year in which UK companies applied IFRSs for the rst time, have we seen such alarge year on year increase.
Interestingly, as illustrated by gure 5.2, the change is most noticeable amongst thesmaller listed companies surveyed – an average increase of 16%, compared to just3% for the FTSE 350. This is due to the fact that some, if not all, of the companies inthe FTSE 350 were already ‘looking forward’ to these new requirements in their previousreporting, including for example business models, reporting of greenhouse gas emissionsand even in a few cases enhanced auditor reporting. This early adoption was much lessprevalent amongst smaller companies, meaning that they have had to add more to theirreports to meet these new requirements. As in previous years, the longest reports in oursample were the banks, with an average report length of 468 pages (2013: 415).
The shortest reports, unsurprisingly from companies outside the FTSE 350, were 43pages long (2013: 25). Both were amongst the very smallest companies in our surveyand, while cutting clutter is to be encouraged, these perhaps go a bit too far – theychose not to include any pictures or charts, opting instead for largely unbroken text.Both also included very limited detail on their corporate social responsibility activities.
-5
0
5
10
15
20
2013-20142012-20132011-20122010-20112009-20102008-20092007-20082006-20072005-20062003-20052000-20031996-2000
Figure 5.1. How has the average length of the annual report changed over time?
Increase in number of pages
119
6
15
4
7
-2
1 3
5
10
4
0
40
80
120
160
200
OthersFTSE 350Overall
Figure 5.2. How long is the annual report?
Number of pages
132 122 156 151 101 87
2014 2013
22

8/10/2019 Uk Audit Annual Report Insights14 Full Survey
http://slidepdf.com/reader/full/uk-audit-annual-report-insights14-full-survey 25/144
Directors’ remuneration reporting
The introduction of revised directors’ remuneration reporting requirements thisyear has had a signicant effect on the length of remuneration reports. Whilesome companies partially adopted the revised requirements early last year, for mostcompanies the amount of information required on remuneration and the company’sassociated policy went well beyond that which they had previously been providing.Figure 5.3 shows the effect of this change, as well as the average length of thecomponents of the remuneration report for 2014.
0
4
8
12
16
20
OthersFTSE 350Overall
Figure 5.3. How long is the d irectors' remuneration report?
Number of pages
7
8
2
5
7
1
7
9
2
11 14 7
2014 2013
Remunerat ion pol icy Annual repor t on remunerat ion Other information
2014 2013 2014 2013
The ‘other information’ included is typically an introduction from the chairman ofthe remuneration committee discussing its activities during the year, although somecompanies also included other useful information – CLS Holdings plc presented aone and a half page ‘at a glance’ summary of the remuneration policy report forusers interested in just the key messages. See Appendix 1 for key messages from aseparate Deloitte survey on the rst new-style directors’ remuneration reports.
CLS Holdings plc Annual Report 2014 (p47)
Annual report insights 2014 23
8/10/2019 Uk Audit Annual Report Insights14 Full Survey
http://slidepdf.com/reader/full/uk-audit-annual-report-insights14-full-survey 26/144
8/10/2019 Uk Audit Annual Report Insights14 Full Survey
http://slidepdf.com/reader/full/uk-audit-annual-report-insights14-full-survey 27/144
Figure 5.4.
What type of pdf reports ar e prepared bycompanies?
What proportion of companies produce anHTML report?
132 151 101 87
Basic pdf Enhanced pdf No HTML versionEnhanced HTML content
Basic HTML version
68%
83%
% 16%
16%
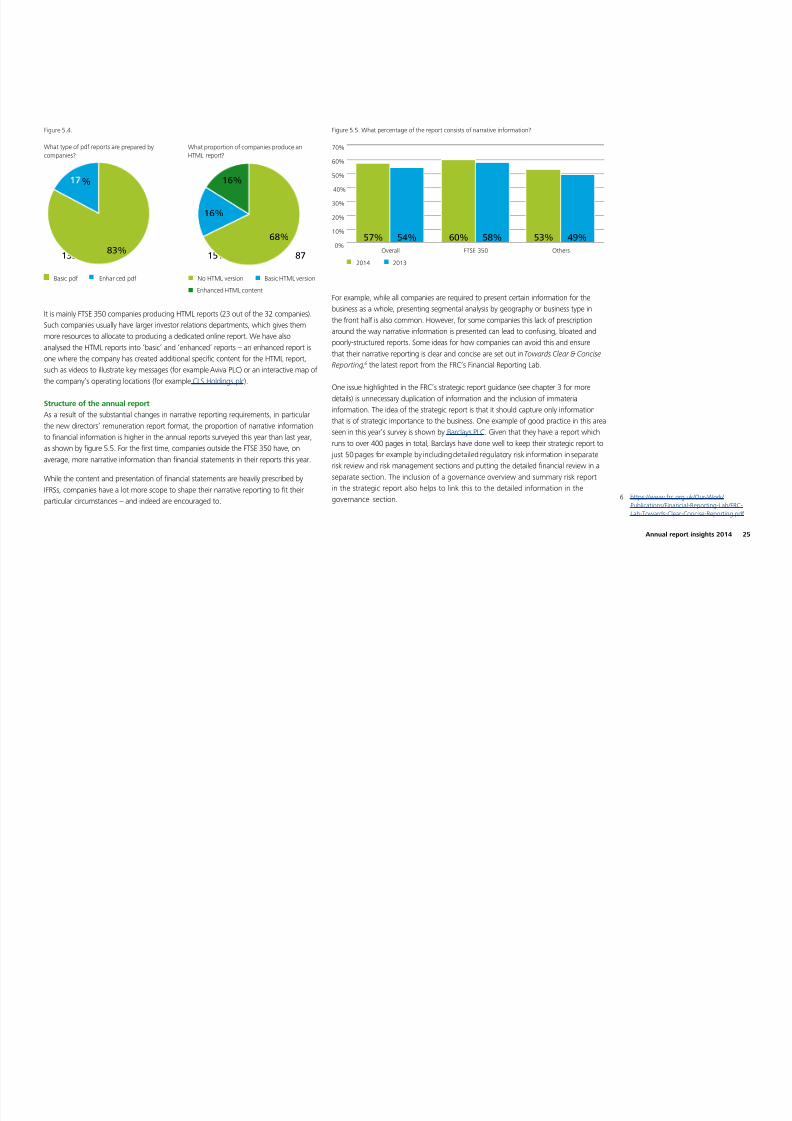
It is mainly FTSE 350 companies producing HTML reports (23 out of the 32 companies).Such companies usually have larger investor relations departments, which gives themmore resources to allocate to producing a dedicated online report. We have alsoanalysed the HTML reports into ‘basic’ and ‘enhanced’ reports – an enhanced report isone where the company has created additional specic content for the HTML report,such as videos to illustrate key messages (for example Aviva PLC) or an interactive map ofthe company’s operating locations (for example CLS Holdings plc).
Structure of the annual report
As a result of the substantial changes in narrative reporting requirements, in particularthe new directors’ remuneration report format, the proportion of narrative informationto nancial information is higher in the annual reports surveyed this year than last year,as shown by gure 5.5. For the rst time, companies outside the FTSE 350 have, onaverage, more narrative information than nancial statements in their reports this year.
While the content and presentation of nancial statements are heavily prescribed byIFRSs, companies have a lot more scope to shape their narrative reporting to t theirparticular circumstances – and indeed are encouraged to.
0%
10%
20%
30%
40%
50%
60%
70%
OthersFTSE 350Overall
Figure 5.5. What percentage of the report consists of narrative information?
57% 54% 60% 58% 53% 49%
2014 2013
For example, while all companies are required to present certain information for thebusiness as a whole, presenting segmental analysis by geography or business type inthe front half is also common. However, for some companies this lack of prescriptionaround the way narrative information is presented can lead to confusing, bloated andpoorly-structured reports. Some ideas for how companies can avoid this and ensurethat their narrative reporting is clear and concise are set out in Towards Clear & ConciseReporting,6 the latest report from the FRC’s Financial Reporting Lab.
One issue highlighted in the FRC’s strategic report guidance (see chapter 3 for moredetails) is unnecessary duplication of information and the inclusion of immaterialinformation. The idea of the strategic report is that it should capture only informationthat is of strategic importance to the business. One example of good practice in this areaseen in this year’s survey is shown by Barclays PLC. Given that they have a report whichruns to over 400 pages in total, Barclays have done well to keep their strategic report to
just 50 pages for example by including detailed regulatory risk information in separaterisk review and risk management sections and putting the detailed nancial review in aseparate section. The inclusion of a governance overview and summary risk reportin the strategic report also helps to link this to the detailed information in thegovernance section. 6 https://www.frc.org.uk/Our-Work/
Publications/Financial-Reporting-Lab/FRC-Lab-Towards-Clear-Concise-Reporting.pdf
Annual report insights 2014 25

8/10/2019 Uk Audit Annual Report Insights14 Full Survey
http://slidepdf.com/reader/full/uk-audit-annual-report-insights14-full-survey 28/144

8/10/2019 Uk Audit Annual Report Insights14 Full Survey
http://slidepdf.com/reader/full/uk-audit-annual-report-insights14-full-survey 29/144
8/10/2019 Uk Audit Annual Report Insights14 Full Survey
http://slidepdf.com/reader/full/uk-audit-annual-report-insights14-full-survey 30/144
Some of the other specic points called for by <IR> are considered in the other
chapters of this publication. For example, how well companies include a discussionof value creation as part of their business model is discussed in chapter 7, as iscorporate social responsibility reporting – which can be seen as a discussion ofnon-nancial capital identied in the <IR> framework.
Reporting timetableDespite the additional challenges for companies this year in complying with anumber of new reporting requirements, it is interesting to note that there hasbeen a further acceleration of reporting timetables, with the median companyreporting in 62 days (2013: 63). While some companies take full advantage of thefour months allowed by the UK Listing Authority’s Disclosure and TransparencyRules (DTR), others like to get their report out as quickly as possible, with thefastest (a telecommunications business) doing so in just 37 days (2013: 39).Figure 5.7 shows a box-plot of the reporting times for companies in our survey.
30
50
70
90
110
130
OthersFTSE 350Overall
Figure 5.7. How quickly was the annual report approved?
Number of days
72
62
55
37
98
64
5854
37
121
86
69
59
42
121
However, the time between year-end and the reporting date is only one half of
this picture. Most companies begin putting together their annual report months inadvance of the year-end, building a template and creating a narrative arc into whichthe nal gures can be swiftly tted once they are produced. Obviously, as this is aninternal process we are unable to collect data on it in our surveying. Nevertheless,Ideas for your annual report , which accompanies this publication, gives ourthoughts on how companies can structure this process to produce a high-qualityreport that nevertheless can be produced quickly after year-end, increasing thetimeliness of the information it provides to shareholders.
Preliminary announcementsAlthough preliminary announcements are no longer required by the Listing Rules,96 companies produced similar announcements which were often referred toas ‘preliminary announcements’. Given DTR 2.2 (disclosure of price sensitiveinformation) and Listing Rule 9.7A.2 (announcement of dividend and distributiondecisions) require announcements of this type of information to be made assoon as possible, for practicality most companies choose to issue a ‘preliminaryannouncement’ when their annual report is approved, with the full “glossy” reportpublished on the company’s website at a later date.
Of the companies in our sample, 12 (2013: 10) produced a preliminaryannouncement which was based on unaudited results. Five of these werecompanies in the FTSE 100, with three in the FTSE 250 and four smaller companies.Of the remaining companies, 84 (2013: 80) produced a preliminary announcementbased on their audited results (although one of these made no mention of theaudit, it was published on the same day as the annual report was approved), andfour published their full annual report in unedited text.
Most companies begin putting together their annual report months in advance of the year-end,building a template and creating a narrative arc into which the nal gures can be swiftly tted oncethey are produced.
28
8/10/2019 Uk Audit Annual Report Insights14 Full Survey
http://slidepdf.com/reader/full/uk-audit-annual-report-insights14-full-survey 31/144
As discussed in chapter 5, annual reports are getting longer and the quantity
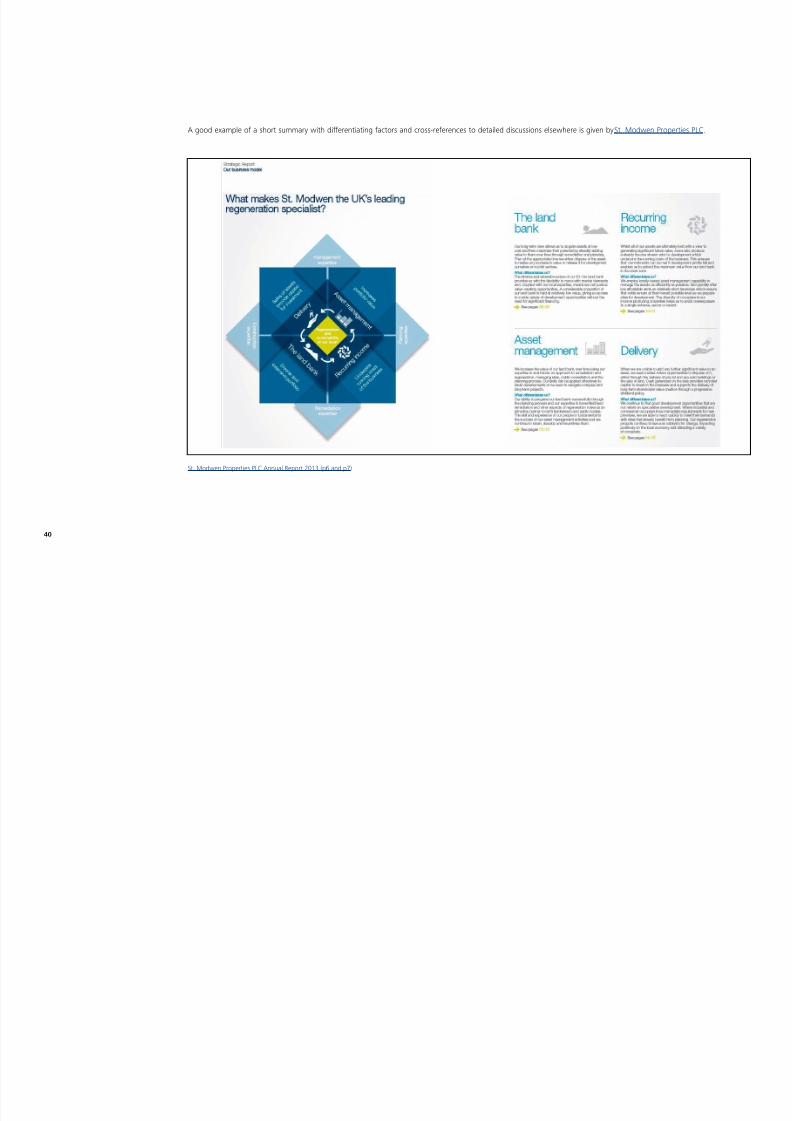
of information they are required to provide is also increasing. Equally, users andregulators are calling for clearer signposting of key information. Although there isno requirement to do so, the presentation of a short summary section at the frontof an annual report can be an effective tool in cutting through the clutter, bringingtogether key nancial and narrative information in one place and showing the linksbetween them.
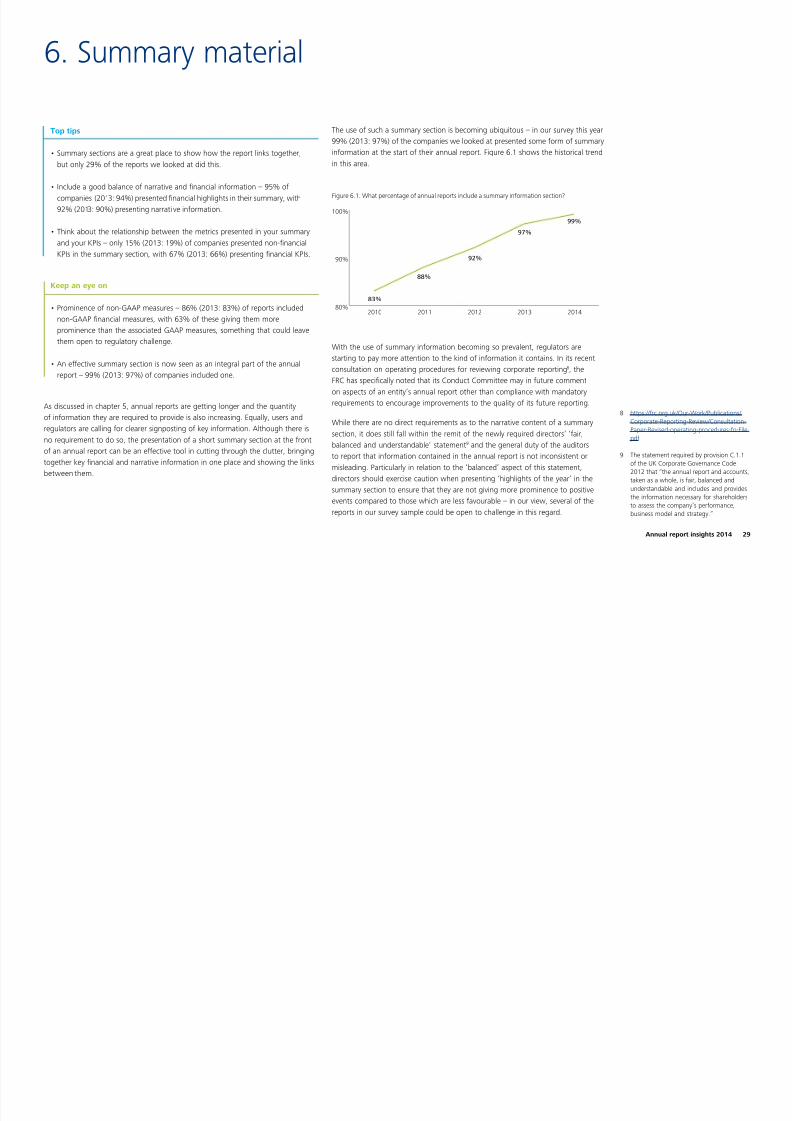
The use of such a summary section is becoming ubiquitous – in our survey this year
99% (2013: 97%) of the companies we looked at presented some form of summaryinformation at the start of their annual report. Figure 6.1 shows the historical trendin this area.
Figure 6.1. What percentage of annual reports include a summary information section?
88%
92%
97%
83%
99%
80%
90%
100%
20142013201220112010
With the use of summary information becoming so prevalent, regulators arestarting to pay more attention to the kind of information it contains. In its recentconsultation on operating procedures for reviewing corporate reporting 8, theFRC has specically noted that its Conduct Committee may in future commenton aspects of an entity’s annual report other than compliance with mandatoryrequirements to encourage improvements to the quality of its future reporting.
While there are no direct requirements as to the narrative content of a summarysection, it does still fall within the remit of the newly required directors’ ‘fair,balanced and understandable’ statement 9 and the general duty of the auditorsto report that information contained in the annual report is not inconsistent ormisleading. Particularly in relation to the ‘balanced’ aspect of this statement,directors should exercise caution when presenting ‘highlights of the year’ in thesummary section to ensure that they are not giving more prominence to positiveevents compared to those which are less favourable – in our view, several of thereports in our survey sample could be open to challenge in this regard.
6. Summary material
Top tips
• Summary sections are a great place to show how the report links together,but only 29% of the reports we looked at did this.
• Include a good balance of narrative and nancial information – 95% ofcompanies (2013: 94%) presented nancial highlights in their summary, with92% (2013: 90%) presenting narrati ve information.
• Think about the relationship between the metrics presented in your summaryand your KPIs – only 15% (2013: 19%) of companies presented non-nancialKPIs in the summary section, with 67% (2013: 66%) presenting nancial KPIs.
Keep an eye on
• Prominence of non-GAAP measures – 86% (2013: 83%) of reports includednon-GAAP nancial measures, with 63% of these giving them moreprominence than the associated GAAP measures, something that could leavethem open to regulatory challenge.
• An effective summary section is now seen as an integral part of the annualreport – 99% (2013: 97%) of companies included one.
8 https://frc.org.uk/Our-Work/Publications/ Corporate-Reporting-Review/Consultation-Paper-Revised-operating-procedures-fo-File.pdf
9 The statement required by provision C.1.1of the UK Corporate Governance Code2012 that “the annual report and accounts,taken as a whole, is fair, balanced andunderstandable and includes and providesthe information necessary for shareholdersto assess the company’s performance,business model and strategy.”
Annual report insights 2014 29
8/10/2019 Uk Audit Annual Report Insights14 Full Survey
http://slidepdf.com/reader/full/uk-audit-annual-report-insights14-full-survey 32/144
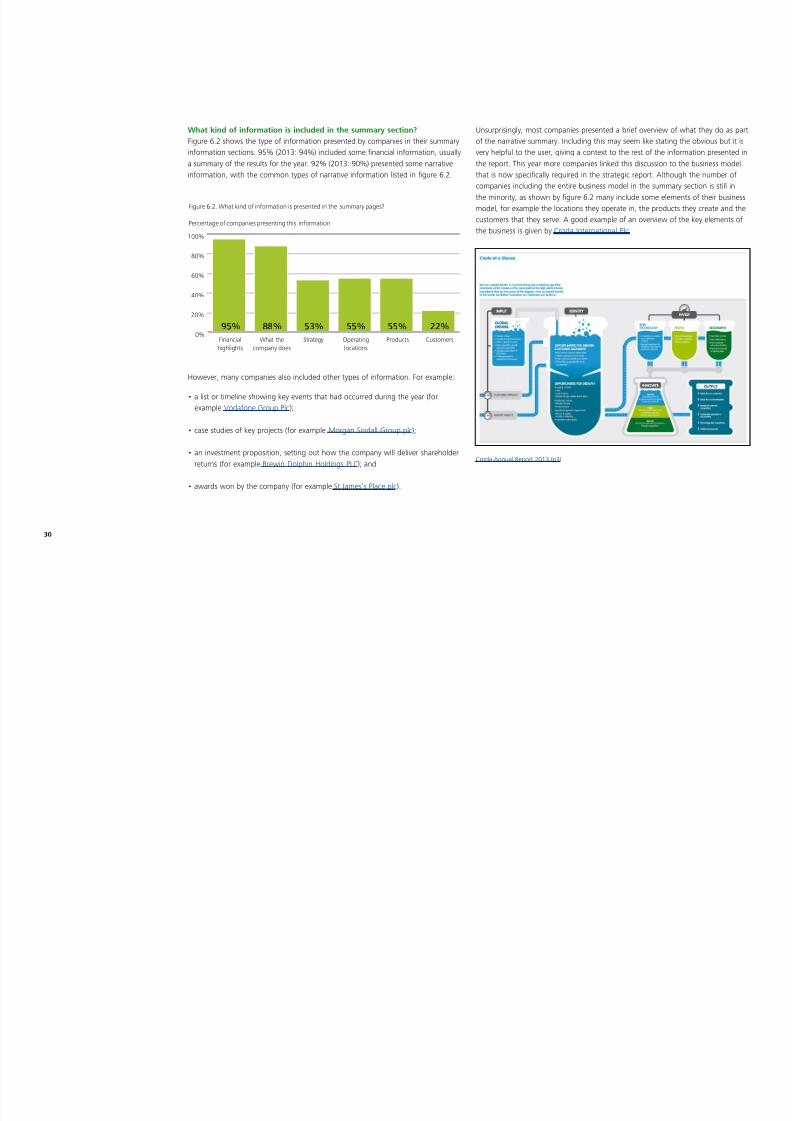
What kind of information is included in the summary section?
Figure 6.2 shows the type of information presented by companies in their summaryinformation sections. 95% (2013: 94%) included some nancial information, usuallya summary of the results for the year. 92% (2013: 90%) presented some narrativeinformation, with the common types of narrative information listed in gure 6.2.
0%
20%
40%
60%
80%
100%
CustomersProductsOperatinglocations
StrategyWhat thecompany does
Financialhighlights
Figure 6.2. What kind of information is presented in the summary pages?
Percentage of companies presenting this information
95% 88% 53% 55% 55% 22%
However, many companies also included other types of information. For example:
• a list or timeline showing key events that had occurred during the year (forexample Vodafone Group Plc );
• case studies of key projects (for example Morgan Sindall Group plc );
• an investment proposition, setting out how the company will deliver shareholderreturns (for example Brewin Dolphin Holdings PLC); and
• awards won by the company (for example St James’s Place plc ).
Unsurprisingly, most companies presented a brief overview of what they do as part
of the narrative summary. Including this may seem like stating the obvious but it isvery helpful to the user, giving a context to the rest of the information presented inthe report. This year more companies linked this discussion to the business modelthat is now specically required in the strategic report. Although the number ofcompanies including the entire business model in the summary section is still inthe minority, as shown by gure 6.2 many include some elements of their businessmodel, for example the locations they operate in, the products they create and thecustomers that they serve. A good example of an overview of the key elements ofthe business is given by Croda International Plc.
Croda Annual Report 2013 (p3)
30

8/10/2019 Uk Audit Annual Report Insights14 Full Survey
http://slidepdf.com/reader/full/uk-audit-annual-report-insights14-full-survey 33/144
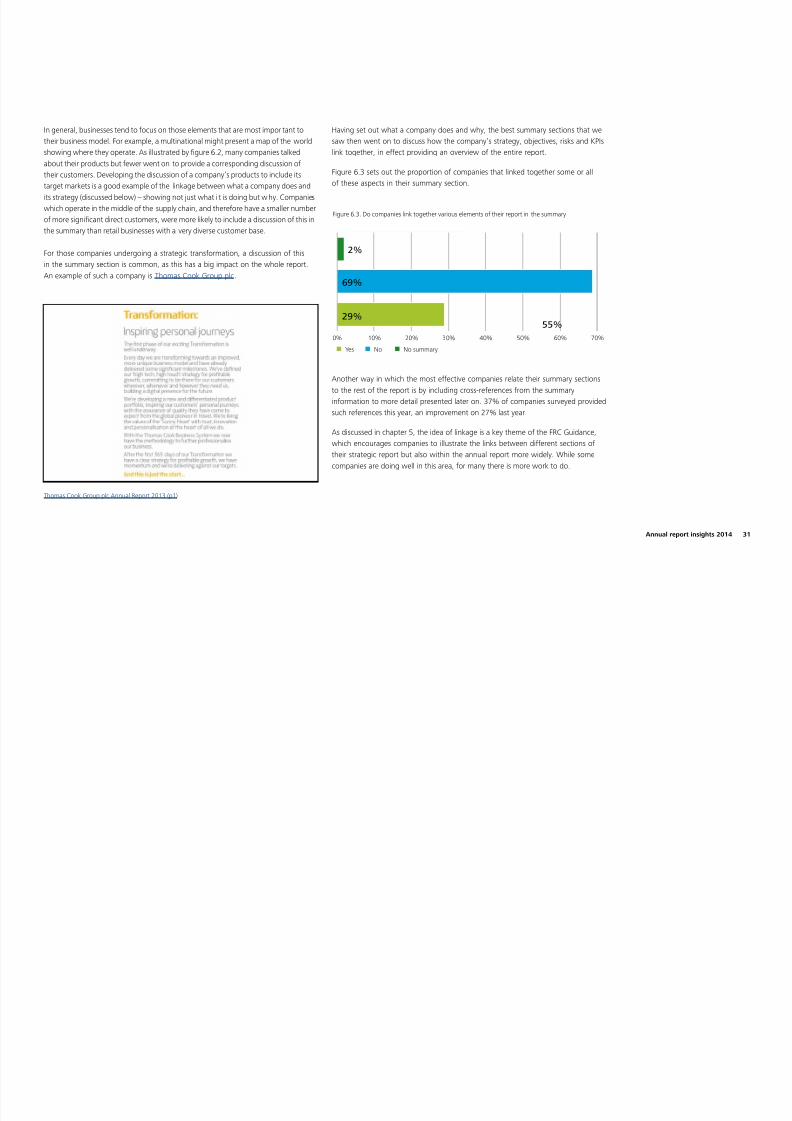
In general, businesses tend to focus on those elements that are most impor tant to
their business model. For example, a multinational might present a map of the worldshowing where they operate. As illustrated by gure 6.2, many companies talkedabout their products but fewer went on to provide a corresponding discussion oftheir customers. Developing the discussion of a company’s products to include itstarget markets is a good example of the linkage between what a company does andits strategy (discussed below) – showing not just what i t is doing but w hy. Companieswhich operate in the middle of the supply chain, and therefore have a smaller numberof more signicant direct customers, were more likely to include a discussion of this inthe summary than retail businesses with a very diverse customer base. For those companies undergoing a strategic transformation, a discussion of thisin the summary section is common, as this has a big impact on the whole report.An example of such a company is Thomas Cook Group plc .
Thomas Cook Group plc Annual Report 2013 (p1)
Having set out what a company does and why, the best summary sections that we
saw then went on to discuss how the company’s strategy, objectives, risks and KPIslink together, in effect providing an overview of the entire report.
Figure 6.3 sets out the proportion of companies that linked together some or allof these aspects in their summary section.
0% 10% 20% 30% 40% 50% 60% 70%
Figure 6.3. Do companies link together various elements of their report in the summary
2%
29%
69%
55%
Yes No No summary
Another way in which the most effective companies relate their summary sectionsto the rest of the report is by including cross-references from the summaryinformation to more detail presented later on. 37% of companies surveyed providedsuch references this year, an improvement on 27% last year.
As discussed in chapter 5, the idea of linkage is a key theme of the FRC Guidance,which encourages companies to illustrate the links between different sections oftheir strategic report but also within the annual report more widely. While somecompanies are doing well in this area, for many there is more work to do.
Annual report insights 2014 31

8/10/2019 Uk Audit Annual Report Insights14 Full Survey
http://slidepdf.com/reader/full/uk-audit-annual-report-insights14-full-survey 34/144
The summary section of the report can be a very effective location to demonstrate these links at a high level, with a summary of each section of the report linking to the
more detailed information given later on. Good examples of summary sections that display both are BT Group plc, SEGRO plc and Croda International Plc .
BT Group Annual Report 2014 (p6 and p7)
32

8/10/2019 Uk Audit Annual Report Insights14 Full Survey
http://slidepdf.com/reader/full/uk-audit-annual-report-insights14-full-survey 35/144
SEGRO plc Annual Report 2013 (p4 and p5)
Annual report insights 2014 33

8/10/2019 Uk Audit Annual Report Insights14 Full Survey
http://slidepdf.com/reader/full/uk-audit-annual-report-insights14-full-survey 36/144
Presentation of nancial highlights
As shown by gure 6.2, the vast majority of companies we surveyed presentedsome sort of nancial summary information at the beginning of their annual report.Inevitably, companies want to explain their results in the most meaningful way andthe use of pure IFRS gures may not always allow them to do this. For this reason,most companies present some ‘non-GAAP’ information – typically gures thatare adjusted in some way to exclude ‘exceptional’ or ‘one-off’ items. Figure 6.4shows how many companies present such non-GAAP information and the level ofconsistency seen between the measures presented in the summary section and anyadjusted measures presented in the nancial statements themselves.
Figure 6.4. How consistent are non-GAAP measures in the summary?
88%
No non-GAAP measures
Consistent with both I/S and IFRS 8
Consistent with I/S only
Consistent with IFRS 8 only
Based on industry guidelines
Not consistent with other information
34%
15%
14%20%
4%
13%
There have been several recent regulatory developments in relation to thepresentation of non-GAAP measures. As well as the information set out below,these are also discussed in chapter 3 (the regulatory overview) and, specically inthe context of the income statement, in chapter 14. Our April 2014 Accountingroundup also includes further details on this topic.
In December 2013, the FRC published a press notice 10 reminding boards of what they
should consider when they present exceptional or similar items, including how acompany should identify items to be excluded when presenting non-GAAP measures.
Both the European Securities and Markets Authority (ESMA) 11 and the InternationalFederation of Accountants (IFAC) 12 published draft proposals on the topic ofnon-GAAP measures in February 2014. The ESMA proposals focus mainly on thepresentation of alternative performance measures (APMs), as they describe them.In particular, they propose that “APMs that are presented outside nancial statementsshould be displayed with less prominence, emphasis or authority than measuresdirectly stemming from nancial statements prepared in accordance with theapplicable nancial reporting framework”. This is a signicantly more aggressivestance than regulators have taken to date – with the FRC, for example, suggestingthat non-GAAP measures should not be given greater prominence than GAAPmeasures but that equal prominence would be acceptable.
Of the companies in our sample, only one (other than those that did not identifyany non-GAAP measures) gave greater prominence to GAAP measures overnon-GAAP measures. 63% of companies that presented non-GAAP measureseither presented them with greater prominence than the associated GAAPmeasures, or did not present the associated GAAP measure in their summary atall. In fact six companies presented only non-GAAP measures in their summarysection, with no GAAP gures at all. This is an area in which we would expect tosee signicant change when nal guidance is published by regulators, assumingthat it is consistent with the position already being taken on a case by case basis.With many companies already out of line with the regulatory position, changes are
likely to be necessary to comply with the published requirements. While there maybe some debate over what is meant by ‘equal prominence’ or ‘less prominence’, itseems unlikely that presenting a non-GAAP measure as a nancial highlight withoutthe associated GAAP measure will be seen as appropriate.
10 https://www.frc.org.uk/News-and-Events/ FRC-Press/Press/2013/December/FRC-seeks-consistency-in-the-reporting-of-exceptio.aspx
11 http://www.esma.europa.eu/system/ les/2014-174_esma_consults_on_guidelines_on_alternative_performance_measures_13.02.2014_0.pdf
12 http://www.ifac.org/sites/default/les/ publications/les/Developing-and-Reporting-Supplementary-Financial-Measures-Guidance-Exposure-Draft-PAIB-Feb-2014_0.pdf . Registration (which is free)is required to view this.
34

8/10/2019 Uk Audit Annual Report Insights14 Full Survey
http://slidepdf.com/reader/full/uk-audit-annual-report-insights14-full-survey 37/144

8/10/2019 Uk Audit Annual Report Insights14 Full Survey
http://slidepdf.com/reader/full/uk-audit-annual-report-insights14-full-survey 38/144
However, presenting measures such as revenue, prot before tax or earnings per
share in the summary section is likely to be useful to investors regardless of whetherthese are specically identied as KPIs by the company.We would not expect such measures to be identied as KPIs by every company.
A good example of a summary secti on which sets out an overview of the company’sbusiness and strategy and then links this to its KPIs is Speedy Hire Plc. Another suchexample is given by SEGRO plc.
The types of measures identied by companies as KPIs are discussed in more detailin chapter 8.
Speedy Hire Plc Annual Report 2014 (p2)
36

8/10/2019 Uk Audit Annual Report Insights14 Full Survey
http://slidepdf.com/reader/full/uk-audit-annual-report-insights14-full-survey 39/144
The reports that we have looked at this year were the rst to include the newlyrequired strategic report, a component of the annual report that is distinct fromthe directors’ report and which replaces the business review that was previouslyrequired. All companies in our survey took on board this change. In practice, mostlisted companies used to present their business review separately from the rest ofthe directors’ report (of which the business review was a part) and so this in itselfdid not necessarily require big changes in the structure of annual reports.
Having said this, the FRC encouraged companies to use this change as an opportunity
to refresh their reporting and there have been some notable improvements.
The regulatory overview in chapter 3 sets out details of the changes in requirementsas a result of the new legislation. The overall aim of the strategic report is topresent a fair review of the company’s business, including the development andperformance of the business during the year and its position at the year-end. Someof the key elements of this which are discussed in this chapter are:
• a description of the company’s business model;
• a discussion of the company’s objectives and strategy; and
• relevant information regarding corporate social responsibility activities, including
employees, the environment, social and community issues and human rights.
Although the new legislation strictly requires disclosure of greenhouse gasemissions in the directors’ report not the strategic report, in practice mostcompanies have used the ability to ‘elevate’ this information to the strategic report,so it is also covered in this chapter.
The strategic report is also required to contain a discussion of principal risks anduncertainties and key performance indicators relevant to the business. Both of theseareas have dedicated chapters of their own – see chapter 8 for principal risks andchapter 9 for KPIs.
Unsurprisingly, we have seen the legal changes reected in the data from this
year’s survey. For example, all but two companies included a specic sectiondiscussing their business model in their 2014 reports, although it is worth notingthat 75% included some discussion of their business model in their 2013 accounts.
7. The strategic report
Top tips
• A meaningful visual representation of your business model can signicantly improvethe clarity of the disclosure – 59% of companies included this (2013: 53%).
• Clearly set out your objectives for the business – 54% of companies identiedboth nancial and non-nancial objectives.
• Link your strategy and objectives to the KPIs that measure their success –54% (2013: 41%) of companies did this.
• Put in place a process to identify information that is of strategic importance– 97% of companies promoted some information from the directors’ reportto the strategic report, with future developments (96%) and greenhouse gasemissions (70%) the most common.
Keep an eye on
• Signposting the discussion of your business model – 94% of this year’sreports did this (2013: 53%).
• The required formats for greenhouse gas and gender diversity disclosures –13% of reports did not clearly comply with the new greenhouse gas emissionsreporting requirements while 27% did not do so for gender disclosures.
Annual report insights 2014 37
8/10/2019 Uk Audit Annual Report Insights14 Full Survey
http://slidepdf.com/reader/full/uk-audit-annual-report-insights14-full-survey 40/144
Two other recent developments in relation to the st rategic report are the release in
December 2013 by the International Integrated Reporting Council (IIRC) of the nalversion of its International Integrated Reporting Framework (<IR> Framework) 13 and,more recently, the publication of its nal Guidance on the Strategic Report 14 by theFRC in June 2013. Both of these are discussed in detail in t he regulatory overview.
Five of the companies in our sample mentioned integrated reporting in theirreports, with two actually reporting that they comply with the Framework in thecurrent year (although one of those, Mondi plc, is a group with a dual listing in theUK and South Africa and as such is required by South African law to prepare anintegrated report) and the other three mentioning as something they will look to inthe future.
The business model
Probably the most signicant change to reporting requirements introduced bythe new legislation was a specic requirement for quoted companies to discusstheir business models in their annual reports. There was no explicit requirementto do this in the previous legislation, although many companies did so as the UKCorporate Governance Code included a provision requiring it (operating, as usual,on a ‘comply or explain’ basis). 94% of the reports surveyed in 2014 (2013: 53%)included a clear section of their annual report dedicated to a discussion of thebusiness model – although it is worth noting that a further 23% of reports in 2013(2014: 2%) did include a section discussing the information one would expect tond in a business model without describing it as such.
Figure 7.1. How much detail do companies provide on their business model?
Comprehensive coverage Shorter summary with cross-references
Brief description No business model presented
0% 20% 40% 60% 80% 100%
2013
2014
58%
78%
9% 10% 23%
15%
4%3%
As shown by gure 7.1, the level of detail given by companies in their businessmodel has also improved following the change in legislation. In theory the businessmodel should set out how the company generates and preserves value over thelong term, although in our view this is not something that all of the businessmodel disclosures we saw actually did – see the ‘Value creation’ section belowfor more detail. At the highest level, the business model is a description of whatthe business does and why and how it does it. It should provide shareholders withan understanding of how the entity is structured, the market in which it operatesand how the entity engages with the market (e.g. what part of the value chain itoperates in, its main products, services, customers and its distribution methods).It should also describe the nature of the relationships, resources and other inputsthat are necessary for the successful continuation of the business.
13 http://www.theiirc.org/wp-content/ uploads/2013/12/13-12-08-THE-INTERNATIONAL-IR-FRAMEWORK-2-1.pdf
14 https://www.frc.org.uk/Our-Work/ Publications/Accounting-and-Reporting-Policy/Guidance-on-the-Strategic-Report.pdf
38
8/10/2019 Uk Audit Annual Report Insights14 Full Survey
http://slidepdf.com/reader/full/uk-audit-annual-report-insights14-full-survey 41/144
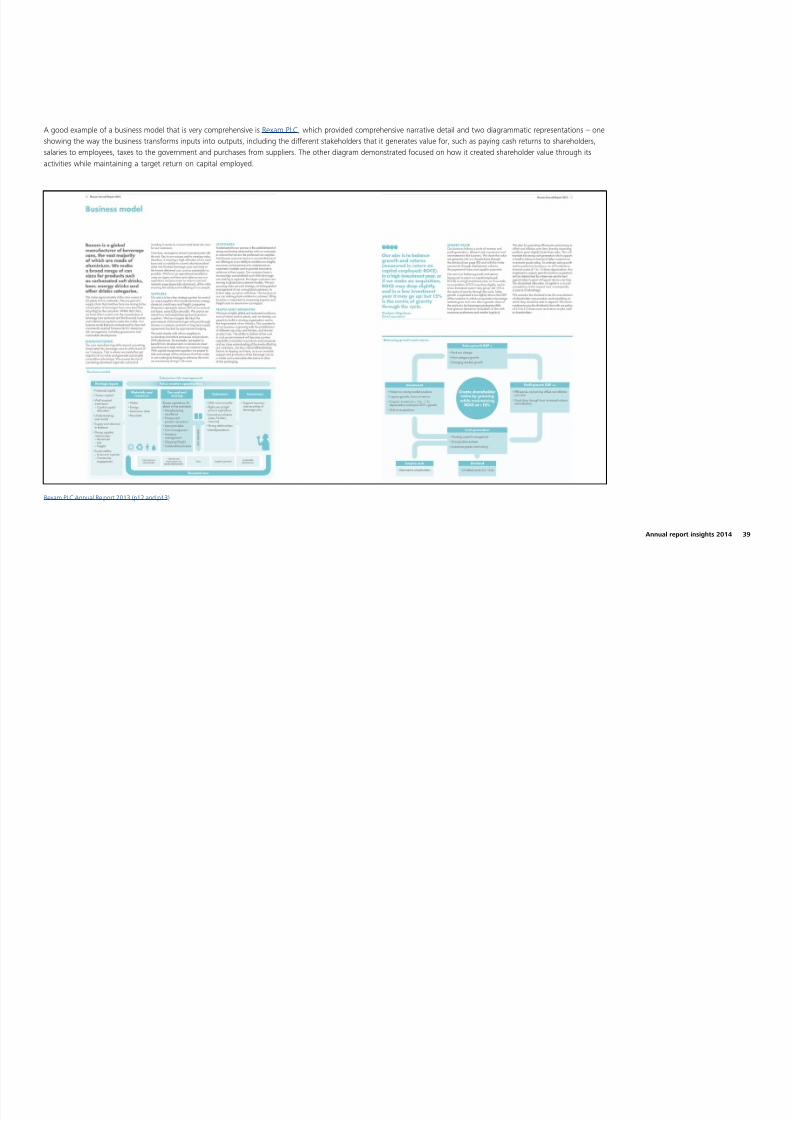
A good example of a business model that is very comprehensive is Rexam PLC, which provided comprehensive narrative detail and two diagrammatic representations – one
showing the way the business transforms inputs into outputs, including the different stakeholders that it generates value for, such as paying cash returns to shareholders,salaries to employees, taxes to the government and purchases from suppliers. The other diagram demonstrated focused on how it created shareholder value through itsactivities while maintaining a target return on capital employed.
Rexam PLC Annual Re port 2013 (p12 and p13)
Annual report insights 2014 39

8/10/2019 Uk Audit Annual Report Insights14 Full Survey
http://slidepdf.com/reader/full/uk-audit-annual-report-insights14-full-survey 42/144
A good example of a short summary with differentiating factors and cross-references to detailed discussions elsewhere is given by St. Modwen Properties PLC .
St. Modwen Properties PLC Annual Report 2013 (p6 and p7)
40

8/10/2019 Uk Audit Annual Report Insights14 Full Survey
http://slidepdf.com/reader/full/uk-audit-annual-report-insights14-full-survey 43/144
Another practice that has become more common this year is the inclusion of a
visual representation of a company’s business model, with 59% of companiesincluding one (2013: 53%). This can be very effective – however the use of apicture needs to go hand in hand with an appropriate level of supporting narrative.The picture also needs to be specic to the company. In some cases the visualrepresentations were supercial, with abstract diagrams, which once analysed,did not communicate how the business creates value.
One area in which the use of a clear and effective diagram can be very helpful is indemonstrating linkages between the different elements of a company’s businessmodel, for example the inputs, processes and outputs involved. It can also help tohighlight how the business generates value. A good example of effective use of avisual representation is given by International Personal Finance plc .
International Personal Finance plc Annual Report 2013 (p4)
The idea of linkage, ensuring that a company demonstrates how all of the different
sections of the strategic report relate to one another, is one of the key themes ofthe FRC Guidance. One could argue that the business model should be at the heartof the annual report, and is therefore a natural place to demonstrate how it all linkstogether. One company that has shown this linkage effectively is Halma plc.
Halma plc Annual Report 2013 (p15)
Annual report insights 2014 41

8/10/2019 Uk Audit Annual Report Insights14 Full Survey
http://slidepdf.com/reader/full/uk-audit-annual-report-insights14-full-survey 44/144
Value creation
One of the key themes of integrated reporting is the idea of value creation. Ofcourse, the aim of all businesses is to create value for their shareholders in someway, but a good business model disclosure should set out exactly how the businesscreates value. This is consistent with the FRC Guidance which refers to how anentity generates or preserves value over the longer term, and how it captures thatvalue. At a high level this may be as simple as whether it aims to return as muchcash as possible to investors or retain it in the business for reinvestment, withcapital growth providing shareholder return. However, the best reports go muchfurther than this – identifying the key differentiating factors within a business thatallow it to generate value within each of its activities. They also identify how valueis created for other stakeholders, not just the owners of the business.
Figure 7.2 illustrates how many companies discuss their value creation activities.
One of the particular ideas of the <IR> Framework is that companies should discussvalue creation in the short, medium and long term, i.e. not just how they createvalue now but how they will ensure that they continue to create value in the future.
While most companies discuss their value creation activities in some way, only a
minority have this future focus to their discussion.
0%
20%
40%
60%
80%
100%
OthersFTSE 350Overall
Figure 7.2. How many companies discuss value creation?
50% 39% 64%
30%
9%
39%
13%
18%
Specic detail including development over timeSome discussion
Of course, the aim of all businesses is to create value for their shareholders in some way, but a goodbusiness model disclosure should set out exactly how the business creates value.
42
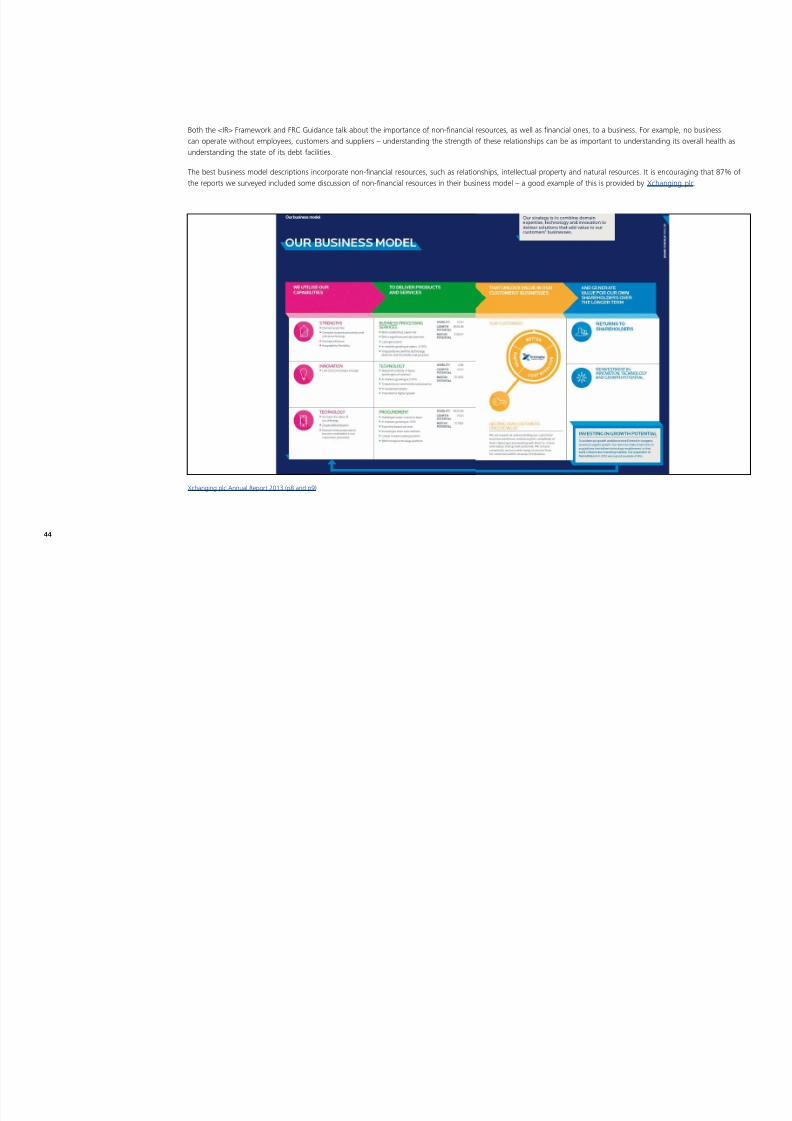
8/10/2019 Uk Audit Annual Report Insights14 Full Survey
http://slidepdf.com/reader/full/uk-audit-annual-report-insights14-full-survey 45/144
Good examples of business models that include a discussion of value creation and preservation are BTG plc and North Midland Construction PLC .
North Midland Construction PLC Annual Report 2013 (p10 and p11)
Annual report insights 2014 43
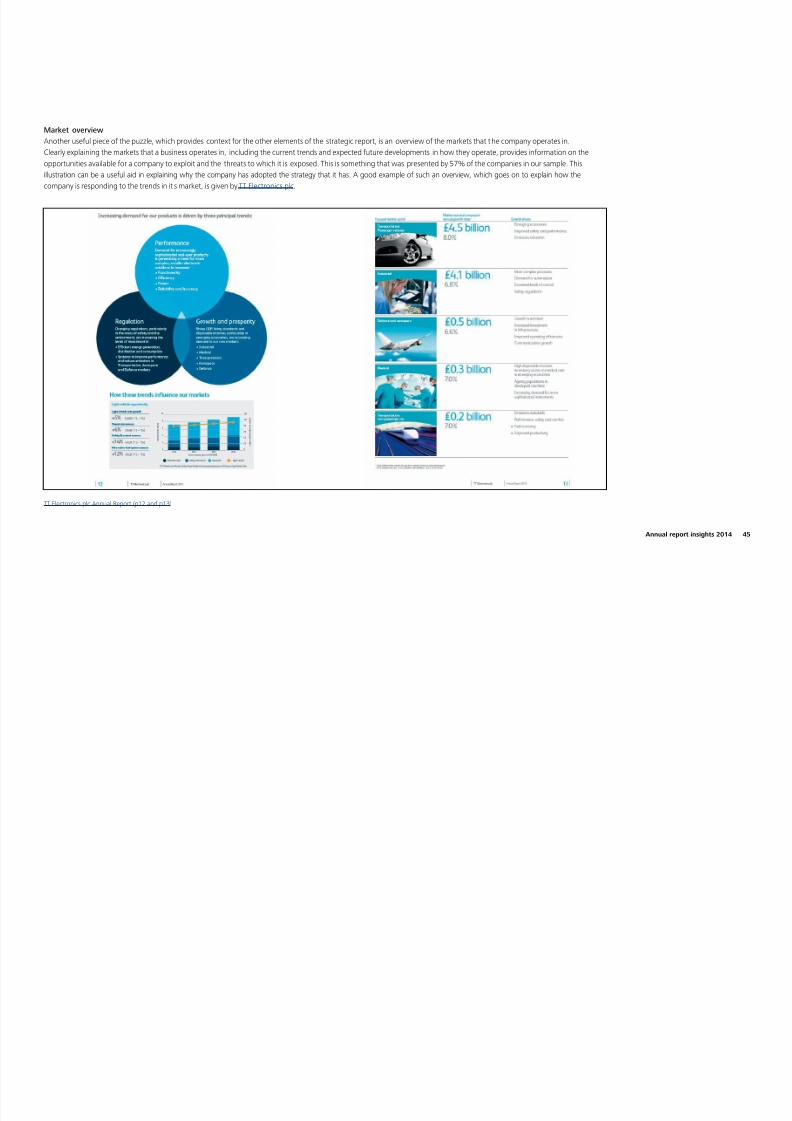
8/10/2019 Uk Audit Annual Report Insights14 Full Survey
http://slidepdf.com/reader/full/uk-audit-annual-report-insights14-full-survey 46/144
Both the <IR> Framework and FRC Guidance talk about the importance of non-nancial resources, as well as nancial ones, to a business. For example, no business
can operate without employees, customers and suppliers – understanding the strength of these relationships can be as important to understanding its overall health asunderstanding the state of its debt facilities.
The best business model descriptions incorporate non-nancial resources, such as relationships, intellectual property and natural resources. It is encouraging that 87% ofthe reports we surveyed included some discussion of non-nancial resources in their business model – a good example of this is provided by Xchanging plc.
Xchanging plc Annual Report 2013 (p8 and p9)
44

8/10/2019 Uk Audit Annual Report Insights14 Full Survey
http://slidepdf.com/reader/full/uk-audit-annual-report-insights14-full-survey 47/144
Market overviewAnother useful piece of the puzzle, which provides context for the other elements of the strategic report, is an overview of the markets that t he company operates in.Clearly explaining the markets that a business operates in, including the current trends and expected future developments in how they operate, provides information on theopportunities available for a company to exploit and the threats to which it is exposed. This is something that was presented by 57% of the companies in our sample. Thisillustration can be a useful aid in explaining why the company has adopted the strategy that it has. A good example of such an overview, which goes on to explain how thecompany is responding to the trends in it s market, is given by TT Electronics plc.
TT Electronics plc Annual Report (p12 and p13)
Annual report insights 2014 45
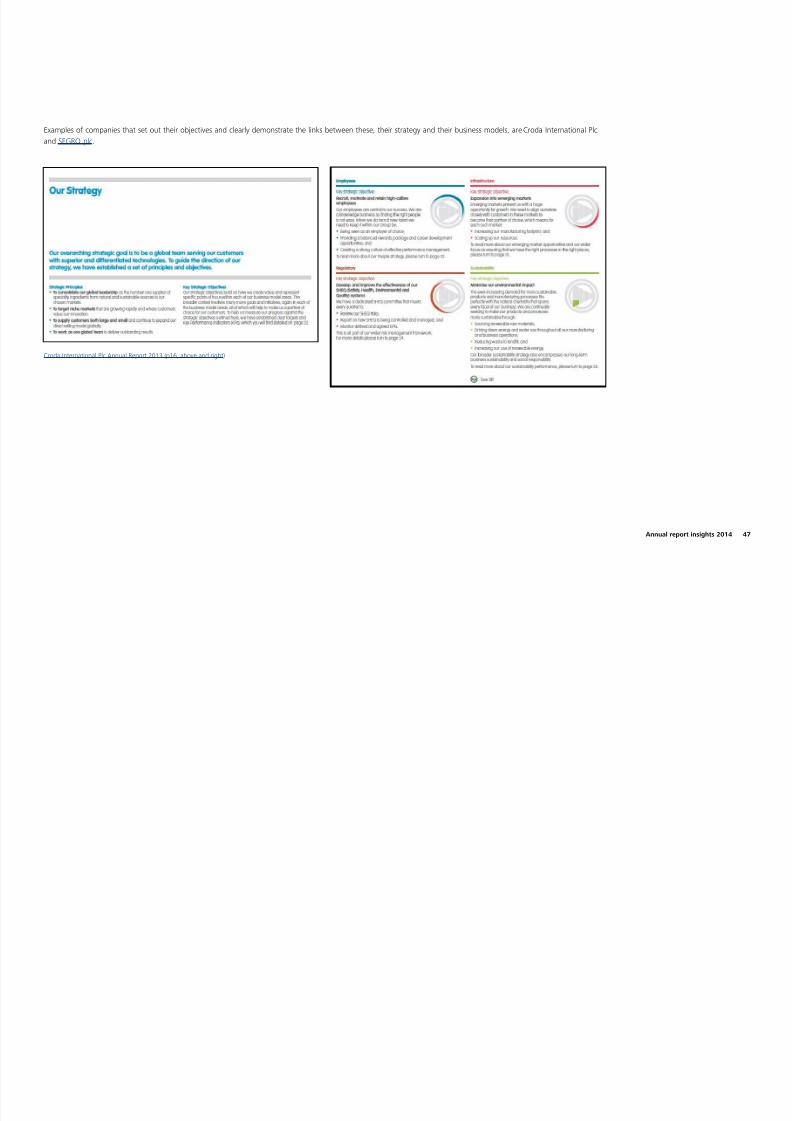
8/10/2019 Uk Audit Annual Report Insights14 Full Survey
http://slidepdf.com/reader/full/uk-audit-annual-report-insights14-full-survey 48/144
Objectives and strategyAlthough company law does not require a business to include a discussion of itsobjectives in its annual report, this is something that the FRC Guidance suggestsshould be included – after all, a description of the strategy is required and withoutthe objectives that it is working towards it would seem rather meaningless. Also,the Code notes that the annual report should contain an explanation of ‘thestrategy for delivering the objectives of the company’ (Provision C.1.2). At a highlevel, all companies ultimately have an objective of maximising shareholder value.However, most companies identify more specic objectives setting out how theywill achieve this aim. Figure 7.3 shows the types of objectives identied.
Figure 7.3. What type of objectives are identied by companies?
88%
Both nancial and non-nancial
Financial only
Non-nancial only
No objectives identied54%
17%
1%
28%
Overall most companies identify both nancial and non-nancial objectives,which is encouraging evidence that businesses are recognising the importanceof maintaining a balanced view of the company. Ultimately, successful pursuitof carefully selected non-nancial goals is likely to make achieving a company’snancial targets, arguably of primary importance to the investor, that much easier.The merits of non-nancial goals are supported by the IIRC’s Integrated ReportingFramework and FRC Guidance.
Only 41% of the companies we surveyed included a discussion of their long-term objectives for the development of the business. This links to the proportionof companies that discuss how the business creates value in the short, mediumand long term, as discussed above in the context of the business model. It isimportant for companies to focus on the long term health of the business as wellas its immediate future, an idea that is picked up in the latest proposals on going
concern (see chapter 10) and the IIRC’s Integrated Reporting Framework. Settingout clear long-term objectives is also likely to be helpful in illustrating the linkbetween executive remuneration and long-term performance, a key element ofthe remuneration policy that companies are required to present under the newremuneration reporting rules.
Linking the objectives of the business to the strategy that is intended to achievethem is also key. Unsurprisingly, all of the companies we surveyed discussed theirstrategy in some way.
46

8/10/2019 Uk Audit Annual Report Insights14 Full Survey
http://slidepdf.com/reader/full/uk-audit-annual-report-insights14-full-survey 49/144
Examples of companies that set out their objectives and clearly demonstrate the links between these, their strategy and their business models, are Croda International Plc and SEGRO plc.
Croda International Plc Annual Report 2013 (p16, above and right)
Annual report insights 2014 47
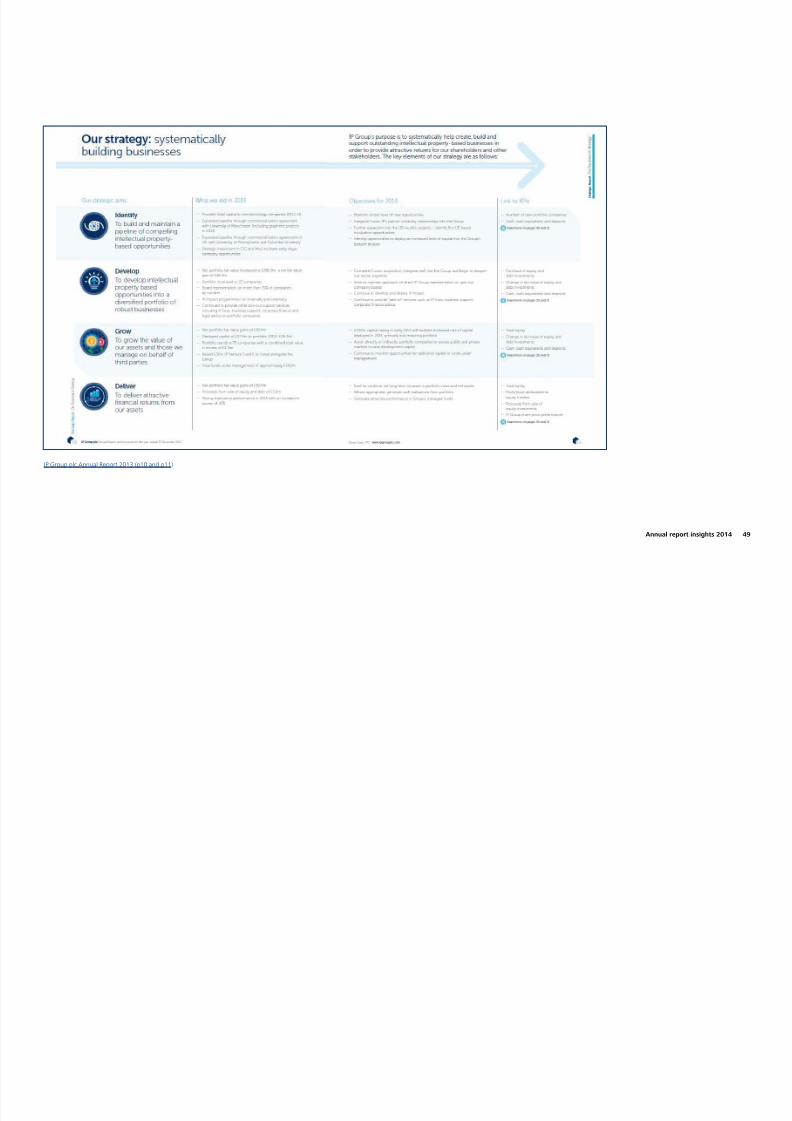
8/10/2019 Uk Audit Annual Report Insights14 Full Survey
http://slidepdf.com/reader/full/uk-audit-annual-report-insights14-full-survey 50/144
Another important link to draw out is between the company’s objectives andstrategy and its key performance indicators. Clearly setting out how the companymeasures achievement of its objectives and the successful implementation of itsstrategy can be a valuable aid to shareholders looking for a concrete way in whichto assess the performance of management. Figure 7.4 shows that this is an areawhere there has been a noticeable improvement year-on-year, although the smallercompanies in our sample are still lagging behind the FTSE 350.
0%
20%
40%
60%
80%
100%
OthersFTSE 350Overall
Figure 7.4. How clear is the link between strategy and performance measures?
54% 41% 70% 56% 34% 22%
2014 2013
Two good examples of how this linkage can be demonstrated are shown by IP Group plc and Mitie Group plc. IP Group plc uses a table which sets out eachelement of their strategy, their progress in 2014, future targets and the related KPIs.Mitie Group plc uses a narrative ow, with each KPI embedded within the relevantcomponent of the group’s strategy.
Mitie Group plc Annual Report 2013 (p9)
48
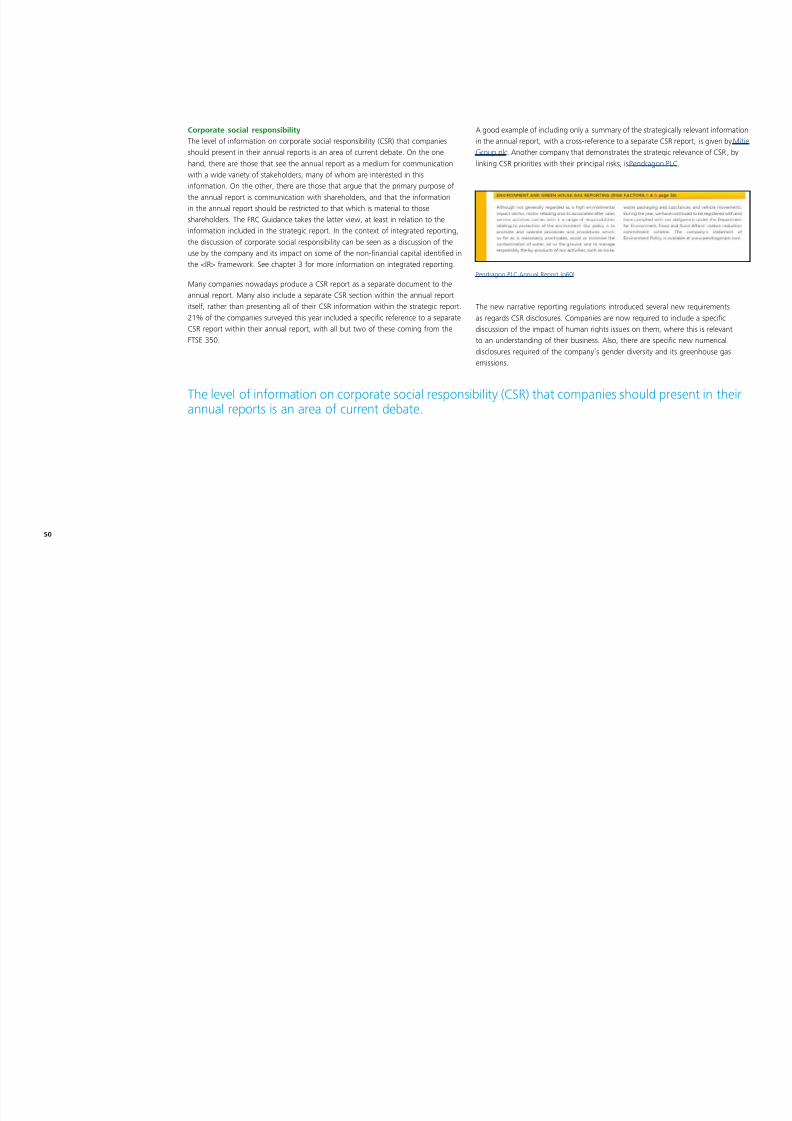
8/10/2019 Uk Audit Annual Report Insights14 Full Survey
http://slidepdf.com/reader/full/uk-audit-annual-report-insights14-full-survey 51/144
IP Group plc Annual Report 2013 (p10 and p11)
Annual report insights 2014 49

8/10/2019 Uk Audit Annual Report Insights14 Full Survey
http://slidepdf.com/reader/full/uk-audit-annual-report-insights14-full-survey 52/144

8/10/2019 Uk Audit Annual Report Insights14 Full Survey
http://slidepdf.com/reader/full/uk-audit-annual-report-insights14-full-survey 53/144
Overall quality of CSR disclosuresFigure 7.5 shows the level of detail that companies gave in their reports this year.There is a good level of disclosure across the board, with the areas of environmentalimpact and employee-related issues showing the best level of meaningful ordetailed disclosures.
Linking CSR information to the strategy of the business, for example by relating it toKPIs, is a theme that emerges from the FRC Guidance.
Ensuring that information presented does link in this way can help companiesto ensure that the information they are presenting is material. Indeed, for somecompanies, where one or more of these areas is not strategically important, just abrief comment may be all that is needed.
See chapter 9 for more information on the kinds of non-nancial KPIs presented bythe companies we surveyed.
Figure 7.5. How much detail have companies given about their corporate social responsibility?
50% 39% 64%
30%
9%
39%
13%
18%
Detailed analysis including a link to KPIs Detailed analysis of strategic importance Meaningful commentary specic to company Brief comment
0%
20%
40%
60%
80%
100%
Human rightsSocial and communityDiversityEmployee-relatedGreenhouse gasesEnvironmental
16%
32%
32%
19%
25%
40%
17%
15%
17%
45%
12%
25%
46%
37%
10%
23%
49%
14%
32%
35%
5%
4%3%
Annual report insights 2014 51

8/10/2019 Uk Audit Annual Report Insights14 Full Survey
http://slidepdf.com/reader/full/uk-audit-annual-report-insights14-full-survey 54/144
Human rightsThe newly required disclosure on human rights is an example of such scalablematerial, where several companies in our sample merely noted that there were nosignicant human rights exposures inherent in their business model. These weremostly service businesses or those with operations solely in the UK, where there areno obvious sources of human rights issues – labour legislation is strong and there isno signicant supply chain to worry about. Nevertheless, even for these companiesthere are issues to consider – for example, modern slavery in the UK is an issue ofcurrent political focus.
A good example of human rights disclosure is given by BT Group plc, who not onlyset out their internal policy but also discuss their supply chain assurance process regarding human rights.
BT Group plc Annual Report 2014 (p29)
BT Group plc Annual Report 2014 (p48)
52

8/10/2019 Uk Audit Annual Report Insights14 Full Survey
http://slidepdf.com/reader/full/uk-audit-annual-report-insights14-full-survey 55/144
Looking to the future, when the new EU non-nancial reporting directive isimplemented in the UK, companies will be required to include a report on briberyand corruption matters. 69% of the reports surveyed this year included a mentionof how the company addresses the possibility of bribery or corruption, either inthe strategic report itself or, quite often, in the corporate governance statement.Exactly how this information is required to be presented in the future will dependon how the EU directive is incorporated into UK law, but it is encouraging to see ahigh level of companies are already considering this area in some way.
Greenhouse gas reportingNot every company has provided emissions data that obviously complies with thenew regulations – only 87% of the reports surveyed clearly did so, with a further7% providing some numerical information. Of those that provided no quantication
of total emissions, two took advantage of the exemption available from disclosurein the rst year of application where collecting the relevant data is not practical,two claimed that emissions were immaterial, one provided an intensity measure butno absolute gure and one made no mention of greenhouse gas emissions.
31% of companies went further than the statutory requirements by also disclosing‘scope 3’ emissions data covering emissions from business travel.
This information is particularly relevant for service businesses with a lot ofinternational travel involved in their operations, such as consultancy rms, wherethese are much more signicant than scope 1 and 2. This is an area where the FTSE350 is leading the way, with 43% of those companies providing this informationcompared to 16% of those outside the FTSE 350. Some companies also give moredetailed sub-analysis than required by law, for example showing emissions bybusiness unit or by country.
89% of companies provided the required intensity measure relating theirgreenhouse gas emissions to an operational metric for their business. In addition,one company discussed the intensity measure they used but did not actually givethe numerical gure for it. The regulations give companies a completely free choiceof what intensity measure to use – gure 7.6 shows the metrics selected by the
companies surveyed.
Several companies in fact presented more than one such metric, with onecompany presenting ve different measures. A revenue comparison was noticeablymore popular amongst the smaller companies in our sample, with 55% of thosegiving this comparison compared to 48% of the FTSE 350. Other measures werecomparably less popular for the smaller companies.
Figure 7.6. What operational measures did companies choose to compare to greenhouse gas emissions?
0
20
40
60
Operational areaProt earnedAssets employedQuantity of productCustomer numbersEmployee numbersRevenue generated
51 24 15 101 23
Annual report insights 2014 53
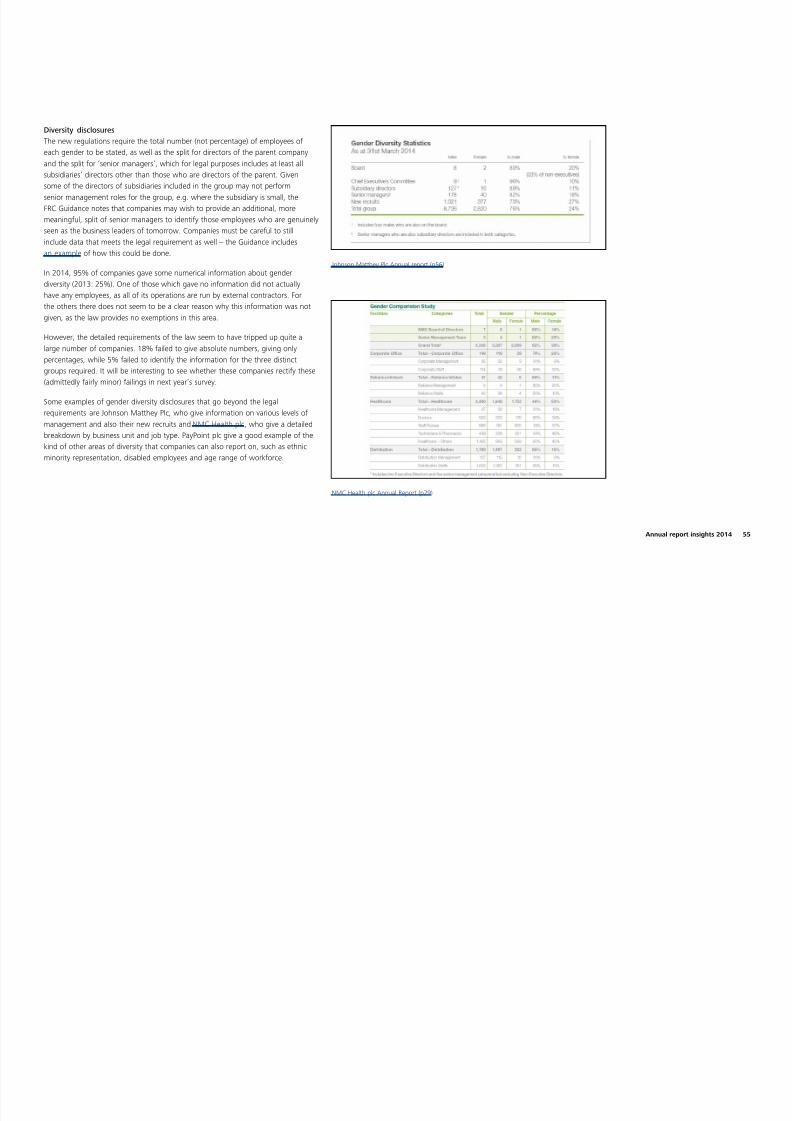
8/10/2019 Uk Audit Annual Report Insights14 Full Survey
http://slidepdf.com/reader/full/uk-audit-annual-report-insights14-full-survey 56/144

8/10/2019 Uk Audit Annual Report Insights14 Full Survey
http://slidepdf.com/reader/full/uk-audit-annual-report-insights14-full-survey 57/144
Diversity disclosuresThe new regulations require the total number (not percentage) of employees ofeach gender to be stated, as well as the split for directors of the parent companyand the split for ‘senior managers’, which for legal purposes includes at least allsubsidiaries’ directors other than those who are directors of the parent. Givensome of the directors of subsidiaries included in the group may not performsenior management roles for the group, e.g. where the subsidiary is small, theFRC Guidance notes that companies may wish to provide an additional, moremeaningful, split of senior managers to identify those employees who are genuinelyseen as the business leaders of tomorrow. Companies must be careful to stillinclude data that meets the legal requirement as well – the Guidance includesan example of how this could be done.
In 2014, 95% of companies gave some numerical information about gender
diversity (2013: 25%). One of those which gave no information did not actuallyhave any employees, as all of its operations are run by external contractors. Forthe others there does not seem to be a clear reason why this information was notgiven, as the law provides no exemptions in this area.
However, the detailed requirements of the law seem to have tripped up quite alarge number of companies. 18% failed to give absolute numbers, giving onlypercentages, while 5% failed to identify the information for the three distinctgroups required. It will be interesting to see whether these companies rectify these(admittedly fairly minor) failings in next year’s survey.
Some examples of gender diversity disclosures that go beyond the legalrequirements are Johnson Matthey Plc , who give information on various levels of
management and also their new recruits and NMC Health plc, who give a detailedbreakdown by business unit and job type. PayPoint plc give a good example of thekind of other areas of diversity that companies can also report on, such as ethnicminority representation, disabled employees and age range of workforce.
Johnson Matthey Plc Annual report (p56)
NMC Health plc Annual Report (p29)
Annual report insights 2014 55
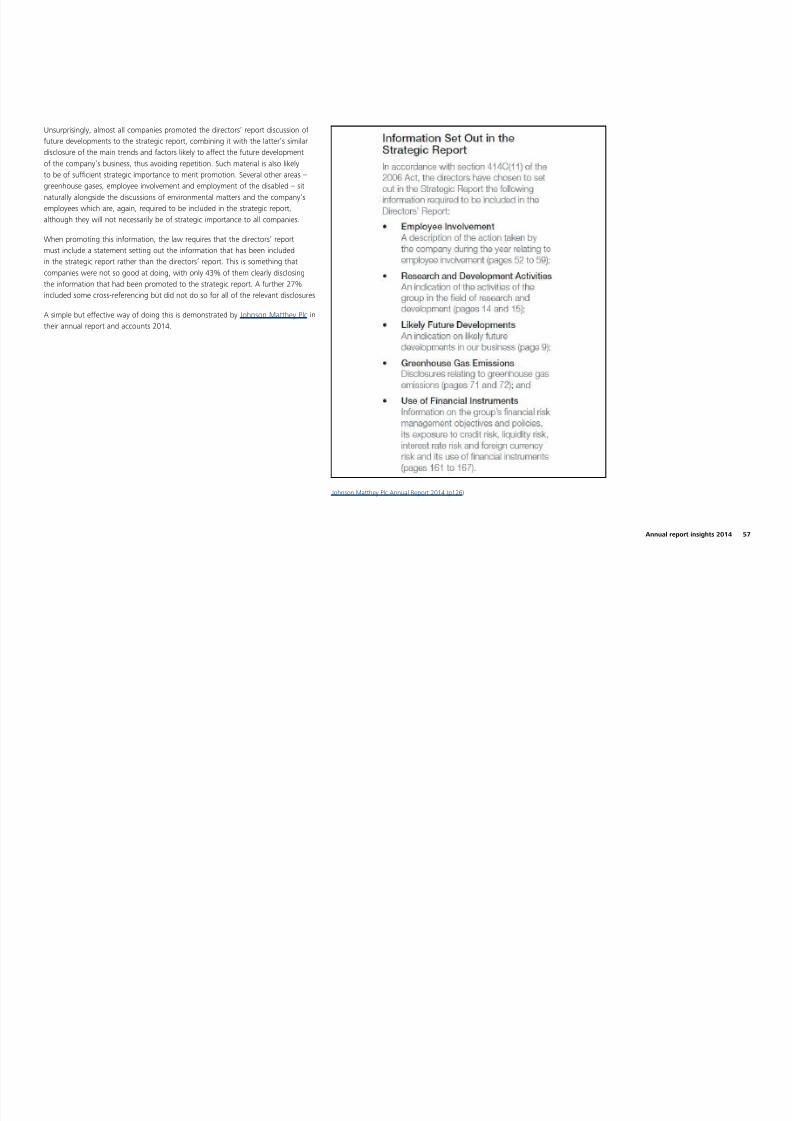
8/10/2019 Uk Audit Annual Report Insights14 Full Survey
http://slidepdf.com/reader/full/uk-audit-annual-report-insights14-full-survey 58/144
Legal issuesApprovalOnly 73% of companies clearly demonstrated compliance with the legalrequirement that the strategic report should be approved by the board. It is notclear whether this approval needs to be separate from that for the directors’ report– the law makes no mention of combined approval, although Companies Househave accepted annual reports with this as long as the approval clearly relates to thedirectors’ report and strategic report. 67% of the companies in our sample includedan approval for the strategic report that was clearly separate from the approval forthe directors’ report, indicating that the majority of companies are viewing this asthe correct way to approach the requirement.
Relationship with the directors’ reportSeveral companies indicated that their strategic report was a component of the
directors’ report, usually incorporating it by cross-reference.
This incorporation was necessary with the old business review to ensure that itwas included in the ‘safe harbour’ provisions applicable to the director’ report.However, the strategic report is a legally separate component of the annual report(and is covered by safe harbour provisions in its own right) and so should be aseparate report. Two of the companies surveyed did not clearly identify a sectionof their report as the strategic report, instead using a slightly different term such asstrategic review.
Another slightly ddly legal area is the inclusion of information in the strategicreport that is, by law, required to be included in the directors’ report. The lawprovides an option for companies to ‘promote’ to the strategic report variousdisclosures, which would otherwise be required in the directors’ report, if they areof strategic importance – an option that 97% of the companies we surveyed tookadvantage of. Figure 7.7 shows the most common disclosures that were promoted
in this way.
* For research and development and post balance sheet events, the percentage quoted is the percentage of those companies with signicant research and development activities or postbalance-sheet events.
Figure 7.7. What information is promoted to the strategic report?
Percentage of companies promoting
0%
20%
40%
60%
80%
100%
Employment of disabledEmployee involvementPost balance sheet events*Research & development*Future developmentsGreenhouse Gas emissions
70% 96% 61% 33% 61%15 58%
56
8/10/2019 Uk Audit Annual Report Insights14 Full Survey
http://slidepdf.com/reader/full/uk-audit-annual-report-insights14-full-survey 59/144
Unsurprisingly, almost all companies promoted the directors’ report discussion offuture developments to the strategic report, combining it with the latter’s similardisclosure of the main trends and factors likely to affect the future developmentof the company’s business, thus avoiding repetition. Such material is also likelyto be of sufcient strategic importance to merit promotion. Several other areas –greenhouse gases, employee involvement and employment of the disabled – sitnaturally alongside the discussions of environmental matters and the company’semployees which are, again, required to be included in the strategic report,although they will not necessarily be of strategic importance to all companies.
When promoting this information, the law requires that the directors’ reportmust include a statement setting out the information that has been includedin the strategic report rather than the directors’ report. This is something thatcompanies were not so good at doing, with only 43% of them clearly disclosing
the information that had been promoted to the strategic report. A further 27%included some cross-referencing but did not do so for all of the relevant disclosures.
A simple but effective way of doing this is demonstrated by Johnson Matthey Plc intheir annual report and accounts 2014.
Johnson Matthey Plc Annual Report 2014 (p126)
Annual report insights 2014 57

8/10/2019 Uk Audit Annual Report Insights14 Full Survey
http://slidepdf.com/reader/full/uk-audit-annual-report-insights14-full-survey 60/144
8. Principal risks
This chapter looks in more detail at the identication and reporting of principalrisks and uncertainties by the companies in our sample. Company law requires allcompanies (other than small companies) to present a description of the principalrisks and uncertainties that they face in their strategic report. Although the lawdoes not explicitly require it, it is widely accepted that a key part of this descriptionis a discussion of the mitigating activities undertaken by the company to managethis risk. Indeed, the FRRP have historically said that they expect the mitigatingactivities to be disclosed and the FRC Guidance recommends such disclosure. Intheir latest consultation on updates to the UK Corporate Governance Code, the FRChas also proposed introducing a specic requirement for companies to explain howtheir risks are managed and mitigated.
94% (2013: 93%) of companies included a discussion of risk mitigation, with 86%(2013: 74%) making a clear distinction between the discussion of the risk and the
associated risk management activity, allowing users to easily distinguish the two.
Identication of risksNumber of principal risksIt is important that the discussion focuses only on the principal risks and does notbecome a long list of potential risks, some of which may be unlikely and of lowpotential impact. The FRC Guidance equates the use of the term ‘principal’ withtheir idea of materiality in the context of narrative reporting, i.e. that they shouldbe the risks that could inuence the economic decisions of shareholders. 95% ofthe companies surveyed clearly indicated that the risks discussed were the principalrisks to the business (2013: 87%). Restricting the discussion to only those risksthat are most important also allows a company to give a full discussion of each
risk without creating a statement of excessive length, providing more meaningfulinformation to users.
Top tips
• Identify an appropriate number of principal risks – the median number identied bycompanies in our sample was 9 (2013: 9).
• Make clear the specic relevance of each of the risks identied to your business –64% (2013: 59%) of companies did this for all of their principal risks.
• Keep your risks up to date – considerably fewer companies identied principal risksaround the state of the economy (57% compared to 72% last year) and nancingissues (37% compared to 48%).
• Demonstrate active risk management by showing how risk priorities have changedsince last year – 33% (2013: 21%) of companies did this.
• Link your risk discussion to other areas of your report, such as st rategic priorities– 22% of companies clearly linked their risk discussion with the other informationpresented in the report in some way.
Keep an eye on
• W hat risks your peers are identifying as principal – operational issues, demandrisk, people retention and regulatory compliance were the most common.
• Clearly identifying your discussion of principal risks – 95% (2013: 87%) of
companies clearly did this.
• Discussing your mitigating actions for each risk – 94% (2013: 93%) of companiesdiscuss the actions being taken in response to the risks identied.
58
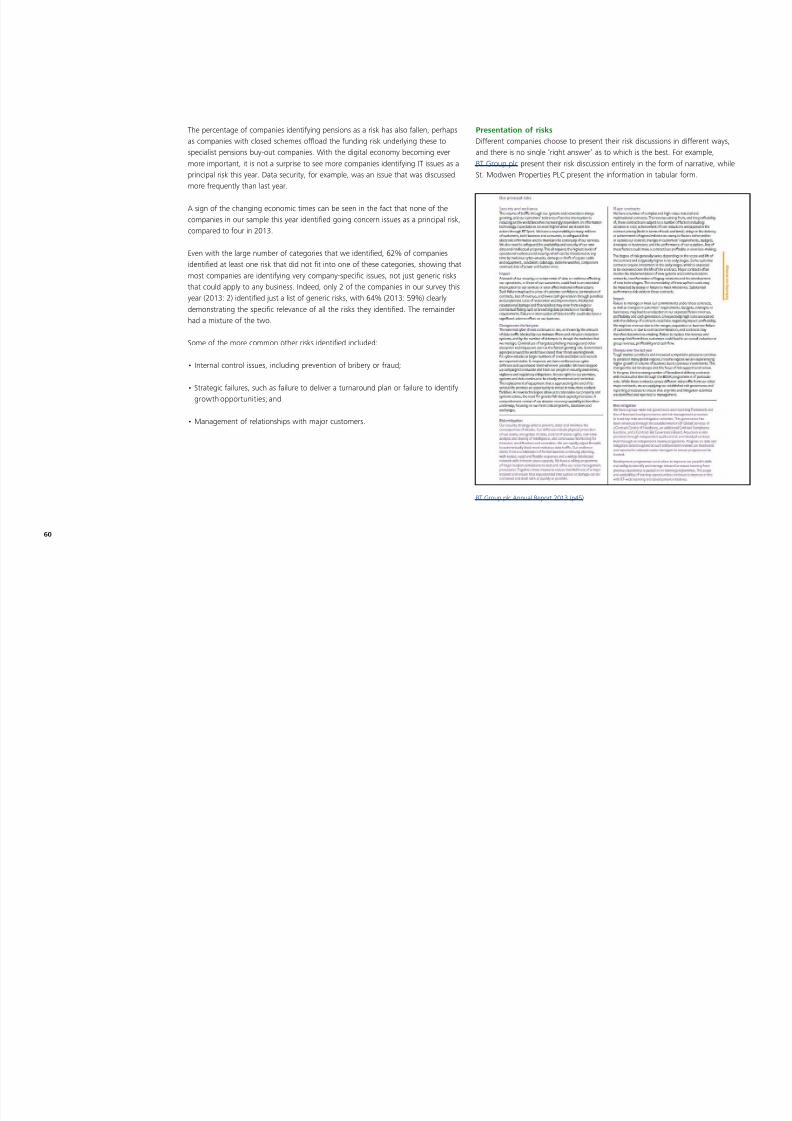
8/10/2019 Uk Audit Annual Report Insights14 Full Survey
http://slidepdf.com/reader/full/uk-audit-annual-report-insights14-full-survey 61/144
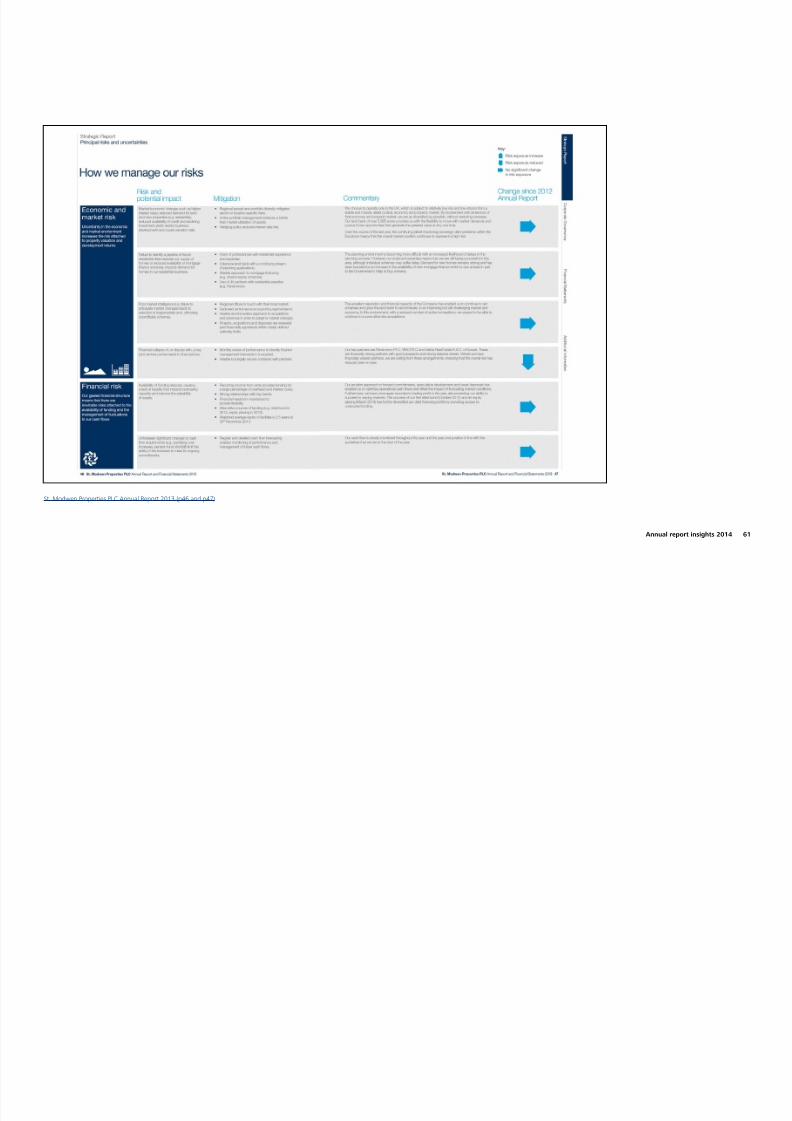
8/10/2019 Uk Audit Annual Report Insights14 Full Survey
http://slidepdf.com/reader/full/uk-audit-annual-report-insights14-full-survey 62/144
The percentage of companies identifying pensions as a risk has also fallen, perhapsas companies with closed schemes ofoad the funding risk underlying these tospecialist pensions buy-out companies. With the digital economy becoming evermore important, it is not a surprise to see more companies identifying IT issues as aprincipal risk this year. Data security, for example, was an issue that was discussedmore frequently than last year.
A sign of the changing economic times can be seen in the fact that none of thecompanies in our sample this year identied going concern issues as a principal risk,compared to four in 2013.
Even with the large number of categories that we identied, 62% of companiesidentied at least one risk that did not t into one of these categories, showing thatmost companies are identifying very company-specic issues, not just generic risks
that could apply to any business. Indeed, only 2 of the companies in our survey thisyear (2013: 2) identied just a list of generic risks, with 64% (2013: 59%) clearlydemonstrating the specic relevance of all the risks they identied. The remainderhad a mixture of the two.
Some of the more common other risks identied included:
• Internal control issues, including prevention of bribery or fraud;
• Strategic failures, such as failure to deliver a turnaround plan or failure to identifygrowth opportunities; and
• Management of relationships with major customers.
Presentation of risksDifferent companies choose to present their risk discussions in different ways,and there is no single ‘right answer’ as to which is the best. For example,BT Group plc present their risk discussion entirely in the form of narrative, whileSt. Modwen Properties PLC present the information in tabular form.
BT Group plc Annual Report 2013 (p45)
60
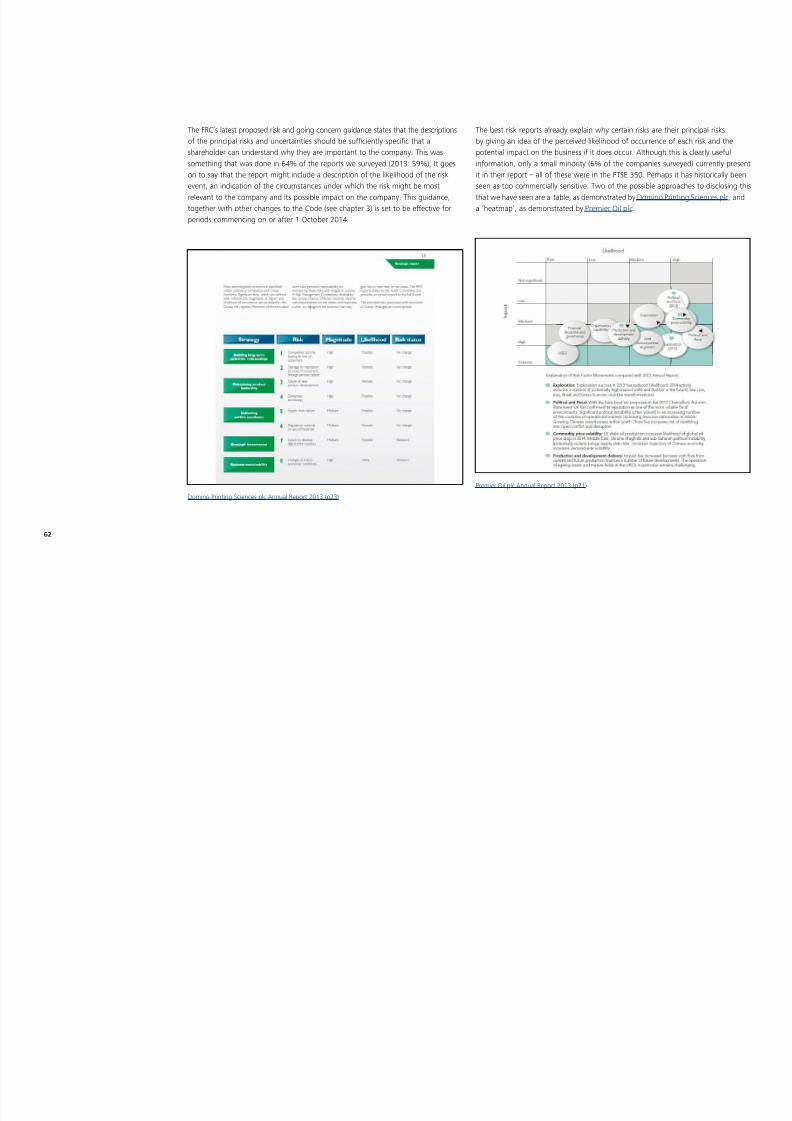
8/10/2019 Uk Audit Annual Report Insights14 Full Survey
http://slidepdf.com/reader/full/uk-audit-annual-report-insights14-full-survey 63/144

8/10/2019 Uk Audit Annual Report Insights14 Full Survey
http://slidepdf.com/reader/full/uk-audit-annual-report-insights14-full-survey 64/144
The FRC’s latest proposed risk and going concern guidance states that the descriptionsof the principal risks and uncertainties should be sufciently specic that ashareholder can understand why they are important to the company. This wassomething that was done in 64% of the reports we surveyed (2013: 59%). It goeson to say that the report might include a description of the likelihood of the riskevent, an indication of the circumstances under which the risk might be mostrelevant to the company and its possible impact on the company. This guidance,together with other changes to the Code (see chapter 3) is set to be effective forperiods commencing on or after 1 October 2014.
Domino Printing Sciences plc Annual Report 2013 (p23)
The best risk reports already explain why certain risks are their principal risksby giving an idea of the perceived likelihood of occurrence of each risk and thepotential impact on the business if it does occur. Although this is clearly usefulinformation, only a small minority (6% of the companies surveyed) currently presentit in their report – all of these were in the FTSE 350. Perhaps it has historically beenseen as too commercially sensitive. Two of the possible approaches to disclosing thisthat we have seen are a table, as demonstrated by Domino Printing Sciences plc , anda ‘heatmap’, as demonstrated by Premier Oil plc.
Premier Oil plc Annual Report 2013 (p71)
62

8/10/2019 Uk Audit Annual Report Insights14 Full Survey
http://slidepdf.com/reader/full/uk-audit-annual-report-insights14-full-survey 65/144
Both of these examples also illustrate how a company can indicate the changes inits risk landscape since the prior year. The FRC’s proposed risk guidance states thatsignicant changes in principal risks such as a change in the likelihood or possibleeffect, or the inclusion of new risks, should be highlighted and explained. This issomething that is currently discussed by a much higher proportion of companies,with 33% of companies doing so this year (2013: 21%). Again, a much higherproportion of companies in the FTSE 350 (45%) did this than the smaller companiessurveyed (18%).
A common way of disclosing changes is to use simple increase/no change/decreaseindicators, such as arrows, to indicate the change in risk – Savills plc gives anexample of this approach. However, an approach that may be more insightful isto give a narrative description of the change, as this allows a company to explainnot just that there has been a change but why, linking this to other changes in
the business. An effective example of this is given by Gresham Computing plc .Describing changes to risks also evidences that effective ongoing governanceprocesses are in place.
Gresham Computing plc Annual Report 2013 (p10)
Annual report insights 2014 63

8/10/2019 Uk Audit Annual Report Insights14 Full Survey
http://slidepdf.com/reader/full/uk-audit-annual-report-insights14-full-survey 66/144
Intermediate Capital Group plc Annual Report 2013 (p31)
Another interesting idea, illustrated by Intermediate Capital Group plc , is to presenta summary of the warning signs or “key risk indicators” monitored by management,giving a clear indication of how they will identify if the events that they areconcerned about occur.
Linkage of risks to the rest of the reportPrincipal risks are another area where linkage to other information elsewhere in thereport, as advocated by the FRC Guidance, can help users understand the biggerpicture. Showing which of a company’s strategic priorities are affected by the risksidentied is one of the more obvious links that can be drawn – 18% of the reportsin our sample demonstrated this relationship. An example of how this can be doneis shown by Hill & Smith Holdings PLC.
Hill & Smith Holdings PLC Annual Report 2013 (p16)
64
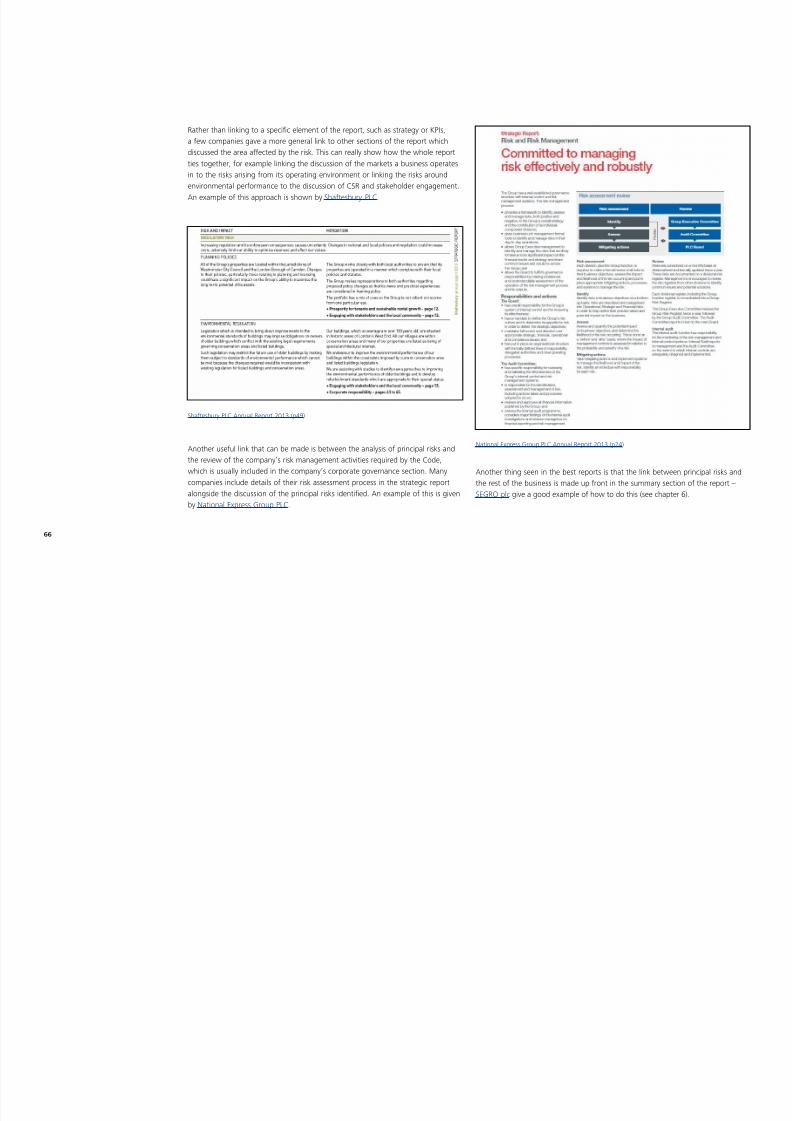
8/10/2019 Uk Audit Annual Report Insights14 Full Survey
http://slidepdf.com/reader/full/uk-audit-annual-report-insights14-full-survey 67/144
8/10/2019 Uk Audit Annual Report Insights14 Full Survey
http://slidepdf.com/reader/full/uk-audit-annual-report-insights14-full-survey 68/144
9 K f i di

8/10/2019 Uk Audit Annual Report Insights14 Full Survey
http://slidepdf.com/reader/full/uk-audit-annual-report-insights14-full-survey 69/144
Legally, all companies (other than small companies) are required to include intheir strategic report an analysis of the business using key performance indicators(KPIs). Unless a company qualies as medium-sized, this discussion must, whereappropriate, include non-nancial KPIs as well as nancial ones.
Key performance indicators are unquestionably one of the most importantpieces of information included in a company’s annual report. They are crucial inshowing investors how the company has performed against its objectives and howeffectively it has implemented its strategy. However, a truly useful discussion ofKPIs is just that – a discussion. It goes beyond just giving some numerical measuresto include a discussion of why these measures are important and what the gurespresented actually tell a reader about the company’s performance during the year.
Presentation of KPIs
91% of the companies we surveyed clearly identied which performance measuresthey considered to be KPIs (2013: 89%). Although there is no explicit legalrequirement to identify which measures are considered to be KPIs, it seems clear tous that to do so makes the information more useful to users. 89% (2013: 84%) gavethe values of their KPIs in the current year, rather than just listing which measuresthey considered to be KPIs – again, the inclusion of this information would seem tobe necessary in order to comply with the spirit of the law.
Something which is less clear is whether the most effective way to present KPIsis in a separate section of their own or as part of a narrative ow, perhaps in thediscussion of the strategy.
9. Key performance indicators
Top tips
• Identify a balanced selection of KPIs – on average companies identify 5nancial KPIs but only 2 non-nancial KPIs (2013: 5 nancial and 2 non-nancial).
• Consider what type of non-nancial indicators are really important tounderstanding the position and potential of the business – the most populartypes of non-nancial KPI we saw were employee-related, such as anemployee engagement index.
• Give an indication of future expectations for your KPIs, helping readers assesstheir relative performance – only 30% of companies gave this information(2013: 31%).
• Highlight links between KPIs and directors’ remuneration – 33% ofcompanies have a link between their KPIs and the measures used to assessdirectors’ remuneration (2013: 35%), although signicantly fewer clearlydemonstrate these links.
Keep an eye on
• The requirement to present appropriate non-nancial KPIs – only 64% ofcompanies clearly identify one or more of these (2013: 68%).
• How clearly the relationship between nancial KPIs and IFRS measures – 64% of
companies with nancial KPIs failed to provide a reconciliation showing this.
Annual report insights 2014 67
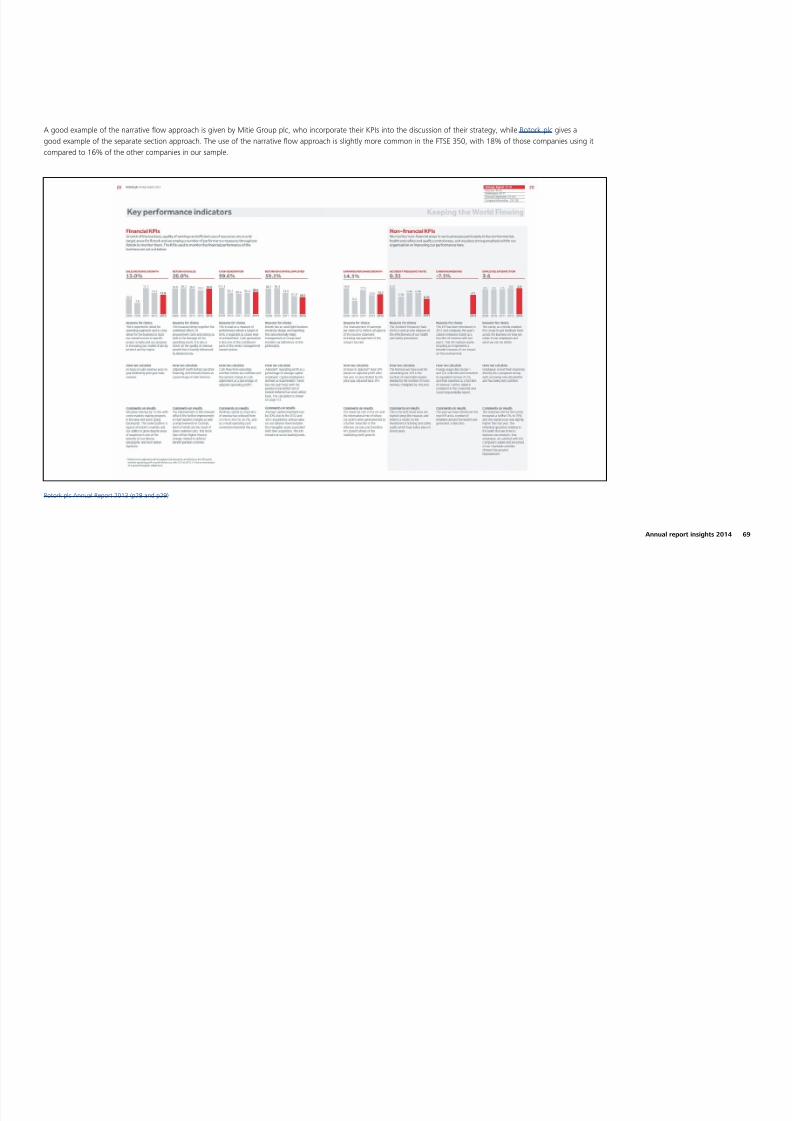
8/10/2019 Uk Audit Annual Report Insights14 Full Survey
http://slidepdf.com/reader/full/uk-audit-annual-report-insights14-full-survey 70/144
Figure 9.1 shows that the use of a separate section is the most prevalentpresentation, and seems to be increasing in its popularity (it was only used by 62%of the companies surveyed in 2013), but both approaches can be effective whenused well. In particular, incorporating KPIs into the narrative can help show whythese particular measures have been selected.
Figure 9.1. How do companies present their KPIs?
Separate section Incorporated into text Not clearly identied
73%
10%
17%
Incorporating KPIs into the narrative can help show why these particular measures have been selected.
68
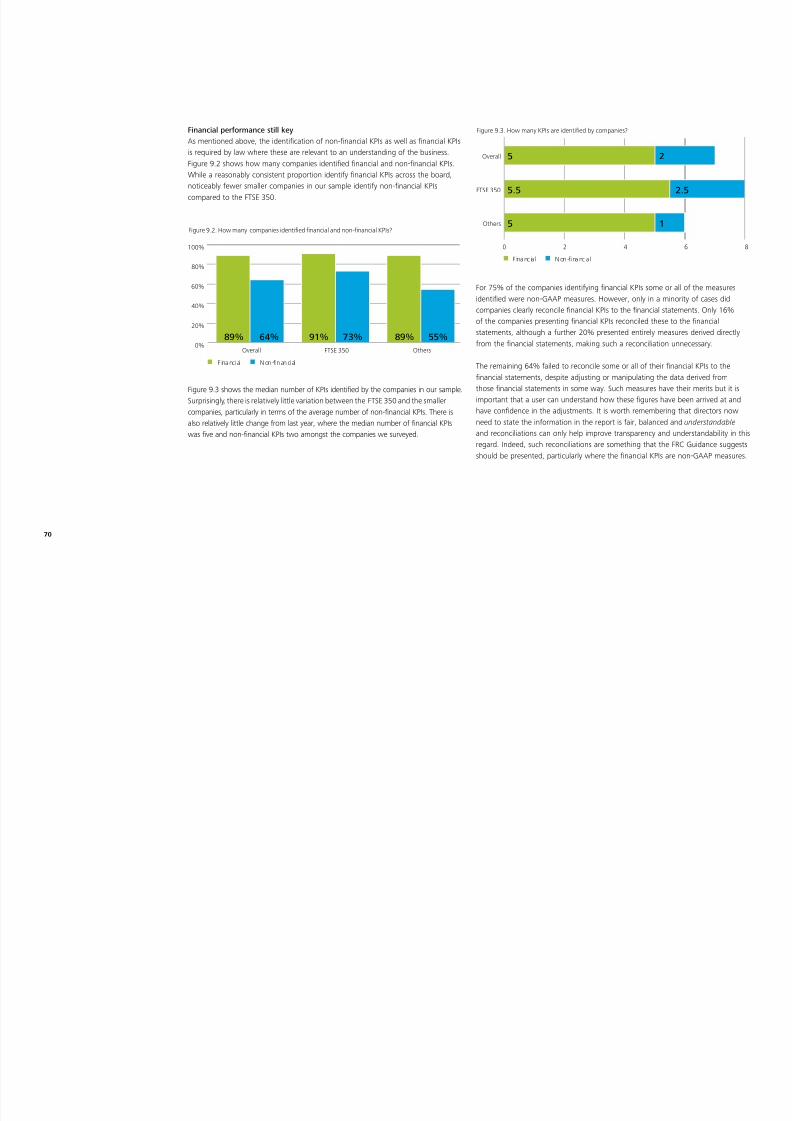
8/10/2019 Uk Audit Annual Report Insights14 Full Survey
http://slidepdf.com/reader/full/uk-audit-annual-report-insights14-full-survey 71/144
A good example of the narrative ow approach is given by Mitie Group plc , who incorporate their KPIs into the discussion of their strategy, while Rotork plc gives agood example of the separate section approach. The use of the narrative ow approach is slightly more common in the FTSE 350, with 18% of those companies using itcompared to 16% of the other companies in our sample.
Rotork plc Annual Report 2013 (p28 and p29)
Annual report insights 2014 69

8/10/2019 Uk Audit Annual Report Insights14 Full Survey
http://slidepdf.com/reader/full/uk-audit-annual-report-insights14-full-survey 72/144
Financial performance still keyAs mentioned above, the identication of non-nancial KPIs as well as nancial KPIsis required by law where these are relevant to an understanding of the business.Figure 9.2 shows how many companies identied nancial and non-nancial KPIs.While a reasonably consistent proportion identify nancial KPIs across the board,noticeably fewer smaller companies in our sample identify non-nancial KPIscompared to the FTSE 350.
0%
20%
40%
60%
80%
100%
OthersFTSE 350Overall
Figure 9.2. How many companies identied nancial and non-nancial KPIs?
89% 64% 91% 73% 89% 55%
F ina nci al N on -n an ci al
Figure 9.3 shows the median number of KPIs identied by the companies in our sample.Surprisingly, there is relatively little variation between the FTSE 350 and the smallercompanies, particularly in terms of the average number of non-nancial KPIs. There is
also relatively little change from last year, where the median number of nancial KPIswas ve and non-nancial KPIs two amongst the companies we surveyed.
Figure 9.3. How many KPIs are identied by companies?
F ina nc ia l N on - na nc ia l
0 2 4 6 8
Others
FTSE 350
Overall
5
5
5.5
1
2
2.5
For 75% of the companies identifying nancial KPIs some or all of the measuresidentied were non-GAAP measures. However, only in a minority of cases didcompanies clearly reconcile nancial KPIs to the nancial statements. Only 16%of the companies presenting nancial KPIs reconciled these to the nancialstatements, although a further 20% presented entirely measures derived directlyfrom the nancial statements, making such a reconciliation unnecessary.
The remaining 64% failed to reconcile some or all of their nancial KPIs to thenancial statements, despite adjusting or manipulating the data derived fromthose nancial statements in some way. Such measures have their merits but it isimportant that a user can understand how these gures have been arrived at andhave condence in the adjustments. It is worth remembering that directors now
need to state the information in the report is fair, balanced and understandable and reconciliations can only help improve transparency and understandability in thisregard. Indeed, such reconciliations are something that the FRC Guidance suggestsshould be presented, particularly where the nancial KPIs are non-GAAP measures.
70
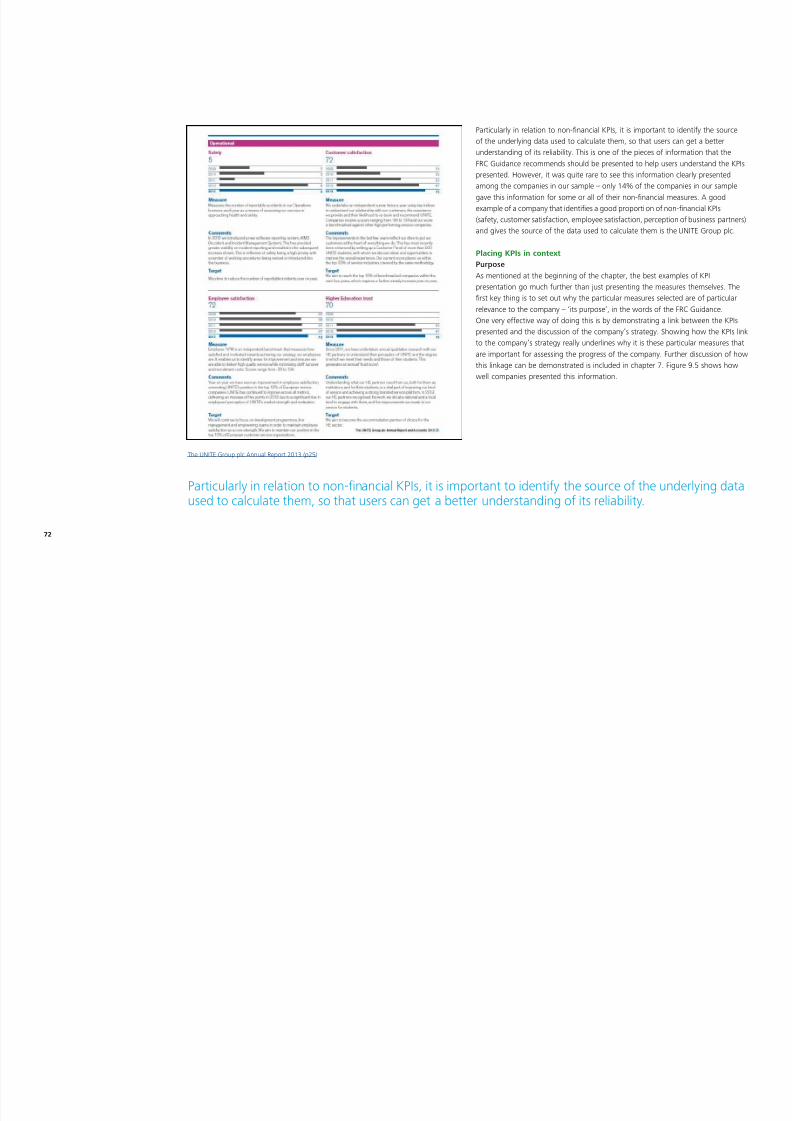
8/10/2019 Uk Audit Annual Report Insights14 Full Survey
http://slidepdf.com/reader/full/uk-audit-annual-report-insights14-full-survey 73/144
BT Group plc show an effective way of providing a reconciliation unobtrusively, bypresenting detailed reconciliations in an appendix. See chapter 6 for a wider discussionof the use of non-GAAP measures in summary information sections and the regulatoryoverview in chapter 3 for a discussion of their use more generally in annual reports.
Another interesting question is whether, for a business that has multiple operatingunits that function largely independently and perhaps in different markets, it ismore useful to present KPIs for the whole business or for individual operating units.In practice, the latter may be most useful to investors, as measures that cover theentire group may be unnecessarily generic and not give a particularly good insightinto its operations – this group-wide information may be best left to nancial highlightsof the sort typically presented in a company’s initial summary section (see chapter 6).An example of using different KPIs for different operating units is given by Findel plc.
Findel plc Annual Report 2013 (p8)
Non-nancial KPIsFigure 9.4 shows the most common types of non-nancial KPI identied bycompanies in our 2014 survey sample, including those measures identied as KPIs inthe CSR report as well as the main body of the strategic report.
0%
5%10%
15%
20%
25%
30%
35%
40%
45%
Customer relatedHealth & safetyEnvironmentEmployee related
Figure 9.4. What type of non-nancial KPIs are included within the annual report?
36% 41% 26% 29% 28%30% 20% 27%
2014 2013
It is interesting to see the prevalence of employee-related KPIs (such as employeesatisfaction) and environmental KPIs (such as waste generated) declining since lastyear, particularly given the promotion of initiatives such as integrated reporting andthe perceived focus on discussions around corporate social responsibility. This haspartly arisen because some of the companies in our sample have revised their KPIsin the light of strategic or other changes, with part of the drop also attributable to
the change in our sample this year (see Appendix 1 for more detail on this). Wherecompanies have revised their KPIs this has not always resulted in a drop in thenumber of non-nancial KPIs – in some instances the focus has shifted away fromthe areas set out above towards more operational measures.
Annual report insights 2014 71
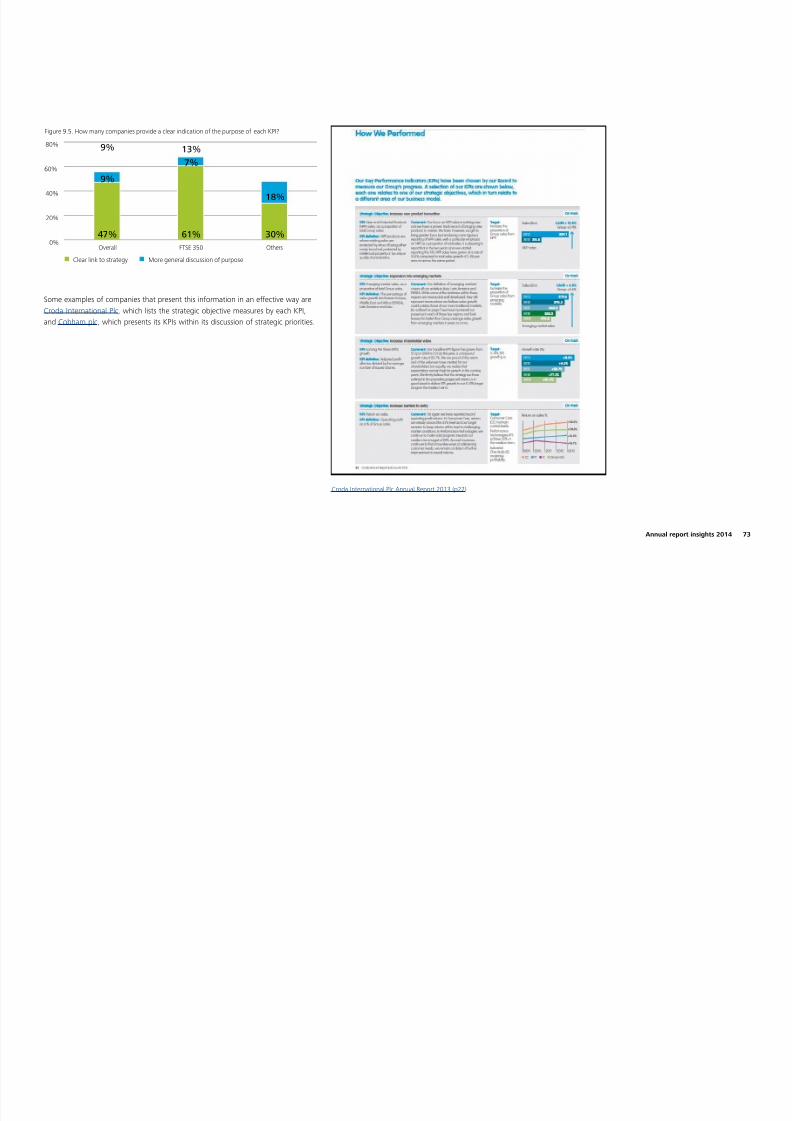
8/10/2019 Uk Audit Annual Report Insights14 Full Survey
http://slidepdf.com/reader/full/uk-audit-annual-report-insights14-full-survey 74/144
The UNITE Group plc Annual Report 2013 (p25)
Particularly in relation to non-nancial KPIs, it is important to identify the sourceof the underlying data used to calculate them, so that users can get a better
understanding of its reliability. This is one of the pieces of information that theFRC Guidance recommends should be presented to help users understand the KPIspresented. However, it was quite rare to see this information clearly presentedamong the companies in our sample – only 14% of the companies in our samplegave this information for some or all of their non-nancial measures. A goodexample of a company that identies a good proporti on of non-nancial KPIs(safety, customer satisfaction, employee satisfaction, perception of business partners)and gives the source of the data used to calculate them is the UNITE Group plc.
Placing KPIs in contextPurposeAs mentioned at the beginning of the chapter, the best examples of KPI
presentation go much further than just presenting the measures themselves. Therst key thing is to set out why the particular measures selected are of particularrelevance to the company – ‘its purpose’, in the words of the FRC Guidance.One very effective way of doing this is by demonstrating a link between the KPIspresented and the discussion of the company’s strategy. Showing how the KPIs linkto the company’s strategy really underlines why it is these particular measures thatare important for assessing the progress of the company. Further discussion of howthis linkage can be demonstrated is included in chapter 7. Figure 9.5 shows howwell companies presented this information.
Particularly in relation to non-nancial KPIs, it is important to identify the source of the underlying dataused to calculate them, so that users can get a better understanding of its reliability.
72
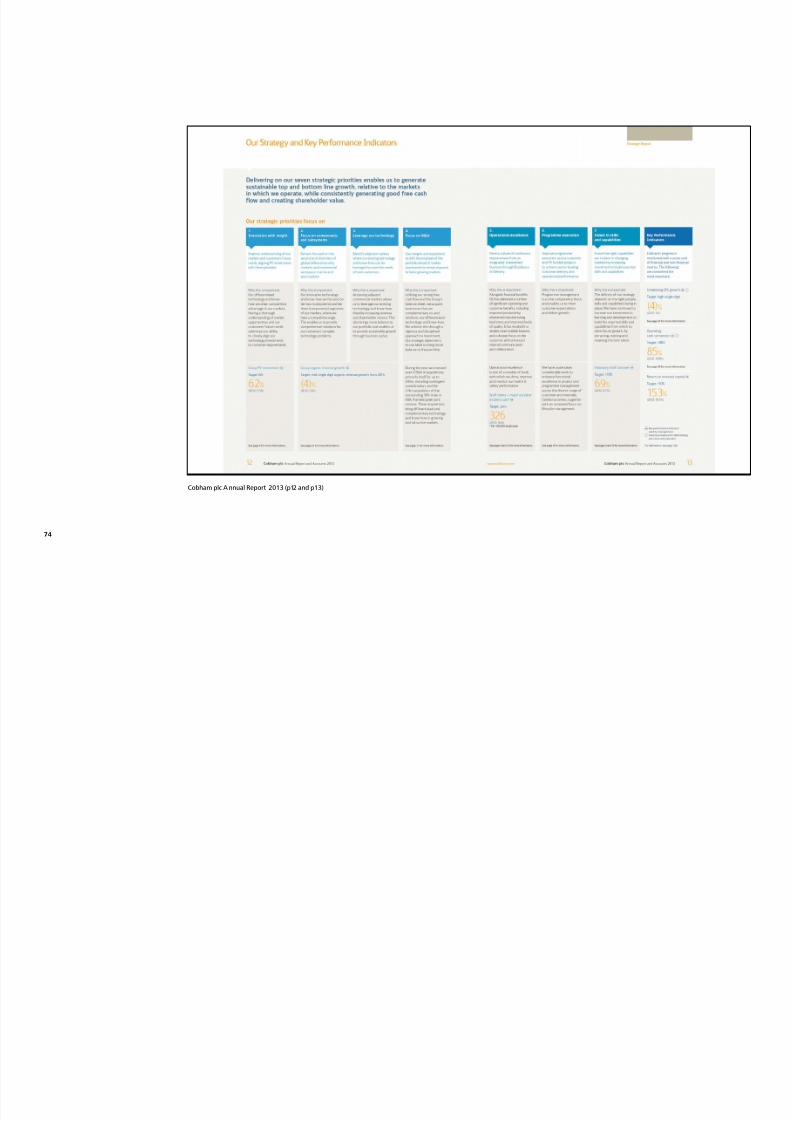
8/10/2019 Uk Audit Annual Report Insights14 Full Survey
http://slidepdf.com/reader/full/uk-audit-annual-report-insights14-full-survey 75/144
0%
20%
40%
60%
80%
OthersFTSE 350Overall
Figure 9.5. How many companies provide a clear indication of the purpose of each KPI?
47% 61% 30%
18%
9%
9%7%
13%
More general discussion of purposeClear link to strategy
Some examples of companies that present this information in an effective way areCroda International Plc , which lists the strategic objective measures by each KPI,and Cobham plc , which presents its KPIs within its discussion of strategic priorities.
Croda International Plc Annual Report 2013 (p22)
Annual report insights 2014 73
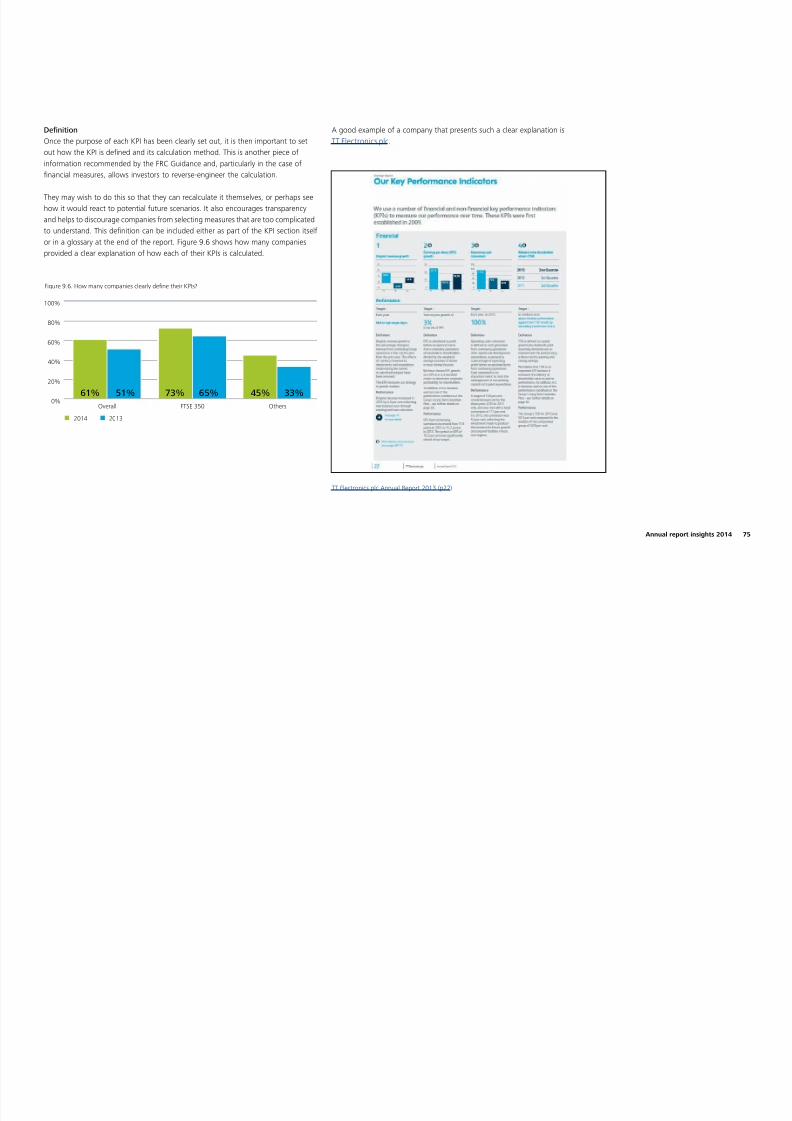
8/10/2019 Uk Audit Annual Report Insights14 Full Survey
http://slidepdf.com/reader/full/uk-audit-annual-report-insights14-full-survey 76/144
Cobham plc A nnual Report 2013 (p12 and p13)
74
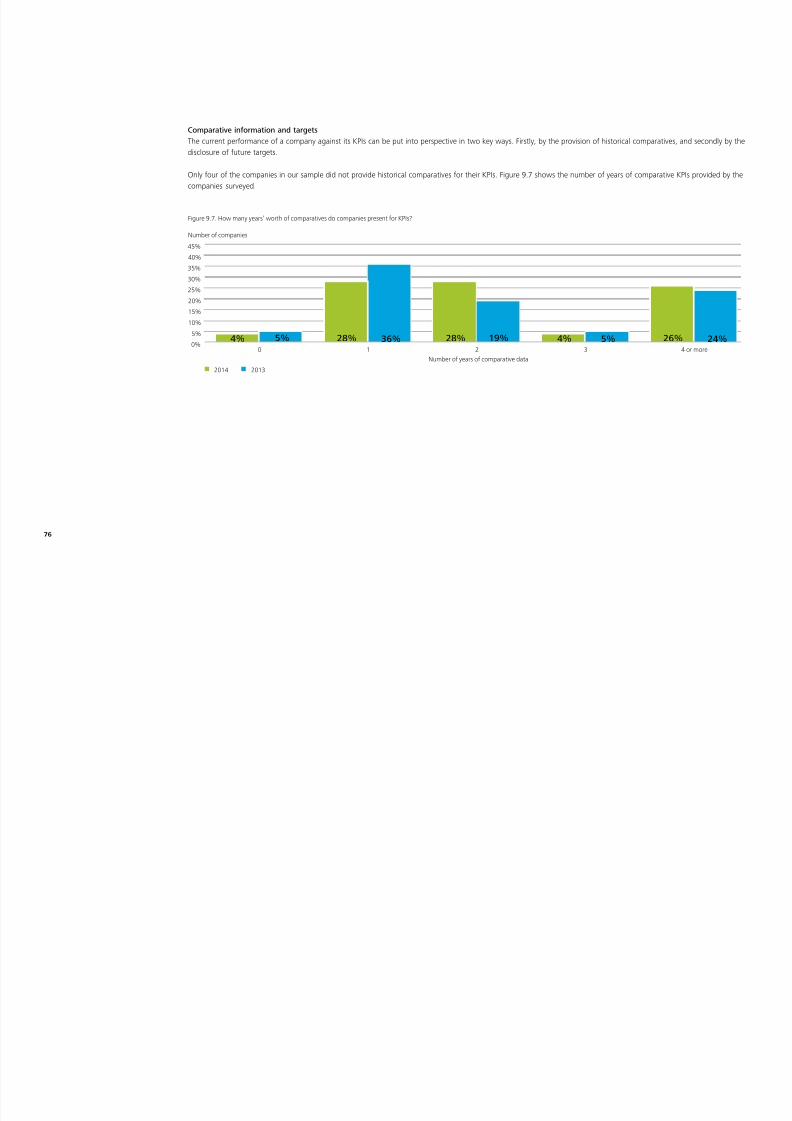
8/10/2019 Uk Audit Annual Report Insights14 Full Survey
http://slidepdf.com/reader/full/uk-audit-annual-report-insights14-full-survey 77/144
DenitionOnce the purpose of each KPI has been clearly set out, it is then important to set
out how the KPI is dened and its calculation method. This is another piece ofinformation recommended by the FRC Guidance and, particularly in the case ofnancial measures, allows investors to reverse-engineer the calculation.
They may wish to do this so that they can recalculate it themselves, or perhaps seehow it would react to potential future scenarios. It also encourages transparencyand helps to discourage companies from selecting measures that are too complicatedto understand. This denition can be included either as part of the KPI section itselfor in a glossary at the end of the report. Figure 9.6 shows how many companiesprovided a clear explanation of how each of their KPIs is calculated.
0%
20%
40%
60%
80%
100%
OthersFTSE 350Overall
Figure 9.6. How many companies clearly dene their KPIs?
61% 51% 73% 65% 45% 33%
2014 2013
A good example of a company that presents such a clear explanation isTT Electronics plc.
TT Electronics plc Annual Report 2013 (p22)
Annual report insights 2014 75
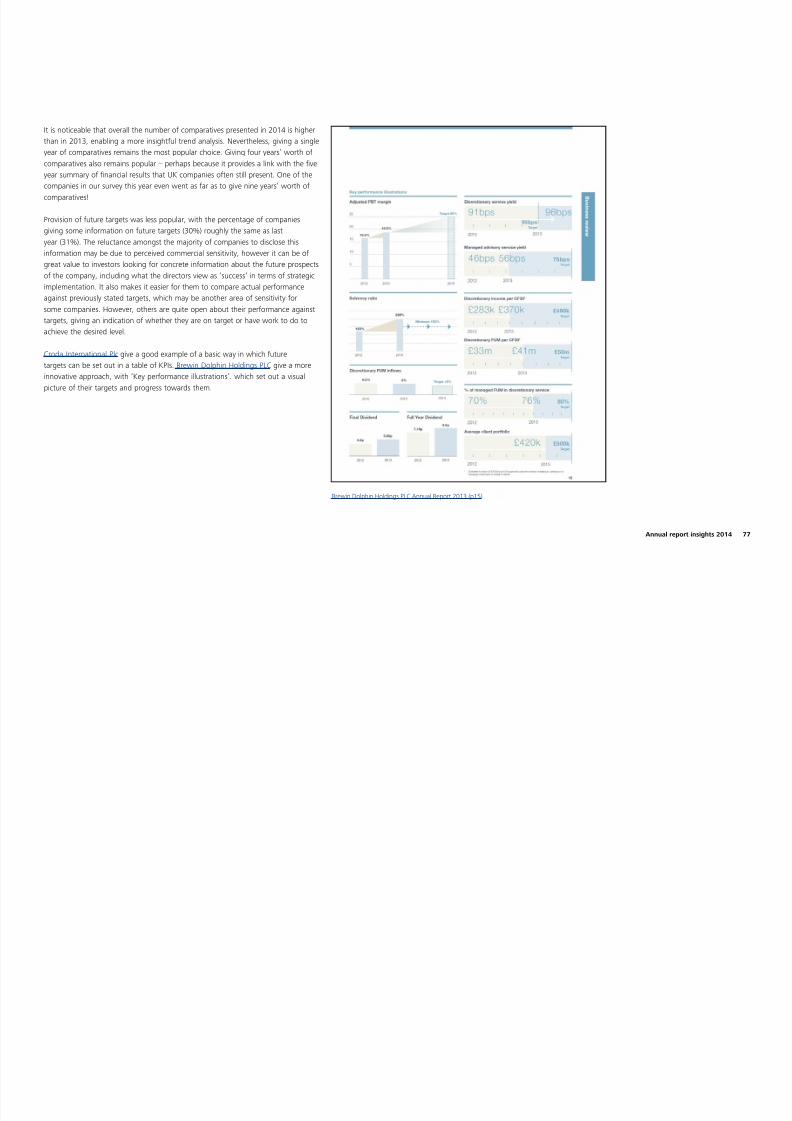
8/10/2019 Uk Audit Annual Report Insights14 Full Survey
http://slidepdf.com/reader/full/uk-audit-annual-report-insights14-full-survey 78/144
Comparative information and targetsThe current performance of a company against its KPIs can be put into perspective in two key ways. Firstly, by the provision of historical comparatives, and secondly by the
disclosure of future targets.
Only four of the companies in our sample did not provide historical comparatives for their KPIs. Figure 9.7 shows the number of years of comparative KPIs provided by thecompanies surveyed.
0%
5%
10%
15%
20%25%
30%
35%
40%
45%
4 or more3210
Figure 9.7. How many years’ worth of comparatives do companies present for KPIs?
Number of companies
4% 5% 28% 36% 28% 4%19% 26% 24%5%
2014 2013
Number of years of comparative data
76

8/10/2019 Uk Audit Annual Report Insights14 Full Survey
http://slidepdf.com/reader/full/uk-audit-annual-report-insights14-full-survey 79/144
It is noticeable that overall the number of comparatives presented in 2014 is higherthan in 2013, enabling a more insightful trend analysis. Nevertheless, giving a single
year of comparatives remains the most popular choice. Giving four years’ worth ofcomparatives also remains popular – perhaps because it provides a link with the veyear summary of nancial results that UK companies often still present. One of thecompanies in our survey this year even went as far as to give nine years’ worth ofcomparatives!
Provision of future targets was less popular, with the percentage of companiesgiving some information on future targets (30%) roughly the same as lastyear (31%). The reluctance amongst the majority of companies to disclose thisinformation may be due to perceived commercial sensitivity, however it can be ofgreat value to investors looking for concrete information about the future prospectsof the company, including what the directors view as ‘success’ in terms of strategic
implementation. It also makes it easier for them to compare actual performanceagainst previously stated targets, which may be another area of sensitivity forsome companies. However, others are quite open about their performance againsttargets, giving an indication of whether they are on target or have work to do toachieve the desired level.
Croda International Plc give a good example of a basic way in which futuretargets can be set out in a table of KPIs. Brewin Dolphin Holdings PLC give a moreinnovative approach, with ‘Key performance illustrations’. which set out a visualpicture of their targets and progress towards them.
Brewin Dolphin Holdings PLC Annual Report 2013 (p15)
Annual report insights 2014 77
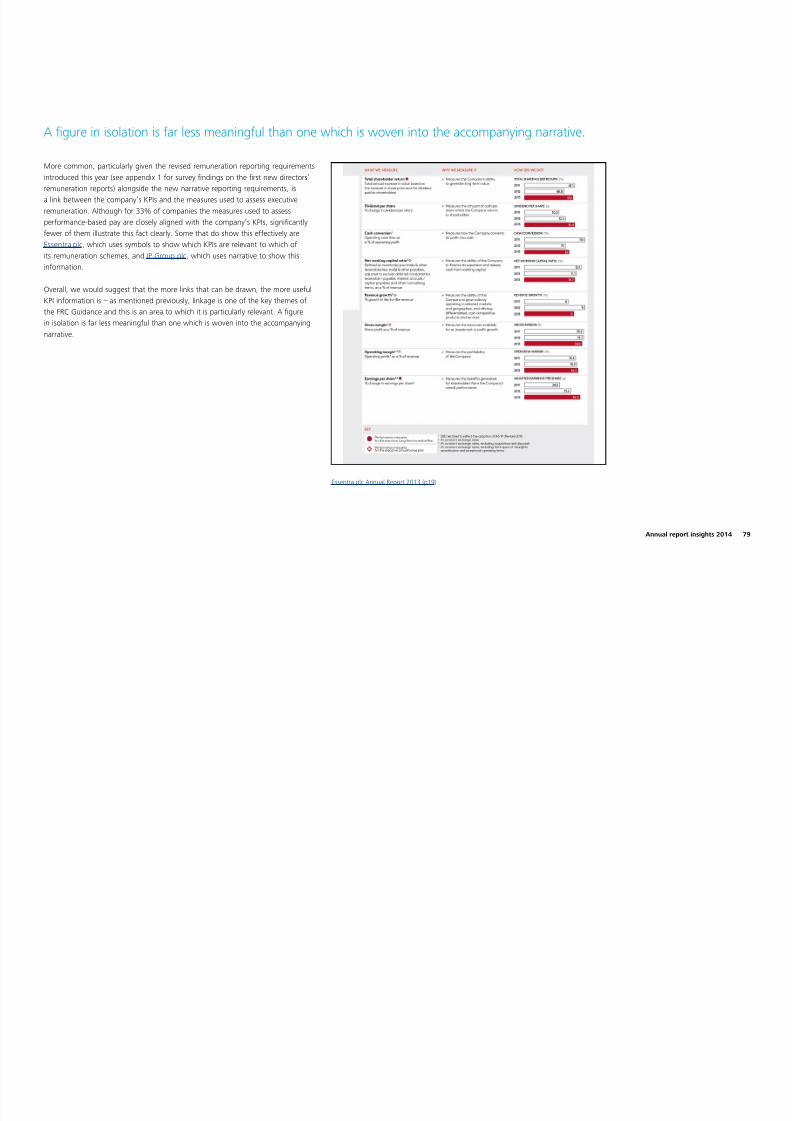
8/10/2019 Uk Audit Annual Report Insights14 Full Survey
http://slidepdf.com/reader/full/uk-audit-annual-report-insights14-full-survey 80/144
Other linkagesAnother link that can be usefully made is between KPIs and the company’s principal risks, showing which risks might affect the future performance of the company against
each of its KPIs. IP Group plc give a good illustration of how this linkage can be presented. Brewin Dolphin Holdings PLC also present a link to ‘potential challenges’ thatmight affect each KPI, giving similar information, although this does not provide a direct link to the identied principal risks.
IP Group plc Annual Report 2013 (p30 and p31)
78

8/10/2019 Uk Audit Annual Report Insights14 Full Survey
http://slidepdf.com/reader/full/uk-audit-annual-report-insights14-full-survey 81/144
More common, particularly given the revised remuneration reporting requirementsintroduced this year (see appendix 1 for survey ndings on the rst new directors’remuneration reports) alongside the new narrative reporting requirements, isa link between the company’s KPIs and the measures used to assess executiveremuneration. Although for 33% of companies the measures used to assessperformance-based pay are closely aligned with the company’s KPIs, signicantlyfewer of them illustrate this fact clearly. Some that do show this effectively areEssentra plc, which uses symbols to show which KPIs are relevant to which ofits remuneration schemes, and IP Group plc, which uses narrative to show thisinformation.
Overall, we would suggest that the more links that can be drawn, the more usefulKPI information is – as mentioned previously, linkage is one of the key themes ofthe FRC Guidance and this is an area to which it is particularly relevant. A gurein isolation is far less meaningful than one which is woven into the accompanyingnarrative.
Essentra plc Annual Report 2013 (p19)
A gure in isolation is far less meaningful than one which is woven into the accompanying narrative.
Annual report insights 2014 79
10 Going concern

8/10/2019 Uk Audit Annual Report Insights14 Full Survey
http://slidepdf.com/reader/full/uk-audit-annual-report-insights14-full-survey 82/144
As we commented in our survey last year, going concern disclosures are acontinued area of focus for regulators and investors. With the recent publication ofthe 2014 Corporate Governance Code, we nally have a regulatory solution to theperceived problem highlighted by the 2008 nancial crisis – companies signed offas a going concern by their directors and auditors becoming insolvent within thetwelve month period that going concern assessment was supposed to cover.
However, it is not a solution that pleases everyone – the FRC has had to conducta delicate balancing act, balancing the demands of investors who want as much
comfort as possible with the concerns of directors and auditors over the level ofassurance that they can give over future events. The nal updated Code is largelyin line with the third consultation draft published by the FRC in April 2014 andwill be effective for periods commencing on or after 1 October 2014. See furtherdiscussion of this in the regulatory overview in chapter 3.
The revised Code requires two board statements. It keeps the existing goingconcern statement for accounting purposes relatively intact but introduces a new‘statement of ongoing viability’, in which directors will be required to state whetherthey have a reasonable expectation that the company will be able to continue inoperation and meet its liabilities as they fall due taking account of their currentposition and principal risks, and specify the period covered by this statement
(expected to be signicantly longer than twelve months) and why they consider itappropriate.
With the goalposts still moving in relation to this during the period of our survey, itis not a great surprise that companies have not made signicant efforts to complywith these, or any of the FRC’s previous draft proposals in this area. Only fourcompanies made any mention of going concern or solvency in their discussionof principal risks, something called for by the FRC’s November 2013 proposals.Similarly, only ve companies made any reference to developments in goingconcern reporting since the FRC’s 2009 guidance 15 on the subject.
10. Going concern
Top tips
• Make your going concern disclosure meaningful – only 69% of companiesgave clear, high quality going concern statements.
• Give an idea of the timeframe covered by your going concern assessment –31% of companies (2013: 30%) gave some indication of this.
Keep an eye on
• The requirements of the 2014 Code and associated guidance – withuncertainty throughout the period surveyed around the implementation ofthe recommendations of the Sharman inquiry, there was little progress in thequality of going concern disclosures compared to last year.
• Potential going concern uncertainties – 10% (2013: 10%) of the companiessurveyed discussed uncertainties in their going concern statement. None ofthese were serious enough to warrant an emphasis of matter in the audit report.
15 Going Concern and Liquidity Risk: Guidancefor Directors
80
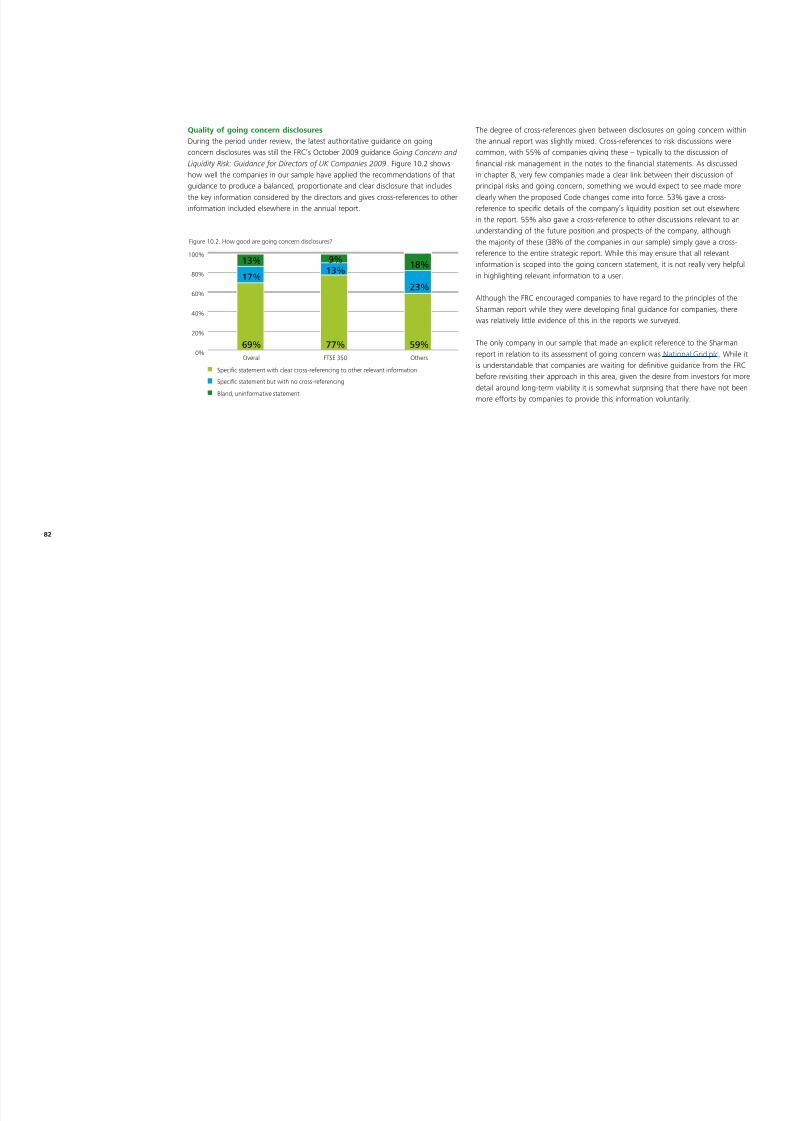
8/10/2019 Uk Audit Annual Report Insights14 Full Survey
http://slidepdf.com/reader/full/uk-audit-annual-report-insights14-full-survey 83/144

8/10/2019 Uk Audit Annual Report Insights14 Full Survey
http://slidepdf.com/reader/full/uk-audit-annual-report-insights14-full-survey 84/144
Quality of going concern disclosuresDuring the period under review, the latest authoritative guidance on going
concern disclosures was still the FRC’s October 2009 guidance Going Concern andLiquidity Risk: Guidance for Directors of UK Companies 2009 . Figure 10.2 showshow well the companies in our sample have applied the recommendations of thatguidance to produce a balanced, proportionate and clear disclosure that includesthe key information considered by the directors and gives cross-references to otherinformation included elsewhere in the annual report.
0%
20%
40%
60%
80%
100%
OthersFTSE 350Overall
Figure 10.2. How good are going concern disclosures?
69% 77% 59%
23%
18%13%
17%13%
9%
Specic statement with clear cross-referencing to other relevant information
Specic statement but with no cross-referencing
Bland, uninformative statement
The degree of cross-references given between disclosures on going concern withinthe annual report was slightly mixed. Cross-references to risk discussions were
common, with 55% of companies giving these – typically to the discussion ofnancial risk management in the notes to the nancial statements. As discussedin chapter 8, very few companies made a clear link between their discussion ofprincipal risks and going concern, something we would expect to see made moreclearly when the proposed Code changes come into force. 53% gave a cross-reference to specic details of the company’s liquidity position set out elsewherein the report. 55% also gave a cross-reference to other discussions relevant to anunderstanding of the future position and prospects of the company, althoughthe majority of these (38% of the companies in our sample) simply gave a cross-reference to the entire strategic report. While this may ensure that all relevantinformation is scoped into the going concern statement, it is not really very helpfulin highlighting relevant information to a user.
Although the FRC encouraged companies to have regard to the principles of theSharman report while they were developing nal guidance for companies, therewas relatively little evidence of this in the reports we surveyed.
The only company in our sample that made an explicit reference to the Sharmanreport in relation to its assessment of going concern was National Grid plc. While itis understandable that companies are waiting for denitive guidance from the FRCbefore revisiting their approach in this area, given the desire from investors for moredetail around long-term viability it is somewhat surprising that there have not beenmore efforts by companies to provide this information voluntarily.
82

8/10/2019 Uk Audit Annual Report Insights14 Full Survey
http://slidepdf.com/reader/full/uk-audit-annual-report-insights14-full-survey 85/144
National Grid plc Annual Report 2013 (p52)
Another company that made an effort to specically explain the key risks to itsgoing concern status and how these had been managed, something that has been
called for throughout the FRC’s consultations, was NMC Health plc.
NMC Health plc Annual Report 2013 (p41)
Annual report insights 2014 83

8/10/2019 Uk Audit Annual Report Insights14 Full Survey
http://slidepdf.com/reader/full/uk-audit-annual-report-insights14-full-survey 86/144
Two key elements of the best going concern disclosures are a clear discussion of thetimeframe covered by the company’s forecasts and a discussion of the time period
considered by the company for going concern purposes. These will not necessarilybe the same – although a company may prepare forecasts looking quite a longway into the future, the length of the business cycle and the inherent uncertaintyof the forecasting process may mean that it is neither necessary nor appropriate toconsider going concern over the full forecast period. Figure 10.3 shows the lengthof forecasts or budgets prepared for going concern purposes by the companies inour survey.
These results are almost identical to those of our survey last year. There does notappear to be any clear reason why companies should not give this information. Itseems likely that most simply feel that investors trust them to be reviewing forecastsfor an appropriate period without needing to be told what this is. However, more
transparency will be required in this area under the latest FRC proposals.
Figure 10.3. Is the period of forecasts or budgets disclosed?
88%
No
Yes, 12 months from the balance sheet date
Yes, 12 months from signing date
Yes, longer than 12 months from the signing date
73%
8%
4%
15%
Two key elements of the best going concern disclosures are a clear discussion of the timeframe coveredby the company’s forecasts and a discussion of the time period considered by the company for goingconcern purposes. These will not necessarily be the same …
84

8/10/2019 Uk Audit Annual Report Insights14 Full Survey
http://slidepdf.com/reader/full/uk-audit-annual-report-insights14-full-survey 87/144
11 Effective company stewardship
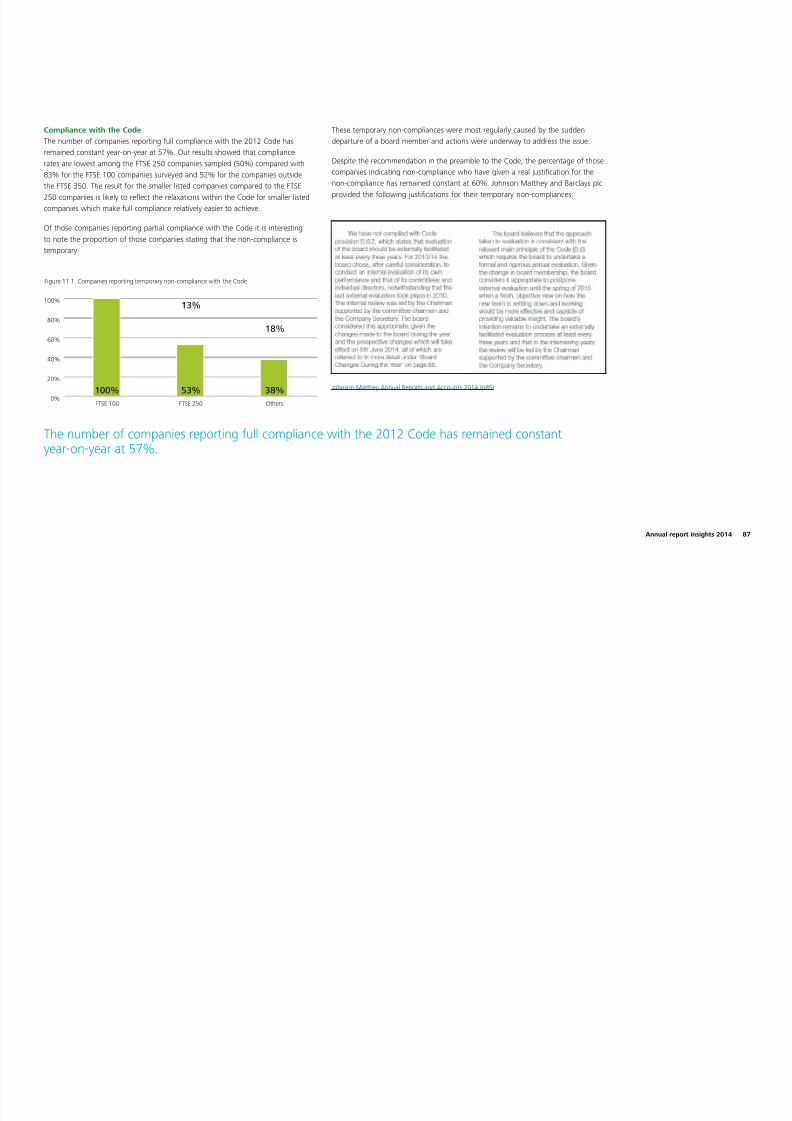
8/10/2019 Uk Audit Annual Report Insights14 Full Survey
http://slidepdf.com/reader/full/uk-audit-annual-report-insights14-full-survey 88/144
When the FRC issued the 2012 edition of the UK Corporate Governance Code,Baroness Hogg, the Chairman at the time, said the reporting changes were
“designed to give investors greater insight into what company boards and auditcommittees are doing to promote their interests, and to provide them with a betterbasis for engagement”. In other words, if the new strategic report is designedto provide a clear picture of the objectives and performance of the business, thecorporate governance statement is there to demonstrate the board’s stewardship ofthe business.
The changes included in the 2012 UK Corporate Governance Code were intendedto provide shareholders with a more dynamic statement on the activities of theboard and its committees. For example the changes included encouragement toprovide more meaningful explanations of non-compliances with the Code and theenhanced reporting by audit committees on the signicant issues considered andthe external audit relationship.
So has the new regime had the desired effect? As described further below, theresults have been mixed. For the purposes of this section of our survey we felt itwas important to highlight differences in the results between FTSE 100, FTSE 250and other listed companies.
11. Effective company stewardship
Top tips
• Include a statement on whether you have fully or partially complied with the UKCorporate Governance Code (“the Code”) – 57% (2013: 57%) of companies fullycomplied.
• Explain any areas of the Code which you did not comply with – the most commonareas of non-compliance were board independence and composition of the auditcommittee.
• Consider the benets that diversity can bring to the boardroom – the proportion ofcompanies with female directors has increased to 73% (2013: 69%) and the overallpopulation of female directors has also risen from 13% to 15%.
Keep an eye on
• Make sure you include the new statement from the board that the annualreport and accounts as a whole are fair, balanced and understandable – fourcompanies, all from our smaller listed companies category failed to do so.
86

8/10/2019 Uk Audit Annual Report Insights14 Full Survey
http://slidepdf.com/reader/full/uk-audit-annual-report-insights14-full-survey 89/144
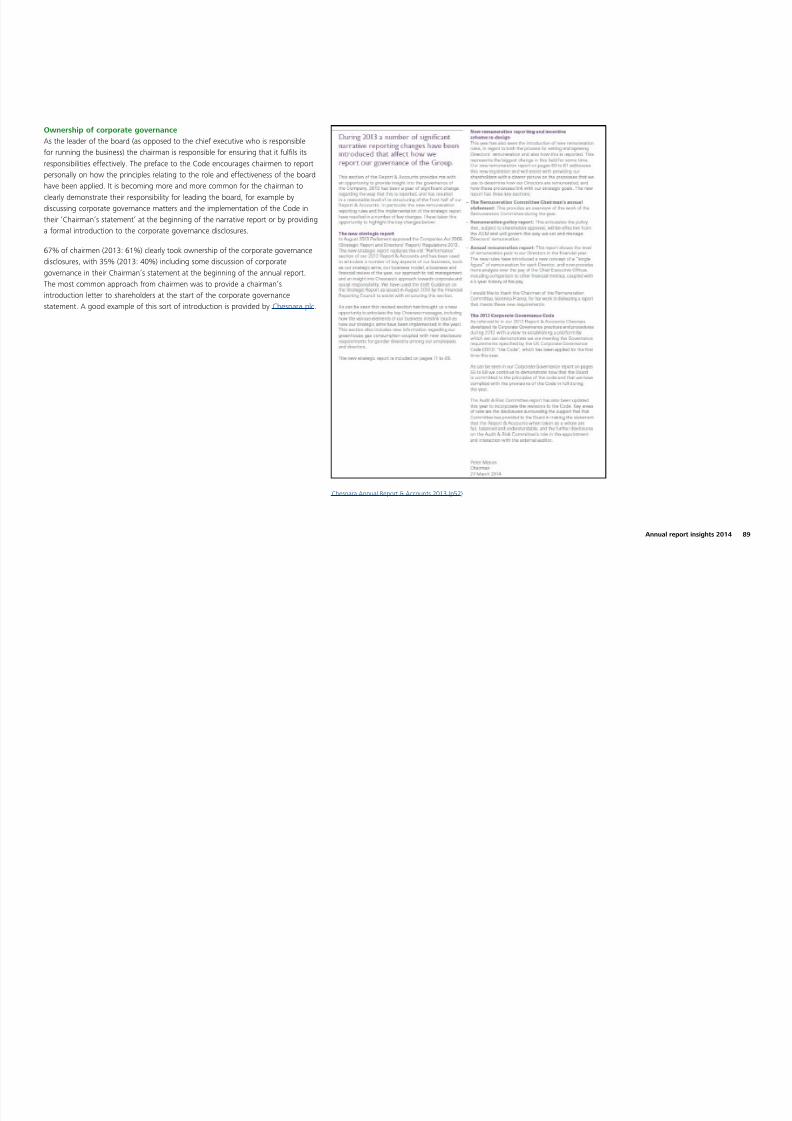
8/10/2019 Uk Audit Annual Report Insights14 Full Survey
http://slidepdf.com/reader/full/uk-audit-annual-report-insights14-full-survey 90/144
Barclays plc Annual Report 2013 (p77)
Figures 11.2 and 11.3 show the most common areas of non-compliance with the
Code amongst the FTSE 250 and smaller companies respectively, showing allprovisions with three or more instances of non-compliance reported. As indicatedabove, all of the FTSE 100 non-compliances were said to be temporary and therewas no commonality in the areas of non-compliance.
0
2
4
6
8
10
E.1.1 Dialoguewith shareholders
A.3.1 Chairmanindependence
D.2.1 Remcocomposition
C.3.1 ACcomposition
B.1.2 Half NEDsindependent
Figure 11.2. What were the most common areas of Code non-compliance for FTSE 250 companies?
Number of occurrences of each
6 5 5 33
0
2
4
6
8
10
B.2.3 NEDsspecicterms
D.2.1 Remcocomposition
B.1.2Half NEDs
independent
C.3.1 ACcomposition
B.6Performance evaluation
A.2.1Chairman/
CEO
B.2.1Nomination
Co
Figure 11.3. What were the most common areas of Code non-compliance for other companies?
Number of occurrences of each
8 6 6 6 6 5 45 3
As in previous years, a quick scan of the gures above indicates that the majority ofthese non-compliances arise from the provisions in relation to the composition ofthe board and its committees, rather that the operational processes in place.
88

8/10/2019 Uk Audit Annual Report Insights14 Full Survey
http://slidepdf.com/reader/full/uk-audit-annual-report-insights14-full-survey 91/144

8/10/2019 Uk Audit Annual Report Insights14 Full Survey
http://slidepdf.com/reader/full/uk-audit-annual-report-insights14-full-survey 92/144

8/10/2019 Uk Audit Annual Report Insights14 Full Survey
http://slidepdf.com/reader/full/uk-audit-annual-report-insights14-full-survey 93/144
Lonmin plc provided some interesting graphics on the diversity of the board. Marksand Spencer Group plc also provide a good example of disclosures covering matters
such as board experience, nationality and length of tenure.
Lonmin Plc Annual Report and Accounts 2013 (p46)
Marks and Spencer Group plc Annual report and nancial statements 2014 (p37)
Annual report insights 2014 91

8/10/2019 Uk Audit Annual Report Insights14 Full Survey
http://slidepdf.com/reader/full/uk-audit-annual-report-insights14-full-survey 94/144
Fair, balanced and understandableOne of the provisions of the 2012 Code which has prompted a signicant amount
of debate is provision C.1.1 that requires the directors to make a statement that “theannual report and accounts, taken as a whole, is fair, balanced and understandableand provides the information necessary for shareholders to assess the company’sperformance, business model and strategy.” Last year 16 companies from oursample voluntarily adopted the new Code provision early and provided the newboard statement. This year, as expected, this number has increased signicantlywith all but four of the smaller listed companies providing the fair, balanced andunderstandable statement.
84% of these statements were included within the statement of directors’responsibilities with the remainder included in either the directors’ report, thecorporate governance statement or the audit committee report.
23% of companies providing the statement included further details of the processundertaken to support the statement within the corporate governance section ofthe annual report, whether in the audit committee report or elsewhere. Includingsuch detail can give shareholders condence that a robust process has beenundertaken for the preparation of the annual report.
Examples of these enhanced disclosures were from Spectris plc and Anglo American plc .
Spectris plc Annual Report and Accounts 2013 (p53)
92

8/10/2019 Uk Audit Annual Report Insights14 Full Survey
http://slidepdf.com/reader/full/uk-audit-annual-report-insights14-full-survey 95/144

8/10/2019 Uk Audit Annual Report Insights14 Full Survey
http://slidepdf.com/reader/full/uk-audit-annual-report-insights14-full-survey 96/144
A good example of disclosures around an internal board performance evaluation process was given by Johnson Matthey.
Johnson Matthey Annual Reports and Accounts 2014 (p91 above & p92 right)
94

8/10/2019 Uk Audit Annual Report Insights14 Full Survey
http://slidepdf.com/reader/full/uk-audit-annual-report-insights14-full-survey 97/144
In its report Developments in Corporate Governance 2013 16 the FRC noted thatsuccession planning should be an area of focus for companies this year and
with that in mind we surveyed succession planning disclosures to determine thenature and extent of disclosures in this area. The results showed that, on thewhole, references to succession planning tended to be very brief and were usuallyrestricted to a conrmation that succession planning had been considered by theboard and/or nomination committee with little or no further detail. The chart onthe right sets out what we observed in relation to the extent of succession planningacross the organisations surveyed.
Figure 11.5. Which positions did succession planning address?
88%
Executives only
Board only
Board and senior management
Not specic
No reference
29
25
9
34
3
…on the whole, references to succession planning tended to be very brief and were usually restrictedto a conrmation that succession planning had been considered by the board and/or nominationcommittee with little or no further detail.
16 https://www.frc.org.uk/Our-Work/ Publications/Corporate-Governance/ Developments-in-Corporate-Governance-2013.pdf#page=5
Annual report insights 2014 95
12. The work of the audit committee
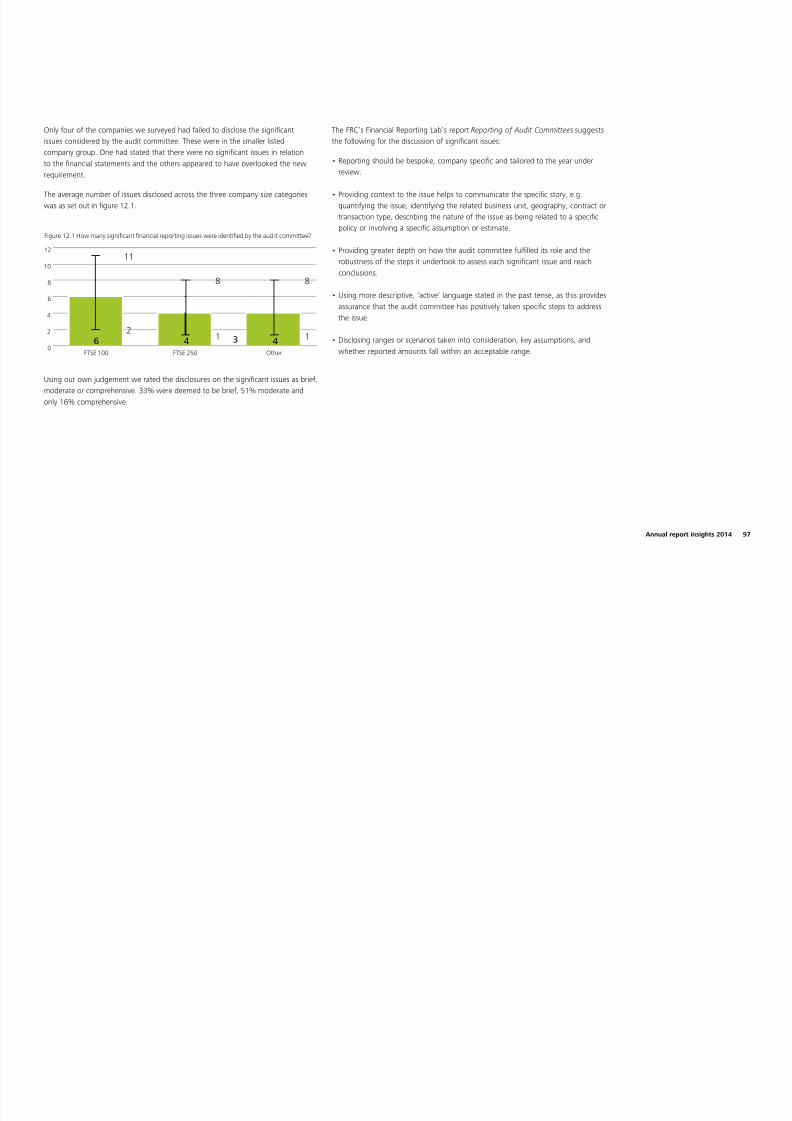
8/10/2019 Uk Audit Annual Report Insights14 Full Survey
http://slidepdf.com/reader/full/uk-audit-annual-report-insights14-full-survey 98/144
The 2012 Code signicantly increased the reporting responsibilities of the auditcommittee. In the past, audit committee reporting has focused largely on whatthe responsibilities of the audit committee are, who the members are and howmany times the audit committee met. The 2012 Code places more emphasis onpresenting details in the annual report as to what the audit committee has done
during the year under review to full its responsibilities. This level of transparencygives shareholders a much clearer picture of what the key issues considered by thecommittee are and how they were addressed and what the audit committee doesto oversee the external audit relationship.
Presentation of the audit committee reportThe 2012 Code requires there to be a separate section of the report which
describes the work of the audit committee in discharging its responsibilities. All ofthe companies in our survey presented an audit committee report in accordancewith the Code. Although the Code species that information on the work of theaudit committee should be included in a ‘separate section of the annual report’,this could be a subsection within the overall corporate governance report.However, reecting the increasing prole of the audit committee’s activities, thenumber of companies presenting a stand-alone audit committee report within thecorporate governance section of the annual report has increased signicantly, with67 companies (2013: 45) presenting such a report. This separation is useful as itprovides a clear denition between the work of the audit committee and the workof the board as a whole.
In line with this rise, there is also an increase in the number of companies wherethe audit committee chairman takes clear ownership of the audit committee report,from 42 in 2013 to 71 in 2014. This was done usually either by the committeechairman signing the report or presenting an introductory summary.
Signicant issues considered by the audit committeeThe revisions to the Code require audit committees to describe the signicantissues considered in relation to the nancial statements and how those issues wereaddressed. In addition, it is important to note that the 2013 revisions to auditorreporting, which came into force for periods ending on or after 30 September 2013(i.e. at the same time as the 2012 Code) now require auditors to report on the keyrisks of material misstatement which they focused on and which required the mostaudit effort. We examine the correlation between the signicant issues discussed by
the audit committee and the risks disclosed by the auditors in chapter 13.
Top tips
• Given the increased responsibilities of audit committees, consider presenting theirwork in a clear, separate report within the annual repor t – 67% (2013:45%) ofcompanies elected to do so this year.
• The audit committee chairman could take clear ownership of the audit committeereport, for example by personally introducing it – the number already doing so rosefrom 42 in 2013 to 71 in 2014.
Keep an eye on
• Identify an appropriate number of signicant nancial statements issues whichthe audit committees considered – the average number of signicant issues
disclosure by FTSE 100 audit committees in our sample was six, and was four forboth the FTSE 250 and smaller listed companies surveyed.
• Keep up to date on the developments around audit tendering and considerdisclosing when you might next put your audit out to tender – 35 companies.(2013: 35) did so this year.
The 2012 Code has signicantly increased the reporting responsibilities of the audit committee.
96

8/10/2019 Uk Audit Annual Report Insights14 Full Survey
http://slidepdf.com/reader/full/uk-audit-annual-report-insights14-full-survey 99/144

8/10/2019 Uk Audit Annual Report Insights14 Full Survey
http://slidepdf.com/reader/full/uk-audit-annual-report-insights14-full-survey 100/144
The following diagram takes the issue of goodwill impairment as an example andshows the range of disclosures observed from those which are minimal and more
generic to those which provide context, company specic detail and references toother, relevant disclosures within the nancial statements.
Good examples of disclosures on signicant issues were given by ITV plc and TullowOil plc. In particular, both these companies make it clear which issues are recurring
issues for the audit committee and which are one-off items for the particular year.
ITV plc Annual Report and Accounts for the year ended 31 December 2013 (pages 77-79, truncated)
98
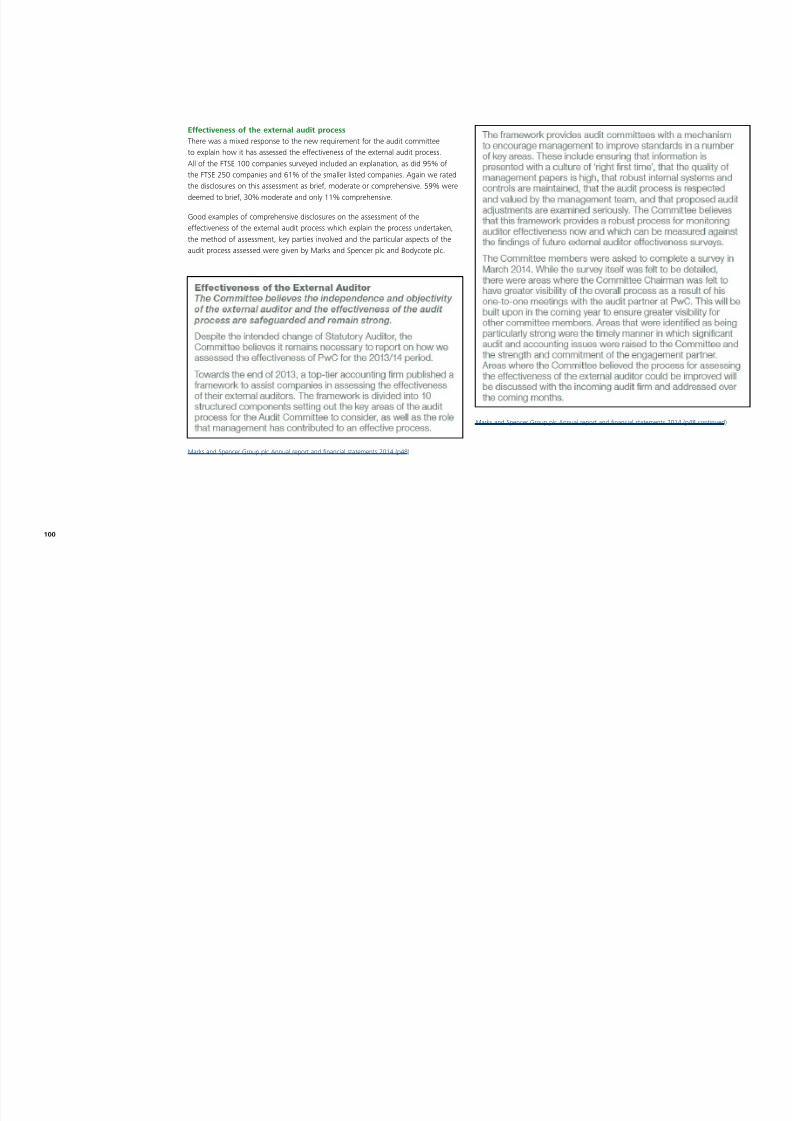
8/10/2019 Uk Audit Annual Report Insights14 Full Survey
http://slidepdf.com/reader/full/uk-audit-annual-report-insights14-full-survey 101/144
Tullow Oil plc 2013 Annual Report & Accounts (p91)
ITV plc Annual Report and Accounts for the year ended 31 December 2013 (pages 77-79, truncatedcontinued)
Annual report insights 2014 99

8/10/2019 Uk Audit Annual Report Insights14 Full Survey
http://slidepdf.com/reader/full/uk-audit-annual-report-insights14-full-survey 102/144
Effectiveness of the external audit processThere was a mixed response to the new requirement for the audit committee
to explain how it has assessed the effectiveness of the external audit process.All of the FTSE 100 companies surveyed included an explanation, as did 95% ofthe FTSE 250 companies and 61% of the smaller listed companies. Again we ratedthe disclosures on this assessment as brief, moderate or comprehensive. 59% weredeemed to brief, 30% moderate and only 11% comprehensive.
Good examples of comprehensive disclosures on the assessment of theeffectiveness of the external audit process which explain the process undertaken,the method of assessment, key parties involved and the particular aspects of theaudit process assessed were given by Marks and Spencer plc and Bodycote plc.
Marks and Spencer Group plc Annual report and nancial statements 2014 (p48)
Marks and Spencer Group plc Annual report and nancial statements 2014 (p48 continued)
100

8/10/2019 Uk Audit Annual Report Insights14 Full Survey
http://slidepdf.com/reader/full/uk-audit-annual-report-insights14-full-survey 103/144
13. The auditor’s report

8/10/2019 Uk Audit Annual Report Insights14 Full Survey
http://slidepdf.com/reader/full/uk-audit-annual-report-insights14-full-survey 104/144
Highlights
• All companies in our sample published an enhanced auditor’s report including theauditor’s comments on risks, materiality and scope.
• The average number of audit risks disclosed for FTSE 100 companies was 5, with4 the average for both the FTSE 250 and smaller companies surveyed.
• There was a high degree of cross-over between audit committee signicant issuesand the auditor’s audit risks, although in a number on instances one of themidentied issues that the other did not comment on.
• 95% of audit reports disclosed the basis on which the auditor had determinedmateriality and 98% disclosed the level at which misstatements were reported tothe audit committee, despite no statutory requirement to do so.
The enhanced audit reportThe 2013 revisions to audit reporting came into force for periods ended on or after30 September 2013, at the same time as the 2012 Code. These revisions constituteda fundamental change to the nature of the audit report, moving away fromstandard or “boilerplate” information to require description of areas that are uniqueto the individual company. The changes open the black box of audit to discuss risks,materiality and the auditor’s response.
Although the audit report is written by the auditor, it is read in conjunction with theaudit committee report and to present a clear picture to shareholders it is important
that these are broadly consistent. In addition, there are areas of presentation orcontent that audit committees and preparers may wish to discuss with their auditorto align the report more closely with the remainder of the annual report.
By now the majority of companies affected have already published their annualreport including a new-style “enhanced” audit report, including all of thecompanies in our sample. Shareholders have welcomed the new style of reporting,particularly the identication of the risks that took up most of the auditors’attention and the basis used for materiality. Auditors and audit committees havestarted to consider their approach to the second year of enhanced reporting. Overthe rst year of reporting, we saw a trend for auditors to provide more focussedentity-specic information on risks as both they and audit committees grew morecondent. We expect this to continue in year two; we also expect more insight
around materiality.
Vodafone Group plc is an example of a company that has already published itssecond enhanced audit report. Both the format and the content have movedon considerably. New content includes new risks and responses, information onmisstatements and explanations of changes to risks and materiality compared to theprior year’s audit report.
p
Although the audit report is written by the auditor, it is read in conjunction with the audit committee
report and to present a clear picture to shareholders it is important that these are broadly consistent.
102
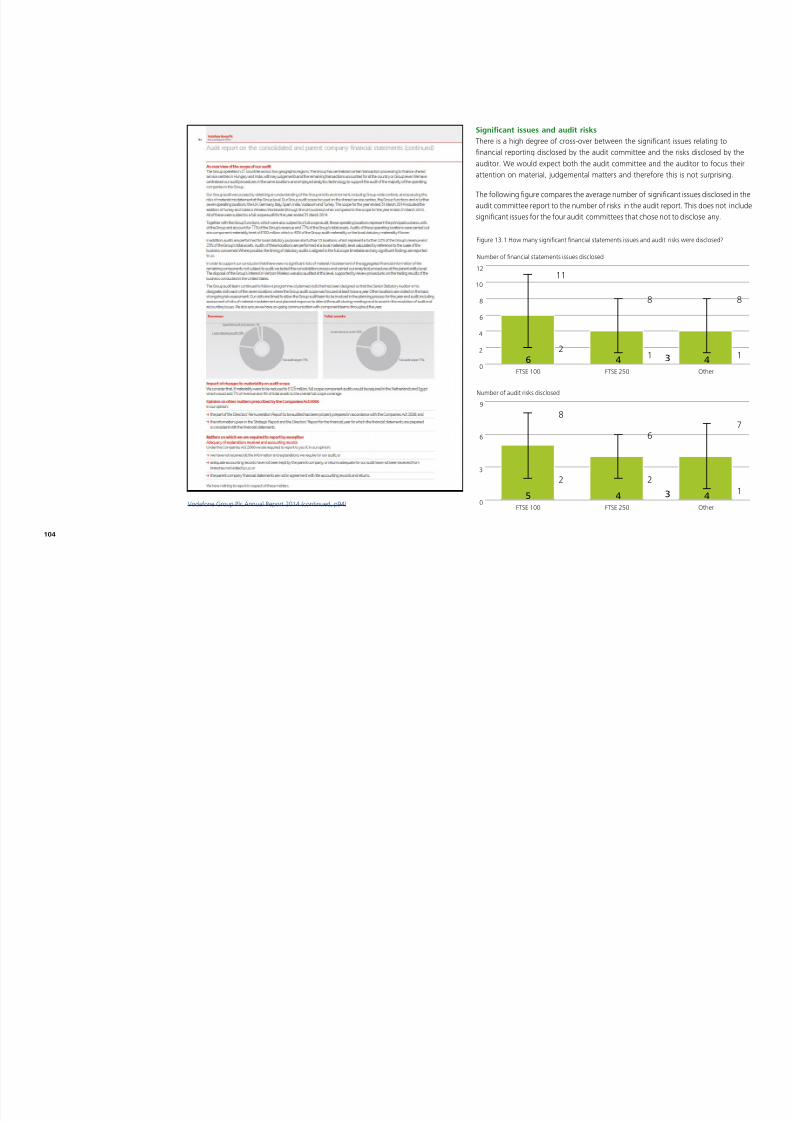
8/10/2019 Uk Audit Annual Report Insights14 Full Survey
http://slidepdf.com/reader/full/uk-audit-annual-report-insights14-full-survey 105/144
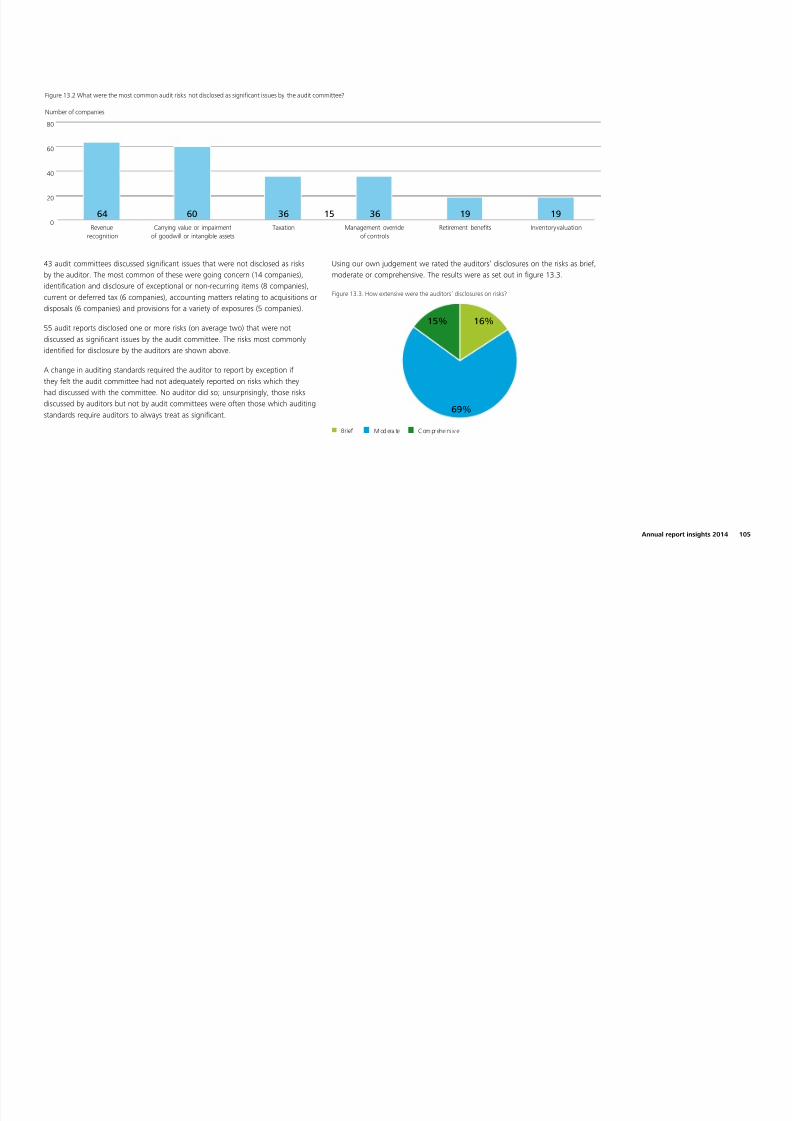
8/10/2019 Uk Audit Annual Report Insights14 Full Survey
http://slidepdf.com/reader/full/uk-audit-annual-report-insights14-full-survey 106/144
Signicant issues and audit risksThere is a high degree of cross-over between the signicant issues relating to
nancial reporting disclosed by the audit committee and the risks disclosed by theauditor. We would expect both the audit committee and the auditor to focus theirattention on material, judgemental matters and therefore this is not surprising.
The following gure compares the average number of signicant issues disclosed in theaudit committee report to the number of risks in the audit report. This does not includesignicant issues for the four audit committees that chose not to disclose any.
Vodafone Group Plc Annual Report 2014 (continued, p94)
Figure 13.1 How many signicant nancial statements issues and audit risks were disclosed?
Number of nancial statements issues disclosed
33
Number of audit risks disclosed
33
0
2
4
6
8
10
12
OtherFTSE 250FTSE 100
6 4 42
11
1
8
1
8
0
3
6
9
OtherFTSE 250FTSE 100
5 4 4
2
8
2
6
1
7
104
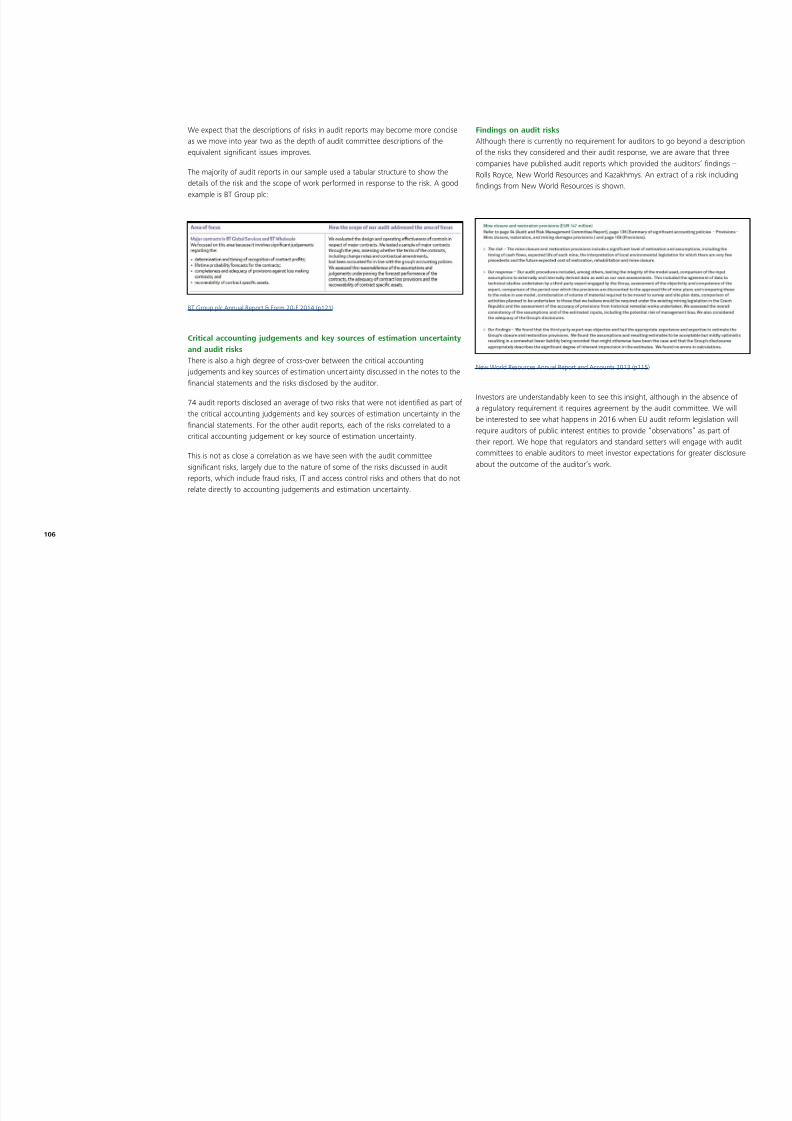
8/10/2019 Uk Audit Annual Report Insights14 Full Survey
http://slidepdf.com/reader/full/uk-audit-annual-report-insights14-full-survey 107/144
43 audit committees discussed signicant issues that were not disclosed as risksby the auditor. The most common of these were going concern (14 companies),identication and disclosure of exceptional or non-recurring items (8 companies),current or deferred tax (6 companies), accounting matters relating to acquisitions ordisposals (6 companies) and provisions for a variety of exposures (5 companies).
55 audit reports disclosed one or more risks (on average two) that were notdiscussed as signicant issues by the audit committee. The risks most commonlyidentied for disclosure by the auditors are shown above.
A change in auditing standards required the auditor to report by exception ifthey felt the audit committee had not adequately reported on risks which theyhad discussed with the committee. No auditor did so; unsurprisingly, those risksdiscussed by auditors but not by audit committees were often those which auditingstandards require auditors to always treat as signicant.
Using our own judgement we rated the auditors’ disclosures on the risks as brief,moderate or comprehensive. The results were as set out in gure 13.3.
Figure 13.3. How extensive were the auditors’ disclosures on risks?
Brief M od era te C om pr ehe ns iv e
16%15%
69%
Figure 13.2 What were the most common audit risks not disclosed as signicant issues by the audit committee?
Number of companies
0
20
40
60
80
Inventory valuationRetirement benetsManagement overrideof controls
TaxationCarrying value or impairmentof goodwill or intangible assets
Revenuerecognition
64 60 36 36 1915 19
Annual report insights 2014 105
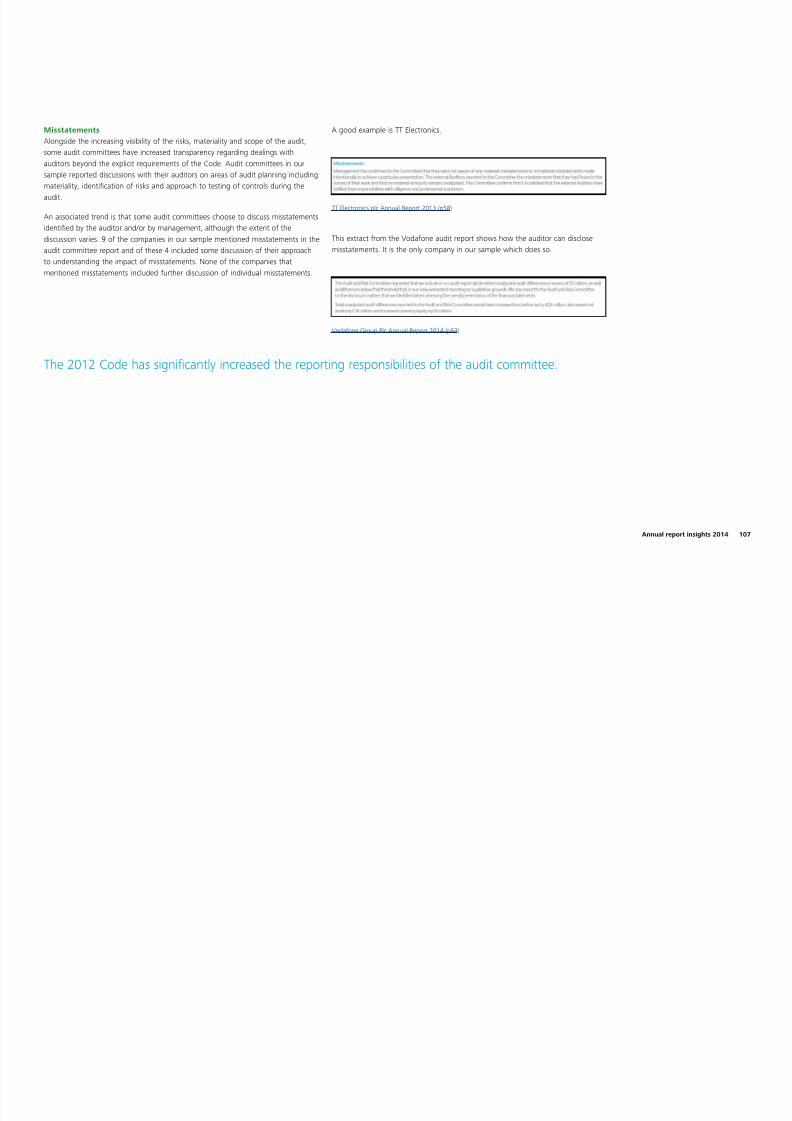
8/10/2019 Uk Audit Annual Report Insights14 Full Survey
http://slidepdf.com/reader/full/uk-audit-annual-report-insights14-full-survey 108/144
We expect that the descriptions of risks in audit reports may become more conciseas we move into year two as the depth of audit committee descriptions of the
equivalent signicant issues improves.
The majority of audit reports in our sample used a tabular structure to show thedetails of the risk and the scope of work performed in response to the risk. A goodexample is BT Group plc:
BT Group plc Annual Report & Form 20-F 2014 (p121)
Critical accounting judgements and key sources of estimation uncertaintyand audit risksThere is also a high degree of cross-over between the critical accounting
judgements and key sources of es timation uncert ainty discussed in t he notes to thenancial statements and the risks disclosed by the auditor.
74 audit reports disclosed an average of two risks that were not identied as part ofthe critical accounting judgements and key sources of estimation uncertainty in thenancial statements. For the other audit reports, each of the risks correlated to acritical accounting judgement or key source of estimation uncertainty.
This is not as close a correlation as we have seen with the audit committeesignicant risks, largely due to the nature of some of the risks discussed in auditreports, which include fraud risks, IT and access control risks and others that do notrelate directly to accounting judgements and estimation uncertainty.
Findings on audit risksAlthough there is currently no requirement for auditors to go beyond a description
of the risks they considered and their audit response, we are aware that threecompanies have published audit reports which provided the auditors’ ndings –Rolls Royce, New World Resources and Kazakhmys. An extract of a risk includingndings from New World Resources is shown.
New World Resources Annual Report and Accounts 2013 (p115)
Investors are understandably keen to see this insight, although in the absence ofa regulatory requirement it requires agreement by the audit committee. We willbe interested to see what happens in 2016 when EU audit reform legislation will
require auditors of public interest entities to provide “observations” as part oftheir report. We hope that regulators and standard setters will engage with auditcommittees to enable auditors to meet investor expectations for greater disclosureabout the outcome of the auditor’s work.
106

8/10/2019 Uk Audit Annual Report Insights14 Full Survey
http://slidepdf.com/reader/full/uk-audit-annual-report-insights14-full-survey 109/144
MisstatementsAlongside the increasing visibility of the risks, materiality and scope of the audit,
some audit committees have increased transparency regarding dealings withauditors beyond the explicit requirements of the Code. Audit committees in oursample reported discussions with their auditors on areas of audit planning includingmateriality, identication of risks and approach to testing of controls during theaudit.
An associated trend is that some audit committees choose to discuss misstatementsidentied by the auditor and/or by management, although the extent of thediscussion varies. 9 of the companies in our sample mentioned misstatements in theaudit committee report and of these 4 included some discussion of their approachto understanding the impact of misstatements. None of the companies thatmentioned misstatements included further discussion of individual misstatements.
A good example is TT Electronics.
TT Electronics plc Annual Report 2013 (p58)
This extract from the Vodafone audit report shows how the auditor can disclosemisstatements. It is the only company in our sample which does so.
Vodafone Group Plc Annual Report 2014 (p53)
The 2012 Code has signicantly increased the reporting responsibilities of the audit committee.
Annual report insights 2014 107

8/10/2019 Uk Audit Annual Report Insights14 Full Survey
http://slidepdf.com/reader/full/uk-audit-annual-report-insights14-full-survey 110/144
MaterialityThe auditor is required to describe how they applied the concept of materiality in planning and performing the audit, including as a minimum the threshold used by the
auditor as being materiality for the nancial statements as a whole. Almost all auditors explained the basis on which they had determined materiality – 88% gave materialityas a percentage of a benchmark; a further 7% explained the benchmark used but without giving the percentage. Investors have broadly welcomed this information,although some have asked for more information on the application in practice – for example, an understanding of what auditors do if they discover an immaterial error.
Figure 13.4 What is the basis on which the auditor determined materiality?
Number of companies
OtherTotal assetsRevenueEquity/net assetsProt before tax
4Range: 1%-3%
Mode 2%
71Range: 2%-10%
Mode 5%
9Range: 0.5%-2.1%
Mode 0.5%
7Range: 0.5%-3%
Mode 1%4
108
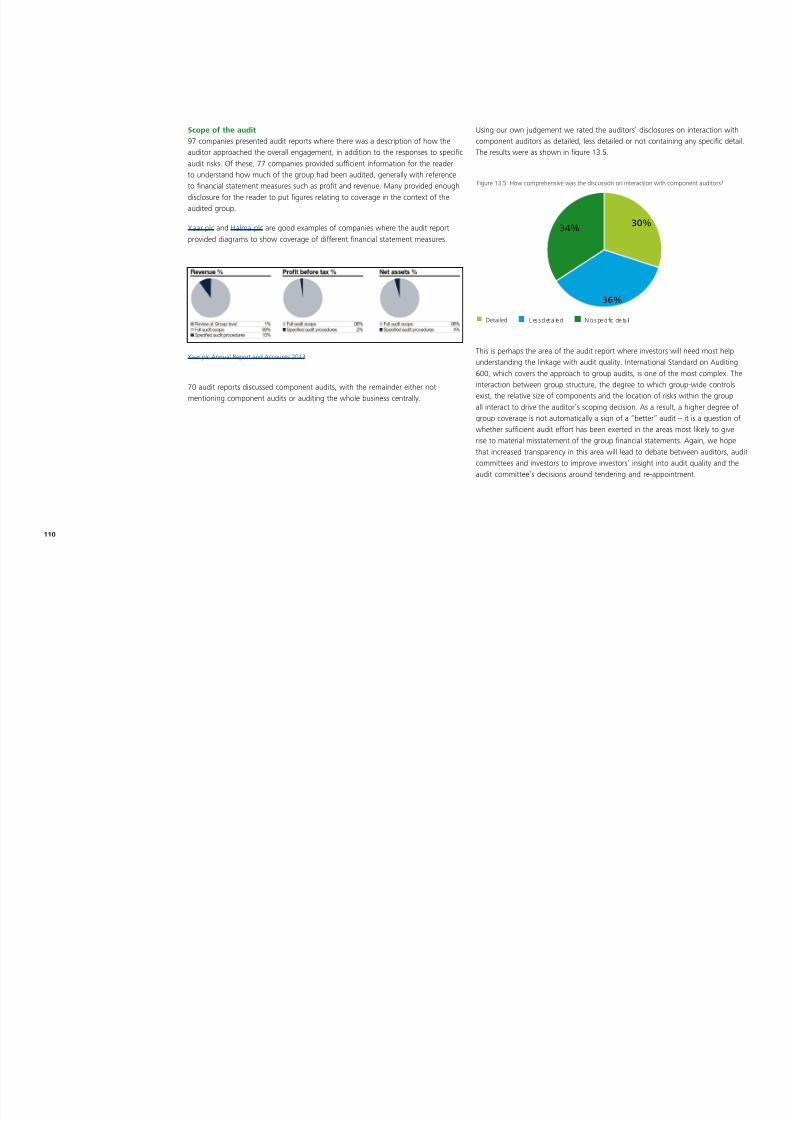
8/10/2019 Uk Audit Annual Report Insights14 Full Survey
http://slidepdf.com/reader/full/uk-audit-annual-report-insights14-full-survey 111/144
44 of the auditors that used prot before tax as a basis, used an adjusted measure,and of these, only 50% (22) used a measure that was already discussed by thecompany in its nancial statements, often as a non-GAAP prot measure. For 10of these companies, it was not possible to reperform the calculation from theinformation provided in the audit report and nancial statements.
Amortisation of acquired intangible assets is identied in the FRC’s ‘Audit QualityThematic Review – Materiality’ as a specic example of a recurring item where theywould have questions for the auditor if it was excluded from the prot measureused to determine materiality. 14 of the auditors using adjusted measures wereclear that amortisation of acquired intangible assets was adjusted out of the protmeasure used to determine materiality. In 4 cases it was not possible to tell fromthe information provided. We consider the information on materiality more usefulif the user can reproduce and reach their own conclusions on the results based onthe annual report. 3% used a second materiality gure to audit certain elements ofthe nancial statements. 14% disclosed performance materiality and 98% disclosedthe level at which differences identied were reported to the audit committee.Although it is not required by the standard, it is important for readers to understandthe quantitative level at which differences are considered by the audit committee.
The Pendragon audit report adopted an innovative approach and used a diagram toshow materiality.
Pendragon PLC 2013 Annual Report
Although it is not required by the standard, it is important for readers to understand the quantitativelevel at which differences are considered by the audit committee.
Annual report insights 2014 109

8/10/2019 Uk Audit Annual Report Insights14 Full Survey
http://slidepdf.com/reader/full/uk-audit-annual-report-insights14-full-survey 112/144
Scope of the audit97 companies presented audit reports where there was a description of how theauditor approached the overall engagement, in addition to the responses to specicaudit risks. Of these, 77 companies provided sufcient information for the readerto understand how much of the group had been audited, generally with referenceto nancial statement measures such as prot and revenue. Many provided enoughdisclosure for the reader to put gures relating to coverage in the context of theaudited group.
Xaar plc and Halma plc are good examples of companies where the audit reportprovided diagrams to show coverage of different nancial statement measures.
Xaar plc Annual Report and Accounts 2013
70 audit reports discussed component audits, with the remainder either notmentioning component audits or auditing the whole business centrally.
Using our own judgement we rated the auditors’ disclosures on interaction withcomponent auditors as detailed, less detailed or not containing any specic detail.The results were as shown in gure 13.5.
Figure 13.5. How comprehensive was the discussion on interaction with component auditors?
Detailed L es s d et ai le d N o s pe ci c de ta il
30%34%
36%
This is perhaps the area of the audit report where investors will need most helpunderstanding the linkage with audit quality. International Standard on Auditing600, which covers the approach to group audits, is one of the most complex. Theinteraction between group structure, the degree to which group-wide controlsexist, the relative size of components and the location of risks within the groupall interact to drive the auditor’s scoping decision. As a result, a higher degree ofgroup coverage is not automatically a sign of a “better” audit – it is a question of
whether sufcient audit effort has been exerted in the areas most likely to giverise to material misstatement of the group nancial statements. Again, we hopethat increased transparency in this area will lead to debate between auditors, auditcommittees and investors to improve investors’ insight into audit quality and theaudit committee’s decisions around tendering and re-appointment.
110
14. Primary statements

8/10/2019 Uk Audit Annual Report Insights14 Full Survey
http://slidepdf.com/reader/full/uk-audit-annual-report-insights14-full-survey 113/144
Telling a story with words is one thing but to try and tell a story with numbers isan altogether different challenge. IFRSs contain many disclosure requirements,but in certain areas there is exibility around how information is presented, withopportunities for preparers to communicate their performance in what they believeto be the most effective fashion. For example, IAS 1 Presentation of Financial
Statements permits extra line items to be included in the income statement whererelevant to an understanding of performance. Plenty of companies make use of thisexibility in presenting non-GAAP measures (see below).
IAS 1 also makes clear that disclosures required by IFRSs need not be presentedif the information is immaterial and the IASB has proposed changes to IAS 1 tofurther this point as part of their disclosure initiative project. Preparers shouldremember this when looking to cut clutter from their annual reports (see ouraccompanying publication A clear steer for your annual repo rt ).
Income statementsA company’s prot or loss for the year is one of the most important parts of anyannual report. In telling their story many regard prot or loss as more importantthan other comprehensive income, the latter capturing items such as actuarialmovements on dened benet pensions, certain foreign exchange differencesand the revaluation of property, plant and equipment. Perhaps for this reason,83 companies elected to present a statement of prot or loss separately from theirstatement of comprehensive income, as permitted by IAS 1. Of the 17 companiespresenting a single statement of prot or loss and other comprehensive income,seven were in the FTSE 350.
IAS 1 also requires companies to present an analysis of expenses recognised inprot and loss using a classication based on either their nature or function withinthe company and encourages this to be presented in the statement presentingprot and loss and other comprehensive income (rather than the notes). IAS 1states that this choice should be made on the basis of whichever approach providesinformation that is reliable and more relevant.
Top tips
• Take care in using non-GAAP measures – an area of regulatory focus in recenttimes, 68% included such metrics on the face of their income statement.
• Explain why items are stripped out of any non-GAAP measures – 79% ofcompanies with non-GAAP measures made sure they did this, as requestedby the FRC.
• Consider including a net debt reconciliation – 44 companies includedinformation of this kind despite not currently being required by IFRSs.
• Consider voluntarily including information on tax governance and strategy –an area of media scrutiny, ten companies in our FTSE 350 sample providedsuch information.
• If you have joint ventures and are accounting for them under proportionalconsolidation make sure you’re ready for IFRS 11, assuming you haven’talready transitioned – four out of six companies with such JVs identied thatthe transition would have a signicant impact.
Keep an eye on
• Keep items of an operating nature, such as restructuring expenses, withinoperating prot – 43 out of 45 companies did so.
• Don’t fall into the trap of describing recurring items as exceptional or non-recurring – most companies successfully avoided this.
• If presenting an adjusted EPS gure, make sure you include both basic anddiluted gures under that basis – 19% of those with adjusted gures forgot thediluted gure.
Annual report insights 2014 111

8/10/2019 Uk Audit Annual Report Insights14 Full Survey
http://slidepdf.com/reader/full/uk-audit-annual-report-insights14-full-survey 114/144
Consistent with previous years, the most popular presentation of expenses isclassication by function (presenting items such as cost of sales and administrativeexpenses), with 51% of companies (2013: 46%) choosing this option, as shown ingure 14.1.
Figure 14.1. How are operating expenses presented on the face of the income statement?
Nature Function Mixed Not classied
8%
51%
23%
18%
While presentation by function was a clear preference for the smaller companies(64% of the ’other’ group adopting it), the presentation chosen by FTSE 350companies was more varied, with function chosen by 41% of the companies, natureby 9% and a mixture of the two by 21%. 29% chose not to classify the expenseson the face of the income statement. A ‘mixed’ presentation could be open tochallenge given that IAS 1 requires presentation by nature or function.
Where expenses were not classied on the face of the income statement andan analysis was instead provided in the notes to the nancial statements, 52%presented the analysis based on nature, 35% by function and only 13% had amixed classication.
Where the classication of expenses is by function (and, for the purposes of oursurvey, mixed), companies are nevertheless required by IAS 1 to disclose furtherinformation on the nature of expenses in the notes, including depreciation,amortisation and employee benets expense. There were 80 companies for whichthis was the case and all but ve of them provided the required information.Although the ve outliers reported some information on the nature of certainexpenses, there did not appear to be enough to clearly demonstrate compliancewith IAS 1’s requirements.
Operating protOne metric that most companies seem to feel is helpful in describing theirperformance is operating prot. For companies outside the nancial servicesindustry this tends to reect protability before items such as investment income,nance costs and tax. Old UK GAAP required such a measure to be presented, buteven now 91% of the companies surveyed (2013: 91%) still present an operating
prot line, despite IFRS containing no requirement to do so. 8% of these didhowever (2013: 8%) present the equivalent of an operating prot line, but using adifferent name, such as trading income.
Whilst the presentation of an operating prot line is still popular with IFRSreporters, an important difference compared to old UK GAAP is the treatment ofcertain exceptional items. Old UK GAAP required the three items shown in gure14.2 to be presented below operating prot (technically, under old UK GAAP thereorganisation or restructurings would have needed to be ‘fundamental’), whereasthe basis for conclusions to IAS 1 indicates that where such a measure is presentedit would be misleading to exclude items of an operating nature, such as inventorywrite-downs, restructuring and relocation expenses. Because of this, it came aslittle surprise to see that nearly all companies with the types of expenses shown in14.2 presented them above their operating prot line.
112

8/10/2019 Uk Audit Annual Report Insights14 Full Survey
http://slidepdf.com/reader/full/uk-audit-annual-report-insights14-full-survey 115/144
However, the treatment of these types of expenses when it came to companies’non-GAAP measures was a different story, as set out above.
Non-GAAP performance measuresNon-GAAP measures are any measures of an entity’s performance or position otherthan those specically dened in accounting standards. As noted above, operatingprot is technically a non-GAAP measure under IFRSs, but for the purposes of thediscussion that follows it has not been included as such. The presentation of non-GAAP measures in the narrative reporting is discussed in chapter 6 and chapter 9.
An area of much debate over the last year, the use of non-GAAP measuresremains as popular as ever, with, on the face of it, little evidence that the FRC’sannouncement in December 2013 17 on the use of exceptional items has hadmuch impact. However, delving deeper reveals that many companies are abidingby certain of the FRC’s ‘reminders’, although in some cases this compliance wasperhaps more from a technical perspective rather than adhering to the ‘spirit’ of thereminders.
The European Securities and Markets Authority (ESMA), the International Federationof Accountants (IFAC), the International Accounting Standards Board (IASB) and theInternational Financial Reporting Standards Interpretations Committee (IFRSIC) havealso all contributed to the debate, as set out below and in the regulatory overviewat chapter 3.
68% of companies (2013: 61%) presented non-GAAP measures on the face of theirincome statement. The proportion of companies presenting such measures is fairlysimilar for the FTSE 350 and the other group.
The basis for conclusions to the latest proposed amendments to IAS 1 statesthat ‘the IASB does not want to propose amendments that could be seen asencouraging the proliferation of ‘non-GAAP’ measures’. However, the FRCsresponse to the ED encouraged the IASB to consider the disclosure and placementof alternative performance measures as part of the wider disclosure initiativeproject as in some cases alternative performance measures provide useful insightand enable users to make better decisions. We also consider that, when appliedproperly, non-GAAP measures can add value to an entity’s communication withinvestors by providing insight into the metrics that management uses to run thebusiness.
Figure 14.2. Where are the following items presented?
0
20
40
60
Prot/losses on the disposal of xed assetsCosts of reorganisation or restructuringProt/loss on the sale or termination of an operation
51 23 15 102 1 43 1 1 36 1 53
Above operating prot B el ow op er ati ng pro t N o e vid en ce
17 https://www.frc.org.uk/News-and-Events/ FRC-Press/Press/2013/December/FRC-seeks-consistency-in-the-reporting-of-exceptio.aspx
Annual report insights 2014 113

8/10/2019 Uk Audit Annual Report Insights14 Full Survey
http://slidepdf.com/reader/full/uk-audit-annual-report-insights14-full-survey 116/144
Every company that presented a non-GAAP measure on the face of its incomestatement dened the measure, making clear the items stripped out in orderto arrive at it. Where this was not already apparent on the face of the incomestatement an analysis of the items excluded tended to be provided in the rst fewnotes to the accounts. Occasionally it was provided right at the back as one of thelast notes to the accounts, which given that they were describing “exceptional”items seemed a little questionable in terms of the prominence they had beenafforded, albeit there are no rules on the order in which notes should be presented.
Clarity in how the measures are arrived at is essential and it comes as no surprisethat the draft guidelines recently proposed by ESMA 18 would, inter alia, requiredenitions and reconciliations to amounts reported in the nancial statements.
In the FRC’s December press notice, the Financial Reporting Review Panel (FRRP)stated that they believe the approach taken in justifying additional items that
qualify for separate presentation should also be clearly disclosed. Of thosepresenting non-GAAP measures, 79% provided justications for why items hadbeen stripped out, with generic descriptions tending to be presented within theaccounting policies note and any more detailed discussion presented alongside thenumerical breakdown of the constituent items. For example, the descriptions ofexceptional items commonly indicated that the items stripped out required separatepresentation from the remaining results of the group due to their one-off natureand that this would allow users of the nancial statements to better understand theelements of nancial performance in the period plus enable comparison with priorperiods.
A good example was presented by National Grid.
National Grid Annual Report and Accounts 2013/14
Clarity in how the measures are arrived at is essential and it comes as no surprise that the draftguidelines recently proposed by ESMA would, inter alia, require denitions and reconciliations toamounts reported in the nancial statements.
18 http://www.esma.europa.eu/content/ ESMA-Guidelines-Alternative-Performance-Measures
114

8/10/2019 Uk Audit Annual Report Insights14 Full Survey
http://slidepdf.com/reader/full/uk-audit-annual-report-insights14-full-survey 117/144
The description of the non-GAAP measures was fairly mixed (see gure 14.3), withterms such as prots “before exceptional items”, “underlying” prots and “adjusted”prots being the most popular. The only category to increase in popularity in theyear was “before exceptional items”, which had previously only been used by 10%of those presenting non-GAAP measures, although this is perhaps a little surprisinggiven the FRC’s press notice. The other groups all saw small falls, but their usageremained relatively constant.
Figure 14.3. How are the non-GAAP performance measures broadly described?
88%
Before exceptional items
underlying
Adjusted
No description
Other
25%
22%27%
10%
16%
The items that were excluded from the results to calculate the non-GAAP measures,however, were described slightly differently. The most common description ofexcluded items was “Exceptional”, as shown in gure 14.4. Accordingly, mostcompanies would do well to pay close attention to the FRRP’s reminders, which
explicitly refer to the use of exceptional items, although they are also relevant forother similar metrics.
Figure 14.4. How are the excluded items broadly described?
88%
Exceptional Non-underlying Non-rec urring
Other
A dj us tm ent s N o d es cr ip ti on
47%
10%
6%
6%7%
24%
One of the FRRP’s reminders was that where the same category of material itemsrecurs each year, and in similar amounts, companies should consider whethersuch amounts should be included within underlying prot. As gure 14.5 shows,the types of items that are stripped out was relatively consistent compared to theprevious year. Common items such as prots or losses on sale or termination of anoperation or restructuring costs, whilst typically included in arriving at operatingprot, tended to be stripped out in arriving at adjusted earnings measures. Wherecompanies infrequently undertake such activities such an approach appearsreasonable.
Annual report insights 2014 115
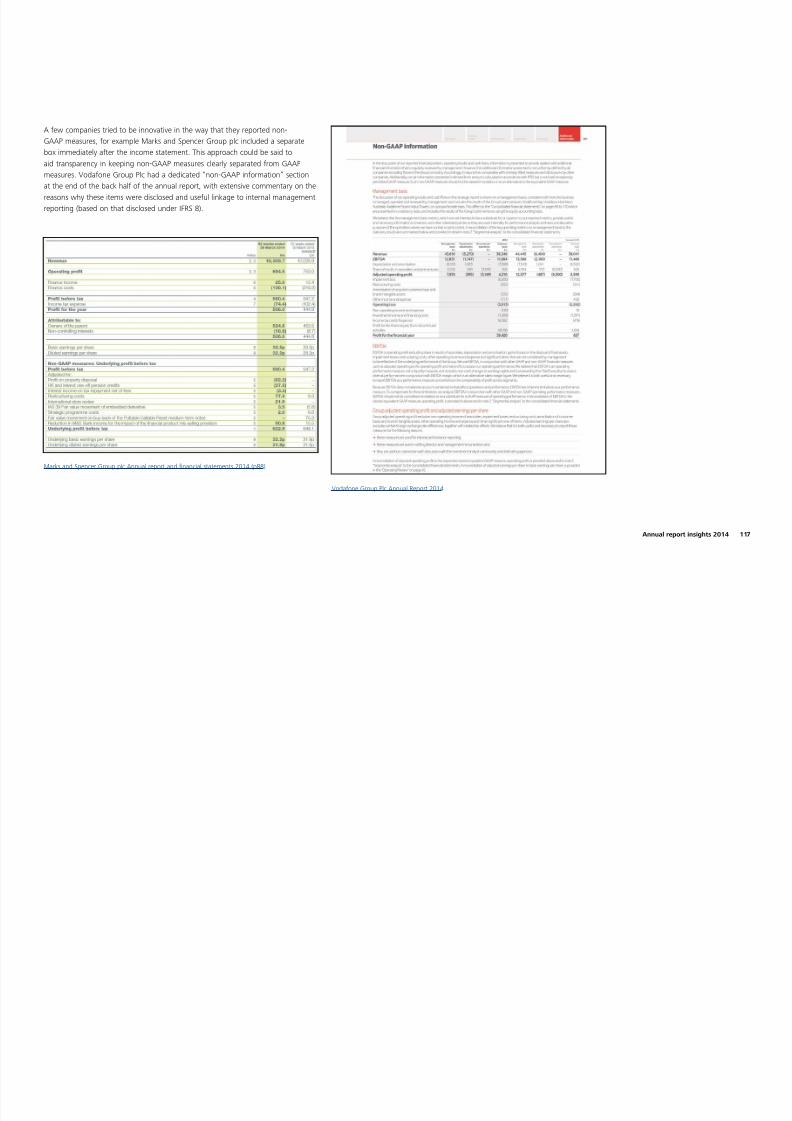
8/10/2019 Uk Audit Annual Report Insights14 Full Survey
http://slidepdf.com/reader/full/uk-audit-annual-report-insights14-full-survey 118/144
Meanwhile, amortisation of intangibles, often of intangibles acquired in a businesscombination, was stripped out slightly more often in the companies we surveyedthis year. Although the presentation of amortisation year after year as “exceptional”or “non-recurring” could be open to challenge very few companies fell into thistrap. Instead, those companies stripping out amortisation tended to adopt otherapproaches, for example including it in an ‘adjustments’ column or presenting protbefore exceptional items and amortisation. Whilst technically appearing to complywith the FRRP’s reminders it could be questioned whether this complies with thespirit of those reminders. On the other hand, the usefulness of measures such asEBITDA seems to be accepted by many.
Another reminder was that the approach to identifying items as exceptional shouldbe even-handed between gains and losses. Whilst the presentation of non-GAAPmeasures that strip out certain expenses is common, in 2014 is was also noted thata number of companies stripped out one-off credits, such as pension curtailments,leasing items and other non-recurring income. Such a balance helps contributestowards efforts to ensure reports are fair, balanced and understandable.
Companies also adopted a variety of structures in presenting non-GAAP measuresin their income statement. 47% of companies inserted an extra column and 40%inserted additional line items. In January 2014 the IFRSIC stated that the additionof pro forma columns to the primary statements appears “unlikely” to satisfythe requirements of IAS 1. However, this is a commonly accepted practice in
jurisdict ions that include the U K and Deloitte’s recommen dation was that if thecommittee believes such a presentation should be prohibited then an amendmentshould be made to IAS 1 as part of the IASB’s disclosure initiative project. No suchamendment was proposed in the IASB’s exposure draft of amendments to IAS 1released in March 2014, although the project is ongoing.
Figure 14.5. What do non-GAAP measures strip out?
0%
20%
40%
60%
AmortisationFinancial instrumentsadjustments
ImpairmentAcquisition related costsDisposal of xed assetsRestructuring costsSale or terminationof operations
34% 30% 56% 52% 15% 16% 22% 27% 34% 37% 40% 43% 53% 45%
2014 2013
116

8/10/2019 Uk Audit Annual Report Insights14 Full Survey
http://slidepdf.com/reader/full/uk-audit-annual-report-insights14-full-survey 119/144
A few companies tried to be innovative in the way that they reported non-GAAP measures, for example Marks and Spencer Group plc included a separatebox immediately after the income statement. This approach could be said toaid transparency in keeping non-GAAP measures clearly separated from GAAPmeasures. Vodafone Group Plc had a dedicated “non-GAAP information” sectionat the end of the back half of the annual report, with extensive commentary on thereasons why these items were disclosed and useful linkage to internal managementreporting (based on that disclosed under IFRS 8).
Marks and Spencer Group plc Annual report and nancial statements 2014 (p88)
Vodafone Group Plc Annual Report 2014
Annual report insights 2014 117

8/10/2019 Uk Audit Annual Report Insights14 Full Survey
http://slidepdf.com/reader/full/uk-audit-annual-report-insights14-full-survey 120/144
It seems likely that non-GAAP measures will still be used for the foreseeable futureand it will be interesting to see how the various regulators and standard settersfurther the debate and requirements in this area. The key challenge is to provideuseful information without creating inconsistencies and without confusing thereader. Of course, the use of non-GAAP measures is also captured by the directors’statement that the annual report and accounts taken as a whole is “fair, balancedand understandable” and some of audit committees may wish to state that theiruse is a signicant issue they have considered (see chapter 12).
Earnings per shareAdjusted EPS gures also remained very popular amongst reporters. Similar to theprevious year 63% (2013: 67%) of the companies chose to disclose additional EPSnumbers based upon a non-statutory measure.
IAS 33 species that where additional EPS gures are provided, both the adjusted
basic measure and the adjusted diluted gures should be presented with equalprominence and included in the notes to the nancial statements. The implicationfrom this wording could be that one should not present such measures on theface of the income statement. However, of the companies presenting additionalEPS gures, 51% presented them on the face of the income statement while theremaining 49% presented them only in the notes to the nancial statements.
81% of companies (2013: 87%) presenting an additional basic EPS measure alsopresented an additional diluted measure, in line with the requirements of thestandard.
IAS 33 requires basic and diluted EPS to be presented for prot/loss for continuingoperations, and for the total prot/loss attributable to shareholders. Of those 16entities with discontinued operations in the year all met the IAS 33 requirementsto disclose a separate gure for continuing operations on the face of the incomestatement and a separate gure for discontinued operations on the face or in thenotes.
TaxThe issues of tax charges and tax paid, especially by large internationalconglomerates, as well as tax governance, continue to appear in the headlinesof UK business news. Perhaps as a response to this, seven companies that we
surveyed, all from FTSE 350 group, went beyond the statutory requirements foraccounting purposes and provided information on tax governance, tax chargesand/or tax payments to UK and/or global tax authorities in their annual report.Another three companies, again all in the FTSE 350, did not provide tax governanceinformation but did voluntarily provide information on the tax charges or paymentsto UK and/or global tax authorities.
The issues of tax charges and tax paid, especially by large international conglomerates, as well as taxgovernance, continue to appear in the headlines of UK business news.
118
8/10/2019 Uk Audit Annual Report Insights14 Full Survey
http://slidepdf.com/reader/full/uk-audit-annual-report-insights14-full-survey 121/144
An example of disclosure in this area is provided by the Weir Group PLC.
The Weir Group PLC Annual Report and Financial Statements 2013 (p46)
Share of results of associates and joint ventures52 companies within the survey had interests in associates and joint ventures.IAS 1 requires that the share of the prot or loss of associates and joint venturesthat are equity accounted for must be presented on the face of the income statementin a separate line. Six (2013: ve) companies with interests in associates or jointventures under the equity method of accounting did not present their share ofprot or loss on the face of the income statement (as required by IAS 1). Two ofthem explicitly stated that this was due to materiality. Regulators have conrmedthat negative statements of this sort are not required, although many seem toprefer to play it safe and include a conrmation.
One additional company made clear that their joint ventures were immaterial butthere was no evidence of which method of accounting they had been applying.
IFRS 11 Joint Arrangements , replaces IAS 31, the existing accounting standards
for joint ventures, effective for periods beginning on or after 1 January 2013 forcompanies which comply with IFRSs as issued by the IASB but a year later for thosereporting under IFRSs as adopted by the EU. The two main changes brought in byIFRS 11 are that:
• joint arrangements are now categorised by focusing on the rights and obligationsof the parties to the joint arrangement, whereas previous accounting was drivenby the structure of the joint arrangement; and
• the choice of accounting method for jointly controlled entities is removed underIFRS 11 – the equity method is required for all joint ventures, and proportionateconsolidation is not permitted.
43 companies had evidence of interests in joint arrangements within thenancial statements. Of these, six chose to account for them using proportionateconsolidation under IAS 31. Four of these six identied that the forthcomingadoption of IFRS 11 would have a signicant impact on the nancial statements(see chapter 15 for more detail on these types of disclosures).
Annual report insights 2014 119
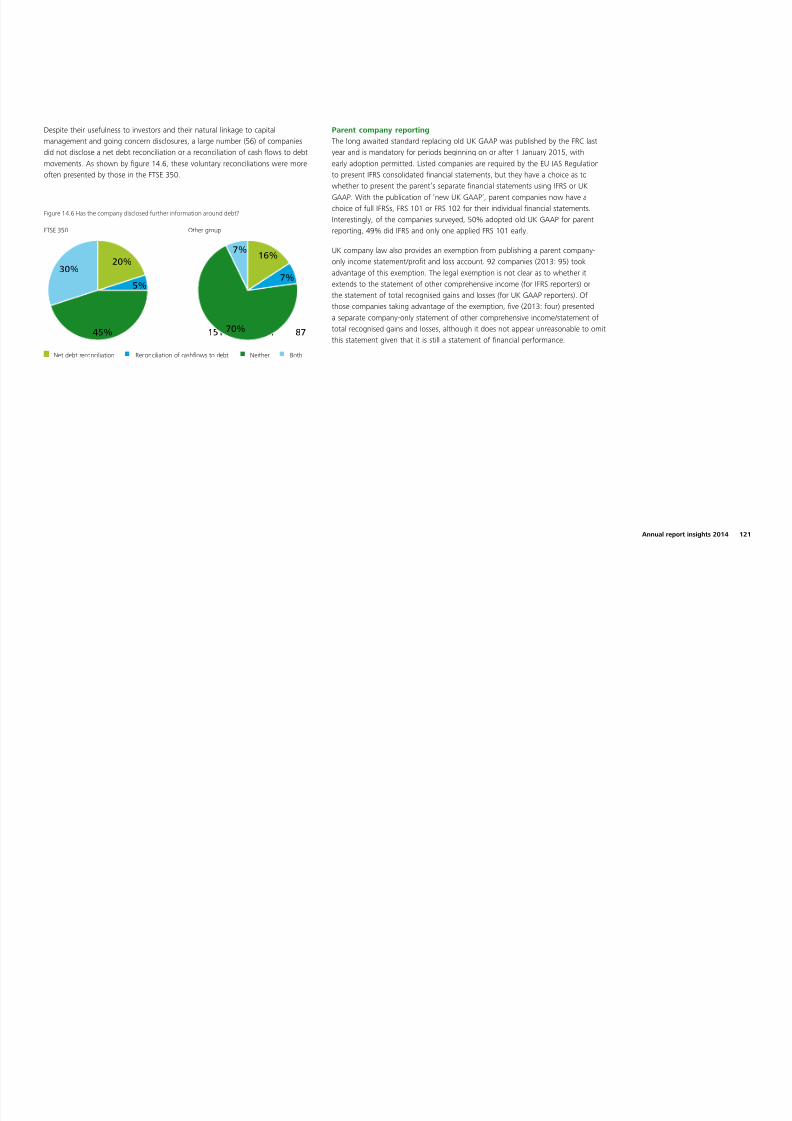
8/10/2019 Uk Audit Annual Report Insights14 Full Survey
http://slidepdf.com/reader/full/uk-audit-annual-report-insights14-full-survey 122/144
Discontinued operationsIAS 1 requires that if there are discontinued operations in the period, the total protor loss from these discontinued operations must be shown as a single line item onthe face of the income statement. The order of the items required to be disclosedon the face of the income statement (as listed in IAS 1:82) suggests that the resultsfrom the discontinued operations should come below the tax expense line althoughthis is not an explicit requirement of the standard.
Out of the 16 companies that clearly had discontinued operations, all compliedwith the requirement to show the total prot or loss from as a single line item. One
company remained silent on whether they had any discontinued operations or not,although there was no evidence to suggest that they had any. All other companiesincluded an explicit statement that all results were derived from continuingoperations.
Balance sheetIAS 1 has its own terminology for the primary statements, which periodicallyundergoes revisions, but it does permit exibility around this labelling and does notmandate the use of its terminology. For example, IAS 1 refers to the “statement ofnancial position” but most companies (75%) still refer to a “balance sheet”.
IAS 1 also allows exibility over how the various categories of items within it arepresented. 72 companies presented the information on a net assets basis i.e. withassets followed by liabilities, with a subtotal corresponding to a net assets andtotal equity gure. 27 companies presented a total assets gure followed by totalequity and liabilities. The one remaining company presented total assets less currentliabilities followed by non-current liabilities and equity.
The majority of companies presented two balance sheets, with just 9 companiespresenting a third balance sheet due to retrospective application of an accountingpolicy or a correction of a prior year error. However, 63 companies had such
restatements – 21 of these made an explicit statement that no third balance sheethad been presented on the grounds that the restatement had had no materialimpact on that third balance sheet. No such statement is required though and theremaining 33 companies remained silent as to why they had omitted a third balancesheet, leaving readers to draw their own conclusions.
Net DebtBecause of the importance of net debt disclosure to many investors (as evidencedby the FRC lab’s project in September 2012), the IASB decided at its March 2014meeting to undertake a narrow-scope project which would amend IAS 7 Statementof Cash Flows to address net debt disclosures. This project will consider introducingdisclosures that reconcile nancing cashows to amounts included in the balancesheet.
Because of the importance of net debt disclosure to many investors (as evidenced by the FRC lab’sproject in September 2012), the IASB decided at its March 2014 meeting to undertake a narrow-scope
project which would amend IAS 7 Statement of Cash Flows to address net debt disclosures.
120

8/10/2019 Uk Audit Annual Report Insights14 Full Survey
http://slidepdf.com/reader/full/uk-audit-annual-report-insights14-full-survey 123/144
Despite their usefulness to investors and their natural linkage to capitalmanagement and going concern disclosures, a large number (56) of companiesdid not disclose a net debt reconciliation or a reconciliation of cash ows to debtmovements. As shown by gure 14.6, these voluntary reconciliations were moreoften presented by those in the FTSE 350.
Figure 14.6 Has the company disclosed further information around debt?
FTSE 350 Other group
151 101 87
Net debt reconciliation Reconciliation of cashows to debt Neither Both
20%
5%
45%
30%
7%
70%
7%
16%
Parent company reportingThe long awaited standard replacing old UK GAAP was published by the FRC lastyear and is mandatory for periods beginning on or after 1 January 2015, withearly adoption permitted. Listed companies are required by the EU IAS Regulationto present IFRS consolidated nancial statements, but they have a choice as towhether to present the parent’s separate nancial statements using IFRS or UKGAAP. With the publication of ‘new UK GAAP’, parent companies now have achoice of full IFRSs, FRS 101 or FRS 102 for their individual nancial statements.Interestingly, of the companies surveyed, 50% adopted old UK GAAP for parentreporting, 49% did IFRS and only one applied FRS 101 early.
UK company law also provides an exemption from publishing a parent company-only income statement/prot and loss account. 92 companies (2013: 95) tookadvantage of this exemption. The legal exemption is not clear as to whether itextends to the statement of other comprehensive income (for IFRS reporters) or
the statement of total recognised gains and losses (for UK GAAP reporters). Ofthose companies taking advantage of the exemption, ve (2013: four) presenteda separate company-only statement of other comprehensive income/statement oftotal recognised gains and losses, although it does not appear unreasonable to omitthis statement given that it is still a statement of nancial performance.
Annual report insights 2014 121
15. Notes to the nancial statements

8/10/2019 Uk Audit Annual Report Insights14 Full Survey
http://slidepdf.com/reader/full/uk-audit-annual-report-insights14-full-survey 124/144
The notes to the nancial statements not only provide information explicitlyrequired by IFRSs, they should also contain any other information that is relevant toan understanding of the nancial statements. Nowadays the list of IFRS disclosurerequirements alone is fairly extensive, with most new standards introducingadditional disclosure requirements. It therefore came as little surprise that theaverage length of the nancial statements rose to 55 pages this year (2013:53 pages), with the FTSE 350 averaging 60 pages and other companies 47 pages.
As set out in the regulatory overview in chapter 3, there are various initiativesunderway to try and address the disclosure overload perceived by many, includingthe FRC’s clear and concise project and the IASB’s disclosure initiative. In themean-time however it seems as though companies have struggled to cut clutterfrom their nancial statements. The IASB’s latest proposals to amend IAS 1 wouldfurther clarify that immaterial disclosure need not be provided, that preparers neednot adhere to the ordering of notes suggested by IAS 1 and examples of signicant
accounting policies would also be removed. These efforts may help preparers in theirbattle against clutter, whilst encouraging greater levels of innovation in the notes tothe nancial statements, for example by linking to narrative reporting as set out below.
Linkage to narrative reportingIn July 2014 the FRC’s nancial reporting lab issued a report: A ccounting policiesand integration of related nancial information .19 The report considered the viewsof companies and investors on the presentation of accounting policies, the notes tothe nancial statements more generally and the integration of narrative reportingwith the primary statements. On this nal point the prevailing view amongstinvestors was that it was not appropriate for management commentary to beincluded in the nancial statements.
Accordingly, the vast majority of annual reports present management’scommentary in the front half and the nancial statements and notes in the backhalf. Some companies have nevertheless experimented in this area, presentingnarrative reporting in amongst their primary statements, for example National GridPLC (illustrated below) and Vodafone PLC. The FRC lab’s report stated that a smallproportion of investors do prefer this presentation, as it aids management in theirefforts to tell the company’s story. Companies may therefore wish to engage withtheir primary audience to understand what presentation they would favour.
Top tips
• See whether there are immaterial disclosures that can be cut from your nancialstatements – regulators are keen to promote this message at a time when theaverage length of nancial statements increased from 53 pages to 55 pages.
• Make sure the nancial statements are consistent with the story told in the narrativereporting, virtually all companies with impairments, restructuring expenses orexceptional items in their nancial statements made sure they were discussed withsuitable prominence in the front-half.
• Although 89% of companies present their accounting policies together immediatelyafter the nancial statements, some investors prefer other presentations – see whatyour investors would like.
• Capi tal risk management disclosures are material in nature in the eyes of regulatorsand should not be boilerplate in nature – 90% of companies provided disclosure inthis area, although 22% of disclosures were generic.
Keep an eye on
• Make sure the notes are consistent internally – six of the ten companies thathad goodwill but no sensitivit y analysis had nevertheless identied the potentialimpairment of goodwill as a key source of estimation uncertainty, which mightsuggest a disconnect.
• Check through IFRS 3’s extensive disclosure requirements carefully – of thoseentities with a business combination in the period, 81% provided disclosureswhich were considered to meet all, or nearly all, of IFRS 3’s requirements.
• Goodwill impairment disclosures will always be an area of focus for regulatorsso get them right! Only 70% of companies clearly disclosed the allocation ofsignicant goodwill to the underlying cash-generating units as required by IAS 36.
19 https://www.frc.org.uk/Our-Work/ Publications/Financial-Reporting-Lab/ Accounting-policies-and-integration-of-related-n.pdf
122

8/10/2019 Uk Audit Annual Report Insights14 Full Survey
http://slidepdf.com/reader/full/uk-audit-annual-report-insights14-full-survey 125/144
National Grid Annual Report and Accounts 2013/14
Annual report insights 2014 123
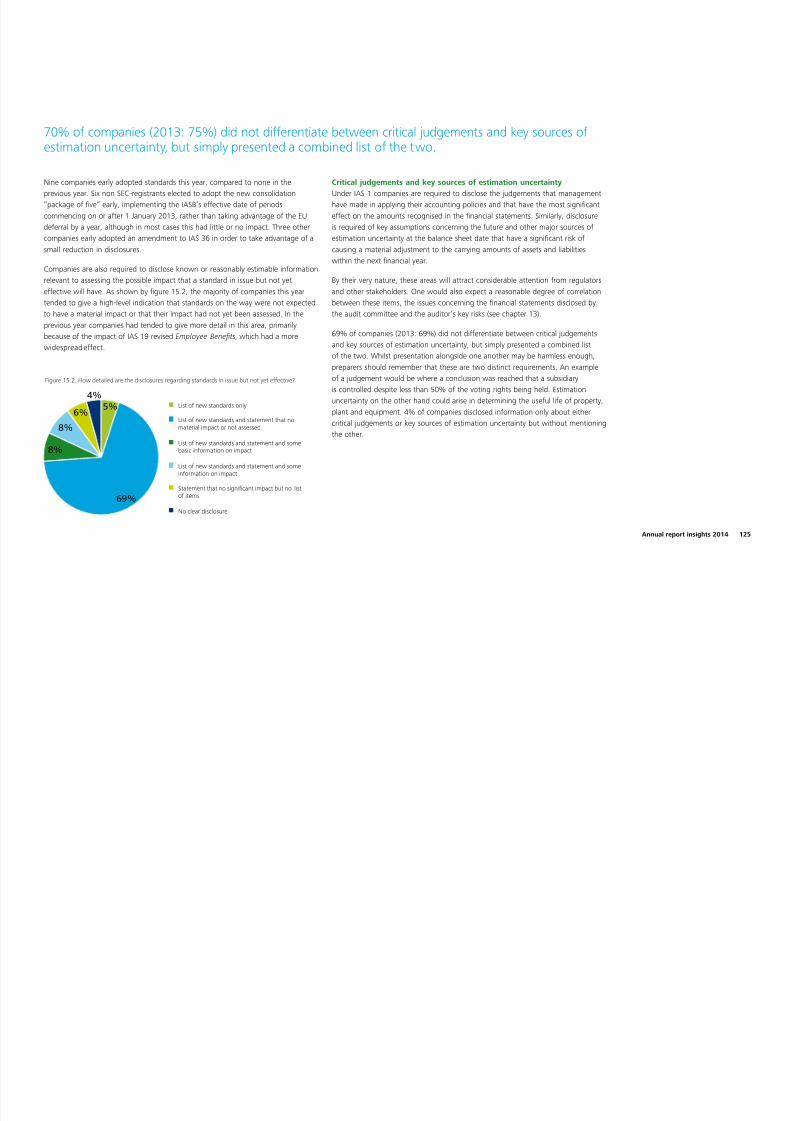
8/10/2019 Uk Audit Annual Report Insights14 Full Survey
http://slidepdf.com/reader/full/uk-audit-annual-report-insights14-full-survey 126/144
Regardless of whether narrative reporting is presented within the nancialstatements, integration of the front and back half is vital – a reader should nottake away a completely different message when reading one half compared tothe other. 69 companies in our sample were seen to have reported signicantrestructuring costs, impairment charges or exceptional items in their nancialstatements. Encouragingly, in all but one instance these items were commented onin the front half of the annual report with what was deemed a reasonable degreeof prominence, rather than being buried in the narrative reporting.
Structure of notesAs mentioned above, proposals already exist to clarify that the order of notes neednot reect the order in which they are listed in IAS 1. As set out in the FRC lab’sreport, differing views exist on whether companies would be best off retainingthis ordering, since it aids comparability and is still adopted by the majority ofcompanies, or innovating. For example, IMI PLCsplit their notes into ve sections –
the basis of preparation, results for the year, operating assets and liabilities, capitalstructure and nancing costs and other notes. This structure may help some readersmore readily understand a company’s story.
Choice for accounting policiesOne of the few areas where a handful of companies have started to mix thingsup and present information in a more engaging fashion is around signicantaccounting policies. The tradition has been to present this information as note 1to the nancial statements and as shown by gure 15.1 this remains the favouredposition. An example of an alternative approach, presenting accounting policies inthe relevant note, was provided by BAE Systems plc. In respect of the location ofaccounting policies, each approach has its own merits but, per the FRC’s report, forinvestors the most important thing is the content rather than the location.
Figure 15.1. How are the accounting policies presented?
88%
Seperate note immediately after primarystatements
Before the primary statements
Combined with the relavant note
Seperate appendix or other
2%4%
89%
5%
Where accounting policies were presented in a separate note, the length ofthe policies was similar to last year, varying from two and half to twenty pages(2013: three to nineteen pages) and averaging six and a half pages. The longestaccounting policies were presented by a bank in the FTSE 350 group and onecompany which had extended disclosures in the accounting policies section dueto a prior year restatement. Excluding these two companies, page length rangedfrom two and a half to thirteen pages, and averaged six; there was no noticeabledifference in lengths between the FTSE 350 and the other group.
In accordance with IAS 8 Accounting policies, Changes in A ccounting Estimatesand Errors companies are required to disclose if there have been any changes inaccounting policies, such as adopting a new or revised standard.
Nowadays the list of IFRS disclosure requirements alone is fairly extensive, with most new standardsintroducing additional disclosure requirements. It therefore came as little surprise that the averagelength of the nancial statements rose to 55 pages this year …
124

8/10/2019 Uk Audit Annual Report Insights14 Full Survey
http://slidepdf.com/reader/full/uk-audit-annual-report-insights14-full-survey 127/144

8/10/2019 Uk Audit Annual Report Insights14 Full Survey
http://slidepdf.com/reader/full/uk-audit-annual-report-insights14-full-survey 128/144
One company did not clearly disclose a section in relation to key sources of estimation uncertainty and critical judgements, instead highlighting any use of judgement undereach relevant accounting policy. One company was also bold enough to assert that there were no critical accounting estimates or judgements in the current or prior year.A few companies included key numbers in their disclosures or cross-referenced to the notes with further information. A good example of concise, company-specicdisclosure in this area, with appropriate linkage to other parts of the nancial statements, was presented by Evraz plc, an extract of which is reproduced below.
Evraz plc Annual Report and Accounts 2013
The combined number of critical judgements and key sources of estimation uncertainty disclosed has remained static compared to the prior year, with the largest numberbeing 14 and the average being ve. The average among both groups of companies was ve, thus implying that the size of a company does not necessarily dictate thenumber of judgements and uncertainties.
126
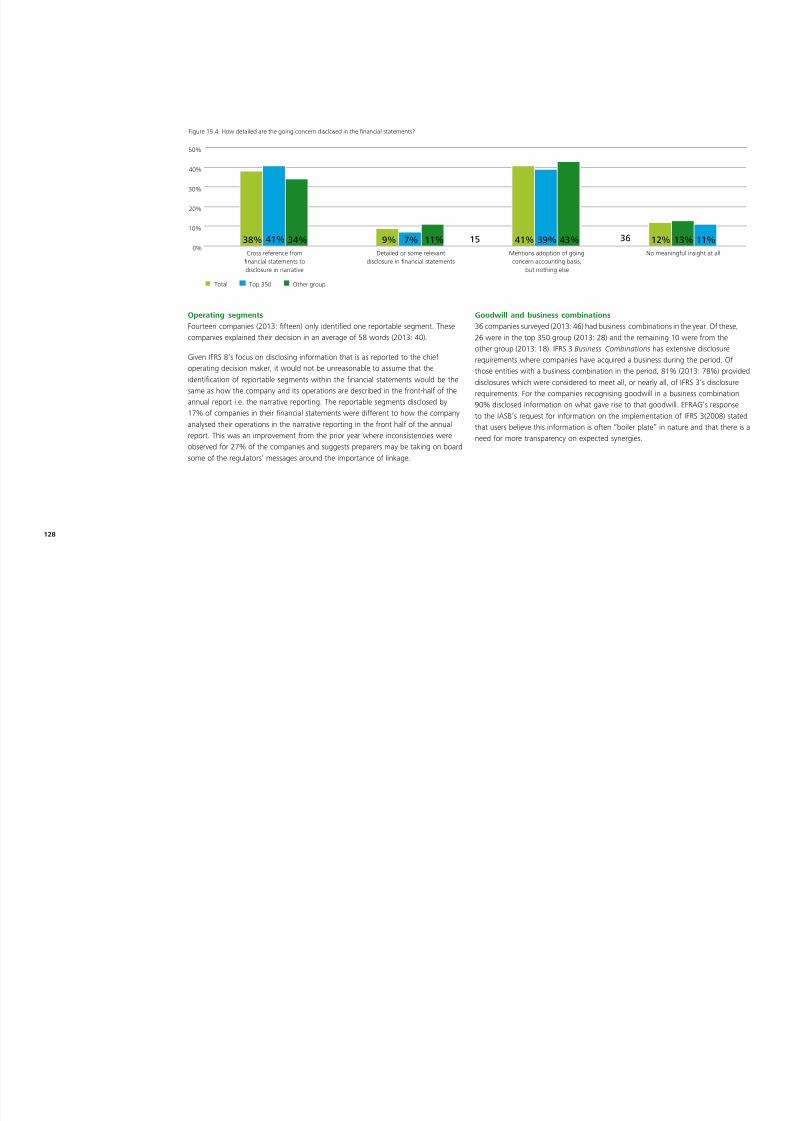
8/10/2019 Uk Audit Annual Report Insights14 Full Survey
http://slidepdf.com/reader/full/uk-audit-annual-report-insights14-full-survey 129/144
As shown in gure 15.3, the underlying areas common to a majority of companiesremain the same as last year, with goodwill and acquisitions, pensions, tax andprovisions being the most common areas of judgement and estimation uncertainty.The most popular item – accounting for goodwill and business combinationsreects the difculties preparers face as highlighted in EFRAG’s response to theIASB’s request for information on implementing IFRS 3(2008). Identifying whatconstitutes a business and intangible assets, measuring fair values and testinggoodwill for impairment are all areas that challenge preparers.
In 2014, only three companies identied the application of the going concern basisof accounting as being a critical judgement or key source of estimation uncertainty,as was the case in 2013.
58 companies identied issues other than those noted in gure 15.3 as being critical judgements and key sources of es timation uncert ainty. Common themes emer ginginclude the valuation of investment property, the measurement of contingentconsideration and the determination of fair values, reecting the impact of IFRS 13.
Recognising the importance of revenue recognitionOne of the key metrics for any business, revenue attracts a lot of attention fromshareholders, regulators and auditors alike. Despite this, many companies providescant detail on how they actually account for revenue and what their policy is forrecognising revenue. 42% of companies surveyed were deemed to have provided onlygeneric disclosure regarding revenue recognition, rather than meaningful company-specic information. IFRS 15 Revenue from Contracts with Customers was publishedin May 2014 and, in keeping with tradition, introduced a number of new disclosurerequirements. This is likely to lead to more disclosure about revenue recognition policiesbut there will be a wait for improvement given the IASB’s effective date is 2017.
Going concern problems going but not goneThe requirements for disclosure around going concern within the annual reportare discussed in detail in chapter 10. As shown by gure 15.4, just under half thecompanies surveyed either included detailed or relevant disclosure around going
concern in the nancial statements or provided a clear cross-reference to relevantdisclosure in the narrative reporting. 41% stated that the nancial statements wereprepared on a going concern basis yet did not expand on this. The remaining 12%gave no meaningful insight at all on going concern within the nancial statements,albeit in some of these cases there were generic descriptions of managing capital toensure companies could continue as going concerns.
Figure 15.3. How many companies include the following items as critical judgements or key sources of estimation uncertainty?
0
20
40
60
80
Impairment(generic issues)
Share basedpayments
RevenueRecognition
Current AssetsFinancialInstruments
Tangible &Fixed Assets
IntangiblesProvisionsTaxPensionsGoodwill &acquisitions
71 65 56 67 56 51 54 56 43 56 24 22 24 25 35 27 32 33 12 14 34%
237
2014 2013
Annual report insights 2014 127
8/10/2019 Uk Audit Annual Report Insights14 Full Survey
http://slidepdf.com/reader/full/uk-audit-annual-report-insights14-full-survey 130/144
Figure 15.4. How detailed are the going concern disclosed in the nancial statements?
0%
10%
20%
30%
40%
50%
No meaningful insight at allMentions adoption of goingconcern accounting basis,
but nothing else
Detailed or some relevantdisclosure in nancial statements
Cross reference fromnancial statements todisclosure in narrative
38% 41% 34% 9% 7% 13%11% 41% 39% 43% 12% 11%15 36
Total Top 350 Other group
Operating segmentsFourteen companies (2013: fteen) only identied one reportable segment. Thesecompanies explained their decision in an average of 58 words (2013: 40).
Given IFRS 8’s focus on disclosing information that is as reported to the chiefoperating decision maker, it would not be unreasonable to assume that theidentication of reportable segments within the nancial statements would be thesame as how the company and its operations are described in the front-half of theannual report i.e. the narrative reporting. The reportable segments disclosed by17% of companies in their nancial statements were different to how the companyanalysed their operations in the narrative reporting in the front half of the annual
report. This was an improvement from the prior year where inconsistencies wereobserved for 27% of the companies and suggests preparers may be taking on boardsome of the regulators’ messages around the importance of linkage.
Goodwill and business combinations36 companies surveyed (2013: 46) had business combinations in the year. Of these,26 were in the top 350 group (2013: 28) and the remaining 10 were from theother group (2013: 18). IFRS 3 Business Combinations has extensive disclosurerequirements where companies have acquired a business during the period. Ofthose entities with a business combination in the period, 81% (2013: 78%) provideddisclosures which were considered to meet all, or nearly all, of IFRS 3’s disclosurerequirements. For the companies recognising goodwill in a business combination90% disclosed information on what gave rise to that goodwill. EFRAG’s responseto the IASB’s request for information on the implementation of IFRS 3(2008) statedthat users believe this information is often “boiler plate” in nature and that there is aneed for more transparency on expected synergies.
128

8/10/2019 Uk Audit Annual Report Insights14 Full Survey
http://slidepdf.com/reader/full/uk-audit-annual-report-insights14-full-survey 131/144
Testing times for goodwillIAS 36 Impairment of Assets requires goodwill to be tested for impairment annuallyand as part of this has a number of disclosure requirements, as noted below. By itsvery nature this continues to be an area of focus for auditors and regulators alike.
80 companies surveyed recognised goodwill on their balance sheets at the end ofthe current reporting period (2013: 86). Of these, only 70% of companies disclosedthe allocation of signicant goodwill to the underlying cash-generating units(CGUs) as required by IAS 36. In a number of cases where this information was notdisclosed an allocation by operating segment was provided, but it was not madeclear whether the operating segments corresponded to CGUs.
Assets are tested for impairment by comparing the asset’s carrying amount toits recoverable amount; recoverable amount is calculated as the higher of theasset’s value in use and its fair value less costs to sell. Three companies justiedthe carrying value of goodwill by reference to fair value less costs to sell, while allothers had a recoverable amount based on value in use.
For those entities with recoverable amounts based on value in use, IAS 36 requiresdisclosure of the period over which management’s projections of cash ows arebased on approved budgets or forecasts and, where this exceeds ve years anexplanation of why that longer period is justied. 94% of companies using valuein use to support goodwill disclosed the period covered by budgets or forecasts.Only three companies indicated that the period was more than ve years, with twoproviding an explanation to justify the longer period.
Value in use calculations may extrapolate cash ow projections beyond the periodcovered by budgets or forecasts by applying a steady or declining growth rate(unless an increasing rate is justied). Where the growth rate exceeds the long termindustry average a justication should be provided. 36% of companies using thevalue in use method explicitly stated that the growth rate applied did not exceedthe long-term average growth rates for the relevant country or market, albeit thereis no requirement for a negative statement like this; a further 9% implied that thiswas the case. The remaining companies remained silent as to whether their longterm growth rate exceeded the average, although in a number of cases the growthrate applied was nil.
94% of companies using the value in use method (2013: 91%) disclosed thediscount rate used. 8% of companies using the value in use method only had oneCGU with signicant goodwill; of the remaining companies, only 55% indicated thatthey had used more than one discount rate for different CGUs or groups of CGUs.
Unless cash-ows are risk-adjusted the discount rate applied to an individual CGUshould reect the risks specic to that CGU.
Both the value in use method and the calculation of a CGU’s fair value less coststo sell require the use of estimates and assumptions. For CGUs with signicantgoodwill, if a reasonably possible change in a key assumption would lead toan impairment, IAS 36 requires the disclosure of further relevant sensitivityinformation.
80 companies surveyed recognised goodwill on their balance sheets at the end of the currentreporting period.
Annual report insights 2014 129

8/10/2019 Uk Audit Annual Report Insights14 Full Survey
http://slidepdf.com/reader/full/uk-audit-annual-report-insights14-full-survey 132/144
As shown by gure 15.5, 53% of companies with goodwill (2013: 48%) provided eitherdetailed or high-level sensitivity analysis. Just over a third of companies of companieswith goodwill included a negative statement that there were no reasonably possiblechanges that would cause an impairment. Six of the ten companies that had goodwillbut no sensitivity analysis had nevertheless identied the potential impairment ofgoodwill as a key source of estimation uncertainty. This suggests that there may besome disconnect between the different disclosure elements in the nancial statements.
Figure 15.5. Were additional sensitivity disclosures provided regarding goodwill impairment?
Detailed sensitivity analysis
High-level sensitivity analysis
Negative statement only
No sensitivity analysis
9%
44%
12%
35%
Other intangible assetsSixteen companies (2013: 10) surveyed had no intangible assets (excludinggoodwill) recognised on their balance sheets at their reporting date. Thirteen ofthese were from the ‘other group’. Figure 15.6 further analyses the number ofclasses of intangibles companies have identied.
15% of companies with intangible assets (other than goodwill) disclosed that one or moreclasses of intangible assets had been assessed to have an indenite life. IAS 38 Intangible
Assets requires the reasons supporting the assessment of an indenite useful life to bedisclosed, including the factors that played a signicant role in determining that the assethas an indenite useful life. It is encouraging to see that 92% of companies with intangibleassets assessed to have an indenite life included the reasons supporting the judgement.A good example of justication in this regard was presented by LSL Property Serv ices plc.
LSL Property Services plc Annual Report and Accounts 2013
Figure 15.6. How many classes of intangibles (other than goodwill) are recognised?
0
10
20
30
6 or more543210
16 10 13 16 17 14 21 28 19 14 9 9 5 8
2014 2013
130
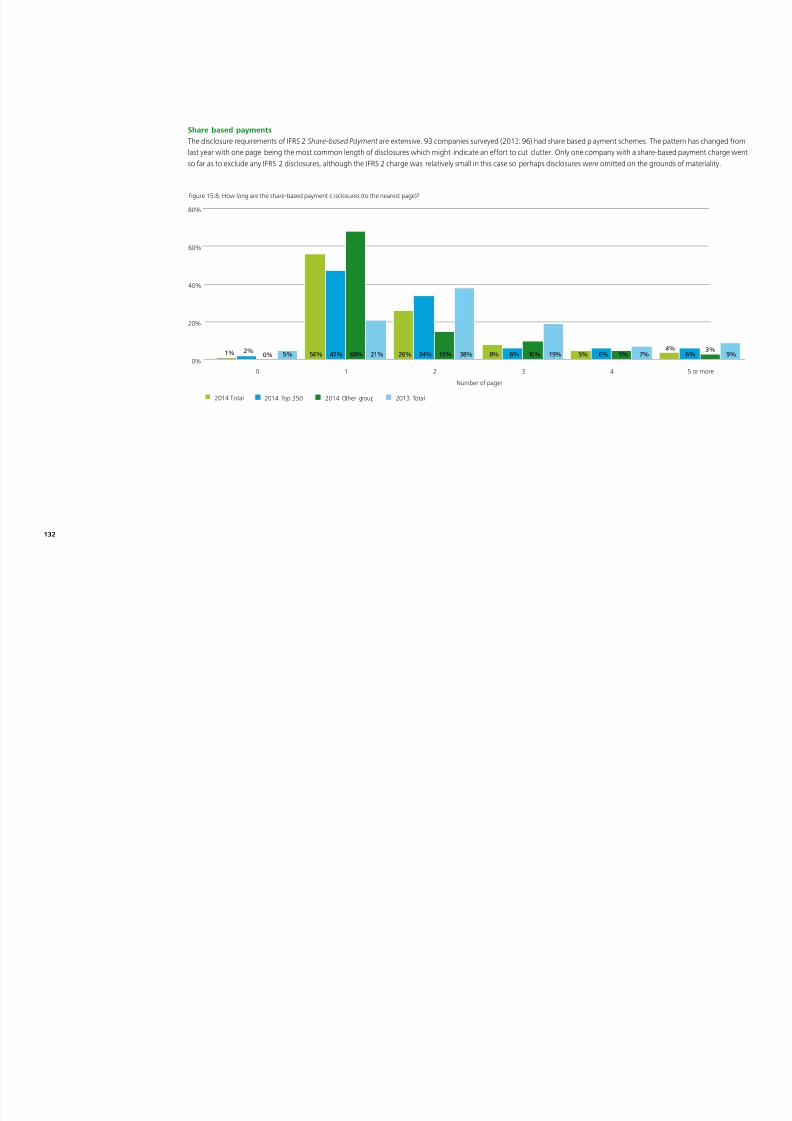
8/10/2019 Uk Audit Annual Report Insights14 Full Survey
http://slidepdf.com/reader/full/uk-audit-annual-report-insights14-full-survey 133/144
Impairments91 companies (2013: 81) surveyed recognised an impairment loss in the year. Figure 15.7 indicates what was impaired in the period. Of those nancial assets impaired in2014, trade receivables remained the most commonly impaired item.
Figure 15.7. What has been impaired during the year?
0
20
40
60
80
100
OtherIntangiblesGoodwillProperty, plant and equipmentFinancial assets(including trade receivables)
89 74 26 18 15 14 19 12 249
2014 July-05 2012
For all material impairments, IAS 36 requires the events and circumstances that led to the recognition of the impairment loss to be disclosed. The vast majority of companieshad provided such information. The majority of “other” impairment losses related to inventory write-offs.
It is encouraging to see that 92% of companies with intangible assets assessed to have an indenite lifeincluded the reasons supporting the judgement.
Annual report insights 2014 131
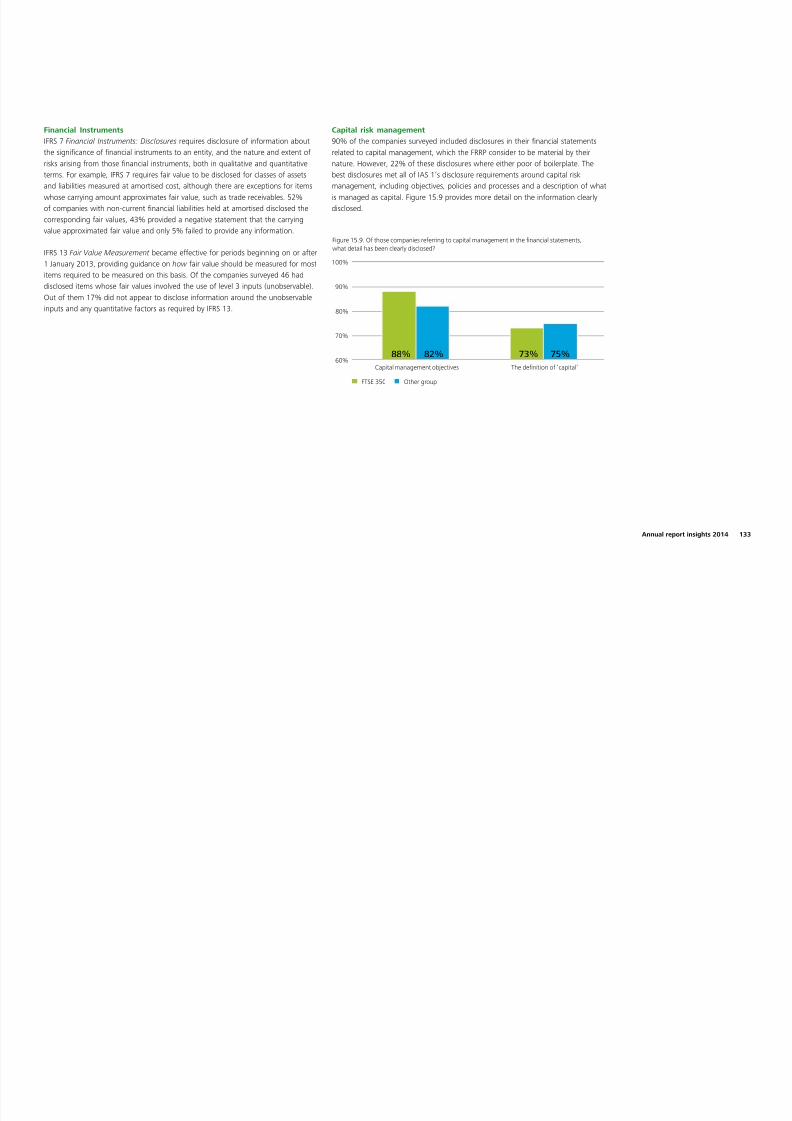
8/10/2019 Uk Audit Annual Report Insights14 Full Survey
http://slidepdf.com/reader/full/uk-audit-annual-report-insights14-full-survey 134/144
Share based paymentsThe disclosure requirements of IFRS 2 Share-based Payment are extensive. 93 companies surveyed (2013: 96) had share based p ayment schemes. The pattern has changed fromlast year with one page being the most common length of disclosures which might indicate an effort to cut clutter. Only one company with a share-based payment charge wentso far as to exclude any IFRS 2 disclosures, although the IFRS 2 charge was relatively small in this case so perhaps disclosures were omitted on the grounds of materiality.
Figure 15.8. How long are the share-based payment d isclosures (to the nearest page)?
0%
20%
40%
60%
80%
5 or more43210
1% 56% 47% 68% 21% 26% 34% 15% 38% 8% 6% 10% 19% 5% 6% 5% 7%4%
6%3%
9%0%2%
5%
2014 Total 2014 Top 350 2014 Other group 2013 Total
Number of pages
132

8/10/2019 Uk Audit Annual Report Insights14 Full Survey
http://slidepdf.com/reader/full/uk-audit-annual-report-insights14-full-survey 135/144
Financial InstrumentsIFRS 7Financial Instruments: Disclosures requires disclosure of information aboutthe signicance of nancial instruments to an entity, and the nature and extent ofrisks arising from those nancial instruments, both in qualitative and quantitativeterms. For example, IFRS 7 requires fair value to be disclosed for classes of assetsand liabilities measured at amortised cost, although there are exceptions for itemswhose carrying amount approximates fair value, such as trade receivables. 52%of companies with non-current nancial liabilities held at amortised disclosed thecorresponding fair values, 43% provided a negative statement that the carryingvalue approximated fair value and only 5% failed to provide any information.
IFRS 13 Fair Value Measurement became effective for periods beginning on or after1 January 2013, providing guidance on how fair value should be measured for mostitems required to be measured on this basis. Of the companies surveyed 46 haddisclosed items whose fair values involved the use of level 3 inputs (unobservable).
Out of them 17% did not appear to disclose information around the unobservableinputs and any quantitative factors as required by IFRS 13.
Capital risk management90% of the companies surveyed included disclosures in their nancial statementsrelated to capital management, which the FRRP consider to be material by theirnature. However, 22% of these disclosures where either poor of boilerplate. Thebest disclosures met all of IAS 1’s disclosure requirements around capital riskmanagement, including objectives, policies and processes and a description of whatis managed as capital. Figure 15.9 provides more detail on the information clearlydisclosed.
60%
70%
80%
90%
100%
The denition of ‘capital’Capital management objectives
Figure 15.9. Of those companies referring to capital management in the nancial statements,what detail has been clearly disclosed?
88% 82% 73% 75%
FTSE 350 Other group
Annual report insights 2014 133

8/10/2019 Uk Audit Annual Report Insights14 Full Survey
http://slidepdf.com/reader/full/uk-audit-annual-report-insights14-full-survey 136/144
Auditors’ remune ration and indepe ndenceThe vast majority of companies, 97%, received some form of non-audit services from their auditors – a frequent area of focus and debate for regulators. It was good to seethat 60% of companies either disclosed their policy on non-audit services or cross reference to their website. Figure 15.10 provides further analysis on disclosed policies.
Figure 15.10. Does the policy on the provision of non-audit services describe those services which are prohibited, those which are pre-approved and those which specic approval is required?
0%
20%
40%
60%
No mention of a policyImplies there’s a policy,but no detail disclosed
NoPolicy not stated in full,but cross reference to website
Yes
53% 39% 7% 7% 7%11% 45% 43% 19% 5120% 1%36
134
Appendix 1 – Key messages on directors’remuneration reports

8/10/2019 Uk Audit Annual Report Insights14 Full Survey
http://slidepdf.com/reader/full/uk-audit-annual-report-insights14-full-survey 137/144
Following the introduction of legislation that has had a signicant impact onquoted companies’ directors’ remuneration reports, our survey Providing a clear
steer examined the average length of directors’ remuneration reports, includingthe constituent components (see chapter 5) and the linkage of remuneration to keyperformance indicators (see chapter 10).
We have also recently conducted a review of the new remuneration reports ofaround 70% of FTSE 100 companies with nancial years ending up to February2014. This review, which forms part of our soon to be published guide to directors’remuneration in FTSE 100 companies, focuses on some of the key disclosures wherethere are choices and decisions to be made about what and how informationshould be disclosed and the specic aspe cts of the new disclosure wherecompanies and investors are focusing attention. This appendix presents the ndingsfrom this other review.
Some parts of the regulations are less prescriptive than others and companies havehad to make many judgment calls on the level of detail to include. In the rst year ofreporting, before best practice begins to emerge, this has clearly been a challengeand it is not surprising that we are seeing differences in the level of informationbeing disclosed and the format and presentation of this data.
The directors’ remuneration report must contain a statement by the chair of theremuneration committee. This should include details of the major decisions ondirectors’ remuneration, any substantial changes relating to directors’ remunerationmade during the year and the context in which those changes occurred anddecisions have been taken. The statement provides an opportunity to tell the storyof the year in respect of remuneration, setting the scene for the details to followand ensuring there are no major surprises in store. All companies have includedthis statement; however, the content varies considerably. Most companies haveprovided a good summary of any proposed changes in remuneration arrangementsfor the coming year with some explanation and justication. Only around halfprovide details of the context in which decisions were taken and very few provideddetails of the relationship between remuneration and the business strategy.
The other two main components of the new-style reports are a policy report,setting out a company’s policy on directors’ remuneration, and an annual
remuneration report, which reviews the historical remuneration. Some of the keyndings from our review are as set out in the following pages.
remuneration reports
Some parts of the regulations are less prescriptive than others and companies have had to make many judgment calls on the level of detail to include. In the rst year of reporting, before best practice beginsto emerge, this has clearly been a challenge …
Annual report insights 2014 135

8/10/2019 Uk Audit Annual Report Insights14 Full Survey
http://slidepdf.com/reader/full/uk-audit-annual-report-insights14-full-survey 138/144
8/10/2019 Uk Audit Annual Report Insights14 Full Survey
http://slidepdf.com/reader/full/uk-audit-annual-report-insights14-full-survey 139/144
Key themes emerging from the annual remuneration report
Annual remuneration re port
• The lack of disclosure in relation to bonus payouts has been one of the key issues raised by shareholders during the 2014 AGM season.
– Almost 90% of companies disclose the retrospectiv e bonus measures although where these are non-nancial in nature specic details are not always given.
– Around 70% of companies disclose the weightings that apply to these measures.
– Just over 20% provide full details of nancial targets with a similar number providing partial disclosure. Around a quarter of companies give some indication of thetargets for non-nancial measures but very few give specic details.
– In total just under half provide some disclosure in relation to targets. Where there is no disclosure of targets around two thirds provide a good level of detail of thedegree to which the targets were achieved. However, around 10% gave almost no details of either the targets or the degree of achievement.
• Almost half of companies disclose the retrospective measures and the weighting of the measures used for awards made under long term plans vesting in respect ofthe year under review. Around 85% disclosure the specic targets.
• Implementation in the next nancial period – most companies disclose information about salaries (85% of companies) and fees (60% of companies) to be paid in thenext nancial period and the level of awards to be made under incentive plans, or at least conrm that these will be in line with those disclosed in the policy.
• Companies are not disclosing prospective bonus performance targets on the grounds that they are commercially sensitive. However around two thirds are disclosingsome degree of information at least around the nancial measures on which the bonus will be based.
• Just over half of companies provide full disclosure of the measures and targets relating to prospective long term awards with a further 20% making partial disclosure,typically disclosing the measures but not the actual targets.
• Relative spend on pay – almost half of companies show the minimum requirements (employee costs and dividend/buybacks). Around a third include a measure ofprot. A small number of companies include additional information.
Annual report insights 2014 137
Appendix 2 – Glossary of terms and abbreviations
8/10/2019 Uk Audit Annual Report Insights14 Full Survey
http://slidepdf.com/reader/full/uk-audit-annual-report-insights14-full-survey 140/144
BIS The Department for Business, Innovation and Skills
BR Business Review
The Companies Act 2006 requires that directors’ reports include a Business Review.
CEO Chief Executive Ofcer
CGU Cash generating unit
CODM Chief Operating Decision Maker
Competition CommissionAn independent public body which helps to ensure healthy competition betweencompanies in the UK for the ultimate benet of consumers and the economy.
Conduct CommitteeThe Conduct Committee of the FRC have taken on the legal powers of the FRRP,following the FRC’s restructuring.
CSR Corporate social responsibilityCorporate social responsibility is about how businesses take account of theireconomic, social and environmental impact. The Companies Act 2006 requires thatcompanies disclose information, about environmental matters, their employees, andsocial and community issues, in their annual report.
DTR Disclosure and Transparency RulesThese rules of the FCA include requirements for periodic nancial reporting to meetthe requirements of the EU Transparency Directive.
EBITDA Earnings before interest, tax and amortisation
EC European Commission
EDTF Enhanced Disclosure Task ForceEstablished by the Financial Stability Board in May 2012, the Task Force aims toimprove the risk disclosures of banks and other nancial institutions.
EPS Earnings per share
ESMA European Securities and Markets AuthorityAn independent EU Authority that seeks to ensure the integrity, transparency,efciency and orderly functioning of securities markets, as well as enhancinginvestor protection.
EU European Union
FCA Financial Conduct AuthorityOriginating from the former Financial Services Authority, the FCA acts as theCompetent Authority for setting and enforcing the rules applicable to listedcompanies and those admitted to trading on a regulated market.
FRC’s Financial Reporting LabFacilitated by a steering group and FRC staff, the Lab provides an environmentwhere investors and companies can come together to develop pragmatic solutionsto reporting needs.
FRC Financial Reporting CouncilThe UK’s independent regulator responsible for promoting condence in corporatereporting and governance and issuing accounting standards.
138

8/10/2019 Uk Audit Annual Report Insights14 Full Survey
http://slidepdf.com/reader/full/uk-audit-annual-report-insights14-full-survey 141/144

8/10/2019 Uk Audit Annual Report Insights14 Full Survey
http://slidepdf.com/reader/full/uk-audit-annual-report-insights14-full-survey 142/144
Regulated marketRegulated market is dened in the Markets in Financial Instruments Directive.The European Commission website also includes a list of regulated markets at:
http://ec.europa.eu/internal_market/securities/isd/index_en.htm
SEC U.S. Securities and Exchange CommissionRegulator of all securities commissions within the United States of America.
SOCIE Statement of Changes in Equity
SORIE Statement of Recognised Income and Expense
SORP Statement of Recommended Practice
STRGL Statement of total recognised gains and losses
UK Corporate Governance Code
The UK Corporate Governance Code sets out standards of good practice on issuessuch as board composition and development, remuneration, accountability and audit,and relations with shareholders. All companies with a previous listing are required underthe Listing Rules to report in their annual report on how they have applied the UKCorporate Governance Code.
UKLA UK Listing AuthorityThe FCA acting in its capacity as the competent authority for the purposes of Part VIof the Financial Services and Markets Act 2000.
140
Other resources available

8/10/2019 Uk Audit Annual Report Insights14 Full Survey
http://slidepdf.com/reader/full/uk-audit-annual-report-insights14-full-survey 143/144
Deloitte would be pleased to advise on specic application of the principles setout in this publication. Professional advice should be obtained as this generaladvice cannot be relied upon to cover specic situation; application will depend
on the particular circumstances involved. If you would like further, more detailedinformation or advice, or would like to meet with us to discuss your reportingissues, please contact your local Deloitte partner or:
Tracy [email protected]
James Rogers jrogers@deloi tte.co.uk
Corinne [email protected]
Amanda [email protected]
Christos [email protected]
Peter [email protected]
UK Accounting PlusFor the latest news and resources on UK accounting, reporting and corporategovernance, go to www.ukaccountingplus.co.uk . UK Accounting Plus is the
UK-focused version of Deloitte’s hugely successful and long-established globalaccounting news and comment service, IAS Plus.
GAAP 2015 Model annual report and nancial statements for UK listedgroups (due out around the end of 2014)This Deloitte publication illustrates the disclosures in force for December 2014 yearends, including material encompassing all of the revised reporting requirementsdiscussed herein. If you would like to obtain a copy of this publication please speakto your Deloitte contact.
Annual report insights 2014 141

8/10/2019 Uk Audit Annual Report Insights14 Full Survey
http://slidepdf.com/reader/full/uk-audit-annual-report-insights14-full-survey 144/144
Deloitte refers to one or more of Deloitte Touche Tohmatsu Limited (“DTTL”), a UK private company limited by guarantee, and its network of member rms, each of which is a legally separateand independent entity. Please see www.deloitte.co.uk/about for a detailed description of the legal structure of DTTL and its member rms.
Deloitte LLP is the United Kingdom member rm of DTTL.
This publication has been written in general terms and therefore cannot be relied on to cover specic situations; application of the principles set out will depend upon the particularcircumstances involved and we recommend that you obtain professional advice before acting or refraining from acting on any of the contents of this publication. Deloitte LLP would be pleasedto advise readers on how to apply the principles set out in this publication to their specic circumstances. Deloitte LLP accepts no duty of care or liability for any loss occasioned to any person