uk continental shelf health & safety offshore workforce...
TRANSCRIPT

page 1
HEALTH & SAFETYREPORT 2015
OIL &
GAS UKUKCS O
FFSHORE W
ORKFO
RCE DEMO
GRAPHICS REPORT 2015
UKCS OFFSHO
RE WO
RKFORCE DEM
OGRAPHICS REPO
RT 2015O
IL & GAS UK
UK CONTINENTAL SHELF OFFSHORE WORKFORCE DEMOGRAPHICS REPORT 2015


page 3
Contents
1. Foreword 52. Summary of Findings 63. Introduction 74. TotalOffshoreWorkforce 85. CoreWorkforce 156. ResidentialLocationsandNationalities
oftheWorkforce 227. FemaleWorkforce 258. WorkforceAgeAnalysis 28
UKCS OFFSHORE WORKFORCE DEMOGRAPHICS REPORT 2015

UKCS OFFSHORE WORKFORCE DEMOGRAPHICS REPORT 2015
page 4

page 5
1. Foreword
Welcome to the ninth edition of Oil & Gas UK’s Demographics Report, which takes an in-depth look at the offshore workforce employed by the industry on the UK Continental Shelf (UKCS) in 2014. Since the publication of the last edition in May 2014, the upstream industry has been adjusting to a dramatically different business landscape, where the impact of oil price, combined with the challenge of operating in a high cost, mature basin, is having a negative effect on future activity. While the full impact of these changes on the offshore workforce is yet to be realised, the data in this report will provide a baseline for measuring how these prevailing business conditions affect employment levels.
Two new elements have been included in the report for the first time this year: the first provides a comparison of the numbers and roles of female workers on the UKCS with those of our North Sea neighbours in The Netherlands, Denmark and Norway, reflecting the industry’s outward-looking approach to learning from other oil and gas provinces. The second element consists of age profiles for the core offshore workforce (those who work offshore for 100 nights or more per year) as well as the non-core groups. This extra information augments the data we provide for the total offshore workforce and provides additional evidence to refute the public perception that the oil and gas workforce is ageing, or part of what has been described as ‘the great crew change’.
As always, Oil & Gas UK would welcome any feedback you have on the report or ideas for future editions. If you would like to get in touch with either, or indeed if you have any questions, please email me at [email protected].
Dr Alix ThomOil & Gas UK’s employment and skills issues manager
1
2
3
4
5
6
7
8

UKCS OFFSHORE WORKFORCE DEMOGRAPHICS REPORT 2015
page 6
2. Summary of Findings
The data used in this report are drawn from the Vantage Personnel On Board (POB) system and have been analysed to identify trends in the UK oil and gas offshore workforce.
• 64,113 people travelled offshore in 2014 representing a 3.6 per cent (61,892) increase from 2013.• The number of core workers (those working over 100 nights a year offshore) rose to 28,990 in 2014 from
27,749 in 2013. The core workforce represented 45 per cent of the total offshore workforce.• The total number of personnel travelling offshore continued to rise – albeit a lesser year-on-year increase than
has been seen previously – despite the average oil price dropping from $109 to $99 per barrel between 2013 and 2014.
• There was an 18 per cent (2,335) increase in those working for operators in 2014 compared to a 0.2 per cent (114) decrease in contractor personnel.
• The majority of the total offshore workforce worked for a single operator and travelled to a single location last year.
• Almost 50 per cent of the total workforce worked in the central North Sea region.• The core offshore workforce produced the equivalent of 49,327 barrels of oil per person in 2014.• Over 27 per cent of offshore workers who reside in the UK are based in Aberdeen City or Aberdeenshire.• 84 per cent of the offshore workforce in 2014 were of British nationality.• Women continued to represent 3.6 per cent of the total offshore workforce last year and 2.9 per cent of the
core workforce. More female workers perform catering roles than any other discipline.• The average age of the offshore worker has remained at 40.8 years of age.

page 7
3. Introduction
This report provides an up-to-date analysis of demographics data for the offshore workforce on the UK Continental Shelf (UKCS) between 2006 and 2014.
The offshore population comprises a core workforce, defined as those who work offshore for 100 nights or more in one calendar year, and those who have travelled offshore for at least one but less than 100 nights. Data are extracted from the Vantage Personnel on Board (POB) system that tracks the movement of personnel to and from offshore installations.
The report will consider the differences that arise between the core and total workforce and between operators and contractors, as well as analysing the workers’ UK residential locations, the nationalities represented by the workforce, the female demographic, the age profile of the workforce and how these have changed.
1
2
3
4
5
6
7
8

UKCS OFFSHORE WORKFORCE DEMOGRAPHICS REPORT 2015
page 8
4. TotalOffshoreWorkforce
The core off shore workforce (comprising those who have been off shore for 100 or more nights in a single calendar year) represented 28,990 workers out of a total off shore workforce of 64,113. The core and non-core off shore workforce represents less than one fi ft h of the total number of employees working directly in, or as a result of acti viti es generated by, the UK off shore oil and gas industry, which at the start of 2014, totalled more than 400,000.
The total off shore workforce (64,113) increased by 2,221 workers (3.6 per cent) from 2013 to 2014 and compares with an increase of 4,910 workers (8.6 per cent) from 2012 to 2013. The conti nued rise in total off shore personnel may be att ributed to the ongoing robust maintenance programmes, together with the development of major off shore projects such as Nexen’s Golden Eagle and BP’s Clair Ridge. However, the soft ening of theyear-on-year increase in total off shore personnel last year could be due to the completi on of a number of2013 projects.
Figure 1: Total Number of Personnel who Travelled Off shore
86%
8%6%
Remaining Workforce (Onshore)
Non-Core Offshore Personnel
Core Offshore Personnel
Source: Vantage POB
86%
8%6%
Remaining Workforce (Onshore)
Non-Core Offshore Personnel
Core Offshore Personnel
Source: Vantage POB
As was seen in 2013, there was an increase in employees in all off shore disciplines, with no parti cular sub-sector or role subject to higher than average growth.
0

page 9
1
2
3
4
5
6
7
8
Figure 2 provides a breakdown of the total off shore workforce by those working for operators and those employed by contracti ng companies.
There was a noti ceable change last year in this area with an 18 per cent increase in the number of personnel working for operators to 15,306. The number of contractor personnel, meanwhile, decreased by 0.2 per cent to 48,807. This is an acute diff erence from 2013, when operator and contractor employee levels increased by 4.2 and ten per cent, respecti vely.
The contractor community represented 76 per cent of the total off shore workforce in 2014 compared with 80 per cent in the previous year.
Figure 2: Total Personnel Travelling Off shore for Operators and Contractors

UKCS OFFSHORE WORKFORCE DEMOGRAPHICS REPORT 2015
page 10
Of the total non-core workers (35,123), the largest proporti on (10,128) conti nued to travel off shore for ten nights or less. Of the total off shore workforce, 15.8 per cent travelled off shore for ten nights or less.
The most noti ceable increase is found in the number of personnel travelling off shore for 91 to 100 days, with a 12.4 per cent rise from 1,820 to 2,045. Workers spending between 31 to 40 and 41 to 50 days off shore have seen increases of 11.5 per cent and ten per cent, respecti vely.
Figure 3: The Number of Nights Spent Off shore by the Non-Core Workforce in 2012, 2013 and 2014

page 11
1
2
3
4
5
6
7
8
The correlati on observed unti l 2012 between the average oil price and the total number of off shore personnel, with a one-year ti me lag, does not conti nue. From 2013 to 2014, there was a nine per cent drop in the average oil price per barrel (bbl) and a 3.6 per cent rise in the total off shore workforce. This can be compared with 2013 when there was a 2.7 per cent drop in average oil price alongside an 8.6 per cent increase in off shore workers.
Figure 4: The Total Number of Personnel Travelling Off shore Versus the Average Oil Price

UKCS OFFSHORE WORKFORCE DEMOGRAPHICS REPORT 2015
page 12
There is a conti nuing trend when looking at the breakdown of locati ons visited and the number of operators worked for by the off shore workforce, with the majority travelling to a single locati on and working for one operator.
Figure 5: The Number of Locati ons Visited by the Total Off shore Workforce in 2014
Figure 6: The Number of Operators Worked for by the Total Off shore Workforce in 2014
66%
17%
8%
4% 2% 3%
1
2
3
4
5
6+
Source: Vantage POB

page 13
1
2
3
4
5
6
7
8
Similar to 2013, almost half of the offshore workforce travelled to the central North Sea last year. There was a 20.8 per cent (447) decrease in the numbers working in the west of Shetland (W of S) overall.
Figure 7: Geographical Distribution of the Total Offshore Workforce on the UK Continental Shelf 1
1 All percentages displayed have been rounded and so do not add up to 100.
West of ShetlandNo.ofMales&
Females No.ofMales No.ofFemales
1,704 1,605 99% of Total Workforce 2.7 2.5 0.2
Northern North SeaNo.ofMales&
Females No.ofMales No.ofFemales
8,482 8,196 286% of Total Workforce 13.2 12.8 0.4
Central North SeaNo.ofMales&
Females No.ofMales No.ofFemales
31,408 30,076 1,332% of Total Workforce 49 46.9 2.1
Morecambe Bay (including East Irish Sea)No.ofMales&
Females No.ofMales No.ofFemales
1,261 1,220 41% of Total Workforce 2 1.9 0.1
Southern North SeaNo.ofMales&
Females No.ofMales No.ofFemales
6,023 5,863 160% of Total Workforce 9.4 9.1 0.2
Multiple SectorsNo.ofMales&
Females No.ofMales No.ofFemales
15,235 14,850 385% of Total Workforce 23.8 23.2 0.6
Source: Vantage POB

UKCS OFFSHORE WORKFORCE DEMOGRAPHICS REPORT 2015
page 14
Figure 8 represents the geographical distributi on of the workforce as a cluster graph. It is evident that the distributi on has been relati vely stable since the fi rst data collecti on of off shore demographics in 2006.
Figure 8: Geographical Distributi on of the Total Off shore Workforce on the UK Conti nental Shelf 2
There have been some noti ceable changes between 2006 and 2014, parti cularly in the W of S region, with the number of male and female workers rising by 40.1 per cent and 57.1 per cent, respecti vely. The only percentage decrease between 2006 and 2014 was found in the female workforce travelling to the southern North Sea, whilst the most noti ceable percentage increases were for the female numbers travelling to the northern North Sea and the male workers travelling to Morecambe Bay. It is interesti ng to note that exactly the same number of female workers travelled to multi ple sectors throughout the UKCS in 2006 as they did in 2014.
Figure 9: Diff erence in the Geographical Distributi on of the Total Off shore Workforce
2 Data collecti on for the Morecambe Bay/East Irish Sea area started in 2009.
Sectors 2006 2014 %Difference2006 to 2014
No.Males No.Females No.Males No.Females No.Males No.FemalesCentral NorthSea
21,805 903 30,076 1,332 37.9 47.5
MorecambeBay(including East Irish Sea)2
814 30 1,220 41 49.9 36.7
NorthernNorthSea
6,255 181 8,196 286 31 58
SouthernNorthSea
5,522 208 5,863 160 6.2 -23.1
WestofShetland
1,146 63 1,605 99 40.1 57.1
MultipleSectors12,959 385 14,850 385 14.6 0
Source: Vantage POB

page 15
1
2
3
4
5
6
7
8
5. CoreWorkforce
The core workforce comprises those who have been off shore for 100 or more nights in a single calendar year. The number of core personnel increased from 27,749 in 2013 to 28,990 in 2014, a 4.5 per cent rise. This is the lowest year-on-year increase since the fi rst Demographics Report was produced in 2006, with the excepti on of the1.4 per cent decrease in 2010.
Common rotati onal patt erns are either equal ti me or two weeks on, three weeks off . Due to current industry cost and effi ciency challenges, a number of companies have now moved to an equal ti me rota, while other companies conti nue to consider such a move. It is anti cipated that core workforce numbers may decline in 2015.
Figure 10: Number of Core Personnel Travelling Off shore
The number of core workers conti nued its upward trajectory in 2014 despite rising development and operati ng costs and conti nued to account for 45 per cent of the total off shore workforce.

UKCS OFFSHORE WORKFORCE DEMOGRAPHICS REPORT 2015
page 16
Figure 11: Total Versus Core Personnel Off shore
0
10,000
20,000
30,000
40,000
50,000
60,000
70,000
2006 2007 2008 2009 2010 2011 2012 2013 2014
Num
ber o
f Per
sonn
el
Total Offshore Personnel Core Offshore Personnel
Source: Vantage POB
The number of off shore locati ons visited by the core workforce almost mirrors those visited by the total off shore workforce. Forty-nine per cent (31,513) of the total off shore workforce visited one locati on, compared with51 per cent (14,701) of the core personnel. Twenty per cent of the total and core workforce visited two locati ons in 2014. This is a similar breakdown as in previous years, with 50 per cent of core personnel travelling to a single locati on in both 2013 and 2012.
Figure 12: The Number of Off shore Locati ons Visited by the Core Workforce in 2014

page 17
1
2
3
4
5
6
7
8
Figure 13 shows that 70 per cent (20,268) of core personnel worked for a single operator last year.
Figure 13: The Number of Operators Worked for by the Core Workforce in 2014

UKCS OFFSHORE WORKFORCE DEMOGRAPHICS REPORT 2015
page 18
5.1. Comparative Trends of the Core Workforce
As with the total workforce, a correlation was observed until 2012 between the average oil price per bbl and the number of core personnel, with a one-year time lag. Figure 14 illustrates the disconnection between the two since 2012, showing the continued increase in core workforce and the reduction in average oil price.
Figure 14: The Number of Core Personnel Travelling Offshore Versus the Oil Price
0
20
40
60
80
100
120
0
5,000
10,000
15,000
20,000
25,000
30,000
2006 2007 2008 2009 2010 2011 2012 2013 2014
Date
d Br
ent A
vera
ge O
il Pr
ice
($/b
bl)
Num
ber o
f Cor
e Pe
rson
nel
Core Personnel
Oil Price/$
Source: Vantage POB, Argus Media

page 19
1
2
3
4
5
6
7
8
2014 saw the smallest year-on-year reducti on since UK producti on peaked in 2000. This is in stark contrast to the eight per cent fall seen in 2013. Improved output from existi ng faciliti es and investment in new producti on were the key drivers3.
Figure 15: The Relati onship between the Number of Core Workers and Producti on
Likewise, the following graphs show that core workforce numbers steadily increased despite a reducti on in drilling acti vity and alongside an increase in operati ng costs and capital expenditure.
Figure 16: The Relati onship between the Number of Core Workers and Drilling Acti vity
3 Oil & Gas UK’s Acti vity Survey 2015 is available to download at www.oilandgasuk.co.uk/acti vitysurvey

UKCS OFFSHORE WORKFORCE DEMOGRAPHICS REPORT 2015
page 20
Figure 17: The Relati onship between the Number of Core Workers and Overall Expenditure
0
5
10
15
20
25
30
0
5,000
10,000
15,000
20,000
25,000
30,000
2006 2007 2008 2009 2010 2011 2012 2013 2014
£ Bi
llion
-20
14 M
oney
Num
ber o
f Per
sonn
el
Exploration & Appraisal Costs
Development Costs
Operating Costs
Core Workers
Source: Vantage POB, Oil & Gas UK
Figure 18: The Relati onship between the Number of Core Workers and Operati ng and Capital Expenditure Costs
0
2
4
6
8
10
12
14
16
0
5,000
10,000
15,000
20,000
25,000
30,000
2006 2007 2008 2009 2010 2011 2012 2013 2014
£ Bi
llion
-20
14 M
oney
Num
ber o
f Per
sonn
el
Operating Costs Capital Expenditure Core Workers
Source: Vantage POB, Oil & Gas UK

page 21
1
2
3
4
5
6
7
8
Figure 19 illustrates the signifi cant decline in the barrels of oil equivalent (boe) produced per worker over a nine-year period. In 2006, 151,121 boe were produced per core worker, in stark comparison to 2014 when 49,327 boe were produced. This represents a 67.4 per cent reducti on. However, it is important to understand that this refl ects a trend associated with the maturity of the basin; many fi elds are past peak producti on and new fi elds are smaller with more diffi cult to access resources. There has also been a decline in producti on effi ciency, which is parti cularly apparent between 2010 and 2013.
Figure 19: Total Off shore Workforce and Core Workforce against Producti on
0
20,000
40,000
60,000
80,000
100,000
120,000
140,000
160,000
2006 2007 2008 2009 2010 2011 2012 2013 2014
Prod
uctio
n (b
oe)
Barrels per Worker
Barrels per CoreWorker
Source: Vantage POB, DECC

UKCS OFFSHORE WORKFORCE DEMOGRAPHICS REPORT 2015
page 22
6. ResidentialLocationsandNationalitiesoftheWorkforce
6.1 Residential Locations
Figure 20 maps the UK home addresses of personnel working on the UKCS, together with the density. Over a quarter of those who reside in the UK, 15,146 workers, live in Aberdeen city and shire. 13.8 per cent (7,711) live in the north east of England and 4.5 per cent (2,543) are based in and around Norwich.
These percentages are slightly less than in 2013, when 28 per cent of UK-based personnel lived in Aberdeen city and shire and 16 per cent were based in the Tyneside and Teesside areas. This reveals that more workers from outwith key hubs are joining the sector.
Figure 20: A Map Illustrating the UK Home Addresses of Workers on the UK Continental Shelf

page 23
1
2
3
4
5
6
7
8
6.2 Workforce Nati onaliti es
Of the off shore workforce, 53,881 workers were of Briti sh nati onality in 2014, an increase of 5.3 per cent from 2013 when there were 51,177 Briti sh personnel. This represents 84 per cent of the total off shore workforce last year, an increase of 1.3 per cent from the previous year.
Figure 21: The Number of Off shore Workers of Briti sh Nati onality
Although the vast majority of off shore personnel are of Briti sh nati onality, Figure 22 overleaf highlights the diversity of the remaining 10,232 workers. Nati onaliti es such as Albanian, Bhutanese, Israeli, Panamanian and Zambian have re-entered the UKCS in 2014, with others, such as El Salvadorian, Jordanian, Peruvian and Uzbekistani, leaving the sector. The largest decrease was in the Norwegian workforce, falling by 330 workers, from 1,729 in 2013 to 1,399 in 2014. The non-Briti sh workforce accounted for 17.3 per cent of total off shore personnel in 2013, which fell to 16 per cent last year.

UKCS OFFSHORE WORKFORCE DEMOGRAPHICS REPORT 2015
page 24
Figure 22: A Map Showing the Nationalities Working Offshore on the UK Continental Shelf. The Countries Shown in Green are Represented by Employees.
The top 10 non-British nationalities working on the UKCS are shown in Figure 23 below. The percentage of Norwegian workers has declined from 16.1 per cent in 2013 to 13.7 per cent last year, whilst the proportions of Dutch, Polish, American, Irish, French and Romanian workers have all increased. Canadians have fallen out of the top ten while Italians have entered the list.
Figure 23: The Top Ten Non-British Nationalities Working on the UK Continental Shelf
Nationality Proportion No.ofPersonnel1.Norwegian 13.7% 1,3992.Dutch 10.4% 1,0603.Polish 6.3% 6484.Irish 4.9% 5025.American(USA) 4.7% 4816.French 2.9% 2987.Italian 2.7% 2808.Romanian 2.5% 2519.Lithuanian 2.2% 22310.Danish 1.9% 199Other 47.8% 4,891Total Number of Non-British Employees
10,232
Source: Vantage POB

page 25
1
2
3
4
5
6
7
8
7. FemaleWorkforce
An additi onal 66 women travelled off shore in 2014, 43 of which were part of the core workforce. This brought the number of female off shore workers to 2,303 representi ng 3.6 per cent of the total off shore workforce, as in 2013. Women have conti nued to make up 2.9 per cent of the core workforce since 2012.
Despite the focus on encouraging gender diversity within the oil and gas sector, female representati on within the off shore sector is sti ll disproporti onately low. It is interesti ng to note that this issue is not unique to the UK, with the Dutch and Danish sectors reporti ng female percentages of 3.7 per cent and 5.2 per cent, respecti vely4. Whilst these levels are higher than in the UK, they remain disappointi ngly low.
A comparison can be made with the Norwegian sector, where 3.5 per cent of the off shore workforce was female in 1985, the same level as the UK sector in 20065. In 2010, the percentage in Norway had risen to nine per cent, whilst the UK percentage had barely increased and sat at 3.7 per cent. However, though the Norwegian percentage hit nine per cent in 2000 it remained stati c for the next decade.
Although the Norwegian sector has a higher percentage of female personnel off shore, it is worth noti ng the disciplines in which the women work. Fift y-four per cent of them worked in catering in 2010 compared with29.7 per cent in the UK sector in the same year. As can be seen in Figure 24, catering conti nues to be a key discipline for women in the UK off shore workforce, with those carrying out maintenance acti viti es accounti ng for the second highest area of employment.
Figure 24: Breakdown of Female Personnel by Key Discipline
57%
4%
10%
29%Other
Administration
Maintenance
Catering
Source: Vantage POB
4 Data were provided through the Vantage POB tracking system.5 See htt p://bit.ly/1g3LROq
UKCS OFFSHORE WORKFORCE DEMOGRAPHICS REPORT 2015
page 26
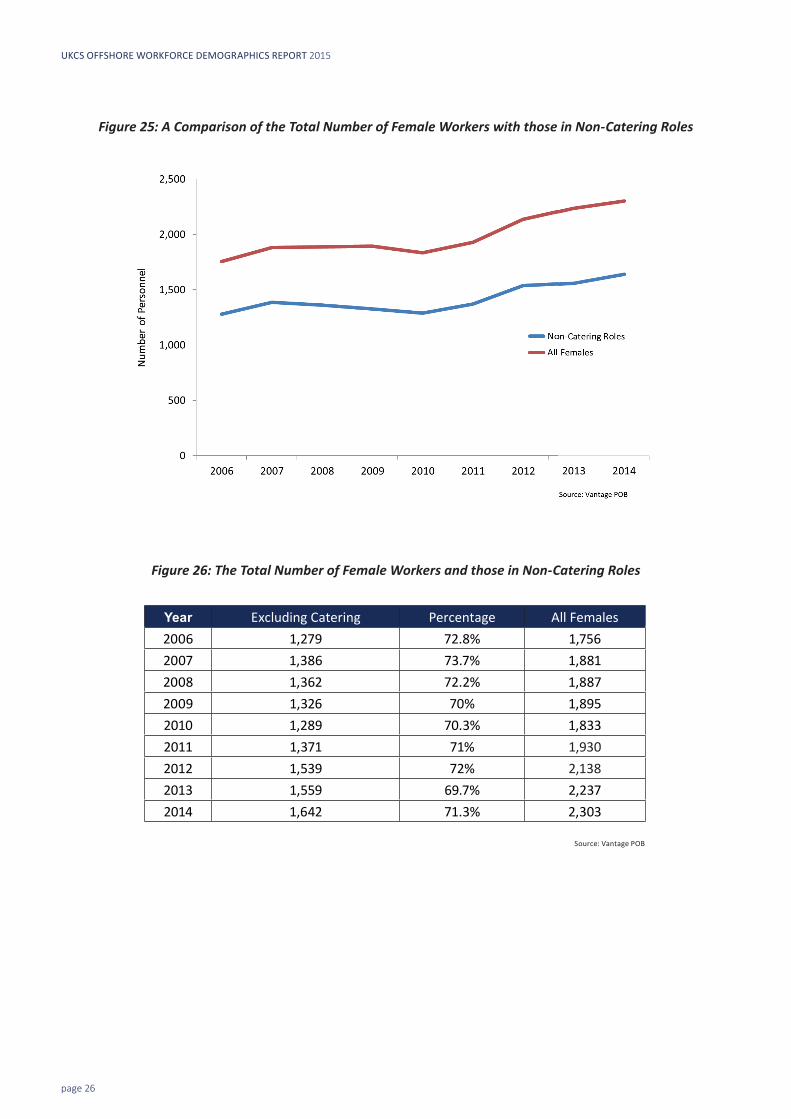
Figure 25: A Comparison of the Total Number of Female Workers with those in Non-Catering Roles
Figure 26: The Total Number of Female Workers and those in Non-Catering Roles
Source: Vantage POB
Year Excluding Catering Percentage All Females2006 1,279 72.8% 1,7562007 1,386 73.7% 1,8812008 1,362 72.2% 1,8872009 1,326 70% 1,8952010 1,289 70.3% 1,8332011 1,371 71% 1,9302012 1,539 72% 2,1382013 1,559 69.7% 2,2372014 1,642 71.3% 2,303

page 27
1
2
3
4
5
6
7
8
As in 2013, the highest concentrati on of females working off shore in 2014 remained in the 24 to 29 age category, followed by the 30 to 34 bracket. Last year saw a 1.4 per cent increase in the 30 to 34 category and a one per cent increase in the 35 to 39 bracket. This shows a more stable picture than in the previous year, when there was a fi ve per cent increase and 4.8 per cent decrease, respecti vely.
Figure 27: Female Off shore Populati on Versus Male Populati on, in 2014

UKCS OFFSHORE WORKFORCE DEMOGRAPHICS REPORT 2015
page 28
8. WorkforceAgeAnalysis
The average age of the off shore worker remained stati c in 2014 at 40.8 years, refuti ng the myth of an ageing workforce. Once again, the majority of personnel fall within the younger age categories with a steady decline as the workforce gets older.
Figure 28: The Age Profi le of the Off shore Workforce from 2010 to 2014
0
500
1,000
1,500
2,000
2,500
18 23 28 33 38 43 48 53 58 63 68 73
Num
ber o
f Per
sonn
el
2014 Figures
2013 Figures
2012 Figures
2011 Figures
2010 Figures
Source: Vantage POB

page 29
1
2
3
4
5
6
7
8
When the age profi le of the core workforce is compared with that of non-core personnel, it becomes evident that the average age of the core crew is slightly older at 42.2 compared to 39.6 for the non-core worker. There is a more gradual decline in the numbers as the non-core workforce gets older. This is the fi rst Demographics Report to include a breakdown of the non-core and core age profi le.
Figure 29: The Age Profi le of the Core Workforce Versus the Non-Core Workforce in 2014
0
200
400
600
800
1,000
1,200
1,400
18 23 28 33 38 43 48 53 58 63 68 73 78
Num
ber o
f Per
sonn
el
Non-Core Offshore Personnel
Core Offshore Personnel
Source: Vantage POB
UKCS OFFSHORE WORKFORCE DEMOGRAPHICS REPORT 2015
page 30
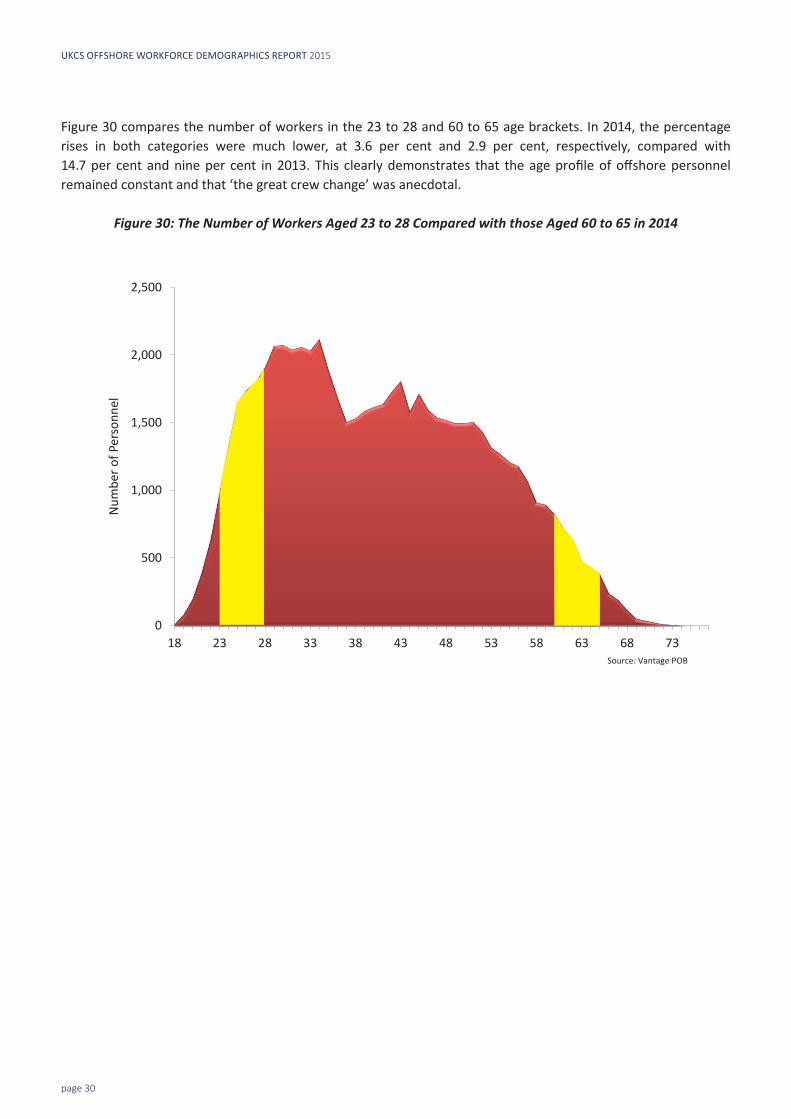
Figure 30 compares the number of workers in the 23 to 28 and 60 to 65 age brackets. In 2014, the percentage rises in both categories were much lower, at 3.6 per cent and 2.9 per cent, respecti vely, compared with 14.7 per cent and nine per cent in 2013. This clearly demonstrates that the age profi le of off shore personnel remained constant and that ‘the great crew change’ was anecdotal.
Figure 30: The Number of Workers Aged 23 to 28 Compared with those Aged 60 to 65 in 2014
0
500
1,000
1,500
2,000
2,500
18 23 28 33 38 43 48 53 58 63 68 73
Num
ber o
f Per
sonn
el
Source: Vantage POB

page 31
1
2
3
4
5
6
7
8
Figure 31 compares the change in each age range between 2006 and 2013 and 2006 and 2014. There is a greater diff erence in most brackets from 2006 to 2014, with the excepti on of the under 18 and 18 to 23 categories where there were decreases by eight and 228 workers, respecti vely. The greatest increase is evident between the ages of 30 and 34 with a diff erence of 761 workers, followed by the 24 to 29 category with a diff erence of 636. There was a decline in the older brackets from 2012 to 2013 but this has since reversed.
Figure 31: The Change in the Number of Workers in Each Age Range for the Total Off shore Workforce between 2006 and 2014 and between 2006 and 2013
0
500
1,000
1,500
2,000
2,500
3,000
3,500
4,000
Under18
18 - 23 24 - 29 30 - 34 35 - 39 40 - 44 45 - 49 50 - 54 55 - 59 60 - 64 65+
Num
ber o
f Per
sonn
el
2006-2013 2006-2014
Source: Vantage POB

UKCS OFFSHORE WORKFORCE DEMOGRAPHICS REPORT 2015
page 32
When looking at the core workforce separately, it is evident that the greatest change, as in 2013, was in the 30 to 34 age category with a 2,194 increase in workers. The same patt ern as previous years emerges when looking at the core workforce in its enti rety with virtually no change in the under 18 category, signifi cant increases in both the 24 to 29 and 30 to 34 brackets, followed by a sharp reducti on in the scale of the increase in the remaining age ranges.
Figure 32: The Change in the Number of Core Workers in Each Age Range between 2006 and 2014
page 33
1
2
3
4
5
6
7
8
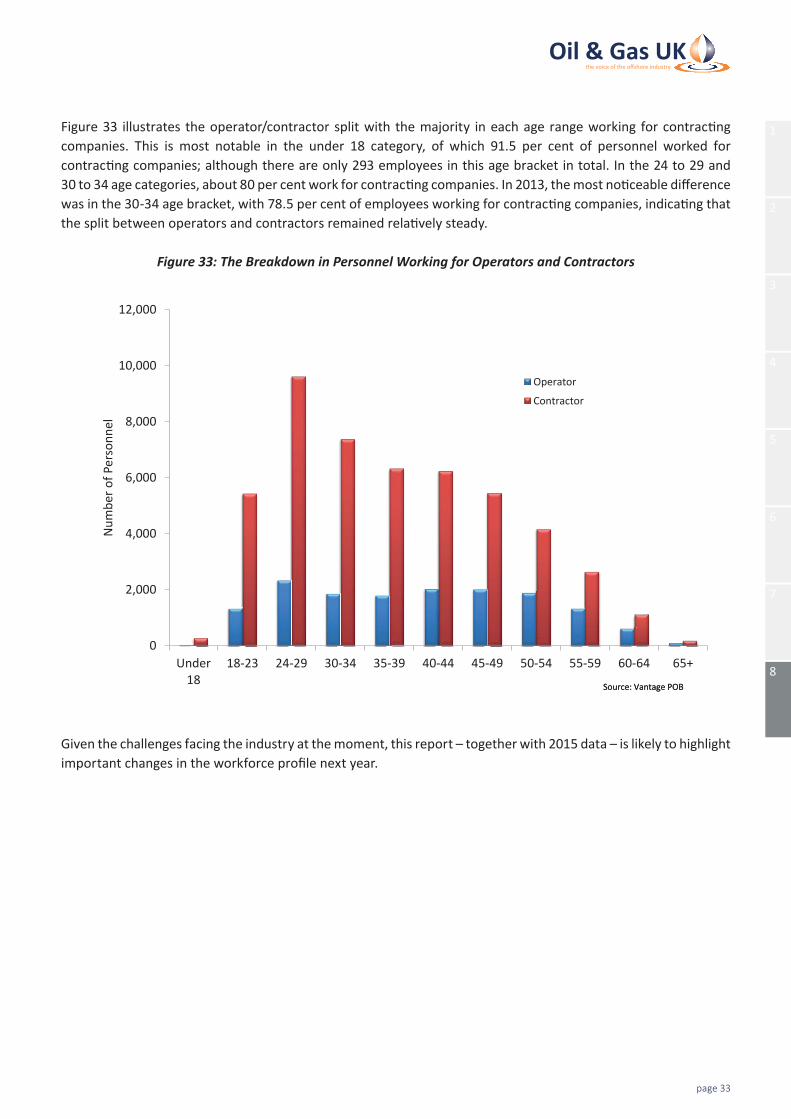
Figure 33 illustrates the operator/contractor split with the majority in each age range working for contracti ng companies. This is most notable in the under 18 category, of which 91.5 per cent of personnel worked for contracti ng companies; although there are only 293 employees in this age bracket in total. In the 24 to 29 and 30 to 34 age categories, about 80 per cent work for contracti ng companies. In 2013, the most noti ceable diff erence was in the 30-34 age bracket, with 78.5 per cent of employees working for contracti ng companies, indicati ng that the split between operators and contractors remained relati vely steady.
Figure 33: The Breakdown in Personnel Working for Operators and Contractors
0
2,000
4,000
6,000
8,000
10,000
12,000
Under18
18-23 24-29 30-34 35-39 40-44 45-49 50-54 55-59 60-64 65+
Num
ber o
f Per
sonn
el
Operator
Contractor
Source: Vantage POBSource: Vantage POB
Given the challenges facing the industry at the moment, this report – together with 2015 data – is likely to highlight important changes in the workforce profi le next year.

UKCS OFFSHORE WORKFORCE DEMOGRAPHICS REPORT 2015
page 34

page 35
Oil&GasUK(Aberdeen)3rd FloorThe Exchange 262 Market StreetAberdeen AB11 5PJ
Tel: 01224 577 250
Oil&GasUK(London)6th Floor EastPortland House Bressenden PlaceLondon SW1E 5BH
Tel: 020 7802 2400 [email protected]
www.oilandgasuk.co.uk
UKCS OFFSHO
RE WO
RKFORCE DEM
OGRAPHICS REPO
RT 2015O
IL & GAS UK
www.oilandgasuk.co.uk
Oil&GasUK(Aberdeen)3rd FloorThe Exchange 262 Market StreetAberdeen AB11 5PJ
Tel: 01224 577 250
Oil&GasUK(London)6th Floor EastPortland House Bressenden PlaceLondon SW1E 5BH
Tel: 020 7802 2400 [email protected]
ISBN 1 903 004 52 7© 2015 The UK Oil and Gas Industry Association Limited, trading as Oil & Gas UK
UKCS OFFSHO
RE WO
RKFORCE DEM
OGRAPHICS REPO
RT 2015O
IL & GAS UK