uk feed studies 2011 – a summary · transmission by pipeline. the first section of the pipeline...
TRANSCRIPT

UK FEED Studies 2011 – A Summary Report: 2013/12 October 2013

INTERNATIONAL ENERGY AGENCY
The International Energy Agency (IEA) was established in 1974 within the framework of the Organisation for Economic Co-operation and Development (OECD) to implement an international energy programme. The IEA fosters co-operation amongst its 28 member countries and the European Commission, and with the other countries, in order to increase energy security by improved efficiency of energy use, development of alternative energy sources and research, development and demonstration on matters of energy supply and use. This is achieved through a series of collaborative activities, organised under more than 40 Implementing Agreements. These agreements cover more than 200 individual items of research, development and demonstration. IEAGHG is one of these Implementing Agreements.
DISCLAIMER
This report was prepared as an account of the work sponsored by IEAGHG. The views and opinions of the authors expressed herein do not necessarily reflect those of the IEAGHG, its members, the International Energy Agency, the organisations listed below, nor any employee or persons acting on behalf of any of them. In addition, none of these make any warranty, express or implied, assumes any liability or responsibility for the accuracy, completeness or usefulness of any information, apparatus, product of process disclosed or represents that its use would not infringe privately owned rights, including any parties intellectual property rights. Reference herein to any commercial product, process, service or trade name, trade mark or manufacturer does not necessarily constitute or imply any endorsement, recommendation or any favouring of such products. If any readers should want to perform calculations or further work based on the information provided in this FEED Studies Review, it is recommended that the original FEED documents are consulted (available on the Department of Energy and Climate Change website). Care should be taken when using and referencing figures, tables and references, as numbering of these in each sub-chapter is consistent within the sub-chapter but independent from the other sub-chapters.
COPYRIGHT
Copyright © IEA Environmental Projects Ltd. (IEAGHG) 2013. All rights reserved.

ACKNOWLEDGEMENTS AND CITATIONS This report describes a review carried out by IEAGHG. This report was compiled by: Samantha Neades and Laura Davis, IEAGHG The principal researchers and authors were:
Prachi Singh, IEAGHG (Longannet sub-chapters) Jasmin Kemper, IEAGHG (Kingsnorth sub-chapters) Ludmilla Basava-Reddi, IEAGHG (Wells and Storage chapters) Samantha Neades, IEAGHG (Consents & Environment and Health & Safety chapters) Michael Haines, COFree Technology Ltd/IEAGHG (Overview)
To ensure the quality and technical integrity of the research undertaken by IEAGHG each study is managed by an appointed IEAGHG manager. The IEAGHG managers for this report were: Stanley Santos and Tim Dixon, IEAGHG The report should be cited in literature as follows: ‘IEAGHG, “UK FEED Studies 2011 – A Summary”, 2013/ 12, October 2013.’ Care should be taken when using and referencing figures, tables and references, as numbering of these in each sub-chapter is consistent within the sub-chapter but independent from the other sub-chapters. Further information or copies of the report can be obtained by contacting IEAGHG at: IEAGHG, Orchard Business Centre, Stoke Orchard, Cheltenham, GLOS., GL52 7RZ, UK Tel: +44(0) 1242 680753 Fax: +44 (0)1242 680758 E-mail: [email protected] Internet: www.ieaghg.org

1
FRONT END ENGINEERING DESIGN STUDIES FOR DEMONSTRATION SCALE
CCS SYSTEMS SERVING LONGANNET AND KINGSNORTH POWER STATIONS
IN THE UNITED KINGDOM
BACKGROUND
The UK DECC funded FEED studies for two potential CCS projects in the UK as part of a first competition for funding of a full scale demonstration. A key aim of the FEED was thus to assist in selection of a winning project but the participants were also required to narrow the range of projected costs and clearly identify the cost risks and establish upper and lower limits. DECC also had the intention of making results public to enhance learning and information exchange. Initially 9 consortia entered projects into the competition but only two proceeded into the FEED phase. One of these withdrew before the full FEED was developed so some elements of this FEED are less well developed. The FEED’s were funded with public money and hence the documentation has been made publically available where it does not include confidential material. It is if considerable worldwide interest to those engaged in the emerging CCS industry. The documents in the public domain can be viewed at: http://webarchive.nationalarchives.gov.uk/20111209170139/https://www.decc.gov.uk/en/content/cms/emissions/ccs/demo_prog/feed/feed.aspx. The front end engineering design of a project aims to define all elements required to execute the project so that detailed engineering, procurement and construction can proceed without significant changes, delays or cost overruns. The scope of the FEED documentation usually includes basic specification of the required processes, layout, routing and site locations. It would also usually identify standards to be applied, permits and permissions required along with safety and environmental risks and measures to control these to acceptable levels. It would also set out a preferred contracting and procurement strategy, a project schedule and develop costs estimates of sufficient accuracy based on these to allow firm investment commitments to be made. If long lead equipment lies on the critical path of the schedule, requisitions for this may also prepared so that procurement can start as soon as the investment decision is made. While some choices may be left to be made during detailed design these should not be of a type which would significantly affect the project within established levels of time, resource and cost contingency. Thus the exact scope and contents of a FEED will vary with the type of project and its context.
APPROACH
IEAGHG executive committee agreed that it would be useful if the salient information from the published FEED documents was reviewed and summarised in a publication. A total of 329 documents have been made publically available containing a wealth of detailed information which is time consuming to extract. The task of reviewing and summarising this information was shared amongst four members of IEAGHG technical staff each concentrating on different areas according to their expertise. They reviewed all the FEED documentation in detail and have extracted and prepared summaries of the salient information in 10 separate chapters. A condensed tabular format was chosen to aid comparison between the

2
two projects. Important references to the many separate documents which make up the full FEED studies are also included. A selection of the key figures and diagrams as well as heat/mass balance tables is also presented. This overview summarises the IEAGHG synthesis report described above.
INTRODUCTION
The two developments for which FEED’s were prepared are for CCS projects at Kingsnorth with CO2 stored in the depleted Hewitt field in the Southern North Sea and at Longannet in Scotland with CO2 to be stored in the depleted Goldeneye field in the Northern North Sea. A key difference between these projects is that Kingsnorth would be a new build power station, albeit on the site of the existing station which would be retired from service. Longannet would be an addition to an existing coal fired power station. Furthermore the CO2 from Kingsnorth would be injected via a new platform and wells whilst that from Longannet would utilise the existing Goldeneye platform and wells. The designers thus faced some significantly different issues in preparing their FEED studies.
MAIN FINDINGS AND RESULTS
General descriptions of the proposed CCS systems
A brief description of each project is given below. This is followed by more detailed descriptions of the main elements of each CCS system. Figures 1 and 2 near the end give a general impression of the key features of each project. Kingsnorth/Hewett
The existing Kingsnorth facility is situated on the north bank of the Medway estuary in Kent. It consists of four 500MW coal fired subcritical steam power plants and is expected to be retired by 2015. A new coal fired supercritical steam power plant consisting of 2 units (nos.5 and 6) each of 840MWe gross output is proposed to be built on the same site. Just under 50% of the flue gases from one of these new units (no. 5) would be fitted with a demonstration post combustion carbon dioxide capture unit. Parts of some of the existing infrastructure and utility systems (such as the CW system) would be reused. The design includes a later expansion of the capture plant which would recover CO2 from all of the power station flue gases. The initial amount would be just over 2.1 million t/y rising to just over 8.6 million t/y in phase 2. However the FEED considers only the first phase of the project in detail. The CO2 would be dried and compressed to sufficient pressure for direct delivery by pipeline to the storage site. It is proposed to pipe the CO2 overland via a 36” line to a landfall point 10km away on the south bank of the Thames estuary just west of All Hallows-on-sea. The offshore section is 260km to a location, as yet to be defined, above the Hewett gas field. The CO2 would be injected into the Upper and Lower Bunter sandstones of the depleted Hewett gas field from a new wellhead platform. The final location was not fully determined in the FEED study. Initially there will be 4 injection wells with 3 in use and one spare.
3
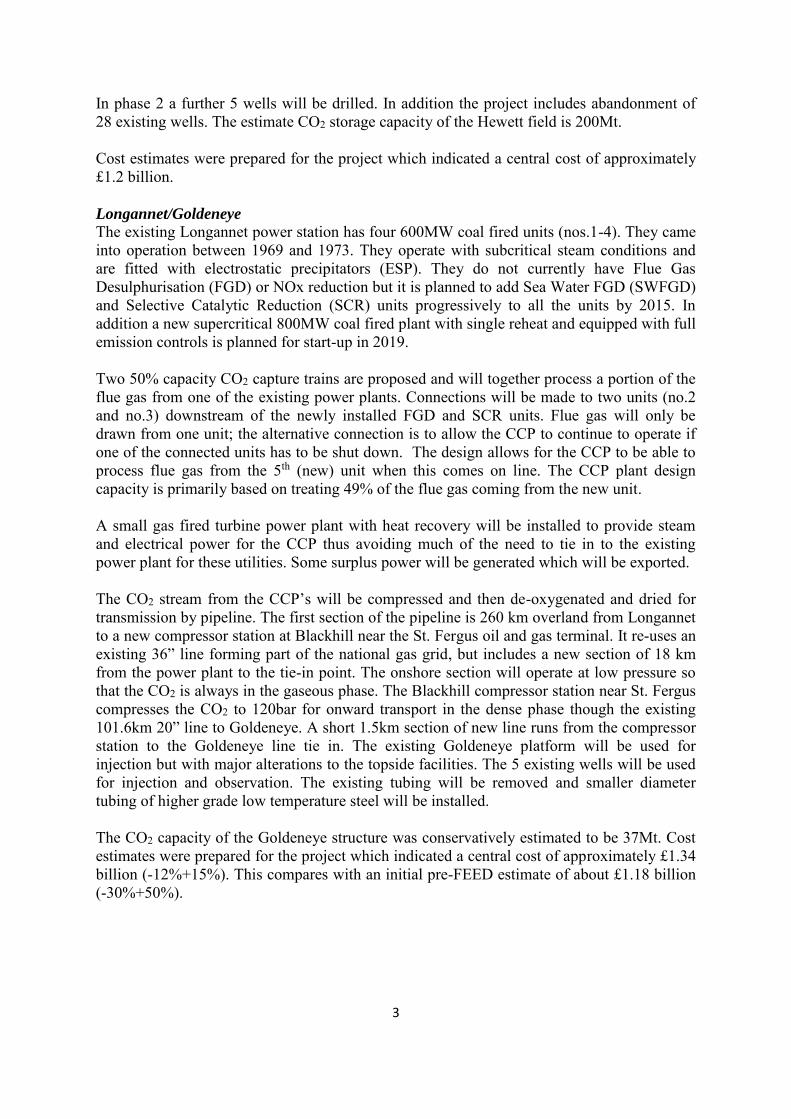
In phase 2 a further 5 wells will be drilled. In addition the project includes abandonment of 28 existing wells. The estimate CO2 storage capacity of the Hewett field is 200Mt. Cost estimates were prepared for the project which indicated a central cost of approximately £1.2 billion. Longannet/Goldeneye
The existing Longannet power station has four 600MW coal fired units (nos.1-4). They came into operation between 1969 and 1973. They operate with subcritical steam conditions and are fitted with electrostatic precipitators (ESP). They do not currently have Flue Gas Desulphurisation (FGD) or NOx reduction but it is planned to add Sea Water FGD (SWFGD) and Selective Catalytic Reduction (SCR) units progressively to all the units by 2015. In addition a new supercritical 800MW coal fired plant with single reheat and equipped with full emission controls is planned for start-up in 2019. Two 50% capacity CO2 capture trains are proposed and will together process a portion of the flue gas from one of the existing power plants. Connections will be made to two units (no.2 and no.3) downstream of the newly installed FGD and SCR units. Flue gas will only be drawn from one unit; the alternative connection is to allow the CCP to continue to operate if one of the connected units has to be shut down. The design allows for the CCP to be able to process flue gas from the 5th (new) unit when this comes on line. The CCP plant design capacity is primarily based on treating 49% of the flue gas coming from the new unit. A small gas fired turbine power plant with heat recovery will be installed to provide steam and electrical power for the CCP thus avoiding much of the need to tie in to the existing power plant for these utilities. Some surplus power will be generated which will be exported. The CO2 stream from the CCP’s will be compressed and then de-oxygenated and dried for transmission by pipeline. The first section of the pipeline is 260 km overland from Longannet to a new compressor station at Blackhill near the St. Fergus oil and gas terminal. It re-uses an existing 36” line forming part of the national gas grid, but includes a new section of 18 km from the power plant to the tie-in point. The onshore section will operate at low pressure so that the CO2 is always in the gaseous phase. The Blackhill compressor station near St. Fergus compresses the CO2 to 120bar for onward transport in the dense phase though the existing 101.6km 20” line to Goldeneye. A short 1.5km section of new line runs from the compressor station to the Goldeneye line tie in. The existing Goldeneye platform will be used for injection but with major alterations to the topside facilities. The 5 existing wells will be used for injection and observation. The existing tubing will be removed and smaller diameter tubing of higher grade low temperature steel will be installed. The CO2 capacity of the Goldeneye structure was conservatively estimated to be 37Mt. Cost estimates were prepared for the project which indicated a central cost of approximately £1.34 billion (-12%+15%). This compares with an initial pre-FEED estimate of about £1.18 billion (-30%+50%).

4
Power stations
New Kingsnorth Power station
EON’s proposed new 2 trains 1680 MWe gross coal fired supercritical steam power plant with single reheat will be constructed someway north of the old units (1-4). Steam conditions would be HP 600°C, 286.5 bar(a), IP 619°C, 56 bar(a), LP 231°C, 233 bar(a). Thermal efficiency (based on LHV) without CCS would be 45%. The units would be designed for full integration with CCS utilising LP steam extracted from the IP/LP crossover as the main heat source for solvent regeneration. The efficiency when 50% of the flue gas is treated in the capture unit is estimated to be 40%. The units will be equipped with ESP, SCR and FGD and the flue gas to be treated in the capture plant is ducted from a point downstream of the FGD. Treated flue gas is returned to the main flue gas stream downstream of the extraction point after which the full stream is reheated in a gas/gas exchanger before entering the main stack at around 90°C. The CO2 transport system is designed for future capture from the flue-gases of both units. The FEED recognises that the IP/LP crossover pressure and steam turbines can be designed for optimal extraction of steam for the CCS process. It specifies provision of attemperated steam by-passes around the LP turbine to the steam condensers for control when extraction conditions deviate from normal. The design also includes steam throttling valves downstream of the extraction point to ensure that the extraction pressure does not drop too low as steam flow changes. At this stage however the choice of optimum design point for the steam system i.e. with no steam extraction, with demonstration rate extraction or full capture rate extraction was not chosen. The CCS plant requires a range of other auxiliaries which are integrated to various degrees in the design. The FEED study has made choices on how these will be provided which are to some extent driven by the specifics of the existing brown-field site. Some elements of the existing infrastructure and utility systems such as a significant part of the existing Cooling Water system would be reused. The only caveat is that were the CCS plant to be expanded to process 100% of the flue gases it might be difficult to meet the maximum discharge temperature requirements back into the Medway. The CCS plant auxiliaries will be served by a single separate 11kV transformer and distribution system. Large drives both in the power plant and CCS plant such as the CO2 compressors and flue gas fan are to be Variable Speed Drives (VSD’s) as Direct On Line (DOL) starting would complicate compliance with the Grid connection requirements. Because of the lower reliability of VSD’s 2x or 3x 50% units are to be installed depending on criticality of each machine’s service. New connections to the electrical grid were originally foreseen but if the existing plant is decommissioned before the new units come on stream some of the old connections can be used. A new reserve electrical connection from the grid for auxiliary power serving both the power plant and the CCS plant is specified. The inclusion of reserve connections for the CCS plant is included because the study considers that it will not be operationally desirable for the CCS plant to shut down due to a fault in its primary auxiliary power system. The FEED indicates that the basic supercritical steam power plant design cannot comply with UK Grid Code frequency control requirements. This is because there is less energy stored in the once through steam system than in a subcritical plant. It is suggested that the CCS plant

5
should be part of an electrical load shedding system aimed at assisting in Grid frequency control compliance for the plant. However this on its own would be insufficient and additional measures would be required. Solutions would need to be developed during detailed design and could include renegotiation of the requirements. Condensate stop whereby steam extraction for condensate preheating is temporarily stopped is one feature included in the design. The status of CCS plants in load shedding may thus be a significant issue for new build projects. The dynamics of CCS LP steam extraction stop may be worth investigation. Longannet power station
The FEED study only covers the tie in to the existing power plant and brief mention of the tie in to a proposed new 800MW. This is notionally specified with steam conditions of 600°C 275 bar(g) with single reheat to 610°C giving an efficiency of 45% (LHV). The flue gas composition from the new unit will be slightly different (higher CO2 content) and this is taken into account in the capacity rating of the CCP. The new CCS plant will be built as a standalone facility with minimal use of existing systems although some basic utilities can be provided by extension of those at the existing power station. In particular the cooling water system of the existing power plant has capacity and would be extended to service the capture plant including the new dedicated gas fired combined cycle plants which provide the electrical power and heat. Demineralised water will also come from the main plant but a new holding tank is required to allow peak demands to be met. The gas supply to the new auxiliary heat and power plant is taken from the existing supply to Longannet power station. Flue-gas tie-ins are provided in the ducts of Units 2 and 3 downstream of the newly installed FGD units. There would be isolation dampers so that either one or the other of these units but not both would feed the Carbon Capture Plant (CCP) through a common transfer duct. The design calls for a minimum of 10% of the abstracted flue gas to go to the chosen unit’s stack directly in order to prevent backflow. This equates to a minimum load of 363MW when the CCP is at full capacity. In the event that units are shut down the operational precedence would ensure that the one supplying the CCP was the last off. Processed flue gas from the two CCP trains is exhausted through a common dedicated stack with multiple flues and thus does not rejoin the flue gas system of the existing power plant. Key features of the design of the new auxiliary power plant will be described in this section. The plant will have two trains comprising gas turbines of 47MW each generating power at 11kV and 50 Hz. Hot turbine exhausts are fed to Heat Recovery Steam Generators (HRSGs) at 544ºC to raise HP steam at a single pressure of 26 bar(g) and 325ºC. The system is provided with supplementary duct burners. Connections via dampers to a single shared stack are provided between the turbines and the HRSGs. The HP steam passes through a single back pressure turbine and at full load exhausts at 4.2 bar(g) and 165ºC but this temperature will be higher at part load. This pressure allows for throttling control valves to supply to the CCP regenerator reboilers at 3.8 bar(g) saturated (at 160ºC). A desuperheater is provided. A small slip stream of HP steam is let down to provide MP steam at 9.5 bar(g) for the boiler feed water (BFW) deaerator. The steam turbine has a full power output of 30.6MW. A feature of the design is provision of HP steam desuperheating bypasses around the steam turbine one for each HRSG with a 100% capacity spare. These can be used for supplying LP steam whilst the steam turbine is being started up or maintained.

6
The new power plant produces an excess of power over that required for the CCP. This power would be exported via a new 275kV connection to the Grid. Full connection to the existing 11kV grid was rejected because of the engineering complications and concerns about electrical instability which might be introduced. CCP plant Kingsnorth
The capture plant would make use of Mitsubishi Heavy Industries’ (MHI’s) proprietary hindered amine process. This was chosen amongst other reasons because of its low energy consumption. The single train plant would process approximately half (47.3%) of the flue gas from the proposed new Unit 5 of the new power plant and the auxiliary power and heat used by the CCP would reduce the power output by approximately 100MWe. The plant specification calls for a flexible design capable of operating from 25%-100% capacity with frequent load changes and high ramp up capability of 4%-6% of the maximum continuous rating per minute in the mid-range. The chosen solvent (KS-1™) offers a high rich loading 1.5 times higher than MEA, and claims degradation rates of 10% those for MEA. Furthermore the process employs a proprietary absorber heat optimization which enhances energy consumption by an estimated additional 10%. Before entering the main absorber column the flue gas is further cleaned and cooled in a quench column. This has three sections. The first contacts the flue gas with a pH controlled solution of caustic soda for deep removal of SO2 required for prevention of degradation of the solvent. It then passes upwards through a wet Electrostatic Precipitator (ESP) and finally is cooled by direct contact with cold water. The low temperature is required to optimise the absorption of CO2 by the absorption solvent. The design of the quench system is proprietary to MHI. The column is a large rectangular tower 10M x 14M and 49M high. A blower is situated downstream of the quench column and draws the flue-gas into the absorber. This will be constructed as a rectangular column 10M x 17m and 72M high. After counter current contact with the circulating solvent the flue gas is water washed in two stages. Above this the column contains a “Deep amine recovery” section but no further details of this proprietary process are given in the FEED. The rich amine is partly heated by exchange with hot lean amine and is then regenerated in 2 x 50% capacity packed stripper columns 7M in diameter and 39M tall. A side draw and return is installed on each column and this exchanges with the hot lean amine as part of MHI’s proprietary energy saving arrangements. However details of the conditions are not disclosed. The stripper operates at a slight overpressure and delivers CO2 to the suction of the export compressors at 0.59Bar(g). A conventional amine reclaimer system is installed on a slip stream of the lean solvent and is designed for intermittent operation. CO2 compression and purification Kingsnorth
For the demonstration phase of the project CO2 will be transported in the gaseous phase. The transport pipeline will however be designed to accommodate capture of CO2 from both of the proposed new generation units or roughly 4 times the demonstration capacity. The required injection pressure is initially low and rises as the storage fills. It is planned to convert to higher pressure dense phase operation later should phase 2 be implemented. For the first phase, two trains of 50% capacity 4 stage integral gear compressors are recommended. Initial outlet pressure is 32 bar(g) rising to 40 bar(g) as the reservoir fills. The option to recover heat from the inter stage coolers was reviewed and rejected in favour of

7
seawater cooling. This results in slightly lower compressor power but a slight loss in overall power generation efficiency. However this loss is outweighed by the increased size and cost of the compression plant. The compressed CO2 is dried in a mole sieve unit to a water dryness of 24 ppm. TEG drying was considered as an alternative but rejected for several reasons including potential inability to maintain water content within specification, potential emission of TEG and potential contamination of the CO2 which could affect injectivity. Mole sieves on the other hand had the advantage of stable operation, rapid achievement of water specification and better reliability. No oxygen removal is specified on the basis that the maximum of 200 ppm expected will not cause corrosion problems in the system. However no details of the material selection for the injection wells are presented and this conclusion differs from that made during the Longannet FEED study where deep oxygen removal is required to protect the selected 13% Cr well tubing. The FEED investigated and compared several methods for deep oxygen and the analysis seemed to favour a catalytic reactor in the hot discharge of the final compression stage. A number of alternatives for supplying or generating the hydrogen for the oxygen destruction in this reactor were also investigated but no choices or recommendations were made. CCP plant Longannet
There are two identical 50% capacity carbon dioxide capture trains in the design. After the flue gas flow splits it is first treated in a direct contact quench cooler, one per train. These serve both to cool the stream but also to remove SO2, SO3, NO2, HF, HCl and particles such as fly ash and corrosion products. The contact fluid is water to which caustic soda is added to control the pH to close to 7. The contacting/quenching fluid is circulated using stainless steel pumps through an external Titanium plate exchanger cooled with seawater. The quench towers are of rectangular cross section 10m by 8m and are 19.4m high. They are constructed of concrete with an epoxy lining and have a stainless steel packing. The treated fluegas cooled to about 39°C then passes through an axial flow blower with variable pitch vanes which raise the pressure to about 73mb to overcome the pressure drop in the absorber towers. CO2 is absorbed in the absorber columns by counter current contact with a proprietary MEA solution. The designers, Aker Clean Carbon, do not reveal the specification/supplier of the proprietary amine solvent. The absorber is a rectangular concrete structure with internal lining (not specified) 60m in height but with cross sectional dimensions not revealed. The absorbers contain an absorption section above which is a conditioning section followed by a demister. Exact details of the water balance and conditions in the wash section are not revealed. The solvent is regenerated in a conventional arrangement but full details of the system are not revealed. P&ID diagrams for the absorber/regenerator system stream compositions are not shown in the Heat and Mass balance table although other process conditions are shown. The regenerator operates slightly above atmospheric pressure with a top pressure of 0.84bar(g) and a bottom temperature of 122.1°C. A reclaimer system is provided for batch-wise regeneration of amine from Heat Stable Salts (HSS). CO2 compression and purification at Longannet
The CO2 from both capture trains is combined for compression. It will be compressed from 0.5 bar(g) to 37 bar(g) and 30ºC and exported via the National Grid pipeline in the vapour phase. 2 x 50% capacity electrically driven integral gear compressors were specified with the exact number of stages to be determined during detailed design. All inter stage and final

8
coolers are to be constructed with 22% duplex stainless steel shells and titanium or titanium clad tubes. An oxygen removal unit consisting of a 22% duplex stainless steel pre-conditioning vessel containing a catalyst bed is placed in the hot outlet of the last stage of compression. The catalyst is palladium supported on alumina. A small excess of hydrogen is added to convert any oxygen in the CO2 to water. After oxygen removal the CO2 is cooled before entering a mole sieve drying package designed to reduce water content to <50 ppm. This specification was chosen to avoid hydrate formation and free water in the pipeline. Mole sieve regeneration is achieved by flowing a slip stream of CO2 through the off line bed using a small compressor and electrical heater. The hot regeneration gas exhausting from the regenerating bed is cooled to knock out water and returned to the inlet of the drying system. The CO2 is metered before passing into the transport pipeline. There is further compression at the pipeline landfall site which will be described in the sections on the pipeline transport. Pipeline transport Kingsnorth
The planned 260 km 36” pipeline is designed to cater for the initial demonstration phase and a later full capture phase at which point the flow would be quadrupled to 26,400 t/day with the injection pressure rising as the reservoir filled. Most of the line is offshore and there will be no booster compression. A key design requirement is to avoid two phase flow conditions. The maximum pressure which can be allowed in the initial transport gas phase is 39bar(g) and this is based on the minimum winter air temperature of -6°C adopted for flow assurance purposes. Minimum ground and seabed temperatures are all several degrees higher than this. For operation of the system in the dense phase a minimum pressure of 79 bar(g) is specified. Design pressure is set at 150 bar(g) and a minimum design temperature of -85°C onshore and -20°C offshore. These temperatures apply under conditions of depressurisation. An electrical heater is specified at the offshore platform to heat the arriving CO2 so that low temperatures do not occur when it is throttled for injection. Electrical power for this and other services is provided from onshore. Other key features are fiscal flow metering onshore at the power station, flow metering for leak detection only at the platform and ultrasonic metering in the CO2 venting system to allow any venting losses to be quantified. The line will be equipped with pig launcher receivers for the onshore section and the offshore section. To avoid mill scale entering the injection wells despite best endeavours to clean the line at start up, a set of filters will be installed offshore. Considerable attention was paid to the requirements for venting under all routine and emergency conditions in the FEED study. It was concluded that a key requirement for safety is an automatic block valve at the landfall to prevent the considerable inventory in the offshore line flowing back to exacerbate a leak or rupture in the onshore section. The effect of automatic blowdown in the event of an onshore full bore rupture was modelled and it was shown that this would have little effect on quantities released at the rupture and it is thus recommended that such a system is not installed. The preliminary wall thickness for the onshore section is 27mm with a 5mm bitumen coating. This includes a 1.5mm corrosion allowance. The onshore section will be buried at a depth of 1.1m along its entire length. Additional sectionalisation valves are envisaged if detailed

9
engineering studies indicate that pipeline CO2 inventories are such that these are needed to limit the amounts released for safety reasons in the event of a leak. At this stage the possible numbers and locations were not determined but the preference is for these to be installed below ground. A tie-in point will be provided near the land fall so that CO2 from third party sources could be tied in without interrupting operations. The offshore section is specified with preliminary wall thickness of 23.8mm also with a 1.5mm corrosion allowance. Coating is specified as 5mm bitumen and 50mm concrete. Subject to requirements for protection against anchoring and fishing activities along the route the pipeline would not be trenched and buried. Well head platform Hewett
The pipeline terminates at a new platform. The FEED proposes that this should be a liftable jacket located on piled foundations on which a lift installed integrated deck would be placed. This was chosen as it is cost efficient, allows for easy decommissioning in line with regulations and can be supported by locally available construction yards. A key design consideration was the CO2 venting system. This will be designed only to vent the topsides equipment. It is assumed that pipeline depressurisation and full process flow venting will not be required. The facility will be designed for the full pipeline pressure. The maximum quantities for topside only venting were found to be low enough to allow a low level downwards pointing vent to be used. This would not be the case if the other venting services were required. To avoid venting of the pipeline CO2 contents in the event of a planned line depressurisation the CO2 would first be displaced into the reservoir with another fluid such as air. A variety of issues associated with design of the vent system are addressed including measures to cope with low temperatures and possible hydrate blockages. However detailed design details and specifications have still to be developed. The platform would be protected against full flow release events by installation of 2 remote operated riser isolation valves in series. Pipeline transport Longannet
Transport of the captured CO2 will be for the most part through existing natural gas pipelines adapted appropriately for CO2 service. The first overland section will make use of parts of National Grid’s gas pipeline system. Sections of 36” line running from just north of the town of Denny to the St Fergus terminal will be made available. The design pressures of these lines, 70 bar from St Fergus to Aberdeen and 84 bar south of Aberdeen, dictated that transport be in the gas phase and a key design requirement was that there should be no risk of two phase flow under all conditions. Considering the minimum ground temperature this set the maximum incidental pressure at 37.5 bar(g) and the design operating pressure 10% lower at 34 bar(g). Due to space limitations a full metering and pigging station could not be located near the plant. A new above ground installation (AGI) would thus be built to the north of the Longannet site near Valleyfield. The short section of 24” line would have only pig launching facilities at Longannet but this would allow frequent pigging of this short section enabling condition monitoring data to be accumulated without having to pig the main line. From Valleyfield a new section of 36” line would run to Dunipace north of Denny where a tie in to the no10 feeder system would be made. The FEED established that single block valve isolation would be adequate rather than double block and bleed. There are about 16 above ground installations along the route and also cross connections between the multiple gas lines. The cross connections would have to be removed and also the valves at these stations
10
changed to be suitable for CO2 service. In addition a decision was made to provide 24” bypasses and 8” bypass bridles across pipeline section isolating valves at these stations so that these valves could be exercised without interrupting flow. At St Fergus the CO2 has to be compressed further for transport in the dense phase to the offshore platform. A new site was chosen for this compressor station at Blackhill which is located just to the Northwest of the terminal. Here 3 x 50% compressors would be installed with a discharge pressure of 120 bar(g). Two would be electrical with variable speed drive and one would be driven by a gas turbine. Design studies on the existing offshore pipeline indicated that to avoid running ductile fractures the gas temperature should be limited to maximum 29°C. To achieve this limit the non-condensable gases in the CO2 have to be limited to 1% and the hydrogen component within this to max 0.3%. In extreme summer conditions this maximum temperature could not be guaranteed by using cooling water in the Blackhill compressor after coolers. Thus a propane chilled aftercooler would also be installed at the Blackhill compressor station which would lower the temperature to 15°C. A fiscal metering system would be installed at the outlet of the Blackhill compression station. A short section of new buried 12” line skirts the St Fergus site to tie in to the existing 20” line to Goldeneye through an existing 12” tie in point. The design pressure of this line and the discharge system of the compressor station would be 132 bar(g) to match that of the existing offshore line. Full flow vent reliefs for example due to back flow or from compressor over pressure would be avoided by installation of HIPPs systems. Wellhead platform Goldeneye
An existing seabed non return valve with flow towards shore will be removed. A new remote operated subsea ball valve will be installed. The line and riser section downstream will be replaced to have a higher design pressure able to withstand thermal expansion of any locked in dense phase CO2 under normal conditions. The CO2 will be filtered in the dense phase through 2x100% filters before passing through a meter and then a letdown valve. From downstream of this valve low temperatures are expected due to the expansion and all equipment downstream will be executed in stainless steel selected for this service. A new manifold and flow lines to 5 injection wells will be installed. New stainless steel Christmas trees equipped with hydrate inhibitor injection points will be provided. Construction of the Longannet supplementary power plant and CCP
A number of options for construction of these facilities were studied as a result of which preferred methods were selected. The costs estimates for the project are based on these methods. For Longannet it was found to be feasible to build most of the new facility in the form of pre-assembled modules or pre-assembled racks. The large stripper columns would be dressed and fitted with some reinforcing steel for transport and up-ended on site onto their foundations. Special attention was paid to dressing the upper part of the strippers which might interfere with the up-ending operation with a key aim being to avoid having to scaffold up to this area. Three options for unloading barges at Longannet were investigated, two involved shore based crane lifts from supply barges and the third use of a roll on/roll off barge. The latter roll on/roll off option was selected. Cost were estimated to be lower mainly because labour costs for building as modules would be less than in the case of stick build.
11
Wells at Hewett
Injection wells
The new wells will be fitted with 7” tubing and will be deviated with an angle up to 50 degrees. In order to control temperatures in the tubing due to throttling the delivery pressure will initially be lower than the maximum of 35 bar(g). The starting pressure in the Lower Bunter is low, 2.69 bar(a). During the demonstration phase it will not be necessary to reheat the CO2. In the second higher capacity phase transport will switch to dense phase with an arrival pressure at the platform of 79bar(g). At this stage throttling will be required and to avoid low temperature and two phase flow the well head heater will have to be brought in to service. The reservoir will be filled to no more than hydrostatic pressure which at 1198.8 meters depth will be 117 bar(a). As dense phase injection proceeds the pressure difference across the well tubing due to the combined effects of friction and hydrostatic head effects will change so that initially 8 wells will be required progressively dropping to 6 wells as the reservoir fills up. Other wells
To ensure the integrity of the storage reservoir, existing well penetrations will need to be plugged to an acceptable standard for CO2 service. There are 28 existing wells and none are abandoned to the required standard. All will have to be abandoned with CO2 resistant materials. Wells at Goldeneye
The existing wells at Goldeneye will be reused for injection. They are fitted with 7” tubing but flow studies indicate that using this size would cause too low temperatures in the well due to the need for throttling at the wellhead. Consequently the tubing will be replaced in a smaller diameter so that friction is increased and the drop in temperature reduced to acceptable levels. The upper part of the new tubing diameters will be 4.5” reducing with depth to smaller sizes in the range 4.5”,4”,3.5” and 2.875”. A number of combinations will be installed so that injection rates can be matched to a selection of wells. The upper sections of tubing will be executed in super Cr13 which has better low temperature properties. To further manage the temperatures in the wells an insulating non-water based fluid will be introduced into the annuli. Other wells
There are 13 abandoned exploration and appraisal wells in the vicinity of the Goldeneye platform. The quality of the abandonment is good but any intervention would be costly as the wells are cemented and have had the well heads removed. Four of the wells are outside of the structure. Only one well is considered a potential risk because of abandonment quality but lies 10km West of Goldeneye and the CO2 plume is not expected to reach it. Reservoirs
Hewett
The Hewett gas reservoir consists of two main sands, the Upper and Lower Bunter. The Lower Bunter is well suited to CO2 storage having excellent quality sands and an extensive seal from a series of shales and this reservoir would be the target for injection. The reservoirs are sealed to the South West and North East by faults. A static model was built with 5 horizons and 97 faults were identified of which 17 were modelled. Extensive work was

12
carried out to review the time depth conversion making use of information from existing wells. To the North East of the Hewett field there are a number of other fields designated as the “D” fields from their names. A detailed model of the target reservoirs was made in which porosity and permeability were incorporated based on data from well logs and cores. Estimates of capacity were made. A concern is the possible juxtaposition of the reservoir sands across the fault between the Hewett and Little Dotty fields which could thus potentially provide a migration pathway. There is also some evidence of a juxtaposition of the Lower and Upper Bunter sands which would also have implications for the development of the CO2 plume. The logs from the existing wells are of poor quality partly due to washouts in some sections of shale. It was also not possible to make good predictions of water saturation from the available data. Reservoir static modelling was carried out in Petrel and the model was exported to GEM for dynamic modelling. An outline of the intended monitoring programme was produced to cover operational, plume development and integrity management. Essential requirements were defined and also a set of recommendations considered essential were:-
Full continuous monitoring of well inlet temperature, pressure, flowrate (per well and total).
Annulus pressures (A and B), and either annulus bleed/top-up density and volume or alternatively a downhole annulus gauge.
Downhole pressure and temperature. CO2 sampling on seabed, riser, and platform, both during operations and after abandonment.
4D baseline survey, and further 4D on a time schedule (e.g. 5 years), Campaign-based wireline logging including as a minimum Pulsed-Neutron and
Cement Bond Log from Surface to total well depth, and other logs as required, covering all wells on a rotational basis.
A number of other techniques are recommended for investigation and possible deployment in the main aimed at reducing residual uncertainties about the reservoir integrity and performance.
Goldeneye
Goldeneye was discovered in 1996 and brought into production in 2004. It is a gas condensate field with a thin oil rim. The reservoir has a strong aquifer drive and as a result pressure has dropped from an original 262bar(a) to 152bar(a). It is estimated that injection of 20 million tons of CO2 would raise the pressure to between 241 and 259 bar(a) but will then drop back due to dissipation into the aquifer. The reservoir is sealed to the East South and West by structural traps and to the North by a pinch-out. It is sandstone reservoir with average porosity of 25%and permeability of 790mD. Extensive work was carried out to model the reservoir, determine the storage capacity and evaluate the integrity of the seal. A static model was constructed on the basis of the asset model used for development and production. The original input data used in this model was used. However the boundaries of the model were extended to cover movement of the CO2 plume and some rebuilding of the model was required. Changes were made to enable a focus on the evaluation of capacity and containment. The changes included modifications to layering to better model thin buoyant CO2 plumes and more focus on porosity and permeability in the under-burden.

13
Several variants of the model were constructed because the first model, based on that used for field management, did not give a good history match with the production to date. Further work is needed to test the models and develop a robust dynamic model of the CO2 injection. The study also developed a Monitoring, Measurement and Verification (MMV) plan. This has several objectives including comparing actual and modelled behaviour of CO2 and formation fluids in the storage site, detecting significant irregularities, detecting migration, leakage of CO2 or significant adverse effects on the environment and assessing the effectiveness of corrective measures. A key foundation of the monitoring plan is acquisition of a pre-injection baseline for both the environment and subsurface. During the project a range of techniques are planned including:-
Multi-beam echo sounding, seabed sampling and continuous tracer injection, Well integrity monitoring using a range of down hole sensors and logging tools, Seabed CO2 detection below the platform, CO2 injection conformance based on pressure, saturation and flow monitoring Time lapse seismic.
Figure 1 An overview diagram of the Kingsnorth Project
KINGSNORTH - HEWITT
EO
N.U
K
Unit 6850MWe
Unit 5850MWe
Comp Dry
NaOH
Wash
Quench
Cool
Wet
ESP
Str
ip
Ab
so
rb
New
AGI
10 km 36 inch (max 39 barg in phase 1, 150barg in phase 2)
EN
T 260 km 36 inch (max 39 barg in phase 1, 150barg phase 2)
Phase 1, Four wells (1 spare)
Phase 2 , Nine wells
N
HewettOffshore
pipeline
and platform (all new)
Onshore
Pipeline (new)
New Power
Plant
~50%
Bunter sandstones
200Mt capacity
Figure 1 KINGSNORTH - HEWITT
EO
N.U
K
Unit 6850MWe
Unit 5850MWe
Comp Dry
NaOH
Wash
Quench
Cool
Wet
ESP
Str
ipS
trip
Ab
so
rbA
bso
rb
New
AGI
10 km 36 inch (max 39 barg in phase 1, 150barg in phase 2)
EN
T 260 km 36 inch (max 39 barg in phase 1, 150barg phase 2)
Phase 1, Four wells (1 spare)
Phase 2 , Nine wells
N
HewettOffshore
pipeline
and platform (all new)
Onshore
Pipeline (new)
New Power
Plant
~50%
Bunter sandstones
200Mt capacity
Figure 1
14
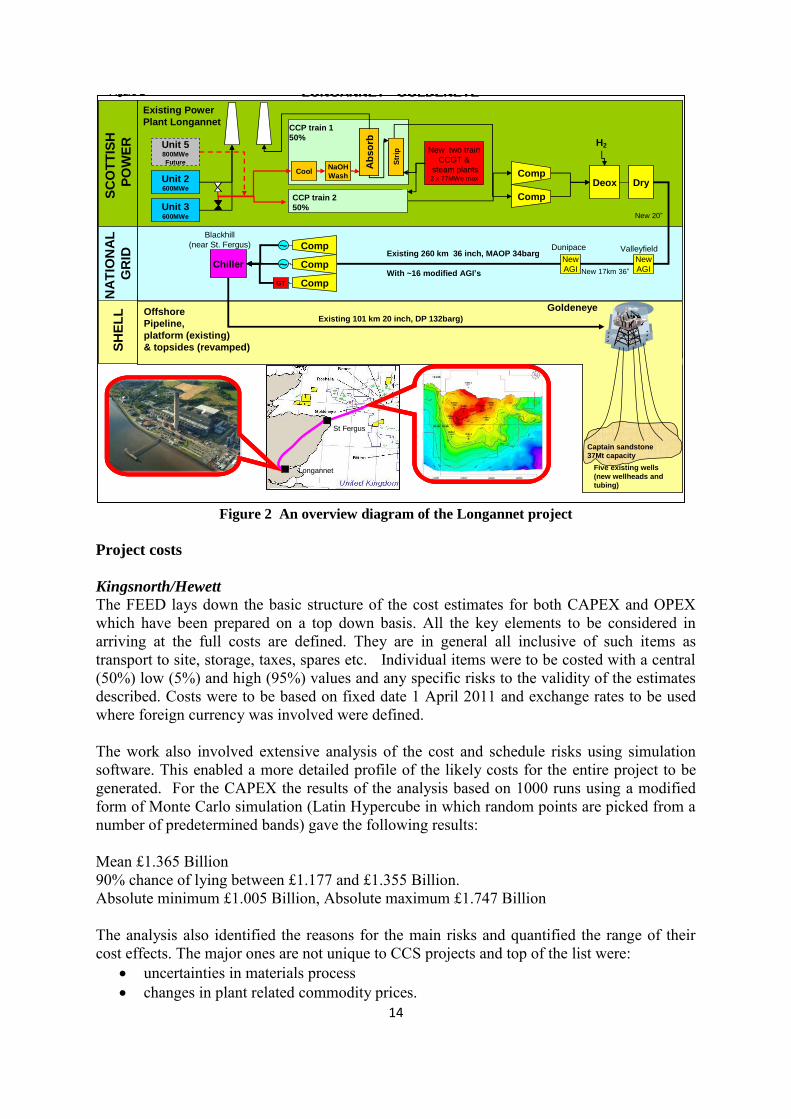
Figure 2 An overview diagram of the Longannet project
Project costs
Kingsnorth/Hewett
The FEED lays down the basic structure of the cost estimates for both CAPEX and OPEX which have been prepared on a top down basis. All the key elements to be considered in arriving at the full costs are defined. They are in general all inclusive of such items as transport to site, storage, taxes, spares etc. Individual items were to be costed with a central (50%) low (5%) and high (95%) values and any specific risks to the validity of the estimates described. Costs were to be based on fixed date 1 April 2011 and exchange rates to be used where foreign currency was involved were defined. The work also involved extensive analysis of the cost and schedule risks using simulation software. This enabled a more detailed profile of the likely costs for the entire project to be generated. For the CAPEX the results of the analysis based on 1000 runs using a modified form of Monte Carlo simulation (Latin Hypercube in which random points are picked from a number of predetermined bands) gave the following results: Mean £1.365 Billion 90% chance of lying between £1.177 and £1.355 Billion. Absolute minimum £1.005 Billion, Absolute maximum £1.747 Billion The analysis also identified the reasons for the main risks and quantified the range of their cost effects. The major ones are not unique to CCS projects and top of the list were:
uncertainties in materials process changes in plant related commodity prices.
LONGANNET - GOLDENEYE
SC
OT
TIS
H
PO
WE
RS
HE
LL
Existing 101 km 20 inch, DP 132barg)
GoldeneyeOffshore
Pipeline,
platform (existing)
& topsides (revamped)
NA
TIO
NA
L
GR
ID
Chiller
~
~GT
Unit 3600MWe
Unit 2600MWe
CompDeox Dry
Comp
H2
St Fergus
Longannet
Comp
Comp
Comp
Existing Power
Plant Longannet
Ab
so
rb
Str
ip
CoolNaOH
Wash
CCP train 1
50%
CCP train 2
50%
Existing 260 km 36 inch, MAOP 34barg
With ~16 modified AGI’s
New two train
CCGT &
steam plants2 x 77MWe max
Five existing wells
(new wellheads and
tubing)
Unit 5800MWe
Future
New
AGI
New
AGI
Dunipace Valleyfield
New 17km 36”
New 20”
Blackhill
(near St. Fergus)
Figure 2
Captain sandstone
37Mt capacity
LONGANNET - GOLDENEYE
SC
OT
TIS
H
PO
WE
RS
HE
LL
Existing 101 km 20 inch, DP 132barg)
GoldeneyeOffshore
Pipeline,
platform (existing)
& topsides (revamped)
NA
TIO
NA
L
GR
ID
Chiller
~
~GT
Unit 3600MWe
Unit 2600MWe
CompDeox Dry
Comp
H2
St Fergus
Longannet
St Fergus
Longannet
Comp
Comp
Comp
Existing Power
Plant Longannet
Ab
so
rbA
bso
rb
Str
ipS
trip
CoolNaOH
Wash
CCP train 1
50%
CCP train 2
50%
Existing 260 km 36 inch, MAOP 34barg
With ~16 modified AGI’s
New two train
CCGT &
steam plants2 x 77MWe max
Five existing wells
(new wellheads and
tubing)
Unit 5800MWe
Future
New
AGI
New
AGI
Dunipace Valleyfield
New 17km 36”
New 20”
Blackhill
(near St. Fergus)
Figure 2
Captain sandstone
37Mt capacity

15
Amongst those related to CCS were:
Previously unknown environmental impacts of PCC, Delay in pipeline consents due to public concerns and other factors, CCP/power plant co-commissioning difficulties, Delay in Unit 5 operation preventing flue gas supply to the CCP, Uncertainties in capture plant and compression plant design and, Failure of current license holder to abandon wells in way suitable for CO2 storage.
The mid cost estimates show that the split between the main components was as follows:- Development costs 6.0% Capture Plant 17.8% Compression/conditioning 8.0% Transport system 49.5% Injection facilities 12.5% Geological storage 6.3% The mid estimate shows the expenditure phased over 6 years as Year 1 2.5% Year 2 13.8% Year 3 30.0% Year 4 36.3% Year 5 11.3% Year 6 6.3%
Longannet/Goldeneye
The three consortium members each have their own rigorous cost estimating processes. The costs presented in the FEED study are thus the results of three underlying cost estimates. Despite the differing estimating processes a common division of the costs was used so that costs were allocated to one of 15 categories. The mid estimate for the entire system is based on 2010 costs and amounted to £1,145.5 Billion. To this was added a contingency of about 17% bringing the total to £1,340.3 Billion. The split between the main elements was approximately: CCP and associated compression at Longannet 57.3% Transport pipeline and booster compression 26.3% Offshore injection facilities 13.4% Misc development costs (FEED/surveys) 3.0% The overall estimate post FEED was considered to have an accuracy of -12% to +15%. This makes the estimate range including contingency from £1,200 to £1,519 Billion. Abandonment costs were also estimated for all elements of the CCS system. A breakdown of these is given in this report. The total is £281.3 Million which amounts to 24.6% of the mid CAPEX (excluding contingency). Annual operating costs were also estimated as £51 million/y fixed and £81.4 million/y making a total of £132.4 million/y. A more detailed breakdown is given in Chapter 6 of this report.

16
Consents and Environment
Kingsnorth
The main work on consents focussed on the power station for which a section 36, Electricity Act, consent was obtained without objections in 2006 for the new units 5 and 6 but without the capture plant. An application was also made in 2007 for the environmental permit to operate (PPT). Both would have to be resubmitted to include the capture plant. The FEED study expected the storage of ammonia and diesel at the site to invoke COMAH regulations but noted that CO2 was not currently regarded as a COMAH substance. The onshore pipeline is short and will be a local pipeline under the Pipelines Act. It was noted that the Health and Safety Executive (HSE) was consulting on whether to extend the Pipeline Safety Regulations to include CO2 as a named substance. It would then be regarded as a major hazard and compliance with these regulations would be required. Planning consent for the onshore pipeline and associated above ground facilities would be required. Temporary construction sites would also be required but it was noted that these are usually “permitted developments” under the Town and Country Planning Act. The offshore pipeline would require a “works authorisation” under the Petroleum Act which gives permission to construct and operate. An additional Food and Environmental Protection Agency (FEPA) licence will however be required for the intertidal area. A Petroleum Operations Notice (PON) would be needed for the offshore discharge of any chemicals used particularly during the construction and commissioning activities. The exact location of the proposed new platform was not determined at the time of the FEED study, thus it was not possible to progress the Environmental Statement which would be needed. It was noted that some offshore survey work would have to be undertaken to complete this statement. Once the location of the new facilities is known a “Consent to Locate” would be required under the Coastal Protection Act and the Continental Shelf Act extension of this. Furthermore if the location of the facilities presented any obstruction or danger to navigation the consent of the Secretary of State is also required. An Environmental Impact Assessment (EIA) would also be a requirement under the Offshore Petroleum Production and Pipelines (Assessment of Environmental Effects) Regulations which themselves are to be amended to cover CO2 storage. In addition a number of different environmental and other permits will be required for the various offshore operations involved in the new platform, from seismic acquisition through well drilling, well workovers, CO2 injection decommissioning and abandonment. The FEED outlines how the protection of the environment would be addressed during the various phases of the project from design through construction to operation and abandonment. Energy efficiency, climate change, water use efficiency; selection of materials, environmental enhancement, pollution control would all be addressed in an integrated and focussed way as the post FEED design was developed. Longannet
The main consents required for the full system are for change in manner of operation of the generating station under the Electricity Act, planning consents for the pipeline and other above ground facilities, Pipeline construction consent under the Pipelines Act, a Petroleum Operations Notice and a Carbon Storage Permit under the Energy Act. In addition

17
Environmental impact assessments and certain environmental statements and summaries are required. The FEED study produced a detailed register of consents and licenses and also performed an analysis of the risks which the processes of obtaining consents posed to the project. An overall plan for the permitting and consent processes was also produced. Although the various sections of the project were the responsibility of specific consortium members the three partners worked jointly together with the regulators on permitting and consents. An early start to this element of CCS projects is strongly recommended and it was observed that permitting for such a system is complex and needs careful management. A few of the risks are related to the immaturity of regulation for example the status of CO2 under Control of Major Hazards regulations (COMAH), the issue of a carbon storage license by the Department of Energy and Climate Change (DECC) which is contingent on their completion of a Strategic Environmental Assessment (SEA). Health and Safety
In both demonstration projects there will be no transport of dense phase CO2 on land apart from a short section near St Fergus. As a result the risks to the public from supercritical CO2 leaks did not have to be addressed in detail. For the future commercial scale phase of the Kingsnorth project, which would use the same short overland section of pipeline, they were touched on but a full analysis was not done. Management and acceptance of this risk is possibly going to be the most controversial aspect of complete CCS systems together with that posed by onshore storage. Thus the Health and Safety work undertaken during FEED for these projects does not appear to have raised any particularly difficult issues. The nature of the work undertaken and a few significant points are outlined below.
Longannet
Health and Safety was addressed by each consortium member using a structured approach and well recognised techniques such as HAZID, HAZOP and dispersion modelling. In addition a contractor (Mott McDonald) was commissioned to conduct a full chain end to end safety review which draws together the results and recommendations from the individual studies and highlights the important ones. The consortium published 7 reports covering HSE issues which were generated during the FEED. Chapter 10 of this report summarises the main findings from each of these 7 documents and their onward reference. Major release scenarios for CO2 and amine were examined at the Longannet site and it was concluded that effects would be contained within the site thus offering no risk to the public. The only risk which could spread outside was a toxic risk from a major spillage of amine which could potentially enter the wild life food chain. An insidious risk was identified relating to work at the base of the cooling tower where certain failures in the plant might cause a build-up of CO2 and hence a asphyxiation hazard which would not be present in a normal power plant. Within the process plants and around venting systems the risk of cold burns to personnel was identified and also risks of material failure if the correct low temperature materials are not specified. It was however noted that correct material selection, procedures and appropriate insulation could prevent these risks.
18
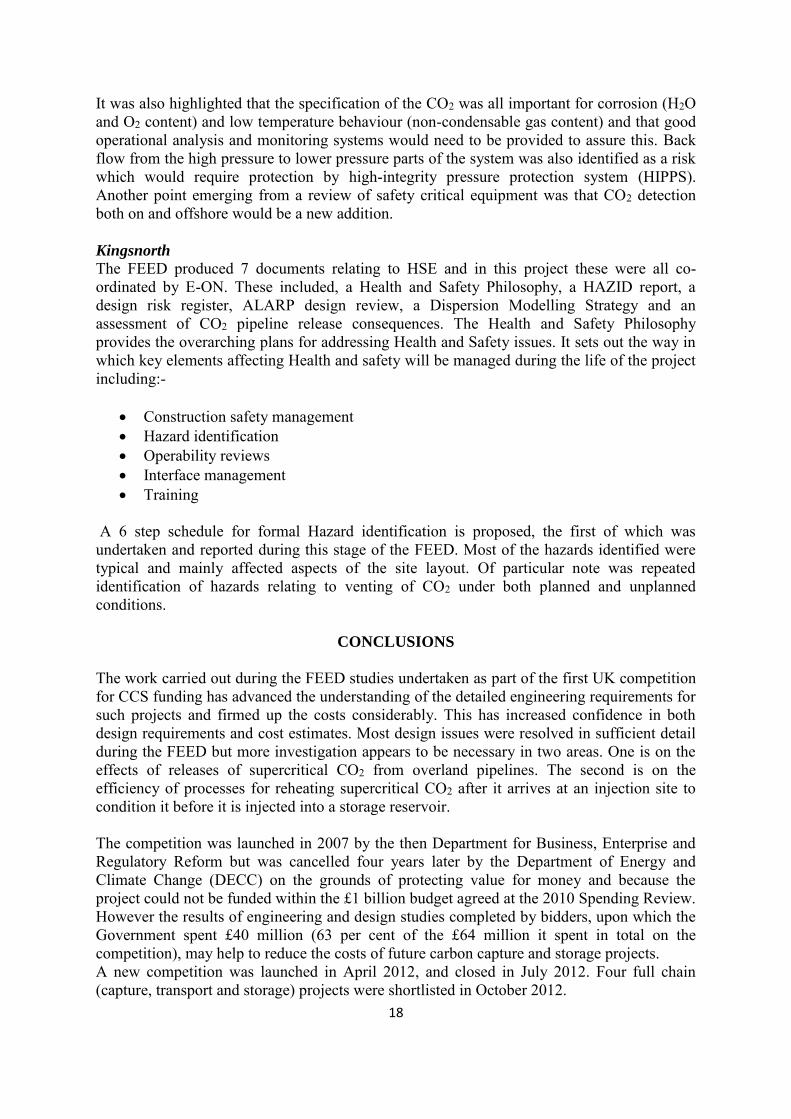
It was also highlighted that the specification of the CO2 was all important for corrosion (H2O and O2 content) and low temperature behaviour (non-condensable gas content) and that good operational analysis and monitoring systems would need to be provided to assure this. Back flow from the high pressure to lower pressure parts of the system was also identified as a risk which would require protection by high-integrity pressure protection system (HIPPS). Another point emerging from a review of safety critical equipment was that CO2 detection both on and offshore would be a new addition. Kingsnorth
The FEED produced 7 documents relating to HSE and in this project these were all co-ordinated by E-ON. These included, a Health and Safety Philosophy, a HAZID report, a design risk register, ALARP design review, a Dispersion Modelling Strategy and an assessment of CO2 pipeline release consequences. The Health and Safety Philosophy provides the overarching plans for addressing Health and Safety issues. It sets out the way in which key elements affecting Health and safety will be managed during the life of the project including:-
Construction safety management Hazard identification Operability reviews Interface management Training
A 6 step schedule for formal Hazard identification is proposed, the first of which was undertaken and reported during this stage of the FEED. Most of the hazards identified were typical and mainly affected aspects of the site layout. Of particular note was repeated identification of hazards relating to venting of CO2 under both planned and unplanned conditions.
CONCLUSIONS
The work carried out during the FEED studies undertaken as part of the first UK competition for CCS funding has advanced the understanding of the detailed engineering requirements for such projects and firmed up the costs considerably. This has increased confidence in both design requirements and cost estimates. Most design issues were resolved in sufficient detail during the FEED but more investigation appears to be necessary in two areas. One is on the effects of releases of supercritical CO2 from overland pipelines. The second is on the efficiency of processes for reheating supercritical CO2 after it arrives at an injection site to condition it before it is injected into a storage reservoir. The competition was launched in 2007 by the then Department for Business, Enterprise and Regulatory Reform but was cancelled four years later by the Department of Energy and Climate Change (DECC) on the grounds of protecting value for money and because the project could not be funded within the £1 billion budget agreed at the 2010 Spending Review. However the results of engineering and design studies completed by bidders, upon which the Government spent £40 million (63 per cent of the £64 million it spent in total on the competition), may help to reduce the costs of future carbon capture and storage projects. A new competition was launched in April 2012, and closed in July 2012. Four full chain (capture, transport and storage) projects were shortlisted in October 2012.

19
On 14 January 2013, all the shortlisted bids submitted revised proposals. On 20 March 2013 the government announced two preferred bidders:
Peterhead Project in Aberdeenshire, Scotland – a project which involves capturing around 90% of the carbon dioxide from part of the existing gas fired power station at Peterhead before transporting it and storing it in a depleted gas field beneath the North Sea. The project involves Shell and SSE.
White Rose Project in Yorkshire, England – a project which involves capturing 90% of the carbon dioxide from a new super-efficient coal-fired power station at the Drax site in North Yorkshire, before transporting and storing it in a saline aquifer beneath the southern North Sea. The project involves Alstom, Drax Power, BOC and National Grid.
Initially there were 8 bids and following a detailed analysis of these 4 projects were short-listed. The two other projects, Captain Clean Energy and Teeside Low Carbon projects were appointed as Reserve projects.
The Government will now undertake discussions with the two preferred bidders to agree terms by the summer of 2013 for FEED studies, which will last approximately 18 months. A final investment decision will be taken by the Government in early 2015 on the construction of up to two projects. The Peterhead project will again make use of the depleted Goldeneye field and its existing offshore pipeline, platform and wells. This project will also again make use of post combustion capture fitted to an existing power plant although this is gas fired, not coal fired. It is thus likely that a lot of the work undertaken in the Longannet FEED study will be relevant to this new project. Since the first competition FEED studies were published the existing Kingsnorth power station which started operation in 1970 has been decommissioned (March 2013). This was as a result of implementation of the EU’s Large Combustion Plant Directive legislation. There is currently no application for consent to build the proposed new supercritical plants which featured in the FEED study. The White Rose project will make use of oxy- combustion technology and includes the possibility to co-fire biomass along with the coal fuel. This project plans to make use of a saline aquifer rather than a depleted oil or gas field. It thus represents a significant technological step out from the projects which featured in the previous competition.
RECOMMENDATIONS
It is proposed that IEAGHG monitors the availability of new FEED material developed during the second UK competition and informs IEAGHG members if it is considered worthwhile to do a further in depth review of such new documentation. Notes:
If any readers should want to perform calculations or further work based on the information provided in this FEED Studies Review, it is recommended that the original FEED documents are consulted (available on the Department of Energy and Climate Change website). Care should be taken when using and referencing figures, tables and references, as numbering of these in each sub-chapter is consistent within the sub-chapter but independent from the other sub-chapters.

20
CONTENTS
IEAGHG Overview p 1
Chapter 1: Projects Overview p 21
1.1 Longannet p 21 1.2 Kingsnorth p 28
Chapter 2: Power Plant p 35
2.1 Longannet p 35 2.2 Kingsnorth p 51
Chapter 3: CO2 Capture Plant p 64
3.1 Longannet p 64 3.2 Kingsnorth p 83
Chapter 4: CO2 Compression Plant p 91
4.1 Longannet p 91 4.2 Kingsnorth p 105
Chapter 5: CO2 Transport System p 123
5.1 Longannet p 123 5.2 Kingsnorth p 136
Chapter 6: Wells p 154
Chapter 7: CO2 Storage p 162
Chapter 8: CCS Project Cost p 183
8.1 Longannet p 183 8.2 Kingsnorth p 194
Chapter 9: Consents & Environment p 204
9.1 Longannet p 204 9.2 Kingsnorth p 211
Chapter 10: Health & Safety p 229
10.1 Longannet p 229 10.2 Kingsnorth p 240

21
CHAPTER 1: PROJECTS OVERVIEW
1.1 Longannet Power Station to Goldeneye Reservoir CCS Demo Project
Project Longannet Power Station (LPS) to Goldeneye reservoir (North Sea) CCS Demo Project [2].
Scope CO2 extracted from coal-fired power plant, piped ~ 260 km onshore and ~ 100 km offshore and stored in the depleted Goldeneye gas field [2].
Consortium CCS Consortium is comprised of ScottishPower, Aker Clean Carbon, National Grid and Shell [2].
Figure 1 Overview of Longannet Consortium
Figure 2 Technical Overview of Longannet Consortium

22
Power Plant
Power plant company Scottish Power Generation and Capture [2].
Location Kincardine-on-Forth, by Alloa, Clackmannanshire, on the north bank of the Firth of Forth, Scotland [2].
Power plant Capacity 2400 MWe (4 Sub-critical pulverised coal fired units rated at 600 Mwe each).
Operation The station was originally commissioned and opened between 1969 and 1973.
Flue Gas Specification
Temperature 80°C Pressure 101395 Pa Flow rate 1625665 m3/hr CO2 equivalent 165 Mwe (2x50%)
Nox
Catalytic Reduction Technology CRT is not in place at LPS [5]. Current regulation Nox don’t exceed 452 mg/Nm3 and can reduce further 200 mg/Nm3 by implementing CRT on Units 1,2 and 3 before end of 2015[5].
Sox Sea Water Flue Gas Desulphurisation (SWFGD) units are installed on Units 1, 2 and 3. Unit 1 and 2 are commissioned in 2010 [5], with removal efficiency of 94%.
Particulate All units are equipped with ESP and particulate will be further reduced by SWFGD.
Hg 0.0008 mg/Nm3 (max.)
Figure 3 Footprint of Longannet Project
23
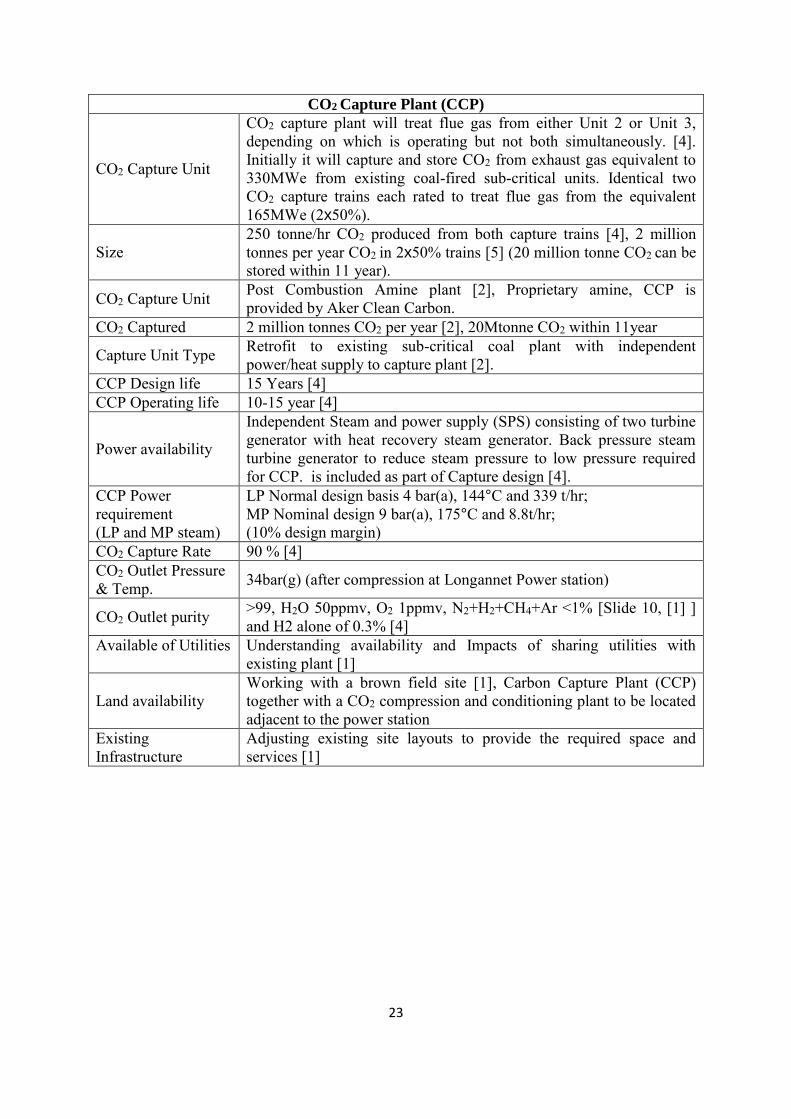
CO2 Capture Plant (CCP)
CO2 Capture Unit
CO2 capture plant will treat flue gas from either Unit 2 or Unit 3, depending on which is operating but not both simultaneously. [4]. Initially it will capture and store CO2 from exhaust gas equivalent to 330MWe from existing coal-fired sub-critical units. Identical two CO2 capture trains each rated to treat flue gas from the equivalent 165MWe (2x50%).
Size 250 tonne/hr CO2 produced from both capture trains [4], 2 million tonnes per year CO2 in 2x50% trains [5] (20 million tonne CO2 can be stored within 11 year).
CO2 Capture Unit Post Combustion Amine plant [2], Proprietary amine, CCP is provided by Aker Clean Carbon.
CO2 Captured 2 million tonnes CO2 per year [2], 20Mtonne CO2 within 11year
Capture Unit Type Retrofit to existing sub-critical coal plant with independent power/heat supply to capture plant [2].
CCP Design life 15 Years [4] CCP Operating life 10-15 year [4]
Power availability
Independent Steam and power supply (SPS) consisting of two turbine generator with heat recovery steam generator. Back pressure steam turbine generator to reduce steam pressure to low pressure required for CCP. is included as part of Capture design [4].
CCP Power requirement (LP and MP steam)
LP Normal design basis 4 bar(a), 144°C and 339 t/hr; MP Nominal design 9 bar(a), 175°C and 8.8t/hr; (10% design margin)
CO2 Capture Rate 90 % [4] CO2 Outlet Pressure & Temp. 34bar(g) (after compression at Longannet Power station)
CO2 Outlet purity >99, H2O 50ppmv, O2 1ppmv, N2+H2+CH4+Ar <1% [Slide 10, [1] ] and H2 alone of 0.3% [4]
Available of Utilities
Understanding availability and Impacts of sharing utilities with existing plant [1]
Land availability Working with a brown field site [1], Carbon Capture Plant (CCP) together with a CO2 compression and conditioning plant to be located adjacent to the power station
Existing Infrastructure
Adjusting existing site layouts to provide the required space and services [1]

24
St. Fergus
Avonbridge
Compressor
Aberdeen
Compressor
Kirriemuir
Compressor
Offshore
Storage
Aberdeen
Dundee
Edinburgh
Glasgow
Existing NTS pipelines
Proposed new CO2 pipeline
Existing emitters
Compressor stations
Longannet power station
Figure 4 Longannet Pipeline Routes
CO2 Transportation
Compressor at Longannet Power Station
5 Stage integrally geared; 31-34 bar(g) at 5-30 °C in vapour phase <50ppmv moisture level [4] Due to pressure drop arrival at Blackhill Compressor Station operating between 28.5 to 31 bar(g) and 3-14°C [4] ,
Onshore: New Build Pipeline 17km (Vapour phase) [1,2]
Onshore: Existing Pipeline 260km onshore gas pipeline changed for CO2 transportation [2]
Nominal Diameter
New 600mm (24”) buried steel pipeline from LPS to Valleyfield Installation New 900mm (36”) buried steel pipeline from Valleyfield to Dunipace Installation [4]
Onshore pipeline: Company Name National Grid [2]
Offshore: New Pipeline -N.A.-
Offshore: Existing pipeline 100 km (dense phase) [1,2]
Nominal Diameter 500 mm (20”) [4]
Offshore pipeline Company Name Shell
Compressor at Blackhill Compressor
Multiple Stage, integrally geared, 80-120 bar(g), 29°C (Max) [4]

25
Station Injection Platform
Existing Pig launcher at Goldeneye platform will be converted to Pig receiver[4]
CO2 Storage
Operator Company Name
Shell
Location Offshore, central North Sea – Goldeneye gas field
Wells 5 production wells to be worked over (1 monitoring well, 4 injection wells)
Estimated Capacity Theoretical – 47 M t (mass balance). Expected: 30Mt Depth 2500m Water depth 120m Reservoir pressure Initially 140bar (265bar expected final pressure) Reservoir temp 20 - 30˚C
Structural trap Combined structural and stratigraphic trap. Secondary structural trap up dip.
Trapping mechanism
1: accommodation in pore space voided by gas. 2: capillary trapping in water-leg below original hydrocarbon accumulation
Type of Aquifer, e.g depleted gas field/ DSF
Offshore storage in depleted gas reservoir connected to aquifer (Goldeneye gas field, n sea)
Lithology of reservoir
Turbidite sandstone. (L. Cret Captain sandstone)
Porosity Av. 25% Permeability Av 790mD Lithology of Caprock
Laminated calcareous mudstone (Rodby fm). + additional lateral sealing mudstones within Valhall and Kimmeridge clay fms
Caprock Thickness Primary seal 60-85m (300m entire seal complex) CO2 Phase to be injected
Dense / liquid phase
CCS Project Economics
CAPEX Post Feed [1]
Capture Cost Steam and Power supply
(Steam and Power Supply value may differ) 114.8m£
CO2 Capture cost 228.1m£ Compression cost 47.2m£
Balance of Plant Utilities (Include CW pumps, fire system and other items that me be provided 119.7 m£

26
as part of power station) Site-Other
(Include EPC profit, Owner Engineers costs and other fees/licences) 146.7 m£
Total Capture Cost 656.5m£ (49%) Transportation Cost 281.2 m£ (21%) Storage Cost 207.8m£ (16%) Total Overall 1,145.5 m£ (85%) Risk & Contingency 194.8 m£ (15%) Total Project Capex 1,340.3 m£ (100%) Estimated Range 1,200 to 1,519 m£
OPEX Post Feed [4]
Item Longannet Site Transportation Storage
Fuel / Power / Energy
Calculated based on volume and energy price
profiles
0.04533MWh/t CO2 £4k/month
Consumables £4.86/t CO2 - £8k/month Waste disposal £0.31/t CO2 - £2k/month
Maintenance £505k/month £58k/month Annual profile,
averaging £284k/month
Staff £421k/month £350k/month £202k/month Rates £425k/month £4k/month -
Insurance £425k/month £33k/month Annual profile,
averaging £19k/month
Overheads £325k/month £602k/month £178k/month Lease Costs - - £8k/month
Other Fixed Costs £238k/month -
£96k/month + Annual profile,
averaging £267k/month
Summary of Overall Lessons Learned [6]
Development and review of the End-to-End CCS chain design requires information transfer between all key parties and potentially significant design iterations to develop a completed FEED.
Comprehensive Impact Assessment is required before implementing CCS chain design changes.
Achieving CCS chain flexibility is complex. An understanding of base load operation is first required.
The economic and design considerations of the whole CCS chain must be considered when determining a CCS operating philosophy.

27
Design work should be managed in terms of the End-to-End solution interfaces – not three separate design programmes.
Resource the technical work stream with appreciation of added complexity and novelty of CCS.
Re-using existing infrastructure can achieve a cost saving to the project but potentially introduces significant design constraints on the CO2 specification and process conditions.
References
No. Report Name
1 UK CCS Demonstration Competition FEED Dissemination Event, 5-6 December 2011; PRE412_SP_KT_Event20111205
2 UK CCS Demonstration Competition FEED Dissemination Event, 5-6 December 2011; Session 1 - Intro Final
3 UK CCS Demonstration Competition FEED Dissemination Event, 5-6 December 2011; Session 1- R. Cooper
4 SP-SP 6.0-RT 015 FEED Close Out Report 5 UKCCS - KT - S7.1 - E2E - 001 Post-FEED End-to-End Basis of Design 6 UKCCS - KT – S12.0 - FEED- 001 Lesson Learned Report
28
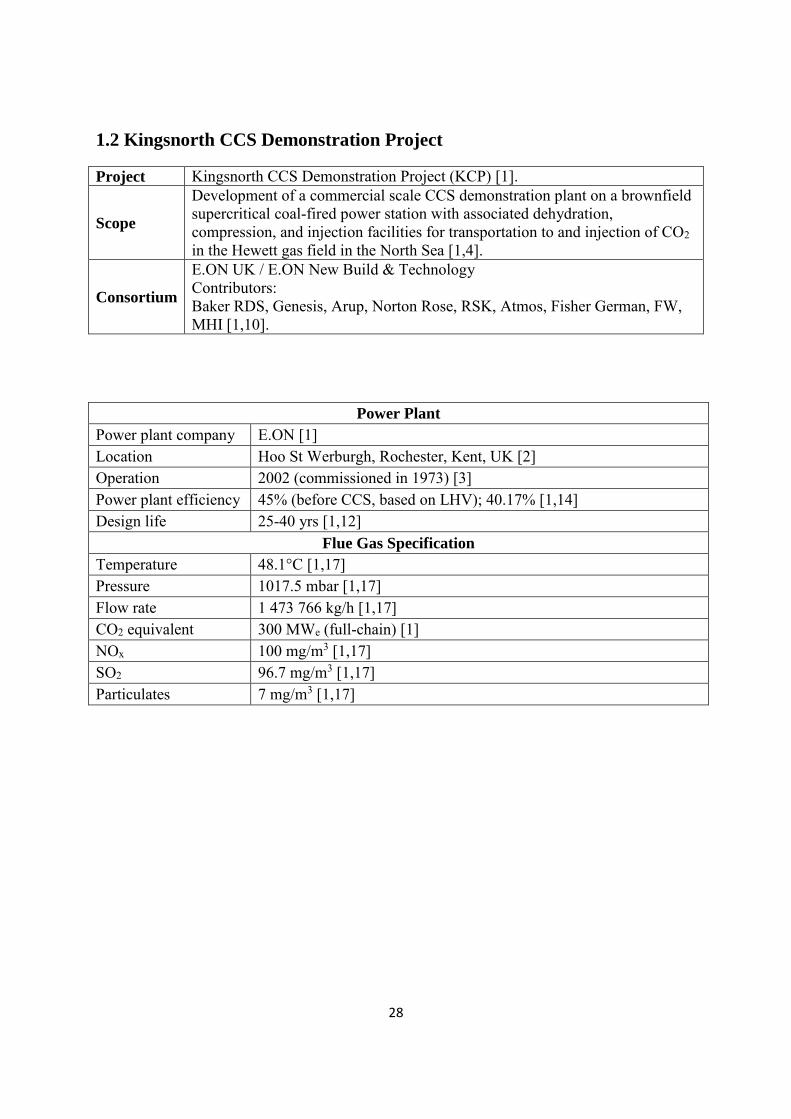
1.2 Kingsnorth CCS Demonstration Project
Project Kingsnorth CCS Demonstration Project (KCP) [1].
Scope
Development of a commercial scale CCS demonstration plant on a brownfield supercritical coal-fired power station with associated dehydration, compression, and injection facilities for transportation to and injection of CO2 in the Hewett gas field in the North Sea [1,4].
Consortium
E.ON UK / E.ON New Build & Technology Contributors: Baker RDS, Genesis, Arup, Norton Rose, RSK, Atmos, Fisher German, FW, MHI [1,10].
Power Plant
Power plant company E.ON [1] Location Hoo St Werburgh, Rochester, Kent, UK [2] Operation 2002 (commissioned in 1973) [3] Power plant efficiency 45% (before CCS, based on LHV); 40.17% [1,14] Design life 25-40 yrs [1,12]
Flue Gas Specification
Temperature 48.1°C [1,17] Pressure 1017.5 mbar [1,17] Flow rate 1 473 766 kg/h [1,17] CO2 equivalent 300 MWe (full-chain) [1] NOx 100 mg/m3 [1,17] SO2 96.7 mg/m3 [1,17] Particulates 7 mg/m3 [1,17]

29
Figure 1 Kingsnorth Project Footprint
CO2 Capture Plant (CCP)
CO2 capture unit Post-combustion amine plant [1,9], KS1 [1,15]
CO2 captured 6600 t/d (20 Mt over 10-15 years) [1], 2.2 Mt/yr at 24/7 full-load competition operation [1,12], 26400 t/d resp. 9 Mt/yr at full-load 100% Kingsnorth operation [5]
Capture unit type New-build power plant with integrated CCS plant with heat integration, whole power station certified as “capture ready”, so further CCS trains can be applied [1,4]
CO2 capture rate 90% [1], 50% of the flue gas from one 800 MW unit [1,11] CO2 outlet capture plant 30°C, 1 bar [1]
CO2 purity
99.94% [1], H2O < 24 ppmv N2 < 359 ppmv O2 < 200 ppmv H2S, COS, CO, H2, Ar, CH4 = 0 [1,18]
Operating life of CCS demo 12 yrs (2017-2029) [1,9]
Design life CCP 15 yrs [1,12]
Steam supply LP steam: 329.5 t/h @ 2.2 bar(g), 214°C IP steam: 0.9 t/h @ 4.9 bar(g), 277°C (batch operation)
Availability of utilities
On-site generation [1,11]: electric power, steam, demineralised water, compressed air On-site storage: fuel oil, H2, N2, CO2 River water abstraction: cooling water Site supply line: potable water Sea water distribution system: sea water

30
Land availability Brownfield site [1] Existing infrastructure Re-use as much as possible [1] Expected commercialisation Q3 2017 [1,8]
CCS power requirement 140 MWe [1,11]
Figure 2 Offshore and Onshore Pipeline Routes
CO2 Transportation
Compression Base case [1,15]: vapour, 30-40 bar, max. 40°C, max. 24 ppm H2O Full flow [1,15]: dense, 110-120 bar, max. 40°C, max. 24 ppm H2O
Compressor type 2x integrally geared [1,16], with integrated dehydration [5] Onshore pipeline ~10 (6-11)km [1,13], new-build [4] Diameter 36’’ OD, 32’’ ID [1] Material X65 Company Name E.ON UK, Genesis [1,10]
Design Specification & Capacity
Base case [1,13]: vapour, 6600 tCO2/d, 39 bar(g), no choking, no heating Full flow [1,13]: dense, 26400 tCO2/d, 87 bar(g), 79 bar(g) choking, single phase heating
Design Lifetime 40 yrs [1,12] Offshore pipeline ~260 (260-270) km [1,13], new-build [4]

31
Diameter 36’’ OD, 32’’ ID [1] Material X65 Company Name E.ON UK, Genesis [1,10]
Design Specification & Capacity
Base case [1,13]: vapour, 6600 tCO2/d, 39 bar(g), no choking, no heating Full flow [1,13]: dense, 26400 tCO2/d, 87 bar(g), 79 bar(g) choking, single phase heating
Design Lifetime 40 yrs [1,12]
Injection platform New-build [4], NUI with limited facilities, controlled directly from Kingsnorth [5]
Design lifetime 40 yrs [5]
CO2 Storage
Operator Company Name Currently ENT. FEED study carried out by Baker Hughes
Location Offshore southern North Sea
Wells Initially 3 wells + 1 contingency. Full system – additional 5 wells Total = 9 28 existing platform wells (£66.1 million estimate to abandon)
Estimated Capacity 110Mt modelled. Maximum 205.8Mt (assuming limiting reservoir pressure to 122.1 bar(a) at the crest of the field)
Time of availability 40 years modelled Depth 3500m Water depth 30m
Reservoir pressure 2.69 bar(a) (expected final P 117bar (hydrostatic pressure)). Though after 40 years modelling P 90.6 bar(a).
Reservoir temp 52˚C Structural trap Fault bounded reservoir. Proven gas trap. Trapping mechanism Main – Structural Type of Aquifer, e.g depleted gas field/ DSF
Offshore storage in depleted gas reservoir (Hewett Gas Field, Southern north sea).
Lithology of reservoir L. bunter sandstone – primary target, u. Bunter also storage potential
Reservoir thickness 25m (based on av well depths) Porosity 15-30% (note – no SCAL data) Permeability 1000mD l. Bunter, 250mD u. Bunter Lithology of Caprock Primary seal for l. Bunter – Bunter Shale. Primary seal for u. Bunter
– Haisborough group (anhydrite/ dolomite/ shale.) Overlain by several clay layers
Caprock Thickness Bunter shale ~ 50m Haisborough group ~ 365m
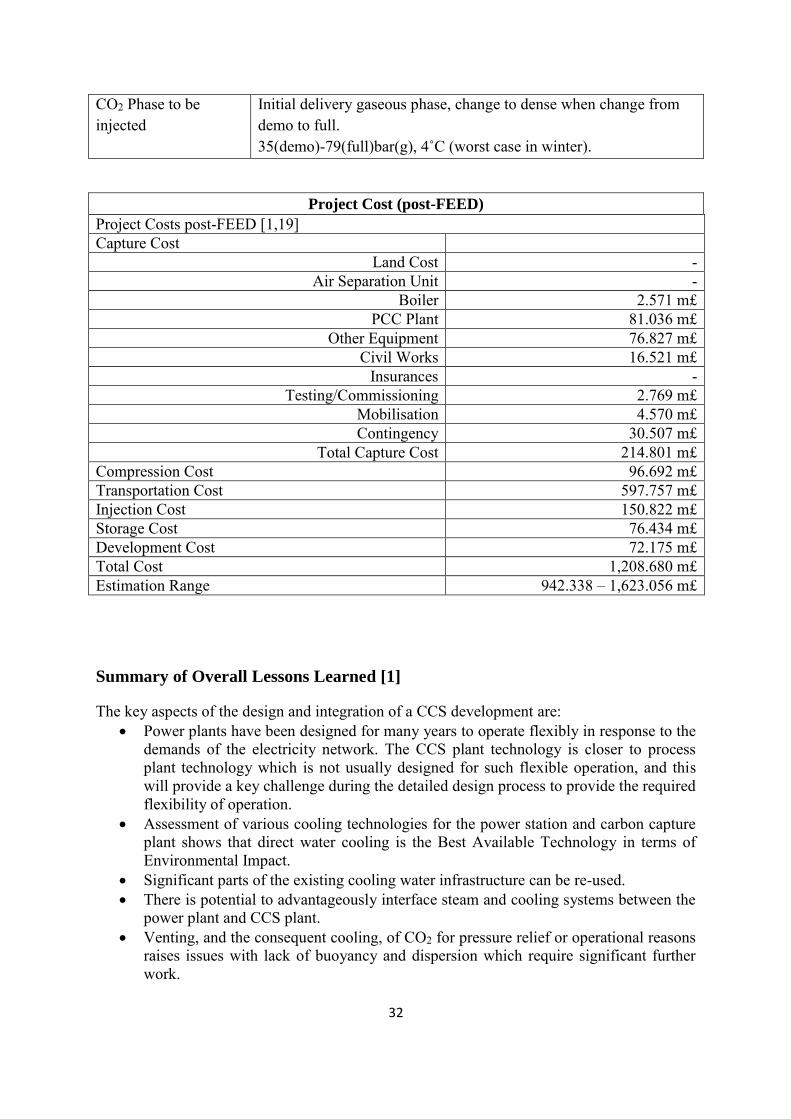
32
CO2 Phase to be injected
Initial delivery gaseous phase, change to dense when change from demo to full. 35(demo)-79(full)bar(g), 4˚C (worst case in winter).
Project Cost (post-FEED)
Project Costs post-FEED [1,19] Capture Cost
Land Cost - Air Separation Unit -
Boiler 2.571 m£ PCC Plant 81.036 m£
Other Equipment 76.827 m£ Civil Works 16.521 m£
Insurances - Testing/Commissioning 2.769 m£
Mobilisation 4.570 m£ Contingency 30.507 m£
Total Capture Cost 214.801 m£ Compression Cost 96.692 m£ Transportation Cost 597.757 m£ Injection Cost 150.822 m£ Storage Cost 76.434 m£ Development Cost 72.175 m£ Total Cost 1,208.680 m£ Estimation Range 942.338 – 1,623.056 m£
Summary of Overall Lessons Learned [1]
The key aspects of the design and integration of a CCS development are: Power plants have been designed for many years to operate flexibly in response to the
demands of the electricity network. The CCS plant technology is closer to process plant technology which is not usually designed for such flexible operation, and this will provide a key challenge during the detailed design process to provide the required flexibility of operation.
Assessment of various cooling technologies for the power station and carbon capture plant shows that direct water cooling is the Best Available Technology in terms of Environmental Impact.
Significant parts of the existing cooling water infrastructure can be re-used. There is potential to advantageously interface steam and cooling systems between the
power plant and CCS plant. Venting, and the consequent cooling, of CO2 for pressure relief or operational reasons
raises issues with lack of buoyancy and dispersion which require significant further work.

33
Quench water can be reused in the power plant should be kept separate from the desulphurisation waste water.
Molecular sieves have been selected as the most appropriate equipment for dehydration of the CO2 prior to pipeline transportation.
With the particular layout constraints of the Kingsnorth site, a split layout of the absorption and regeneration equipment is preferred over the compact layout.
The pipeline material selected and recommended is high yield strength carbon steel. The corrosion prevention strategy is to provide a high reliability drying process.
Wells that have already been abandoned using conventional methods pose a risk of eventual CO2 leakage to the surface and compromise the integrity of the CO2 store, unless they can be located and re-plugged, which may not be feasible. In the Hewett field there are five exploration wells and three redundant legs of production wells which would require remedial works to bring them up to CO2 resistant standards.
To achieve the target flow rates at all stages of the injection sink development, varying levels of pre-injection heating are required to stabilise the CO2 flowing regime.
References
No. Report Name
Document
No.
1 Key Reference Handbook 0 2 http://www.eon-uk.com/about/2758.aspx - 3 https://en.wikipedia.org/wiki/Kingsnorth_power_station -
4 CCS Demo 1 Project FEED Stage, Mervyn Wright, UK CCS Demonstration Competition FEED Studies Dissemination Event, 5th – 6th December 2011 -
5 Kingsnorth CCS Demonstration Feed 1A – Kingsnorth CCS: An Introduction, Stephen Beck, UK CCS Demonstration Competition FEED Studies Dissemination Event, 5th – 6th December 2011
-
6 Kingsnorth CCS Demonstration Feed 1A – Session 5-2: Offshore Topsides Design, Stephen Murphy, UK CCS Demonstration Competition FEED Studies Dissemination Event, 5th – 6th December 2011
-
7 Kingsnorth CCS Demonstration Feed 1A – External Environment: Consents, Kareem Askari, UK CCS Demonstration Competition FEED Studies Dissemination Event, 5th – 6th December 2011
-
8 Construction Philosophy 4.7 9 Full-chain Decommissioning and Abandonment Philosophy 4.10 10 Interface Management Philosophy 4.11 11 Utilities Philosophy 4.13 12 Design Life Philosophy 4.14 13 Whole CCS System Operating Philosophy 4.15 14 Overall Project Data 4.16 15 Overall Plant Integration Philosophy 4.30 16 CO2 Compression and Pumping Philosophy 5.2 17 Design Basis for CO2 Recovery Plant 5.4

34
18 Materials Selection for HSE Submission 6.53 19 Post-FEED Project Cost Estimates 10.14

35
CHAPTER 2: POWER PLANT
2.1 Longannet Power Station to Goldeneye Reservoir CCS Demo Project
The existing LPS is a conventional pulverised coal-fired power station comprising four adjacent sub-critical generating units rated at 600 MWe each. All units are equipped with electrostatic precipitators (ESPs) to comply with emission limits for particulates. For emissions compliance, seawater scrubbing flue gas desulphurisation (SWFGD) plants are also being installed on Units 1, 2 and 3. For Units 1 and 2 SWFGD plants are being commissioned in 2010. ScottishPower aspires to commission NOX Catalytic Reduction Technology on units 1, 2 and 3 during the summer outages in 2015, 2014 and 2013 respectively. It is proposed that NOX Catalytic Reduction Technology be in service by 1st January 2016 in order to comply with the LCP Directive 2001/80/EC requirements for NOx emissions. Unit 4 will be decommissioned in 2014 following the introduction of the Large Combustion Plant (LCP) Directive and the introduction of lower SOx emissions limits. To comply with the UKCCS Demonstration Competition (the Competition) requirements the proposed capture plant would treat flue gases from a new coal-fired supercritical unit from 2019. For the present FEED study, a new supercritical unit with a gross installed capacity of 800 MWe has been considered incorporating NOX Catalytic Reduction Technology, FGD and ESPs to meet applicable emission limit values (ELVs) [1]. Basic Overview [1]
Existing Power plant type Sub-critical pulverised coal-fired power plant
Unit capacity Four units of 600MWe each Carbon Capture Plant (CCP) On Unit 2 or Unit 3
Flue gas clean up
Electrostatic Precipitators (ESP’s)
All four generating units at Longannet are equipped with Electrostatic Precipitators (ESP’s) to comply with present emission limit values for particulates.
Sulphur recovery SWFGD on Unit 1 and 2 by end of 2010, Unit 3 by 2013 and Unit 4 by 2014.
SO2 recovery level 90%
NOx Recovery Catalytic Reduction Technology (CRT) on Units 1 2015, Unit 2 by 2014 and Unit 3 by 2013.
New Unit
New unit Supercritical Unit (2019) New unit Capacity 800MWe New unit Steam condition
275 bar(a) / 600ºC at the high pressure steam turbine inlet with reheat to 610ºC at the intermediate pressure turbine inlet.
New unit Overall Electrical Efficiency 45% (LHV)
New unit Flue gas clean up
NOX Catalytic Reduction Technology, FGD and ESPs and CCP will be applied to reach emission limit values (ELVs).

36
Ambient Conditions
Ambient conditions will vary along the length of the CCS chain with significant differences between onshore and offshore conditions [1]. Although it is difficult to specify design ambient conditions across the entire CCS chain, design ambient conditions can be specified at the Longannet Power plant:
Table 2.1 Design ambient conditions for Longannet Power Plant [1].
Design Ambient Conditions for the Longannet Site
The design ambient conditions [SP to Confirm] Ambient temperature, Design Point 8°C Ambient temperature, (above ground) Maximum 38°C Ambient temperature, (above ground) Minimum -17°C Design atmospheric pressure 1013 mbara Relative humidity range 30% - 100% Relative humidity average 80%
Design wind speed [Hold – SP to advise] Annual Rainfall [Hold – SP to advise] Design seismic case [Hold – SP to advise] Corrosive coastal environment [Hold – SP to advise]
Notes:
1. SP: Scottish Power
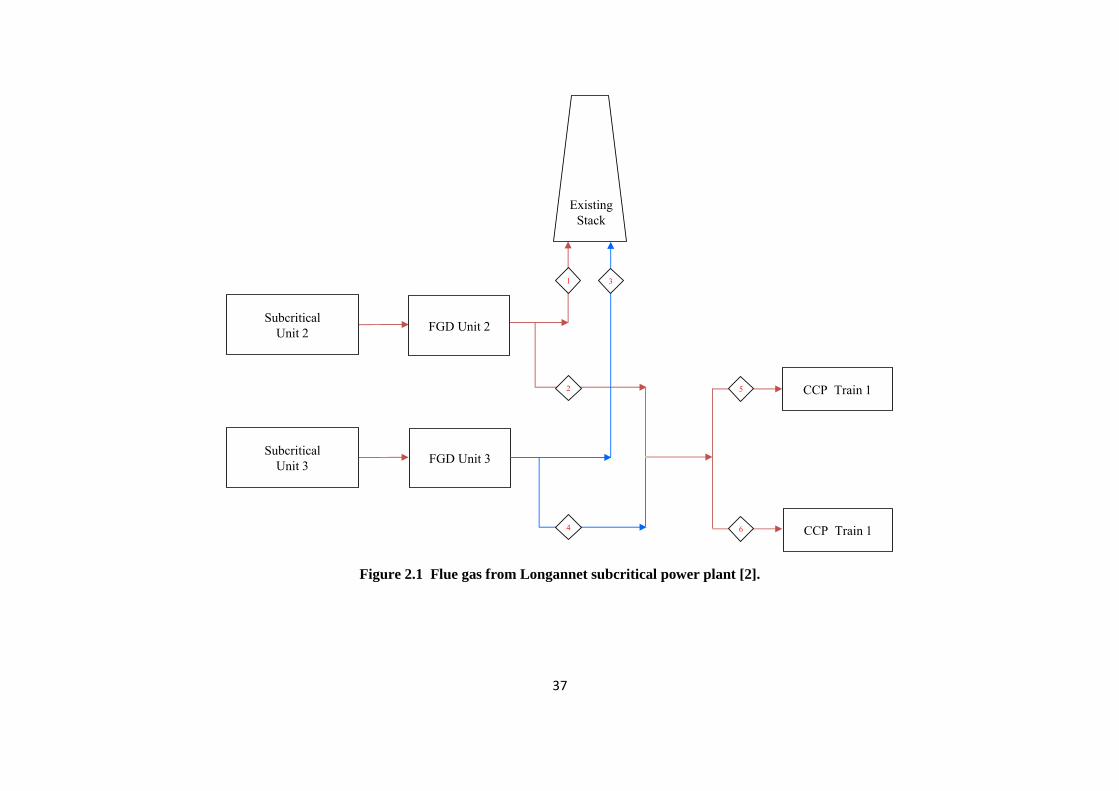
37
Figure 2.1 Flue gas from Longannet subcritical power plant [2].
SubcriticalUnit 2
SubcriticalUnit 3
ExistingStack
2
1
4
FGD Unit 2
FGD Unit 3
CCP Train 1
CCP Train 16
5
3
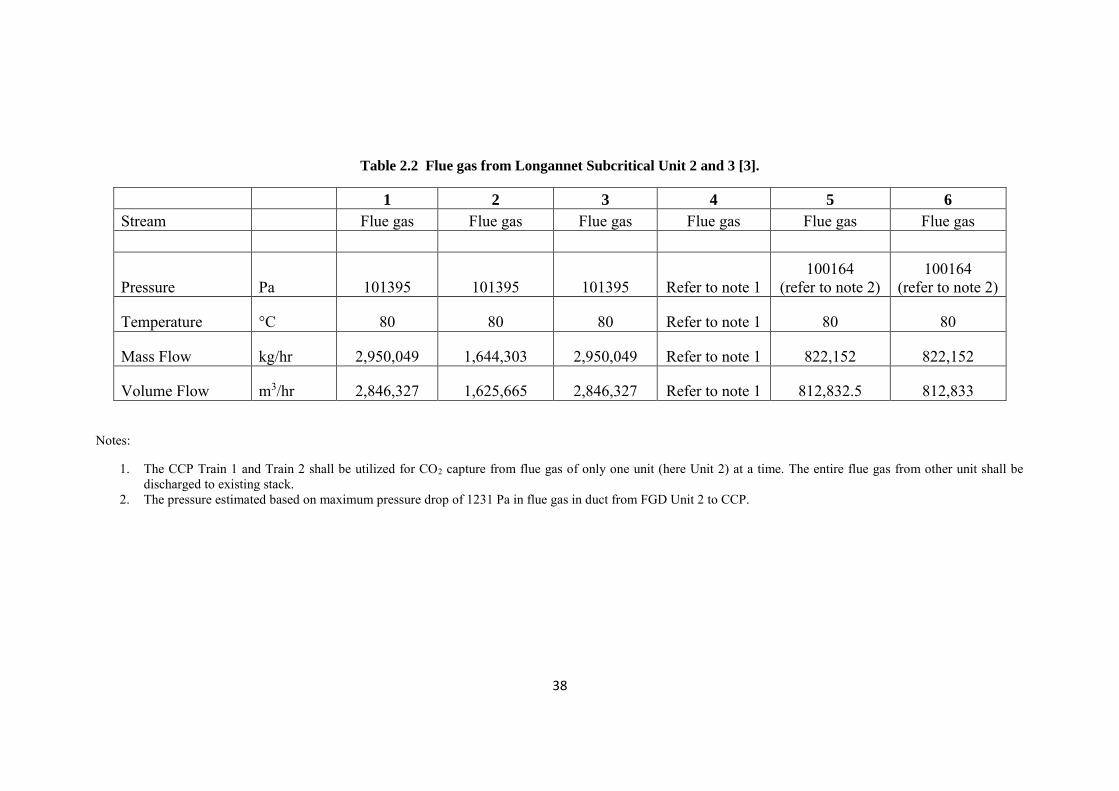
38
Table 2.2 Flue gas from Longannet Subcritical Unit 2 and 3 [3].
1 2 3 4 5 6
Stream Flue gas Flue gas Flue gas Flue gas Flue gas Flue gas
Pressure Pa 101395 101395 101395 Refer to note 1 100164
(refer to note 2) 100164
(refer to note 2)
Temperature °C 80 80 80 Refer to note 1 80 80
Mass Flow kg/hr 2,950,049 1,644,303 2,950,049 Refer to note 1 822,152 822,152
Volume Flow m3/hr 2,846,327 1,625,665 2,846,327 Refer to note 1 812,832.5 812,833
Notes:
1. The CCP Train 1 and Train 2 shall be utilized for CO2 capture from flue gas of only one unit (here Unit 2) at a time. The entire flue gas from other unit shall be discharged to existing stack.
2. The pressure estimated based on maximum pressure drop of 1231 Pa in flue gas in duct from FGD Unit 2 to CCP.

39
Figure 2.2 Flue gas from Longannet Supercritical Unit [2].
Table 2.3 Flue gas from Longannet Supercritical Unit [3].
1 2 3 4
Stream Flue gas Flue gas Flue gas Flue gas Pressure kPa Under development 101 101 101
Temperature °C Under development 80.0 80.0 80.0
Mass Flow kg/hr Under development 1,644,000 822,000 822,000
Volume Flow m3/hr Under development 1,608,988 804,494 804,494
Note:
1. 100% Flue gas shall be considered from supercritical power plant unit.
SupercriticalUnit
SuperCritical
UnitStack
2
1
CCP Train 1
CCP Train 14
3

40
Table 2.4 Untreated flue gas composition from Longannet Power Plant [1].
Untreated flue gas max. quantity
mg/Nm3 ppmv SO2 95.7 32.5 SO3 12.1 3.3 HF 1 1.1 HCl 0.1 0.1 H2S 0.05 0.017 Hg 0.0008 0.00009
NOx (NO)1 500 236 NOx (NO)2 200 94 NOx (NO2) 10 4.7 NH3 5 6.4
Notes:
1. Pre installation of selective catalytic reduction (SCR) -Assumed that SCR will be installed. NOT Required.
2. Post installation of SCR-These figures to be used.
Steam and Power Supply Plant (SPS) [1]
An independent steam and power supply (SPS) plant is included as part of the CCP design. Selection of a separate SPS for the CCP rather than integrating steam supply with the main power station was made on the basis of feasibility. Obtaining steam from a mature asset such as LPS would have involved unacceptable risks in the execution of the project. This arrangement is of particular relevance to older coal fired power stations where original design data may be limited. This arrangement could also help overcome the perceived problems of inadequate engineering resources worldwide for bespoke solutions for retrofitting to every individual power station and also the issues of warranty for major modifications to old plant.
SPS equipment
Two Gas Turbine Generator sets each equipped with a Heat Recovery Steam generator (HRSG) fitted with supplementary firing.
One back pressure Steam turbine generator set is used to reduce the steam pressure to the low pressure required by the CCP and generates further electricity to improve the overall thermal efficiency of the SPS.
One package boiler is installed. The auxiliary boiler will be used to supplement steam supply for peak demand and also to supply steam for starting up the CCP and maintaining it in the hot standby condition when the rest of the SPS is not operational.
Natural Gas Fuel LHV Input Is assumed to be 413437 kWth

41
Net Power output 120MW (taken as basis in calculation) Gas Turbine
Type Natural gas fired, Two gas turbine 47 MWe each at 50Hz, Power generation voltage 11kV by an AC generator.
Operation Operate continuously at base load, facility to operate at reduced load but turndown will be restricted by the allowable emissions levels to atmosphere.
Flue gas
At base load and reference ambient conditions the gas turbines will generate hot flue gas at a temperature of circa 544°C. From each gas turbine the hot flue gas flows to a common plant stack which is located between the gas turbine exhaust gas discharge and the inlet to the associated HRSG.
Heat Recovery Steam Generators
Type Single pressure horizontal gas path units with supplementary firing capability.
Steam HP steam at 26 bar(g) nominal pressure and 325°C.
Components
Superheater sections for superheating the steam from the high pressure (HP) steam drum.
Evaporator sections for heating the HP steam drum. Economiser sections for preheating of the inlet boiler feed water.
Feed water
Supplied from a common deaerator by a set of boiler feedwater pumps Feedwater piping system comprising a boiler feedwater control valve,
flow meter and all necessary isolations for system maintenance. From the feedwater piping, the feedwater will flow to the HP steam
drum via the economiser. The HP steam drum connected to the HRSG evaporator piping sections
for hold-up of boiler feedwater and for generation of saturated steam. The HP steam drum will include all necessary instrumentation for drum level control and boiler trip and will be provided with an appropriate relief valve for over pressure protection.
The HRSG steam drums and associated feedwater piping will be dosed with various water treatment chemicals. The selected chemicals could potentially include sodium phosphate for pH control, carbohydrazide as an oxygen scavenger and amine for corrosion protection.
Steam piping
HRSG superheater acts to raise the steam temperature and includes a de-superheater spray for injection of boiler feed water for final steam temperature control.
The subsequent HP steam piping will include a steam flow meter, start-up vent, non-return valve, boiler motorised stop valve, over pressure relief valve and appropriate isolations.
Blowdown system
Continuous and intermittent blowdown from the HRSG is discharged to an atmospheric blowdown tank where it is cooled directly with potable water prior to discharge to a blowdown sump.
The blowdown tank will also receive condensate and flash steam from adjacent steam trapping systems and warm up lines.
The flash steam is discharged to atmosphere at a safe location via a suitable vent.

42
Steam Turbine Generator
Capacity 30642 kW
Steam source
The steam turbine will receive HP steam generated from each HRSG. Reduce HP steam (24 bar(g) and 320°C allowing for HP steam header
temperature and pressure losses) to LP steam at the exit of the steam turbine.
Base load Discharge steam conditions will be circa. 165°C at 5.3 bar(a). This
provides a degree of margin for subsequent supply of steam to the CCP at a nominal pressure of 4.8 bar(a) and a temperature of 160°C.
Reduced Load Discharge steam temperature will be higher and will require de-superheating to meet the requirements of the CCP.
Output Produce additional electrical power at 50 Hz driving an 11kV generator
High Pressure (HP) Steam
From each HRSG’s is either routed to a common HP steam header which subsequently supplies the Steam Turbine or via bypass Pressure Reduction De-superheater Stations (PRDS) which conditions the steam for supply directly to the LP steam header.
HP steam header
Includes a start-up vent valve, a steam flow meter at the inlet to the steam turbine and all the necessary manual and motorised isolations to facilitate system operation.
Pressure Reduction De-superheater Stations (PRDS)
Separate bypass PRDS are provided from each HRSG. The bypass PRDS, which are installed in a duty / standby configuration (2 x 100%) are provided for both start-up of the HRSG prior to supply of steam to the Steam Turbine or as Steam Turbine bypass stations. Each bypass PRDS comprises a pressure reduction valve and a downstream de-superheater section which is supplied with spray water for steam de-superheating.
Medium Pressure (MP) Steam
MP steam at 10.5 bar(a) pressure and due to CCP steam demand is intermittent the MP steam header is also the source of deaeration steam for deaerator.
In normal plant operation the MP steam will be provided from the HP steam header via a single PRDS.
Alternatively MP steam can be supplied from the Auxiliary Boiler.
Low Pressure (LP) Steam
LP steam at 4.8 bar(a) and 160°C. CCP steam demand up to345 t/h but designed with a 10% LP steam
flow margin giving a potential supply of up to379 t/h to ensure that the CCP steam demand can be met under all envisaged operating scenarios.
In normal plant operation the LP steam will be provided from the exhaust of the Steam Turbine.
Alternatively LP steam can be supplied from any of the HP to LP steam bypass PRDS (4 off 2 per HRSG) or from the MP to LP bypass PRDS.
Auxiliary Boiler
Capacity Anticipated circa 60 t/h for warm-up and maintaining shortfalls in steam supply
Fuel The auxiliary boiler will be fired on natural gas at a gas pressure anticipated to be of the order of < 100 mbar(g). At 60t/h, 4.5 t/h natural gas is required
pH control As with the HRSGs, the auxiliary boiler and associated piping will be
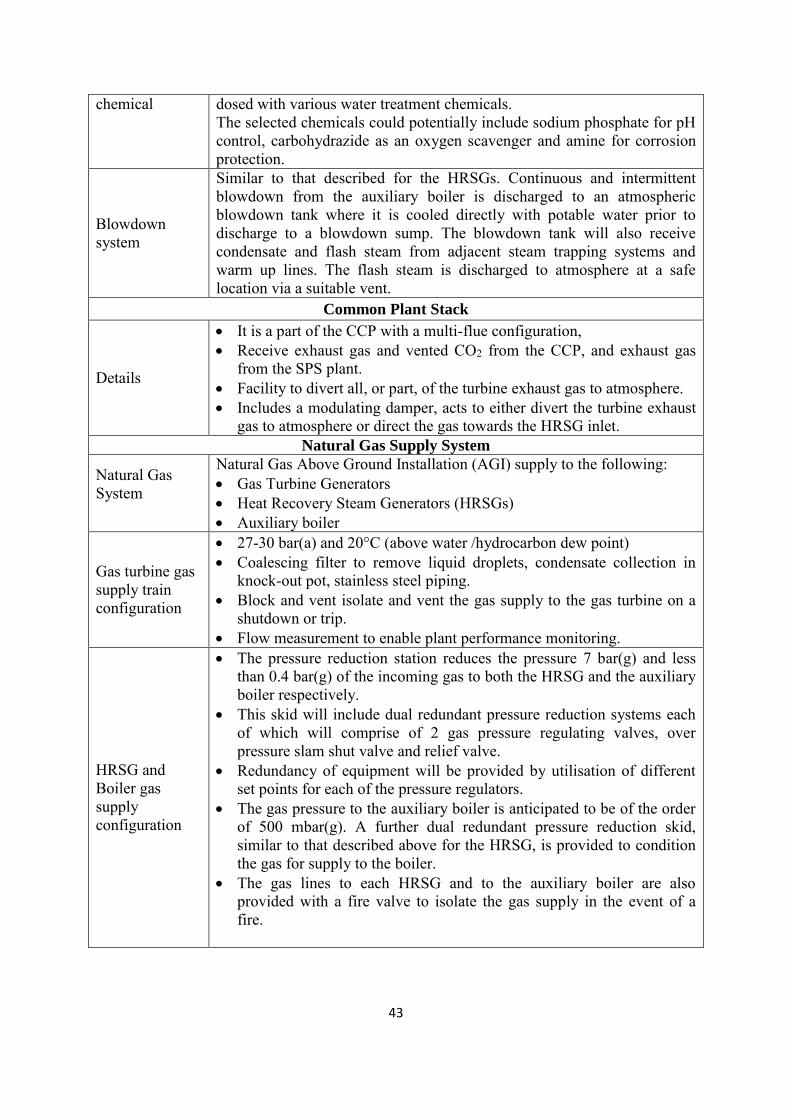
43
chemical dosed with various water treatment chemicals. The selected chemicals could potentially include sodium phosphate for pH control, carbohydrazide as an oxygen scavenger and amine for corrosion protection.
Blowdown system
Similar to that described for the HRSGs. Continuous and intermittent blowdown from the auxiliary boiler is discharged to an atmospheric blowdown tank where it is cooled directly with potable water prior to discharge to a blowdown sump. The blowdown tank will also receive condensate and flash steam from adjacent steam trapping systems and warm up lines. The flash steam is discharged to atmosphere at a safe location via a suitable vent.
Common Plant Stack
Details
It is a part of the CCP with a multi-flue configuration, Receive exhaust gas and vented CO2 from the CCP, and exhaust gas
from the SPS plant. Facility to divert all, or part, of the turbine exhaust gas to atmosphere. Includes a modulating damper, acts to either divert the turbine exhaust
gas to atmosphere or direct the gas towards the HRSG inlet. Natural Gas Supply System
Natural Gas System
Natural Gas Above Ground Installation (AGI) supply to the following: Gas Turbine Generators Heat Recovery Steam Generators (HRSGs) Auxiliary boiler
Gas turbine gas supply train configuration
27-30 bar(a) and 20°C (above water /hydrocarbon dew point) Coalescing filter to remove liquid droplets, condensate collection in
knock-out pot, stainless steel piping. Block and vent isolate and vent the gas supply to the gas turbine on a
shutdown or trip. Flow measurement to enable plant performance monitoring.
HRSG and Boiler gas supply configuration
The pressure reduction station reduces the pressure 7 bar(g) and less than 0.4 bar(g) of the incoming gas to both the HRSG and the auxiliary boiler respectively.
This skid will include dual redundant pressure reduction systems each of which will comprise of 2 gas pressure regulating valves, over pressure slam shut valve and relief valve.
Redundancy of equipment will be provided by utilisation of different set points for each of the pressure regulators.
The gas pressure to the auxiliary boiler is anticipated to be of the order of 500 mbar(g). A further dual redundant pressure reduction skid, similar to that described above for the HRSG, is provided to condition the gas for supply to the boiler.
The gas lines to each HRSG and to the auxiliary boiler are also provided with a fire valve to isolate the gas supply in the event of a fire.
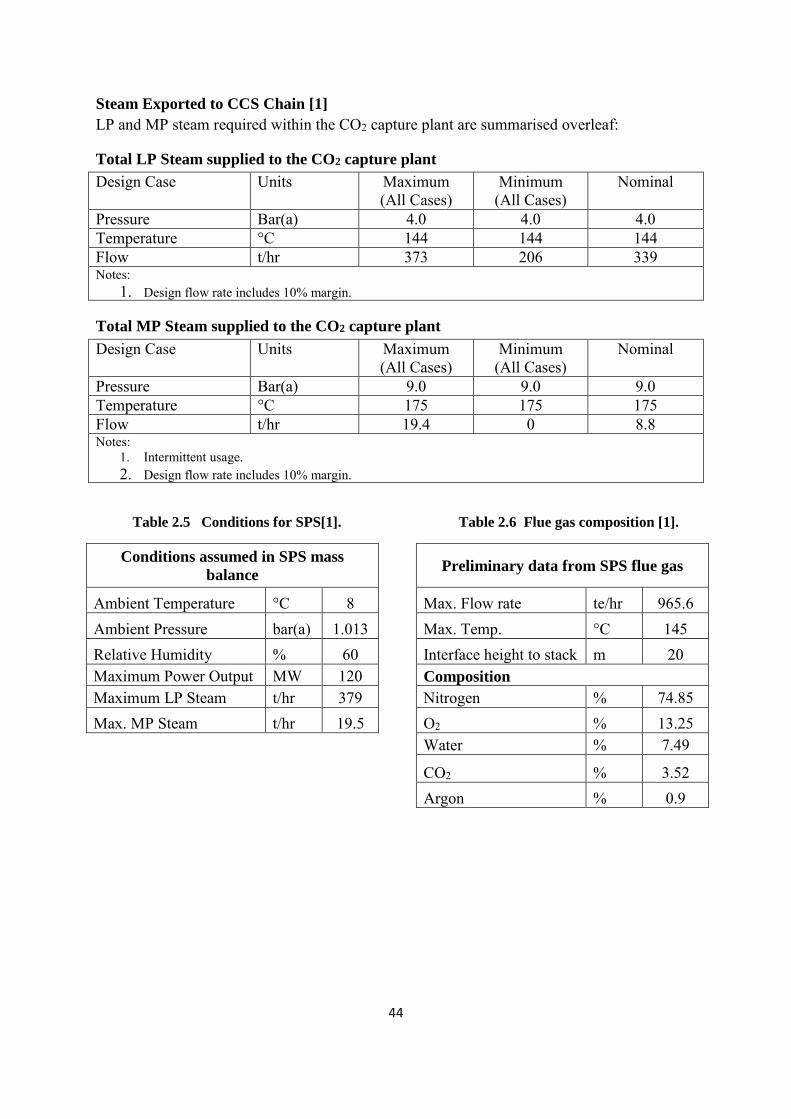
44
Steam Exported to CCS Chain [1]
LP and MP steam required within the CO2 capture plant are summarised overleaf:
Total LP Steam supplied to the CO2 capture plant
Design Case Units Maximum (All Cases)
Minimum (All Cases)
Nominal
Pressure Bar(a) 4.0 4.0 4.0 Temperature °C 144 144 144 Flow t/hr 373 206 339 Notes:
1. Design flow rate includes 10% margin.
Total MP Steam supplied to the CO2 capture plant
Design Case Units Maximum (All Cases)
Minimum (All Cases)
Nominal
Pressure Bar(a) 9.0 9.0 9.0 Temperature °C 175 175 175 Flow t/hr 19.4 0 8.8 Notes:
1. Intermittent usage. 2. Design flow rate includes 10% margin.
Table 2.5 Conditions for SPS[1]. Table 2.6 Flue gas composition [1].
Conditions assumed in SPS mass
balance
Preliminary data from SPS flue gas
Ambient Temperature °C 8
Max. Flow rate te/hr 965.6 Ambient Pressure bar(a) 1.013
Max. Temp. °C 145
Relative Humidity % 60
Interface height to stack m 20 Maximum Power Output MW 120
Composition
Maximum LP Steam t/hr 379
Nitrogen % 74.85 Max. MP Steam t/hr 19.5
O2 % 13.25
Water % 7.49
CO2 % 3.52
Argon % 0.9
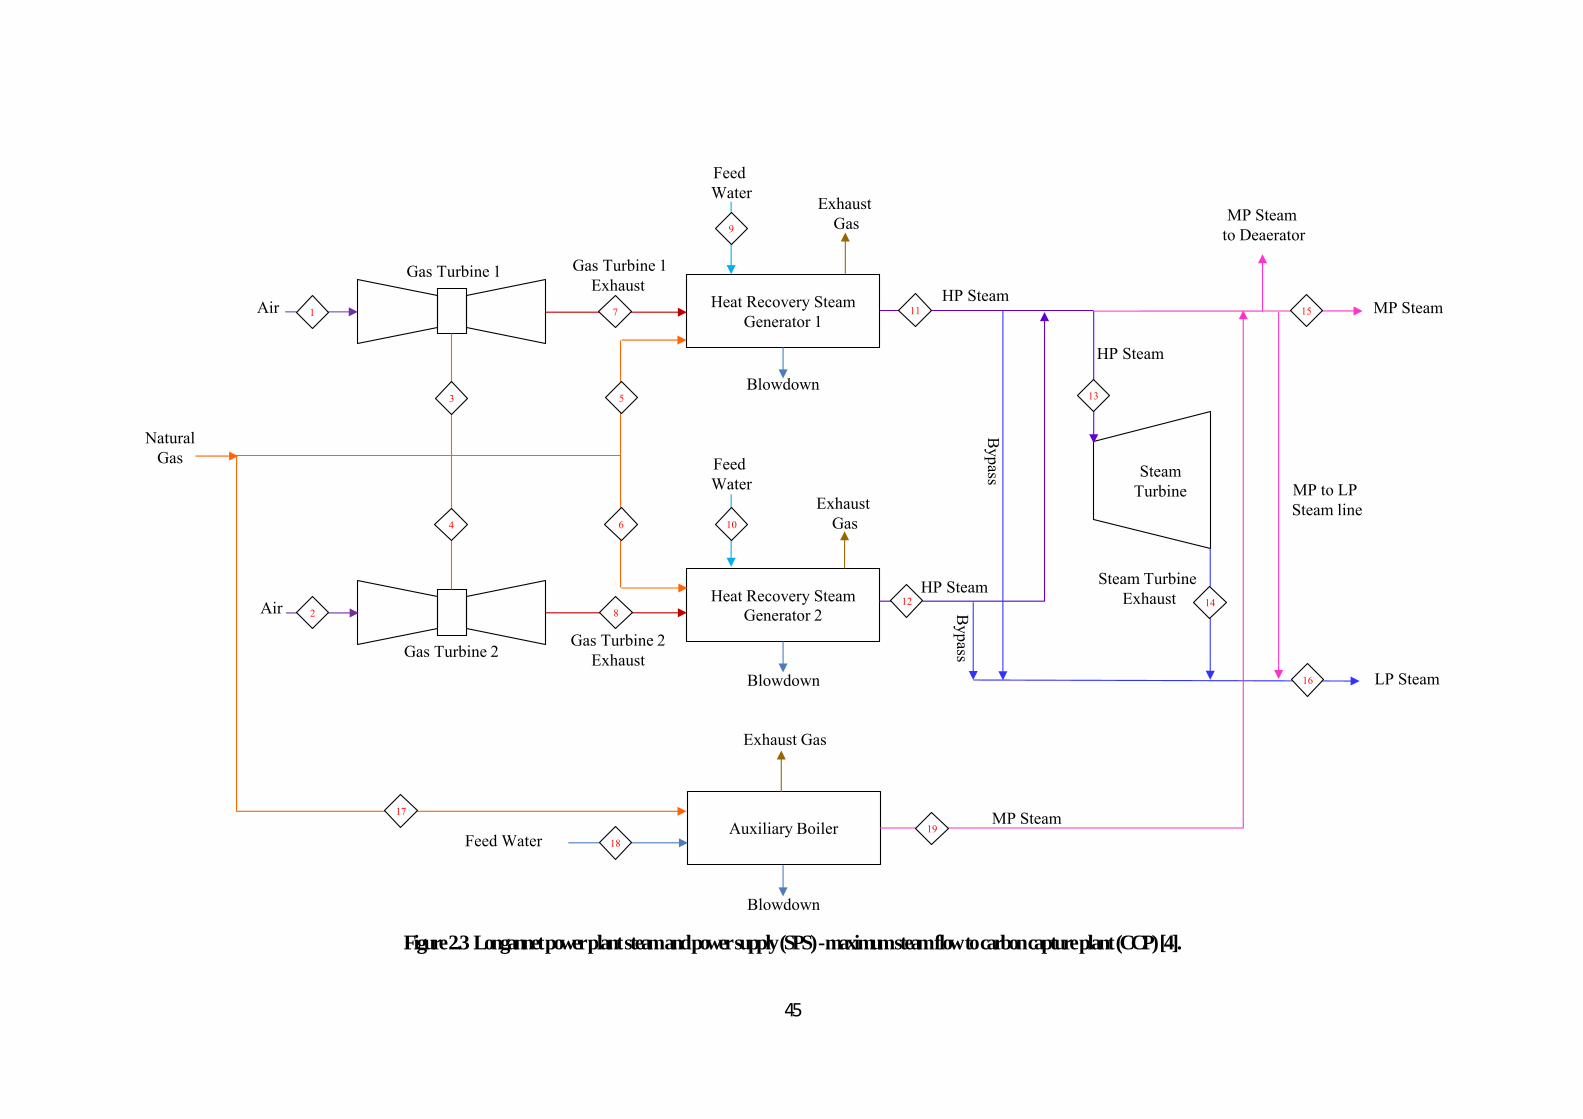
45
Figure 2.3 Longannet power plant steam and power supply (SPS) - maximum steam flow to carbon capture plant (CCP) [4].
Blowdown
MP Steam
LP Steam
Heat Recovery Steam Generator 1
Heat Recovery Steam Generator 2
Steam Turbine
Air
Air
Natural Gas
Gas Turbine 1
Gas Turbine 2
Exhaust Gas
Exhaust Gas
Auxiliary Boiler
Blowdown
Blowdown
Feed Water
Exhaust Gas
Gas Turbine 1Exhaust
Gas Turbine 2 Exhaust
Feed Water
Feed Water
MP Steam to Deaerator
MP Steam
MP to LP Steam line
Steam Turbine Exhaust
HP SteamB
ypass
Bypass
HP Steam
3
4
1
2
7
8
6
5
17
18
10
9
11
19
15
16
13
1412
HP Steam

46
Table 2.7 Longannet Steam and Power Supply Unit Heat Mass Balance of Maximum Steam Flow to CCP Plant [4].
1 2 3 4 5 6 7 8 9
Stream
Air to Gas
Turbine 1
Air to Gas
Turbine 2
Natural Gas to
Gas Turbine
1
Natural Gas to
Gas Turbine
2
Natural Gas to
HRSG 1
Natural Gas to
HRSG 2
Gas Turbine
1 Exhaust
Gas Turbine
2 Exhaust
Feed Water to HRSG 1
Operating Pressure Bara 1.01 1.01 30.8 30.8 8 8 1.04 1.04 27.83
Operating Temperature °C 8 8 5 5 5 5 546 546 139 Mass Flow t/h 469.1 469.1 9.9 9.9 6.1 6.1 479 479 200.5
10 11 12 13 14 15 16 17 18 19
Stream
Feed Water to HRSG 2
HP Steam from
HRSG 1
HP Steam from
HRSG 2
HP Steam to
Steam Turbine
Steam Turbine Exhaust
MP Steam to
CCS
LP Steam to
CCS
Natural Gas to
Auxiliary Boiler
Feed Water to Auxiliary
Boiler
MP Steam from
Auxiliary Boiler
Operating Pressure Bara 27.83 26 26 24 5.3 10.5 4.8 TBC 30 10.5 Operating Temperature °C 139 325 325 320 161 192 160 5 139 192
Mass Flow t/h 200.5 198.5 198.5 397 379 379 379 0 (Note
1) 20.2 0.9 Note:
1. Auxiliary boiler is sized to produce a maximum steam flow of 60t/hr for warm-up and maintaining shortfalls in steam production. At 60t/hr, 4.5t/hr of Natural gas is required.

47
Revision of the Steam and Power Supply Electrical Connection [1]
The steam and power supply (SPS) provides both process steam, used during the carbon capture process to release CO2 from the amine to which it is bonded, and electrical energy to power the Carbon Capture Plant, compressors and associated auxiliary plant infrastructure at Longannet Power Station. In addition there is a requirement to import electrical power to the SPS and Carbon Capture Plant both to supply minor auxiliaries during standby conditions and also to start-up the SPS. The Outline Solution for electrical tie-in between the SPS and Longannet Power Station proposed an interconnection from the SPS to the Longannet Power Station 11 kV distribution system. Further analysis of the solution during FEED identified that this solution would impose unacceptable operational constraints on the existing LPS operations but that a tie-in to Longannet’s 275 kV sub-station would be a possible alternative. ScottishPower will also provide a power supply to National Grid’s Longannet AGI.
The impacts of changing the connection from 11 kV to 275 kV was more expensive than the 11 kV connection but this was countered by a number of positive aspects, including a simpler technical design, the risk associated with the 275 kV design was lower as more of the design parameters were known compared with the 11 kV, more clearly defined interfaces and operation of the assets more straightforward. Also limited or minimal modifications would be required to the operating procedures at Longannet Power Station.
Longannet Power Station Utilities tie-ins and their management [1]
The CCP and its associated SPS Plant require various utilities to operate, as well as a source of CO2. In general the operation philosophy of the CCP is that it will be operated separately from the main station. However, due to the CCP being cited in the vicinity of the source of CO2 (at LPS) it is beneficial to ‘share’ utility supplies (where possible) rather than create or source new ones. Natural Gas (supply to CCP)
Aker Solutions and Aker Clean Carbon confirmed through the FEED that there is sufficient capacity for a supply of natural gas to the CCP as well as the maximum demand of LPS.
Flue Gas (supply to CCP)
A portion of the flue gas from either existing sub-critical Unit 2 or Unit 3 will be supplied to the CCP with the remaining portion exiting via the existing stack. To run both capture plant trains at 100% load and ensure an excess amount of flue gas up the existing stack the load on the unit supplying the flue gas is to be greater than 363MWe. The CCP connected unit will be 'first on' and 'last off', with the Minimum Stable Generation (MSG) figure for the CCP connected unit to be 363MWe to reduce the risk that the forecast CO2 capture profile will not be achieved. During LPS shutdown partially or all flue gas will exit via the existing stack and the CCP is isolated through a damper arrangement. To mitigate the risk of the low availability of flue gas from LPS due to forced outages (aged assets), it is proposed to connect multiple units to the CCP (i.e. unit 2 and unit 3), introduce a station longevity works package including preventative maintenance to allow the operation of the existing units beyond their normal design life, and bringing forward CAPEX spend

48
to do this. Flue Gas Desulphurisation (FGD) and NOx reduction technology (NRT) are not yet commissioned and full operation of these and any associated effects on CCP operation are not yet fully understood. Following mitigation measures have been outlined when FGD and NRT will be in full operation: FGD: Performance of FGD will be monitored once commissioned, and if
necessary the flue gas pretreatment section (the DCC) at the CCP will be adjusted accordingly.
NRT: The influence of nitrogen oxide (NOx) levels on the CCP will be investigated, and performance of NRT will be monitored once commissioned.
Cooling Water (supply to CCP and discharge from CCP)
The cooling water (CW) supply for the SPS and CCP plant will be from the existing CW system comprises of four intake bays which are separated from the Firth of Forth using stoplogs. CW discharge from CCP unit will be into the existing LPS flume which currently handles the CW discharge from the four LPS unit condensers and the seawater FGD intake and discharge flows.
Potable Water (supply to CCP)
A potable water supply required by the CCP, it is proposed to take this supply from the existing LPS townswater supply downstream of the townswater pumping station.
Demineralised Water (supply to CCP)
The existing demineralised water system has insufficient capacity within the system to supply the CCP during the case of a boiler-fill. Hence, a holding tank arrangement has been designed into the CCP which will enable a continuous supply of demineralised water to be provided to the CCP. Therefore, tying-in to the existing demineralised water system will not impact either LPS or CCP operation.
Electrical (supply to and from CCP)
The CCP will interface with LPS in the form of a local electrical supply from the existing LPS 11kV ring main and a 275kV connection at the 275kV substation (which is owned and operated by SP Energy Networks).
Fire Fighting Water Supply
CCP would have a stand-alone fire protection and fighting system, rather than tie-in to the existing LPS system.
The risks associated with physically tying-in to any live systems at a working power station include poor interface management during the construction phase, damage to existing assets and problems with tie-in locations including poor accessibility, poor condition of existing assets and contamination (e.g. asbestos and lead paint and the timing of tie-ins to live systems). A number of mitigation measures have been outlined for these risks, which include the following:
The CCS project will involve working closely with LPS operations to ensure that programme milestones and the consequences of delays are understood by all parties
A coordinated tie-in and interface plan will be developed The programme will be developed to integrate tie-ins and permitting to minimise
disruption to both construction activities and plant operations; key dates will be agreed by the relevant parties
Seek to include sufficient float within the programme to accommodate some slippage in the tie-in events with the live plant

49
All construction work will be managed in a coordinated and safe way in accordance with defined processes and the agreed programme
Day to day permitting will be coordinated with the station operating team to minimise delays.
The use of appropriately qualified and experienced contractors is key, working to defined safe systems of work
Contactor works will be managed to reduce the likelihood of accidents / unplanned incidents
Float will be included within the programme for addressing contamination at tie-in locations, and specialist asbestos contractors will be employed as required to safely remove asbestos
Summary [5]
Using existing facilities has been a challenge as there were existing constraints at the site such as cooling water availability. This had to be matched with what is required by the Carbon Capture Plant (CCP) and the Steam and Power Supply (SPS) by working with both the power station engineers and the contractor to agree a way forward. This activity has been complicated by the fact that the FEED design has developed and service requirements have been less well understood at the commencement of FEED than would be expected for a conventional project.
There has been less power plant integration proposed than for new build CCS projects. The Consortium approach is better suited for retrofit of CCS, but needs to take account of the existing constraints. The main issue was identified as being the steam supply for the CCP.
1. New-build projects will have more flexibility in terms of the available design options
(e.g. pre/post combustion CCS technology) but this will only be the case once the CCP technology is commercially available with matching boiler and turbine designs developed for an integrated power plant / CCS solution.
2. The footprint of the CCP has almost doubled over the course of the project. Future developers should not underestimate the footprint requirements of the process plant. In particular this involves the following:
The increase in size has been associated with a better understanding of the equipment design, operations and maintenance requirements. It is also associated with the fact that this is a demonstration project and the plant has not been optimised for size but rather for flexibility in terms of access and being able to change out equipment if required as the technology develops or if the equipment does not operate as planned.
Whilst it would have been possible to reduce the footprint, the associated costs would increase due to the increased complexity of delivering to a smaller area. Standard layout information for conventional power plant power islands have been developed and optimised over a number of years. While this could also be achieved over time for CCS projects, it is unrealistic to expect ‘First of a Kind’ layouts to be fully optimised.

50
Across the various feasibilities on other CCS projects, it is apparent that there is a common misunderstanding about the general footprint requirement for carbon capture technology. This is possibly due to consideration of CCP requirements only and not all the associated auxiliary services which are also required, for example cooling, demineralised, potable and fire fighting water.
3. CCP operation should first be understood under base load conditions before seeking to demonstrate flexibility.
4. CCP power and steam supply from the existing power plant may be not be the preferred solution for a retrofit demonstration project.
5. The Mobile Test Unit results have shown that the CCP output is cleaner than anticipated and therefore an Effluent Treatment Plant is not required.
References
No. Report name
1 SP-SP 6.0 - RT015 FEED Close Out Report 2 UKCCS - KT - S7.9 - OS – 001 Outline Solution Process Flow Diagrams 3 UKCCS - KT - S7.11 - OS – 001 Outline Solution Heat and Mass Balance 4 UKCCS - KT - S7.8 - ACC - 001 Aker Clean Carbon Process Flow Diagrams 5 UKCCS - KT – S12.0 - FEED- 001 Lesson Learned Report

51
2.2 Kingsnorth CCS Demonstration Project
E.ON's existing coal-fired power station at Kingsnorth, on the Medway Estuary in Kent, is reaching the end of its life and is due to close under the Large Combustion Plants Directive. E.ON has submitted plans to replace it with a new, high efficiency, supercritical, coal-fired power plant. The new plant is designed to include a commercial scale carbon dioxide (CO2) capture demonstration plant using the best available technology. The carbon dioxide capture and compression plant itself consumes a significant amount of power reducing the overall plant efficiency and output. The CCS demonstration will be integrated into the overall design to give maximum overall efficiency for the abated power plant.
Basic Overview [1,2,3,4,7,8,10,14,15,16,18,19,23]
Existing power plant Unit 1 – 4
Type Subcritical coal-fired power plant Unit capacity 4x 500 MWe CCS application No Expected closure 2013-2015 Flue gas clean-up
Flue gas
428.85 kg/s (47.3% of the flue gas will be extracted from the ductwork downstream of the FGD absorber Unit 5 and will be treated in the CCP)
New unit flue gas clean up ESP, SCR & FGD
SOx recovery n.s. NOx recovery n.s. New power plant Unit 5 & 6
Type Supercritical coal-fired power plant New unit capacity 2x 800 MWe Power output 840 MW Auxiliary power 102 MW Net output 733 MW CCS application To Unit 5 for demo period of 15 years Predominant operation Base load at 100% MCR
Fuel supply 73.3 kg/s New unit steam condition (without CCS)
HP: 652.8 kg/s at 600°C, 286.5 bar(a) IP: 537.7 kg/s at 619°C, 56 bar(a) LP: 488.0 kg/s at 231°C, 2.33 bar(a)
New unit overall electrical efficiency
45% (LHV, without CCS) 40% (with CCS)
National grid reference TQ811720
Grid connection 400 kV air insulated Stack height 198 m Max cooling water 4 500 000 m3/d

52
mass flow Max cooling water temperature increase 8K
C&I design Separate bus network per unit and a separate bus network for the common services
Interface with old Units 1-4
Re-use of infrastructure: Cooling water system Office buildings Demolition debris Existing underground structures (e.g. culverts, pipes and cables)
Design life 25 years
Normal shutdown 20-30 min (at -5%MCR/min) CO2 will be delivered to CCP within this period at decreasing quantity (decreasing to 0)
Emergency shutdown < 1 min CO2 will be delivered to CCP only for a short follow-up time
CCS sludge co-firing
Results of impact assessment: CCS sludge can be disposed of without any significant
implications on boiler performance and emissions Need to be permitted as a hazardous waste co-incinerator and to
comply with the WID requirements Additional installations required for sludge transport and
emissions monitoring
CHP feasibility No industrial, residential or public consumers identified who would provide an attractive return on investment
Table 2.8 Site conditions and climatic data for Kingsnorth Power Station [24]
Site conditions Kingsnorth
Max. design temperature 29.8°C Min. design temperature - 5.5°C Average design temperature Not specified (n.s) Average pressure 1,013 mbar(a) Max. hourly relative humidity 100% Min. hourly relative humidity 26% Average of hourly relative humidity 77% Max. rainfall 148 mm/month Average rainfall 55 mm/month Design wind speed n.s Design seismic n.s. Soil conditions n.s. Provision for winterization required

53
Mass and Heat Balances
Figure 2.4 Block flow diagram for Kingsnorth
Table 2.9 Summarised process data [17]
1 2 3 4 5 6 7 8 9
Stream Flue gas
Flue gas
Flue gas
Flue gas
Flue gas
Flue gas
Flue gas
Flue gas
Flue gas
Temperature °C 120.0 129.8 85.6 47.4 47.4 47.4 32.0 89.9
Mass Flow kg/s 871.0 861.2 861.2 874.3 428.91 453.5 326.9 780.4 780.4 Note:
1) 2% air ingress taken into account, 420.8 kg/s without
Basis for all balances calculated is Kleinkopje coal, the design coal for Kingsnorth 5&6. The block flow diagram in the figure above shows the different process streams investigated. The process data are summarised in the table above referring to the numbers in the block diagram.
Design Case [17]:
Fuel heat input: 1826 MW (100.0 %) Captured CO2: 6600 t/d (100.0 %) Heat Integration: No
Steam System Design
The steam system of the power plant consists of the boiler, the turbine with its internal IP and LP pressure system and the relevant parts of the CCS plant. For start-up purposes and as long
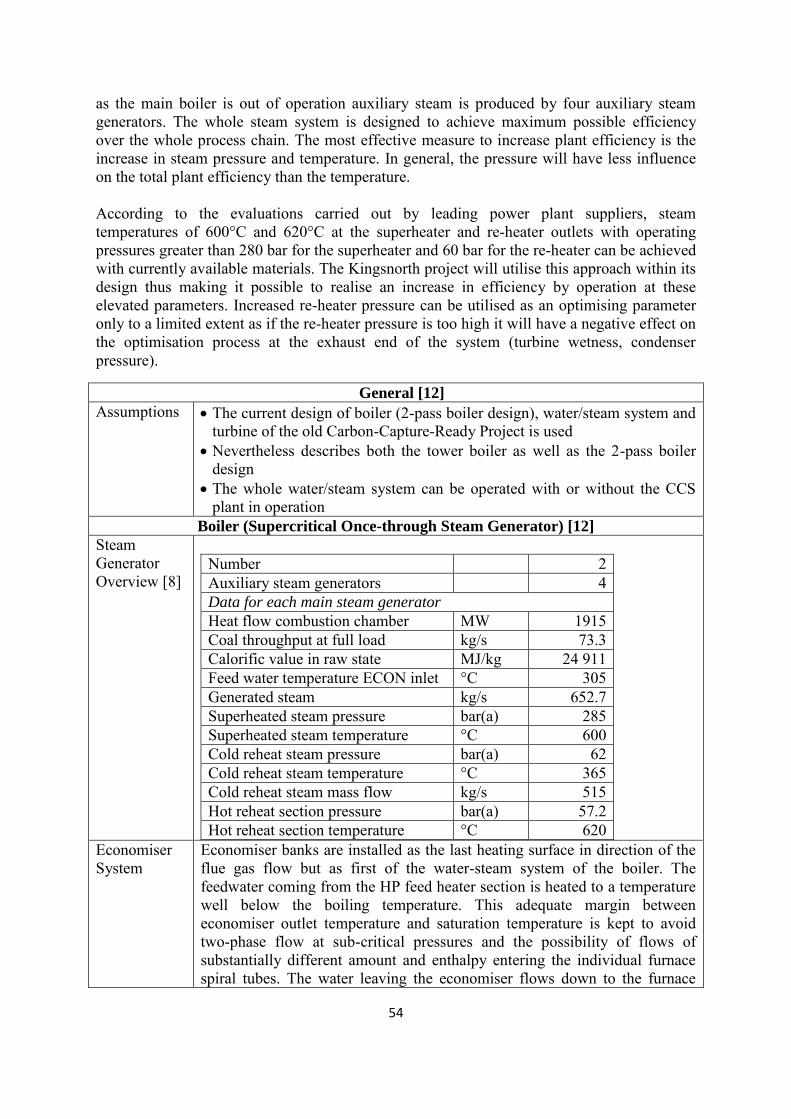
54
as the main boiler is out of operation auxiliary steam is produced by four auxiliary steam generators. The whole steam system is designed to achieve maximum possible efficiency over the whole process chain. The most effective measure to increase plant efficiency is the increase in steam pressure and temperature. In general, the pressure will have less influence on the total plant efficiency than the temperature. According to the evaluations carried out by leading power plant suppliers, steam temperatures of 600°C and 620°C at the superheater and re-heater outlets with operating pressures greater than 280 bar for the superheater and 60 bar for the re-heater can be achieved with currently available materials. The Kingsnorth project will utilise this approach within its design thus making it possible to realise an increase in efficiency by operation at these elevated parameters. Increased re-heater pressure can be utilised as an optimising parameter only to a limited extent as if the re-heater pressure is too high it will have a negative effect on the optimisation process at the exhaust end of the system (turbine wetness, condenser pressure).
General [12]
Assumptions The current design of boiler (2-pass boiler design), water/steam system and turbine of the old Carbon-Capture-Ready Project is used
Nevertheless describes both the tower boiler as well as the 2-pass boiler design
The whole water/steam system can be operated with or without the CCS plant in operation
Boiler (Supercritical Once-through Steam Generator) [12]
Steam Generator Overview [8]
Number 2 Auxiliary steam generators 4 Data for each main steam generator
Heat flow combustion chamber MW 1915 Coal throughput at full load kg/s 73.3 Calorific value in raw state MJ/kg 24 911 Feed water temperature ECON inlet °C 305 Generated steam kg/s 652.7 Superheated steam pressure bar(a) 285 Superheated steam temperature °C 600 Cold reheat steam pressure bar(a) 62 Cold reheat steam temperature °C 365 Cold reheat steam mass flow kg/s 515 Hot reheat section pressure bar(a) 57.2 Hot reheat section temperature °C 620
Economiser System
Economiser banks are installed as the last heating surface in direction of the flue gas flow but as first of the water-steam system of the boiler. The feedwater coming from the HP feed heater section is heated to a temperature well below the boiling temperature. This adequate margin between economiser outlet temperature and saturation temperature is kept to avoid two-phase flow at sub-critical pressures and the possibility of flows of substantially different amount and enthalpy entering the individual furnace spiral tubes. The water leaving the economiser flows down to the furnace

55
water walls which act as an evaporator. Furnace Waterwalls
The furnace water wall’s are of membrane panel construction. High pressure water from the economizer is passed down a single large-bore down comer to the bottom of the boiler. From there, interconnecting pipes run, one to the front of the boiler and one to the rear of the boiler. Each of the inter-connecting pipes has further pipes through which water is passed to the two inlet headers supplying the furnace spiral tubes, one at the front and one at the rear of the boiler. Compared with a natural circulation boiler, the flow area required for a once-through boiler is less. A suitably high mass flux is achieved by small diameter tubes arranged in a spiral around the perimeter of the furnace. The higher the mass flux, the lower the elevation in metal temperature due to boiling transition. The spiral arrangement enables close pitching of adjacent tubes for effective heat removal with a relatively small number of tubes around the perimeter of the furnace. The spiral arrangement also encourages an even distribution of heat pick-up in each tube.
Superheater System
The superheater is usually arranged in a number of stages, i.e. as a primary, secondary, tertiary and a final superheater. Dry steam flows from the separator vessels to the primary superheater which is often designed as support tubes for other convection heating surfaces and, in case of a two-pass boiler, they also form the walls of the rear gas pass. The steam leaves the primary superheater outlet headers in four streams which pass through their respective first stage attemperators and cross over to the other side of the boiler to feed the secondary superheater. The secondary superheater, as well as the final superheater, can be designed as platen pendant heating surface (in case of 2-pass design) or as tube bundles (for a tower boiler), subject of final supplier design chosen. The steam leaves the outlet manifolds of the secondary superheater in four streams – independent of supplier design, each of which passes through its own second stage attemperator and crosses to the other side of the boiler to feed the final superheater inlet manifolds. The steam passes through the final superheater in a parallel flow arrangement. Austenitic steel is used for the high temperature superheater tubes to provide adequate resistance to scaling. Steam leaves the final superheater outlet manifolds as four streams and enters the high-pressure main steam pipework. The temperature of the superheater steam in once-through mode is a function of the fuel/water flow ratio and the attemperator flow is normally set at a fixed percentage of the steam flow. The attemperators provide rapid trimming control of steam temperature during load changes. Water is injected through nozzles and evaporates due to the temperature in the surrounding steam thus cooling down the whole to produce the desired steam temperature. The spray water is extracted from a point between the final HP heater and the economiser inlet. The temperature of the spray water is therefore equal to the economiser inlet water temperature.
Reheater System
The re-heater is arranged in two stages comprising a final stage pendant section located in the vestibule area and primary stage horizontal serpentine banks located in the rear gas pass in case of a 2-pass boiler. In case of a tower boiler both re-heater stages are horizontal serpentine banks located in the first pass. A cross-over is incorporated between the primary and final

56
stages. The final stage re-heater surface is in parallel flow to the gas so that the section with the hottest steam is in the cooler gas stream, thereby helping to minimise tube metal temperatures. The banks of the first re-heater stage are in counter flow for maximum heat transfer efficiency. The current design is a divided flue gas pass), where the first stage of the re-heater is located in a separate part of the gas pass. The reheat outlet temperature is controlled by the flue gas flow through that pass which is adjusted using control dampers.
Materials Selection for High Temperature Components
Modified 9% chrome material X10CrMoVNb9-1 & X10CrWMoVNb9-2 with its high strength and relatively low coefficient of thermal expansion is used for the stub headers, interconnecting pipework and manifolds of the high temperature superheater and re-heater stages, independent of supplier design. Independent of supplier design austenitic material (e.g. Super304H & HR3C and their equals) is used in the high temperature tubes in the gas pass of the secondary and final superheaters and final stage re-heater, where extra resistance to scaling is required. HR3C (or DMV 310N) is used in the highest temperature sections for resistance to fireside corrosion.
Turbine [12]
Turbine Overview Unit 5 [8]
Number 1 Power output MW 733.44 Turbine tap points 8 Condenser pressure mbar(a) 0.031 Re-cooling MW 682.4
Steam Turbine Generator
The turbine is designed to be a tandem-compound reheat machine with a single shaft system comprising 3 pressure sections: HP (high pressure), IP double flow (intermediate pressure) and LP double flow (low pressure) sections all directly coupled to a generator with excitation system. Main steam at 600ºC is admitted to the HP turbine by combined stop and control valves. After passing through the HP turbine the steam is returned to the boiler re-heater where it is re-heated to 620ºC before being admitted to the IP turbine through combined reheat stop and intercept valves. The steam after leaving the IP section passes through an external crossover pipe which connects to the LP turbine sections. The steam after passing through the LP sections is exhausted to the condenser. Shaft end sealing is provided to prevent leakage of pressurised steam from the turbine rotor shafts and casing ends and prevents the ingress of air to the LP turbines. The turbine rotors are supported by pressure lubricated bearings and positioned axially by a thrust bearing. A lubricating oil system supplies filtered and cooled oil to the bearings during all modes of operation including start-up, shut down and turning gear operating with standby capacity of system components. If the main lubricating oil supply fails, an emergency centrifugal oil pump permits safe shut down of the unit. Each of the LP turbines has its own condenser from which the condensate is drawn by condensate extraction pumps (CEP) from the hot well through the gland steam condenser and the series of low pressure preheaters into the feed water tank after any necessary cleaning. The surface type condenser is
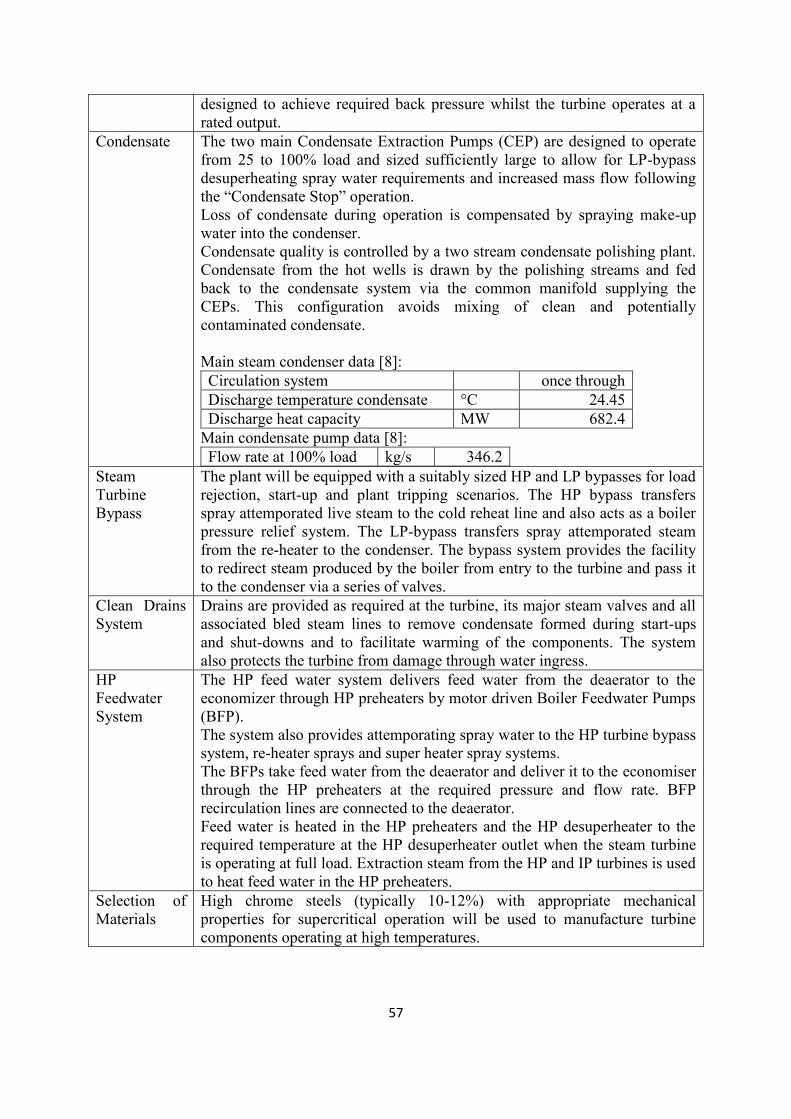
57
designed to achieve required back pressure whilst the turbine operates at a rated output.
Condensate The two main Condensate Extraction Pumps (CEP) are designed to operate from 25 to 100% load and sized sufficiently large to allow for LP-bypass desuperheating spray water requirements and increased mass flow following the “Condensate Stop” operation. Loss of condensate during operation is compensated by spraying make-up water into the condenser. Condensate quality is controlled by a two stream condensate polishing plant. Condensate from the hot wells is drawn by the polishing streams and fed back to the condensate system via the common manifold supplying the CEPs. This configuration avoids mixing of clean and potentially contaminated condensate. Main steam condenser data [8]: Circulation system once through Discharge temperature condensate °C 24.45 Discharge heat capacity MW 682.4
Main condensate pump data [8]: Flow rate at 100% load kg/s 346.2
Steam Turbine Bypass
The plant will be equipped with a suitably sized HP and LP bypasses for load rejection, start-up and plant tripping scenarios. The HP bypass transfers spray attemporated live steam to the cold reheat line and also acts as a boiler pressure relief system. The LP-bypass transfers spray attemporated steam from the re-heater to the condenser. The bypass system provides the facility to redirect steam produced by the boiler from entry to the turbine and pass it to the condenser via a series of valves.
Clean Drains System
Drains are provided as required at the turbine, its major steam valves and all associated bled steam lines to remove condensate formed during start-ups and shut-downs and to facilitate warming of the components. The system also protects the turbine from damage through water ingress.
HP Feedwater System
The HP feed water system delivers feed water from the deaerator to the economizer through HP preheaters by motor driven Boiler Feedwater Pumps (BFP). The system also provides attemporating spray water to the HP turbine bypass system, re-heater sprays and super heater spray systems. The BFPs take feed water from the deaerator and deliver it to the economiser through the HP preheaters at the required pressure and flow rate. BFP recirculation lines are connected to the deaerator. Feed water is heated in the HP preheaters and the HP desuperheater to the required temperature at the HP desuperheater outlet when the steam turbine is operating at full load. Extraction steam from the HP and IP turbines is used to heat feed water in the HP preheaters.
Selection of Materials
High chrome steels (typically 10-12%) with appropriate mechanical properties for supercritical operation will be used to manufacture turbine components operating at high temperatures.

58
Steam Exported to CCS Chain
The need of constant pressure of LP steam for the reboiler throughout the total load range is controlled by a throttle valve in the overflow line between the IP und the LP turbine. As this steam has to be only slightly superheated, typically by 2 or 3°C, to avoid condensation in the supply line, the controlled desuperheating of LP steam has to be carried out at the inlet side of the reboiler by injecting a fraction of the condensate recovered from the steam condensate drum. Only a small amount of IP steam will be required by the reclaiming processes of the CCP and by the dehydration unit of the compression unit and is likely to be supplied from the deaerator steam line. LP and IP steam required within the CO2 capture plant are summarised below18, 22.
Table 2.10 Total LP Steam supplied to reboiler of CO2 capture plant [18]
Units Design Case
Pressure bar(a) 2.2 Temperature °C 213 Flow kg/s 98.5 Source IP/LP crossover
Table 2.11 Total IP Steam supplied to reclaimer of CO2 capture plant [18]
Units Design Case
Pressure bar(a) 8.5 Temperature °C 307 Flow kg/s 0.25 Source De-aerator
Utilities
It is expected that the following utilities will be required for the operation of power plant (PP) and Carbon Capture and Storage (CCS) facilities:
Table 2.12 Utilities required by power and capture plant [6]
Utility
Required
by Purpose Provision
Electrical power Common Motive drive force On-site generation Steam CCS Process heating On-site generation
Cooling water Common Power generation, process cooling River water abstraction
Demineralised water PP, CCS FGD, boiler make-up On-site generation
Fuel oil PP Ignition firing, auxiliary boilers, GT On-site storage
H2 PP, CCS Generator cooling On-site storage
N2 PP, CCS Emergency purging, vessel blanketing On-site storage
CO2 PP Generator purging On-site source or storage Compressed air Common Instrumentation, general use On-site generation

59
Utilities Description [6]
Utility Description
Electrical power
Provision of electrical power for the power island will be ensured by integrated electrical system. System design requirements have been developed for two 800 MW units and one CCS demonstration unit treating 50% of flue gas from one unit. Overall auxiliary power requirement for one generation unit integrated with the CCS demonstration unit is estimated at 140 MWe.
Steam
The demonstration capture plant will draw LP steam under full and part load conditions to satisfy heat demand of solvent regeneration and reclaiming operations. This steam will be taken from the IP/LP crossover line which will be modified by inserting a pressure control valve downstream of the off-take point to ensure that steam is delivered to capture plant at a constant pressure throughout the whole load range. Once the fraction of LP steam will be diverted to capture plant, steam pressure will fall in proportion to the diverted flow. The system design must ensure that the remaining LP steam is delivered to LP turbine at a minimum pressure required for its safe operation under reduced load conditions and, at the same time, to satisfy the minimum steam temperature requirement of the capture plant reboiler and reclaimer. A small amount of IP steam will be required by the dehydration unit of the compression plant. Irrespective of the choice of the dehydration technology, this demand is likely to be supplied from the deaerator steam supply line.
Cooling water
Subject to obtaining the Environmental Agency permit, the cooling water system for power plant will be based on a direct cooling concept using water abstracted from the river Medway as a primary cooling medium. The heat rejection duty for a single unabated 800 MWe supercritical unit is estimated at 868 MWth which will increase to 976 MWth for a unit abated with the capture plant of 6600 tCO2/d capacity. The capture plant and the CO2 compression plant cooling system will be integrated into the host plant either in a parallel or a series connection with the main turbine condensers. The details of such arrangement are still under design consideration, but it is envisaged that this will comprise a primary sea water open circuit and a secondary fresh water closed cooling circuit. The study has also considered several possible system configurations and integration issues related with potential reuse of some of the existing Kingsnorth 1-4 cooling system. The study has suggested a preferred design solution based on the parallel configuration, which will result in increased abstraction rates than those for the series configuration, but with lower discharge temperatures to the Medway estuary. The provisional cooling water flows for the power station and CCS plant are as follows [21]:
Cooling
water
design inlet
temperature
°C
Cooling
water
flowrate
kg/s
Heat
rejection
MWth
Temperature
rise
°K
Total
Unit
5&6
Unit 5 6 – 22 22 878 697 8.0 30 384

60
av. 14.3 CCS plant
6 – 22 design 21.0 7506 273.7 8.0
Unit 6 6 – 22 av. 14.3 27 177 868 8.0 27 177
Power plant direct cooling with sea water [8]: Condenser cooling requirement MW 682.4
Power plant closed cooling water system [8]: Cooling requirement MW 191.8
The water composition in the estuary is close to sea water [8]: Sodium mg/l 150 KS4,3 mmol/l 3 Chloride mg/l 450 Nitrate mg/l 60 TOC mg/l 6 Information on calcium, sulphate, AFS and pH is on hold.
Demineralised water
The power plant requires large quantities of demineralised water for the FGD unit which is produced in water treatment plant by utilising the two stage Sea Water Reverse Osmosis technology. In addition, this plant also supplies treated water to the condensate polishing plant which utilises the ion exchange process to produce boiler feed water to a high purity specification (VGB-R 450) needed to avoid boiler tubes corrosion and trace metal deposition. The FGD plant serving two 800 MW units at Kingsnorth will have demineralised water demand at full of approximately 148 t/h at base case and 220 t/h for the worst case, depending on the sea water chlorine content. This demand can be significantly reduced by utilising process water from the capture plant where the Flue Gas Quencher can produce up to 44 t/h of high purity condensed water at full load operation.
Fuel oil
Fuel oil will be required for the ignition and support firing system of the power plant main steam boiler and for operation of the black-start gas turbines. The functions of the ignition and support firing equipment shall be to provide: a means of lighting up and warming the boiler prior to the admission of
the main fuel to the furnace satisfactory and reliable ignition of coal for all of defined firing
conditions a means of coal combustion support during periods of reduced boiler
load operation a part load carrying facility on the support fuel. Recommended fuel oil for the auxiliary boilers and the boiler oil firing system is the light fuel oil class E, with quality requirements conforming to the current British and European Standards. However, a recent economic study carried out at the E.ON Technology
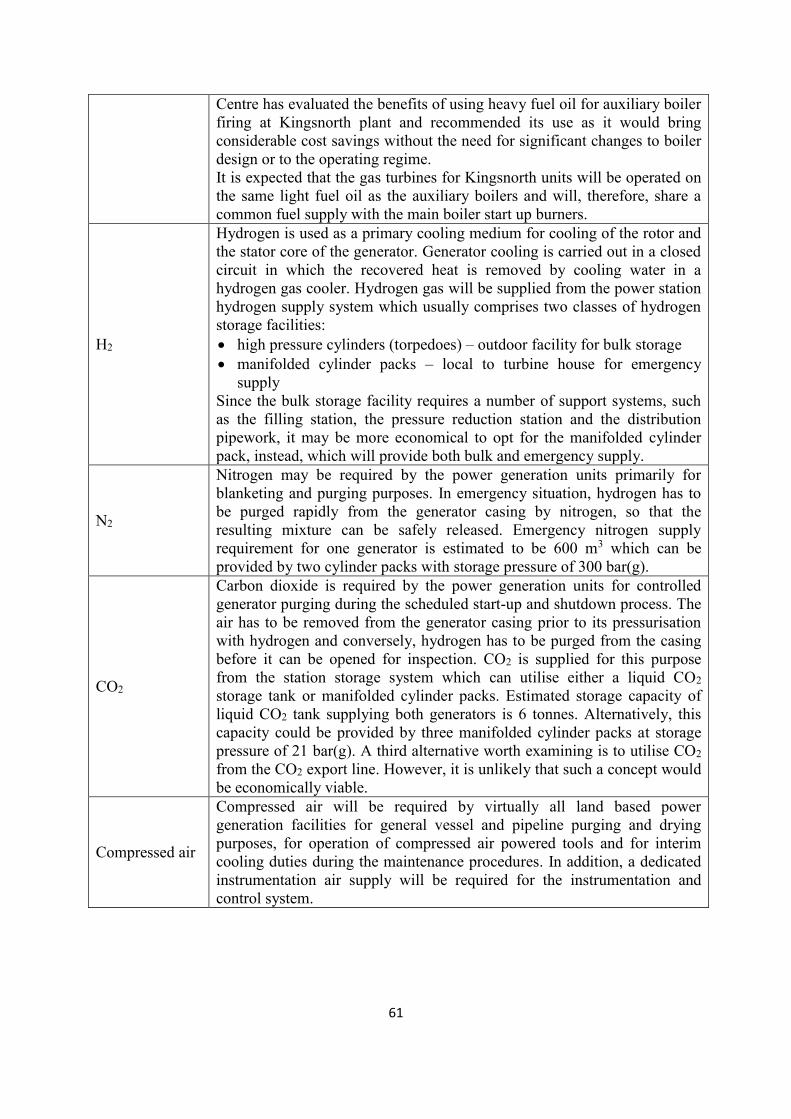
61
Centre has evaluated the benefits of using heavy fuel oil for auxiliary boiler firing at Kingsnorth plant and recommended its use as it would bring considerable cost savings without the need for significant changes to boiler design or to the operating regime. It is expected that the gas turbines for Kingsnorth units will be operated on the same light fuel oil as the auxiliary boilers and will, therefore, share a common fuel supply with the main boiler start up burners.
H2
Hydrogen is used as a primary cooling medium for cooling of the rotor and the stator core of the generator. Generator cooling is carried out in a closed circuit in which the recovered heat is removed by cooling water in a hydrogen gas cooler. Hydrogen gas will be supplied from the power station hydrogen supply system which usually comprises two classes of hydrogen storage facilities: high pressure cylinders (torpedoes) – outdoor facility for bulk storage manifolded cylinder packs – local to turbine house for emergency
supply Since the bulk storage facility requires a number of support systems, such as the filling station, the pressure reduction station and the distribution pipework, it may be more economical to opt for the manifolded cylinder pack, instead, which will provide both bulk and emergency supply.
N2
Nitrogen may be required by the power generation units primarily for blanketing and purging purposes. In emergency situation, hydrogen has to be purged rapidly from the generator casing by nitrogen, so that the resulting mixture can be safely released. Emergency nitrogen supply requirement for one generator is estimated to be 600 m3 which can be provided by two cylinder packs with storage pressure of 300 bar(g).
CO2
Carbon dioxide is required by the power generation units for controlled generator purging during the scheduled start-up and shutdown process. The air has to be removed from the generator casing prior to its pressurisation with hydrogen and conversely, hydrogen has to be purged from the casing before it can be opened for inspection. CO2 is supplied for this purpose from the station storage system which can utilise either a liquid CO2 storage tank or manifolded cylinder packs. Estimated storage capacity of liquid CO2 tank supplying both generators is 6 tonnes. Alternatively, this capacity could be provided by three manifolded cylinder packs at storage pressure of 21 bar(g). A third alternative worth examining is to utilise CO2 from the CO2 export line. However, it is unlikely that such a concept would be economically viable.
Compressed air
Compressed air will be required by virtually all land based power generation facilities for general vessel and pipeline purging and drying purposes, for operation of compressed air powered tools and for interim cooling duties during the maintenance procedures. In addition, a dedicated instrumentation air supply will be required for the instrumentation and control system.

62
Summary[1]
Summary of Key Issues The key aspects of the design and integration of a CCS development are:
Power plants have been designed for many years to operate flexibly in response to the demands of the electricity network. The CCS plant technology is closer to process plant technology which is not usually designed for such flexible operation, and this will provide a key challenge during the detailed design process to provide the required flexibility of operation.
Assessment of various cooling technologies for the power station and carbon capture plant shows that direct water cooling is the Best Available Technology in terms of Environmental Impact.
Significant parts of the existing cooling water infrastructure can be re-used. There is potential to advantageously interface steam and cooling systems between the
power plant and CCS plant.
Assumptions
Operation of the power plant will remain a commercial concern with the integrated CCS (Carbon Capture and Storage) chain.
The power plant will be designed to be at optimum efficiency at full load with the CCS chain in service.
Both power plant and CCS chain will be designed to allow flexible operation over the full operational load a wide range, as far as possible independent of each other from a loading perspective.
The CCS chain will be designed to flexibly operate between MSG (Minimum Stable Generation), and full load (MCR) as required. At any time the power station may be called to operate at any load within this range and be expected to achieve that load within declared loading / de-loading rates.
Power plant outage requirements are yet to be confirmed by manufacturers’ requirements.
The power plant and entire CCS chain is to be designed to be able to be shut down and subsequently restarted as required.
Design Requirements
The power plant with integrated CCS chain will be designed to be flexible within its operating parameters and capable of:
Start-up – ability to start from hot, warm and cold conditions. Ramp up – ability to increase and decrease load at a declared rate within its operating
parameters as required by commercial and Grid requirements. Full Load / Part Load Operation – ability to maintain stable generation at any load
between its declared MSG (Minimum Stable Generation) and MCR (Maximum Continuous Rating).
Shutdown – ability to safely and securely shutdown as required by market conditions and Grid requirements to a mode available for restart when required. It is expected that during de-loading the CCS will not normally be in service at loads below MSG.
Frequency Response – ability to respond to changes in system frequency as required by the Grid Code including reduction/stoppage of CCS chain if necessary.
Emergency Conditions – ability to shutdown, rapidly reduce load or operate safely.

63
To support these requirements: Power plant FGD system will be required fully in service before CCS plant is
commissioned. Power plant to be fitted with necessary frequency response equipment, including
consideration of ‘condensate stop’ to assist rapid response in line with Grid Code requirements
References:
No. Report Name
Document
No.
1 Key Reference Handbook 0 2 Full System Operational Philosophy 4.3 3 Overall C&I System & Integration Design Philosophy 4.4 4 Full System Construction Philosophy 4.7 5 Inspection & Maintenance Philosophy 4.8 6 Utilities Philosophy 4.13 7 Design Life Philosophy 4.14 8 Design Philosophy Overall Project Data 4.16 9 Civil Design Philosophy 4.2 10 Onshore Electrical Design Philosophy 4.21 11 Cooling Medium System Design Philosophy 4.22 12 Steam System Design Philosophy 4.23 13 Fire and CO2 Impact Prevention Design Philosophy 4.27 14 Emergency Shutdown System Design Philosophy 4.28 15 Overall Plant Integration Philosophy 4.30 16 Feasibility of CCS Sludge Co-firing in Power Plant 4.32 17 Power Plant Heat & Mass Balances at Various CCS Conditions 4.34
18 Design report of flue gas and steam integration of power plant and capture plant including Interface list 4.35
19 Life Assessment of Existing Infrastructure 4.36 20 Plant Layout with Split Carbon Capture Demonstration Plant 4.39 21 Cooling Water System Design Report 4.41 22 Interface Design of Water Steam Cycle and Carbon Capture Process 4.42 23 CHP Feasibility Study 4.45 24 Design Basis for CO2 Recovery Plant 5.4
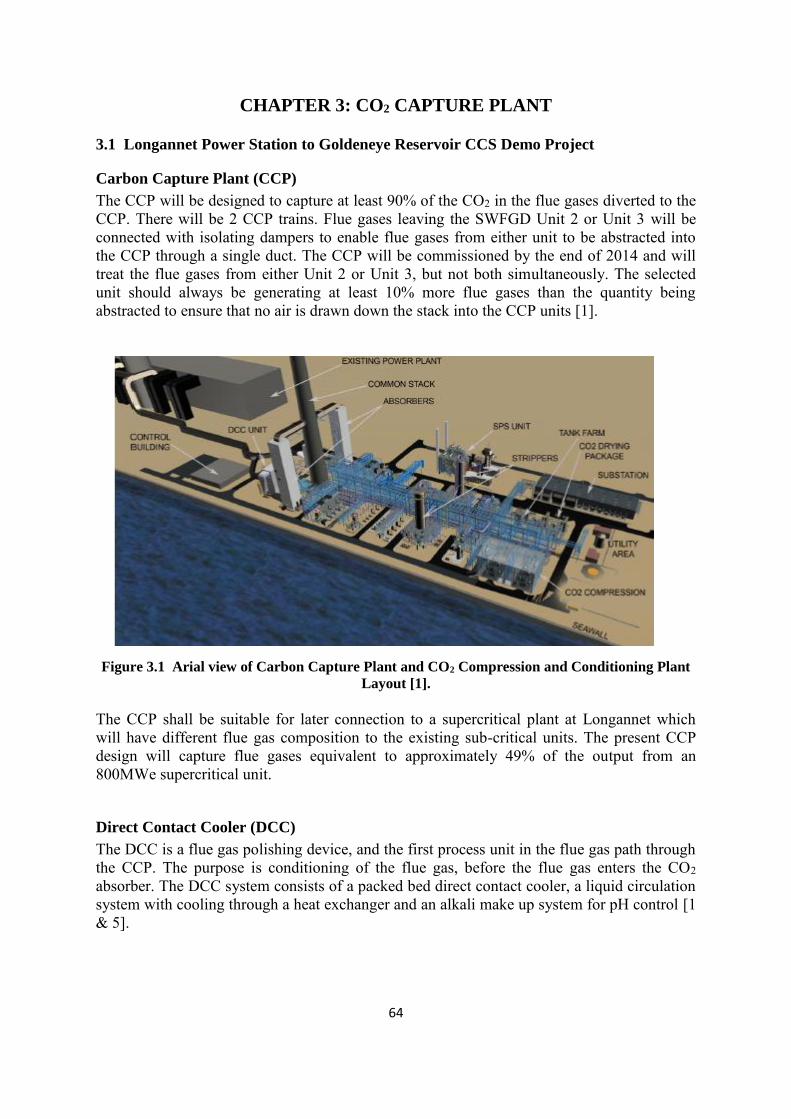
64
CHAPTER 3: CO2 CAPTURE PLANT
3.1 Longannet Power Station to Goldeneye Reservoir CCS Demo Project
Carbon Capture Plant (CCP)
The CCP will be designed to capture at least 90% of the CO2 in the flue gases diverted to the CCP. There will be 2 CCP trains. Flue gases leaving the SWFGD Unit 2 or Unit 3 will be connected with isolating dampers to enable flue gases from either unit to be abstracted into the CCP through a single duct. The CCP will be commissioned by the end of 2014 and will treat the flue gases from either Unit 2 or Unit 3, but not both simultaneously. The selected unit should always be generating at least 10% more flue gases than the quantity being abstracted to ensure that no air is drawn down the stack into the CCP units [1].
Figure 3.1 Arial view of Carbon Capture Plant and CO2 Compression and Conditioning Plant
Layout [1].
The CCP shall be suitable for later connection to a supercritical plant at Longannet which will have different flue gas composition to the existing sub-critical units. The present CCP design will capture flue gases equivalent to approximately 49% of the output from an 800MWe supercritical unit.
Direct Contact Cooler (DCC)
The DCC is a flue gas polishing device, and the first process unit in the flue gas path through the CCP. The purpose is conditioning of the flue gas, before the flue gas enters the CO2 absorber. The DCC system consists of a packed bed direct contact cooler, a liquid circulation system with cooling through a heat exchanger and an alkali make up system for pH control [1 & 5].

65
Direct Contact Cooler (DCC)
Flue gas component removed in DCC
SO2, SO3, NO2, HF, HCl and particles (fly ash, corrosion products, etc)
DCC L=10000m, W=8000, H(internal)=19400, Flue gas in =904367 kg/hr, Concrete with epoxy lining [5]
DCC operating condition Atmospheric pressure, 80°C
DCC Packing L=10000m, W=8000, H(internal)=19400, Flue gas in =904367 kg/hr [5]
Pressure drop Less than 1000 Pa (10 mbar) [5] DCC pH Close to 7 (pH range >6 & <8) [5] DCC pH control NaOH solution DCC distributor/collector Flue gas in =904367 kg/hr, construction material SS316L
DCC Cooler H:2.1 & C:0.5 bar(g); H:35.5/30 & C:20/28°C; Titanium, plate type sea water cooled
DCC Pump 2 Pumps, 2.6 bar(g); 31.3°C; 1820 m3/h; construction material SS316L, 100% fixed speed, Horizontal, Centrifugal
Figure 3.2 Long view of Carbon Capture Plant and CO2 Compression and Conditioning Plant
Layout [1].

66
Carbon Capture Plant Overview [1]
Flue gas fan Operating Pressure: 0.073bar(g) and Temp.: 30.1°C; Dimensions/design
capacity: 778378 m3/hr, Axial type, Variable Pitch blades [5]
Absorber
Absorber shape Rectangular Absorber material Concrete with internal lining Absorber height 60 meter [5]
Absorber components
Absorber sump Gas inlet section Absorption section Conditioning section Demister Flow control valves Sampling points
Solvent Proprietary solvent
Absorber Design Considerations
The liquid to gas ratio is carefully controlled to achieve the required capture rate with the highest possible rich loading of the amine in the bottom of the absorber. This reduces the specific re-boiler duty due to higher CO2 partial pressure at the top of the stripper and consequently reduces the water evaporation into the stripper overhead condenser.
Demineralised water make-up, condensate from the stripper overhead receiver and condensate from the CO2 compressor intercooler knock out drums are routed to the wash systems, and a bleed is cascaded downwards through the tower, ending up in the amine solvent. The amount of demineralised water makeup will normally be close to zero.
At the bottom of the absorber, a sump is provided with sufficient volume to protect the downstream rich amine pump.
The amine circulation loop is controlled by flow control valves. The rich and lean amine pumps are fixed speed, with flow control by use of control valves.
Sampling points are included to enable gas and liquid sampling. The conditioning section above the absorption section contains wash steps to minimise amine slip and to cool the flue gas in order to control the water balance in the entire CO2 capture plant. The wash sections remove any alkaline compound such as amines and ammonia in the flue gas which would otherwise pass to atmosphere.
A demister is included at the top of the absorber to ensure no carry-over of amine droplets. The flue gas leaving the tower is water saturated.
Stripper
Stripper components Stripping section

67
Condenser Reboiler steam ~3.0 bar(g)
Stripper Design Considerations
The design is optimised to give high heat transfer coefficients. Significant heat is removed in the rich amine in this exchanger,
contributing to the energy efficiency of the plant. The rich amine flow control valve is placed on the discharge of the
exchangers to ensure no vapour production within the exchangers. The rich amine flashes over the flow control valve resulting in two
phase stream entering the Stripper. The Stripper distributor is designed for two phase inlet flow.
The re-boiler duties, regulated by the stripper bottom temperature in order to achieve the specified lean loading, are controlled by control valves on the steam supply side.
The stripper operates such that the top temperature is the same as the rich amine inlet temperature. This will ensure optimal operating condition and low water content of CO2 leaving the stripper and hence less energy required for the re-boilers.
The pressure in the stripper is controlled by capacity control of the downstream CO2 compressor train. The stripper will operate at a positive pressure with a small pressure drop across the column.
When operating the capture plant at reduced load it will be possible to reduce the operating pressure to enable use of lower pressure steam in the re-boiler. This may be an important feature to demonstrate, as the counter pressure from the LP turbine section decreases at reduced turbine load. CCP operation at lower steam supply pressure is then clearly attractive, even if the specific power consumption for the CO2 compression increases.
Before leaving the stripper, the produced CO2 is conditioned in order to minimise amine carry over to the stripper overhead condenser. The stripper condenser cools the CO2 stream down to 30°C and condensed water is collected in the stripper overhead receiver where a portion is used to provide reflux to the stripper and a portion is re-used elsewhere in the CCP. The stripper overhead condensate is highly enriched with CO2, which in turn improves the amine capture performance in the absorber conditioning section.
Low temperature heat is rejected to the closed cooling water system in the lean amine coolers.
The solvent is optimised for minimising the steam content in the stripper overhead section, which in turn reduces the energy required for CO2 stripping. This is achieved by the high (and close to equilibrium) CO2 loading in the rich amine leaving the absorber bottom section.
Amine Solvent Management
Amine Reclaimer
Thermal reclaiming with NaOH as neutralising solution. Non-volatile impurities and solvent degradation products are not
boiled off, and accumulate in the Reclaimer System as reclaimer waste. When reaching a maximum reclaimer waste inventory, the

68
reclaimer unit is emptied to a waste handling system. The capacity of the reclaiming unit is dimensioned based on
solvent degradation rates and reclaimer storage/inventory exchange frequency, as well as choice of operation mode.
Medium pressure steam will be required for the operation of the reclaimer module and the energy utilised will be recovered in the stripping process.
Amine Filter
One filter package on each CCP train treat a side stream of the lean amine stream, consists of: Pre-filter (upstream mechanical filter) with 5 microns retention
size Carbon bed (activated carbon filter) After filter (downstream mechanical filter) with 10 microns
retention size Relief and Vent Handling
Description Single vent header for 2 CCP train and CO2 compression system
Vent Function This line is used to vent out-of-specification CO2 to the new stack during start-up or in case of down-stream plant failure (e.g. a compressor trip or a valve closure in the pipeline).
Vent design consideration
Full CO2 production rate from both trains simultaneously, vented either from the stripper overhead systems in the CCP or from downstream of the compression and drying systems.
In the latter case, depressurisation of the CO2 may lead to very low temperatures in the vent header and to ensure adequate dispersion of the cold, dense gas from the top of the stack, the vented gas is mixed with the hot flue gas from the SPS plant.
Overpressure safety Mechanical relief devices

69
Figure 3.3 Process flow diagram Carbon Capture Plant (CCP) (Train 1) [2].
CoolingWater Out
Direct Contact Cooler
Absorber
Stripper
Heat Exchanger &Amine Filter
Reclaimer
Flue gas
NaOH
Flue gas
Treated Flue gasto Stack
LP Steam
Condensate
CO2 for Compression& Drying
Rich amine
Rich amine
Lean amineLean amine
Amine Slip Stream
(Batch Flow)
Sea Water Out
Sea Water In
DemineralizedWater
CoolingWater In
Condensate from Compression
& DryingDemineralized
Water
MP Steam
NaOH
Condensate
Amine Waste for disposal
Lean amine
Amine Make up
1
6
7
12
8
11
10
9
13
17
CO2 Vent to Stack
14
Stripper Overhead Receiver
15
18
16
3
Process Water
DCC Pump & Cooler
2
5
4
Effluent

70
1 2 3 4 5 6 7 8 9
Stream Flue gas Inlet to DCC
DCC outlet to DCC liquid loop
NaOH to DCC liquid loop
DCC Circulation Water
Process Water to DCC
Flue gas Inlet to Absorber
Rich Amine Outlet from Absorber
Lean Amine Inlet to Absorber
Demi. Water Inlet Absorber
Temperature °C 80.0 35.5 20.0 30.0 20.0 39.1 35.0 35.0 20.0 Pressure bar (a) 1.010 1.000 6.000 5.500 2.000 1.073 6.000 4.000 4.000 Volume Fraction - 1.000 - - - - 1.000 - - -Total Molar Flow kmol/h 27,688.1 88,997.6 8.2 88,831.7 263.6 27,794.0 NR NR NRTotal Mass Flow kg/h 822,181.5 1,644,363.0 186.3 1,641,297.0 4,750.0 824,051.8 1,437,873.3 1,283,174.8 30,075.3 Volumetric Flow m3/h 804,949.1 1,654.5 0.1 1,648.4 4.8 672,251.3 1,268.8 1,241.2 30.1 Density kg/m3 1.021 993.889 1,500.000 995.678 998.234 1.226 1,133.232 1,033.839 998.205 Molecular Weight g/mol 29.694 18.476 22.619 18.476 18.020 29.649 NR NR NRViscosity cP 0.019 0.712 30.000 0.797 1.002 0.018 NR NR NRThermal Conductivity W/m-K 0.027 0.624 0.649 0.616 0.599 0.024 NR NR NRHeat Capacity kJ/kg-K 1.023 4.179 3.607 4.179 4.184 1.009 NR NR NR
H2O kmol/h 1,079.8 87,616.9 6.5 87,453.5 263.6 1,186.5 NR NR NRCO2 kmol/h 3,156.4 - - - - 3,156.3 NR NR NRN2 kmol/h 21,731.5 - - - - 21,731.7 NR NR NRO2 kmol/h 1,716.7 - - - - 1,716.6 NR NR NRSO2 kmol/h 0.9 440.1 - 439.3 - - NR NR NRSO3 kmol/h 0.1 - - - - 0.1 NR NR NRHCl kmol/h - 0.9 - 0.8 - - NR NR NRHF kmol/h - 15.5 - 15.5 - - NR NR NRNH3 kmol/h 0.2 - - - - 0.2 NR NR NRNO2 kmol/h 2.5 - - - - 2.5 NR NR NRNaOH kmol/h - 924.3 1.7 922.6 - - NR NR NRAmine kmol/h - - - - - - NR NR NRSO4 kmol/h - - - - - - NR NR NR
H2O kg/h 19,458.5 1,578,855.8 117.4 1,575,911.9 4,750.0 21,381.6 NR NR NRCO2 kg/h 138,914.2 - - - - 138,909.9 NR NR NRN2 kg/h 608,700.3 - - - - 608,705.1 NR NR NRO2 kg/h 54,932.9 - - - - 54,931.2 - NR NRSO2 kg/h 55.3 28,194.9 - 28,142.3 - 2.8 - NR NRSO3 kg/h 7.0 - - - - 7.0 - NR NRHCl kg/h 0.1 31.0 - 31.0 - - - NR NRHF kg/h 0.6 310.1 - 309.5 - - - NR NRNH3 kg/h 2.9 - - - - 2.9 - NR NRNO2 kg/h 115.7 - - - - 115.7 - NR NRNaOH kg/h - 36,971.2 68.9 36,902.2 - - - NR NRAmine kg/h - - - - - - NR NR NRSO4 kg/h - - - - - - - NR NR
Component Mass Flow:
Component Molar Flow:
Table 3.1 Heat mass balance for Carbon Capture Plant (CCP) (Train 1, Winter Case) [3].
Table continued on next page.

71
10 11 12 13 14 15 16 17 18
Stream Demi. Water Inlet Absorber
Treated Flue gas to Stack
Rich amine Inlet to Stripper
Lean Amine Outlet from Stripper
Amine slip stream to Reclaimer (Batch)
Condensate return to Stripper
CO2 Outlet from Stripper
CO2 to Compression &
Drying
Condensate from Compression &
DryingTemperature °C 20.0 32.5 112.9 122.1 122.1 30.0 96.0 30.0 20.0 Pressure bar (a) 6.000 1.013 5.500 1.900 5.500 4.000 1.840 1.740 4.000 Volume Fraction - - 1.000 - - - - 1.000 1.000 -Total Molar Flow kmol/h 22.8 24,976.5 NR NR NR NR NR 2,911.5 70.5 Total Mass Flow kg/h 410.0 699,406.2 1,437,873.3 1,282,780.7 8,181.8 14,118.1 169,210.7 126,287.5 1,270.2 Volumetric Flow m3/h 0.4 626,519.6 1,330.1 1,311.1 8.4 14.2 87,115.8 41,813.6 1.3 Density kg/m3 998.205 1.116 1,081.018 978.412 978.412 995.651 1.942 3.020 998.205 Molecular Weight g/mol 18.020 28.003 NR NR NR NR NR 43.376 18.020 Viscosity cP 1.001 0.018 NR NR NR NR NR 0.015 1.001 Thermal Conductivity W/m-K 0.599 0.025 NR NR NR NR NR 0.017 0.599 Heat Capacity kJ/kg-K 4.183 1.029 NR NR NR NR NR 0.881 4.184
H2O kmol/h 22.8 1,209.5 NR NR NR NR NR 71.1 70.5 CO2 kmol/h - 315.6 NR NR NR NR NR 2,840.4 -N2 kmol/h - 21,734.9 NR NR NR NR NR - -O2 kmol/h - 1,716.4 NR NR NR NR NR - -SO2 kmol/h - - NR NR NR NR NR - -SO3 kmol/h - - NR NR NR NR NR - -HCl kmol/h - - NR NR NR NR NR - -HF kmol/h - - NR NR NR NR NR - -NH3 kmol/h - - NR NR NR NR NR - -NO2 kmol/h - - NR NR NR NR NR - -NaOH kmol/h - - NR NR NR NR NR - -Amine kmol/h - - NR NR NR NR NR - -SO4 kmol/h - - NR NR NR NR NR - -
H2O kg/h 410.0 21,795.2 NR NR NR NR NR 1,280.5 1,270.2 CO2 kg/h - 13,889.7 NR NR NR NR NR 125,007.0 -N2 kg/h - 608,795.4 NR NR NR NR NR - -O2 kg/h - 54,925.9 NR NR NR NR NR - -SO2 kg/h - - NR NR NR NR NR - -SO3 kg/h - - NR NR NR NR NR - -HCl kg/h - - NR NR NR NR NR - -HF kg/h - - NR NR NR NR NR - -NH3 kg/h - - NR NR NR NR NR - -NO2 kg/h - - NR NR NR NR NR - -NaOH kg/h - - NR NR NR NR NR - -Amine kg/h - - NR NR NR NR NR - -SO4 kg/h - - - - NR NR NR - -
Component Molar Flow:
Component Mass Flow:
Note: NR: Not reported
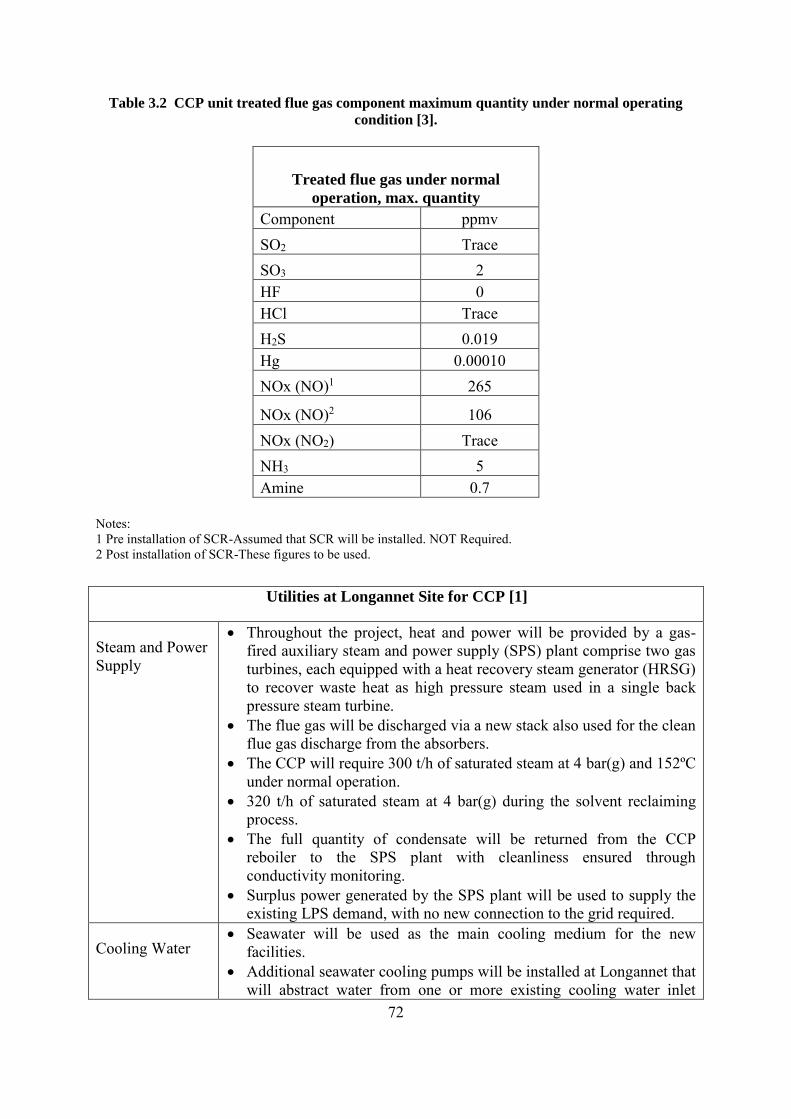
72
Table 3.2 CCP unit treated flue gas component maximum quantity under normal operating
condition [3].
Treated flue gas under normal
operation, max. quantity
Component ppmv SO2 Trace SO3 2 HF 0 HCl Trace H2S 0.019 Hg 0.00010 NOx (NO)1 265
NOx (NO)2 106 NOx (NO2) Trace NH3 5 Amine 0.7
Notes: 1 Pre installation of SCR-Assumed that SCR will be installed. NOT Required. 2 Post installation of SCR-These figures to be used.
Utilities at Longannet Site for CCP [1]
Steam and Power Supply
Throughout the project, heat and power will be provided by a gas-fired auxiliary steam and power supply (SPS) plant comprise two gas turbines, each equipped with a heat recovery steam generator (HRSG) to recover waste heat as high pressure steam used in a single back pressure steam turbine.
The flue gas will be discharged via a new stack also used for the clean flue gas discharge from the absorbers.
The CCP will require 300 t/h of saturated steam at 4 bar(g) and 152ºC under normal operation.
320 t/h of saturated steam at 4 bar(g) during the solvent reclaiming process.
The full quantity of condensate will be returned from the CCP reboiler to the SPS plant with cleanliness ensured through conductivity monitoring.
Surplus power generated by the SPS plant will be used to supply the existing LPS demand, with no new connection to the grid required.
Cooling Water
Seawater will be used as the main cooling medium for the new facilities.
Additional seawater cooling pumps will be installed at Longannet that will abstract water from one or more existing cooling water inlet

73
Summary of the Control Systems Philosophy for the Carbon Capture System at LPS [1]
Station systems will be modified to monitor the use of services provided by LPS for the required operation of the SPS plant and CCP.
The monitoring will take place using the existing systems, reporting to the common systems control console in the power station central control room.
The console will additionally display status information relating to SPS plant/CCP operation.
The unit control systems of Unit 2 and Unit 3 will each provide a small number of signals required for the operation of the CCP. These are derived from the unit status, without operator involvement.
chambers located upstream of the existing drum screens.
Effluents and Waste
Six main effluent and waste streams have been identified for the whole CCP process. These effluents and their method of disposal will be as follows: DCC effluent containing sodium sulphate and traces of suspended
solids: disposal to the Firth of Forth following on-site treatment; Amine reclaimer waste: off-site incineration in a waste incinerator; Condensate waste: recycling for re-use in the process; Boiler blowdown: disposal to the Firth of Forth after cooling; Spent carbon filter waste: removed from site by road tanker for
recycling; and Solvent filter waste: removed from site by road tanker for disposal. These solutions will be subject to meeting the necessary environmental and permitting requirements and will be revisited upon receipt of more detailed information from the Mobile Test Unit (MTU) currently operating at LPS.
Ancillary Services
The main ancillary services for the CCP will consist of the DCS instrument and service air supply Fire fighting water Potable water Demineralised water Nitrogen and sodium hydroxide supply The fuel gas supply will be from the current Longannet facilities
(though further investigation is required to establish whether modifications will be required to the existing pressure reduction facility).
The FEED study work will be based upon the previously prepared preliminary design packages for these systems.

74
Effect on the monitoring and auditing requirements for participation in the EU ETS for
LPS [1]
The principal of the EU ETS is that each installation will have a greenhouse gas emissions permit with the requirement to quantify the net CO2 emitted from the installation, to the satisfaction of the competent authority (in the case of LPS, the Scottish Environmental Protection Agency).
In the case of CCS, the CO2 emitted will incorporate CO2 that is transferred in and/or out of an installation.
Scottish Power’s emissions permit will be modified to show that CO2 is being transferred to another entity rather than emitted.
Venting [6]
The venting system is required to comply with relevant UK Health and Safety legislation and must provide for the controlled release of CO2, ensuring safe dispersal and engineering integrity of the vent arrangement. Dispersion of CO2 during venting is critical as CO2 is a colourless, odourless gas which is both toxic and an asphyxiant. It is also denser than air. Under certain depressurising conditions, for example let-down of high-pressure dense-phase CO2, liquid may form as the pressure is reduced and the CO2 cools (adiabatic cooling).The venting system will be required to consider low temperature constraints of local equipment, structures and piping systems, for example failure due to carbon steel embrittlement or damage to internal and external coatings. Noise generated at the vent tip as a result of CO2 venting operations will require consideration with reference to limits defined in the applicable permits and occupational health limits. Measures for noise reduction will be considered as required. The venting design should be suitable for venting of both in-specification and out-of- specification CO2. The CCS chain CO2 detection systems are primarily designed to identify leaks from the system. They will remain in service during venting operations. Temporary CO2 detection may be required to support temporary venting operations. The design and siting of temporary vents will also take into account dispersion patterns, wind, topography, vent height and vent orientation. The venting system will be required to support activities normally associated with a pressure system such as depressurisation and thermal relief. Additionally it will be required to support activities specific to operating the CCS chain such as, venting to support start-up and venting to prevent out-of specification CO2 entering the CCS chain.
Venting to support start-up
The venting system will be required to support start-up of the End-to-End CCS chain after a shutdown.
During a normal start-up sequence, the CCP will be unable produce CO2 within specification immediately and must be operated for a period of time until CO2 with the desired specification can be achieved.
During this period the CO2 production cannot be exported to the Onshore Transportation System and will be directed to the common plant stack.
When the desired CO2 specification is reached, the vent will be closed and the export of CO2 to the Onshore Transportation System will commence.

75
Venting out-of-specification CO2
As far as is practicable, the venting system will prevent out-of-specification entering the CCS chain. If this does occur, the venting system will also support removal of out-of-specification CO2 from any part of the CCS chain.
During normal operation, out-of-specification CO2 will not be exported to the Onshore Transportation System. If the CCP production is detected as being out-of specification, the produced CO2 will be diverted to the vent at Longannet until production is again within specification.
It is anticipated that venting of this nature will only involve the release of small inventories of CO2 to atmosphere.
Venting for maintenance activities
CO2 venting will be required as part of carrying out selected maintenance activities. The equipment or system under maintenance will require to be vented to remove all CO2 prior to starting the maintenance activity.
Small amounts of CO2 will be vented from the ‘double-block-and-bleed’ type arrangements that are provided to maintain safe isolation from pressurised CO2 whilst the maintenance is in progress.
The number and position of the isolation valves used to sectionalise the system for maintenance will be chosen to minimise the release of CO2.
Starting the CCS chain after maintenance may require equipment to be purged with CO2 for return to normal service. This is anticipated to require the venting of small inventories of CO2.
Venting during commissioning and decommissioning
The venting system will be required to support commissioning and decommissioning of the End-to-End CCS chain. Venting of CO2 for commissioning will be required for each element of the CCS chain as follows: During commissioning, the CO2 produced by the CCP will be directed to the vent at the
common plant stack until the CO2 quality and the reliability and availability of the CCP is proven. Once these criteria have been met, the vent can be closed and CO2 exported to the Onshore Transportation System.
Venting to maintain CCP operation during a chain shutdown
One objective of the venting system is to allow continued CCP operation during periods when other elements of the CCS chain are shutdown. If this takes place, CO2 venting will be carried out using the common plant stack to allow the CCP to remain operational at full output.
This capability will be used as a temporary measure, where appropriate, to avoid unnecessary wear and tear associated with stopping and starting the CCP. With the CCP maintained in operation, immediate resumption of CO2 supply to the Onshore Transportation System can take place.
In a situation where an element of the CCS chain is not available for a short period of time, i.e. the Blackhill compressors have tripped and the Onshore Transportation System has reached its pressure limit, the Onshore Transportation System operator (who will also coordinate management of the CCS chain) will have the option of requesting the CCP operator to divert CO2 from the CCP to the common plant stack at Longannet. Otherwise the CCP would need to be shutdown.

76
Modularisation [4] Barging/ Transportation Logistics
The barging and transportation logistics review sought to identify and evaluate at a high level, the advantages and constraints associated with each of the following:- Logistics Description
Sea Port Proximity It would be preferable to load-out equipment (or PAU’s (Pre-assembled unit) / PAR’s (Pre-assembled rack) from the fabrication yard onto sea transportation, (rather than road transport) including the provision of sea fastenings and any temporary transportation strops. Forth Ports PLC (“Forth Ports”) operates five ports on the Firth of Forth, namely Leith, Grangemouth, Methil, Burntisland and Rosyth. Of these Grangemouth is located closest to the LPS, and is Scotland’s largest container port specialising in short-sea feeder operations linking Scotland to UK and European deep-sea ports. There are also European door-to-door connections.
Barging Options It is assumed that all large items transported to the Grangemouth port by ship or sea going barge, will be off-loaded to a shuttle barge, for on-going transportation direct to the LPS site load-in area.
The river tidal details
The Firth of Forth is tidal and due to the profile of the river bank adjacent to the LPS quay, studies must be undertaken to assess the tidal rise and fall to ensure there is sufficient water depth throughout the lift-in operation period.
On-site trailing / lifting options
First option proposes trailing the PAU’s / PAR’s directly from the (RoRo: Roll-on Roll-off) barge to their respective permanent site locations, utilising multi-axle transporters (SPMT’s). Physical lifting requiring site cranage may be necessary for the Amine Stripper PAU. Second option proposes the design and installation of a new crane support pad, to be utilised for offloading from a shuttle barge. Third option proposes the utilisation of the existing crane support pad that is located just east of the existing pier.
Lay down areas
It is assumed that a comprehensive integrated materials management system will be implemented at the site. Large items transported by sea (PAUs and PARs) will be trailed directly to their intended installation location on a just-in-time basis ready for further installation and hook-up. If Option 1 is adopted and two or more PAU’s / PAR’s are delivered in close succession, the beached construction barge can be used for temporary storage, if necessary. For all other items it is assumed that a central storage will be arranged at the designated Construction area north of the SPS area. In general the laydown area needed for typical PAU / PAR construction is considered to be approximately 50-60% of the area needed for the Stick Build approach.
Road transportation to the LPS site
For this option, it has been assumed that all large items will be transported by ship or sea going barge to the Grangemouth port, where these will then be lifted onto suitable road going transporters.

77
LPS On-site roads
The transportation of equipment (PAU’s / PAR’s) by road requires that the road going transporter is able to access and negotiate the LPS on-site road infrastructure.
Temporary Use of SSSI (Site of Special Scientific Interest) Designated Area
For temporary access requirement to a SSSI designated area general requirement for following authorities to be met: Scottish Natural Heritage (SNH) Scottish Environmental Protection Agency (SEPA) River Forth Fisheries Trust & Forth District Salmon Fisheries Trust Marine Scotland LPS ‘Biodiversity Action Plan’ (BAP)
Proposed Installation Campaigns
The installation is proposed in three separate campaigns which are as follows: Installation Campaign Description
1: Amine Train 1 - North side
The most critical milestone for ‘Campaign 1’ will be the trail-in of the Amine Stripper PAU in the centre before closing the access way by installing the intermediate PAR A2. As it is the largest PAU and contains several heavy and complex components, it is likely to be the last unit to be delivered to site.
2: Central & Pipe Rack Areas
The proposed hook-up zones between the rack sections in straight line is proposed performed as direct fit. With this approach much hook-up work at site is saved. The individual parts can be (pair-wise) fabricated and tested with connections made up, and de-coupled before transportation.
3: Amine Train 2 - South side
It is assumed that the modules for train 2 will be approximately 4-6 months after train 1. The work with hook-up of Train 1 and the main pipe racks will also have much better working conditions with access from the Train 2 area. ‘Campaign 3’ is proposed to start from the east end, (refer to indicated sequence numbers) but due to very good trail-in access from south, the actual installation sequence can be adapted to changed conditions.
Each of these are presented hereunder, based on PAU’s / PAR’s being barged to the site utilising Option 1.
Pre-assembled unit (PAU) / Pre-assembled rack (PAR) Details and Installation Methods
[4]
Amine stripper PAU - Complete unit
Assuming that the Amine Stripper PAU can be delivered as a complete PAU, (i.e. will pass under the Forth Road & Rail Bridge height restrictions), the transportation and load-in of the complete unit including internals in column is considered feasible.
Including internals the total weight could be as much as 1000Te.

78
It is recommended that temporary transportation beams are integrated between the structure legs and two strong beams penetrating the vessel skirt is considered necessary to carry the vessel load.
Supports for setting-down the stripper directly to pre-shimmed foundations must be inserted.
Figure 3.4 Amine Stripper Pre-assembled unit (PAU) 1109 as per FEED design [4].
Two concepts for making the PAU suitable for trailing are sketched.
1. Lift-in and up-ending of stripper 1 at the main pad (barging Option 2), installation of trailing beams set externally on the skirts, and trailing onto foundation on the Train 1 plot.
2. The lower structure can be installed partly or completely after the installation of the stripper vessel. The substructure might even be divided in 4 parts.
3. For train 2 the lift-in pad will be within the 38m reach radius [4], and the vessel can be positioned directly. The trailing principle for the Train 1 stripper is by installing the lifting frame on the outside of the column vessel skirt [4]. The unit can be trailed directly to its foundation. No stability problems are foreseen.
4. The stripper column should be delivered fully dressed externally, including the largest practical amount of down comer piping. The platforms above the trunnions must be made with sections temporarily removed / folded back. Significant savings can be achieved if a full scaffolding tower to the column top can be avoided. Upending of

79
stripper is considered feasible with one heavy duty construction crane, and assisted by either trailers with special hinge arrangement at lower end, or a large mobile crane. By using lifting trunnions further down the column, the needed assistance crane may be smaller, but platforms and other external outfitting have to be dismounted, or segments of the platforms “folded up” for easy re-instatement after lifting. A check will be necessary to ensure that the stripper shell thickness is suitable for lifting a fully dressed column.
Stripper Overhead
The stripper overhead structure has a Receiver Drum integrated which cannot be lifted in after the structure is installed without a large degree of level-by-level build-up. Due to the drum being supported at ground level (on a concrete plinth), it is proposed that the method of using a sub-frame is utilised. The PAU can thereby be made complete with all internal equipment and piping. The normal method is to jack the PAU down into a pre-cast concrete pit until the frame is covered by 250mm concrete. Alternatively (and cheaper) is to place the complete sub-frame on low plinths (200 mm) and have the sub frame covered by grating. The drum might have to be grouted anyway, in order to have even support contact with the drum bottom.
Figure 3.5 Stripper overhead PAU with sub-frame for casting in [4].
The PAU is proposed outfitted on a sub-frame, with a supported steel plate underneath the drum. When the module is lifted (jacked) down to final elevation in a pre-cast pit, the drum support plate firstly have to be under-cast by slightly expanding concrete, in order to obtain perfect support without pockets. Thereafter the complete sub-frame is overcast to correct level and slope, and finally the bund walls are to be cast between the columns. The “sub-frame” technique offers the advantage that all equipment and outfitting on the lower (grade) level can be integrated in the module. The jacking down can be done by use of external

80
consoles bolted onto the corner columns, and move the trailers to this position. Alternatively the jacking can be done by separate jack packs. The stripper overhead PAU is chosen.
Amine Heat Exchanger
The Amine Heat Exchanger structure / pipe rack is an example of a unit which is well suited for being unitised and transported to site ready for direct hook-up. The structure can be made suitable for trailing by inserting cross beams between the columns at a height minimum 1250 above ground, see figure 3.6. The low bund around the area may be kept unfinished in the trailing track, so that the unit can be easily trailed into position. Alternatively the bund (if below 300mm) can be buried by gravel and plywood and trailed over. Two continuous trains are preferable, in order to avoid further transportation reinforcement of the structure. This is not needed for the capacity reason. Stairs and small external platforms can either be included, or installed and then dismounted before transportation.
Figure 3.6 Installation of Amine Heat Exchanger Rack [4].
Other possibilities which will require more re-design are as follows:
Install the superstructure on a sub-frame, allowing all piping in the ground-near volume to be pre-installed. The sub-frame to be grated and rest on low plinths above ground.
Install the heat exchangers on each side on separate sub-frames (forming two small outfitted skids) for separate transportation and installation. During fabrication these heat exchanger skids can be fitted in true position to the rack, and then dismounted for separate transportation.
Increase the height and width of structure slightly, and install the heat exchangers inside the structure. Introduce a sub-frame to support the heat exchangers on, and a grated deck at the lower location (approx. ±1.0m). Some additional bracings would be required.

81
Absorber Water Wash
The absorber water wash structure is designed with a large drum as a separate free standing unit, which is lifted in separately. It should be delivered fully dressed, standing vertically, in order to avoid up-ending and requirement for two cranes. Inside the structure is placed 3 large pumps on the ground level. A lot of piping is connected to the pumps. Insertion of transportation cross-beams between the columns will therefore demand that this piping is kept loose. The unit is therefore a clear candidate for using a sub-frame. Bolted jacking consoles should be included from the fabricator.
The unit is over 12m wide, so protruding items may have to be removed if the barging Option 3 concept is chosen. Possibilities that could be subjects for further evaluation are:
Look at integrating the drum on the sub-frame, including interconnecting piping Generally try to support piping on the structure to the largest degree Transport the structure with inserted transport beams, without the pumps and piping
hook-up spools. This eliminates the sub-frame and concrete pit, and avoids jacking, but increases installation and hook-up work. The hook-up work might be reduced by trial fitting the pumps and hook-up spools at the fabrication site. Pump plinths must be cast after PAU trail-in.
Consider to elevate the structure, and place with the sub-frame above ground, as a grated Level 1. Reduces the Civil and hook-up work after installation.
Seawater Filtration
The seawater filtration structure is a skid structure which might lack the necessary strength for transportation as a PAU. However, by introducing temporary trailing beams above the two large manifold pipes, it is possible to achieve the required strength. By placing the trailers outside of the structure, the transport beams can be used for temporary supporting of the manifolds, until supported from grade. With this method, a distance of approx. 3m is required between this structure and the adjacent Water Wash structure, to allow space for the trailer. The lower flight of stairs on the south side should be kept loose.
This method is primarily suited for the Ro-Ro load-in concept. The total width of the unit and trailers will be approx. 15m. Possibilities for further optimisation:
Expand the unit to include more of the interconnection ducts/ pipes If the total PAU weight amounts to less than a 100t, then it can be transported on top of a
double trailer train and lifted onto the foundations. However that will require lifting onto the trailers as well (Most suited for the Crane load-in concept).
Lean Amine Filters
The lean amine filter package could be delivered as a system package, and is proposed with a sub-frame (above ground) with all equipment integrated. The System Package definition normally comprises a demand for extended FAT (UFAT). The free standing filter vessel is assumed fully dressed from supplier, and delivered standing vertical. Both units are assumed light, and lift-in is conventional. (No difference from Stick Build approach).

82
Summary
The study has confirmed that it is technically feasible to proceed with a PAU / PAR design and construction strategy for the CCU plant, commencing from the start of the EPC phase.
A basic review of fabrication yards has indicated that there are sufficient, locally based fabrication yards with suitable process module experience, construction and loading facilities.
A PAU / PAR will reduce the interdependency at the site and civil work can proceed in parallel with fabrication. In addition PAU’s / PAR’s are delivered as multi-discipline units complete with piping, instrumentation, electrical, heat tracing, insulation, painted and pre-tested. This will minimise site installation and hook-up activities. The PAU/PAR approach is also expected to significantly improve the quality levels.
The size and weight constraints associated with road transportation, are not commensurate with the proposed PAU/PAR concept. A barging transportation strategy would therefore be required to implement the PAU / PAR approach. Three (3) barging Options were investigated and Option 1 was identified as the preferred option. This utilises a roll on/roll off facility for off-loading PAU’s / PAR’s.
Barging Option 1 requires authority approvals to utilise a small portion of a SSSI designated area. ScottishPower will need to obtain this approval prior to committing to this option.
The proposed construction approach is based on 3 installation campaign. Adoption of a PAU/PAR approach will impact the cost breakdown for the EPC phase.
The E&P effort costs will increase, but the Construction costs are expected to reduce, with an expected overall EPC cost saving. The potential construction cost saving is directly related to number of man hours transferred from the site to the fabrication yards, and the delta of site to fabrication yard labour rates and productivity.
On investigation, changing from a stick-build to a PAU/PAR concept does not impact the overall project schedule lead time. However based on APL experience, minimising site based man hours will effectively reduce the risk to the project schedule.
Adoption of PAU / PAR approach is expected to significantly improve site health and safety, and have less potential environmental impact at the site and on the local residents.
If the PAU / PAR approach is adopted, then there will be additional work to be carried out at commencement of the EPC.
References
No. Report Name
1 UKCCS - KT - S7.8 - E2E – 001: End-to-End Process Flow Diagram 2 UKCCS - KT - S7.8 - ACC – 001: Aker Clean Carbon Process Flow Diagrams 3 UKCCS - KT - S7.10 - ACC – 001: Aker Clean Carbon Heat and Mass Balance 4 UKCCS - KT - S7.14 - ACC – 001: Modularisation Study 5 UKCCS - KT - S7.13 - E2E – 001: End-to-End Major Equipment List 6 UKCCS - KT - S7.24 - E2E – 003: End-to-End CO2 Venting Philosophy

83
3.2 Kingsnorth CCS Demonstration Project
CCP Overview [1,2,9]:
The Kingsnorth Power Plant will include 2 x 800 MW hard coal fired power trains, one of these power trains will be fitted with a Carbon Capture Demonstration plant which will treat the flue gas from the production of around 400 MW of gross power or 300 MWe, equivalent after full chain CCS power use of around 100 MW is deducted. The Carbon Capture Plant will be capable of abating 6,600 t/d of CO2 from the flue gas at MCR. The process uses a proprietary, advanced, hindered amine solution with specially designed equipment components. This is based on a proven and advanced technology for recovering CO2 from the flue gases of various conditions. The deployment of this technology process shall lead to a number of advantages and benefits such as lower energy consumption, lower solution degradation and low corrosivity.
CCP Design Parameter
CCP Design Parameter
PCC plant life min. 25 years Total design number of starts over life time1
Cold starts (> 50 hrs shutdown) Warm starts (24 hrs shutdown)
Hot starts (8 hrs shutdown)
80 700 1 200
Load Changes (40-100%) 40 000 PCC plant availability > 90% Ramping speed2
From 30-50% From 50-90%
From 90-100%
2-3% of MCR/min 4-6% of MCR/min 2-3% of MCR/min
Noise Under normal steady operation the noise level at 1m from any item of plant does not exceed 80dB(A).
Safety system Hazardous area no Explosive protection no Passive fire protection no
CO2 capture rate 90% Sea water cooling demand 274 MWth (includes closed circuit) Closed circuit demineralized
water cooling demand
81.8 MWth
Note 1):
To be confirmed during detailed engineering. Note 2):
To be confirmed during detailed engineering. The Maximum Continuous Rating (MCR) point corresponds to flow rate of design Gas Condition.
Flue Gas Integration [2,9]
Approximately 47.3% of the flue gas will be extracted from the ductwork downstream of the FGD absorber and will be treated in the CCP. First the temperature, the SO2 amount and the water content will be reduced in the Quencher. After passing a blower, approx. 90 % of the CO2 content in the flue gas is bound to an absorption medium. In addition to the non-CO2 elements of the flue gas offered to the CCP, the 10% (approx.) of CO2 not removed in the

84
absorption column will be exhausted to the main flue gas stack. It is anticipated that the treated flue gas will be returned to the cold treated side of the gas-gas-heater (GGH) to be reheated before being discharged to the stack of the unit with the CC- Plant.
The composition and properties of the nominal flue gas condition at full boiler load is given in the table below. This condition is used for the material balance and for guarantee purpose. Data for partial boiler load is available as well.
Table 3.3 Flue gas specifications
Flue gas condition at FGD outlet Design gas condition
Mass flow rate [kg/h] wet, act. O2 3 157 6542
Flow rate [Nm3/h] wet, act O21 2 416 4242
[Nm3/h] dry, act O2 2 150 5392
Temperature1 [°C] 48.1 Pressure [mbar(a)] 1017.5 Composition
CO2 [%v] dry, act O2 15.3 N2
1 [%v] dry, act O2 80.6 Ar [%v] dry, act O2 - O2 [%v] dry, act O2 4.1 H2O (gas) [kg/h] 213.702 H2O (liquid) [kg/h] 32.3 HCl [mg/m3] dry, 6% O2 0.3 SO2 [mg/m3] dry, 6% O2 96.7 SO3 [mg/m3] dry, 6% O2 5 NOx [mg/m3] dry, 6% O2 < 100 Particulates [mg/m3] dry, 6% O2 7 Note 1)
Temperature and Flow Rate (Nm3/h Wet) are calculated by MHI using the flue gas composition specified Note 2)
Flue gas flow rate at Carbon capture plant inlet is 47.3% of design gas condition (i.e. Kleinkopje at full boiler Load). Flue gas flow rate at Carbon capture plant inlet: Flow Rate: 1,473,766 [kg/h](wet,act.O2) 1,143,118 [Nm3/h]( wet,act.O2) 1,017,338 [Nm3/h](dry,act.O2)
The minimum PCC plant operating point will be at 25% of nominal flue gas flow (i.e. 47.3% flue gas of 25% boiler load of 819 MWe coal fired boiler).

85
MHI’s Amine Capture Process [2,5,6]:
Figure 3.7 Block flow diagram for Kingsnorth CO2 capture plant (CCP)

86
Table 3.4 Stream data for Kingsnorth CO2 capture Plant (CCP)
1 2 3 4 5 6 7 8 9 10 11 12 13 14
Stream
Flue Gas
from FGD
NaOH
Quench
Deep
FGD
Waste
Water
Recov.
Quench
Water
Flue Gas
from
Quencher
Treated
Flue
Gas
Rich Amine
from
Absorber
Rich Amine
to Stripper
Lean
Amine
from
Stripper
Lean
Amine to
Absorber
LP
Steam
IP
Steam
Condens.
return to
PP
CO2 to
Compr.
MHI
Confidential MHI
Confidential MHI
Confidential MHI
Confidential Temperature °C 48 Amb. 48 39 31 32 214 277 134 35 Pressure bar(g) 0.005 - 2.5 2.5 -0.02 0.005 2.2 4.9 23 0.59 Flow Rate Nm³/h 1 143 118 1 065 197 920 033 145 164 Flow Rate kg/h 577 7 400 55 230 2 533 4961 329 5002 03 329 500 Composition H2O
vol% (wet)
11.0 75wt% 100wt% 100wt% 4.5 4.7 N2 71.7 77.0 89.1 O2 3.6 3.9 4.5 CO2 13.6 14.6 1.7 NOx
ppm (dry) 82.0 82.0 95.0
SOx ppm (dry) 38.0 < 1 0
Dust kg/h 8.0 1.1 < 1 KS-1 + H2O wt% 0 0 0 NaOH wt% 25 0 0 Others 0 0 0 Note:
1) Total Flow Rate for 10.1 + 10.2 2) Total Flow Rate for 11.1 + 11.2 3) Estimated demand for batch operation 900 kg/h (see Chapter 2)

87
General
Solvent KS-1™ (MHI proprietary, advanced, hindered amine solution) The advanced KS-1™ solvent has: High CO2 Loading (1.5 times higher than MEA solvent) Negligible Corrosion (does not need corrosion inhibitor) Lower Dissociation Heat (68% of MEA solvent regeneration heat
including all process aspects) Negligible Solvent Degradation (10% of MEA solvent)
Process Improvements
MHI‟s „Improved Process‟: Utilizes the semi lean solvent for the recovery of the lean solvent enthalpy. Steam consumption is reduced by 15% compared to MHI‟s conventional process including the effect of the condensate heat utilization. MHI‟s „Energy Saving Process‟ Utilizing absorber heat optimization, the newly developed „Energy Saving Process‟ can achieve approximately a further ~10% steam consumption reduction over MHI‟s „Improved Process‟ utilizing absorber heat optimization. To realize the absorber heat optimization with the „Energy Saving Process‟ under a wide range of commercial operating conditions, together with KS-1™ solvent, MHI modified the CO2 absorber process. The modification leads to improve absorption reaction efficiently.
Scale-up To accommodate a higher gas flow, MHI adds a standardized module. A large module can be accommodated without sacrificing standardization.
Solvent Storage
KS-1™ solvent is stored in a solution storage tank, on site, and the concentration is adjusted utilizing a solution sump tank and solution sump pump and fed to the process. A solution sump filter is utilized to clean the solvent and remove any particles. This system is also utilized during the periodical inspection when a drain out of the process is required.
Flue Gas Duct One flue gas damper shall be installed in the sucking point of the duct from the FGD Absorber of the existing boiler. The flue gas shall be extracted from the FGD Absorber outlet and fed to the CO2 capture plant through the duct by a flue gas blower and the treated gas is sent to the GGH treated side inlet through the outlet damper in one duct. In an emergency situation, in the event the flue gas blower is stopped suddenly with closing the inlet damper, flue gas shall by-pass the CO2 capture plant so that operation of the Power Plant shall not be affected by a sudden failure of the CO2 capture plant.
Flue Gas Quencher
Quantity 1 Column Type Rectangular packed tower Dimensions Area: 10 x 17 m
Height: 49 m Material of Construction
Stainless steel
Deep FGD Section (lower)
The flue gas enters into the integrated NaOH Deep FGD wash section in the bottom part of the quencher, a process similar to that applied for other MHI Deep FGD processes, where the flue gas is made to contact directly with an alkaline, pH controlled solution re-circulated by the flue gas wash water

88
pump for the specific absorption of SO2. The Deep FGD consists of a rectangular column which incorporates packing. Caustic soda solution will be fed from the caustic storage supply.
Wet EP Section (middle)
A Wet EP basically consists of the discharge electrode and the collecting electrode etc. The Wet EP unit is incorporated into the flue gas quencher in terms of minimizing the plot area for CO2 capture plant for this project.
Washing Section (upper)
The flue gas moves upward into the flue gas washing section, this also features a rectangular column and packing. The temperature of the flue gas from the Deep FGD is too high to feed directly into the CO2 absorber, because a lower flue gas temperature is preferred for the exothermic reaction of CO2 absorption and KS-1™ solvent consumption. The hot flue gas, therefore, shall be cooled in the flue gas quencher by contact with circulation water supplied from the top of the flue gas quencher, prior to entering the CO2 absorber. The water circulated by the flue gas cooling water pump is cooled by flue gas cooling water cooler and then enters into flue gas quencher.
Flue Gas Blower
Quantity 1 Type Axial Capacity 1 065 197 Nm³/h (Normal)
1 171 717 Nm³/h (Design) General The flue gas blower is required to draw the flue gas from the FGD Absorber
outlet to overcome the pressure drop between the flue gas quencher, the CO2 absorber and connecting duct including accessories such as the damper and the silencer. The flue gas blower will be installed downstream of the flue gas quencher.
Absorber
Quantity 1 Column Type Rectangular packed tower Dimensions Area: 10 x 14 m
Height: 72 m General The CO2 absorber consists of two main sections:
1) the CO2 absorption section in the lower part and 2) the treated flue gas washing section in the upper part.
Absorption Section
The cooled flue gas is introduced into the bottom section of the CO2 absorber. The flue gas moves upward through the packing material, while the CO2 lean, KS-1™ solvent is introduced from the top of the absorption section onto the packing. The flue gas contacts with the solvent on the surface of the packing, where CO2 in the flue gas is selectively absorbed by the solvent. The rich solvent from the bottom of the CO2 absorber is then directed to the regenerator via the solution heat exchange by the rich solution pump.
Water Wash Section
The flue gas from the CO2 absorption section moves upward into the wash section, Wash water is circulated in the upper part of the CO2 absorber to minimise emission. In addition, removing any vaporized solvent and is cooled down to maintain water balance within the system. The water wash section is split into two sub-sections. A circulation pump circulates the

89
Additional Utilities Information [2]
Steam Condensate:
a) Condensate Return required b) Condensate from CO2 recovery unit shall be discharged at 24 bar(a). Max. 137 ºC to
the outside of battery limit c) Steam Condensate Quality VGB-R 450 Le
water in each section, with an additional pump which circulates the water through the wash water cooler. The treated gas passes through the wash section and is cooled through direct contact with the wash water. The water wash section features a combination of packing. After that flue gas moves upward into Amine Deep Recovery System to minimise environmental emissions from CO2 Absorber.
Stripper
Quantity 2 Column Type Cylindrical tray/packed tower Dimensions Diameter: 7 m
Height: 39 m General Solvent regeneration shall take place in a stripper column, whereby the rich
solvent is steam-stripped, using low pressure steam, and CO2 is removed from the rich solvent. The rich solvent from the bottom of the CO2 absorber shall be heated by the lean solvent from the bottom of the regenerator in the solution heat exchanger. The heated rich solvent shall be introduced into the upper section of the regenerator, where it contacts with the stripping steam. The steam in the regenerator shall be produced by the regenerator reboiler, which uses LP steam to boil the lean solvent. LP steam will be provided by the turbine system and the condensate from the regenerator is collected at the steam condensate drum and then pumped by the steam condensate return pump. The overhead vapour shall be cooled by the regenerator condenser system. The condensed water shall be returned from the regenerator condenser system to the top of the regenerator by the regenerator reflux pump. The product CO2 gas is led to the following system. The lean solvent shall then be cooled to the optimum reaction temperature by the solution heat exchanger and lean solution cooler prior to being sent to the CO2 absorber by the lean solution pumps and the process starts again within a closed cycle. A portion of lean solvent flows through an absorbent purification system to remove oil and other soluble impurities.
Reclaimer
Type Intermittent batch operation General A reclaiming system shall be provided in order to remove the HSS (Heat
Stable Salts) accumulated in the KS-1™ solvent. When the HSS content in the solvent reaches a pre-defined, maximum limit, the reclaiming system shall be operated to reduce HSS. After operating the reclaiming system, reclaimed waste shall remain in the system and KS-1™ solvent shall be recovered as vapour.
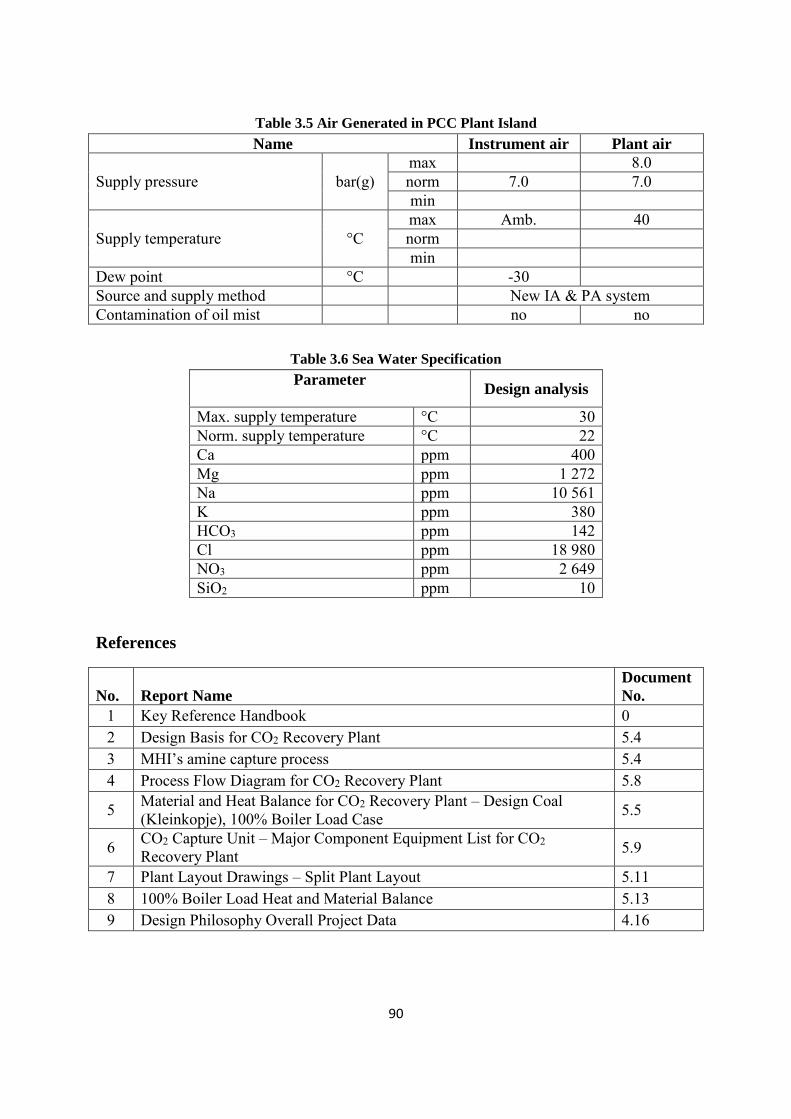
90
Table 3.5 Air Generated in PCC Plant Island
Name Instrument air Plant air
Supply pressure bar(g) max 8.0 norm 7.0 7.0 min
Supply temperature °C max Amb. 40 norm min
Dew point °C -30 Source and supply method New IA & PA system Contamination of oil mist no no
Table 3.6 Sea Water Specification
Parameter
Design analysis
Max. supply temperature °C 30 Norm. supply temperature °C 22 Ca ppm 400 Mg ppm 1 272 Na ppm 10 561 K ppm 380 HCO3 ppm 142 Cl ppm 18 980 NO3 ppm 2 649 SiO2 ppm 10
References
No. Report Name
Document
No.
1 Key Reference Handbook 0 2 Design Basis for CO2 Recovery Plant 5.4 3 MHI’s amine capture process 5.4 4 Process Flow Diagram for CO2 Recovery Plant 5.8
5 Material and Heat Balance for CO2 Recovery Plant – Design Coal (Kleinkopje), 100% Boiler Load Case 5.5
6 CO2 Capture Unit – Major Component Equipment List for CO2 Recovery Plant 5.9
7 Plant Layout Drawings – Split Plant Layout 5.11 8 100% Boiler Load Heat and Material Balance 5.13 9 Design Philosophy Overall Project Data 4.16

91
CHAPTER 4: CO2 COMPRESSION & DEHYDRATION
4.1 Longannet Power Station to Goldeneye Reservoir CCS Demo Project
The CO2 stream from the CCP will be compressed and CO2 is then dried and de-oxygenated for export as a vapour via the National Grid 900 mm (36”) diameter pipeline to a compression facility at St Fergus. At St Fergus the CO2 will be compressed into dense phase, transported to the Goldeneye Platform and injected into the Goldeneye reservoir in the North Sea. The Blackhill Compressor Station and the St Fergus terminal are located approximately 64km North East of Aberdeen, 8km from Peterhead on the North East coast of Scotland [1].
In between compression stages, cooling and condensation/removal of water will be included. Safety guarding/shutdown block valves will surround each unit operation/stage to allow ease of use for start-up and shut-down scenarios.
Figure 4.1 Preliminary CO2 Capture, Compression & Conditioning Plant Layout [1]

92
CO2 Compression at Longannet Power Station [1]
Two 50% compression and drying trains are planned to meet the availability requirements and to match the operation of the capture plant.
CO2 Compression at Longannet Power station overview
Capacity Each compression train will handle 1 million tonnes of CO2 per annum compressed to 37 bar(g) for export into the National Grid pipeline. The CO2 will be compressed from 0.5 bar(g) to 37 bar(g) and 30ºC and exported via the National Grid pipeline in the vapour phase
Compressor Type
Integrally geared, the number of stages will be confirmed by the vendor who will design the machine and the associated ancillaries which are part of the package.
Location The CO2 compression and conditioning plants will be located adjacent to the existing sub-critical power station
Dehydration and Transport Conditioning [1]
Free water combined with CO2 forms carbonic acid (H2CO3) which is detrimental to carbon steel components, such as pipelines, causing corrosion on the internal surfaces. Additionally, at elevated pressures and ambient temperature, hydrates can form which could cause blockages in equipment, valves and pipelines. To minimise formation of carbonic acid or hydrates during CO2 transportation, a dehydration plant will be included following CO2 compression at Longannet. The dehydration scheme is shown in Figure below [1].
Figure 4.2 Schematic diagram of dehydration unit [1].
CO2 Dehydration unit overview
Moisture removal level
50 ppm (wt.)
CO2 purity >90% O2 Level <1 ppmv [7]
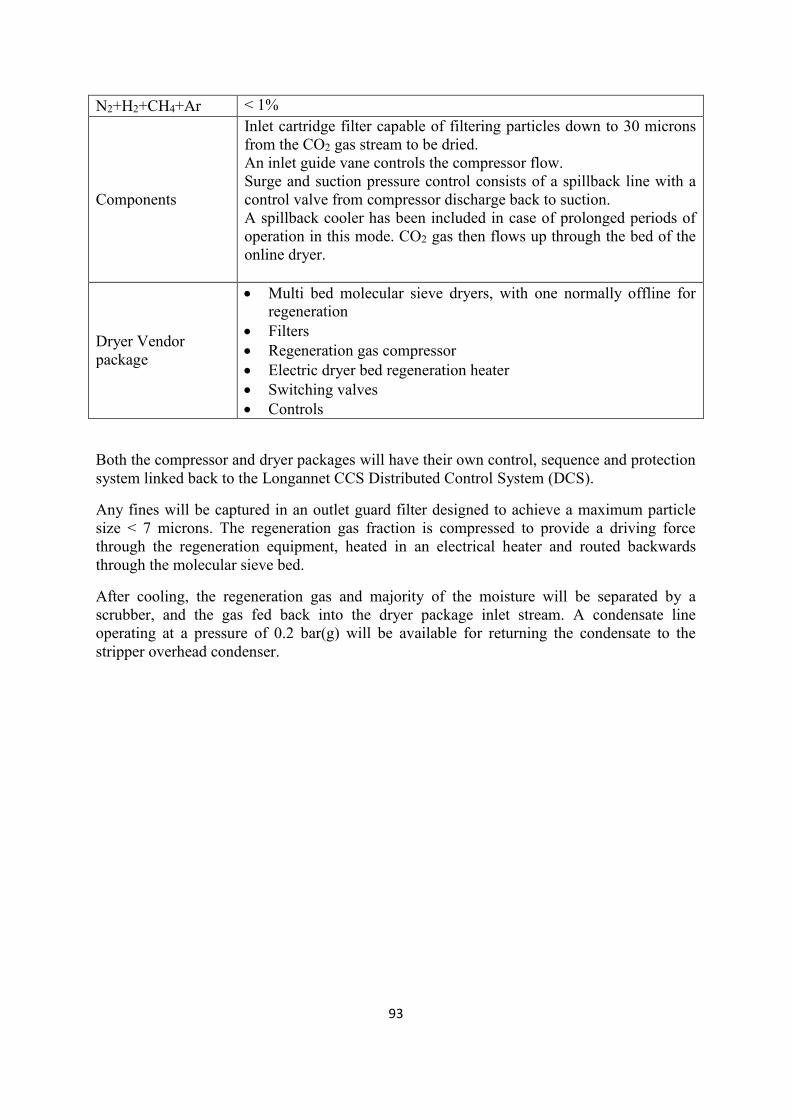
93
N2+H2+CH4+Ar < 1%
Components
Inlet cartridge filter capable of filtering particles down to 30 microns from the CO2 gas stream to be dried. An inlet guide vane controls the compressor flow. Surge and suction pressure control consists of a spillback line with a control valve from compressor discharge back to suction. A spillback cooler has been included in case of prolonged periods of operation in this mode. CO2 gas then flows up through the bed of the online dryer.
Dryer Vendor package
Multi bed molecular sieve dryers, with one normally offline for regeneration
Filters Regeneration gas compressor Electric dryer bed regeneration heater Switching valves Controls
Both the compressor and dryer packages will have their own control, sequence and protection system linked back to the Longannet CCS Distributed Control System (DCS).
Any fines will be captured in an outlet guard filter designed to achieve a maximum particle size < 7 microns. The regeneration gas fraction is compressed to provide a driving force through the regeneration equipment, heated in an electrical heater and routed backwards through the molecular sieve bed.
After cooling, the regeneration gas and majority of the moisture will be separated by a scrubber, and the gas fed back into the dryer package inlet stream. A condensate line operating at a pressure of 0.2 bar(g) will be available for returning the condensate to the stripper overhead condenser.

94
1
2
Drain
4
6
5
Knock Vessel 1
Knock Vessels
Knock Vessel 2
CO2 Pre Conditioning Vessel Bed
Compressor1st Stage
CompressorLast Stage
Condensate to Stripper System Reflux
10
7
9
CO2 Drying Package
(Molecular Sieve)
CO2 Vent (To New Stack)
CO2 Onshore Transportation
Pipeline
Sea Water In
Sea Water Out
14
Condensate to Stripper
System Reflux
12
8
H2
Condensate to Stripper System Reflux
CO2 from Capture Plant
11
13
3
Figure 4.3 Process flow diagram of compressor train at Longannet power plant [2].
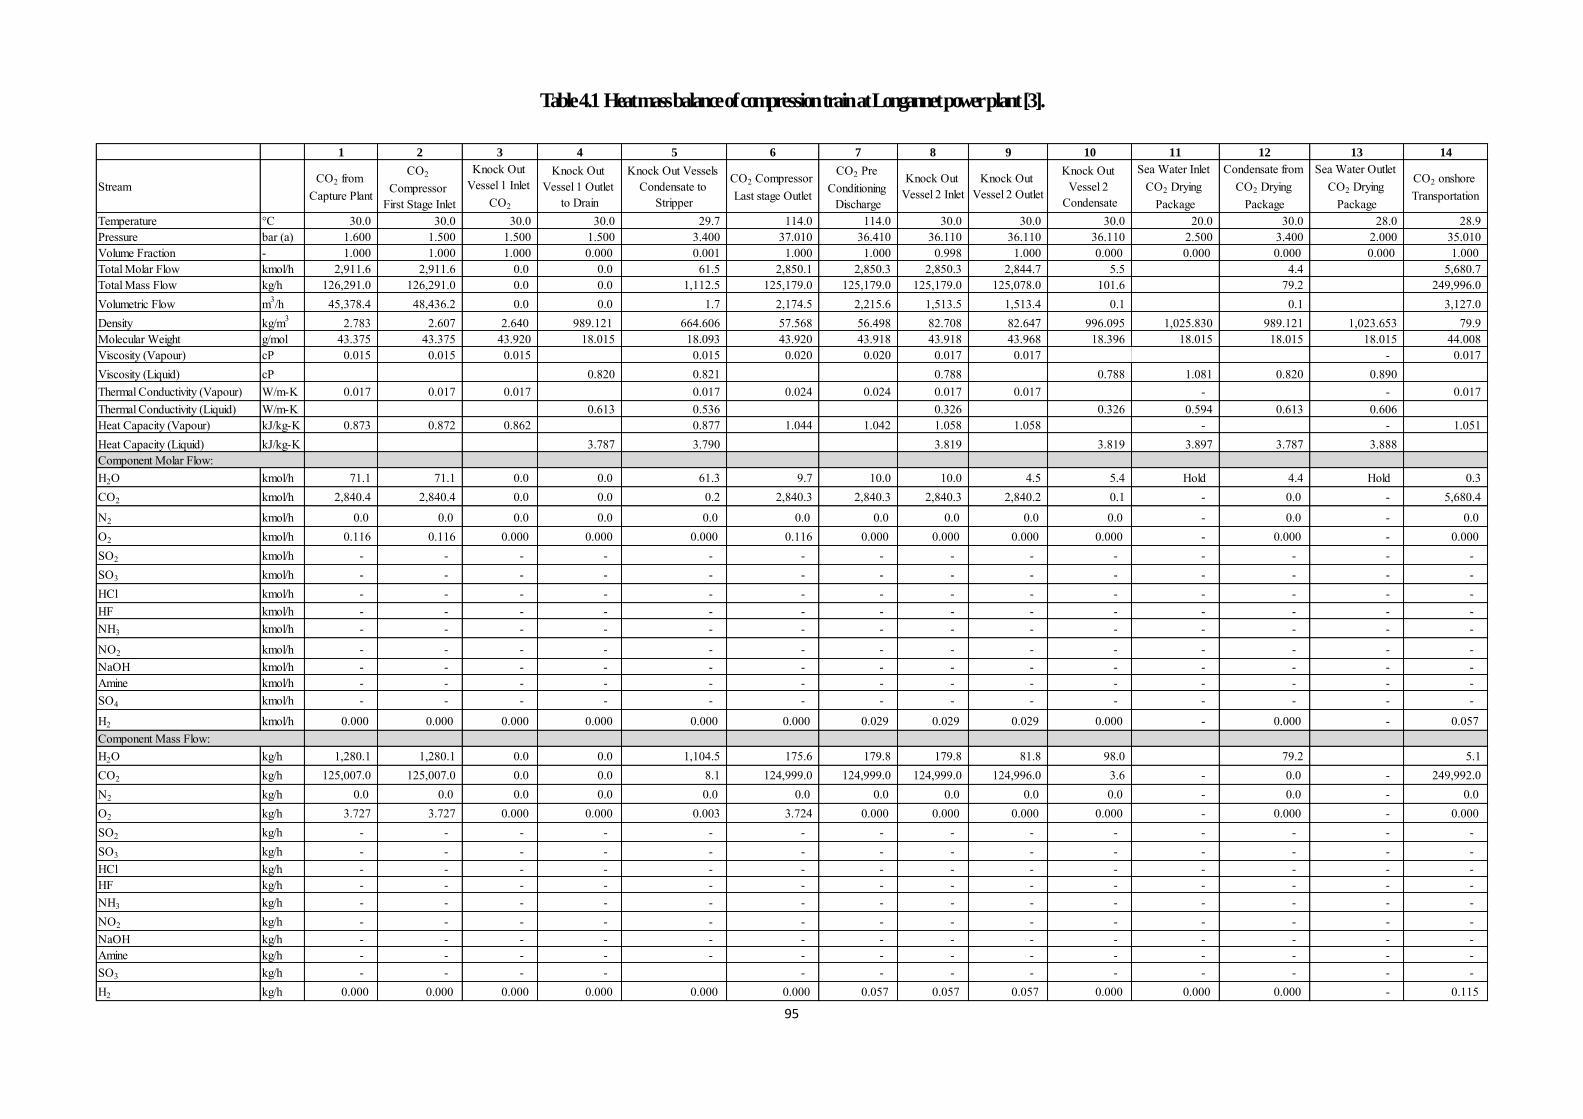
95
Table 4.1 Heat mass balance of compression train at Longannet power plant [3].
1 2 3 4 5 6 7 8 9 10 11 12 13 14
StreamCO2 from
Capture Plant
CO2 Compressor
First Stage Inlet
Knock Out Vessel 1 Inlet
CO2
Knock Out Vessel 1 Outlet
to Drain
Knock Out Vessels Condensate to
Stripper
CO2 Compressor Last stage Outlet
CO2 Pre Conditioning
Discharge
Knock Out Vessel 2 Inlet
Knock Out Vessel 2 Outlet
Knock Out Vessel 2
Condensate
Sea Water Inlet CO2 Drying
Package
Condensate from CO2 Drying
Package
Sea Water Outlet CO2 Drying
Package
CO2 onshore Transportation
Temperature °C 30.0 30.0 30.0 30.0 29.7 114.0 114.0 30.0 30.0 30.0 20.0 30.0 28.0 28.9 Pressure bar (a) 1.600 1.500 1.500 1.500 3.400 37.010 36.410 36.110 36.110 36.110 2.500 3.400 2.000 35.010 Volume Fraction - 1.000 1.000 1.000 0.000 0.001 1.000 1.000 0.998 1.000 0.000 0.000 0.000 0.000 1.000Total Molar Flow kmol/h 2,911.6 2,911.6 0.0 0.0 61.5 2,850.1 2,850.3 2,850.3 2,844.7 5.5 4.4 5,680.7 Total Mass Flow kg/h 126,291.0 126,291.0 0.0 0.0 1,112.5 125,179.0 125,179.0 125,179.0 125,078.0 101.6 79.2 249,996.0 Volumetric Flow m3/h 45,378.4 48,436.2 0.0 0.0 1.7 2,174.5 2,215.6 1,513.5 1,513.4 0.1 0.1 3,127.0 Density kg/m3 2.783 2.607 2.640 989.121 664.606 57.568 56.498 82.708 82.647 996.095 1,025.830 989.121 1,023.653 79.9 Molecular Weight g/mol 43.375 43.375 43.920 18.015 18.093 43.920 43.918 43.918 43.968 18.396 18.015 18.015 18.015 44.008 Viscosity (Vapour) cP 0.015 0.015 0.015 0.015 0.020 0.020 0.017 0.017 - 0.017 Viscosity (Liquid) cP 0.820 0.821 0.788 0.788 1.081 0.820 0.890 Thermal Conductivity (Vapour) W/m-K 0.017 0.017 0.017 0.017 0.024 0.024 0.017 0.017 - - 0.017 Thermal Conductivity (Liquid) W/m-K 0.613 0.536 0.326 0.326 0.594 0.613 0.606 Heat Capacity (Vapour) kJ/kg-K 0.873 0.872 0.862 0.877 1.044 1.042 1.058 1.058 - - 1.051 Heat Capacity (Liquid) kJ/kg-K 3.787 3.790 3.819 3.819 3.897 3.787 3.888
H2O kmol/h 71.1 71.1 0.0 0.0 61.3 9.7 10.0 10.0 4.5 5.4 Hold 4.4 Hold 0.3 CO2 kmol/h 2,840.4 2,840.4 0.0 0.0 0.2 2,840.3 2,840.3 2,840.3 2,840.2 0.1 - 0.0 - 5,680.4
N2 kmol/h 0.0 0.0 0.0 0.0 0.0 0.0 0.0 0.0 0.0 0.0 - 0.0 - 0.0O2 kmol/h 0.116 0.116 0.000 0.000 0.000 0.116 0.000 0.000 0.000 0.000 - 0.000 - 0.000SO2 kmol/h - - - - - - - - - - - - - -SO3 kmol/h - - - - - - - - - - - - - -HCl kmol/h - - - - - - - - - - - - - -HF kmol/h - - - - - - - - - - - - - -NH3 kmol/h - - - - - - - - - - - - - -
NO2 kmol/h - - - - - - - - - - - - - -NaOH kmol/h - - - - - - - - - - - - - -Amine kmol/h - - - - - - - - - - - - - -SO4 kmol/h - - - - - - - - - - - - - -
H2 kmol/h 0.000 0.000 0.000 0.000 0.000 0.000 0.029 0.029 0.029 0.000 - 0.000 - 0.057
H2O kg/h 1,280.1 1,280.1 0.0 0.0 1,104.5 175.6 179.8 179.8 81.8 98.0 79.2 5.1 CO2 kg/h 125,007.0 125,007.0 0.0 0.0 8.1 124,999.0 124,999.0 124,999.0 124,996.0 3.6 - 0.0 - 249,992.0 N2 kg/h 0.0 0.0 0.0 0.0 0.0 0.0 0.0 0.0 0.0 0.0 - 0.0 - 0.0O2 kg/h 3.727 3.727 0.000 0.000 0.003 3.724 0.000 0.000 0.000 0.000 - 0.000 - 0.000SO2 kg/h - - - - - - - - - - - - - -SO3 kg/h - - - - - - - - - - - - - -HCl kg/h - - - - - - - - - - - - - -HF kg/h - - - - - - - - - - - - - -NH3 kg/h - - - - - - - - - - - - - -NO2 kg/h - - - - - - - - - - - - - -NaOH kg/h - - - - - - - - - - - - - -Amine kg/h - - - - - - - - - - - - - -SO3 kg/h - - - - - - - - - - - - -H2 kg/h 0.000 0.000 0.000 0.000 0.000 0.000 0.057 0.057 0.057 0.000 0.000 0.000 - 0.115
Component Molar Flow:
Component Mass Flow:
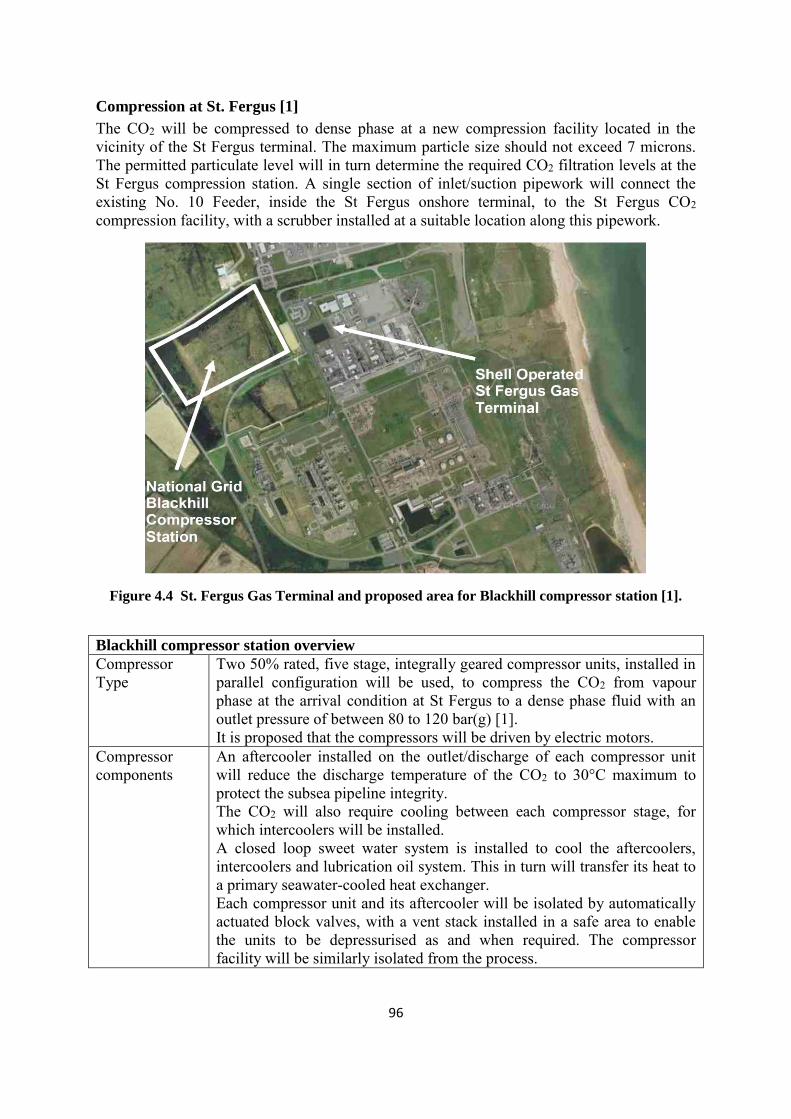
96
Compression at St. Fergus [1]
The CO2 will be compressed to dense phase at a new compression facility located in the vicinity of the St Fergus terminal. The maximum particle size should not exceed 7 microns. The permitted particulate level will in turn determine the required CO2 filtration levels at the St Fergus compression station. A single section of inlet/suction pipework will connect the existing No. 10 Feeder, inside the St Fergus onshore terminal, to the St Fergus CO2 compression facility, with a scrubber installed at a suitable location along this pipework.
Figure 4.4 St. Fergus Gas Terminal and proposed area for Blackhill compressor station [1].
Blackhill compressor station overview
Compressor Type
Two 50% rated, five stage, integrally geared compressor units, installed in parallel configuration will be used, to compress the CO2 from vapour phase at the arrival condition at St Fergus to a dense phase fluid with an outlet pressure of between 80 to 120 bar(g) [1]. It is proposed that the compressors will be driven by electric motors.
Compressor components
An aftercooler installed on the outlet/discharge of each compressor unit will reduce the discharge temperature of the CO2 to 30°C maximum to protect the subsea pipeline integrity. The CO2 will also require cooling between each compressor stage, for which intercoolers will be installed. A closed loop sweet water system is installed to cool the aftercoolers, intercoolers and lubrication oil system. This in turn will transfer its heat to a primary seawater-cooled heat exchanger. Each compressor unit and its aftercooler will be isolated by automatically actuated block valves, with a vent stack installed in a safe area to enable the units to be depressurised as and when required. The compressor facility will be similarly isolated from the process.

97
The design case for the Heat and Mass Balance is based on the base case process conditions for the CO2 entering the onshore pipeline at Longannet Power Station.
Parameter Value Remark
Mass Flow 252,688 kg/h As base case Composition CO2 99.96 Mole%
H2O 0.01 Mole% N2 0.03 Mole%
As base case
Pipeline Inlet Pressure 32.5 bar(g) Design assumption Pipeline Inlet Temperature 35°C Design assumption
Pressure Drop Assumptions [4]
It is not possible to model the equipment items such as knockout drums, flow metering devices, filters, etc. as details are not yet available. For each unit a simple valve model with a fixed pressure drop has been used to represent the equipment item.
Pipeline Model assumption [4]
The entire pipeline: including new pipe sections from Longannet Power Station to the connection point to No 10 Feeder, are modelled as a single entity. A margin of 20% has been added to the total length of the system to allow for inclines and fittings. The heat loss from the pipeline to the ground has not been modelled at this stage and the temperature has been set at 10°C at the entry point to Blackhill Compressor station. The pipeline roughness value of 0.15 mm has been selected as a typical value as the internal condition of the existing pipeline is not known at this time.
Compressor Model [4]
Three compression trains are to be installed; each rated at 50% capacity of the base case flow. It is assumed that each of the compressors will be identical apart from the means of the drivers.
Two compressors are to be driven by variable speed electric drive motors and one using a gas turbine.
The different drives are not included in the model at this stage as the equipment details have not been defined.
The compressor recycle system has not been modelled in the base case scenario as it is not intended to be required at this operating condition.
Aftercooler and Chiller [4]
Each compression train will have a fin fan cooler installed where the gas stream is cooled using electrically driven fans.
Additional cooling will be required at periods of high ambient conditions and this will be provided by a common heat exchanger using a refrigerant to remove heat from the pipeline system.
The aftercoolers and heat exchanger are vendor packages and details are not available at this time therefore these are modelled as simple coolers and detailed heat transfer is not included at this stage.

98
Ambient Conditions
Ambient conditions will vary along the length of the CCS chain with significant differences between onshore and offshore conditions. Design ambient conditions at St Fergus sites mentioned in this study are as follows:
Table 4.2 Design Ambient Conditions for the St Fergus Site.
Design Ambient Conditions for the St Fergus Site
The design ambient conditions for the National Grid pipeline [NG/Shell to confirm] Ambient temperature, design point 20°C Ambient temperature, maximum 29 °C Ambient temperature, minimum -15 °C Design atmospheric pressure 1013 mbara Relative humidity range [Hold – NG to advise] RH average [Hold – NG to advise] Design wind speed [Hold – NG to advise] Annual Rainfall [Hold – NG to advise] Design seismic case [Hold – NG to advise] Corrosive coastal environment [Hold – NG to advise]
Note: NG is National Grid
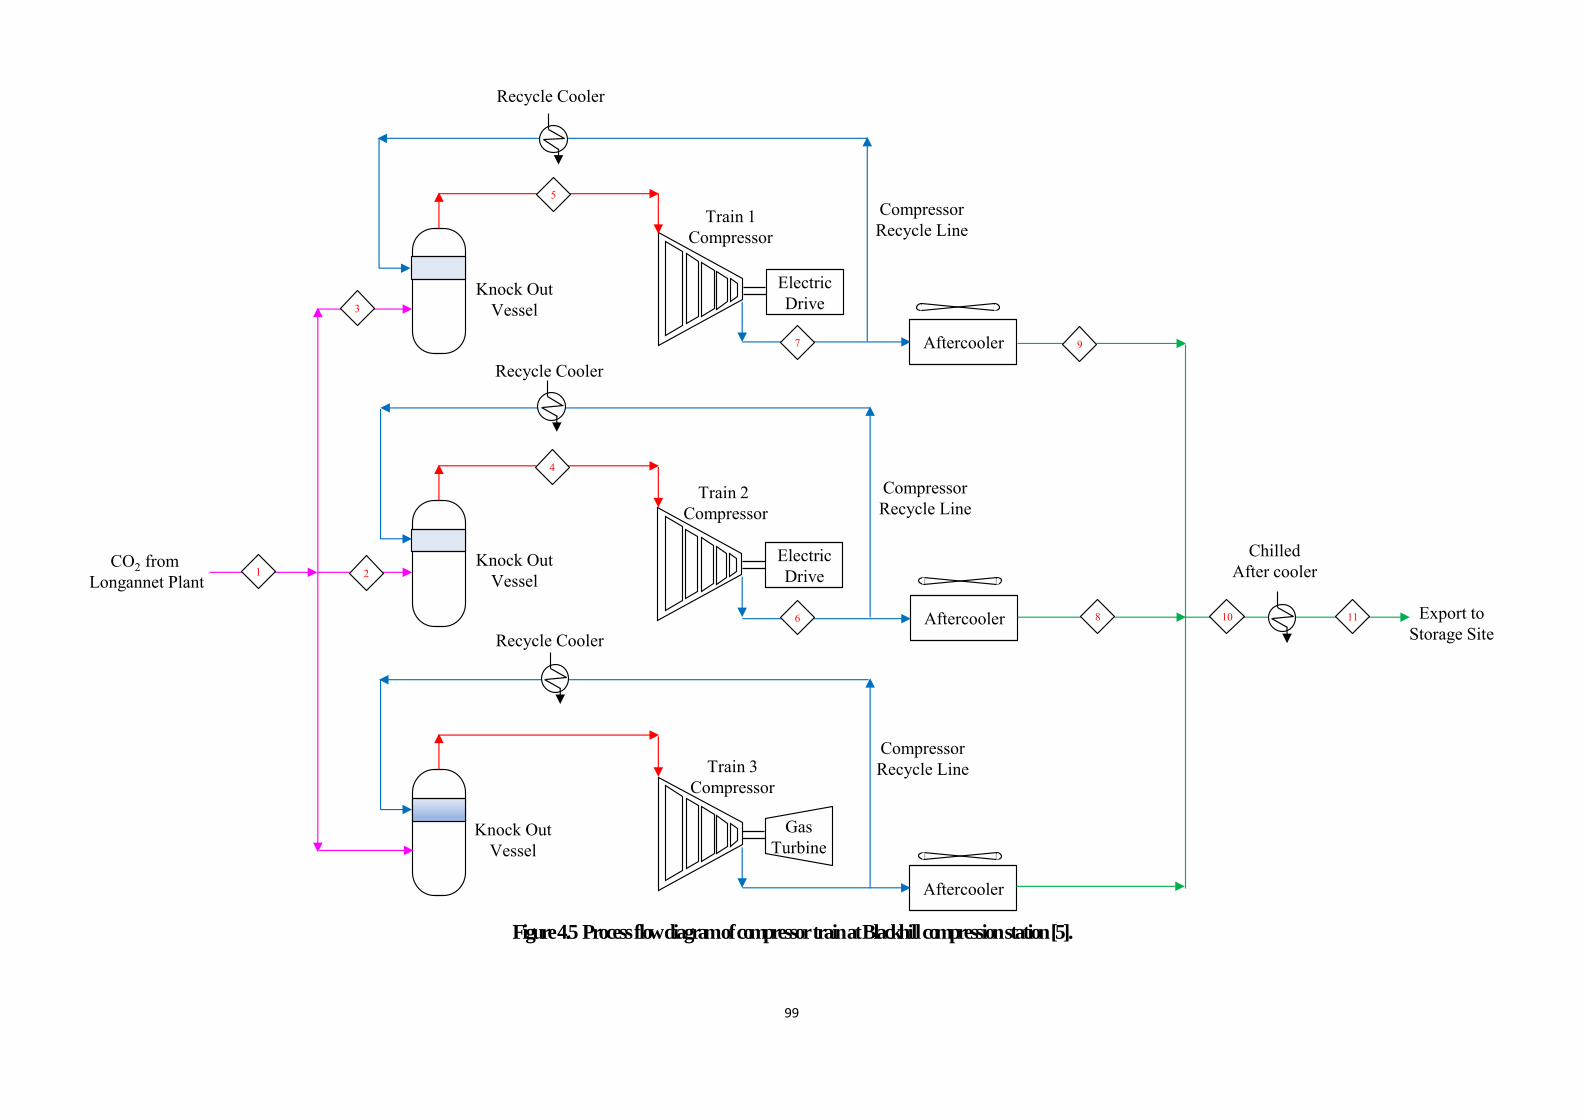
99
CO2 from Longannet Plant
Aftercooler
Aftercooler
Aftercooler
Electric Drive
Gas Turbine
1 2
4
9
10 116
7
5
3
8
Train 1 Compressor
Train 3 Compressor
Train 2Compressor
Knock OutVessel
Knock OutVessel
Knock OutVessel
Recycle Cooler
ChilledAfter cooler
Recycle Cooler
Recycle CoolerExport to
Storage Site
CompressorRecycle Line
CompressorRecycle Line
CompressorRecycle Line
Electric Drive
Figure 4.5 Process flow diagram of compressor train at Blackhill compression station [5].
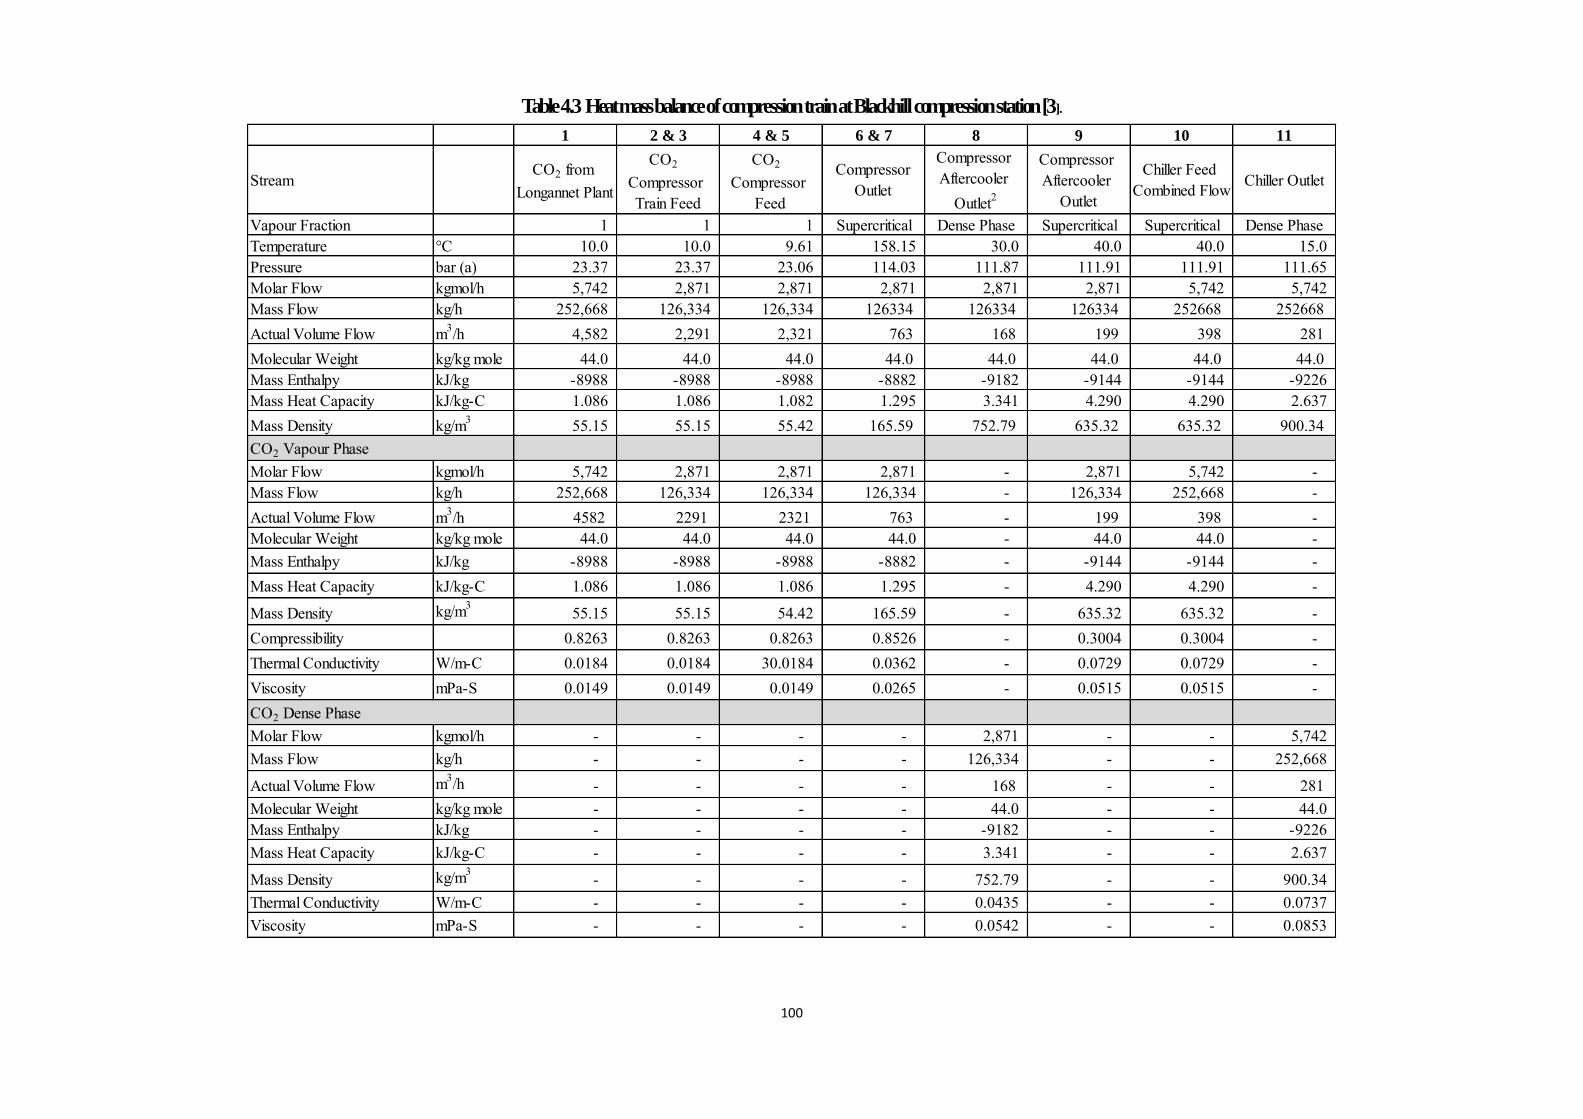
100
Table 4.3 Heat mass balance of compression train at Blackhill compression station [3].
1 2 & 3 4 & 5 6 & 7 8 9 10 11
StreamCO2 from
Longannet Plant
CO2 Compressor Train Feed
CO2 Compressor
Feed
Compressor Outlet
Compressor Aftercooler
Outlet2
Compressor Aftercooler
Outlet
Chiller Feed Combined Flow Chiller Outlet
Vapour Fraction 1 1 1 Supercritical Dense Phase Supercritical Supercritical Dense PhaseTemperature °C 10.0 10.0 9.61 158.15 30.0 40.0 40.0 15.0 Pressure bar (a) 23.37 23.37 23.06 114.03 111.87 111.91 111.91 111.65 Molar Flow kgmol/h 5,742 2,871 2,871 2,871 2,871 2,871 5,742 5,742 Mass Flow kg/h 252,668 126,334 126,334 126334 126334 126334 252668 252668Actual Volume Flow m3/h 4,582 2,291 2,321 763 168 199 398 281Molecular Weight kg/kg mole 44.0 44.0 44.0 44.0 44.0 44.0 44.0 44.0Mass Enthalpy kJ/kg -8988 -8988 -8988 -8882 -9182 -9144 -9144 -9226Mass Heat Capacity kJ/kg-C 1.086 1.086 1.082 1.295 3.341 4.290 4.290 2.637 Mass Density kg/m3 55.15 55.15 55.42 165.59 752.79 635.32 635.32 900.34CO2 Vapour PhaseMolar Flow kgmol/h 5,742 2,871 2,871 2,871 - 2,871 5,742 -Mass Flow kg/h 252,668 126,334 126,334 126,334 - 126,334 252,668 -Actual Volume Flow m3/h 4582 2291 2321 763 - 199 398 -Molecular Weight kg/kg mole 44.0 44.0 44.0 44.0 - 44.0 44.0 -Mass Enthalpy kJ/kg -8988 -8988 -8988 -8882 - -9144 -9144 -Mass Heat Capacity kJ/kg-C 1.086 1.086 1.086 1.295 - 4.290 4.290 -
Mass Density kg/m3 55.15 55.15 54.42 165.59 - 635.32 635.32 -Compressibility 0.8263 0.8263 0.8263 0.8526 - 0.3004 0.3004 -Thermal Conductivity W/m-C 0.0184 0.0184 30.0184 0.0362 - 0.0729 0.0729 -Viscosity mPa-S 0.0149 0.0149 0.0149 0.0265 - 0.0515 0.0515 -CO2 Dense PhaseMolar Flow kgmol/h - - - - 2,871 - - 5,742 Mass Flow kg/h - - - - 126,334 - - 252,668
Actual Volume Flow m3/h - - - - 168 - - 281Molecular Weight kg/kg mole - - - - 44.0 - - 44.0 Mass Enthalpy kJ/kg - - - - -9182 - - -9226Mass Heat Capacity kJ/kg-C - - - - 3.341 - - 2.637
Mass Density kg/m3 - - - - 752.79 - - 900.34 Thermal Conductivity W/m-C - - - - 0.0435 - - 0.0737 Viscosity mPa-S - - - - 0.0542 - - 0.0853

101
Notes: 1. Composition for all streams are as follows:
Mole Fraction Mole Fraction
CO2 0.99965 0.99979 N2 0.00030 0.00019 H2O 0.00005 0.00002 Total 1 1
2. Aftercooler Design conditions are based on 20°C Ambient temperature and approach for 10°C. Giving
30°C aftercooler exit temperature. In warm weather these conditions cannot be achieved and the Chiller will be required to cool from 40°C.
Venting [8]
Permanent vents are required at the Blackhill Compressor Station and the Goldeneye platform for maintenance and pressure relief. These vents will be sized for their local operation but will be minor in comparison to the venting system at Longannet. Venting at any other location will be accommodated by the use of temporary vents.
Determination of the performance requirements which will be used to size the permanent vents at Blackhill and Goldeneye and also the temporary vents, including their locations, will be developed during the project implementation phase.
Vent sizing will be dependent on many factors that will be considered further during the implementation phase, including vent velocities, dispersion patterns, and noise, as well as the duration, rate and volume of CO2 to be vented. Material specification and cryogenic effects may also be a factor in sizing vents.
The venting system will be designed to combine vented streams, where practical, to reduce the number of CO2 release points. Where this is not practical, e.g. for minor vents, then venting should be carried out in well ventilated areas.
Venting out-of-specification CO2
In addition to manual venting for depressurisation some of the equipment in the CCS chain, such as the compressors, may include automatic depressurisation as part of their operating sequence.
Modularization [6]
Dryer
The Dryer PAU has column positions less than the width of the trailer. Due to the expected weight lower than 110t, it is straight forward to transport on a double trailer and lift on to foundations by a mobile crane. In the barging Option 1 (Ro-Ro) case for load-in, it is assumed similarly to be lifted onto the trailers. The unit for Train 2 is located on the same side of the main pipe rack. It should therefore be considered to be delivered and installed in the same campaign as the unit for Train 1.

102
Figure 4.6 Dryer PAU trailing – Vendor Package [6].
Possibilities for further optimisation are:
Include more of the adjacent pipe work, assuming this can be supported on the PAU frame, permanently or temporarily.
Consider a separate preassembled section for this piping.
Compressor
The unit containing the pre-conditioning vessel and discharge cooler is considered to be well suited for making as a PAU. Transportation beams are proposed integrated. Due to the placing of unit for Train 2 on the north side of the main pipe rack, it should be considered to install the unit at the same time as unit for Train 1.
Compression Inlet/Outlet
The compression suction KO drum (70Te) and discharge cooler structure is not well suited for modularisation as is. The drum is placed on ground level (Drum bottom 750 above ground). This complicates the integration in a PAU suited for trailing. The problem can be solved in the following way:

103
Figure 4.7 Compressor PAU210-1 and 2201-2 part 1, -1 and -2 (Sequence 10/12) [6].
A sub-frame is introduced, but mounted above ground. The sub-frame will have grating and provides an access and service platform.
The following alternatives are possible:
1. The whole structure can be built onto a sub-frame, trailed to position and jacked down in a pre-cast pit. Strengthening of the structure for lifting and/or trailing will be required. Refer to figure 8.20. It is assumed that the volume below the floor will be used for some piping and valves, cable trays etc.
2. The compressor suction KO drum is elevated approx. 0.5m, in order to allow integrated supports beams to be permanent. Temporary steel between the columns in the wing spaces will be support for the trailers. The trailers can then place the unit directly onto the plinths, without requiring a separate jacking operation. After setting the module, the support ring for the drum may be under cast, to ensure even support to ground.
3. It should be evaluated whether this unit can be useful in a FAT test setup of the compressors, and for this reason should be delivered by the compressor vendor.
The unit is numbered similar to the pre-conditioning vessel structure, and should get a separate number for reference.

104
References
No. Report Name
1 UKCCS - KT - S7.1 - E2E – 001 Post-FEED End-to-End Basis of Design 2 UKCCS-KT-S7.8-ACC-001 PFD for Compression and dehydration
3 UKCCS-KT-S7.10-ACC-001 Heat and Mass Balance Compression and dehydration
4 UKCCS - KT - S7.10 - NG – 001 (KT-PFD-0810-014 Base Case Heat & Mass Balance)
5 UKCCS - KT - S7.8 - NG – 001 (page 12-14) 6 UKCCS - KT - S7.14 - ACC – 001, Modularisation Study
7 UK CCS Demonstration Competition FEED Dissemination Event, 5-6 December 2011; PRE412_SP_KT_Event_20111205 presentation
8 UKCCS - KT - S7.24 - E2E – 003 End-to-End CO2 Venting Philosophy
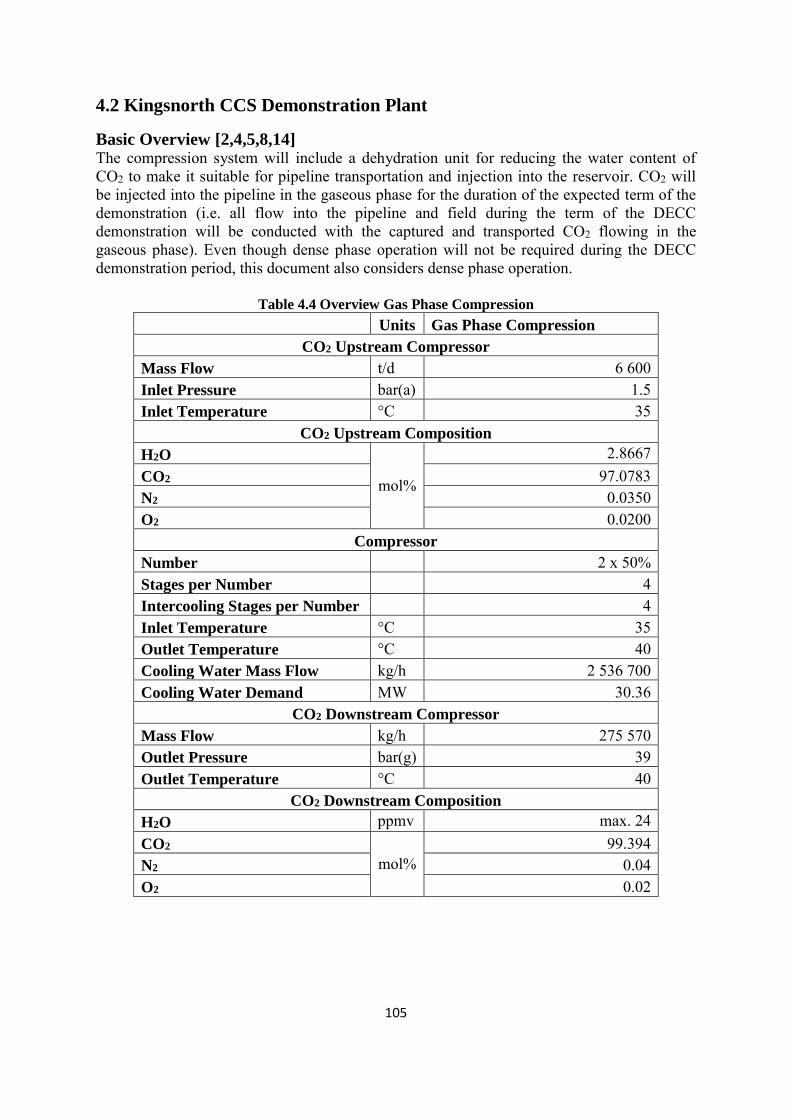
105
4.2 Kingsnorth CCS Demonstration Plant
Basic Overview [2,4,5,8,14] The compression system will include a dehydration unit for reducing the water content of CO2 to make it suitable for pipeline transportation and injection into the reservoir. CO2 will be injected into the pipeline in the gaseous phase for the duration of the expected term of the demonstration (i.e. all flow into the pipeline and field during the term of the DECC demonstration will be conducted with the captured and transported CO2 flowing in the gaseous phase). Even though dense phase operation will not be required during the DECC demonstration period, this document also considers dense phase operation.
Table 4.4 Overview Gas Phase Compression
Units Gas Phase Compression
CO2 Upstream Compressor
Mass Flow t/d 6 600 Inlet Pressure bar(a) 1.5 Inlet Temperature °C 35
CO2 Upstream Composition
H2O
mol%
2.8667 CO2 97.0783 N2 0.0350 O2 0.0200
Compressor
Number 2 x 50% Stages per Number 4 Intercooling Stages per Number 4 Inlet Temperature °C 35 Outlet Temperature °C 40 Cooling Water Mass Flow kg/h 2 536 700 Cooling Water Demand MW 30.36
CO2 Downstream Compressor
Mass Flow kg/h 275 570 Outlet Pressure bar(g) 39 Outlet Temperature °C 40
CO2 Downstream Composition
H2O ppmv max. 24 CO2
mol% 99.394
N2 0.04 O2 0.02

106
Table 4.5 Overview Dehydration Unit
Units Dehydration Unit
IP Steam Mass Flow1 kg/h 733 IP Steam Pressure bar(a) 13.59 IP Steam Temperature °C 390 Condensate Mass Flow1 kg/h 733 Condensate Pressure bar(a) 12.9 Condensate Temperature °C 191.5 Note:
1) Mass flows for IP Steam and Condensate are a time-average.
Table 4.6 Overview Dense Phase Compression
Units Dense Phase Compression
Compressor
Number 2 Stages per Number 2 Intercooling Stages per Number 2 Inlet Temperature °C 40 Outlet Temperature °C 40 Cooling Water Mass Flow kg/h 1 052 780 Cooling Water Demand MW 12.6
CO2 Downstream Compressor
Mass Flow t/d 6 600 Outlet Pressure bar(a) 88 Outlet Temperature °C 40
CO2 Downstream Composition
H2O ppmv max. 24 CO2
mol% 99.94
N2 0.035 O2 0.020
Detailed Description [2,4,5,8]
General
Assumptions The eventual transition from gaseous to dense phase operation after completion of the DECC demonstration is planned to avoid two-phase flow conditions either in the pipeline or in the wells.
The compressor upgrade from gaseous to dense phase operation must be considered, as additional space will need to be provided in order to accommodate the new compression stages, associated intercoolers and other equipment. It is highly desirable to be able to continue to utilise the remaining life of available equipment installed for initial gaseous phase

107
operation. Compression Plant
Compressor Technology
At present, there is a preference to utilise an integrally geared type compressor for this application. This type of compressor offers two main advantages over the single shaft design: it can reduce the compressor power consumption by intercooling after
each compression stage and its footprint is smaller. The system shall include anti-surge control, vent, intercoolers, knock-out drums and condensate draining facilities as appropriate. A vent shall be located upstream of the compressor suction to enable compressor blowdown.
Location It has been recommended to locate the compression plant as close as possible to the strippers in the capture plant to minimise the pressure drop in the suction pipework and also to reduce the demand for parasitic compression power. Safety concerns were addressed in HAZID sessions.
Number of Trains
The minimum number of parallel compressor trains required is two each rated at 50% of the total flow. This is the minimum number of compressor trains required to provide current assumptions of flexibility and reliability for the CCS chain. It has been determined that the use of two compressor trains rather than on larger compressor will have minimal impact on the compressor electricity demand.
Type At present, centrifugal compressors with electric drives are the preferred option as they will simplify the issues associated with the location of the compression plant while maintaining the requirements for flexible operation.
Trips The compression plant will incorporate control systems to monitor the water content of the CO2 and the pipeline inlet pressure and to trip the system when these specifications are not met for a period of time.
Outlet Temperature
The temperature of the CO2 stream at the outlet of the compression plant has been assumed to be 40°C in FEED 1A. However, E.ON may seek to increase the outlet temperature to 50°C during the demonstration (gaseous) phase operation. Calculations of the outlet temperature for dense phase operation (beyond the scope of the demonstration period) are currently inconclusive given that the modelling software is unable to converge at 40°C. Finally, higher CO2 stream temperatures (in the range of 50–60°C) will be required to start injecting CO2 into an empty pipeline for a period of time, after which the operating temperature will be 40°C under steady-state operation.
Condensed Water
In the compression plant, a continuous stream of water will be produced after condensation in the compressor intercoolers. This stream will contain low concentrations of CO2 and amine. It has been decided that this stream will be sent to the capture plant for use in the process.
Water Content Specification
The water concentration values of 24 ppmv for steady-state operation and 100 ppmv for short, transient periods have been agreed. The main driver for this decision is to ensure that no free water will be present at any time in the pipeline, therefore minimising the opportunity for internal corrosion damage in the pipeline and avoiding the formation of hydrates in the

108
offshore facilities. O2 Removal An oxygen removal unit located within the compression plant battery limits
will not be required. The oxygen content of the CO2 entering the pipeline (200 ppmv maximum) does not have to be reduced. It has been found that this value is acceptable and will not cause oxygen-induced corrosion provided the water content is limited to 24 ppmv for steady-state operation and 100 ppmv for short, transient periods.
Plant Integration
The compression system will be integrated where possible to utilise available heat from compression and thus to minimise overall power consumption of the CCS chain. The inter-cooling temperature between compressor stages will be optimised to minimise the through-life cost of the CCS system. These aspects of the compression system design are the subject of a heat integration study.
Heat Integration
A preliminary heat integration study for the compression plant was completed. This study considered the full replacement of the sea cooling water used for CO2 compression intercooling in the base case with power island condensate. This case completely eliminates the need for sea cooling water to the CO2 compression and dehydration unit. The recovery of CO2 compressor waste heat for power plant condensate heating slightly increases the overall plant efficiency. However, the capital cost arising from the significantly larger heat exchangers is expected to outweigh the operating cost benefit of the efficiency improvement. It is therefore only recommended to incorporate this integration option if the logistical benefit of removing the sea cooling water, as well as efficiency improvements, are a high priority.
Plant Reliability
The CO2 compression and dehydration unit is expected to run 365 days a year, less downtime and have an average availability of greater than 90% (including scheduled and forced outages) within 2 years of commissioning.
Start-up, Shutdown and Turndown
To address part-load operation at least two (perhaps three) independent compressor trains are specified. To accommodate start-up, stop and the lowest flow rate from the abated power plant, recirculation of the
CO2 will be required. The minimum flow will be determined by the minimum stable generation (MSG) load of the power plant and the CO2 capture rate associated with it. The compression system must be optimised for base-load operation, with minimal impact at part-load operation.
Transient Operation
No transient work was carried out in FEED 1A. It is a requirement that this work is carried out in the next phase of the project.
Air Compression
To compress air for pipeline commissioning temporarily hired air compressors will be used.
Gas Phase Operation
The pipeline inlet pressures required for gaseous phase operation range from 28 bar(a) (start of CO2 injection) to 36 bar(a) (end of CO2 injection in gaseous phase). These values correspond to the pressure downstream of the landfall valve at the beach. In between the compression plant and the landfall valve there will be a CO2 metering system, an emergency shutdown valve and the onshore section of

109
the pipeline. Therefore, a provision for the total pressure drop has been made. The pressure at the outlet of the compression plant will range from 32 bar(a) to 40 bar(a) (start/end of injection respectively)
Stage 1 Stage 2 Stage 3 Stage 4
Compressor
Type Centrifugal Drive Electric Capacity m³/h 71 350 31 565 12 570 6 110 Pressure Inlet bar(a) 1.2 2.6 6.4 15.9 Pressure Outlet bar(a) 2.9 6.7 16.2 40.5 Power kW 2890 2913 2815 3434 Material 304 SS
KO Pot
Diameter m 3.4 2.8 2.3 2.1 Height m 6.8 5.7 4.6 4.2 Volume m³ 72.0 42.4 22.3 17.0 Temperature °C 55.0 65.0 65.0 65.0 Pressure bar(g) 3.5 3.5 6.0 18.6 Internals Wire Mesh Pad Packed Volume m³ 0.91 0.62 0.42 0.35 Packed Height mm 100 100 100 100 Material CS with 304L cladding
Cooler
Number of Shells 1 1 1 1
Rate kg/h 257 800 304 050
300 250
405 900
Duty MW 3.1 3.6 3.6 4.9 Heat Transfer Area m² 505 537 527 703 Coldside Temperature °C 47.0 47.0 47.0 47.0 Pressure bar(g) 5.5 5.5 11.1 28.6 Hotside Temperature °C 135.0 148.0 133.0 151.8 Pressure bar(g) 3.5 6.3 16.7 44.5 Material CS with 304L cladding
Condensed Water Transfer Pump
Type Centrifugal Drive Electric Capacity m³/h 2.0 Efficiency % 75 Diff. Pressure kPa 370
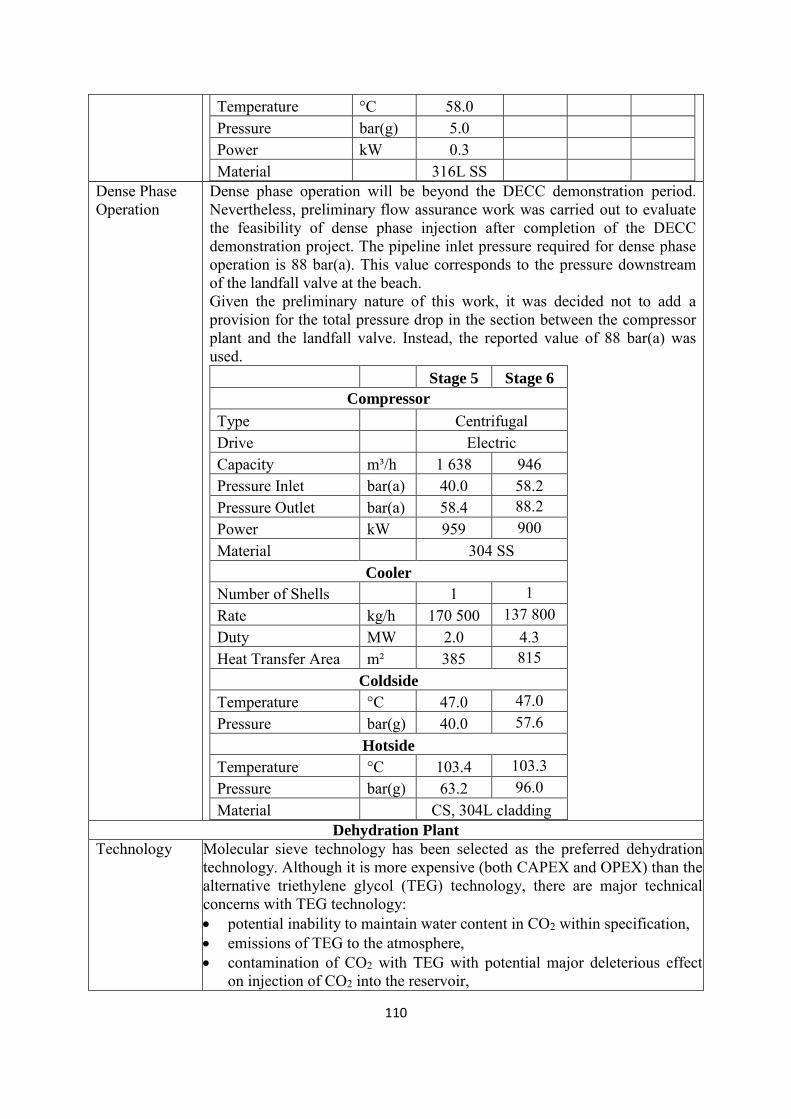
110
Temperature °C 58.0 Pressure bar(g) 5.0 Power kW 0.3 Material 316L SS
Dense Phase Operation
Dense phase operation will be beyond the DECC demonstration period. Nevertheless, preliminary flow assurance work was carried out to evaluate the feasibility of dense phase injection after completion of the DECC demonstration project. The pipeline inlet pressure required for dense phase operation is 88 bar(a). This value corresponds to the pressure downstream of the landfall valve at the beach. Given the preliminary nature of this work, it was decided not to add a provision for the total pressure drop in the section between the compressor plant and the landfall valve. Instead, the reported value of 88 bar(a) was used.
Stage 5 Stage 6
Compressor
Type Centrifugal Drive Electric Capacity m³/h 1 638 946 Pressure Inlet bar(a) 40.0 58.2 Pressure Outlet bar(a) 58.4 88.2 Power kW 959 900 Material 304 SS
Cooler
Number of Shells 1 1 Rate kg/h 170 500 137 800 Duty MW 2.0 4.3 Heat Transfer Area m² 385 815
Coldside
Temperature °C 47.0 47.0 Pressure bar(g) 40.0 57.6
Hotside
Temperature °C 103.4 103.3 Pressure bar(g) 63.2 96.0 Material CS, 304L cladding
Dehydration Plant
Technology Molecular sieve technology has been selected as the preferred dehydration technology. Although it is more expensive (both CAPEX and OPEX) than the alternative triethylene glycol (TEG) technology, there are major technical concerns with TEG technology: potential inability to maintain water content in CO2 within specification, emissions of TEG to the atmosphere, contamination of CO2 with TEG with potential major deleterious effect
on injection of CO2 into the reservoir,

111
inability of TEG to operate above 40°C time to settle out to stable process operation is excessive with TEG and significant reliability advantages of molecular sieve over TEG.
Units
Type Molecular sieve Vessel Type Vertical tank Quantity 3 Diameter m 2.90 Height m 9.49 Volume m³ 63 Packing Ceramic balls & Siliporite RA pellets Material Carbon steel with 304L cladding
The specifications of the CO2 stream entering the compressor plant are shown in the table below. The full load data correspond to 6,600 t/d of CO2 captured.
Table 4.7 CO2 stream specification at compressor inlet
Units 100% load
Temperature °C 35 Pressure bar(a) 1.49
Molar flow kmol/h 6490 Mass flow kg/h 279 668
CO2 % mol 96.45 H2O % mol 3.5 N2 % mol < 0.03 O2 % mol < 0.02
The main process products from this unit are compressed dehydrated product CO2, collected acid gas condensate, returned cooling water, and return streams from any other cooling media arising from the heat integration study.
The next table below summarises the preliminary requirements for the compression plant and dehydration unit, including the CO2 dehydration level assumed.
Table 4.8 Preliminary specifications for compression and dehydration
Units Value
Initial compressor outlet pressure (gas phase operation) bar(a) 30 Final compressor outlet pressure (gas phase operation) bar(a) 40 Compressor outlet pressure (dense phase operation) bar(a) 88 Maximum water content of product CO2 ppmv 24

112
Mass and Heat Balance [6,7,10,13]
Figure 4.8 Process flow diagram for Kingsnorth compression and dehydration plant

113
Table 4.9 Stream data for Kingsnorth compression and dehydration plant1
1 2 3 4 5 6 7 8 9 10 11 12 13 14
Stream
Temperature °C 35.0 32.4 32.2 114.0 39.8 123.4 39.8 124.2 39.9 126.6 40.0 70.7 70.7 42.2 Pressure bar (g) 0.49 3.99 0.14 1.91 1.61 5.65 5.35 15.15 14.85 39.47 39.32 37.86 37.86 38.99 Flow Rate kg/h 139 834 2 044 139 990 139 990 139 380 139 380 138 496 138 496 177 071 177 071 176 897 39 067 43 137 785 Flow Rate kmol/h 3 245 113 3 254 3 254 3 220 3 220 3 170 3 170 4 038 4 038 4 026 895 2 3 131 Vapour Fraction 1 0 1 1 1 1 1 1 1 1 1 1 0 1 Density kg/m³ 2.55 1002.06 1.96 3.93 4.42 8.86 11.02 22.14 28.99 58.17 86.26 69.39 975.77 84.15 Heat Capacity Cp kJ/kg°C 0.90 4.31 0.90 0.96 0.90 0.97 0.92 0.99 0.97 1.07 1.22 1.12 4.29 1.20
Heat Capacity Cv kJ/kg°C 0.70 3.74 0.70 0.75 0.70 0.76 0.70 0.76 0.70 0.77 0.73 0.74 3.67 0.73 Viscosity cP 0.015 0.758 0.015 0.019 0.015 0.020 0.015 0.020 0.016 0.021 0.017 0.018 0.413 0.017 Molecular Weight 43.09 18.03 43.03 43.03 43.29 43.29 43.68 43.68 43.85 43.85 43.91 43.67 18.21 44.00 Enthalpy kJ/kg - 9 002 - 15 847 - 9 009 - 8 935 - 8 985 - 8 909 - 8 960 - 8 887 - 8 957 - 8 887 - 8 979 - 8 960 - 15 561 - 8 969 Entropy kJ/kg°C 3.984 3.088 4.036 4.072 3.865 3.901 3.643 3.678 3.429 3.463 3.184 3.328 3.594 3.184 Compressibility 0.992 0.004 0.994 0.993 0.987 0.985 0.969 0.965 0.922 0.916 0.788 0.856 0.025 0.798 Composition CO2
mol%
96.45 0.05 96.19 96.19 97.21 97.21 98.72 98.72 99.37 99.37 99.60 98.67 0.77 99.94 H2O 3.50 99.95 3.75 3.75 2.73 2.73 1.23 1.23 0.57 0.57 0.34 1.27 99.23 0.002
N2 0.03 0.00 0.03 0.03 0.04 0.04 0.04 0.04 0.04 0.04 0.04 0.04 0.00 0.04 O2 0.02 0.00 0.02 0.02 0.02 0.02 0.02 0.02 0.02 0.02 0.02 0.02 0.00 0.02 Note:
1) Two compressor trains have been specified. Flow rates shown are for one compression train only and hence total flow rate is twice the flow rate shown in this table. 2) Moisture content of stream 14 is anticipated to be 1 ppmv.

114
Figure 4.9 Modified compression and dehydration PFD for switch from gas phase to dense phase transport

115
Table 4.10 Modified compression and dehydration stream data for switch from gas phase to dense phase transport1,3
1 2 3 4 5 6 7 8
Stream
Temperature °C 35.0 40.0 42.2 78.4 40.0 78.4 40.0 40.0 Pressure bar (g) 0.49 39.32 38.99 57.39 57.19 87.19 86.99 86.99 Flow Rate kg/h 139 834 176 897 137 785 137 785 137 785 137 785 137 785 275 570 Flow Rate kmol/h 3 245 4 026 3 131 3 131 3 131 3 131 3 131 6 263 Vapour Fraction 1 1 1 1 1 1 1 1 Density kg/m³ 2.55 86.26 84.15 109.33 145.76 169.47 404.54 404.54 Heat Capacity Cp kJ/kg°C 0.90 1.22 1.20 1.25 1.65 1.64 9.68 9.68
Heat Capacity Cv kJ/kg°C 0.70 0.73 0.73 0.76 0.75 0.79 0.83 0.83 Viscosity cP 0.015 0.017 0.017 0.020 0.019 0.023 0.031 0.031 Molecular Weight 43.09 43.91 44.00 44.00 44.00 44.00 44.00 44.00 Enthalpy kJ/kg - 9 002 - 8 979 - 8 969 - 8 944 - 8 998 - 8 974 - 9 085 - 9 085 Entropy kJ/kg°C 3.984 3.184 3.184 3.202 3.042 3.059 2.718 2.718 Compressibility 0.992 0.788 0.798 0.804 0.675 0.701 0.368 0.368 Composition CO2
mol%
96.45 99.60 99.94 99.94 99.94 99.94 99.94 99.94 H2O 3.50 0.34 0.002 0.002 0.002 0.002 0.002 0.002
N2 0.03 0.04 0.04 0.04 0.04 0.04 0.04 0.04 O2 0.02 0.02 0.02 0.02 0.02 0.02 0.02 0.02 Note:
1) Two compressor trains have been specified. Flow rates shown for streams 1-7 are for one compression train only and hence total flow rate is twice the flow rate shown in this table. Stream 8 is located downstream of the point where the two trains meet to enter the export pipeline, therefore showing the total combined flow. 2) Moisture content of streams 3-8 is anticipated to be 1 ppmv.
3) Dense phase operation will not occur within the demonstration period.
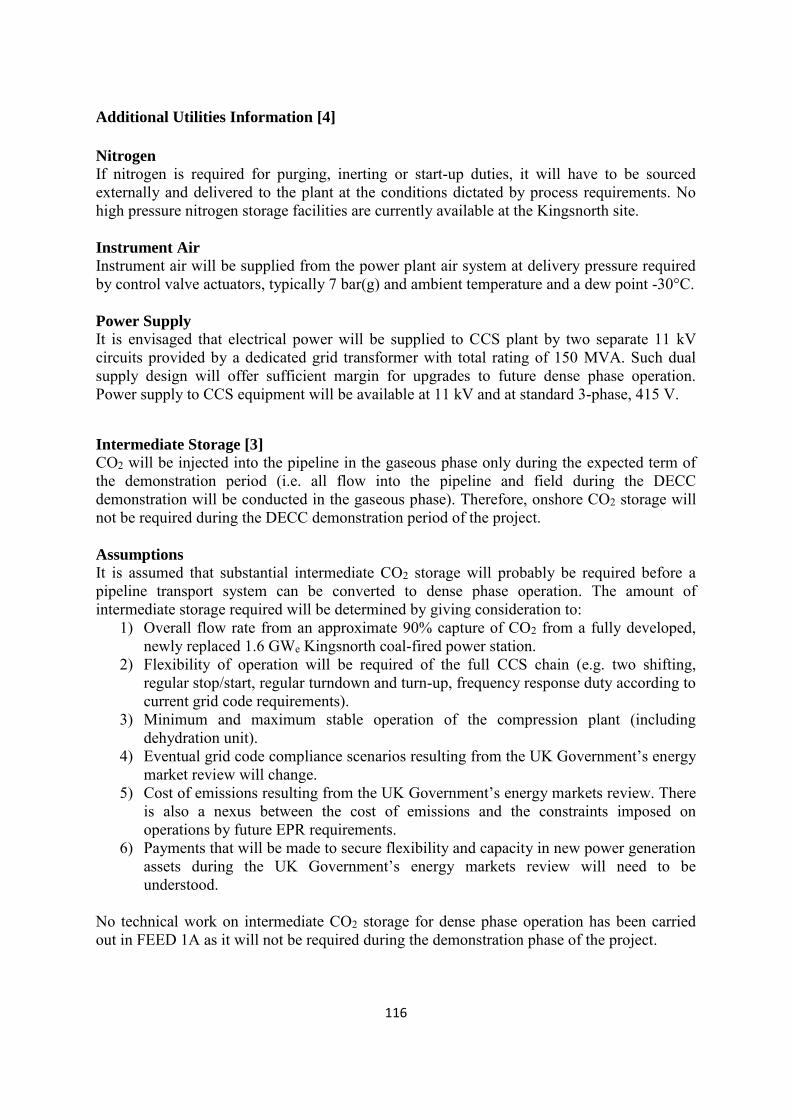
116
Additional Utilities Information [4]
Nitrogen If nitrogen is required for purging, inerting or start-up duties, it will have to be sourced externally and delivered to the plant at the conditions dictated by process requirements. No high pressure nitrogen storage facilities are currently available at the Kingsnorth site. Instrument Air Instrument air will be supplied from the power plant air system at delivery pressure required by control valve actuators, typically 7 bar(g) and ambient temperature and a dew point -30°C. Power Supply It is envisaged that electrical power will be supplied to CCS plant by two separate 11 kV circuits provided by a dedicated grid transformer with total rating of 150 MVA. Such dual supply design will offer sufficient margin for upgrades to future dense phase operation. Power supply to CCS equipment will be available at 11 kV and at standard 3-phase, 415 V.
Intermediate Storage [3]
CO2 will be injected into the pipeline in the gaseous phase only during the expected term of the demonstration period (i.e. all flow into the pipeline and field during the DECC demonstration will be conducted in the gaseous phase). Therefore, onshore CO2 storage will not be required during the DECC demonstration period of the project. Assumptions
It is assumed that substantial intermediate CO2 storage will probably be required before a pipeline transport system can be converted to dense phase operation. The amount of intermediate storage required will be determined by giving consideration to:
1) Overall flow rate from an approximate 90% capture of CO2 from a fully developed, newly replaced 1.6 GWe Kingsnorth coal-fired power station.
2) Flexibility of operation will be required of the full CCS chain (e.g. two shifting, regular stop/start, regular turndown and turn-up, frequency response duty according to current grid code requirements).
3) Minimum and maximum stable operation of the compression plant (including dehydration unit).
4) Eventual grid code compliance scenarios resulting from the UK Government’s energy market review will change.
5) Cost of emissions resulting from the UK Government’s energy markets review. There is also a nexus between the cost of emissions and the constraints imposed on operations by future EPR requirements.
6) Payments that will be made to secure flexibility and capacity in new power generation assets during the UK Government’s energy markets review will need to be understood.
No technical work on intermediate CO2 storage for dense phase operation has been carried out in FEED 1A as it will not be required during the demonstration phase of the project.
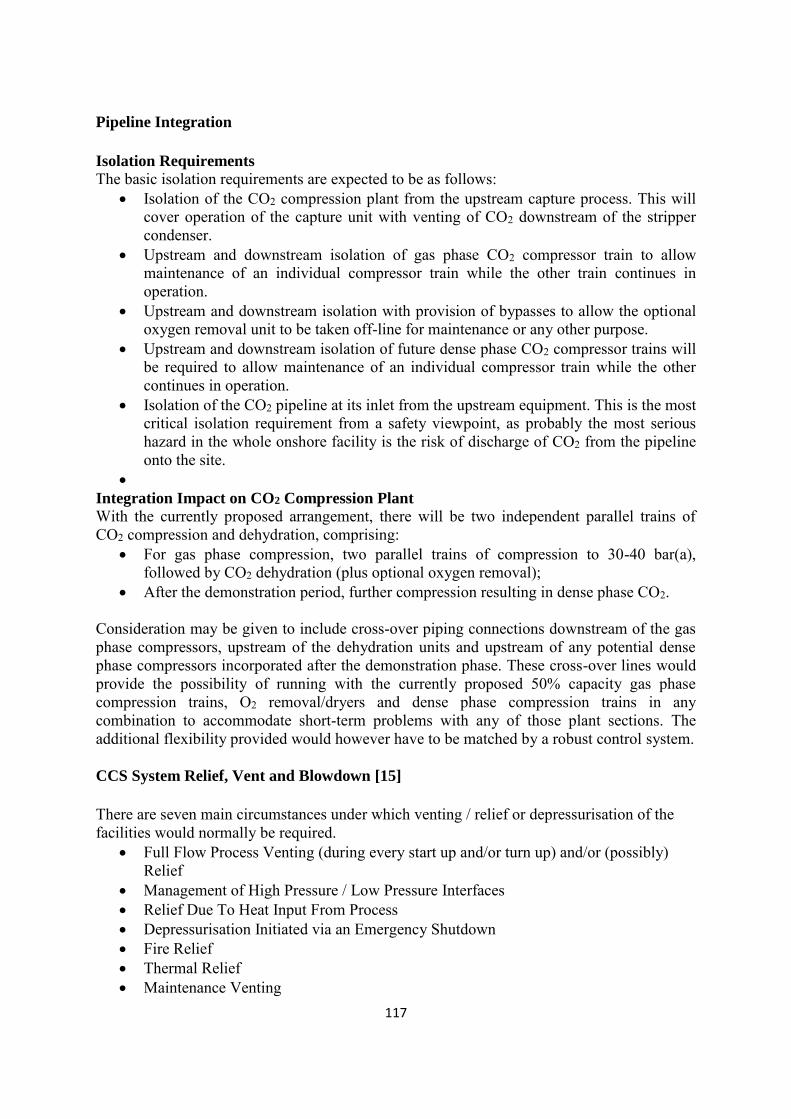
117
Pipeline Integration
Isolation Requirements
The basic isolation requirements are expected to be as follows: Isolation of the CO2 compression plant from the upstream capture process. This will
cover operation of the capture unit with venting of CO2 downstream of the stripper condenser.
Upstream and downstream isolation of gas phase CO2 compressor train to allow maintenance of an individual compressor train while the other train continues in operation.
Upstream and downstream isolation with provision of bypasses to allow the optional oxygen removal unit to be taken off-line for maintenance or any other purpose.
Upstream and downstream isolation of future dense phase CO2 compressor trains will be required to allow maintenance of an individual compressor train while the other continues in operation.
Isolation of the CO2 pipeline at its inlet from the upstream equipment. This is the most critical isolation requirement from a safety viewpoint, as probably the most serious hazard in the whole onshore facility is the risk of discharge of CO2 from the pipeline onto the site.
Integration Impact on CO2 Compression Plant
With the currently proposed arrangement, there will be two independent parallel trains of CO2 compression and dehydration, comprising:
For gas phase compression, two parallel trains of compression to 30-40 bar(a), followed by CO2 dehydration (plus optional oxygen removal);
After the demonstration period, further compression resulting in dense phase CO2.
Consideration may be given to include cross-over piping connections downstream of the gas phase compressors, upstream of the dehydration units and upstream of any potential dense phase compressors incorporated after the demonstration phase. These cross-over lines would provide the possibility of running with the currently proposed 50% capacity gas phase compression trains, O2 removal/dryers and dense phase compression trains in any combination to accommodate short-term problems with any of those plant sections. The additional flexibility provided would however have to be matched by a robust control system. CCS System Relief, Vent and Blowdown [15]
There are seven main circumstances under which venting / relief or depressurisation of the facilities would normally be required.
Full Flow Process Venting (during every start up and/or turn up) and/or (possibly) Relief
Management of High Pressure / Low Pressure Interfaces Relief Due To Heat Input From Process Depressurisation Initiated via an Emergency Shutdown Fire Relief Thermal Relief Maintenance Venting

118
General
Assumptions Under normal steady state operating conditions the water content of the dehydrated CO2 is less than 24 ppmv. Under start-up and other upset flow conditions, water content of the dehydrated CO2 could be as high as a maximum of 100 ppmv. A water content of greater than 100 ppmv will be prevented.
CO2 that is vented from locations upstream of the pipeline could be saturated with water and may even contain free water. Thus the possibility of formation of solid CO2, CO2 hydrates, and/or water ice in venting operations has to be considered.
Full flow process pressure relief will not be required. A system to heat vented fluids will be considered. Under most circumstances venting will need to be conducted via the
main flue stack. It is anticipated that at least the stripper columns will be required to be
fitted with a vacuum breaker. Onshore CO2 Venting
General Onshore venting is likely to occur under the following scenarios: Start-up of the capture, compression and dehydration plant. Controlled shutdown of the capture, compression and dehydration plant. Emergency shutdown of the capture, compression and dehydration plant. Venting of the onshore pipeline by reverse flow to onsite venting
arrangements. The power station will be equipped with low pressure (Vent 1) and high pressure (Vent 2) venting systems.
Vent 1 This vent system will handle low pressure CO2 located downstream of the stripper at the overhead condenser outlet. Consequently this stream will have conditions of 35°C and 1.5 bar(a), allowing this vent to be returned to the treated flue gas ductwork downstream of the capture plant absorber, prior to entering the FGD reheater. The vent line should include appropriate corrosion protection due to moisture and amine impurity (up to 5 ppm) of the CO2 stream, albeit for short periods of time. This vent may also be used in order to provide load flexibility to the grid by allowing the loaded operation of the CO2 compressors to be interrupted.
Vent 2 This vent system will handle high pressure CO2 vented from either the compressor outlet (Vent 2a) or the dehydration (Vent 2b) outlet. Conditions at this vent are likely to be up to 40°C and 40 bar(a). It is also likely to handle an off-spec CO2 (moisture > 100 ppmv); materials should be chosen accordingly and valve arrangements should be designed to guard against valves becoming frozen in the open position.
Scenarios
Start-up Vent to low pressure line until mass flow to compressors is equal to 30.6 kg/s (40% of design value).
Decrease low pressure venting rate when compressors are stabilised (40 bar) and increase capture plant flow rate and flow to the dehydration unit.

119
Vent to high pressure line until moisture content to onshore pipeline is less than 100 ppmv. This is unlikely to occur as a fully regenerated dehydration unit can achieve very low moisture (1 ppmv) on start-up, with the option of an available stand-by unit.
Controlled Shutdown
Shut flow to onshore pipeline, vent to high pressure line (Vent 2b) and then isolate dehydration unit by venting to the dehydration bypass (Vent 2a). Flow to the dehydration unit can be controlled to allow full regeneration of operational unit. Capture unit is put into flue gas bypass mode.
Shut off flow to high pressure vents and initiate full recycle of compressors, allowing remaining CO2 to be vented to the low pressure line.
For longer outages or shutdowns the stripper outlet will continue to vent to the low pressure line to achieve a leaner amine suitable for prolonged tank storage. CO2 flow rate will steadily decrease until target amine loading for tank storage is achieved, followed by shut down of capture plant and low pressure vent.
Emergency Shutdown
Shut flow to onshore pipeline, vent to high pressure line (Vent 2b) and then isolate dehydration unit by venting to the dehydration bypass (Vent 2a). Flow to the dehydration unit is unlikely to be controlled in an emergency shutdown. Capture unit is put into flue gas bypass mode.
High pressure vent is shut. Full recycle of compressors is initiated and remaining CO2 is vented to the low pressure line.
Onshore Pipeline Blowdown
For emergency pipeline blow down, same as scenario 3 followed by pipeline venting to high pressure vent. For the gas phase case (40 bar), then an entirely vapour phase CO2 release is expected at -46 °C.
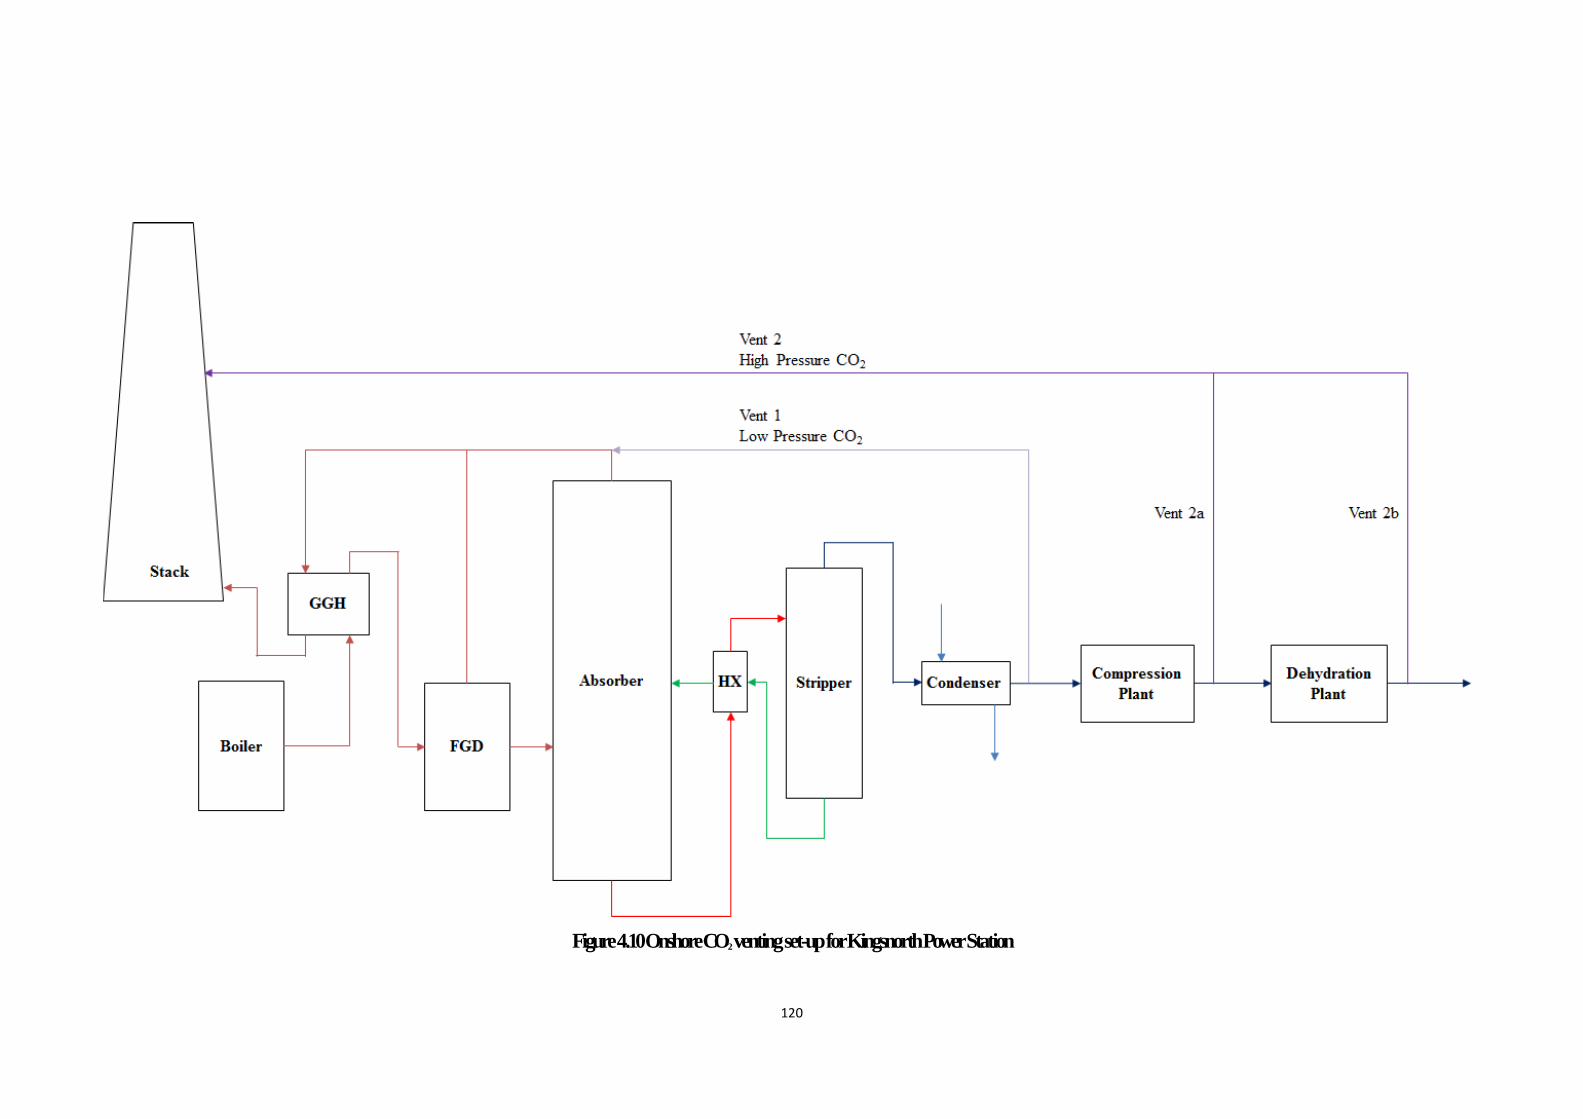
120
Figure 4.10 Onshore CO2 venting set-up for Kingsnorth Power Station
121
Summary [2]
All flow into the pipeline and field during the term of the DECC demonstration will be conducted with the captured and transported CO2 flowing in the gaseous phase.
The DECC demonstration is planned to avoid two-phase flow conditions. The compressor upgrade from gaseous to dense phase operation must be considered,
at least conceptually, from the start of the demonstration project as additional space will need to be provided in the detailed design in order to accommodate the new compression stages, associated intercoolers and other equipment. It is highly desirable to be able to continue to utilise the remaining life of available equipment installed.
At present, there is a preference to utilise an integrally geared type compressor for this application.
It has been recommended to locate the compression plant as close as possible to the strippers in the capture plant to minimise the pressure drop in the suction pipework and also to reduce the demand for parasitic compression power.
It is currently considered that the minimum number of compressor trains required is two each rated at 50% of the total flow.
The electric drive is the preferred option as it will simplify the issues associated with the location of the compression plant while maintaining the requirements for flexible operation.
Although it is more expensive than the alternative triethylene glycol (TEG) technology, molecular sieve technology has been selected as the preferred dehydration technology because there are major technical concerns with TEG.
The temperature of the CO2 stream at the outlet of the gas phase compression plant has been assumed to be 40°C. Calculations of the outlet temperature for dense phase operation are currently inconclusive given that the modelling software is unable to converge at 40°C.
Water Condensed in the Compression Plant will contain low concentrations of CO2 and amine. It has been decided that this stream will be sent to the capture plant for use in the process.
The water concentration values of 24 ppmv for steady-state operation and 100 ppmv for short, transient periods have been agreed.
An oxygen removal unit located within the compression plant battery limits will not be required.
A preliminary heat integration study for the compression plant was completed. This study considered the full replacement of the sea cooling water used for CO2 compression intercooling in the base case with power island condensate. The capital cost arising from the significantly larger heat exchangers is expected to outweigh the operating cost benefit of the efficiency improvement.
The design and process difficulties associated with the high pressure venting require careful consideration during detailed design. It is likely that efforts to minimise the requirement for high pressure venting will not manage to eliminate it. Systems must therefore be designed to permit high pressure venting operations to be conducted with a very high level of reliability, predictability and safety.

122
References
No. Report Name
Document
No.
1 Key Reference Handbook 0 2 CO2 Compression and Pumping Philosophy 5.2 3 CO2 Intermediate Storage Philosophy 5.3 4 CO2 Compression and Dehydration Design Basis 5.12 5 CO2 Compression – Sized Equipment List 5.18 6 Gas Phase CO2 Compression Process Flow Diagram 5.16 7 CO2 Dehydration Process Flow Diagram 5.17 8 Oxygen Content Reduction Study Report 5.19 9 Pipeline Integration Study Report 5.20 10 Dense Phase CO2 Compression Process Flow Diagram 5.21 11 Cooling Water Distribution Process Flow Diagram 5.22 12 Utilities Process Flow Diagram 5.23 13 100% Boiler Load Heat and Material Balance 5.13 14 Design Philosophy Overall Project Data 4.16 15 Full System CO2 Relief, Vent & Blowdown System Design Philosophy 4.44

123
CHAPTER 5: CO2 TRANSPORT SYSTEM
5.1 Longannet Power Station to Goldeneye Reservoir CCS Demo Project
Onshore Pipeline: National Grid Pipeline [1]
The Longannet compression facility will inject gaseous CO2 into the National Grid pipeline system at a maximum allowable operating pressure of 34 bar(g) and maximum operating temperature of 30ºC.
The connection from LPS to the Blackhill Compressor Station will be via:
1. A new 600 mm (24”) diameter buried steel pipeline from LPS to the proposed Valleyfield installation
2. A new 900 mm (36”) diameter buried steel pipeline from Valleyfield to the proposed Dunipace installation which is adjacent to the existing National Transmission System (NTS) pipeline (No. 10 Feeder) to the North of Denny
3. 280 km of the existing 900 mm (36”) diameter buried steel NTS No. 10 Feeder which currently runs from the existing compressor station at Avon bridge/Bathgate to the onshore natural gas terminal facilities at St. Fergus.
Figure 5.1 Scotland Pipeline Network Schematic [2].
The existing No. 10 Feeder was designed for transportation of natural gas using National Grid (formally Transco / British Gas) and the Institute of Gas Engineers standards and specifications applicable at the time. The existing No. 10 Feeder from Kirriemuir to Bathgate is currently rated at 85 bar(g) for the transportation of natural gas, with 85 bar(g) being the maximum allowable pressure. The existing No. 10 Feeder from Aberdeen to Kirriemuir is rated at 84 bar(g), and from St. Fergus to Aberdeen it is rated at 70 bar(g).
Due to a pressure drop along the onshore pipeline, the expected National Grid pipeline exit conditions for arrival at Blackhill Compressor Station are:

124
Operating pressures between 28.5 to 31 bar(g) (due to the pressure drop in the pipeline)
Operating temperatures likely to be in the range of 3 to 14ºC [3].
The existing NTS No.10 Feeder pipeline system between Bathgate and St. Fergus consists of 3 main pipeline sections and each individual section includes manually operated block valve installations at several locations along the pipeline route.
Modifications will be required to disconnect No. 10 Feeder from the natural gas NTS pipeline network at existing multi- junction sites and compressor sites, and to cross-connect the various pipeline sections.
The existing block valve installations will also require modifications to convert them from natural gas to CO2 duty.

125
Figure 5.2 Schematic diagram of National Grid Pipeline System [2].

126
Offshore Transport [1]
Onshore Pipeline at St. Fergus [1]
Dense phase compressed CO2 will be discharged from the new National Grid Blackhill Compressor Station at an outlet pressure of 120 bar(g) and a maximum temperature of 29ºC.
It is proposed to meter the CO2 to fiscal standards on the National Grid compressor station.
Quality checks of the purity of the CO2 on receipt will be carried out; water and oxygen are the key contaminants of interest for the offshore transportation and storage of the CO2.
A new pig launcher is proposed for installation at the point of discharge from Blackhill, thus permitting the operation of intelligent pipeline pigging in the offshore pipeline.
The compressed CO2 will be transferred from the compressor station into a new 1.4 km section of underground piping that initially runs around the perimeter of the current Shell site.
Connection of this new section of piping to the offshore pipeline will be made via a new isolation valve installed in a new valve pit within the Shell St. Fergus site.
Offshore CO2 Transportation, Injection [2]
The existing Goldeneye facilities consist of three major parts:
1. The onshore receiving and processing facilities [2]
The CO2 from the National Grid Compressor Station will enter the Shell-operated St. Fergus Terminal.
a) New connection between National Grid and Shell scope of supply
300mm (12”) diameter and be provided with a National Grid / Shell interface isolation valve(s). The isolation valve(s) should be above ground and provided with vehicular access from the site peripheral road. This should be designed to avoid frequent stop/start injection of CO2 into wells wherever possible to reduce operational stress on the wells and avoid any consequent degradation of well integrity. a) The range of inlet temperatures to the pipeline will be from minimum ambient to a
maximum of 29°C set by the need to protect against running ductile fractures. b) The range of inlet pressures is from 80 bar(g) to 120 bar(g) during normal operation. c) The onshore CO2 facility (both new and re-used piping) has a design pressure of 132
bar(g), to match the Goldeneye pipeline design pressure while the design temperature is –20/+66ºC.
b) New pipeline from Shell, Blackhill site to the Goldeneye pipeline at St Fergus
The new CO2 transfer pipe will connect to the Goldeneye pipeline at the existing 300mm (12”) branch line from the tee.

127
The new CO2 transfer pipe across the Shell-operated St. Fergus Terminal will be buried where possible to provide protection from damage from a hydrocarbon release incident followed by consequential possibility of explosive rupture and toxic cloud release.
The buried CO2 transfer pipe should be routed such that during installation there is minimum impact to the existing services. The existing Goldeneye pig receiver shall be replaced or converted to a new (intelligent) pig launcher designed for CO2 service complete with new pipework and valves connecting to all nozzles. All operational and maintenance access shall be retained for the pigging area. Emergency depressurisation facilities are not required for the new CO2 transfer pipe, though thermal relief of CO2 will be required to deal with blocked-in sections of pipework, the pig launcher and maintenance venting. Relief and depressurisation discharge should be collected together in a dedicated common header to vent at a remote vent stack to ensure that personnel are not exposed to the toxic levels of CO2 relief. As CO2 is only a vapour at ambient conditions there is no requirement for a vent drum.
2. Offshore Pipeline to Goldeneye [1]
The offshore production pipeline is a 101.6km 500mm (20”) carbon steel line connecting the offshore platform and the onshore St Fergus Goldeneye facilities. This pipeline was designed for three-phase operation, hydrocarbon gas, hydrocarbon liquids and aqueous phase (Monoethylene Glycol (MEG)/water). Corrosion management is by inhibition (pH stabiliser, inhibition and MEG) and hydrate management is by the continuous injection of MEG on the platform. This existing Goldeneye 500 mm (20”) nominal diameter hydrocarbon export pipeline will be reused to transport the captured dense phase CO2 at a pressure above the CO2 mixture Cricondenbar for ease of operability (avoidance of slugging issues and minimizing pipeline pressure drop) to the existing Goldeneye offshore platform for the proposed 15-year design life of the CCS project.
The pipeline has a Maximum Allowable Operating Pressure (MAOP) of 132 bar(g) and was not designed for full Closed-In Tubing Head Pressure (CITHP).
The design premise for the Subsea Assets is as follows: Provide a remotely operable SSIV that can be closed automatically on leak detection from
the spool pieces and/or riser. Re-use the existing infrastructure for CO2 service, minimising modification or
replacement where possible. Should complete or component replacement be required existing system flanges are to be re-used where possible (gaskets and stud bolts shall be replaced).
Maintain dropped object and over-trawl able protection consistent with the existing SSIV structure design.
Maintain intelligent and operational pigging capability of the subsea pipeline.

128
All subsea valves are to be remotely operable. All facilities are to allow Remotely Operated Vehicle (ROV) inspection of valves and connections and to allow diver access for repair and maintenance;
New facilities will satisfy the proposed design life of 15 years from 2015 – 2030; and
The pipeline has an existing non-return valve located 150 m from the riser base, which will need to be removed and replaced with an actuated sub-sea isolation valve (SSIV). The pipeline between the SSIV assembly and the riser base will also be replaced with higher pressure-rated spools to accommodate CO2 thermal expansion.
Commissioning of the pipeline for CO2 injection service will be carefully planned to ensure that the pipeline is swept of any debris and residual hydrocarbons/water, in order to reduce the risk of well contamination.
3. The Goldeneye offshore platform facilities and wells
Goldeneye Platform [1]
The dense phase CO2 arrives on board the Goldeneye platform via the existing pipeline riser.
The dense phase CO2 will pass through a flow meter and a back-pressure control valve that will maintain the pipeline contents in dense phase.
The fluid will then pass through one of 2x100% dense phase CO2 filters to a new injection manifold and flow lines to the injection wellheads. The topsides pipework and equipment downstream of the carbon steel pipeline will be made from stainless steel.
The platform and offshore pipeline will be controlled from the Shell-operated St. Fergus terminal using remote satellite telemetry. Additional control interfaces with the new Blackhill Compressor Station are envisaged.
No offshore heat input is required for injection into the system and the only power consumption is from instrumentation (which is negligible), hence the existing offshore surface/topsides platform facilities are adequate for re-use in injection service.
New piping, injection manifold and well flow lines from the injection manifold to the injection wells.
Existing offshore pipeline valves will need to be modified or replaced if not suitable for CO2 service.
The Sub-Sea Isolation Valve (SSIV) on the Goldeneye pipeline is a hydraulically actuated non-return valve for CCS will be replaced with an actuated ball valve. Pipe spools between the SSIV and the riser base will be replaced with higher design pressure spools. This is to avoid over pressuring the pipeline due to thermal expansion.
Local strengthening of the jacket may be required for any changed deck loads on the jacket and some additional anodes may need to be retrofitted for corrosion protection of the jacket.
129
Offshore Platform Facilities and Wells at Goldeneye [2]
Wells
There are five wells available in Goldeneye for CO2 injection. It is planned to convert four of the existing wells to CO2 injectors.
Three wells will normally be required to meet the maximum injection based on the expected CO2 injectivity, the well configuration and development of reservoir pressure with injection and time.
The fourth well will give full redundancy and add flexibility in operating the system. The injection rates per well are within the expected injectivity of the formation and the well design. The wells‟ operating envelopes will be designed to cover the full range of envisaged flow rates from the minimum CCS plant output to the maximum delivery rate when the reservoir has re-pressurised to its initial value.
The fifth well (No 3) in the platform will be used as a monitoring well. No new wells are planned for CO2 injection in Goldeneye. This will reduce the risk of well penetration in the cap rock.
The wells will require replacement of the existing upper completion with new injection tubing.
The wells will initially be completed with an insert string to provide extra pressure drop in order to have a single phase in the well. Without this the pressure drop at the wellhead could result in low temperatures (<0°C steady state). This effect will reduce with time as reservoir pressures increase.
At a later stage, when the pressure drop is not required, an intervention may be required to remove the insert string.
The detailed completion was designed to meet the injection rate expectations during the lifecycle of the project. Tubing size and materials, insert string length and size will be investigated per well.
Well Monitoring
The wells will have specialised equipment to monitor the CO2 injection as permanent down-hole gauges and distributed temperature sensors via fibre-optics. The Goldeneye wells were gravel packed for hydrocarbon production due to the prediction of sand failure under production conditions using Goldeneye rock mechanics information. No sand production has been reported to date in any of the wells concluding that the installation of the gravel pack has been effective in controlling the sand failure.
Injection of CO2
After commissioning, the CCP will have a capacity of 2 million tonnes of CO2 annually. The CO2 delivery to the wells will have minor variations due to CO2 volumes captured at
LPS can have major variations during 24 hours. There will be some attenuation of the flow transients before arriving at the wells owing to line pack.
For the flexibility in terms of CO2 injection capacity in the well it is anticipated that three wells will be injecting for the maximum capacity of the capture plant (2 million tonnes of CO2 annually).
A fourth well will be available for injection. This will give full redundancy of one well in case of planned or unforeseen activities in
the injection wells.
130
The initial injection stage will be more difficult to manage due to the relatively low pressure in the reservoir and the possibility of having two phases (vapour-liquid) at the wellhead level. This will be managed by deploying small bore completions
The final stage of injection after pressurizing the reservoir would be easier to manage, as the wells will be able to inject in a single phase.
At the platform the maximum available tubing head pressure available for injection will be about 110 bar(g). This pressure is enough to inject in the well assuming an injection bottom-hole pressure of 310 bar(g) that is 55 bar above the original reservoir pressure.
There shall be minimum destruction of the existing plant and pipework. However re-use of the existing process pipework in CO2 service may not be suitable for the low temperatures that may be experienced and it is assumed that it will be replaced as appropriate. Any new pipework installation shall not impede existing access for escape, operation and/or maintenance.
Pig Launcher at Well
The existing pig launcher shall be replaced or modified for use as a receiver to handle intelligent pigs in dense phase CO2 service complete with new pipework and valves connecting to all nozzles, including the hook-up connection to the pipeline.
Permanent pigging facilities will be available at either end of the pipeline, for use during commissioning, subsequent pigging and inspection runs.
All operational and maintenance access shall be retained for the pigging area.
Vent System
The flow lines will include new allocation metering and new choke valves. New vent systems will be provided for:
A replacement vent system will be installed for the relief and venting requirements of the Goldeneye Platform in CO2 service.
The new vent system is required to deal with thermal relief from closed-in sections of pipework, the pig receiver and maintenance venting.
Relief and depressurisation discharge should be collected together in a new dedicated common header to vent at the remote vent stack to ensure that personnel are not exposed to the toxic levels of CO2 relief.
Consideration shall be given for depressurising the pipeline utilising the offshore facility. It is assumed that all utilities are available for the new CO2 pipework installation and the structure and personnel support aspects of the Goldeneye Platform remain largely unchanged.

131
Figure 5.3 Onshore and Offshore pipeline schematic diagram [3].
National Grid Compression
National Grid Shell
PC P = 105 baraT= 4-10 C
Injection Manifold
P = 120 baraT= 30 C
P = 115 baraT= 4-10 C
120 km 20” Offshore Pipeline
1 2
3
4
5/6
To VentTo Vent
Choke Valve
To Other existing Wells
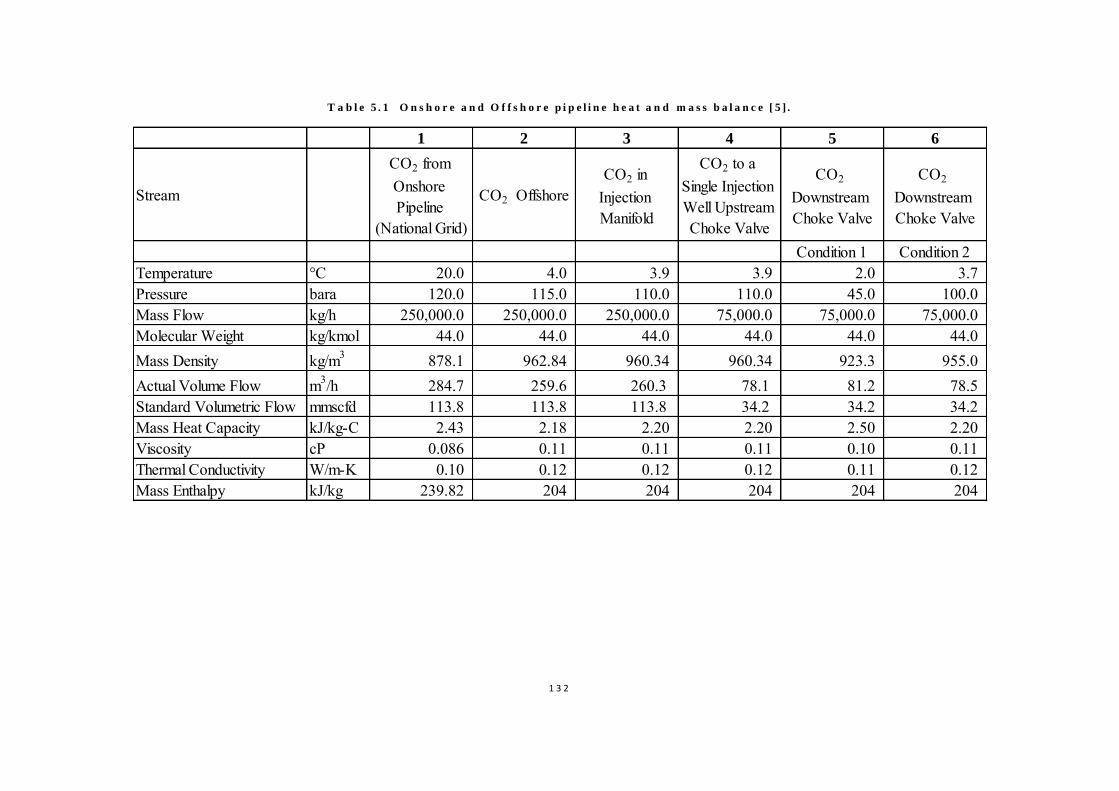
1 3 2
T a b l e 5 . 1 O n s h o r e a n d O f f s h o r e p i p e l i n e h e a t a n d m a s s b a l a n c e [ 5 ] .
1 2 3 4 5 6
Stream
CO2 from Onshore Pipeline
(National Grid)
CO2 OffshoreCO2 in
Injection Manifold
CO2 to a Single Injection Well Upstream Choke Valve
CO2 Downstream Choke Valve
CO2 Downstream Choke Valve
Condition 1 Condition 2Temperature °C 20.0 4.0 3.9 3.9 2.0 3.7 Pressure bara 120.0 115.0 110.0 110.0 45.0 100.0 Mass Flow kg/h 250,000.0 250,000.0 250,000.0 75,000.0 75,000.0 75,000.0 Molecular Weight kg/kmol 44.0 44.0 44.0 44.0 44.0 44.0 Mass Density kg/m3 878.1 962.84 960.34 960.34 923.3 955.0 Actual Volume Flow m3/h 284.7 259.6 260.3 78.1 81.2 78.5 Standard Volumetric Flow mmscfd 113.8 113.8 113.8 34.2 34.2 34.2 Mass Heat Capacity kJ/kg-C 2.43 2.18 2.20 2.20 2.50 2.20 Viscosity cP 0.086 0.11 0.11 0.11 0.10 0.11 Thermal Conductivity W/m-K 0.10 0.12 0.12 0.12 0.11 0.12 Mass Enthalpy kJ/kg 239.82 204 204 204 204 204

133
Venting [7]
Venting to support start-up
Venting at locations, other than at Longannet, is not expected during start-up providing the system components remain filled with in-specification CO2. However, starting the End-to-End CCS chain after maintenance may require venting to return to CO2 service.
Venting out-of-specification CO2
If out-of-specification CO2 enters the pipeline then remedial work to recover the situation will be required. This may involve venting the CO2 to atmosphere from the affected section or sections of the transportation system.
In this respect, consideration is being given to include for venting of the first section of the onshore pipeline between the Longannet and Valleyfield AGIs through the common plant stack at Longannet. This consideration will need to be explored further during the implementation phase of the project.
Venting to depressurise the system
The venting system will be required to allow depressurisation of individual sections or elements of the End-to-End CCS chain.
Depressurisation of the onshore and offshore pipelines will be considered an abnormal requirement as it is intended that the pipeline systems will be maintained in a pressurised state during the operating lifetime of the CCS chain.
However, should depressurisation of the pipeline systems be required, the inventory of CO2 released to atmosphere will be minimised by isolating the relevant pipeline section or sections using the pipeline valves available. Depressurisation of the pipeline(s) will be a manual operation and may involve the use of temporary vents deployed locally.
Under certain circumstances it may be necessary to depressurise the whole or a major section of the End-to- End CCS chain, i.e. the entire Onshore Transportation System.
The process for venting the large quantities of CO2 considered under these circumstances will be developed at the project implementation stage. This will include review of factors such as; whether the system is depressurised in sections or as a single release; preference of using temporary vents or permanent vents; and any design constraints that may limit how venting is achieved, e.g. backflow restrictions and timescales for venting.
Venting for thermal relief
Provision of thermal relief is a standard requirement for many pressure systems. The venting system will be required to support CO2 pressure excursions in the CCS chain following shutdowns and provide thermal relief. Vents will be required at several points on the CCS chain to accommodate thermal relief. Thermal relief is required to avoid overpressure conditions that can arise when a fluid is trapped in a system under rising temperature conditions. Venting will be used to bring the system back within its operational limits.
Dense phase CO2 has a high coefficient of thermal expansion. This can create pressure rises in blocked in sections of pipe and equipment. It is therefore necessary to protect these items with thermal relief valves. The detail of the venting arrangements proposed for Blackhill and Goldeneye will be designed to accommodate venting of dense phase CO2.

134
Venting during commissioning and decommissioning
Prior to commissioning, the Onshore Transportation System will contain a non-CO2 initial fill. In order to fill the system with in-specification CO2 this initial fill will require purging with CO2 exported from the CCP. To commission the onshore pipeline section of the CCS chain, venting will be required through temporary vents.
These vents will be installed on the onshore pipeline and will be used while the system is being filled with CO2. Venting will be carried out in sections along the pipeline and will cease when the initial fill is purged from each section of pipeline.
A temporary analyser will be used to monitor the venting stream and confirm that each section has been successfully purged.
Prior to commissioning, the offshore pipeline will contain a non-CO2 initial fill. In order to fill the system with in-specification CO2 this initial fill will require purging with CO2 exported from Blackhill Compressor Station.
This initial fill will be vented at the Goldeneye platform until the pipeline is filled with CO2 of the desired specification and the purge is complete. To decommission the End-to-End CCS chain, venting will be required to remove all of the CO2 from the system. Venting for decommissioning will be carried out in a similar manner to depressurising the system.
The system would then be filled with a preservation gas. These decommissioning proposals will be subject to further study and development during the implementation phase of the project.
Summary [6]
Onshore Pipeline
Re-using Asset: Feeder 10 pipeline
It has been possible to greatly reduce the cost and environmental impacts by re-using existing pipeline assets. This has also significantly reduced the implementation schedule and enabled the Consortium to consider CO2 storage at an earlier time.
For the development of the new pipeline section, it was decided to take a cautious approach until the transportation issues associated with the properties of CO2 are better understood. Whilst the initial design approach was to follow a business as usual model, the specific properties of CO2 mean that normal pipeline design principles and materials normally associated with natural gas are not always directly transferable (e.g. lower temperature resistant steels are required and new materials). This is due to the Joule-Thompson effect which is not an issue in natural gas pipelines. National Grid therefore used the safety in design criteria applied for methane pipelines.
The problems associated with the lower pipeline operating pressure will be common to other CCS projects as this is due to the physical properties of CO2. The properties of CO2 will vary dependent on location and climate conditions and these need to be well understood for each particular application. Maintaining CO2 in a gaseous phase over the 300 km pipeline has proven to be more difficult than initially anticipated. Designers who were experts on dealing with natural gas had to be educated on the properties of CO2, especially with regards to safety. For example, CO2 will collect at the lowest point, therefore designers need to understand the impacts of this behaviour on their chosen locations for vents, block valves etc.

135
National Grid identified a need to develop a consistent knowledge base of CCS for all their people working on the UKCCS Demonstration Competition. A presentation and supporting training package was developed as a starting point for all participants (internal and external, commercial and technical) to provide an understanding of the presentation is provided at the end of this appendix section.
Low water content of CO2 is required to minimise potential for corrosion.
Offshore Pipeline and Storage
Re-using Asset: Goldeneye offshore pipeline and gas reservoir
Shell found that injecting CO2 in vapour phase would result in slugging. By injecting CO2 in dense phase instead, the Joule-Thompson effect has resulted in identification of problems with the temperature profile across the well.
By using existing pipeline and wells, there have been constraints (running ductile fracture, small operating window). This was not anticipated initially but has become apparent as dense phase CO2 is better understood. Future projects need to work within these restraints; a better understanding of these issues will help inform the design process and avoid the rework / design iterations and developing learning undertaken on the present project.
Cycling of wells is not preferred to avoid damaging the wells and the field structure. Potential difficulty in designing to avoid for running ductile fracture. First start-up of CCS requires controlled conditions and a significant period of steady CO2
flow. Regular stops/starts at the beginning of the operational period is undesirable.
References
No. Report Name
1 SP-SP 6.0 - RT015 FEED Close Out Report 2 UKCCS - KT - S7.1 - E2E - 001 Post-FEED End-to-End Basis of Design 3 UKCCS - KT - S7.9 - OS – 001 Outline Solution Process Flow Diagrams 4 UK CCS Demonstration Competition FEED Dissemination Event, 5-6 December
2011; Presentation Session 5 5 UKCCS - KT - S7.10 - Shell - 001 Shell Heat and Mass Balance 6 UKCCS - KT – S12.0 - FEED- 001 Lesson Learned Report 7 UKCCS - KT - S7.24 - E2E – 003 End-to-End CO2 Venting Philosophy

136
5.2 Kingsnorth CCS Demonstration Project
Basic Overview [1,2,3,6,13]
The broad concept has been selected: CO2 will be captured from the flue gas at the proposed E.ON coal fired power plant located at Kingsnorth. The captured CO2 will be compressed and dried at a new onshore plant at Kingsnorth before being transported in a new pipeline to a new offshore platform, which is located at the Hewett reservoir. There is a potential for stepwise growth in transport volumes from the Demonstration flow rate (6 600 t/d) to 4 x Demonstration (26 400 t/d), and then to full pipeline capacity. The flow rates for Base Case and the Full Flow Case are shown in the table below whereas the composition of the CO2 stream is presented in the table after. The maximum content of trace components is on hold.
Table 5.2 Flow rates for Base Case and Full Flow
Unit Design Base Full Flow
Power equivalent MWg 400 1600 MWe 300 1200
Flow rate t/d 6 600 26 400 Peak annual volume t/y 2 410 650 9 642 600 Average annual volume1 t/y 2 169 585 8 678 340 Note: 1) Based on an availability of 90%.
Table 5.3 Composition of CO2 stream to be transported
Component Composition [mol%]
H2S 0
COS 0
CO2 99.94
CO 0
H2 0
N2 < 350 ppmv
Ar 0
CH4 0
O2 < 200 ppmv
H2O < 24 ppmv1
Note: 1) This value could rise to < 100 ppmv in an upset condition.

137
The initial assumptions for the operating conditions are presented in the following table.
Table 5.4 Operating conditions for gas and dense phase transportation
Unit LP (gas phase) HP (dense phase)
Max. pressure bar(g) 39 150 Min. pressure bar(g) 2 79 Max. temperature °C ~30-521,3 ~30-521 Min. temperature °C 42 42 Note: 1) Maximum temperature will depend on how much heat is added to maintain the system downstream of the Hewett choke. 2) Winter subsea ambient temperature. 3) No heat is added during normal operation. The environmental conditions for flow assurance work are listed in the table below.
Table 5.5 Environmental flow assurance conditions
Conditions Ground
temperature
Air
temperature
Sea surface
temperature
Seabed
temperature
°C °C °C °C
Summer (max.) 18 35 21 17 Winter (min.) 4 -6 1 4
General Description
Equation of State
In the near critical region, a specialised Equation of State such as Span and Wagner is recommended. If necessary outside the near critical region the Soave-Redlich-Kwong (with a Peneloux temperature correction) will be used as the equation of state for the system.
Fluid Phase For all cases operating conditions must ensure that no 2 phase flow is present in the pipeline. To avoid operating in the two-phase region, the base case option assumes that the pipeline will operate in LP (gaseous phase) mode up to a maximum inlet pressure of 39 bar(g). At this point operation will switch to HP (dense phase) mode with a minimum operating pressure of 79 bar(g).
Offshore CO2 Heating
The base case will assume that an electric heater will be used to heat the CO2 offshore prior to injection. Two alternative heating methods will be considered as sensitivity cases: a direct fired heater and an indirect fired heater. Platform heating with seawater is a sensitivity case which will remain outside the scope of this current study.
Solids Content The pipeline to the offshore facility will be carbon steel, which will have been initially flushed with seawater and then emptied, swabbed with MEG and swept through with multiple cleaning pigs, which will be propelled along the pipeline by dry compressed air. The level of cleanliness of the pipeline, prior to introducing CO2 into the pipeline, will be as best as can reasonably be achieved. However, some rust particles will still be carried

138
onto the platform. It is envisaged that filters will be provided downstream of the pigging branch from the pipeline.
Metering Requirements
Metering to fiscal standard will be provided onshore, within the boundary of the CO2 plant. Metering offshore will be for leak detection purposes only, located immediately downstream of the riser shutdown valve. A meter will be installed to measure all of the CO2 that is vented. This shall be an ultrasonic type of meter.
Condition Monitoring
The main focus of monitoring will be to identify conditions that could give rise to internal and external corrosion and to confirm that the operating conditions are being maintained in a way that corrosion is being successfully inhibited.
Design Life The pipeline system will have a design life of 40 years. Pipeline Surveillance and Maintenance
During operation, the onshore pipeline right-of-way will be monitored weekly to inspect for any indications of leaks or external damage. It is anticipated that the pipeline system will be shut-in for at least one day per year for internal inspection and annual compressor maintenance services, along with a more thorough inspection of the cathodic protection system. Additionally, it is anticipated that onshore right-of-way maintenance will be accomplished by an outside service company.
Start-Up & Shutdown Requirements
Refer to Start-Up & Shutdown Requirements Report (Gaseous Phase) [13]
Onshore Pipeline [1,2,4,6,10]
The pipeline starts within the confines of the proposed Kingsnorth Power Station. The proposed pipeline route heads in a northerly direction from the Power Station towards the landfall location and landfall valve in the vicinity of St. Mary’s Marshes where it will cross the intertidal mud flats and continue eastwards down the Thames Estuary.
The landfall valve site shall include provision for connection and injection of dense phase CO2 flow sources being delivered into the pipeline system from other capture sources in the Thames basin. Such provision shall enable connections to be made without interruption to the flow from Kingsnorth to Hewett. The proposed onshore route is outlined in Chapter 1.2.
The pressure and temperature conditions which shall apply are summarised in the table below.
Table 5.6 Operating parameters of Kingsnorth onshore pipeline
Description Unit Value
Design pressure bar(g) 150 Max. allowable operating pressure bar(g) 150 Max. design temperature °C 70 Pipeline inlet temperature range °C 30-50 Min. design temperature °C -85 Fluid classification (dense phase) E Pipeline diameter in 36

139
Corrosion allowance mm 1.5 Min. burial depth m 1.1 Max. design flow rate t/d 28 000
The wall thickness assumptions for different design pressures are given in the table overleaf.
Table 5.7 Wall thickness for Kingsnorth onshore pipeline
Design
Pressure Size OD ID WT1 Material Insulation U
Bitume
n Soil
Conc
rete
bar(g) inch mm mm mm mm mm mm W/m²K
120 36 920.8 873.2 23.8 X65 150 36 920.8 866.8 27.0 X65 5 1000 N/A 3.3 200 36 920.8 854.0 33.4 X65
Note: 1) These thicknesses are preliminary.
Additional Information
Onshore Pipeline Location Class
As a starting point, the following general pipeline location class shall be as considered: Class 2 (Areas with a population density greater than or equal to 2.5
persons per hectare) to be adopted for a distance of 800m (as a minimum) from High Water Tide Level towards offshore;
Class 1 (Areas with a population density less than 2.5 persons per hectare)
Burial The onshore pipeline will be buried along its entire length, with a minimum depth of cover of 1.1m, and with increased cover at crossings.
Landfall The landfall area is a key aspect of the proposed pipeline route. Typical landfall construction techniques are conventional open-cut with a cofferdam and pre-excavated trench, or HDD methods.
Onshore Pipeline Sectional Valves
Section isolating valves shall be installed at the beginning and end of the onshore pipeline, with consideration to further isolating valves at a spacing along the pipeline appropriate to the substance being conveyed to limit the extent of a possible leak. The spacing of sectional isolating valves should reflect the conclusions of any safety evaluation prepared for the pipeline, and should preferably be installed below ground.
Onshore Blowdown
The flow assurance modelling of onshore pipeline failures and blowdown has shown the following features: Full bore pipeline rupture release rates reduce substantially before
emergency response pipeline isolation can occur, with the duration of the tail event curtailed by the isolation of the pipeline at the landfall valve. Pipeline isolation at the landfall valve is the key measure to limit the continued release.
Full bore ruptures result in pipeline depressurisation of between 10 and 15 minutes and the initiation of blowdown does not provide any

140
significant benefit in reducing the loss of containment. Pipeline fractures are sustained relatively unabated by flow from the
offshore pipeline until isolation occurred at the landfall valve. Blowdown would need to follow isolation to be beneficial
Pipeline fractures are reduced in duration by blowdown, but the effect is only significant after a period of about 10 - 15 minutes.
Blowdown limits the continued release from a pipeline fracture, in both vapour and dense phase operations but only has a significant effect on the duration of the tail of the release (halving the duration in the cases considered)
The extent of benefit from blowdown for pipeline fractures is dependent on the vent arrangements within the CCS plant, as the blowdown orifice is limited by the capacity of the vent arrangement onshore
Offshore Pipeline [1,2,5,6,11]
The offshore section starts at the proposed landfall and runs east towards deeper water before deviating northwards towards Hewett. The proposed route is outlined in Chapter 1.2.
Offshore pipeline operating parameters are summarised in the following table.
Table 5.8 Operating parameters of Kingsnorth offshore pipeline
Description Unit Value
Design pressure bar(g) 150 Max. allowable operating pressure bar(g) Max. design temperature °C 70 Offshore pipeline inlet temperature °C 40 Min. design temperature °C -20 Pipeline diameter in 36 Safety class high Location class 2 Min. wall thickness mm 12 Corrosion allowance mm 1.5 Thickness of 3-layer PE coating mm 3.2 Max. design flow rate t/d 28 000
The wall thickness assumptions for different design pressures are given in the table overleaf.
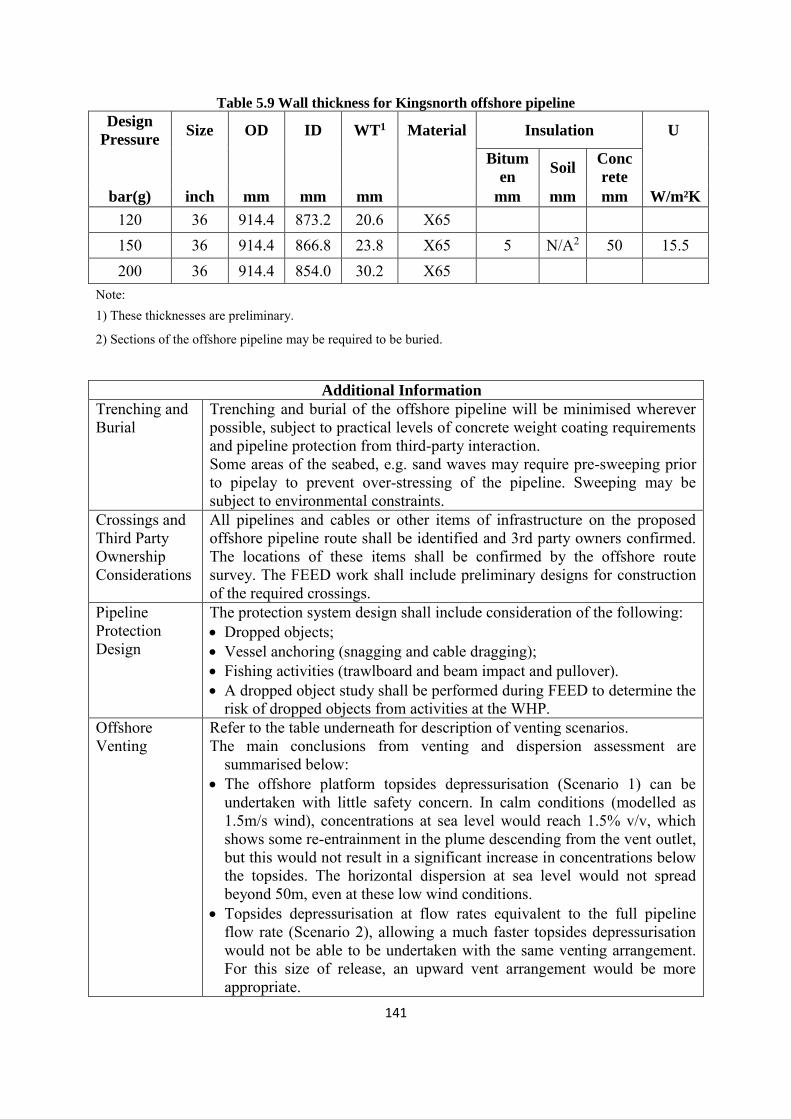
141
Table 5.9 Wall thickness for Kingsnorth offshore pipeline
Design
Pressure Size OD ID WT1 Material Insulation U
Bitum
en Soil
Conc
rete
bar(g) inch mm mm mm mm mm mm W/m²K
120 36 914.4 873.2 20.6 X65 150 36 914.4 866.8 23.8 X65 5 N/A2 50 15.5 200 36 914.4 854.0 30.2 X65
Note: 1) These thicknesses are preliminary.
2) Sections of the offshore pipeline may be required to be buried.
Additional Information
Trenching and Burial
Trenching and burial of the offshore pipeline will be minimised wherever possible, subject to practical levels of concrete weight coating requirements and pipeline protection from third-party interaction. Some areas of the seabed, e.g. sand waves may require pre-sweeping prior to pipelay to prevent over-stressing of the pipeline. Sweeping may be subject to environmental constraints.
Crossings and Third Party Ownership Considerations
All pipelines and cables or other items of infrastructure on the proposed offshore pipeline route shall be identified and 3rd party owners confirmed. The locations of these items shall be confirmed by the offshore route survey. The FEED work shall include preliminary designs for construction of the required crossings.
Pipeline Protection Design
The protection system design shall include consideration of the following: Dropped objects; Vessel anchoring (snagging and cable dragging); Fishing activities (trawlboard and beam impact and pullover). A dropped object study shall be performed during FEED to determine the
risk of dropped objects from activities at the WHP. Offshore Venting
Refer to the table underneath for description of venting scenarios. The main conclusions from venting and dispersion assessment are
summarised below: The offshore platform topsides depressurisation (Scenario 1) can be
undertaken with little safety concern. In calm conditions (modelled as 1.5m/s wind), concentrations at sea level would reach 1.5% v/v, which shows some re-entrainment in the plume descending from the vent outlet, but this would not result in a significant increase in concentrations below the topsides. The horizontal dispersion at sea level would not spread beyond 50m, even at these low wind conditions.
Topsides depressurisation at flow rates equivalent to the full pipeline flow rate (Scenario 2), allowing a much faster topsides depressurisation would not be able to be undertaken with the same venting arrangement. For this size of release, an upward vent arrangement would be more appropriate.

142
The switch to upward venting would also be appropriate for pipeline depressurisation (Scenarios 3 and 4). Given the much greater rates being released, the topsides pipework and vent outlet would need to be sized completely separately from the topsides venting arrangement.
The structural design implications for the pipeline depressurisation offshore would have a significant impact on the offshore platform design and topsides layout. This would require considerable redesign and structural strengthening to make this depressurisation arrangement viable on the offshore platform.
Simultaneous activities for helicopter arrival or departure with venting and depressurisation have been identified as prohibited.
Table 5.10 Kingsnorth offshore venting scenarios
Scenario Description Release
rate
Vent
diameter Velocity
Temp
. Location
kg/s mm m/s °C
Well start-up venting
Pressurized start-up flow rate to vent (1/4 well design flow rate) Equivalent to topside depressurisation in 2h Gas Phase
6.4 87.3 230.2 -49.6
Below platform, vertically down
Full flow venting
Full vent design flow through 3 heaters Equivalent to topside depressurisation in 15min Gas Phase
76.4 215.9 228.5 -49.6
Below platform, vertically down
Pipeline depressurisation Gas phase 92.0 257.2 229.0 -49.8
Vertically up, from stack
Pipeline depressurisation Dense phase 601.0 284.2 95.6 -78.0
Vertically up, from stack

143
PFD and Mass & Heat Balance [15,16]
Figure 5.1 Schematic diagram of Kingsnorth onshore and offshore pipeline

144
Table 5.11 Stream data of Kingsnorth onshore and offshore pipeline
Base Case - Initial Gas Phase Operation, Reservoir Pressure = 2.1 bar(g)
Stream No. 1 2 3 4 5 6 7
Stream
Kingsnorth Pipeline Entry
End of Pipeline / Top of Riser1
Upstream CO2 Injection Manifold
To CO2 Injection Heater2
Downstream CO2 Injection Heater3
Downstream Choke Valve Bottomhole5
Phase Gaseous Gaseous Gaseous Gaseous Gaseous Gaseous Gaseous Pressure bar(g) 26.9 21.1 21.1 21.1 21.1 20.8 7.5 Temperature °C 40.0 3.0 3.0 3.0 3.0 2.8 5.9 Mass Flow t/d 6 600 6 000 6 600 2 200 2 200 2 200 2 200 Actual Volumetric Flow Am³/h 5 082 5 441 5 441 1 814 1 814 1 842 5 367 Density kg/m³ 54.1 50.5 50.5 50.5 50.5 49.8 17.1 Viscosity cP 0.0171 0.0152 0.0152 0.0152 0.0152 0.0151 0.0147 Heat Flow kW - 1 000 - 3 565 - 3 565 - 1 188 - 1 188 - 1 182 - 649 Z Factor 0.872 0.838 0.838 0.838 0.838 0.841 0.945 Composition CO2 mol% 99.94 N2 ppmv < 350 O2 ppmv < 200
H2O ppmv < 1004
Note:
1) A seawater temperature of 4°C was used to determine the CO2 arrival conditions.
2) CO2 is routed to 3 out of 4 wells. The flow is assumed to be split evenly, although this is unlikely to be the case in practice. 3) Heating is not required during normal gas phase operation, only during start-up, venting and dense phase operation. 4) Max. water content allowed in upset condition. Expected to be < 24 ppmv in normal operation. 5) Conditions at exit from wellbore tubing.

145
Table 5.12 Stream data of Kingsnorth onshore and offshore pipeline
Base Case – End of Gas Phase Operation, Reservoir Pressure = 29.6 bar(g)
Stream No. 1 2 3 4 5 6 7
Stream
Kingsnorth Pipeline Entry
End of Pipeline / Top of Riser1
Upstream CO2 Injection Manifold
To CO2 Injection Heater2
Downstream CO2 Injection Heater3
Downstream Choke Valve Bottomhole5
Phase Gaseous Gaseous Gaseous Gaseous Gaseous Gaseous Gaseous Pressure bar(g) 34.9 31.0 31.0 31.0 31.0 30.8 34.0 Temperature °C 40.0 2.9 2.9 2.9 2.9 2.6 20.0 Mass Flow t/d 6 600 6 600 6 600 2 200 2 200 2 200 2 200 Actual Volumetric Flow Am³/h 3 761 3 328 3 328 1 109 1 109 1 116 1 134 Density kg/m³ 73.1 82.6 82.6 82.6 82.6 82.1 80.9 Viscosity cP 0.0175 0.0158 0.0158 0.0158 0.0158 0.0158 0.0167 Heat Flow kW - 1 669 - 4 919 - 4 919 - 1 640 - 1 640 - 1 640 - 1 162 Z Factor 0.830 0.743 0.743 0.743 0.743 0.744 0.782 Composition CO2 mol% 99.94 N2 ppmv < 350 O2 ppmv < 200
H2O ppmv < 1004
Note:
1) A seawater temperature of 4°C was used to determine the CO2 arrival conditions.
2) CO2 is routed to 3 out of 4 wells. The flow is assumed to be split evenly, although this is unlikely to be the case in practice. 3) Heating is not required during normal gas phase operation, only during start-up, venting and dense phase operation. 4) Max. water content allowed in upset condition. Expected to be < 24 ppmv in normal operation. 5) Conditions at exit from wellbore tubing.

146
Offshore Platform [1,2,3,9,12]
Offshore Platform General Information
Platform Concept The platform concept which is recommended for the Kingsnorth Carbon Capture and Storage offshore facility is a liftable jacket substructure with a lift-installed integrated deck topsides structure and piled foundations. The advantages of a platform of this type identified in the concept selection process included: Efficient structure – Low design, fabrication and installation
CAPEX; Low decommissioning and disposal costs; OSPAR/DECC decommissioning compliant for approval of
FDP; Availability of construction yards and decommissioning
facilities; Currency and availability of design and construction expertise; Structural redundancy of jacket against ship impact and fatigue
damage; Access for "walk to work" marine transit option for visits to
NUI. Platform Location The location of the offshore facility/wells has yet to be confirmed
but is assumed to be in the vicinity of the existing Hewett platform complex, in Block 48/29 of the UKCS Southern North Sea
Water Depth The water depth at the Hewett Platform is 37m. Design Life It is assumed that the platform/facilities will have a design life of
40 years. Arrival Facilities The 36” CO2 pipeline from Kingsnorth will tie into the base of
the 36” riser at the Hewett CO2 injection platform. The pipeline and riser are isolated from the platform facilities by two 36” riser valves in series. These valves will close on an ESD signal. Permanent pig receiving facilities will be present on the platform that will allow intelligent pigs to be received.
CO2 Filtration To prevent fouling of the formation two, 100% CO2 Process System Filters will be provided downstream of the arrival facilities to remove the particulates from the CO2. The filters will operate on a duty / standby basis.
Leak Detection Metering Three metering streams, two duty / one standby, will measure the quantity of CO2 arriving at the platform. The leak detection meters will input into a Real-Time Transient Modelling (RTTM) Leak Detection and Location System. This system compares pressure, temperature and in/out flow values of the pipeline with calculated values and works continuously.
Manifolds The manifold has a design pressure of 150 bar(g) with a design temperature range of minus 85°C to 100°C. The well kill manifold is supplied with seawater from the seawater system.
CO2 Heating and Injection Facilities
Each flowline and CO2 Well Heater has a design pressure of 150 bar(g) with a design temperature range of minus 85°C to 100°C.

147
The CO2 Well Heaters will only normally be used during start-up conditions to ensure that the CO2 entering the well remains as a gas above 0°C.
Hydrate Inhibitor Injection
Hydrate inhibitor may be required on the platform to break down hydrate blockages around the CO2 Well Heaters, choke valves and into the wellbore. It may also be used to break down hydrates that form in the vent system downstream of the CO2 Well Heaters. Hydrate Inhibitor can be injected upstream and downstream of the CO2 Well Heaters.
Seawater System
A seawater system will be employed on the platform to supply treated, filtered seawater to the seawater users i.e. emergency accommodation, deck washdown and wellbay well kill fluid manifold.
CO2 Venting
Rationale for Venting/Depressurisation
There are four main circumstances under which venting or depressurisation of pressurised gas process facilities will normally be required: Full Flow Process Relief Depressurisation Initiated via an Emergency Shutdown Fire/Thermal Relief Maintenance Venting
Location The CO2 vent system will tie together the various CO2 vent lines into a single vent line. The outlet of this vent line will be located below the deck level of the platform and the vent nozzle will be directed downwards towards the sea. The vent location needs to be placed in a suitable location that will limit the potential asphyxiation risks to personnel.
Assumptions It is assumed that all the vessels and pipework will be fully rated for the maximum pressure that could be seen. Full flow process pressure relief will therefore not be required.
It is assumed that the Offshore Infrastructure Let-down System will be designed to handle a maximum inventory of CO2 from the topsides isolation valve, installed at the top of the riser through to the isolation at the wells. At this stage of design it is assumed that if the sealine were required to be depressurised, the CO2 inventory in the flowline would be displaced with an alternative motive fluid (i.e. dry air) into the reservoir. The sealine could then be depressurised after being emptied of CO2.
A vent heater, which could also be one of the topsides process heaters, has been assumed to aid CO2 dispersion and avoid a visible plume of “CO2 snow”.
Blowdown Criteria There could be a requirement to limit the speed of blowdown to avoid creating wall temperatures in the system below the design temperature. This is an issue where boiling liquids are present during depressurisation (i.e. dense phase mode). Using an extended blowdown time will ensure that the operation becomes less adiabatic i.e. the fluid will have more time to warm due to the

148
heat transfer with the surroundings. Blowdown Pressure It is recommended that the system pressure is not depressurised to
below a pressure of 7 bar(g). This will avoid the potential for solid formation within the transportation system following a blowdown event.
Design Temperature/ Materials of Construction
It is estimated that a material with a minimum design temperature of circa -85°C should be sufficient.
Offshore Utilities [3]
The key utilities (electrical power and communications) are provided from onshore. If there is a loss of communications from onshore, the platform will shut down after a specified time delay. The time delay before an automatic shutdown is initiated is to provide the time for the control room operators to re-establish the communication link. An automatic shutdown will also be initiated on loss of power from onshore.
Offshore Utilities
Hydrate Inhibitor
The Hydrate Inhibitor will only be used if required during start-up of an injection well. If the liquid level is low, then the storage tank will have to be refilled with hydrate inhibitor from onshore.
Nitrogen Quad A Nitrogen Quad will supply the hydrate inhibitor tank with a nitrogen gas blanket. The operating requirements for the Nitrogen Quad are yet to be defined.
Seawater System
The seawater system should only be in use when personnel are onboard the platform and it should be shutdown when personnel leave the platform. To provide continuous fouling protection of the lift pump and caisson even while the lift pump is offline, an Electrolytic Anti Fouling System is proposed.
Internal Corrosion [7]
With respect to internal corrosion, the initial design basis is that CO2 gas will be dehydrated to a level where condensation is avoided, otherwise severe corrosion problems would be expected even without the presence of oxygen. The anticipated high concentrations of CO2 (99.6 mol%) will give significant corrosion problems with carbon steel if there is liquid water present. As a result, the control and instrumentation system will be designed to monitor the water content of the export CO2 and will shut down export if the water content exceeds permissible levels.
Internal Corrosion
Linepipe Material
Carbon steel line pipe is the economical choice for CO2 transport. A high strength grade of carbon steel is expected to be generally suitable for construction of the onshore and offshore pipeline. Direct depressurisation of dense phase could lead to temperatures lower than the minimum design temperature of carbon steel.
Corrosion Resistant
There is likely to be a requirement for corrosion resistant alloys (CRA’s) at particular locations in the system, for example valve materials, or spool

149
Alloys pieces subject to particularly low temperatures. External Corrosion Protection
The pipeline shall be protected against external corrosion using a standard anti-corrosion coating. Insulation is not required. Where the line pipe is to be subsequently concrete coated for hydrodynamic stability and/or protection, the anti-corrosion coating shall be compatible with the application of the concrete weight coating. Field joint coating (FJC) type shall be determined during FEED 2. The FJC including in-fill material shall provide an equivalent level of corrosion protection as the parent coating. The onshore pipeline will be cathodically protected using an impressed current system. Test posts will be located at a nominal spacing of 1km along the entire route of the onshore section. Isolating joints will be located at the shoreline and at Kingsnorth. The offshore pipeline shall be cathodically protected using Al-Zn-In sacrificial bracelet anodes. The cathodic protection design shall be primarily to DNV-RP-F103 supplemented by ISO 15589-2.
Condition Monitoring
The main focus of monitoring will be to identify conditions that could give rise to internal and external corrosion and to confirm that the operating conditions are being maintained in a way that corrosion is being successfully inhibited.
Low Pipeline Temperatures
When operating in dense phase mode, a leak from a CO2 transportation pipeline could chill the pipe material locally and or generally to temperatures below -70 ºC.
Non-Metallic Materials
When operating in CO2 dense phase mode, the potential for leakage leading to temperatures below minus 70 ºC imposes onerous conditions on non-metallic materials such as seals. Due to liquid CO2 phase acting as a solvent swelling of elastomers may occur due to solubility/diffusion of the pressurised CO2 into the elastomer. With dense phase CO2 explosive decompression of the elastomer can occur if the system pressure is rapidly decreased.
Hydrate Formation [14]
Pipeline and Topsides Hydrate Potential To ensure that corrosion of the pipeline will not take place the CO2 will be dehydrated to a specification for 24 ppmv H2O prior to entering the pipeline. In an unusual upset condition, this could rise to approximately 100 ppmv H2O. For winter ambient conditions, which represent the worst case scenario for hydrate formation, the temperature in the pipeline cools to a minimum of c. 4 °C for both the base case and full flow scenarios. At the range of pressures encountered within the pipeline system for gaseous and dense phase operation (21 bar(g) to 87 bar(g)), this is within the acceptable margin of 3°C from the hydrate formation temperature, even for a 100 ppmv H2O composition. There is no hydrate potential in the steady state condition during normal gaseous phase operation. During start-up the possibility of hydrate temperatures is avoided with the use of the CO2 Well Heaters.

150
Vent System Hydrate/Ice Potential
The possibility of very low temperatures approaching minus 80°C is realistic in the vent system. This may mean that ice or hydrates could occur in this system. To eliminate any safety risks, this system will be fully pressure rated and temperature rated. However, the system will be designed to be vented downstream of the CO2 Well Heaters, thereby ensuring that the risk of hydrate or ice blockage is mitigated. Although, the formation of hydrates during normal operation is highly unlikely due to the low concentration of water entering the system, hydrates / ice may form during equipment start-up following maintenance activities. During maintenance activities, where equipment will be opened up to atmosphere (e.g. to change out the CO2 process system filters), it is possible that free water will enter the equipment and thereby form hydrates / ice on re-pressurisation either in the equipment or further downstream. As a contingency, hydrate inhibitor (methanol) injection facilities will be provided offshore to break down any hydrates that may form in the system. Summary
The facilities have been designed so that hydrates will not occur in any part of the CO2 process in normal operation.
Ice or hydrate blockage would only remain a possibility in an upset condition in the vent system. This would be prevented by ensuring that water pockets are eliminated from the system by continuously sloping the vent system towards vent system exit. The vent system would also be fully pressure rated to match the maximum design pressure of the upstream vented sections. The topsides would also be vented though the topsides electric heaters.
To eliminate ice/hydrate blockages in any part of the topsides system, then it is recommended that as a contingency that a small hydrate inhibitor injection package is provided on the topsides.
It is recommended that methanol is used for the hydrate inhibitor as any other inhibitors may be too viscous at low temperatures and methanol is known to break up hydrates quicker.
It is recommended that a small storage tank of only 2 m³ of methanol is used for package design.
It is recommended that injection facilities are provided upstream and downstream of each CO2 well heater.
Pigging [2,3,8]
The base case assumption is that permanent pig traps will be required both onshore and offshore. Operational pigging is not required for the 36” CO2 pipeline however, pigging operations will occur when an intelligent pig run is required and when depressurising the pipeline. Pigging runs to sweep the CO2 out of the pipeline and into the reservoir prior to depressurisation of the pipeline will be required.
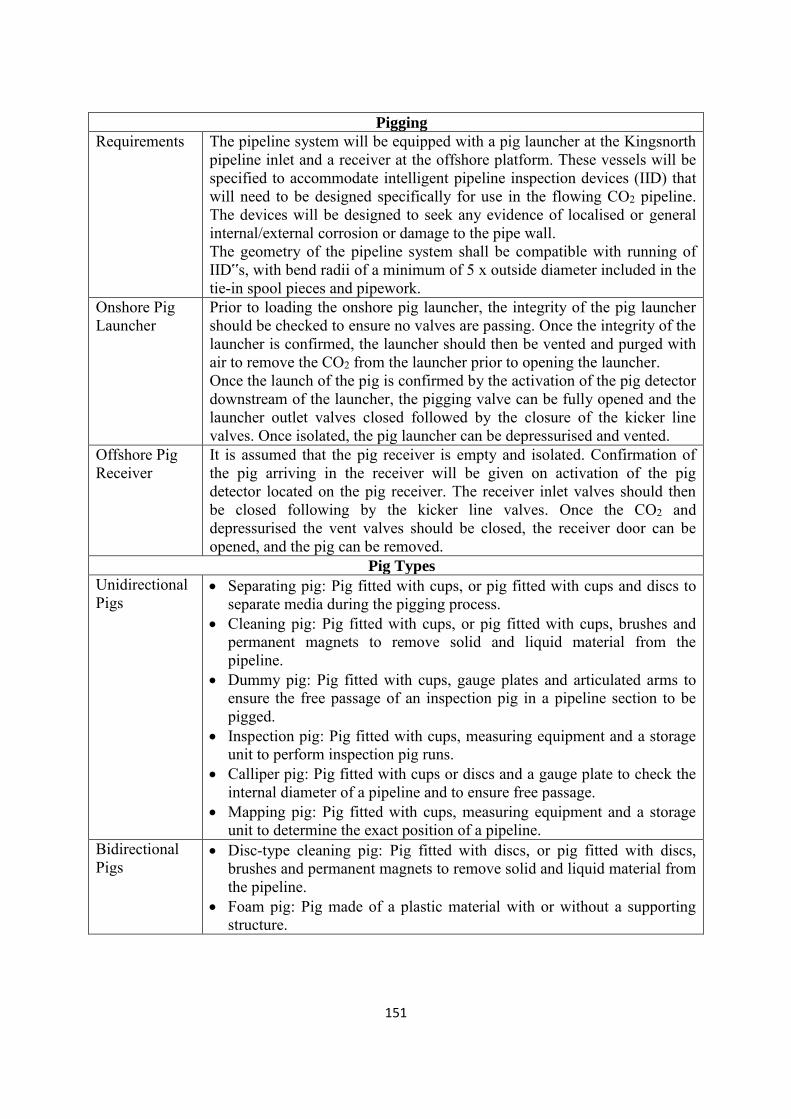
151
Pigging
Requirements The pipeline system will be equipped with a pig launcher at the Kingsnorth pipeline inlet and a receiver at the offshore platform. These vessels will be specified to accommodate intelligent pipeline inspection devices (IID) that will need to be designed specifically for use in the flowing CO2 pipeline. The devices will be designed to seek any evidence of localised or general internal/external corrosion or damage to the pipe wall. The geometry of the pipeline system shall be compatible with running of IID‟s, with bend radii of a minimum of 5 x outside diameter included in the tie-in spool pieces and pipework.
Onshore Pig Launcher
Prior to loading the onshore pig launcher, the integrity of the pig launcher should be checked to ensure no valves are passing. Once the integrity of the launcher is confirmed, the launcher should then be vented and purged with air to remove the CO2 from the launcher prior to opening the launcher. Once the launch of the pig is confirmed by the activation of the pig detector downstream of the launcher, the pigging valve can be fully opened and the launcher outlet valves closed followed by the closure of the kicker line valves. Once isolated, the pig launcher can be depressurised and vented.
Offshore Pig Receiver
It is assumed that the pig receiver is empty and isolated. Confirmation of the pig arriving in the receiver will be given on activation of the pig detector located on the pig receiver. The receiver inlet valves should then be closed following by the kicker line valves. Once the CO2 and depressurised the vent valves should be closed, the receiver door can be opened, and the pig can be removed.
Pig Types
Unidirectional Pigs
Separating pig: Pig fitted with cups, or pig fitted with cups and discs to separate media during the pigging process.
Cleaning pig: Pig fitted with cups, or pig fitted with cups, brushes and permanent magnets to remove solid and liquid material from the pipeline.
Dummy pig: Pig fitted with cups, gauge plates and articulated arms to ensure the free passage of an inspection pig in a pipeline section to be pigged.
Inspection pig: Pig fitted with cups, measuring equipment and a storage unit to perform inspection pig runs.
Calliper pig: Pig fitted with cups or discs and a gauge plate to check the internal diameter of a pipeline and to ensure free passage.
Mapping pig: Pig fitted with cups, measuring equipment and a storage unit to determine the exact position of a pipeline.
Bidirectional Pigs
Disc-type cleaning pig: Pig fitted with discs, or pig fitted with discs, brushes and permanent magnets to remove solid and liquid material from the pipeline.
Foam pig: Pig made of a plastic material with or without a supporting structure.

152
Summary [2]
The platform concept is a liftable jacket substructure with a lift-installed integrated deck topsides structure and piled foundations.
The platform size for the demonstration can be minimized to an NUI. The pipeline size selected for study was 36” OD. A pipeline wall thickness of up to
around 40mm was assumed, leaving an ID of around 32 - 33”. The pipeline material selected and recommended is high yield strength carbon steel. The corrosion prevention strategy is to provide a high reliability drying process. The pipeline can only be operated as a vapour phase pipeline until the pressure at
discharge from the compressors reaches 39 bar(g). This will be consistent with a flowing pressure at the wellhead injection pressure of 35 bar(g) and an injection pressure at the reservoir of less than 33 bar(g) when flowing at a rate of 6 600 t/d.
The pipeline route passes within 1.5 km of the known location of a shipwreck (SS Richard Montgomery) containing unexploded ordnance.
Intermediate storage for CO2 may not be required. Compressibility in the vapour content of the pipeline can be used as a substitute for at least some intermediate storage.
Two phase flow in the pipeline should be avoided as this has potential to set up transients that may damage the pipeline mechanically.
After injection of around 22 million tonnes, the pipeline will need to be ready for conversion to flow in dense phase.
Pipe work located on the topsides upstream of the wells will need to be insulated during winter operations when air temperature can be well below that of the sea temperature.
Stop/Start operations (flexible generation, two shifting) represent a considerable challenge to CCS as the CCS system will need to follow generation flexibility.
References
No. Report Name
Document
No.
1 Key Reference Handbook 0 2 Platform and Pipeline Basis of Design for Studies 6.2 3 Platform & Pipeline Operating Philosophy - Gaseous Phase Operation 6.3 4 Onshore Pipeline Project Data 6.4 5 Offshore Pipeline Project Data 6.5 6 Onshore and Offshore Pipeline Design Philosophy 6.6
7 Pipeline Material Selection, Corrosion Protection and Monitoring Philosophy 6.7
8 Pigging Philosophy 6.9 9 Platform & Pipeline Pressure Let-down System Design Philosophy 6.12 10 Onshore Blowdown Conceptual Design Report 6.31 11 Offshore Venting and Dispersion Study Report 6.45 12 Offshore Concept Screening Report 6.39 13 Start-Up & Shutdown Requirements Report (Gaseous Phase) 6.44

153
14 Hydrate Mitigation Study Report 6.54 15 Design Temperature and Pressure Demarcation (Base Case) 6.61 16 Heat & Mass Balance Demo Phase and Full Flow 6.60

154
CHAPTER 6: WELLS
This chapter will summarise both the plans for CO2 injection at the Hewett field in the southern North Sea (Kingsnorth Project) and the Goldeneye field in the central North Sea (Longannet Project).
Source of Data Shell has operated the Goldeneye field for gas production from 2004 to 2010 and is in possession of all data.
For the Hewett field the majority of the data was purchased from the current field operator ENI. In addition all relevant or related data in the public domain was downloaded from the Common Data Access (CDA) website (www.ukdeal.co.uk). The seismic data survey (PJ942) was purchased from Petroleum Geo-Services (PGS) and the exploration well log data was purchased from Information Handling Systems (IHS energy).
CO2 Composition
Goldeneye requirements:
CO2 >= 99%
O2 < 1ppmV
H20 <= 20ppmw (50ppmV)
N2+H2+Ar – inerts <= 1%
H2 < 0.30%
Particulate Size <= 7microns
Hewett Analysis carried out based on:
CO2 99.94 vol%
N2: 350 ppmv
O2: 150 ppmv
H2O: 24 ppmv normal conditions and 100 ppmv upset conditions
[1][2]
Platform The Goldeneye platform will be reused. The installation is normally unmanned which is also suitable for CO2 operations. Hydrocarbon producing facilities will be decommissioned. Vent and safety systems will be modified for CO2 service and much of the pipework will be replaced with low temperature rated pipework.
A new platform will be built for the Hewett field.
Requirements Goldeneye:
A range of operating conditions have been assumed, due to the likely variation in supply of CO2. These are 34 MMscf/day (75 tonnes/hr) and 114 MMscf/day (250 tonnes/hr) at pressures between 45 to 115 bar (652 to 1,667 psi). [3]
Hewett:
The wells will be designed to operate with the following rates of CO2 Demonstrator Stage (Gaseous Phase Injection):
300 MWnet (DECC competition requirement) Equivalent to ~ 400 MWgross 275 tonnes/hour = 6,600 tonnes/day Full System Stage (Dense Phase Injection):
2 x 800 MWgross (Kingsnorth power plants Nos. 5 & 6) 1,100 tonnes/hour = 26,400 tonnes/day
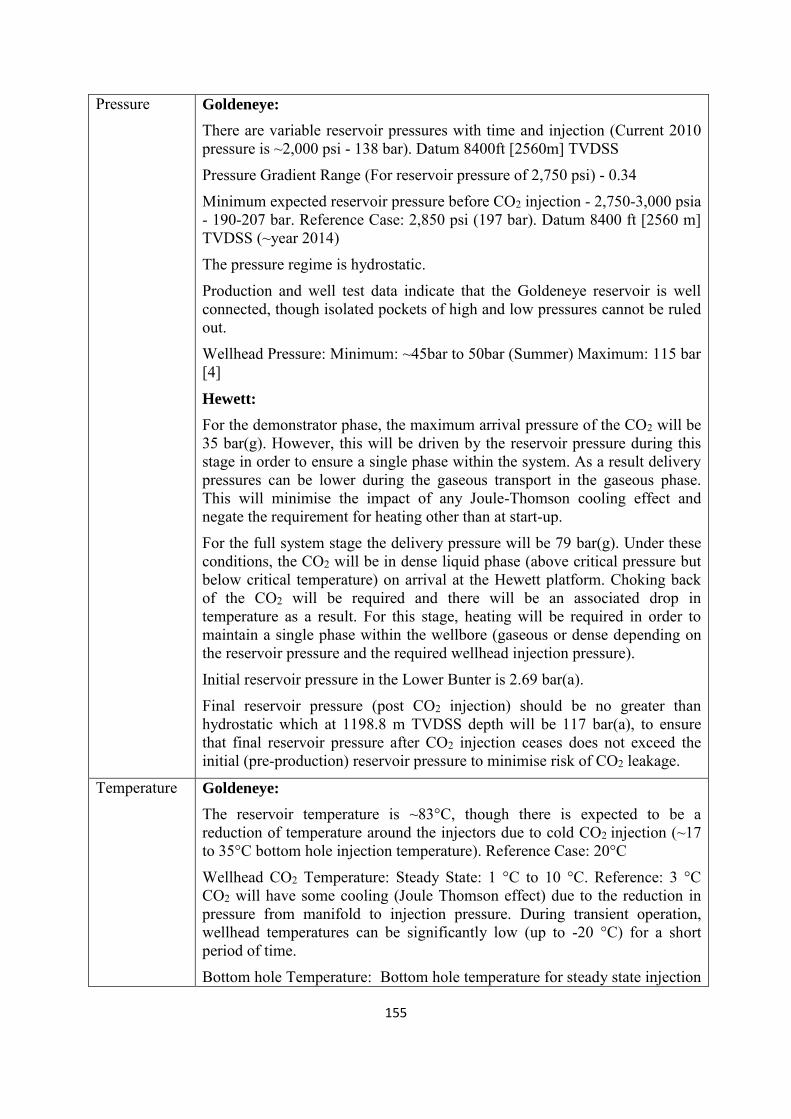
155
Pressure Goldeneye:
There are variable reservoir pressures with time and injection (Current 2010 pressure is ~2,000 psi - 138 bar). Datum 8400ft [2560m] TVDSS
Pressure Gradient Range (For reservoir pressure of 2,750 psi) - 0.34
Minimum expected reservoir pressure before CO2 injection - 2,750-3,000 psia - 190-207 bar. Reference Case: 2,850 psi (197 bar). Datum 8400 ft [2560 m] TVDSS (~year 2014)
The pressure regime is hydrostatic.
Production and well test data indicate that the Goldeneye reservoir is well connected, though isolated pockets of high and low pressures cannot be ruled out.
Wellhead Pressure: Minimum: ~45bar to 50bar (Summer) Maximum: 115 bar [4]
Hewett:
For the demonstrator phase, the maximum arrival pressure of the CO2 will be 35 bar(g). However, this will be driven by the reservoir pressure during this stage in order to ensure a single phase within the system. As a result delivery pressures can be lower during the gaseous transport in the gaseous phase. This will minimise the impact of any Joule-Thomson cooling effect and negate the requirement for heating other than at start-up.
For the full system stage the delivery pressure will be 79 bar(g). Under these conditions, the CO2 will be in dense liquid phase (above critical pressure but below critical temperature) on arrival at the Hewett platform. Choking back of the CO2 will be required and there will be an associated drop in temperature as a result. For this stage, heating will be required in order to maintain a single phase within the wellbore (gaseous or dense depending on the reservoir pressure and the required wellhead injection pressure).
Initial reservoir pressure in the Lower Bunter is 2.69 bar(a).
Final reservoir pressure (post CO2 injection) should be no greater than hydrostatic which at 1198.8 m TVDSS depth will be 117 bar(a), to ensure that final reservoir pressure after CO2 injection ceases does not exceed the initial (pre-production) reservoir pressure to minimise risk of CO2 leakage.
Temperature Goldeneye:
The reservoir temperature is ~83°C, though there is expected to be a reduction of temperature around the injectors due to cold CO2 injection (~17 to 35°C bottom hole injection temperature). Reference Case: 20°C
Wellhead CO2 Temperature: Steady State: 1 °C to 10 °C. Reference: 3 °C CO2 will have some cooling (Joule Thomson effect) due to the reduction in pressure from manifold to injection pressure. During transient operation, wellhead temperatures can be significantly low (up to -20 °C) for a short period of time.
Bottom hole Temperature: Bottom hole temperature for steady state injection

156
ranges from 17 °C to 37 °C. Reference Case: 20 °C. Lowest bottom hole temperature as ~17°C for injection fluid temperature of ~1 °C during winter and at wellhead pressure of ~45 bar.
Goldeneye wells should be designed such that they incorporate the well transient effects.
The low temperature at the wellheads will not vary significantly with the change in well completion type. Operational procedures should be designed to constrain pressure and temperature within the transient operating envelope. The well close-in time and the start-up time for well operations should be limited to 2hrs to remain within the well design. In order to maintain well integrity during transient operations, the well components should be designed to handle low temperatures at the top of the well (~650m).
Well component material should be designed to withstand the low temperatures encountered during steady state and transient conditions. [5]
Hewett:
Due to the length of the subsea pipeline, the arrival temperature of the CO2 will be 4°C (worst case minimum during Winter).
The ambient air temperature is taken as -6°C (again worst case minimum during Winter).
Reservoir temperature is 52°C at 1261.9 m TVDSS (based on midpoint of reservoir calculated from average well depths). [6][7]
Current Wells Goldeneye:
There are currently 5 production wells.
The existing Goldeneye completions are not suitable for CO2 injection operations. The combination of initial low reservoir pressures, circa 2,500 psi (172 Bar), large bore tubing, (7.00” x 5 ½”), low arrival temperature of CO2 at the wellhead, 2°C-4°C (35.6°F- 39.2°F) and surface injection pressures between 45–115 bar (652-1,667psi) make it impossible to maintain the supplied CO2 above the saturation line. Injecting CO2 through the current Goldeneye wells below the saturation line creates problems with extreme low temperatures that can be attributed to a Joule Thomson effect at the injection choke.
Pressure and Temperature modelling (WEPS) suggests that injecting CO2 into the current Goldeneye completions below the saturation point will cause a Joule Thomson effect that will cool the wellhead and upper section of tubing to around -25 deg C, to a depth of around 2,500 ft (762 m) MD (Measure Depth). This very low temperature raises concerns with the current completion design. Of particular concern are material specification, tubing contraction, well bore freezing, and PBR (Polished Bore Receptacle) integrity.
Hewett:
New injection wells will be drilled

157
New Wells / Workover Plans
Goldeneye:
Re-completion of the wells will change out the 7'' tubing to a smaller size. This is in order to provide back pressure in the well, thereby keeping the CO2 in single state during CO2 injection. As pressure and volume of the CO2 will vary during the duration of the project, the injection rates will be
accommodated by the operational selection of different tubing sizes - low rates with smaller tubing and higher rates with larger tubing.
The upper completion tubing will be a 13 Cr steel tubing material to provide for life of CO2 injection corrosion resistance. Top of the tubing to the SSSV is planned to be S13Cr which has a better temperature rating (-50°C based on vendor information) than the 13Cr (between 0 to -30°C depending on information source).
Tubing hanger material can be upgraded in line with the increased Christmas tree specification. As Christmas trees will also need to be replaced.
A single well will not be able to inject from the minimum to the maximum injection rate due to the limited injection envelope per well.
A combination of available injector wells should be able to cover the injection rate ranges arriving at the platform. The aim is to minimise the number of wells within the overall well restrictions. The completion sizing also considers the overlap of well envelopes to give flexibility and redundancy in the system for a given CO2 arrival injection rate. At a given arrival rate different combinations will add flexibility to the system.
The planned tubing sizes in the different wells are as follows:
GYA01: 4.5”-4”-3.5” (2,550-6,500-8,430 ft AHD)
GYA02S1: 4.5”-3.5” (4,000-10,803 ft AHD)
GYA03: 4.5”-3.5” (2,500-9,000 ft AHD)
GYA04: 4.5”-4.5”-3.5” (2,566-9,400-12,665 ft AHD)
GYA05: 4.5”-3.5”-2.875” (2,591-4,700-8,070 ft AHD)
The initial thoughts were to keep the original completions in 1 or 2 wells to be used for monitoring, but it was decided to have each well capable of performing both injection and monitoring, giving more flexibility. Each well will contain PDGM (permanent downhole gauge mandrel) and DTS (distributed temperature sensor).
There is also the option to sidetrack wells at around the depth of the Hod Formation (~2134 m), though the exact depth will depend on the depth of mechanical failure to be mitigated. If a well is sidetracked the opportunity to take a core of the caprock will be taken.
If the work over of any well is unsuccessful, the mother bore will be side tracked.
Drilling fluids:
An oil based packer fluid was decided on to minimise corrosion in the tubing and production casing and to avoid formation of hydrates (which would be

158
possible with a water based fluid). A water based fluid would also not be appropriate due to expected temperatures and may freeze. [8][9][10][11]
Hewett:
Carbon steel is recommended for downhole tubing and liner if the water content in the supplied CO2 is less than 300 ppmv (14 lb/MMscf), otherwise GRE lined carbon steel tubing should be considered for downhole tubing and liner. Carbon steel casing is recommended from wellhead to the reservoir upper-seal depth where casing is unlikely to contact high salinity formation water. 13% chromium (Cr) steel casing can be used in the sections.
Wells will need to be compatible with the demo phase, whereby gaseous CO2 will be injected and full phase, whereby dense phase CO2 will be injected.
Initial assumptions at the start of the design process were that four wells plus one contingency would be required and that all injection wells are surface wells with dry trees located on a Normally Unmanned Installation (NUI) and that all wells will be drilled from this platform.
However, as a result of the initial modelling runs a number of changes to the design which affect tubing size and well count were made.
The tubing size for base case design was originally assumed to be 7” for gaseous phase injection and 4.5” for dense phase injection. However, as a result of the large increase in rate for the full system phase (26,400 te/d), well size should be maintained at 7” along with an increase in the number of 7” wells for the full system. The design will allow therefore for 3 injection wells plus 1 contingency well for the demonstrator stage and a further 5 wells for the full system stage. For clarity:
Initial 3 wells gaseous phase injection (demonstrator) TOTAL = 3
1 contingency well to be drilled at start TOTAL = 4
Additional 5 wells dense phase delivery (full system) TOTAL = 9 Heating will be supplied in order to minimise the effects of a phase change taking place on the offshore topsides equipment or in the wellbore. The system will be designed to be self-regulating but can be started and stopped remotely.
The CO2 will be dehydrated to 24 ppmv prior to transportation to mitigate against corrosion/hydrate formation. In upset conditions, the dehydration will be limited to no more than 100 ppmv.
Base well design constructed with 7” tubing string and a deviation of 50 degrees through the reservoir. This allows for:
Minimising the initial number of wells required while allowing for flexibility in delivery
Ensuring drillability through the highly depleted Lower Bunter. Areal spacing to minimise the effects of thermal interference between
wells. Use of wire line intervention

159
Simulations in OLGA have shown that for a CO2 injection rate of 6,600 te/day in gaseous phase three wells (plus one contingency) are required with 7” tubing.
The gaseous phase can continue with the above well configuration until the reservoir pressure reaches 33 bar(g) based on a limiting wellhead injection pressure of 35 bar(g).
Dense phase delivery will initially require eight wells (plus one contingency) with 7” tubing in order to inject the anticipated 26,400 te/day. This number will drop to six as the reservoir pressure increases.
While the demonstrator phase can be completed using 3 x 7” wells, it is recommended that a fourth well be provided as contingency to allow for intervention and maintenance work as well as variations in the supply and well availability.
A drilling program needs to be established and the risks associated with batch drilling all the wells versus drilling though an existing CO2 store examined.
Finalisation of the injection schedule needs to be completed following verification of individual well trajectories and tubing size based on tubing stress analysis and the completion design process.
[12][13][14][15]
Well abandonment plans
Goldeneye:
An area of 25x17.5 km with the Goldeneye field in the centre contain 13 abandoned exploration and appraisal wells, which were assessed for quality of abandonment and suitability to cope with CO2 conditions. All E&A wells are abandoned (subsurface cement barriers installed and the wellheads removed) therefore no longer feature access to the original wellbores. Any repairs to these wells, if needed, would be very complex and costly.
There are 4 wells outside of the Captain trough.
One of remaining nine wells pose a potential risk to containment of CO2, but only if CO2 would transmit out to this well. The well is situated about 10 km to the West of the Goldeneye field and is not expected to come into contact with CO2 in its wellbore based on current injection volumes. All wells that may be contacted by CO2 either by direct contact with the reservoir or secondary leak paths are of good abandonment quality. Full details can be found in [16] with a summary in table 1 and map of wells, Figure.2
It is concluded that the abandoned E&A wells do not pose a serious risk related to CO2 leaking through abandoned well bores, based on 20 million tonnes injection.
Abandonment proposals for injection wells have also been prepared, for cases of leakage and no leakage. [17]
Hewett:
28 platform wells penetrate the Lower Bunter reservoir. 7 sidetracks were drilled from some of these existing wells to target other reservoirs. This results in a total of 35 legs drilled through the Lower Bunter, 11 of which
160
were continued into the Zechsteinkalk/ Rotliegendes.
The wells were assessed for possible conversion into CO2 injectors and it was concluded that they were unsuitable as injectors due to various integrity concerns. It was also concluded that all the wells will need to be abandoned with CO2 inert materials to ensure integrity through the field life-cycle.
The total cost for abandoning the existing 28 production (platform) wells suitable for CO2 storage is £66.1 million (£2.4 million per well). If the Lower Bunter were not to be used for CO2 storage then the cost of abandonment of these wells would be £19.8 million (£0.71 million per well) a differential of £46.3 million (£1.65 million per well).
Well abandonment studies have been conducted on the existing wells and on new wells in the post injection phase for the planned CO2 sequestration in the depleted Bunter reservoir sandstone of the Hewett gas field. Previous assessments of the existing wells showed most of the wells were not completely abandoned and do not provide a CO2 resistant seal to prevent leakage.
Abandonment requirements for CO2 integrity were determined and existing technologies reviewed to determine the most suitable for life of field integrity. This included selecting appropriate materials for plugging operations.
The study demonstrated that conventional abandonment materials are not suitable for maintaining well integrity in the post-injection phase of the project. Non-Portland cement has been recommended for abandonment plugs.
Well abandonment operation timings and cost estimations were performed which showed an estimated 17 days is required to abandon a standard existing well. For wells with access issues, additional cement plugs have been recommended; for these 3 wells, an operations time of approximately 20 days has been estimated. According to the high level cost estimate, £66.1 million is required to abandon the 28 existing wells. [18][19]
Summary
The plans for wells at the Goldeneye field are more detailed due to the completion of the study; however, both are detailed studies. The concepts are very different, due to the differences at the 2 sites. The Hewett field has been operated on for over 60 years and hence has more legacy wells to deal with and more uncertainty related to these wells. There are also no wells that can be worked over. The Goldeneye field has in contrast only been in production for a relatively short time and by a single contractor. Their philosophy is to use as much of the existing materials as possible and they have therefore decided to workover production wells and decrease their tubing size to avoid Joules-Thomson cooling. The worked over wells are intended to be able to deal with a varying amount of CO2 received, which is likely. The worked over wells all have different tubing sizes, so using a combination of them will allow for a wide range of received CO2. The Wells at the Hewett field will all have 7” tubing. During the demo phase, gaseous CO2 will be used and during the full phase a larger quantity of CO2 is expected, and no Joules-Thomson cooling effect is expected as initial heating will take place.

161
References
No. Report Name Document
No.
1 Kingsnorth FEED 7.2-design-philosophy-wells-project-data 7.2 2 Kingsnorth FEED 7.7-establish-co2-supply-properties 7.7 3 Longannet FEED ukccs-kt-s7.18-shell-002-iap - 4 Longannet FEED ukccs-kt-s7.18-shell-001-tpm - 5 Longannet FEED ukccs-kt-s7.18-shell-001-tpm - 6 Kingsnorth FEED 7.4-design-philosophy--well-start-up-testing-
and-clean-up 7.4
7 Kingsnorth FEED 7.13-temperature-effects-on-well-and-reservoir 7.13 8 Longannet FEED ukccs-kt-s7.16-shell-004-well-proposal - 9 Longannet FEED ukccs-kt-s7.16-shell-005-well-functional-spec - 10 Longannet FEED ukccs-kt-s7.16-shell-006-wts - 11 Longannet FEED ukccs-kt-s7.17-shell-002-completion-cs - 12 Kingsnorth FEED 7.3-design-philosophy-well-drilling-and-
completion 7.3
13 Kingsnorth FEED 7.8-wellbore-stability-for-new-wells - 14 Kingsnorth FEED 7.11-specify-initial-well-design 7.11 15 Kingsnorth FEED 7.12-specify-new-well-completions-criteria 7.12 16 Longannet FEED ukccs-kt-s7.16-shell-002-wac - 17 Longannet FEED ukccs-kt-s7.16-shell-cement-cs - 18 Kingsnorth FEED 7.14-existing-wells-assessment 7.14 19 Kingsnorth FEED 7.17-well-abandonment 7.17
162
CHAPTER 7: CO2 STORAGE
The Goldeneye field is well characterised, with known capacity, which is enough for the intentioned project, but not much longer.
Regarding the Hewett field, much work was carried out, but it was not completed before EON were out of the UK competition, so this will need to be completed before any project can go ahead. The estimated timescale to do this is considered to be less than 12 months.
Issue Field
Geology Goldeneye:
The field is a gas condensate field with a thin oil rim and was originally fill-to-spill. It is a combined structural and stratigraphic trap within the Lower Cretaceous Captain Sandstone Member of the South Halibut Trough, Outer Moray Firth. It is proximal to the site of other hydrocarbon fields producing from the Lower Cretaceous Captain reservoir which was deposited predominantly west-east along the Captain Fairway in a submarine base of slope turbidite environment.
Three-way structural dip closure of the reservoir exists to the east, south and west. Stratigraphic pinch-out of the reservoir sands occurs to the north. Top seal is provided by the Upper Valhall Member and Rodby Formation – both part of the Cromer Knoll Group – and the hydra Formation and Plenus Marl Bed – both part of the Chalk group
Properties of the Goldeneye reservoir, are well understood, comprised of the Captain sandstone with average porosity and permeability values of 25% and 790mD. The strong aquifer in the area extends east-west along the captain trough, the area where Captain sandstones have been deposited. Figures 1 and 2 shows location and stratigraphy. [1][2]
Hewett:
The main reservoirs of the Hewett field are the Upper and Lower Bunter sands and more recently the Zechstein carbonates. The Lower Bunter sand is the primary stratigraphic horizon that CO2 will be injected into.
The Hewett structure is a polyphase inversion which was evolved due to thin skinned tectonics where Zechstein halite facilitated decollement The general NW-SE structural trend of the Greater Hewett area (Hewett and D Fields) was originally inherited from the pre-Caledonian Hercynian orogeny. Within this trend two major regional anticlines (one in the North and the other in the South) are sitting on the Western edge and are mutually connected through a saddle.
A period of erosion led to a local development of Lower Bunter (Hewett Sandstone) in the Hewett Field area. During the early Triassic, this fine grained sedimentation was brought to a halt by further uplift and abrupt deposition of the Upper Bunter, mainly consisting of fluvial channels and sheetflood sands. In the Upper Triassic, marine conditions were re-established and the Haisborough Group was deposited in a flood plain / shallow marine environment which continued through the Upper Jurassic. Over much of the Hewett area, chalk is present at the seabed.

163
Figures 3 and 4 shows map and Stratigraphy.[3]
Figure 7.1 Map of Goldeneye field

164
Figure 7.2 Goldeneye field Stratigraphic column
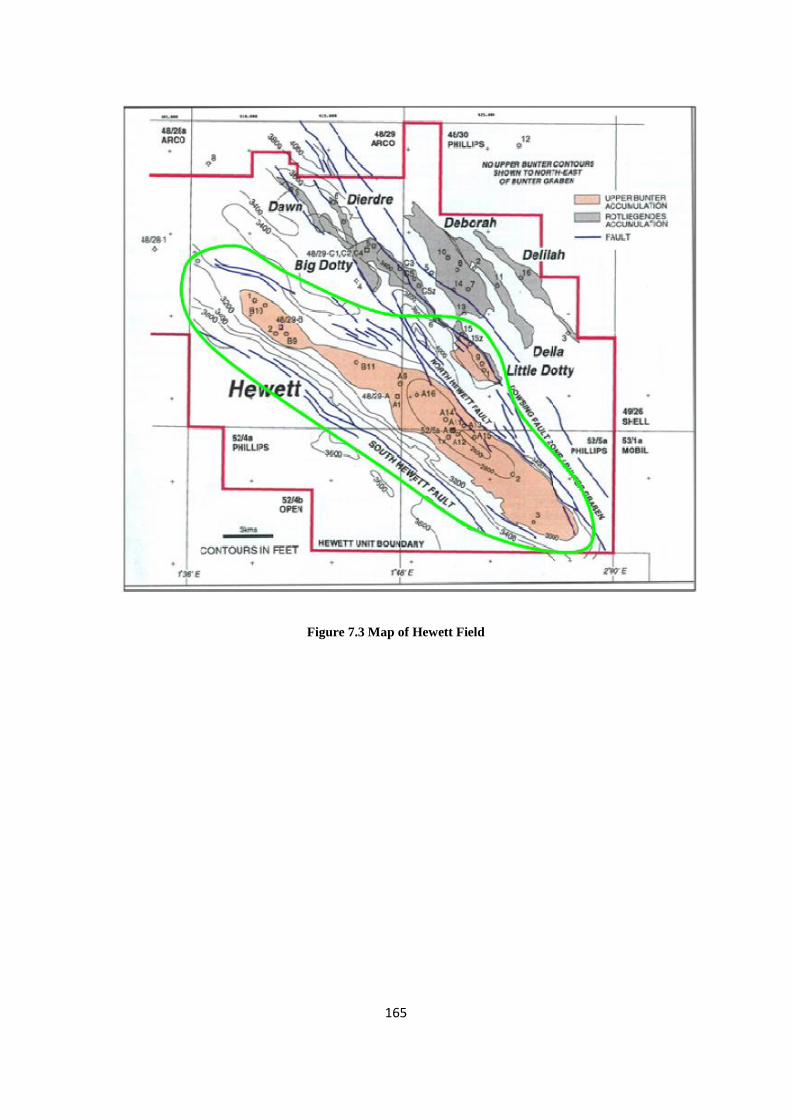
165
Figure 7.3 Map of Hewett Field
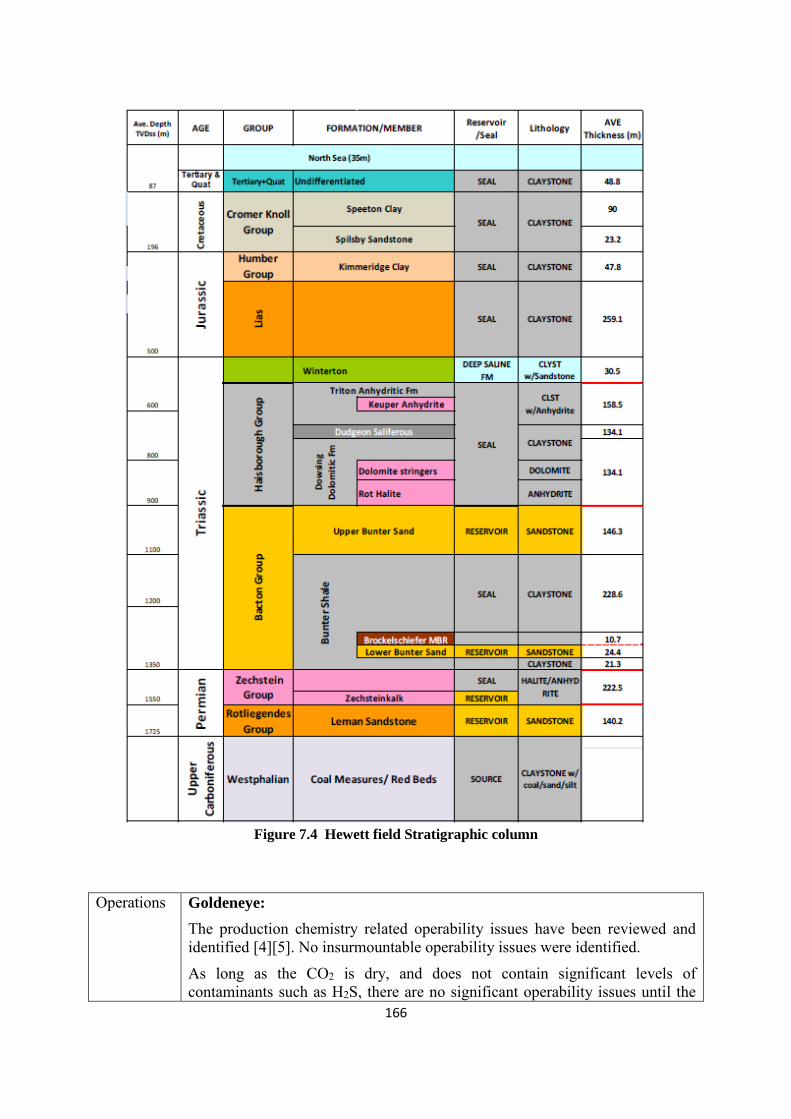
166
Figure 7.4 Hewett field Stratigraphic column
Operations Goldeneye:
The production chemistry related operability issues have been reviewed and identified [4][5]. No insurmountable operability issues were identified.
As long as the CO2 is dry, and does not contain significant levels of contaminants such as H2S, there are no significant operability issues until the
167
CO2 mixes in the injection well with the native Goldeneye reservoir fluids. There is a small potential for hydrate formation, which can be controlled by introduction of a suitable inhibitor.
Special Core Analysis (SCAL) data requirements for the Goldeneye project have been addressed through the use of legacy data and a new programme of measurements.[6]
Ranges were developed as inputs for the storage assessment for:
• gas relative permeability at initial water saturation • trapped gas saturation to brine • water relative permeability at trapped gas saturation
History matches to Goldeneye production performance were achieved within the uncertainty range developed.
The new SCAL programme comprised a combination of ambient condition measurements and reservoir condition floods with CO2 targeted at the key data uncertainties. An initial analysis of the results confirms the validity of the ranges used in the storage assessment based on the legacy data, so that there is no immediate requirement to update any of the existing reservoir models.
Some unexpected differences in flood front dynamics and lowered trapped gas saturations were observed with CO2. This additional work would not change the overall conclusions of the storage assessment for the injection of 20 Mt CO2.
The use of mass balance and in situ saturation techniques proved to be essential in the subsequent interpretation of the results.
Hewett:
This analysis was not completed due to gaps in data (see gaps section)
Modelling Goldeneye:
The Goldeneye field has been successfully managed for nearly six years; however, some uncertainties about its characteristics remain. The focus has previously been on predicting and managing hydrocarbon production performance. It was decided to focus on the following uncertainties:
• Location of northerly stratigraphic pinch-out (which has an impact of between -13% and +6% on Gross Rock Volume)
• The presence or absence of sealing faults (which impacts fluid connectivity)
• Top structure uncertainties (which has a small impact of +/-0.5% on Gross Rock Volume but may also affect spill point and structural dip )
• Distribution of reservoir units (which has an impact of between -3.5% and +5.5% on In-Place volume and also, potentially, has an impact on the dynamic behaviour of the reservoir).
The petrophysical model used porosity and permeability data from well logs and fluid levels (oil, gas and water) from openhole pressure data.

168
Three reservoir models have been built to simulate Goldeneye Captain reservoir performance and model CO2 behaviour.
The existing Asset static reservoir model was used as the basis of the structural and facies model. Also reused was the input data to these models – comprising well deviation data, log data, petrophysical interpretation, core-based geological facies interpretation, seismic depth surfaces and faults – again after a suitable audit trail had been established.
modifications were prioritised:
• The static reservoir models had to be made larger than the existing Asset static reservoir model to accommodate CO2 movements down and away from injectors under differential pressure as free CO2, and gravitational movement of formation water made denser by CO2 dissolution. This required re-building the Asset static reservoir model with a different grid boundary definition.
• The method for determining the robustness of any static reservoir model for future CO2 injection prediction was to assess how well it ‘predicted’ known production. Hence, it was necessary to reproduce the modifications required in the static model to correctly match the timing of water breakthrough in the static model domain.
• A variety of different zoning schemes (division of the Captain Sandstone Member into ‘A’, ‘C’, ‘D’ and ‘E’ Units) have been used to investigate uncertainty around the distribution of gas volumes in the reservoir. In addition, attention was paid to the distribution of porosity and permeability in the underburden.
• Some modification of the reservoir layering modelling was thought necessary to better model thin, buoyant CO2 plumes.
The key static modelling uncertainties for the CO2 injection into the Goldeneye field are related to the capacity of the field (volumes that can be injected) and containment. The static reservoir models have been constructed to address these issues, in particular:
• different volume scenarios; • unstable displacement effects (requiring finer/alternative layering); • increased sensitivity to heterogeneities due to fluid contrast (CO2 vs.
water); • focus on structural dip and spill location relative to injection wells for
injection strategy planning; • under-burden & over-burden focus to investigate possible CO2
migration pathways. • alternative Captain D interpretation;
The aim of the dynamic modelling was to show sufficient capacity in the system; predict reservoir pressures for injection well design and geomechanical risk assessment; assessing the impact of CO2 injection on other users of the subsurface and their impact on Goldeneye and other subsurface uses; and determining the effect of injection well selection on plume development within

169
the CO2 store and on the risk of lateral migration.
A multiple scale modelling approach was adopted. This facilitated the assessment of the interaction of the complex static and dynamic factors which may coincide during CO2 injection into the Goldeneye reservoir. Results from a three-dimensional, three-phase full field Goldeneye numerical simulation model, corroborated initial storage capacity estimations. Different injection scenarios were evaluated to map out the range of capacity available for CO2 storage.
The effects of geochemical reactivity were tested in the models – by running coupled fluid flow and chemical reactive transport simulations. The results from the dynamic models were input into geomechanical models.
[7][8][9][10]
Hewett:
A 3D static model was built in Petrel 2010.1 to assess the suitability of the Hewett field as a potential CO2 store. The Lower and Upper Bunter sands are the two main reservoirs in the Hewett field, with significant gas volumes.
Included are the petrophysical and structural modelling and the methodology associated with each.
A petrophysical interpretation of the 6 Hewett exploration wells was made using a full suite of logs. Water saturation remains an issue as data quality and availability are insufficient to be able to properly interpret this.
Seismic interpretation of the horizons and faults over the Hewett & D-Fields (Della, Deborah, Delilah, Big Dotty, Little Dotty and Dawn - 6 smaller gas fields to the NW of Hewett) areas was made as input to the static modelling. Five surfaces were interpreted including the Upper and Lower Bunter. A total of 97 faults were picked, 17 of which were used for the modelling purposes. A rigorous review of the time-depth conversion methods was carried out and a polynomial application was found to be the most suitable here. A number of attribute analyses were also made to aid with the interpretation, including similarity and maximum curvature.
A detailed model has been constructed for the Upper and Lower Bunter reservoirs which has attempted to spatially link the porosity and permeability model based on observations from the core data and logs. As a result of some uncertainty in the seismic interpretation two static models were built to encompass the potential juxtaposition across the boundary fault between the Hewett and Little Dotty fields (Hewett – Little Dotty Fault), both of which were exported for dynamic simulation.
The key uncertainties in this capacity review include the seismic interpretation across the Little Dotty field, resulting in uncertainty in the juxtaposition across the Hewett-Little Dotty boundary fault. This has significant impact on the behaviour of fluids in the dynamic modelling. Additional to this are the uncertainties associated with the property modelling, mainly the saturation modelling for which a function cannot be created with the existing data.
The static models described in the report has been exported to the dynamic

170
simulation model (using GEM), which will be used to model the movement of the CO2 plume in the dynamic environment and assess the uncertainties associated with it.
Comparison tests also carried out to test the thermal component, results in GEM and STARS v similar
MultiFLASH to model the CO2 properties as this allows the use of a high accuracy CO2 equation of state (Span Wagner) to model the CO2 and provides consistency with modelling carried out by other parties
OLGA was used to develop the well injection models. This allows continuity with the whole system as well as the ability to model transient behaviour at shut-in and start up.
Reservoir static modelling was carried out in Petrel and dynamic modelling in GEM using the thermal option.
The recommendations for further work are:
The permeability grids in the Upper Bunter reservoir should be modelled in greater detail as only two wells were used to guide the HFU modelling in this interval and permeability has a significant impact on the Upper Bunter reservoir performance.
The Little Dotty area should be modelled in greater detail for future studies to improve the understanding of the reservoir structural and fault modelling around the Hewett-Little Dotty fault.
Pressure measurements should be taken periodically in the Upper Bunter reservoir prior to abandoning the existing wells to gain a better understanding of aquifer performance in this reservoir.
The 52/5a platform well status should be reviewed to evaluate if there is potential to acquire logs that could estimate the current GWC in the Upper Bunter.
SCAL measurements be performed on available core data to:
Understand the natural gas relative permeability relationships
Obtain gaseous and liquid CO2/water relative permeability curves
Obtain liquid CO2/gaseous CO2 relative permeability curves
Ascertain whether the relative permeability is pressure or temperature dependant
Take mercury capillary pressure measurements for all cap rocks
Obtain geo-mechanical rock properties
A single platform has been considered for the CO2 injection wells in the SE area of the Hewett Lower Bunter reservoir. This location was selected as it represented the most likely area in the Hewett Upper Bunter reservoir where natural gas may not have been swept by aquifer influx. Although Upper Bunter CO2 injection was not modelled as part of this study the requirement existed to account for the potential for Upper Bunter CO2

171
injection in the future. It is recommended that alternative locations are investigated for the platform for the CO2 injection wells to evaluate the impact on reservoir performance.
The Full Field Model should be run to the initial reservoir pressure of 137.9 bar(a) (2000psia). This is required in order to confirm the results of the near wellbore model and to determine the corresponding bottomhole pressure at which injection should cease
Given the uncertainties in CO2 capillary pressure, further laboratory analysis and evaluation is recommended as well as further sensitivities on the impact of capillary pressure on the limits to the maximum reservoir pressure and hence the maximum storage capacity
Monitoring of bottomhole pressure during injection is a requirement and provisions for this are to be included in the final monitoring programme.
Additional analysis on the overall injection schedule should be carried out in order to assess when the Lower Bunter will reach maximum capacity. These should include, but not limited to: sensitivity to load changes and timings and sensitivity to increased rate and timings based on additional CO2 from third parties
[11]
Monitoring Goldeneye:
The Goldeneye measurement, monitoring and verification (MMV) plan has been developed to address the following:
• The need for a comparison between the actual and modelled behaviour of CO2 and formation fluids (water and oil) in the storage site;
• Detecting significant irregularities; • Detecting migration of CO2 • Detecting leakage of CO2 • Detecting significant adverse effects for the surrounding environment; • Assessing the effectiveness of any corrective measures taken. • Updating the assessment of the safety and integrity of the storage
complex in the short and long-term, including the assessment of whether the stored CO2 will be completely and permanently contained.”
The CO2 sequestration in storage site and storage complex as secondary containment is addressed from two angles: by showing conformance of monitoring results with 3D dynamic earth models; and by monitoring for indications of loss of containment or significant irregularities. The containment monitoring programme is based on two key tenets:
1. Monitoring is focussed on areas and features highlighted by the risk assessment as being of higher risk of potential leakage.
2. Monitoring is built on a staircase of increasing focus and costs; its starts by aiming to detect a potential irregularity then, if an irregularity is suspected, the programme focuses on delineation and confirmation that the suspect is an irregularity (contingency monitoring). The final
172
step – performed in conjunction with the corrective measures plan – is to quantify or define the magnitude of any leak.
MMV is divided into phases: pre-injection or baseline; during injection and post-injection/ closure. The baseline is key to ensuring that the project has a well defined starting point from which to measure any changes. This activity lays down both an environmental and a subsurface baseline. During injection a base plan is executed, informed by the risk assessment and aimed at detecting any irregularities. After injection has ceased another base line is taken to compare the before and after state of the system. This is complemented by additional monitoring over the subsequent years, again informed by the risk assessment.
The risk assessment and the monitoring plans are dynamic. They are updated as new information from conformance and containment monitoring is received.
After screening and modelling exercises the following main monitoring techniques were selected:
• Environmental baseline monitoring using multi-beam echo sounding, seabed sampling and continuous injection tracer
• Well integrity monitoring using pressure and temperature gauges; distributed temperature sensors, tubing integrity logging and seabed CO2 detection below the platform.
• CO2 injection conformance using pressure, saturation and flow monitoring
• Lateral and vertical irregularity and plume conformance using time lapse seismic
The timing and frequency of monitoring is informed by the risk assessment and varies from technique to technique. Until detailed design and tendering exercises have been performed the costs retain a moderate level of uncertainty.
The Well and Reservoir Management (WRM) plan in Goldeneye is an integral part of the MMV plan (Monitoring, Measurement and Verification). The objective of the WRM team during the CCS project is optimisation of the injection phase. The WRM plan details the strategy for optimising long term injection and storage of CO2 whilst safeguarding the facilities and wells. Since reservoir behaviour is complex in a CO2 injection project, WRM focuses on continuous performance monitoring, identifying issues/problems and acting upon these variances.
The frequency of monitoring and verification will change over time because the risk profile of the storage complex changes over time. An annual WRM plan is issued to ensure the reservoir is adequately monitored.
WRM seeks to optimise injection and to improve the understanding of the reservoir. Data is collected to enable decisions to be taken either on activities on the existing well stock or on any requirement. [12][13]
Hewett:
The main elements of a monitoring programme are:

173
Operational Plume Pathway Environmental (Leakage)
Essential Monitoring Requirements
Essential monitoring requirements define the minimum technologies to be installed permanently or run on an ad-hoc manner. These include:
1. Wellhead (all wells):
Full continuous monitoring of temperature, pressure, flowrate per well and total, annulus pressures (A and B), and either annulus bleed/top-up density and volume or alternatively a downhole annulus gauge.
2. Downhole (all wells):
Pressure, temperature
3. Environmental:
CO2 sampling on seabed, riser, and platform. Both during operations and after abandonment
4. Seismic:
4D baseline survey, and further 4D on time schedule (e.g. 5 years). In-well micro-seismic “listening sessions” (closed-in injection) are suggested on a rotational basis covering all geophone-fitted wells; optionally together with VSP.
5. Wireline logging:
Campaign-based wireline logging including minimum Pulsed-Neutron and Cement Bond Log from Surface to total well depth, and other logs as required, covering all wells on a rotational basis.
Recommended Monitoring Requirements
Recommended monitoring defines methods and technologies which reduce the risk associated with unplanned migration of CO2 by helping to localise the migration and develop a more effective remediation plan.
Selected wells only:
Distributed Temperature Sensor (DTS): selected wells for model calibration purposes; investigate possibly all wells for migration detection.
Casing Strain detection for a few wells to evaluate unusual cement response behaviour
Micro-seismic/in-well geophones for wells near old abandoned/exploration (high risk) wells, and possibly near bounding fault with highest re-activation risk.
Consider time-lapse CSEM survey Further consideration should also be given to the implementation of

174
observation wells. Dedicated monitoring methods can be applied to these wells (i.e. aquifer monitoring, density monitoring, aquifer sampling) which can be constructed without the constraint of the CO2 injection. Taking into account the inevitable contact of the CO2 with the deep aquifers, and the crucial importance in the long-term of understanding this aquifer behaviour for understanding the permanence or otherwise of the storage, this should be given strong consideration.
Following this initial screening exercise the following further work is recommended:
Investigate measurement techniques available to (install and maintain) in abandoned wells post injection.
Investigate post-abandonment well-access and protection
Investigate applicability or DTS for leak detection
Investigate and plan remediation scenarios
Verify further operating scenarios following same methodology
Investigate long-term reliability of downhole monitoring equipment
Investigate and model seismic resolution for this specific application [14]
Risk Assessment and Mitigation Plan
Goldeneye:
Key grounding principles:
The key factors in the development of the corrective measures plan are the boundary conditions and definitions as described in the EU directive.
The order of priorities of the plan is ranked as follows. The corrective measures plan acts to:
1. Prevent risks to human health
2. Prevent risks to the environment
3. Prevent leakage from the storage complex
The plan is site specific and risk based and covers the storage complex. The release of CO2 at the surface, be it from a wellhead or surface pipe work, is covered by standard operating practices and the facilities HAZID and HAZOP.
A site specific containment risk assessment has been performed using the bow-tie risk assessment methodology. The Goldeneye bow-tie selected a leak from the storage complex as the top-level event - in line with the principles outlined above. The risk assessment details the potential subsurface migration paths that CO2 can take. (Figure 5). The first two are potential precursors to the other three. Only with escalation and the failure or bypassing of the primary AND secondary seal and the failure of the multiple buffers and secondary stores to disperse or absorb CO2, will there be a migration of CO2 into the biosphere.
Systematic approach:

175
Monitoring base plan
detect potential irregularity Monitoring contingency plan
Investigate further (delineate) Confirm the nature of the suspected irregularity
Risk Assess
Assess the risk posed by the irregularity Threat to people, environment? Could it become a significant irregularity
Act
Discuss potential actions with the regulator Agree course of action with the regulator
Actions depend strongly on the risk assessment. Potential actions depend on the assessment of the potential consequences.
Examples from Figure 5 are:
1. CO2 leaves tubing and is contained by the production casing
Leak is outside the subsurface complex, but still within the storage site. However, it has potential to impact on humans and the environment if the final engineered barriers were to fail. Relatively common in some oil fields - design of multiple independent engineered containment barriers - well practiced oil field techniques rapidly employed to fix the leak.
2. CO2 migrates laterally within Captain Fairway. Still contained under primary seal (caprock).
CO2 still contained; risk to humans and environment nil. CO2 moved out of the licensed store and defined complex. Additional risk exposure exists as CO2 is migrating in with potential additional risk – decommissioned E&A wells.
Initial response - risk assess size, nature and magnitude of migration, increase monitoring and model current and potential migration. Risk assessment establishes the risk of further escalation. Corrective measures such as changing the injection pattern and planning a relief well would be assessed.
3. CO2 crosses the caprock, dissipates in chalk, pools under complex seal and migrates up dip.
Immediate risk to people and environment is nil as the CO2 contained within by the secondary seal. Contingency monitoring and risk assessment would identify potential causes of migration. If it were injection well related then a fix might be appropriate. If the leak is geological in origin then the action would most likely be intensify monitoring and apply to licence additional storage volume.
4. CO2 crosses the cap rock and complex seal. Dissipates in shallow formations as it migrates towards seabed.
This is an escalation from 3 but there is still low risk to people and
176
environment as CO2 not yet migrated to the biosphere. There is however now a significant irregularity as both the primary and secondary seals have been bypassed. Focussed contingency monitoring would inform a risk assessment as to if the CO2 would reach the seabed. Additionally, the monitoring plan dictates quantitative monitoring of the seabed to determine if a CO2 flux is present.
The response will depend on the nature and severity of impacts or potential impacts as determined by the risk assessment. It will also depend on the source of the leak:
• If it is a point source (wells) then leak could potentially be repaired. CO2 already migrating through shallow sediments cannot be halted.
• If source is entirely geological in nature - for example a fault zone - the application of potential corrective measures is reduced. Depending on the nature and scale of migration, the most likely corrective measure is to reduce the leak rate where possible by adjusting the injection pattern.
5. CO2 flows up to near seabed / at seabed.
This is an escalation from 4 and is the HSE critical risk. CO2 could enter the environment (biosphere) and potentially impact flora and fauna. If the release is large enough it could increase the concentration of CO2 at sea level enough to be a risk to humans.
Once the monitoring efforts have identified the source of the leak, quantification would take place. An effects assessment has been performed as part of the environmental statement, which would allow estimation of the potential impact when the location and severity of the migration are known.
In the most likely scenario of a well providing at least part of the flow path through either the primary or secondary seal, it is likely that the agreed corrective measure would be to repair or plug the leak path at the primary seal or secondary complex seal.
The risks assessment concludes that it is highly unlikely that CO2 would migrate to the surface in significant quantities independent of any wellbores:
• Faults are not critically stressed - i.e. are unlikely to be open.
• No detected faults rise to the seabed.
• Fluid flow up a fault / fracture will be capillary dominated - therefore the underbalance in the reservoir means that flow cannot occur until the system re-pressurises.
In this unlikely event that migration to the seabed occurs independent of any wellbore, using current technology, the application of potential corrective measures is reduced. It is theoretically possible to remove the reservoir of CO2 behind the leak, for example by building a platform, drilling wells, and pumping the CO2 out again - and disposing of it into another as yet undeveloped store or the atmosphere. The challenge would then be to weigh up the impact of the corrective measure against the impact of the leak. This would be done in conjunction with the regulator. Alternatively, leak rates may be

177
reduced by adjusting the injection pattern or reducing / curtailing injection.
The corrective measures plan is not a static document. During the review process and detailed engineering phase, the plan will be challenged and amended where necessary. There are several areas envisaged where the plan will need updating to account for changes in the CCS design:
• The completion design affects the integrity envelope and the intervention choices. For example:
o the position of the production packer (especially with respect to the primary seal),
o the seal (or lack of) of the upper completion into the lower completion,
o the ability to run bridge plugs through the upper completion into the lower completion,
o the use and position of the monitoring equipment such as DTS.
• The completion and annular fluids ('A' and 'B' annulus) affect the ability to monitor and respond to an influx. For example, maintaining pressure on the 'A' annulus with a nitrogen cap also makes detecting a leak in the casing or tubing potentially easier. If the 'B' annulus fluid is displaced to oil, it reduces the impact of CO2 (corrosion) migrating into this annulus
• The MMV plan may change as new technology is developed such as DAS (distributed acoustic sensors) and cased hole logging (segmented neutron logs and ultrasonic image tools). Changes to the MMV plan should be reflected in appropriate changes to the corrective measures plan.
Once CCS is implemented, the plan will also be periodically reviewed and updated, taking account any chances to the status of wells or information gathered during the injection and monitoring processes.
Full details of corrective measures plan in [15]
Hewett:
Throughout the Kingsnorth Carbon Capture and Storage project the wells and subsurface team met regularly to assess, and update risks as well as to discuss risk mitigation.
They have also carried out a HAZID, but only the first stage of an intended 6 stage process has been completed. The HAZID workshop successfully achieved the aim of reviewing potential major incidents associated with the wells and reservoir. Various reports produced by Baker RDS have successfully addressed these potentials, and/or identified further work which will be required at later stages in the design process. Output from the HAZID has been included in the Design Risk Register for the project, to ensure that these items will be covered at later stages. All these items will be addressed during further hazard and risk assessment workshops during the course of the project.
178
A risk register was maintained. Risk assessment is a continuous process.
Risks categorised as:
Christmas tree
wells abandoned
new wells
reservoir
overall storage [16]
For each category there is a cause, effect, current status and further actions, 1 example from Christmas tree category:
Cause - Metallurgy or mechanical failure due to defects in trees
Effect - CO2 leakage around trees leading to high values of CO2 in well bays, leading to potential asphyxiation risk
Current Status - Action: Design valves such that they are resistant to CO2 (metallurgy & mechanical failure). This risk is managed through design and procedures.
Further Actions - Engage with Christmas tree vendors to discuss requirements Continue review of design and procedures.
The report concludes:
The risk assessment process successfully achieved the aim of reviewing potential project risks associated with the wells and reservoir. Various reports produced by Baker RDS have successfully addressed these potentials, and/or identified further work which will be required at later stages in the design process.

179
Figure 7.5 CO2 migration and leakage scenarios for Goldeneye

180
Figure 7.6 Risk assessment for Goldeneye, colour co-ordinated to show acceptable levels of risk
Gaps in data
Goldeneye:
All necessary information was provided for the FEED.
Hewett:
The majority of the data was purchased from the current field operator ENI. In addition all relevant or related data in the public domain was downloaded from the Common Data Access (CDA). The seismic data survey (PJ942) was purchased from Petroleum Geo-Services (PGS) and the exploration well log data was purchased from Information Handling Systems (IHS energy).
This has been organised into 10 main categories:
Seismic Data Deviation Data Log Data Core Data Fluid Data Production Data Pressure and Temperature Data Well Reports and Documents Field Reports and Documents D-Field Data
Overall, the majority of data required for the evaluation and conceptual design for CO2 storage in the Hewett Field has been acquired and has provided vital information for the analysis, evaluation and completion of the deliverables required for the Well and Subsurface Storage project work.
Well and log data are of variable quality, in part due to the vintage of the data

181
(1960s and 70s).
Data which was not available for this work or would be needed in more detail includes, production data, exploration and appraisal well data, SCAL Data, RCA data, geomechanical core tests, well log data (full log suites are currently only available for the 6 Hewett exploration wells) and improved resolution of seismic data to aid in understanding fault juxtaposition and communication between Hewett and Little Dotty. Full details on further data needed is in the report [17]
Summary
Data availability in the analyses for the Hewett field was an issue, with some remaining gaps in data. Both are depleted gas fields, but vary greatly. The Hewett field has a very large potential capacity of approximately 200Mt, whereas the Goldeneye field has a maximum of 47Mt, though a conservative estimate is 30Mt (enough for the demonstration). Both fields are currently depressurised; the Hewett field to a much greater extent of 2.69 bar and the Goldeneye field to 138 bar in 2010. The Goldeneye field is however, hydraulically connected to the underlying Captain aquifer and will eventually re pressurise back to the original hydrostatic pressure, giving a limited time to start injection. Even with limited data, the majority of the modelling work was completed for the Hewett field and key decisions made on which packages would best suit. The risk assessment has not been finished though the initial HAZID was completed. The Goldeneye field has a risk based and site specific mitigation plan. The risk assessment and the monitoring plans are dynamic. They are updated as new information from conformance and containment monitoring is received. The mitigation plans are also not static and is planned to be updated when there is further information or developments in monitoring technologies. An environmental impact assessment is not included in the FEED. The mitigation plan follows options available for different levels of CO2 leakage and includes additional monitoring when required to gain more information.
References
No. Report Name Document
No.
1 Longannet FEED ukccs-kt-s7.19-shell-006-Seismic Interpretation Report
-
2 Longannet FEED ukccs-kt-s7.23-shell-004-Storage Development Plan - 3 Kingsnorth FEED 7.21-reservoir-caprock-characterisation 7.21 4 Longannet FEED ukccs-kt-s7.19-shell-003-Geoechemical reactivity
Report -
5 Longannet FEED ukccs-kt-s7.19-shell-005-production Chemistry Report
-
6 Longannet FEED ukccs-kt-s7.19-shell-002-scal-report - 7 Longannet FEED ukccs-kt-s7.19-shell-007-Petrophysical modelling
Report -
8 Longannet FEED ukccs-kt-s7.21-shell-002-Static Model Field Report - 9 Longannet FEED ukccs-kt-s7.22-shell-001-static-model-aquifer - 10 Longannet FEED ukccs-kt-s7.22-shell-002-static-model-overburden - 11 Kingsnorth FEED 7.20-validation-assessment-of-reservoir 7.20

182
12 Longannet FEED ukccs-kt-s7.20-shell-002-mmv-plan - 13 Longannet FEED ukccs-kt-s7.20-shell-003-Monitoring Technologies
Feasibility Report -
14 Kingsnorth FEED 7.28-design-monitoring-programme-for-well-and-storage-assurance
7.28
15 Longannet FEED ukccs-kt-s7.20-shell-001-Corrective Measures Plan - 16 Kingsnorth FEED 7.27-risk-assessment-and-mitigation 7.27 17 Kingsnorth FEED 7.19-data-management-and-underpinning-
subsurface-data 7.19

183
CHAPTER 8: CCS PROJECT COST
8.1 Longannet Power Station to Goldeneye Reservoir CCS Demo Project
This section of the report contains the cost estimate for the End-to-End CCS Chain for the purposes of providing potential developers of CCS projects with refined cost information [1]. One of the key objectives of the FEED phase of the UKCCS Demonstration Competition was to increase the cost certainty for the overall project.
During the Outline Solution development, costs were estimated to an accuracy of -30% to +50%. Through the design and project development across the various Consortium work streams (as outlined in the previous sections of this report), it has been possible to refine this accuracy and increase the cost certainty of the core capital costs to approximately -12% / +15% accuracy.
Costing Methodology
The ScottishPower Consortium Partners have well established and robust cost estimating methodologies. These methodologies are individual to each organisation and must be followed in order to comply with their internal governance procedures. As such, it is inevitable that the total cost of the CCS project is made up of three underling cost estimates.
The Consortium has adopted the following key principles in compiling the cost estimate:
A coherent end-to-end cost submission Value for money test to ensure best value A transparent and fully auditable approach
Figure 8.1 Main components of the cost estimate [1].

184
Capital Costs
The core cost estimates from the FEED scope are the majority, but not the entirety, of the full capital cost picture. Figure 8.1, illustrates the main components of the estimate. The main components of the cost estimate are:
Core Costs
Those directly identifiable elements of cost which make up the majority of the capital costs, and comprise equipment, civil works, pipework, electrical, etc. These costs are based on a combination of external quotes, external estimates (which may be factored to the required volumes), and internal estimates. These are based on the technical specifications developed through the FEED programme of work.
Scope Development
An estimate, based on the technical drawings and drafters expertise, of the additional requirements which are likely when moving from FEED to the implementation phase of the project. This typically accounts for the additional ‘nuts and bolts’ which are not specifically drawn and identified at the FEED stage, but are known omissions at the time of drafting.
Contingency & Risk
An additional amount to cover the expected value of risks facing the project, calculated using the Consortium Partners internal risk pricing approach and is based on a P50 (ie midpoint) probability estimate. The calculation of the contingency amount depends critically on the contracting approach adopted, and the final risk/reward allocation of the project, and as such is indicative at this stage of the commercial negotiations.
Fees
The developer fees associated with managing the project. As per the contingency calculations, these numbers are indicative, pending further commercial discussions.
Breakdown of Capital costs
The capital cost estimates are produced in discrete segments which cover the following elements of the CCS chain. When combined, they cover the full End-to-End CCS chain:
ScottishPower (with Aker Clean Carbon as a key contractor):
SPS – Steam & Power Supply CCP – Carbon Capture Plant Comp – Compression BoP – Balance of Plant and Utilities Site/Other – additional items required at Longannet Power Station over and above the
Aker cost estimate OE/Mgt. – Owners Engineer (Technical Assurance) / Project Delivery
National Grid:
New Pipeline – New link-line from Longannet Power Station to Dunipace No. 10 Feeder – Existing pipeline from Dunipace to St. Fergus Terminal Compressor Station – Works at Blackhill Compressor Station in the vicinity of St. Fergus
Terminal
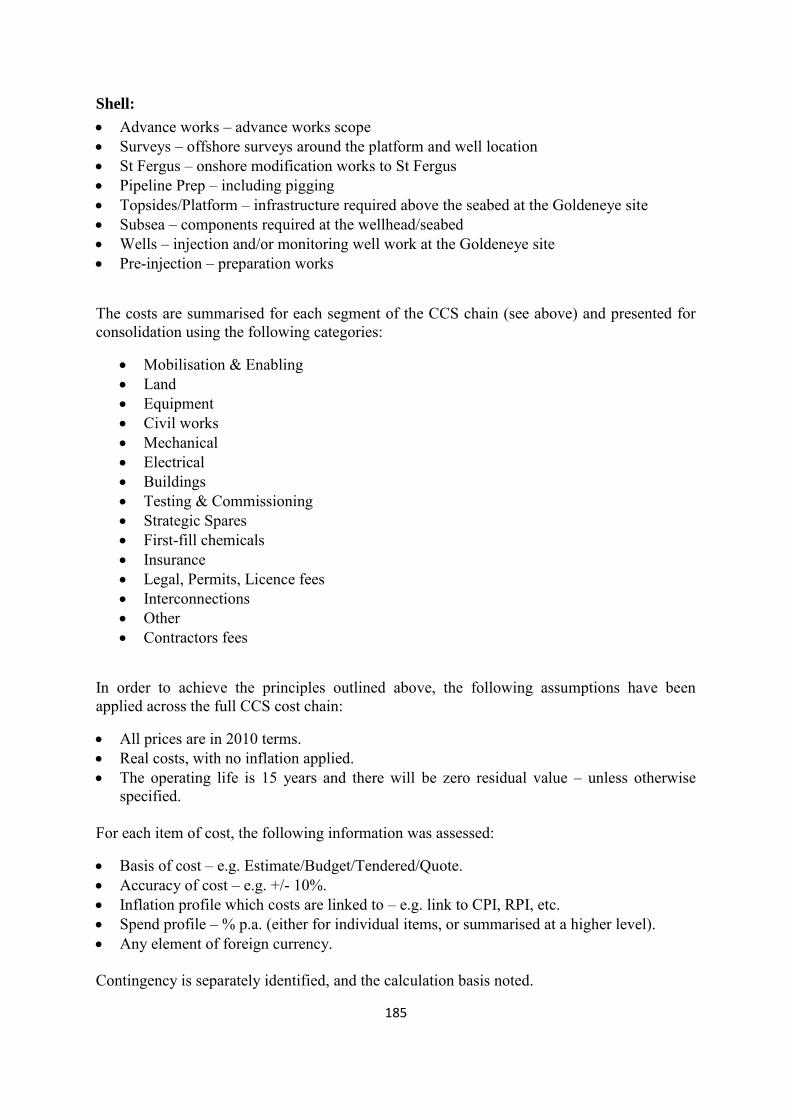
185
Shell:
Advance works – advance works scope Surveys – offshore surveys around the platform and well location St Fergus – onshore modification works to St Fergus Pipeline Prep – including pigging Topsides/Platform – infrastructure required above the seabed at the Goldeneye site Subsea – components required at the wellhead/seabed Wells – injection and/or monitoring well work at the Goldeneye site Pre-injection – preparation works
The costs are summarised for each segment of the CCS chain (see above) and presented for consolidation using the following categories:
Mobilisation & Enabling Land Equipment Civil works Mechanical Electrical Buildings Testing & Commissioning Strategic Spares First-fill chemicals Insurance Legal, Permits, Licence fees Interconnections Other Contractors fees
In order to achieve the principles outlined above, the following assumptions have been applied across the full CCS cost chain:
All prices are in 2010 terms. Real costs, with no inflation applied. The operating life is 15 years and there will be zero residual value – unless otherwise
specified.
For each item of cost, the following information was assessed:
Basis of cost – e.g. Estimate/Budget/Tendered/Quote. Accuracy of cost – e.g. +/- 10%. Inflation profile which costs are linked to – e.g. link to CPI, RPI, etc. Spend profile – % p.a. (either for individual items, or summarised at a higher level). Any element of foreign currency.
Contingency is separately identified, and the calculation basis noted.

186
Operating Costs
Operating costs have been estimated using the internal cost estimating process for each of the Consortium Partners. The key principle is to separate the underlying unit cost and volume drivers, in order that the Pricing Model can reflect estimated operating costs based on changes in those underlying volume drivers.
The costs have been summarised for each segment of the CCS chain and presented for consolidation using the following categories:
Fuel / Power / Energy Amine Consumables Maintenance Waste disposal Staff Leasing Rates Insurance Overheads Other
Decommissioning Costs
On the basis that the project has a defined operating period of 10-15 years, a provision has been calculated for decommissioning costs for each element of the End-to-End CCS chain where applicable.
Post-injection monitoring and well closure costs
These additional costs have currently been excluded from the operating cash-flows of the project, due to the uncertainty on the final treatment and liability for those costs. However, it should be noted that they will be an integral part of the full project cash-flow.
Outline Solution Project Cost Estimates
The capital, abandonment and operating costs are summarised in Table 8.1, 8.2 and 8.3 respectively. The cost schedule prepared for the entire project at the Outline Solution stage of development is given in reference [3].

187
Table 8.1 Summary of Estimated Project Capital Costs at the Outline Solution stage [2].
Notes: * Indicative subject to final agreement of the risk/reward balance and procurement segment.
Table 8.2 Summary of Estimated Project Abandonment Costs at pre-FEED stage [2].
Chain segmentTotal
Capex (£m)
Cost estimate
range (±%)
Cost estimate
range (£m)
Steam and Power Supply 153.6 -30% to +50% -Carbon Capture process 241.8 -30% to +50% -Compression & Conditioning 43.5 -30% to +50% -Balance of Plant and Utilities 54.0 -30% to +50% -Owner's Engineer (Technical Assurance) 58.7 -30% to +50% -Knowledge Share 8.2 -30% to +50% -Link-line between Longannet and Dunipace 43.6 -30% to +50% -No. 10 Feeder (Existing pipe) 54.7 -30% to +50% -Compression and facilities at St. Fergus (Blackhill) 100.5 -30% to +50% -Offshore pipe 114.4 -30% to +50% -Infrastructure at the Goldeneye field 32.4 -30% to +50% -Well at the Goldeneye field 171.9 -30% to +50% -Total 1,077.2 -30% to +50% 754 to 1,616
Risk & Contingency 102.8 n/a 103*
Total Project Capex 1,180.1 - 857 to 1,719
Chain segment Total ABEX(£m)
Steam and Power Supply 47.5Carbon Capture process 70.2Compression & Conditioning 12.8Balance of Plant and Utilities 14.7Owner's Engineer (Technical Assurance) -Knowledge Share -Link-line between Longannet and Dunipace 10.8No. 10 Feeder (Existing pipe) 8.0Compression and facilities at St. Fergus (Blackhill) 10.4Offshore pipe -Infrastructure at the Goldeneye field 9.3Well at the Goldeneye field 16.9Chain segment Total ABEX (£m)
Total 200.6

188
Table 8.3 Summary of Estimated Project Operating Costs at pre-FEED stage [2].
Chain segment
Annual
Fixed
OPEX
(£m)
Annual Variable OPEX
(£m)
Steam and Power Supply 2.4 62.2 Carbon Capture process 5.0 8.7 Compression & Conditioning 4.2 0.1 Balance of Plant and Utilities 16.5 0.0 Owner's Engineer (Technical Assurance) 3.0 0.0 Knowledge Share 2.9 0.0 Link-line between Longannet and Dunipace 0.0 0.0 No. 10 Feeder (Existing pipe) 0.0 0.0 Compression and facilities at St. Fergus (Blackhill) 1.2 10.5 Offshore pipe 15.5 0.0 Infrastructure at the Goldeneye field 0.0 0.0 Well at the Goldeneye field 0.3 0.0 Total 51.0 81.4
Post-FEED project Cost Estimate
FEED Cost Estimate
The capital, abandonment and operating costs are summarised in Table 8.4, Table 8.5 and Table 8.6 respectively. The cost estimate prepared for the entire project at the post-FEED stage is given in reference [3].

189
Table 8.4 Summary of estimated project capital costs post FEED stage [2].
Chain segment
Total
Capex
(£m)
Cost estimate
range (±%)
Cost
estimate
range (£m)
Steam and Power Supply 114.8 -20% to +20% - Carbon Capture process 228.1 -10% to +10% - Compression & Conditioning 47.2 -10% to +10% - Balance of Plant and Utilities 119.7 -10% to +10% - Site -other1 146.7 -10% to +10% - Link-line between Longannet and Dunipace 81.3 -10% to +15% - No. 10 Feeder (Existing pipe) 78.9 -10% to +15% - Compression and facilities at St. Fergus (Blackhill) 121.0 -10% to +15% - Feed Extension 12.5 -25% to +30% - Surveys/Licenses 22.1 -25% to +30% - St Fergus 14.9 -15% to +25% - Pipeline preparation 4.6 -25% to +30% - Topsides / Platform 91.3 -15% to +30% - Subsea 8.9 -15% to +30% - Wells 37.5 -15% to +25% - Pre-injection 16.0 -15% to +25% -
Total
1,145.5
-12.3% to +
15.6%
1,005 to
1,324
Risk & Contingency2
194.8 n/a 195
Total Project Capex
1,340.3 -
1,200 to
1,519
Notes: 1. Includes technical assurance, management and knowledge transfer; 2. Indicative subject to final agreement of the risk/reward balance and procurement segment.

190
Table 8.5 Summary of Estimated Project Abandonment Costs at post-FEED stage [2].
Table 8.6 Summary of Estimated Project Operating Costs at post-FEED stage [2].
Chain segment Total ABEX(£m)
Steam and Power Supply 23.0Carbon Capture process 45.6Compression & Conditioning 9.4Balance of Plant and Utilities 23.9Site -other -Link-line between Longannet and Dunipace 16.3No. 10 Feeder (Existing pipe) 15.8Compression and facilities at St. Fergus (Blackhill) 24.2Offshore Topsides & Subsurface 25.7Wells 39.3Pipelines 31.4Onshore facilities 1.5Post C.O.P. 25.2Total 281.3
Item Longannet Site Transport Storage
Fuel/Power/Energy
Calculated based on
volume and energy price
profiles
0.04533 MWh/tCO2 £4k/month
Consumables £4.86/tCO2 - £8k/monthWaste disposal £0.31/tCO2 - £2k/month
Maintenance £505k/month £58k/month Annual profile, averaging £284k/month
Staff £421k/month £350k/month £202k/monthRates £425k/month £4k/month -
Insurance £425k/month £33k/month Annual profile, averaging £19k/month
Overheads £325k/month £602k/month £178k/monthLease costs - - £8k/month
Other Fixed costs £238k/month -£96k/month + Annual
profile, averaging £267k/month

191
Summary
Capital Costs
Table 8.7, displays a summary comparison of the capital cost estimates at the Outline Solution stage and post-FEED for the capture, transport and storage sections of the scheme.
Table 8.7 Summary of Estimated Project Capital Costs at pre- and post-FEED [2].
The central case capital cost estimate for the capture and transport sections rose following FEED by £96.7m (+17%) and £82.5m (+42%) respectively whereas the estimate for the storage section fell by £110.9m (-35%).
The variations to the overall capital costs can be attributed to the following:
The rise in the capture section estimate was principally due to refined estimates of the balance of plant and utilities costs. These include enabling works, buildings including the control room and a larger electrical substation, a greater definition of the water intake works and steelwork required for the ductwork combined with other site costs which were only apparent as a result of the FEED.
The increase in the estimate for the transport section was due primarily to increases in the estimates of the work required for the new pipeline connecting Longannet Power Station to the No. 10 Feeder pipeline. FEED has enabled closer identification of river crossing risks and therefore better understanding of costs in respect to ground conditions along the pipeline route - specifically the requirement for tunnelling under the Firth of Forth river instead of Horizontal Directional Drilling (HDD) as was originally proposed in the Outline Solution. The FEED study has enabled a greater understanding of the work required and consequently a more accurate estimate to be compiled.
The decrease in the storage section cost estimate was due to a better understanding of the work required as a result of the FEED and in particular the scope and costs of work to be undertaken at the wells.
The risk and contingency costs increased by £92m (82%) as a result of FEED reflecting the better identification and quantification of risks as outlined in Section 7. This value is indicative and is subject to final identification of the risk/reward balance of the project, and the procurement strategy adopted.
Section Outline solution (£m) Post Feed (£m) Change (£m)
Capture1 559.8 (47%) 656.5 (49%) +96.7Transport 198.7 (17%) 281.2 (21%) +82.5Storage 318.7 (27%) 207.8 (16%) -110.9Total 1,077.2 (91%) 1,145.5 (85%) +68.3Risk & Contingency 102.8 (9%) 194.8 (15%) +92.0Total Project Capex 1,180.1 (100%) 1,340.3 (100%) +160.2
Estimated Range 857 to 1,719 1,200 to 1,519 n/a
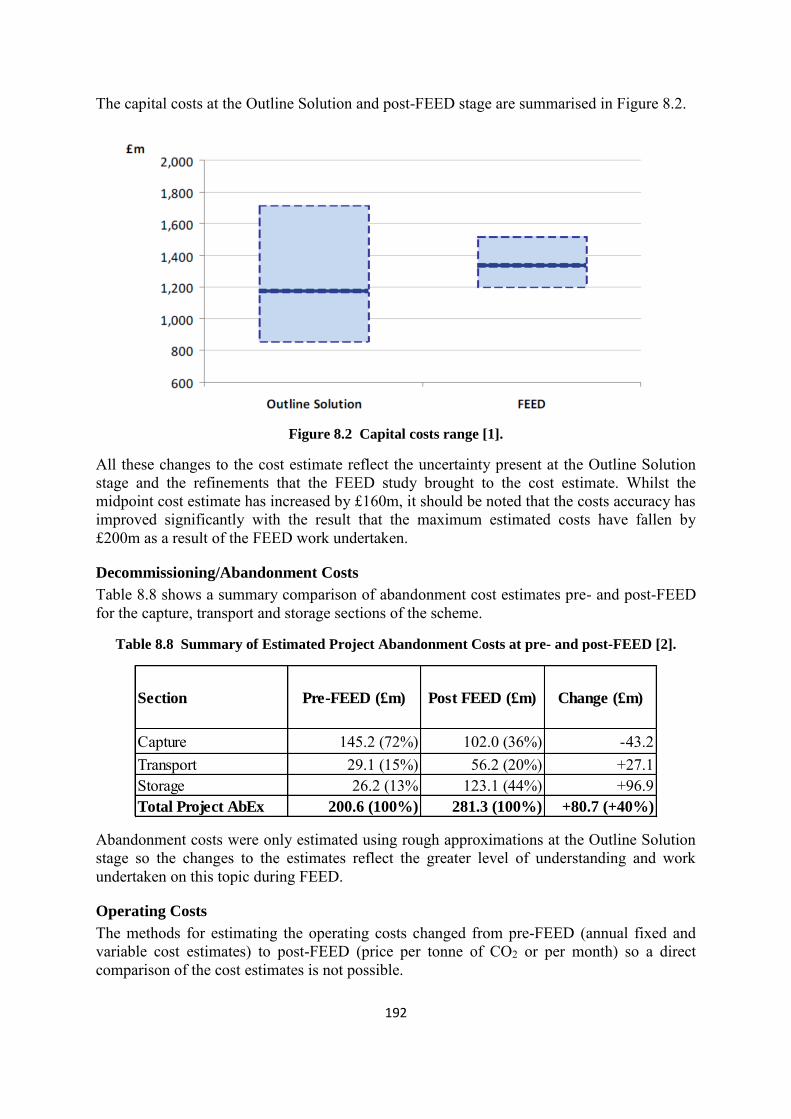
192
The capital costs at the Outline Solution and post-FEED stage are summarised in Figure 8.2.
Figure 8.2 Capital costs range [1].
All these changes to the cost estimate reflect the uncertainty present at the Outline Solution stage and the refinements that the FEED study brought to the cost estimate. Whilst the midpoint cost estimate has increased by £160m, it should be noted that the costs accuracy has improved significantly with the result that the maximum estimated costs have fallen by £200m as a result of the FEED work undertaken.
Decommissioning/Abandonment Costs
Table 8.8 shows a summary comparison of abandonment cost estimates pre- and post-FEED for the capture, transport and storage sections of the scheme.
Table 8.8 Summary of Estimated Project Abandonment Costs at pre- and post-FEED [2].
Abandonment costs were only estimated using rough approximations at the Outline Solution stage so the changes to the estimates reflect the greater level of understanding and work undertaken on this topic during FEED.
Operating Costs
The methods for estimating the operating costs changed from pre-FEED (annual fixed and variable cost estimates) to post-FEED (price per tonne of CO2 or per month) so a direct comparison of the cost estimates is not possible.
Section Pre-FEED (£m) Post FEED (£m) Change (£m)
Capture 145.2 (72%) 102.0 (36%) -43.2Transport 29.1 (15%) 56.2 (20%) +27.1Storage 26.2 (13% 123.1 (44%) +96.9Total Project AbEx 200.6 (100%) 281.3 (100%) +80.7 (+40%)

193
References
No. Report Name
1 SP-SP 6.0 - RT015 FEED Close Out Report 2 UKCCS - KT - S5.2 - OS - 001 Outline Solution project Cost Schedule 3 UKCCS - KT - S5.1 - E2E - 001 Post-FEED project Cost Schedule PFD

194
8.2 Kingsnorth CCS Demonstration Project
Estimating Philosophy [1,3]
The purpose of this philosophy document is to provide instructions for all FEED Participants in the estimation of costs during and following design activities within their scope. It does not refer to the overall E.ON project estimates.
Cost Estimation Details
Basic Principle The basic principle is to use a top-down approach, where a total cost for each substantial item (or lot) is given. Where possible, the costs should then be broken down into standard areas as detailed below. This applies to both capital expenditure (CAPEX) and operational expenditure (OPEX). A template will be produced which should be used to provide the costs back to the E.ON financial manager. It is important for Participants to note that the mechanism by which each cost estimate is generated is as valuable as the financial figure itself, and therefore where mechanisms, models or other methods (direct quotes perhaps) are employed, these should be provided or at least identified.
High-Level Requirements
The costs should be: Provided in GBP £ sterling to the nearest thousand (£’000). Where costs
originated in other currencies, please provide the cost in the original currency as well as the exchange rate used within the calculation. For the following currencies, the exchange rates supplied below should be used: EUR: 1.16 EUR/GBP, USD: 1.68 USD/GBP, YEN: 165.82 YEN/GBP ,NOK: 9.54 NOK/GBP
Based on real Q1 2011 prices (i.e. costs as they would be if contracted on 1st April 2011). Where prices are estimated on a different time basis or are for future calendar years, please provide the time period as well as suggesting an appropriate index for inflation/deflation.
Provided with upper and lower limit estimates. Upper estimates should be 95th percentile and lower estimates 5th percentile (i.e. P5, P50 and P95). An explanation of the method used for calculating the upper and lower estimates should also be provided (e.g. quantitative risk assessment; industry standard, etc). The central case should be based on the best estimate of cost.
Given an indication of uncertainty. What is the remaining uncertainty on the base case figure at the point of submission to E.ON.
Provided with an indicative time profile of spend by month. When costs are anticipated to be incurred and/or can be profiled over a period of time. At this stage, costs should be specified in the month when the physical work is undertaken or the item is delivered (as appropriate). The time estimates should be consistent with the Project Programme provided by the E.ON PMO. Where a Participant has a mechanism for defining the time profile of cost incursion, this would be useful to E.ON.
Provided along with the relevant source identified. Cost For the FEED 1A stage, each substantial item of cost should be specified

195
Breakdown by WBS area and then further broken down, where possible into the following key areas:
Further FEED and design costs should be included. Costs already included within FEED 1A should not be included.
Bulk Material Procurement. Specifications for commodities used should be provided (i.e. quantity of material, market index and date used). This should also include any additional storage costs required.
Equipment and Manufactured Items. Costs should be for the complete item to be stored (if necessary) and transported to site with all taxes and delivery duties paid, Where an item uses a significant volume of a market based commodity (e.g. steel), the specifications used should be provided wherever possible (i.e. quantity of material, market index and date used).
Labour Costs. Costs should be broken down by hourly rate with number of hours per rate quoted.
Preliminary works. Costs for all preliminary works should be included unless the participant is informed otherwise.
Installation of equipment. This should include all finishing works necessary and disposal of any waste.
Commissioning. Including first fill costs and significant/strategic spare parts.
Construction management. Including number of hours and cost. Maintenance costs including the cost of any maintenance contracts and
strategic spares should be included. Costs should be inclusive of delivery.
Operational costs should be detailed, including their phasing over the lifetime of the asset.
Taxes, duties and insurances that must be included. Any VAT payable should be included, but should be specified separately; i.e. Incoterm Delivery Duty Paid (DDP). Any taxes payable on waste disposal (landfill tax, aggregates levy, etc) should also be detailed
Escalation should be included separately alongside the base cost. Due to the mixture of different technologies and disciplines involved within the project, we would anticipate that escalation could vary and should be detailed separately for each significant area of procurement.
Any other costs identified. This is for any available detailed costs which do not fall under the above headings. This could include, for example, project management costs.
During more detailed pricing at FEED 2 stage, more detailed cost breakdowns will be required; updated guidance will be produced when this is required.
Contingencies
Contingencies should not be included within the base prices quoted. Participants should separately and explicitly state any contingency they would normally expect to apply, along with an explanation of the mechanism for defining its value.
Operational Cost Drivers
Some operational costs may vary by either the number of hours of plant operation or the volume of gas or carbon dioxide processed. Where operational costs are driven in this way, they should be specified as a cost

196
per hour or per unit of carbon dioxide processed. For costs relating to utilisation of energy (whether electricity, steam or otherwise), rather than an assumption as to the fuel price being made, the cost should be specified in terms of the volume of energy used (in MWh).
Tax Categorisation
To understand tax implications, expenditure should be supplied along with: The anticipated design lifetime of the item in question. An engineering judgement as to whether or not the item of expenditure is for research and development
Unknown Risk Potential
Where risks cannot be accurately costed, this should be indicated; however, no additional contingencies should be included in each cost estimate. Rather, the indication may be taken into account in order to calculate overall Kingsnorth CCS project contingency required in order to avoid “double contingency” counting.
Handling of Contingencies
During FEED 1A, E.ON will be responsible for applying all contingency. This should not be taken as an indication of E.ON’s likely procurement strategy during later stages of the project.
Quantitative Risk Analysis [1,2]
This section introduces the risk management activities contained within the Kingsnorth Carbon Capture and Storage (KCP) Risk Management Procedure (KCP-ARP-PMG-PRO-0016) and aims to inform the Project’s affordability, value for money and programme implications. It explains the risk management approach to quantify the Project’s capital cost and schedule risk profiles, and records the principal results. This project is at an early stage of FEED development and this is reflected in the results of this report.
Cost QRA Model
Inputs
Uncertainty in cost estimation and significant capital cost risks have been assessed quantitatively where possible. Three-point estimates (i.e. minimum, most likely and maximum cost values), assuming the risk occurs, have been agreed by the Risk Owner, and members of the KCP Senior Management Team and the Risk Management Team. Where possible, cost estimates provided by the specialist contractors involved in this project have been used as the basis of these three point estimates. The justification for any changes to probability values and three-point estimates have been recorded in the project risk register. The probability distributions for each risk are described in @RISK by the Binomial function. Binomial distribution is a discrete distribution on a random number of yes/no scenarios attributed to probabilities.
Impact distributions for risks (i.e. chance events) are described using either PERT (for 3 point estimates) or Uniform (for 2 point estimates) distributions. PERT distribution emphasizes the "most likely" value over the minimum and maximum estimates. However, unlike the triangular distribution the PERT
distribution constructs a smooth curve which places progressively more emphasis on values around the most likely value, in favour of values around the edges. The uniform distribution is the simplest possible distribution for sampling a range of estimates. In Uniform distribution, every value - from the minimum to the maximum - is equally likely. The Risk Collect @RISK function has been used as an additional argument to

197
the distribution functions, so that only functions identified by Risk Collect are displayed in the simulation results and sensitivity analysis.
Outputs A single output cell, using the RiskOutput function, was used to combine the simulation results from all the modelled risks. In addition to this the base cost estimate (P50 probability) of £1,052,352,678 was added to the cost risk profile.
Sampling @RISK for MS Excel (see www.palisade.com for further information) was used to simulate the model. 1,000 iterations were run using the Latin Hypercube sampling method. Latin Hypercube is a stratified sampling technique. Stratified sampling techniques, as opposed to Monte Carlo type techniques, tend to force convergence of a sampled distribution in fewer iterations
Schedule Model (QSRA)
Inputs As with the cost QRA, two sources of error have helped inform the schedule risk profile, namely activity duration estimating uncertainty and chance events from the Project Risk Register. In Primavera Risk Analysis, BetaPert
(i.e. 3-point duration estimates) or Uniform (i.e. 2-point estimates)
distributions were used, as appropriate, to describe activity durations. Both BetaPert (same as Pert) and Uniform are described in more detail in section 3.1.1. The range estimates were agreed by the Risk Owner, members of the KCP Senior Management Team and the Risk Management Team. Their individual justifications have been recorded in the Project Risk Register. To ensure the probabilistic analysis was not undermined by constraints in the deterministic programme (i.e. KCP Level II Schedule); constraints were replaced with logic wherever possible. The basis of the analysis was the Kingsnorth CCS Level II Project Schedule (reference KCP-ARP-SDL-SDL-0003).
Sampling Primavera Risk Analysis was used to simulate the QSRA. 1,000 iterations were run using the Latin Hypercube sampling method.
Results
Output Statistics
The key cost QRA statistics are illustrated in the following two figures and presented in the table at the end of this chapter (Post-FEED Project Cost Estimate). @Risk indicated that sufficient iterations were run to ensure the reliability of the output statistics.

198
The graphs above are key outputs from the Cost QRA model from @Risk. The first figure represents the various hits which occurred during the modelling iterations and demonstrates which values occurred most frequently in the model. The second figure determines the progression, in terms of billions of pounds, related to the confidence levels within the model. Both graphs have the P5 and P95 details highlighted by the vertical delimiter lines. From the figures above and table at the end of the chapter, it can be seen that the cost QRA model details a spread from P5 to P95 of approximately £378 million in CAPEX costs, with the P5 value representing approximately a 12% increase of the base cost estimate of £1,052,352,678 billion and the P95 indicates approximately a 48% increase. As shown in the table “Post-FEED Project Cost Estimate”, the mean value was approximately £1.365 billion (Approx 29% increase on base cost estimates). It is worth noting that the figures shown in this section represent only the CAPEX impacts for the CCS Chain, excluding the Power plant.
Sensitivity Analysis for Cost QRA
The figure beneath presents the results of the sensitivity analysis for the cost QRA. It demonstrates the degree to which the uncertainty of the model’s output is affected by the individual risks in the model. As a note, the longer the horizontal bar, the greater the effect that risk is having on the model’s output.

199
The figure lists risks in descending order of importance, together with their regression coefficients. Further commentary on the top three most influential risks is given below: Identifier 25: Unanticipated change in the market conditions relating to a
change in material prices. There remains considerable uncertainty around the expected material prices across the CCS chain. This is reflected in the broad cost range estimate for this item. Effectively, there could be approximately a 22% saving. Conversely, there could also be approximately a 32% increase on the base costs for materials;
Identifier 241: Uncertain plant-related commodity prices. Similar to identifier 25, there is still sufficient uncertainty in relation to plant prices, which has been indicated by the Project’s Participants cost estimates. In this case, the possible saving is 23% of the base cost, but there could be a 39% increase for the same risk;
Identifier 220: Unknown commissioning requirements for the pipeline in terms of dehydration and corrosion. The exact costs for the commissioning requirements for the pipeline, to ensure that it is suitable for operation, are very much unknown at this stage of the project. This was reflected in the three point estimates provided for this risk demonstrating large uncertainties.
Currently, the project has a large amount of uncertainty in relation to these risk areas and would expect the uncertainty of these risks to be reduced greatly in later stages of the Project, notably the procurement phase.

200
Conclusion
Both QRA models provided very strong evidence that the Kingsnorth CCS project has a great deal of uncertainty at the current stage of the project. This would, as stated earlier in the document, be expected to be mitigated in future design and procurement phases. However, the results of both models highlight the key risks that this project faces and will have to mitigate going forward. The Cost QRA demonstrated that there is a sufficient spread in CAPEX values related to confidence levels, approx £378 million between P5 and P95. The cost QRA model also highlighted that there are large uncertainties in relation to the cost impacts of risks associated with materials, labour and plant. However, a key risk which requires further research in future is the risk to ensure the pipeline is commissioned suitably in terms of dehydration to prevent corrosion. It is crucial to draw attention to this risk, as it also was the most influential risk in the Schedule QRA. This risk has been at the forefront of the Project’s FEED 1A study, but it is widely accepted that future work is required to suitably understand and mitigate this risk. In relation to the Schedule QRA, the results demonstrated that high impact duration risks, mainly consenting risks, could lead to the Schedule being delivered at least 2 years later than initially planned. It is worth stressing that

201
the Schedule QRA modelled the Kingsnorth CCS Schedule risks as they currently stand and did not take into consideration risk reduction plans and their impact after FEED 1A. This helps to focus attention on the key drivers behind such a significant shift from the baseline end date to any date after P20 confidence. Key risks around commissioning and consenting were highlighted by the analysis and this was similarly reflected by a group of activities which showed up as being sensitive to these risks. Again, the risks and activities most prominent in the analysis were part of the focus of FEED 1A and will continue to be going forward. The Cost and Schedule QRA models demonstrated that, at the current stage of the Kingsnorth CCS Project, there are a large variety of risks that remain highly uncertain and if not managed appropriately could have major implications on the Project’s budget and programme. However, the Kingsnorth CCS Project is in a suitable position to manage these risks as it progresses through to future stages of development.

202
Table 8.9 Post-FEED Project Cost Estimate [4]
Project Development and capital cost proforma1,2,3,4,5
Capital Cost Range6 Annual Break-down7 Low Central High 2012/13 2013/14 2014/15 2015/16 2016/17 2017/18 Development Costs Initial studies 18 989 26 880 34 771 672 3 696 8 064 9 744 3 024 1 680 Surveys 9 248 11 560 17 099 289 1 590 3 468 4 191 1 301 723 Bid costs 7 066 8 832 12 461 221 1 214 2 650 3 202 994 552 Procurement fees 18 313 24 902 31 440 623 3 424 7 471 9 027 2 802 1 556 Total Development Costs8 72 175 1 804 9 924 21 653 26 164 8 120 4 511 Construction Costs Capture Plant Land costs Air separation unit Boiler recirculation duct and controls 1 928 2 571 3 342 64 354 771 932 289 161 Post-combustion capture plant 61 448 81 036 106 288 2 026 11 142 24 311 29 375 9 117 5 065 Other plant and equipment 58 755 76 827 100 258 1 921 10 564 23 048 27 850 8 643 4 802 Civil works 11 565 16 521 21 477 413 2 272 4 956 5 989 1 859 1 033 Insurances Testing/Commissioning 2 049 2 769 3 711 69 381 831 1 004 312 173 Mobilisation 2 971 4 570 5 484 114 628 1 371 1 657 514 286 Contingency 22 726 30 507 39 768 763 4 195 9 152 11 059 3 432 1 907 Compression/Conditioning Land costs Compressor plant and equipment 52 282 68 759 90 392 1 719 9 454 20 628 24 925 7 735 4 297 Civil works 6 864 9 805 12 747 245.00 1 348 2 942 3 554 1 103 613.00 Insurances Mobilisation 1 689 2 599 3 119 65 357 780 942 292 162 Testing/Commissioning 1 165 1 574 2 109 39 216 472 571 177 98 Contingency 10 372 13 955 18 244 349 1 919 4 186 5 059 1 570 872 Transport Facilities Land costs 44 55 72 1 8 17 20 6 3 Transportation plant and equipment 288 360 360 450 481 321 9 011 49 562 108 135 130 663 40 551 22 528 Civil works 68 122 85 152 120 932 2 129 11 708 25 546 30 868 9 580 5 322 Insurances 2 653 3 316 4 974 83 456 995 1 202 373 207 Mobilisation 24 590 30 737 46 091 768 4 226 9 221 11 142 3 458 1 921 Testing/Commissioning Contingency 94 438 118 047 165 826 2 951 16 232 35 414 42 792 13 280 7 378 Injection Facilities and Infrastructure Injection Infrastructure 75 467 94 334 125 555 2 358 12 971 28 300 34 196 10 613 5 896 Well Interface 3 267 4 114 5 497 103 566 1 234 1 491 463 257 EOR/EGR Infrastructure Insurances 1 665 2 081 2 965 52 286 624 754 234 130 Mobilisation 3 806 4 758 6 847 119 654 1 427 1 725 535 297 Testing/Commissioning 4 549 5 686 8 492 142 782 1 706 2 061 640 355 Contingency 31 880 39 849 54 971 996 5 479 11 955 14 445 4 483 2 491 Geological Storage Costs Land costs Well Costs 35 222 48 432 61 643 1 211 6 659 14 530 17 557 5 449 3 027 Insurances Mobilisation 10 074 13 432 16 790 336 1 847 4 030 4 869 1 511 840 Testing/Commissioning 3 289 4 385 5 482 110 603 1 316 1 590 493 274 Contingency 7 482 10 185 12 888 255 1 400 3 055 3 692 1 146 637 Total CCS Chain Costs8 1 136 505 28 413 156 269 340 951 411 983 127 857 71 032
Total Costs8 942 338 1 208 680 1 623 056 30 217 166 194 362 604 438 147 135 977 75 543 Note:
1) Real £ 000s based on April 2011 prices. 2) Indices applicable but not used: RPI, rate 2.5%. 3) Fraction of costs subject to index: 100%. 4) Expected cost certainty at the end of FEED: 0%. 5) Costs for the Power Plant are not included. 6) Excluding sensitivities. 7) Uses the central cost estimate. 8) Deviations due to rounding errors.

203
Summary [1,2, 3]
A significant issue from both the cost and schedule QRA’s is that the project still has large uncertainties, particularly in relation to quantifying future cost and expected activity durations.
The cost estimate was broadly consistent with Class 3/4 estimate as defined by AACE. A standard template for each project participant to complete was established in order to
ensure a consistent approach in estimating cost data.
References
No. Report Name
Document
No.
1 Key Reference Handbook 0 2 Quantitative Risk Analysis Report (Cost and Schedule) 10.8 3 Estimating Philosophy 10.12 4 Post-FEED Project Cost Estimates 10.14

204
CHAPTER 9: CONSENTS & ENVIRONMENT
9.1 Longannet Power Station to Goldeneye Reservoir CCS Demo Project
List of regulation material produced in the Longannet FEED study:
Consents and Permitting section – FEED Close Out Report (more detail below) Consents and Licences Register (more detail below) Key Consents Risks (more detail below) Regulatory Permits and Approval Plan (Document reference number 4)
The key when dealing with project consents is to manage the complexity well. The Scottish Power Consortium focused on joint and early engagement (with key stakeholders, regulators, communities etc.) and dealt with it as a full-chain (but with each party responsible for their relevant part/s). Internal work stream collaboration is vital, as is a good working relationship with regulators. Close Out Report – Consents & Permitting
Consents and permitting is covered in chapter 8 of the Scottish Power (SP) FEED Close Out Report [1]. This chapter provides details of the regulatory work carried out during FEED for the purposes of assisting potential developers of CCS projects in assessing the work necessary to achieve the legal requirements of constructing and operating an End-to-End CCS system. The close out report describes the background to regulations for the Scottish Power CCS Consortium’s planned development (including information on the EU Directive for CCS); the consents register produced; and the risks, issues and uncertainties come across in the regulatory process in this FEED study. The CCS Key Consenting Requirements by the Scottish Power CCS Consortium can be found in the figure overleaf :
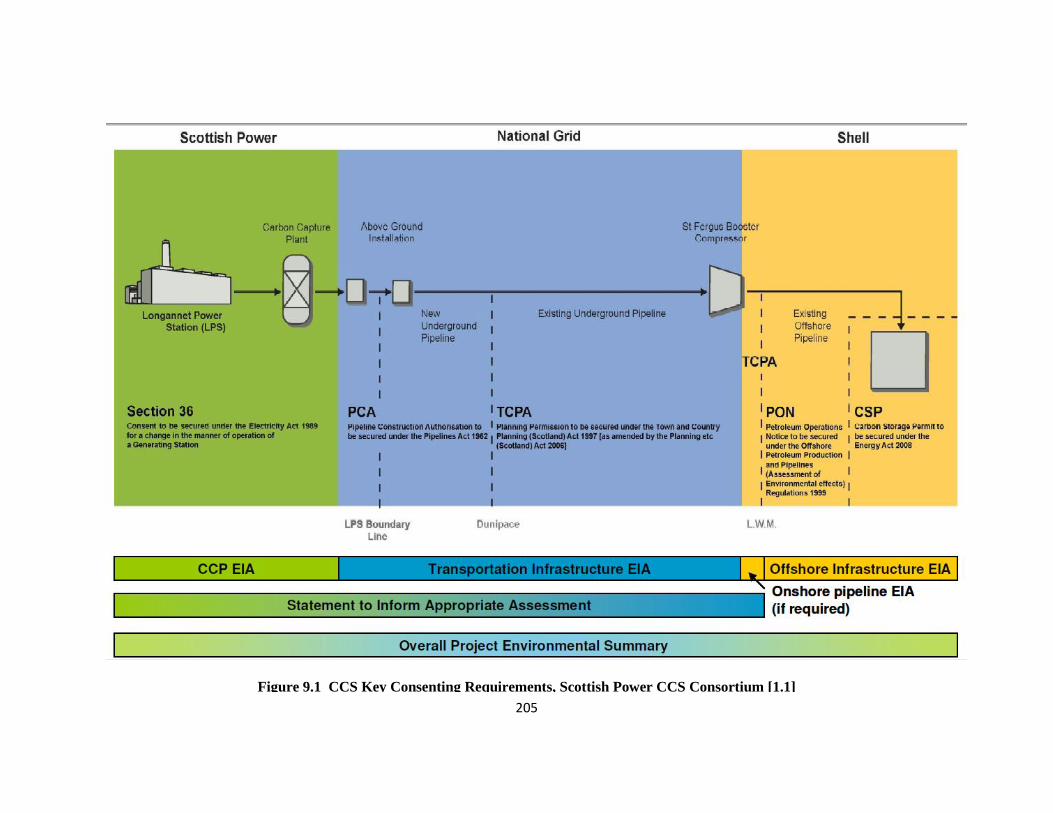
205
Figure 9.1 CCS Key Consenting Requirements, Scottish Power CCS Consortium [1.1]

206
Consents and Licences Register [2]
The consents register is very detailed and addresses each stage of the CCS process separately. For each of the consents identified, the register has captured the area of project that is covered; a written description of the consent/licence; a description of the work needed to meet the requirements for granting the consent; the granting authority/commercial entity; the date of application/award; the current status of the consent; any amendments to the existing consent; and progress updates (June 2010 – March 2011).
Area Consents needed Issues and Uncertainties [1]
Carbon Capture Plant (CCP) and the associated Steam and Power Supply (SPS) plant)
Section 36 Electricity Act 1989 Electricity Works (Environmental Impact Assessment
(Scotland)) Regulations 2000 Electricity (Applications for Consent) Regulations 1990 Town and Country Planning (Scotland) Act 1997 as
amended by the Planning etc (Scotland) Act 2006 Pollution Prevention and Control (PPC) (Scotland)
Regulations 2000 S.14 (1) Energy Act 1976 Planning (Hazardous Substances) (Scotland) Act 1997 New Grid Connection Agreement Control of Major Accident Hazards Regulations
(COMAH) 1999 + Environmental Impact Assessment (EIA) Regulations
Section 36 Electricity Act – Potential for objections from Statutory Agencies and/or Local Authorities in response to local opposition. To mitigate this, Scottish Power (SP) has undertaken a stakeholder engagement programme. PPC permit – may be issues in determining emission limits for the cumulative plants, also the CCP and SPS plant may be operated by a different operator which would impact the issue of a PPC permit variation to the appropriate operator. COMAH – The HSE has delayed making a decision on the inclusion of CO2 as a hazardous substance under the COMAH Regulations until 2015. The current uncertainty could result in inadequate design/assessment.
Transportation of CO2
Pipe-Lines Act 1962 Section 1(1) / Pipeline Works (Environmental Impact Assessment) Regulations 2000
Pipeline Works (Environmental Impact Assessment) Regulations 2000
The Conservation (Natural Habitats, &c.) Regulations, 1994
PCA (Pipeline Construction Authorisation) & planning consents – Environmental Impact Assessment (EIA) and Habitat Regulation Appraisal (HRA) are required to accompany these applications. EIA and HRA will be subject to statutory and public consultation. The outcome of the consultation process therefore cannot be

207
Food and Environment Protection Act (FEPA) 1985 / Coastal Protection Act (CPA) 1949 (To be superseded by the Marine (Scotland) Act 2010 and Marine and Coastal Access Act 2009)
Town and Country Planning (Scotland) Act 1997 as amended by the Planning etc. (Scotland) Act 2006
Environmental Impact Assessment (Scotland) Regulations 1999
Nature Conservation (Scotland) Act 2004 Sections 16(2) & 16(3)
Pipeline Safety Regulations (PSR) 1996 Gas Act 1986 / Energy Act 2008 Control of Major Accident Hazards Regulations 2005 Pollution Prevention and Control (Scotland)
Regulations 2005 Control of Pollution (Amendment) Act 1989/ The
Controlled Waste (Registration of Carriers and Seizure of Vehicles) Regulations 1991
foreseen. Compulsory Purchase Provisions – New Pipeline – It is not always possible to reach a negotiated agreement on land rights and in this case it may be necessary to apply for a Compulsory Purchase Order (CPO). Pipeline Change of Use – Existing Pipeline – change of use of the existing pipeline from the conveyance of natural gas to conveyance of CO2 will require a planning consent. To lessen this potential issue, early consultation with the Scottish Government was undertaken. Pipeline Safety Regulations (PSR) 1996 – requires notification on: commencement of construction; change of use of existing pipeline; de-notification of existing onshore pipeline; revalidation notification of existing onshore pipeline.
CO2 Offshore Transportation and Storage
Energy Act 2008 / 1982 United Nations Convention on The Law of the Sea – Agreement of and Lease for Carbon Storage
s.34 Coast Protection Act 1949 (CPA), as amended - Consent to locate platform (CPA2)
Offshore Petroleum Production and Pipe-lines (Assessment of Environmental Effects) Regulations 1999 (SI 1999/360)
Offshore Petroleum Activities (Conservation of Habitats) Regulations 2001, (SI 2001/1754)) - PON15B Approval
Carbon Storage Licence (CSL) – this will be required but cannot be issued by DECC until the Government has completed its update to the Strategic Environmental Assessment (SEA) to include offshore CO2 storage activities. Carbon Storage Permit (CSP) – DECC consent for storage operations will initiate the operational phase of the licence, but there are various risks and uncertainties that could delay this consent. Consent to Handover Storage Facilities – possible issues

208
Offshore Petroleum Production and Pipe-lines (Assessment of Environmental Effects) Regulations 1999 (SI 1999/360) - PON15D Approval
Offshore Chemicals Regulations 2002 (SI 2002/1355) - Chemical Permit (PON15D Approval)
Offshore Petroleum Production and Pipe-lines (Assessment of Environmental Effects) Regulations 1999 (SI 1999/360) - PON15C Approval
Offshore Chemicals Regulations 2002 (SI 2002/1355) - Chemical Permit (PON15C Approval)
Offshore Chemicals Regulations 2002 (SI 2002/1355) - Chemical Permit (PON15F Approval)
Offshore Petroleum Activities (Oil Pollution Prevention and Control) Regulations 2005 (SI2005.2055), as amended - OPPC Permit
Offshore Petroleum Activities (Oil Pollution Prevention and Control) Regulations 2005 (SI2005.2055) - OPPC Permit
Section 34 Coast Protection Act 1949 - CPA 1 s.17 Petroleum Act 1998 - Consent for connecting to
existing offshore pipelines Town and Country Planning (Hazardous Substances)
(Scotland) Regulations 1993, as amended Planning (Hazardous Substances) (Scotland) Act 1997
- Consent for storage of hazardous substances (CO2) at the onshore gas plant at Blackhill
Regulation 6(4) Control of Major Accident Hazards Regulations 1999 (SI 1999/743) - Approval of updated COMAH Safety Report
Energy Act 2008 - Consent to cease injection and
with the handover regulations which could mean additional costs to the project, additional project delay and even inability to hand over the storage site if EC requirements are considered too onerous. Lease for Carbon Storage – issues have been identified on the schedule for obtaining these permits as well as issues with obtaining leases from the Crown Estate (i.e. if there is a risk of even a small amount of CO2 leak from the aquifer). Pipeline Safety Regulations and COMAH Regulations – The PSRs and COMAH Regulations are being revised in light of the SEVESO Directive. It is possible that these revisions will result in additional HSE obligations although at this stage the nature of those obligations is not known. This could result in additional costs and design changes post-FEED to meet new requirements as well as delays in obtaining approvals and impact on the project schedule.

209
storage operations s.29 Petroleum Act 1988 - Approval of
Decommissioning Programme Energy Act 2008 - Consent to handover storage
facilities Other key consents that will be needed but not at this stage
SI 2005/3117 Offshore Installations (Safety Case) Regulations 2005 (SCR05), as amended - Revised Goldeneye Installation Safety Case (14.2 Material Change) Approval
SI 1996/825 The PSR 1996 - Approval of updated Major Accident Prevention Document for the Goldeneye export pipeline
S1 1996/825 PSR 1996 Reg 21 - Notification before use / re-use of a major accident hazard pipeline for the Goldeneye export pipeline
SI 1996/825 The PSR 1996 Reg 22 - Notification in other cases for the Goldeneye export pipeline
SI 2005/3117 Offshore Installations (Safety Case) Regulations 2005 (SCR05), as amended
Revised Goldeneye Installation Safety Case (14.2 Material Change) Approval for the operation of the mobile drilling rig adjacent to existing, fixed installation

210
Summary [3] This document looks at the key risks in terms of consents. It takes into account onshore and offshore elements, whether it will be affected by the FEED stage, the risk values and current risk control measures. This is formatted in a table and indicates whether the project stage is impacted by the various stages (FEED, construction, commissioning, operations, decommissioning, post-closure). It then describes the risk/event, the consequence/impact on the project should this occur, the risk owner, the risk category (in this case consents), the estimated risk value at baseline (likelihood, cost impact, cost risk rating etc.), current estimated value of risk, management strategy, risk control measures and the estimated value of residual risk at the final stage.
References
No. Report Name
1 Scottish Power FEED Close Out report (SP-SP 6.0 - RT015) (Chapter 8) 1.1 Close Out Report (Chapter 8), figure 8.1-1 2 UKCCS - KT - S11.1 - E2E – 001. Consents & Licences Register 3 UKCCS - KT - S11.2 - FEED – 001. Key Consents Risks 4 UKCCS - KT - S11.2 - Shell – 001. Regulatory Permits and Approval Plan
Note: The ScottishPower CCS Consortium/Longannet environmental information can be found in Chapter 9, ‘Health & Safety’.

211
9.2 Kingsnorth CCS Demonstration Project
List of Consents/Environmental Statements Produced:
Consenting Philosophy (more detail below) Environmental Philosophy (more detail below) Kingsnorth Environmental Statement (more detail below)
Kingsnorth Environmental Statement Figures Kingsnorth EP Application Form
Onshore Pipeline Scoping Complete Onshore Pipeline Environmental Statement (more detail below) Onshore Pipeline ES non-Technical Summary
Offshore Pipeline Scoping Offshore Pipeline Environmental Statement
Offshore Pipeline ES Non Technical Summary Pipeline Scoping Document Comments Genesis Offshore Environmental Plan (more detail below) Environmental Risk Assessment (more detail below) Environmental Commitments Compliance Register Emissions From Offshore Construction Activities Noise Model and Report for Offshore Pipeline, Platform and Well Drilling Waste Management Plan Define Lease Licence Permit Submission Requirements Storage Lease application Carbon Capture Readiness Report Consenting Register
Consenting Philosophy – Summary
For the FEED 1A study, the relevant consents that would be needed were looked at. Discussions were held with the regulatory authorities in order to understand what would be required from whom, and when. The project team were then advised what was needed and in how much detail. Some pre-CCS consenting work was carried out from 2006 – 2009, for the power plant only. The main FEED objectives were to update the original applications where necessary and undertake a rework of assessments. There were significant uncertainties at the outset of the project regarding the types of consent required. This was a consequence of the planning consent for Kingsnorth Units 5 and 6 having already been submitted in 2006, new government policy and draft regulatory guidance, and ongoing government consultations on regulatory issues. Many of these issues were resolved, enabling development of consent applications for the integrated power and capture plant and

212
onshore and offshore CO2 pipeline. However in some cases, particularly for the offshore platform and storage, uncertainty remained throughout the project. In these instances the deliverable was an interpretation of the regulatory requirements that will need to be reviewed and taken into account to obtain consents during subsequent stages of the project [1].
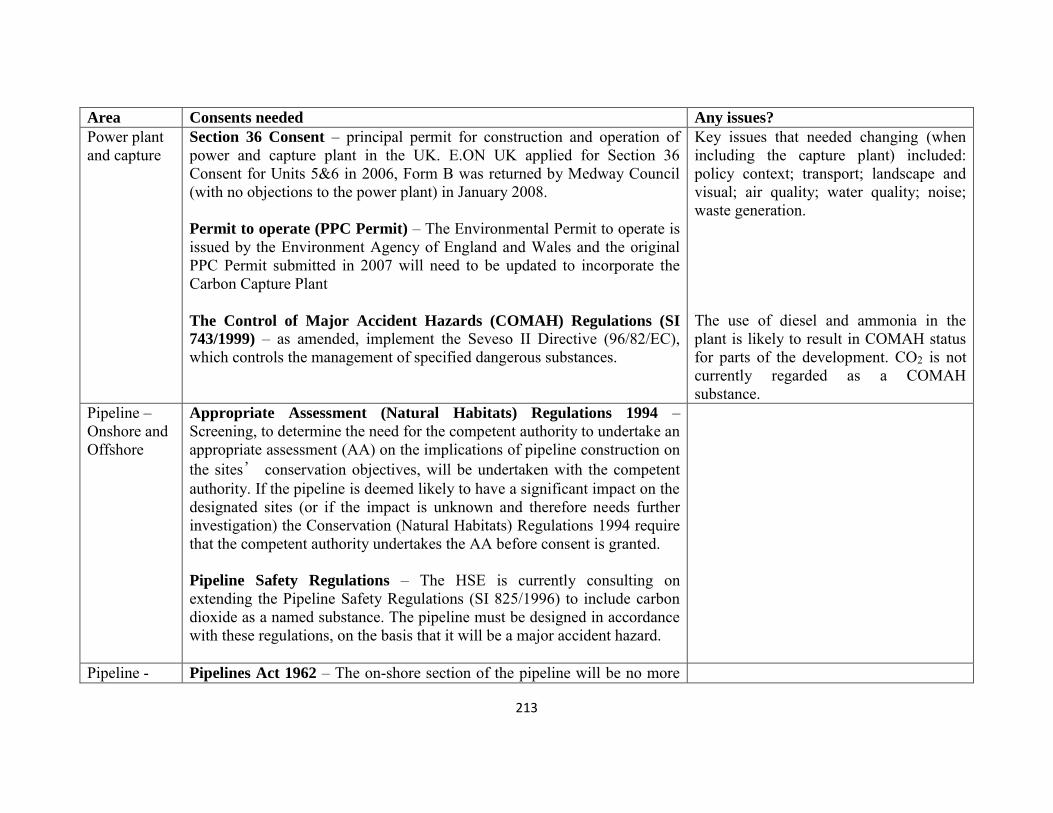
213
Area Consents needed Any issues?
Power plant and capture
Section 36 Consent – principal permit for construction and operation of power and capture plant in the UK. E.ON UK applied for Section 36 Consent for Units 5&6 in 2006, Form B was returned by Medway Council (with no objections to the power plant) in January 2008. Permit to operate (PPC Permit) – The Environmental Permit to operate is issued by the Environment Agency of England and Wales and the original PPC Permit submitted in 2007 will need to be updated to incorporate the Carbon Capture Plant The Control of Major Accident Hazards (COMAH) Regulations (SI
743/1999) – as amended, implement the Seveso II Directive (96/82/EC), which controls the management of specified dangerous substances.
Key issues that needed changing (when including the capture plant) included: policy context; transport; landscape and visual; air quality; water quality; noise; waste generation. The use of diesel and ammonia in the plant is likely to result in COMAH status for parts of the development. CO2 is not currently regarded as a COMAH substance.
Pipeline – Onshore and Offshore
Appropriate Assessment (Natural Habitats) Regulations 1994 – Screening, to determine the need for the competent authority to undertake an appropriate assessment (AA) on the implications of pipeline construction on the sites’ conservation objectives, will be undertaken with the competent authority. If the pipeline is deemed likely to have a significant impact on the designated sites (or if the impact is unknown and therefore needs further investigation) the Conservation (Natural Habitats) Regulations 1994 require that the competent authority undertakes the AA before consent is granted. Pipeline Safety Regulations – The HSE is currently consulting on extending the Pipeline Safety Regulations (SI 825/1996) to include carbon dioxide as a named substance. The pipeline must be designed in accordance with these regulations, on the basis that it will be a major accident hazard.
Pipeline - Pipelines Act 1962 – The on-shore section of the pipeline will be no more

214
Onshore than 10 miles (16 km) in length and will therefore be a local pipeline under the Pipelines Act 1962. Town and Country Planning Act 1990 – The construction of the on-shore section of the pipeline will require planning permission from Medway Council, there will be a single submission for both the pipeline and the AGI. Temporary construction sites, containing offices, stores and workshop facilities, are likely to be required during installation of the pipeline and AGI. These sites are usually Permitted Development under The Town and Country Planning (General Permitted Development) Order 1995. Environmental Impact Assessment – The on-shore section of the pipeline will fall under Schedule 2 of the Town and Country Planning (Environmental Impact Assessment) (England and Wales) Regulations 1999. Other Notices, Consents, Licences and Authorisations – likely to include: assent for works affecting a Site of Special Scientific Interest; licences for work affecting protected species; Flood Risk Management Consents; consent under the Coast Protection Act 1949 and the Food and Environment Protection Act 1985 for works in the intertidal area; Abstraction Licence for abstraction of water for hydrostatic testing; Conservation Notice and Water Transfer Notice for dewatering during construction; Discharge consent for temporary discharges during construction.
They chose the shortest route, which posed the fewest environmental and technical feasibility issues. The ES provides an assessment of the impacts of the steel pipeline (~11km in length), and environmental studies were carried out on ecology, landscape, noise and land quality issues. A further desktop study was also done to confirm the proposed route.
Pipeline - Offshore
Pipeline Works Authorisation, Deposit Consent and Consent to Locate – Under the Petroleum Act 1998 a "works authorisation" means an authorisation: for the works for the construction of a pipeline & for such works and for the use of the pipeline. Petroleum Operations Notice (PON) 15C – forms that the oil and gas
PWA will cover only the section of the pipeline, so the development will also require a FEPA licence and “Consent to Locate” for the intertidal area.
215
industry uses to apply to DECC for a permit to use and/or discharge chemicals offshore. The PON 15 that relates to chemicals used during the construction, hydrotesting and commissioning of pipelines is the PON 15C. It applies particularly to chemicals added to hydrotest water, and to chemicals that are pumped during de-watering and commissioning of pipelines. Environmental Statement – essential to submit an environmental statement for the offshore pipeline under the Petroleum Production and Pipelines (Assessment of Environmental Effects) Regulations (1999) (as amended), it is mandatory to submit an Environmental Statement (ES) in respect of pipelines of 800mm diameter and 40 kilometres or more in length to the Department of Energy and Climate Change (DECC). Other Consents – Individual commercial consents will also be required for pipeline crossings from the owners of existing submarine pipelines and cables. No Crown Estate lease is required for the route of the pipeline in the offshore area outside the twelve mile limit around the UK as no exclusive rights are vested in the Crown in relation to the laying of pipelines on the Continental Shelf. However, within the twelve mile limit of the UK territorial sea, the route of the pipeline will require a Crown Estate lease as the Crown is the land owner in that area.
E.ON couldn’t include this in the ES for the offshore platform as the exact platform location was unknown at the FEED stage. They predicted some offshore survey work (storage reservoir, environmental conditions) would be needed to complete this ES.
Storage
DECC CO2 Storage Licence (under the Energy Act 2008) – would convey a general permission to conduct intrusive exploration, subject to specific consent for the drilling of any well. It will also convey an exclusive but time-limited right to apply for a storage permit. The storage permit in turn will convey permission to construct facilities, including any offshore installation, and to conduct storage operations. Licence phases as follows:
- Stage 1: Initial non-intrusive exploration (“exploration licence”); - Stage 2: Intrusive exploration and test injection (“DECC CO2
Further work would have been required to obtain the storage consents.
216
Appraisal Licence”, “EU CCS Exploration Permit” ); - Stage 3: Carbon Storage (“DECC CO2 Storage Permit”); - Stage 4: The post closure licence
Crown Estate Lease – A lease granted by The Crown Estate will have defined geographical boundaries. As a condition of the lease, the developer will be required to apply to DECC for a licence for storage which will provide the framework for regulatory consent for the physical activities at the site, for example drilling and facilities construction. Consent to locate facilities – required when a development will locate any facilities offshore. This includes CO2-related pipelines and facilities. Section 34 of the Coast Protection Act 1949 extended by the Continental Shelf Act 1964 provides that where obstruction or danger to navigation is likely to result, the prior consent of the Secretary of State is required for the siting of a drilling or offshore installation or a pipeline, in any part of a designated area of the UKCS. Such consents may be issued subject to conditions the Secretary of State feels appropriate. Storage operation consents – several specific consents are referred to in the Licensing regulations The Offshore Installations (Safety Case) Regulations 2005
Consent to drill wells
Environmental consents – All carbon storage projects will require environmental impact assessment under the terms of the Offshore Petroleum Production and Pipelines (Assessment of Environmental Effects) Regulations 1999 [the EIA Regs], which will be amended to specifically
A Crown Estate lease would be required for pipeline sections no further than 12miles from a UK shore. Expected to have a similar structure to existing petroleum production licences. (Energy Act has removed the requirement for a Food and Environment Protection Act (FEPA) Licence, or Licences, for storage developments, as regards English waters.)
217
Environmental philosophy [2] – Summary
The key environmental objectives of this project are: • Adopt an integrated approach to design that offers the solution with the least impact to the environment, taken as a whole; • Minimise resource use during build and subsequent operation; • Use of sustainable solutions, including selection of renewable, reused and reusable materials where technically feasible; • Operating efficient power plant – (loss of efficiency has impact on bottom line and triple bottom line);
Area Details Relevant information
Identifying Sustainable Design Solutions
Environmental principles to be adopted to cover: energy efficiency; climate change; water use efficiency; selection of materials; environmental enhancement; pollution control. Using the Blueprint tool to deliver best environmental practice during design, build and operation of the Kingsnorth CCS project.
Blueprint model – site-orientated model made up of 16 key business process end-states. It sets out target activities that are expected at a UK Generation plant and acts as a tool to capture and disseminate up-to-date best practice.
Identifying Environmental Risks
Hazard Identification Study (HAZID) – Environmental impacts associated with the project will be identified early in the design process during FEED 2 and the study will consider gaseous, liquid and solid emissions (consideration will be made
Will appoint Environmental Advisor from the Generation Environment Team to input into this work.
New Field Development
cover carbon storage activities. Drilling Operations
Other Environmental Permits – required for the following processes: Seismic operations; Drilling Operations; Working over a well; CO2 test injection; Suspended well re-entry and remediation ; Well abandonment; Decommissioning
218
to both point source emissions and fugitive emissions). This Environmental Impact Identification Study will be undertaken as part of a wider HAZID study [3]
Hazard and Operability Study (HAZOP) – will be undertaken just before the ‘design freeze’ stage to identify operability problems which have potential to lead to safety or environmental hazards. It is not expected that this study will highlight major hazards which result in significant redesign as any significant environmental hazards will have been identified during the earlier HAZID study thus allowing appropriate mitigation to be incorporated into design.
Assessment of Environmentally Critical Plant (ECP) – to assess the environmental risks associated with plant failure, identify critical plant items and establish a suitable maintenance strategy. The assessment will adopt the following process:
- Review of operations to identify items of plant that by failure will have an impact on the environment and/or will result in a breach of permit requirements;
- Perform a series of studies to identify the environmentally critical plant items that pose a risk through failure;
- Develop a maintenance strategy for environmentally critical plant items.
Environmental Impact Assessment (EIA), Major Accident Hazards &
COMAH – part of planning requirements, a full EIA is being undertaken to identify all environmental risks associated with the construction and operation of the CCS plant and new Coal Fired Power Station and to establish suitable mitigation measures. A Major Accident Hazard Assessment dealing with pipeline impacts and a pre-construction report required under the COMAH regulations will also be prepared prior to planning application submission.
Will appoint Environmental Advisor from the Generation Environment Team to input into this work ECP is a process developed by the E.ON UK Generation Environment Team
Managing Environmental
Construction – approach to managing environmental risks during construction projects is outlined within the Generation Environmental Management System
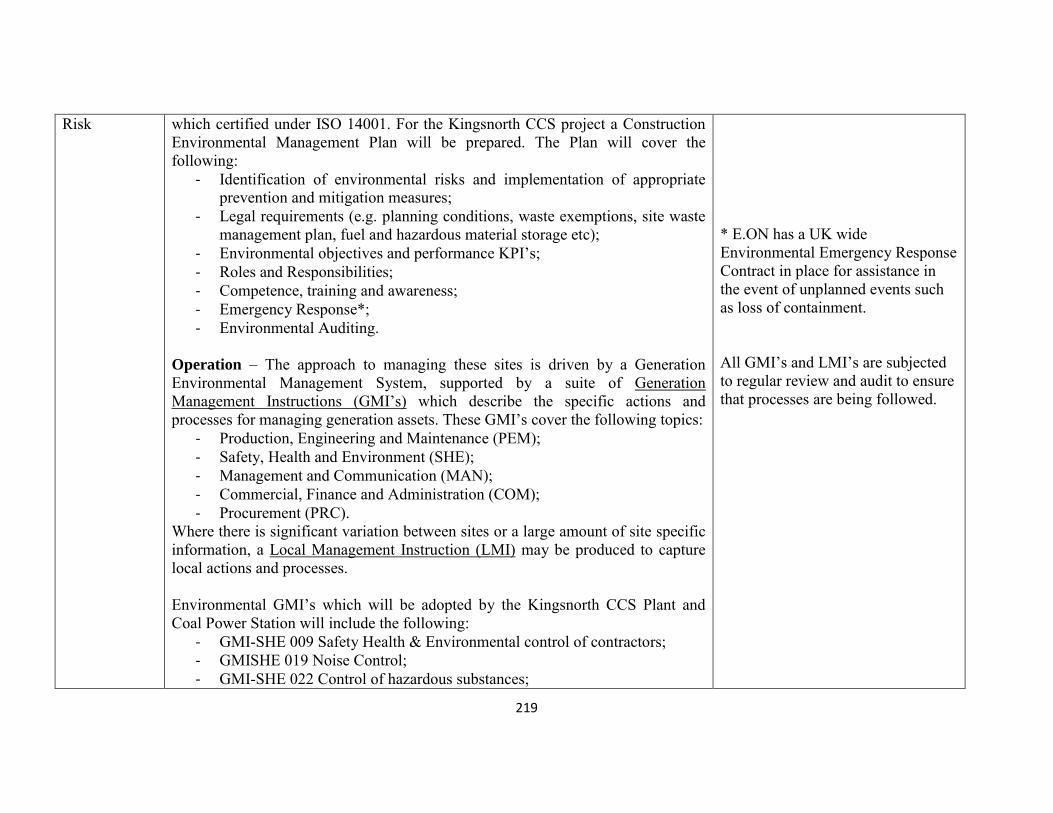
219
Risk which certified under ISO 14001. For the Kingsnorth CCS project a Construction Environmental Management Plan will be prepared. The Plan will cover the following:
- Identification of environmental risks and implementation of appropriate prevention and mitigation measures;
- Legal requirements (e.g. planning conditions, waste exemptions, site waste management plan, fuel and hazardous material storage etc);
- Environmental objectives and performance KPI’s; - Roles and Responsibilities; - Competence, training and awareness; - Emergency Response*; - Environmental Auditing.
Operation – The approach to managing these sites is driven by a Generation Environmental Management System, supported by a suite of Generation Management Instructions (GMI’s) which describe the specific actions and processes for managing generation assets. These GMI’s cover the following topics:
- Production, Engineering and Maintenance (PEM); - Safety, Health and Environment (SHE); - Management and Communication (MAN); - Commercial, Finance and Administration (COM); - Procurement (PRC).
Where there is significant variation between sites or a large amount of site specific information, a Local Management Instruction (LMI) may be produced to capture local actions and processes. Environmental GMI’s which will be adopted by the Kingsnorth CCS Plant and Coal Power Station will include the following:
- GMI-SHE 009 Safety Health & Environmental control of contractors; - GMISHE 019 Noise Control; - GMI-SHE 022 Control of hazardous substances;
* E.ON has a UK wide Environmental Emergency Response Contract in place for assistance in the event of unplanned events such as loss of containment. All GMI’s and LMI’s are subjected to regular review and audit to ensure that processes are being followed.

220
- GMI-SHE 038 Register of Health, Safety & Environmental Law; - GMI-SHE 041 Environmental management system; - GMI-SHE 043 Management of waste and by-products; - GMI-SHE 044 Environmental Permitting Requirements; - GMI-SHE 045 Environmental incident management; - GMI-SHE 046 EU Emission trading scheme tracking & verification; - GMI-SHE 047 Land management; - GMI-SHE 048 Climate change adaptation; - GMI-SHE 049 Environmental reporting.
A SHE Manager will be appointed to oversee the day to day environmental management of the site.
Environmental Statement [4]
An analysis of the implications of the proposal to construct and operate the new units and associated abatement technology. This Environmental Statement (ES) is presented in three main sections: Part 1: Introduction – the background to the project is reviewed in the context of consent procedures and the planning framework. Part 2: The Site and the Project - considers aspects of the supercritical coal-fired plant design and the construction phase for the proposed new units. Part 3: Environmental Impact Assessment – details the effects of the proposed new units on the environment in terms of emissions, site ecology and history, visual aspects, noise, flood risk, traffic and the socio-economic implications for the local community. Part Topics covered Details Any issues?
1. Intro. E.ON the company Introduction on the company, the need for low carbon technologies and E.ON actions to address this (all activities including those outside

221
CCS) Consents procedure Brief description of the main consents needed to apply for to proceed
with work
Environmental statement Brief explanation of ES, including a list of items that will need to be included. Includes list of parties involved/consulted
Planning framework Looks at Medway Local Plan Adopted Version 2003, Medway Core Strategy Issues and Options Report, Medway’s Local Transport Plan 2006-2011.
2. The site and the project
The site Location, access, general site description, site history
Choosing Kingsnorth Looks at the need for new power stations, choice of a coal-fired plant, choice of this site in particular
Existing units at Kingsnorth Very brief description on the units at Kingsnorth
Power generation concepts Gives an introduction then details conventional thermal power plants and supercritical coal-fired power plants,
New units at Kingsnorth Gives an outline of the proposed plant (foundations, temporary contractors’ laydown, plant specifics, typical buildings/plant, and a lot of information on environmental equipment)
Construction Describes typical construction activities that will take place (site prep, piling, civil engineering, steel erection, mechanical plant)
3. EIA Air quality Brief detail on air quality, air quality standards (including effect on human health), significance criteria, existing baseline air quality, assessment methodology, human health impact assessment (and results depending on different scenarios), other impacts (plume visibility, dust, climate change etc.) and conclusions)
Water quality Looks at: cooling water (CW) system; water treatment plant (desalination); FGD waste water treatment plant; flue gas polishing for the carbon capture and storage (CCS) plant; air pre-heater wash water; condensate polishing plant; site drainage. Also considers environmental quality standards for the Estuary, existing environmental conditions, impact assessment (including temp change and construction impacts) and also discusses mitigation
Nearby Medway Estuary saltmarshes and mud flats are designated as a Special Protection Area (SPA) under the

222
Wild Birds Directive (92/43/EEC)
By-products and solid waste Section describes the by-products/solid wastes produced as a result of constructing/ operating Units 5& 6, and means of their disposal. Looks at generation of by-products and waste (during construction and operational impacts), as (furnace bottom ash, pulverised fly ash), FGD gypsum, filter cake, ash sales, reclaimer sludge.
Flood risk Describes the existing flood prevention measures in place (and those underway), water level potentials, previous Flood Risk Assessments (FRA) carried out in 2003 and 2006. Decides that with some maintenance work the site would be safe from flooding.
A large proportion of the power station main buildings are within 100m of the estuary lying within the functional floodplain
Ecology Terrestrial ecology – objectives of ecological impact assessment, legislative and planning policy context, national planning policy and legislation, local plan/development framework, biodiversity action plans, consultations and review of data Field survey methodologies – habitat, newt, water vole, badger, bird and reptile surveys described in this section Baseline description - description and evaluation of baseline conditions for the EcIA, based upon consultation and the results Ecological evaluation – criteria used, features of local/national/international value, protected species, features of EcIA Ecological Impact Assessment – considers the potential impact from construction and operation of two new units and the CCDP at the site Mitigation – in principle there were no ecological constraints found, but there is potential for some impacts of significance at a local scale, and so mitigation measures are proposed in this section Aquatic ecology – species in area, potential impacts
There is a vast amount of data on the terrestrial ecology. Document ref. 4, page 163.
Landscape/visual impact Section presents the assessment of the effects of the development.

223
assessment Includes a summary of the methodology used, details of the development proposal (potential landscape and visual effects), description and analysis of the existing landscape and visual baseline, and description of the impacts and assessment of the effects of the proposed development on the landscape and on visual receptors.
Transportation An assessment of the likely significant effects of the predicted traffic impact of the proposed development on the environment. Includes parts on policy context, assessment methodology, transport baseline conditions, the development proposal, assessment of traffic impact, analysis of sensitive environmental receptors and mitigation measures. There is also a stand-alone transport assessment (appendix F of document)
Noise This section presents: the methodology; the significance criteria adopted; the baseline conditions; the mitigation measures that will be adopted; the potential environmental noise levels and a quantification of the significance of the impact. Looks at noise in construction, commissioning and operation stages
Socio-economic effects (In the Medway area). Looks at employment associated with the new development
Cultural heritage Carried out an archaeological desk-based assessment of the development site. Section contains information on desk-based assessment of the site, an assessment of the site’s geoarchaeological potential, a geophysical survey of the site and results of a field investigation. The section also covers mitigation scenarios
Land quality/contaminated land assessment
This chapter presents an assessment of land quality at the site and the associated risks to human health and the environment. The section describes physical aspects of the site (geology, hydrogeology, hydrology, and existing drainage), looks at the planning/legislative context, the assessment methodology, baseline conditions, groundwater conditions/contaminations.

224
(H&S) Short description of the management plans that will be developed, and lists the main regulations for HSE:
- The Control of Industrial Major Accident Hazards (CIMAH) Regulations
- The Control of Substances Hazardous to Health (COSHH) Regulations
- Regulatory Reform (Fire Safety) Order 2005.

225
Environmental Statement – Onshore Pipeline [5]
The proposed pipeline was planned to run from E.ON’s Kingsnorth Power Station to the Hewett Gas Field in the Southern North Sea. This Environmental Statement (ES) covers the onshore section of the Kingsnorth CCS pipeline. This statement is a culmination of a series of studies, surveys and consultations with various bodies in order to describe the nature of the existing environment, identify the possible impacts of the works on the environment, plan mitigation measures to prevent/reduce adverse impacts and to assess the scale and nature of the residual impacts on the environment. Please note there is also a non-technical ES for the onshore pipeline [6].
Environmental Statement – Offshore Pipeline [8]
This Environmental Statement (ES) covers the offshore section of the CCS pipeline, which was proposed to run from the E.ON Kingsnorth Power Station to the Hewett Gas Field in the Southern North Sea. The onshore ES covers from the Station to the low water mark and the offshore ES from the low water mark to potential injection point. The 36” offshore pipeline will run approximately 270 km from the shoreline to the Hewett field.
Document
area
Section Information given
Volume one
Introduction Project background, the CCS pipeline, EIA, pipeline EIA process.
Planning Policy Looks at legislative requirements, planning policy, planning constraints, applications and consents, land rights.
Project Description Onshore pipeline, design specs, detailed route information, construction, schedule, environmental management, pre-commissioning, operation, resource consumption, maintenance, decommissioning.
Project Alternatives Looks at no project option, method of transportation, route selection, coastal AGI site selection, construction methodology.
Physical Environment Detail on legislation and policy context, assessment methodology, baseline overview, assessment of impacts, mitigation, and significance of impacts.
Ecological Environment Legislation and policy context, assessment methodology and uncertainties, baseline overview, assessment of impacts, mitigation, significance of impacts.
Archaeology and Cultural Heritage
Detail on professional standards, legislation and policy context, assessment methodology and uncertainties, baseline overview, assessment of impacts, mitigation, and significance of impacts.
Landscape and Visual Impact Assessment
Looks at legislation and policy context, assessment methodology and uncertainties, baseline overview, assessment of impacts, mitigation, and significance of impacts.
Air, Noise and Emissions same as above Traffic and Transport Key legislation, planning policy, assessment methodology

226
or uncertainty, magnitude of change, significance of impact, technical difficulties, baseline overview, road network, railways, impacts of development, during construction, mitigation, etc.
Human Environment Looks at legislation and policy context, assessment methodology and uncertainties, baseline overview, assessment of impacts, mitigation, and significance of impacts.
Cumulative Impacts Assessment methodology, cumulative developments, assessment of potential cumulative impacts (construction and operation), and development outline.
Environmental Management
Detailed design, external communications, project environmental management, environmental auditing, environmental training, environmental monitoring, management post-construction and operation.
Appropriate Assessment Signpost Document s
Volume two (appendices)
Appendix A: Scoping Responses Appendix B: Planning Policies Table Appendix C: UXO Report Appendix D: Baseline Ecological
Surveys and Information Appendix E: Archaeological Baseline
Surveys and Information Appendix F: Landscape and Visual
Assessment Photographic Plates Appendix G: Noise Assessment Appendix H: Traffic Assessment
These appendices contain vast amounts of information on the environmental considerations of the onshore pipeline. [7].
Section Information given
Introduction Background to the project, project outline, location, Kingsnorth pipeline, EIA, pipeline EIA
Legislation and consents Legislative requirements, European Directives, other legislation/requirements, consents for other parts of project, planning policy
Description of proposed development
Offshore pipeline route, design specs, control/protection systems, construction, pipeline installation, landfall, pre-commissioning and commissioning, operation, decommissioning
Project alternatives Same as onshore, see above Physical environment Assessment methodology, scope, marine physical baseline
conditions, impacts on marine physical environment, residual impacts and significance.
Ecology Similar to onshore, see above Archaeology and culture Similar to onshore, see above Navigation Assessment methodology, scope, baseline (navigational
features, ship info, vessel destinations, shipping density etc.), potential impacts (during construction and operation), mitigation (construction/operation), residual impacts (construction/operation)

227
Noise and vibration Assessment methodology, baseline, potential impacts, mitigation, residual impacts
Air quality A qualitative assessment of potential air quality impacts associated with the installation and operation of the marine section of the CCS pipeline. (Methodology, baseline, impacts, mitigation).
Socio-economics Assessment methodology and uncertainty, baseline overview (settlements, commercial fisheries, other), potential impacts and proposed mitigation
Cumulative impacts Scope, methodology, developments, potential impacts (of pipeline, other developments), cumulative impacts (air quality, archaeology, ecology, navigation, noise/vibration, physical environment, socio-economics, operational stage
Environmental management Detailed design, external communications, management during construction, post-construction and operation.
Environmental Risk Assessment [9]
The Risk Assessment (RA) holds 10 pages on the process undertaken for environmental concerns, looking at the offshore section of the operations. The approach to risk assessment is not specific to the environment and follows a standard process. This process looks at the identification of the potential hazard, an assessment of the exposure or concentration of the pollutant in the environment, the likely effect on the environment and the characterisation of the risk. The document contains little specific information on the E.ON offshore RA as it is merely a plan for the future assessment. The introduction contains the scope of this risk assessment document, definitions and abbreviations used. The Environmental Risk Assessment section looks at non- project-specific information such as the likelihood, consequence, establishment of risk, objective and performance. The third section (slightly more specific but still no details) looks at the RA process, hazard identification (HAZID), assessment and mitigation, and the HAZOP process.
Summary
The ScottishPower FEED documents give more of a summary of the regulation work undertaken during FEED to achieve the legal requirements needed to progress forward. The consents and licences register is a key source of information here, a comprehensive piece looking at all relevant consents, permits and licences that may be required. The E.ON UK Consents and Environment section is a very in-depth and detailed package of all materials produced in the FEED stages. A key aspect identified was that there were significant uncertainties at the outset of the programme regarding consents required. Some of this uncertainty is clear throughout, in particular when looking at the offshore platform and storage. There is a vast amount of information available on this in the E.ON FEED material.

228
References
No. Report Name Document
No. 1 Kingsnorth FEED, Consenting Philosophy 9.2 2 Kingsnorth FEED, Environmental Philosophy 9.3 3 Kingsnorth FEED, Health and Safety 8 4 Kingsnorth FEED, Kingsnorth Environmental Statement 9.4 5 Kingsnorth FEED, Complete Onshore Pipeline Environmental
Statement 9.7
6 Kingsnorth FEED, Onshore Pipeline ES non-technical Summary
9.8
7 Kingsnorth FEED, Complete Onshore Pipeline ES Volume 2 (Appendices)
9.7.1
8 Kingsnorth FEED, Offshore Pipeline Environmental Statement 9.10 9 Kingsnorth FEED, Environmental Risk Assessment 9.14
229
CHAPTER 10: HEALTH & SAFETY
10.1 Longannet Power Station to Goldeneye Reservoir CCS Demo Project
Health and Safety Documents produced:
Health, Safety & Environment section – FEED Close Out Report Full chain:
End-to-End Safety Review Generation and capture:
Project HSE report HAZID & Hazards Analysis report MAH summary report
Onshore transportation system: National Grid Summary report
Offshore transport and storage: Design HSE case
Health, Safety & Environment – FEED Close Out Report [1] During FEED, each Consortium Partner has followed their own internal methodologies for performance of hazard studies on their respective element of the CCS chain. In addition, National Grid carried out interface hazard studies with Shell and Scottish Power, ensuring that the review has covered the entire End-to-End CCS chain. An End-to-End system safety review workshop was also held to resolve any End-to-End actions identified.
This chapter in the close out report provides information on how the Scottish Power CCS Consortium approaches the health, safety and environmental aspects of the End-to-End CCS chain and gives some background and key drivers to health safety and environmental aspects of carbon capture. A HSE summary document was produced, along with appendices looking at the details of all the CCS chain, specific to HSE (generation and capture – HSE report, HAZID analysis and MAH summary reports; onshore transportation – National Grid HSE summary report; offshore transport and storage – design HSE report). End-to-End Safety Review This document [2], completed by Mott MacDonald, briefly covers the programme status, requirements and scope before looking at the system safety review process, hazard studies undertaken and end-to-end safety review. This review was considered to be the most efficient way to ensure that the entire CCS chain has been reviewed to an appropriate level. Some of the main issues raised in the End-to-End HAZID, HAZOP and SIL (Safety Integrity Level) studies together with the End-to-End safety review are summarised below, along with the mitigation plans for each potential risk:

230
Area/Study Issues raised Mitigation
Cross Consortium HAZID
Risk of asphyxiation from CO2 present at base of cooling tower (and during routine inspections/maintenance)
Put entry precautions in place plus installing CO2 and O2 detectors (plus appropriate design, good ventilation and provision of training)
Risk of cold burns to personnel and low temperature damage to equipment (expansion of CO2 during depressurisation, venting or leakage events)
Thermal insulation on cold surfaces, material selection for low temperatures and installation of CO2 and/or low temperature detectors for leaks
CO2 from a leak could affect personnel on site/adjacent sites and have a detrimental effect on the public/environment.
Dispersion modelling has been undertaken during FEED
Failure of process plant or pipelines could result from deviation of operating parameters outside the design envelope
Measurement of key process parameters and the installation of appropriate control measures
Failure of pipelines can be caused by out of specification CO2 due to effects such as corrosion and running ductile fracture
Specification of the CO2 quality which can be exported from Longannet, quality monitoring and installation of a venting system to prevent out of specification CO2 entering the Onshore Transportation System
Cross Consortium HAZOP (Hazard and Operability Study)
Water content in CO2 can result in corrosion and possible hydrate formation
Specifying the maximum water content in the CO2, monitoring the water content before export from Longannet
Volatile compounds in the transported CO2 could result in running ductile failure of the dense phase pipeline
Specifying CO2 composition limits, monitoring the composition at export from Longannet and venting out of specification CO2
Particulates in the CO2 can accumulate, cause erosion and potentially block the reservoir and consequently restricting injection
Maximum particle size has been defined in the CO2 specification
Loss of CO2 containment occurs due to leakages
Correct material selection and appropriate procedures for maintenance and shut-downs
Loss of utilities at Longannet will impact on the CO2 capture rate
A number of actions were defined to identify mitigations to maximise availability
The overpressure of the Onshore Transportation System if the capture plant compressors were delivering against a closed valve in the pipeline
Specify a HIPPS (high integrity pressure protection system) at the interface to protect both systems Backflow from the Onshore Transportation
System to pass through a stationary compressor and overpressure the low pressure part of the capture plan
Cross Consortium SIL
SIL studies were performed for the capture plant, Onshore Transportation System (including the Blackhill Compressor Station), offshore pipeline, Goldeneye platform and injection wells. No additional issues were identified at the End-to-End safety review so it was considered that the various SIL studies had adequately reviewed the End-to-End CCS chain for the FEED stage of the design process.
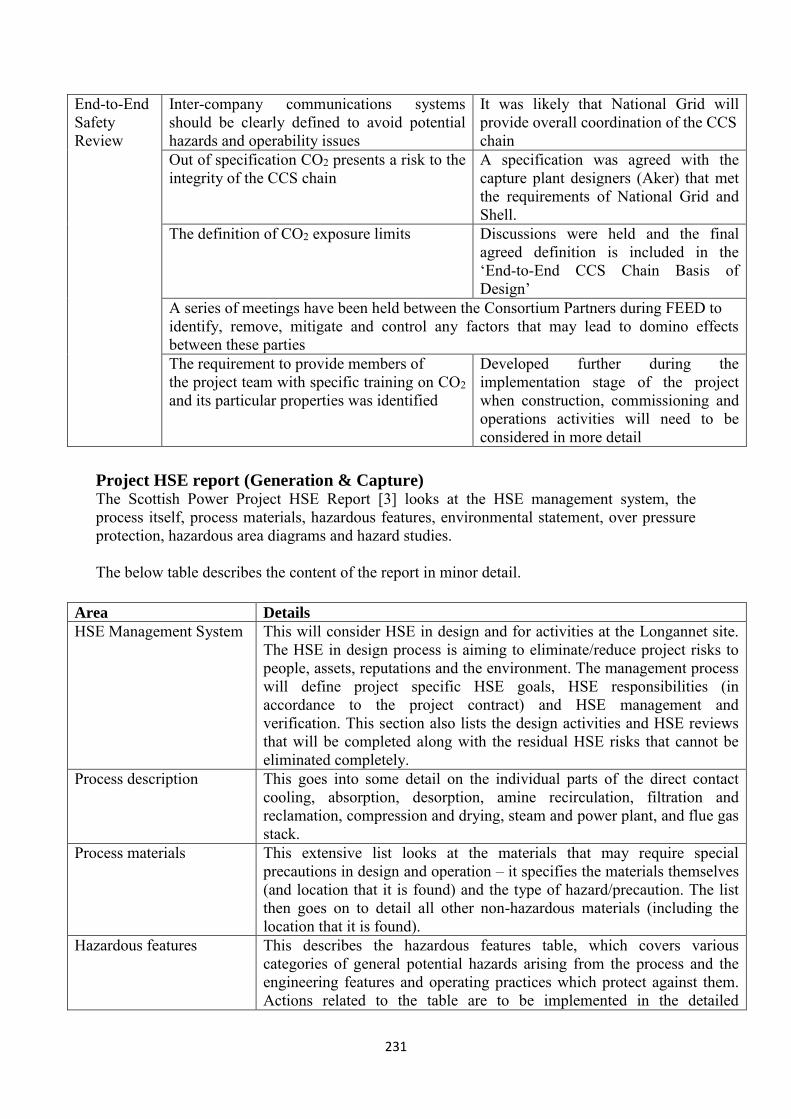
231
End-to-End Safety Review
Inter-company communications systems should be clearly defined to avoid potential hazards and operability issues
It was likely that National Grid will provide overall coordination of the CCS chain
Out of specification CO2 presents a risk to the integrity of the CCS chain
A specification was agreed with the capture plant designers (Aker) that met the requirements of National Grid and Shell.
The definition of CO2 exposure limits Discussions were held and the final agreed definition is included in the ‘End-to-End CCS Chain Basis of Design’
A series of meetings have been held between the Consortium Partners during FEED to identify, remove, mitigate and control any factors that may lead to domino effects between these parties The requirement to provide members of the project team with specific training on CO2 and its particular properties was identified
Developed further during the implementation stage of the project when construction, commissioning and operations activities will need to be considered in more detail
Project HSE report (Generation & Capture) The Scottish Power Project HSE Report [3] looks at the HSE management system, the process itself, process materials, hazardous features, environmental statement, over pressure protection, hazardous area diagrams and hazard studies. The below table describes the content of the report in minor detail.
Area Details
HSE Management System This will consider HSE in design and for activities at the Longannet site. The HSE in design process is aiming to eliminate/reduce project risks to people, assets, reputations and the environment. The management process will define project specific HSE goals, HSE responsibilities (in accordance to the project contract) and HSE management and verification. This section also lists the design activities and HSE reviews that will be completed along with the residual HSE risks that cannot be eliminated completely.
Process description This goes into some detail on the individual parts of the direct contact cooling, absorption, desorption, amine recirculation, filtration and reclamation, compression and drying, steam and power plant, and flue gas stack.
Process materials This extensive list looks at the materials that may require special precautions in design and operation – it specifies the materials themselves (and location that it is found) and the type of hazard/precaution. The list then goes on to detail all other non-hazardous materials (including the location that it is found).
Hazardous features This describes the hazardous features table, which covers various categories of general potential hazards arising from the process and the engineering features and operating practices which protect against them. Actions related to the table are to be implemented in the detailed

232
engineering phase of the Project. Environmental statement This section of the Project HSE Report looks at environment protective
measures and noise and vibration. The environment protective measure focuses on gaseous emissions, liquid discharges, drainage and contaminant and solid waste. The noise and vibration looks at the predicted noise levels – in the Longannet case, the predicted capture plant community noise level is 5 dB below baseline conditions for the existing power station.
Over pressure protection This defines the relief and venting philosophy and describes the measures the design process will look at to ensure the chance of a relief over pressure event is eliminated or the relieving flow rate is reduced to be as low as practically possible.
Hazardous area diagrams This classification covers the potential sources of flammable release at the site. This table is populated with the grade of release (continuous, primary or secondary), fluid category, type of ventilation (natural or artificial), degree of ventilation and the extent of the hazardous area.
Hazard studies HAZID Study – ScottishPower carried out a generic node-by-node HAZID, using preliminary base case information. Coarse (preliminary) HAZOP Study – A full HAZOP study has not been carried out, this preliminary study was intended to ensure that the significant risks have been identified for consideration in detailed design and for discussion. SIL Assessment – A complete SIL has not been carried out, instead a preliminary assessment has been completed on less well-developed P&IDs with no vendor data, by a competent SIL assessment facilitator.
HAZID & Hazards Analysis report (Generation & Capture) The ScottishPower Consortium HAZID study was carried out over four days to identify the significant generic hazards of the capture plant. A number of actions were determined in the HAZID process and many actions have been established to ensure that there is sufficient information available to support the preliminary or detailed design phases, as applicable, or to ensure that certain considerations are taken into account when progressing through the design process [4]. This report contains the output of the hazard identification (HAZID) study completed to identify the significant generic risks for the ScottishPower Consortium carbon capture plant. The below table summarises the outcomes from the HAZID study:
Area Details
Objectives The aim is to help identify significant generic hazards, operability problems and process hazards to allow mitigation/protective measures to be incorporated in the later stages of the design process
Methodology This is based on ScottishPower procedures. The HAZID study is completed through the use of keywords to prompt discussion on potential hazards within the process and operations, on sections of the plant, called nodes. Five tables are used (keywords for HAZID, nodes assessed, harm word models, likelihood and risk categories) to assess the potential hazards [4.1]

233
HAZID Identification [4.2]
CO2 Compression, Drying and Handling – looks at the hazards that could arise from overpressure, access and loss of containment, contamination, corrosion, temperature extremes and venting Amine Handling – looks at loss of containment DCC and Flue Gas – no hazards were identified for this particular node Absorber/Stripper – generic hazards were identified in this node within the areas of overpressure, access and loss of containment and equipment failure Capture Plant Drainage System – access, loss of containment and contamination were the main areas that generic hazards were identified here Adjacent LPS (Longannet power station) and SPS (steam and power supply plant) – the main hazard in this node was determined to be explosion.
HAZID Study Actions The main actions that arose from this HAZID study are recorded in tables for each node [4.3].
MAH summary report (Generation & Capture) The Major Accident Hazard report [5] was undertaken for the capture facilities located at the Longannet site. This review identified the major hazards on site and gave an indication of the risks/consequences of the main hazards identified. This document summarises the MAH review undertaken during the FEED study, and is further summarised briefly in the below table.
Area Details
Requirements of the Major Accident Hazard Report
In terms of scope, this review is only concerned with the carbon capture aspects of the project at Longannet site. All other areas would have been subject to separate MAH reviews. The MAH was carried out alongside the other health and safety reviews (HAZID, HAZOP and SIL studies).
Outline of the Carbon Capture Plant Environs
This section briefly introduces the site location and local population (including information on the on-site population, other local COMAH sites, local weather conditions and local environment).
Outline of the Carbon Capture Process
This outline gives brief information on the layout of the capture plant, flue gas treatment and various information on the CO2-related processes – including absorption, strippers, compression, drying and oxygen removal, and CO2 specification. The outline also provides further information on the capture plant, including the auxiliary plant, control philosophy and site boundaries.
Safety Management Systems (SMS)
An overall SMS was to be developed for the project as a whole to provide a unified approach to safety across all project interfaces. ScottishPower maintains a Policy Statement on Health and Safety for Longannet Power Station, which will also apply to the capture plant – covering all health, safety and welfare issues to ensure compliance with various legislation and approved guidelines.
Identification of Potential Major Accident Hazards
The various hazardous substances on site section looks at CO2 and amines in particular, along with briefly identifying other harmful substances. A specific MAH/HAZID meeting was held to identify the potential major accident hazards that could result from the operation of the capture plant. The key MAHs to be considered were as follows: - CO2 dispersion - Natural gas release
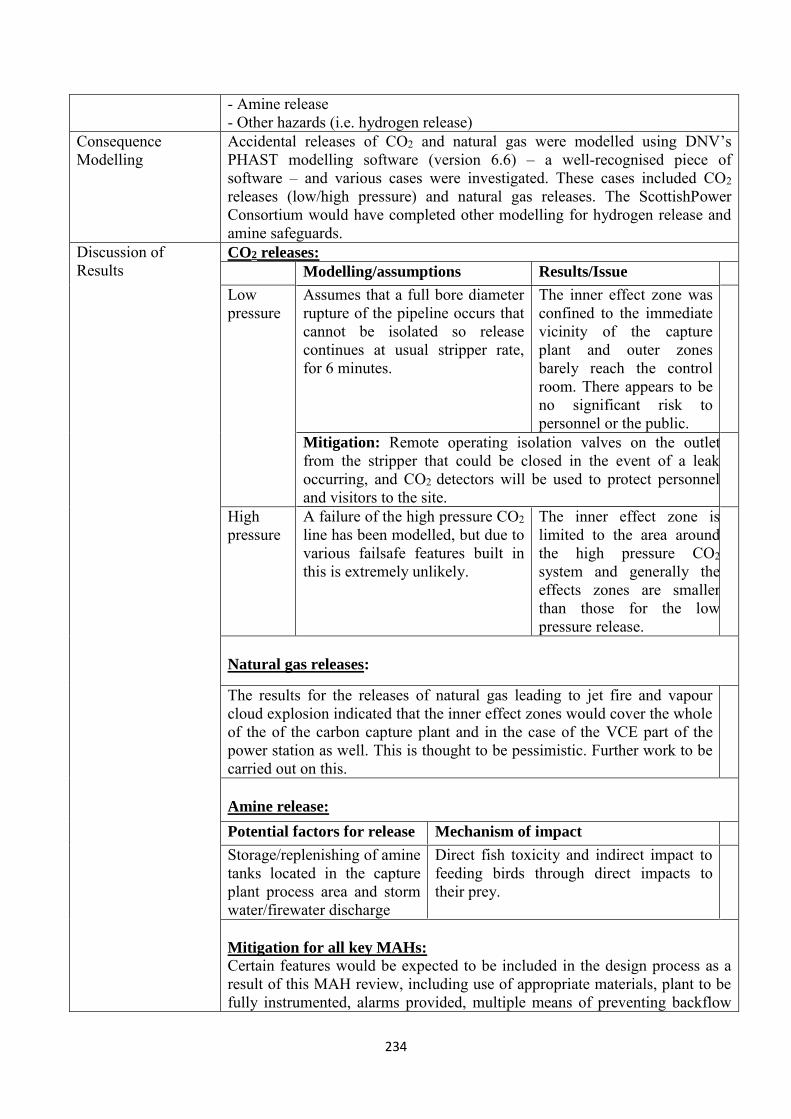
234
- Amine release - Other hazards (i.e. hydrogen release)
Consequence Modelling
Accidental releases of CO2 and natural gas were modelled using DNV’s PHAST modelling software (version 6.6) – a well-recognised piece of software – and various cases were investigated. These cases included CO2 releases (low/high pressure) and natural gas releases. The ScottishPower Consortium would have completed other modelling for hydrogen release and amine safeguards.
Discussion of Results
CO2 releases:
Modelling/assumptions Results/Issue
Low pressure
Assumes that a full bore diameter rupture of the pipeline occurs that cannot be isolated so release continues at usual stripper rate, for 6 minutes.
The inner effect zone was confined to the immediate vicinity of the capture plant and outer zones barely reach the control room. There appears to be no significant risk to personnel or the public.
Mitigation: Remote operating isolation valves on the outlet from the stripper that could be closed in the event of a leak occurring, and CO2 detectors will be used to protect personnel and visitors to the site.
High pressure
A failure of the high pressure CO2 line has been modelled, but due to various failsafe features built in this is extremely unlikely.
The inner effect zone is limited to the area around the high pressure CO2 system and generally the effects zones are smaller than those for the low pressure release.
Natural gas releases:
The results for the releases of natural gas leading to jet fire and vapour cloud explosion indicated that the inner effect zones would cover the whole of the of the carbon capture plant and in the case of the VCE part of the power station as well. This is thought to be pessimistic. Further work to be carried out on this.
Amine release:
Potential factors for release Mechanism of impact Storage/replenishing of amine tanks located in the capture plant process area and storm water/firewater discharge
Direct fish toxicity and indirect impact to feeding birds through direct impacts to their prey.
Mitigation for all key MAHs:
Certain features would be expected to be included in the design process as a result of this MAH review, including use of appropriate materials, plant to be fully instrumented, alarms provided, multiple means of preventing backflow

235
of CO2 from the export pipeline, on-site emergency plan and detection/isolation systems should all be included (among others).
Conclusions and Recommendations
The MAH review is a preliminary examination of the risks associated with the proposed capture plant. It must be noted that the capture plant would not come under COMAH regulations as they are currently enacted (although CO2 is under consideration for inclusion in COMAH regulations) and CO2 is not to be stored on site. The effects of major pipework failure, potential accidents involving natural gas and the potential effects on the environment in case of an amine leak have been looked at in the review. The analysis at the FEED stage demonstrates that there are no reasons why these potential risks could not be demonstrated as tolerable and low as reasonably practical once the design is fully developed. In terms of recommendations, further work would be needed should the design reach a more mature stage. More detailed information would also be needed on the potential release of hazardous chemicals to the environment.
National Grid Summary report (Onshore Transportation System) [6]
This is a comprehensive reference document that looks at the process National Grid has followed during the course of FEED to identify potential hazards associated with the onshore transportation system for CO2. The below table is a brief summary of the summary report.
Area Details
Formal Process Safety Assessment (FPSA)
This looks at the methodology used for safety assessments and the identification of environmental hazards (HAZEL). The latter used a different methodology to usual safety assessments in that it focused on the materials being used/generated and potentially released from the operations, rather than using guidewords as a prompt. Similar to usual HAZID studies, the HAZEL looks at the likelihood and severity of such issues.
Hazard Identification (HAZID) and Hazard Analysis (HAZAN) Overview
This section discussed the identification of hazardous [6.1], hazards of CO2 and key hazards of CO2 processing. In the processing hazards, National Grid looks at health and safety, corrosion, rapid expansion, cooling and brittle fracture and dense phase CO2.
HAZID Studies The objective of the HAZID studies were to identify the hazards posed by the process, the materials used and the effects on the external environment. A number of studies were carried out to ensure full coverage of the transportation system. Key hazards were identified in the main plant areas – above ground installations (AGI), no. 10 feeder block valves and the compressor station.
HAZOP Studies The objective of the HAZOP studies is to identify the likelihood of an incident occurring by failures, misuse or mal-operation of the process and provide a qualitative assessment of the risks. Three studies were carried out (covering the pipeline, no. 10 feeder and compressor station) to determine the various risks that may arise and create action points to deal with them.
HAZCON Studies The hazards in construction (HAZCON) studies’ objective is to identify hazards likely to be encountered during the construction phase of the project and ensure mitigation measures are in place. The two HAZCON studies were

236
carried out looking at the new pipeline and compressor station. It was ensured that all health, safety and environmental issues were looked at and a comprehensive list of these hazards developed to be used during the construction process.
HAZEL Studies The HAZEL studies aim to identify the environmental hazards in each stage of the project – design and construct, operate and maintain. The Environmental Documents Register (appendix 10.5, [6]) outlines the source of the hazard, likely consequences and potential mitigation measures. The most significant potential hazards identified were: Hazard Mitigation
Silt run-off Catchment areas to contain run-off; filtering at the point of discharge; settlement lagoons (allows settling of silt before discharge); addition of chemical coagulents to aid silt settling.
Diesel oil spills Lockable dispensing points on bowsers; spill trays at dispensing points; low dead volume shut‐off on dispensing nozzles; emergency procedures in place.
Waste management
Waste to be stored under strict conditions; segregation of waste streams; waste skips should be covered and well-labelled; training given to all staff involved.
Stack gas emissions
The combustion technology will be a low NOX generation system that can achieve to NOX levels less that 50 mg/m3; combustion process will emit less than 100mg/m3 of carbon monoxide; stack dispersion will be designed to give an acceptable level of environmental impact at sensitive receptors.
Surface water contamination
Oils to be stored in suitably designed tanks; transfers/dispensers will be lockable and controlled by a responsible person; storage areas will be located at least 10 metres from any drains or watercourses; waste oils/contaminated materials stored in a similar manner to new stocks prior to disposal and in accordance with Waste Management Regulations.
Venting of CO2 Where possible, the inventory of CO2 in the system should be reduced by recompression/transfer to another part of the system before maintenance activities are undertaken; the inventory potential between key elements of the system should be minimised during the design phase to reduce the amount of CO2 that may need to be vented; compressor casings maintained under pressure when not in operation.
Leakage of CO2 Minimise the leaking sources – small bore compression fittings, valve stems, flanges.
Closeout Report and Action Summary
This looks at the major areas of concern identified during the FPSA. The main issues identified (and in need of further work) are as follows: - Leak detection - CO2 dispersion - Substances and inventory - CO2 analysis - Exposure limits - Testing and commissioning - Start up and shutdown - System control - Earthing - Surge impacts

237
- Pigging operations - Adjacent facilities/dwellings - Maintenance - Emergency response and planning - Design influence
Challenge and Review This section of the comprehensive document seeks to highlight the technical measures that the designers of the onshore transportation system have taken to ensure that risks to individuals and the environment are As Low As Reasonably Practicable (ALARP). This looks at how FEED has helped to reduce risks, in particular looking at the new pipeline and associated plant between the capture plant and the connection to the no. 10 feeder. The challenge and review section covers many areas, from the active and passive fire protection to the lifting, maintenance and operating procedures.
(Appendices) Guidewords (10.1) – Gives a table of the guidewords used in the HAZID, HAZOP and HAZCON studies
Safety and Risk Phrases (10.2) – A list of phrases used and appropriate codes
References (10.3) Onshore Transportation System Schematic (10.4) – Diagram of the onshore
transportation system Environmental Aspects Register (10.5) – Covers construction,
commissioning and operations
Design HSE case (Offshore transport & storage)
The overall objective of Shell’s Design HSE Case [7] is to demonstrate that risk reduction philosophies and measures have been developed and implemented at each phase to ensure that the risks are tolerable and ALARP. This was done through the systematic application of the Hazard and Effects Management Process (HEMP) – carried out at similar time to the MAH review. The following table briefly summarises the health, safety and environmental aspects of the Design HSE Case document:
Area Details
Description of facilities
This gives a brief introduction to the Goldeneye site and facilities, and goes on to give some detail on the existing infrastructure (reservoir, existing wells, platform, subsea design and gas terminal), well data, platform/subsea modifications and manning strategy.
Hazards & effects management process
Comprises four steps: a) identify hazards, threats and potential hazardous events; b) assess the risks against accepted screening criteria, taking into account the likelihood of occurrence and severity of the consequences to people, assets, the environment and reputation; c) implement suitable risk reduction measures to eliminate/control/mitigate the hazard/its consequences; d) plan for recovery in the event of a loss of control.
238
Shell looked at ALARP and risk tolerability, and the HEMP activities. Hazard identification A Hazard and Environmental Impact Identification workshop was
conducted (along with additional HAZID and ENVID workshops) with the objective of identifying the potential hazards associated with the proposed onshore and offshore facilities within the scope assigned to Shell. Along with these, one main HAZOP study was also carried out. The MAHs identified can be found in [7.1].
Major hazard discussion
This is a detailed discussion covering the effects of CO2 exposure, physical effects modelling, temporary refuge/evacuation/escape/rescue assessment, quantitative risk assessment, MAH assessment and containment risk hazard.
Risk reduction in design
The risk reduction looks at development options (reservoir selection, CO2 transportation, CO2 phase and CO2 compression), inherent safety, material selection, HSE philosophies and human factors in design. The HSE philosophies [7.2] cover layout, leak reduction, blowdown, relief, venting, construction, fire, hydrocarbon and CO2 detection systems, alarms, emergency shutdown, environmental protection, security and social performance.
Derogation register The design, engineering, procurement and construction of the UKCCS project shall be in accordance with the UK statutory law and regulations. Shell follows a hierarchy (order of precedence) for codes and standards applicable to projects (from UK statutory law and regulations to international codes and standards). To date no derogations have been raised against the approved projects codes and standards.
Safety critical elements & performance standards
Shell has reviewed their suite of SCEs (safety critical elements) to apply when when considering the introduction of the new MAHs associated with dense phase CO2. The only entirely new SCE identified is the need for CO2 detection for both onshore and offshore [7.3].
Further work Further work would be undertaken during detailed design to respond to the issues raised within the various HEMP studies.
EIA (Environmental Impact Assessment)
The aim of the EIA was to determine the potential impacts of the development on the environment and their significance. The initial screening assessment showed that the majority of the key activities are of low risk – although there are a number of aspects that are of moderate risk. Following the identification of suitable mitigation measures, these were reduced to ALARP.
ALARP summary This gives a very brief breakdown on the ALARP demonstration [7.4].
References
Number Reference
1 Scottish Power FEED Close Out report (SP-SP 6.0 - RT015) (Chapter 6) 2 UKCCS - KT - S3.1 - E2E – 001. End-to-End Safety Review 3 UKCCS - KT - S3.2 - ACC – 001. Project HSE Report 4 UKCCS - KT - S3.2 - ACC – 002. HAZID and Hazards Analysis Report
4.1 UKCCS - KT - S3.2 - ACC – 002. HAZID and Hazards Analysis Report. (Tables 5.1 – 5.5, pages 5 – 9)
4.2 UKCCS - KT - S3.2 - ACC – 002. HAZID and Hazards Analysis Report (Pages 9 – 13)

239
4.3 UKCCS - KT - S3.2 - ACC – 002. HAZID and Hazards Analysis Report (Pages 13 – 17)
5 UKCCS - KT - S3.2 - SP – 001. MAH Summary Report 6 UKCCS - KT - S3.3 - NG – 001. National Grid HSE Summary Report
6.1 UKCCS - KT - S3.3 - NG – 001. National Grid HSE Summary Report (Table 1, page 9) 7 UKCCS - KT - S3.4/3.5 - Shell – 001. Design HSE Case
7.1 UKCCS - KT - S3.4/3.5 - Shell – 001. Design HSE Case (Table 5.1, page 23) 7.2 ScottishPower Consortium UKCCS Demonstration Competition, HSSE-SP Philosophy 7.3 ScottishPower Consortium UKCCS Demonstration Competition, Safety Critical
Elements Report 7.4 ScottishPower Consortium UKCCS Demonstration Competition, ALARP Study Report

240
10.2 Kingsnorth CCS Demonstration Project
Health and safety documents produced:
HSEQ Full System Noise Protection Philosophy Dispersion Modelling Strategy ALARP Review Report for Genesis Scope of Work CDM Design Risk Register (containing Design Risk Assessments (DRAs)) HAZID Report (+Addendum) (more detail below) Consequence Assessment of CO2 Pipeline Releases Health and Safety Philosophy (more detail below)
Health & Safety Philosophy
This document broadly discusses the philosophy for the management of health and safety risk during and following design activities [1]. The main objective is to set out what measures will be taken to ensure that safety in construction and safety in operation will be built into the management of design at the outset. The following key success factors were recognised to achieve this objective: Early consideration to construction planning
Determination of high level approach to appropriate management of the construction phase by principal contractors who are experienced in the management of safety, security and co-ordination of construction projects both on- and offshore. Early engagement of construction management and contractors during the design phase.
Hazard identification (HAZID)
Systematic use of HAZID workshops during all stages of design and construction to ensure discussion and consultation within the project teams and to identify potential hazards that need to be managed, to record these hazards and consider which hazards can be reduced by appropriate design.
Operability reviews Use of structured hazard and operability (HAZOP) studies for review of designs to ensure operability and maintainability of critical process and flowing systems. HAZOP procedures must be carried out at the appropriate time within the later stages of FEED and detailed design. HAZOP review meetings will be recorded and comment records will be maintained. Finally, the HAZOP recommendations and follow up records will be compared at site during construction inspection and pre-commissioning to ensure that agreed HAZOP actions have been implemented before start up. For the offshore and other marine operations, the design process will also involve the use of Simultaneous Marine Operations (SIMOPS) reviews to ensure that the risks associated with simultaneous operations around the offshore platform and other marine activities are considered at the design stage.
Early construction planning and quality management
Early engagement of quality and construction management teams during the FEED and detailed design stage to ensure construction planning and quality management planning are integrated into the design, specification and procurement of services. Early engagement of supply

241
contractors will increase the time available for suppliers to plan work and give consideration to designing safety into the manufacturing, assembly, fabrication, transport and installation phases of supply of the supplier’s scope. Method/timing of contractor engagement needs to be coordinated with the procurement process.
Interface management
This is a key issue in the management of design for safety. E.ON will implement a number of measures to ensure good communication across all interfaces, including the appointment of a manager to co-ordinate meaningful and effective communication across all project interfaces.
Training E.ON will ensure that designers are competent to supply the required design services and that they are properly informed of the legal obligations of designers under the CDM Regulations 2007. E.ON will supply training material to design contributors, explaining the commitments made to safety by E.ON in its applications for consents and in its undertakings to the Health and Safety Executive (Emerging Energy Technologies Division) during conceptual design and consent applications. This training will also ensure that consent conditions relevant to the management of safety in construction and operations are properly communicated to design contractors.
Similar processes and procedures to those identified in this document are required for environmental management, such as those relating to hazard identification, risk assessment and the maintenance of documentation. These are identified in the Environmental Philosophy – see Environment and Consents chapter (8). E.ON planned a 6-stage approach to the hazard study, as detailed overleaf Study To be completed… Details
Hazard study
1
In FEED 1 (during the project feasibility study)
Takes input from early stage inherent safety, health and environment (SHE) studies and identifies the basic hazards of the materials involved and of the operation (it includes the results of chemical hazards assessment if reaction hazards exist). Establishes safety, health and environmental criteria and ensures the necessary contacts with functional groups and external authorities.
Hazard study
2
Early in FEED 2 (at the project definition stage)
Uses guide diagrams to stimulate creative thinking to identify significant hazards. Inherent SHE principles continue to be applied where possible and practicable, or assessment may be used to determine appropriate design features, including the identification of trip/alarm systems (the study may initiate an operational hazards assessment, if fire and explosion hazards exist, to establish the basis for safe operation).
Hazard study
3
Toward the end of FEED 2 (end of the project design stage)
A HAZOP to identify hazards and operability problems, using guidewords to stimulate creative thinking about possible deviations and their effects.
Hazard study
4
At the end of construction phase
Checks that the plant has been designed and constructed in accordance with the design intent and that there are no residual SHE issues, and checks that all hazard study actions have been closed out/enacted.
Hazard At the end of A check that the project meets company and legislative
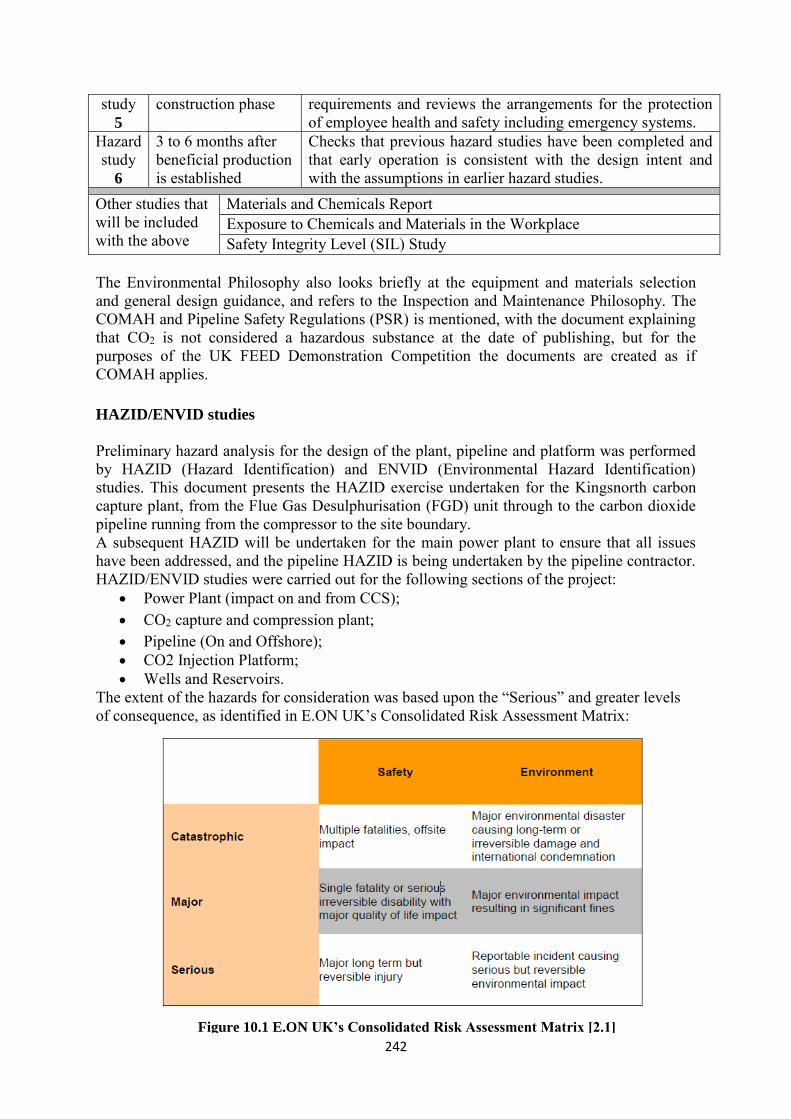
242
study 5
construction phase requirements and reviews the arrangements for the protection of employee health and safety including emergency systems.
Hazard study
6
3 to 6 months after beneficial production is established
Checks that previous hazard studies have been completed and that early operation is consistent with the design intent and with the assumptions in earlier hazard studies.
Other studies that will be included with the above
Materials and Chemicals Report Exposure to Chemicals and Materials in the Workplace Safety Integrity Level (SIL) Study
The Environmental Philosophy also looks briefly at the equipment and materials selection and general design guidance, and refers to the Inspection and Maintenance Philosophy. The COMAH and Pipeline Safety Regulations (PSR) is mentioned, with the document explaining that CO2 is not considered a hazardous substance at the date of publishing, but for the purposes of the UK FEED Demonstration Competition the documents are created as if COMAH applies. HAZID/ENVID studies Preliminary hazard analysis for the design of the plant, pipeline and platform was performed by HAZID (Hazard Identification) and ENVID (Environmental Hazard Identification) studies. This document presents the HAZID exercise undertaken for the Kingsnorth carbon capture plant, from the Flue Gas Desulphurisation (FGD) unit through to the carbon dioxide pipeline running from the compressor to the site boundary. A subsequent HAZID will be undertaken for the main power plant to ensure that all issues have been addressed, and the pipeline HAZID is being undertaken by the pipeline contractor. HAZID/ENVID studies were carried out for the following sections of the project:
Power Plant (impact on and from CCS); CO2 capture and compression plant; Pipeline (On and Offshore); CO2 Injection Platform; Wells and Reservoirs.
The extent of the hazards for consideration was based upon the “Serious” and greater levels of consequence, as identified in E.ON UK’s Consolidated Risk Assessment Matrix:
Figure 10.1 E.ON UK’s Consolidated Risk Assessment Matrix [2.1]

243
HAZID Report [2]
Scope and Methodology
The focus of the HAZID was to identify the major risks to man and the environment. At the time of undertaking the study, two capture plant layout options were under consideration [2.2].
Results The results section of the report covers: - Unit PP4 – FGD; Unit CP1 – Flue gas extraction to capture plant
quencher; - Unit CP2 - CO2 absorption and flue gas return; - Unit CP3 - Solvent regeneration; - Unit CP4 - Compression and dehydration; - Unit CP5 – Utilities; and - Unit PP4 – Miscellaneous (i.e. extraordinary hazardous events).
Conclusions and Recommendations
The workshop successfully achieved the aim of reviewing potential major incidents associated with the operations. Many of the hazards identified are similar to those already encountered on existing power generation sites, although the impacts of new hazards were also considered. A number of recommendations were made, mainly to do with the site layout. The major issue of venting of carbon dioxide under routine and unplanned conditions was identified repeatedly.
Appendices HAZID workshop attendees; HAZID Unites (capture plant and power plant); reference materials; and study record
CDM Design Risk Register
Under the Construction, Design and Management Regulations 2007, there is a requirement for the Designer to carry out Design Risk Assessments (DRA). The outputs from HAZID/ENVID studies were collated into a Safety and Environmental Risk List – this list is used to prompt designers as to where Design Risk Assessments should be carried out (as a minimum), and inform future design decisions.
The CDM regulations require designers to: Eliminate hazards where possible, Reduce the residual risk, Inform others involved in the design, construction and operation of the project about
residual risks, and, Co-operate with the same to reduce risks to a tolerable level in cases where they
cannot be eliminated. Design Risk Assessments and the Risk Register for FEED 1A are included in Appendix 1 [3.1] of the CDM Design Risk Register [3]. The Risk Register comprises a table of risk assessment – with the hazards being described in terms of the hazard itself, description of design/specification, who it may affect, the initial risk assessment (before control), the designer’s control measure, and the residual risk assessment (after control). The risk assessment values given (initial and residual) are described in the key table below:

244
Summary The ScottishPower health and safety section also includes the environmental side of the FEED. Information was given on how the ScottishPower CCS Consortium approaches the HSE aspects of the proposed project. The section gives an overview of the approaches and information on the key drivers for health, safety and environmental aspects of the CCS chain. The FEED close-out report summarises it nicely, as do the supporting PDF files which refer to other (presumably much more detailed and comprehensive) other documents that could be used if wanted. A wide range of health and safety documents were produced in the E.ON UK FEED stages to cover all sections of the project – the power plant, capture and compression plant, the CO2 pipeline (onshore and offshore), the injection platform and the wells/reservoirs. A lot of information is available from E.ON to demonstrate the work carried out in this area in the UK CCS FEED Competition. References
Number Reference Document No.
1 Health and Safety Philosophy 8.9 2 HAZID Report 8.6
2.1 Consolidated Risk Assessment Matrix (page 3) 8.6 2.2 Capture layout options (page 4) 8.6 3 CDM Design Risk Register 8.5
3.1 Design Risk Assessments/Risk Register (page 4) 8.5 3.2 Key for Design Risk Assessments (page 3) 8.5
Figure 10.2 E.ON UK’s Key for Design Risk Assessments [3.2]