uk housing and planning policies: evidence from economic...
TRANSCRIPT

UK Housing and Planning Policies: Evidence from Economic Research
Christian Hilber London School of Economics
June 2016
Presentation given to HM Treasury – Research Seminar – London, 6/6/2016 – © C. Hilber (LSE)

Overview
2
1. The key policy issue – some stylized facts
2. Features of the British system of land use planning and testable implications
3. Empirical evidence: Impact of planning constraints on house prices
4. Assessment of housing policies in light of existing institutional setting
5. Conclusions
Intro – Stylized Facts Features of British system Empirical evidence Assessment of housing policies Conclusions

Overview
3
1. The key policy issue – some stylized facts
2. Features of the British system of land use planning and testable implications
3. Empirical evidence: Impact of planning constraints on house prices
4. Assessment of housing policies in light of existing institutional setting
5. Conclusions
Intro – Stylized Facts Features of British system Empirical evidence Assessment of housing policies Conclusions

Stylized fact 1
4
House values in England – particularly in London and SE – are amongst highest in world
Mean price of single detached house (all transactions in 2008 – in-midst of Great Recession):
Kensington: 4.3M £
Richmond: 1.2M £ (greenish London suburb)
Hackney : 770k £ (rather distressed London borough)
Cotswold: 470k £ (rural West of England)
Buying price per square metre second highest in the world (topped only by Monaco)
Sources: Land Registry; Globalpropertyguide.com (last accessed 6/2016)
Intro – Stylized Facts Features of British system Empirical evidence Assessment of housing policies Conclusions

Stylized fact 2
House prices in UK (and particularly England) are also extremely volatile
UK as a whole substantially more volatile than single most volatile market in US
1980s/90s cycle: boom/bust in real terms
UK: +83% / -38%
Los Angeles: +67% / -33%
Sources: Nationwide; Glaeser et al. (2008)
5
Intro – Stylized Facts Features of British system Empirical evidence Assessment of housing policies Conclusions

0
400
800
1200
1890 1915 1940 1965 1990 2015Year
Real house prices Real land prices
Source: Cheshire (2009) and own calculations for 2008 onwards / Land Registry & Nationwide
Note: House and land price data for war years are interpolated
Real land and house price indices (1931=100)
Volatility has increased in recent decades…
6
Intro – Stylized Facts Features of British system Empirical evidence Assessment of housing policies Conclusions

Volatility has increased in London relative to rest of UK…
7
Intro – Stylized Facts Features of British system Empirical evidence Assessment of housing policies Conclusions
Average London house prices compared to average UK house prices Source: FT

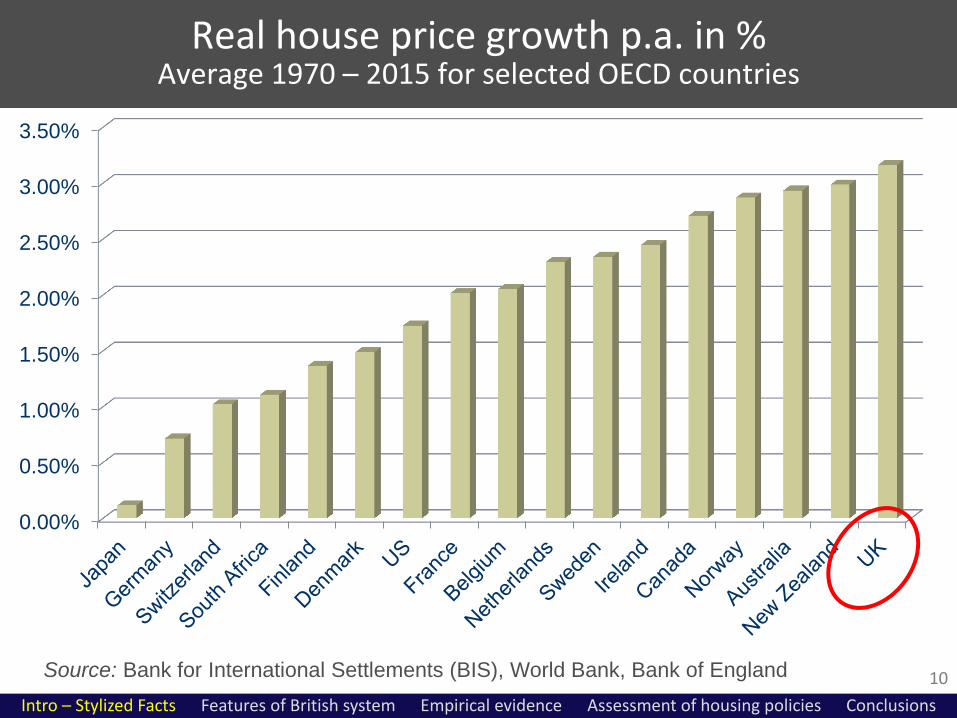
Stylized fact 3
8
Real HP growth in UK over last 40 years has been extraordinarily high by international standards…
Intro – Stylized Facts Features of British system Empirical evidence Assessment of housing policies Conclusions
0.0
50.0
100.0
150.0
200.0
250.0
300.0
350.0
400.0
450.0
1975 1980 1985 1990 1995 2000 2005 2010 2015
Real house price growth in UK vs. US & Switzerland Rebased (1975=100) – Sources: ONS, Nationwide, SNB, St Louis Fed
UK London Switzerland US

0%
50%
100%
150%
200%
250%
300%
350%
Accumulated real house price growth in % 1970 – 2015 for selected OECD countries
9 Sources: Bank for International Settlements (BIS), World Bank, Bank of England
Intro – Stylized Facts Features of British system Empirical evidence Assessment of housing policies Conclusions
0.00%
0.50%
1.00%
1.50%
2.00%
2.50%
3.00%
3.50%
Real house price growth p.a. in % Average 1970 – 2015 for selected OECD countries
10 Source: Bank for International Settlements (BIS), World Bank, Bank of England
Intro – Stylized Facts Features of British system Empirical evidence Assessment of housing policies Conclusions

Stylized fact 4
11
Despite extraordinary price growth since 1970, construction has been in continuous decline…
Intro – Stylized Facts Features of British system Empirical evidence Assessment of housing policies Conclusions
0.0
50.0
100.0
150.0
200.0
250.0
300.0
350.0
400.0
1970 1975 1980 1985 1990 1995 2000 2005 2010 2015
UK real house prices vs. UK permanent dwellings completed Rebased (1970=100) – Source: ONS, DCLG
UK real house prices UK permanent dwellings completed

Stylized fact 5
12
There are not only fewer new-build homes but these are also extremely small by international standards (Statistics Sweden 2005)
A new-build house in UK is 38% smaller than in densely populated Germany and…
40% smaller than in the even more densely populated Netherlands
...and houses are built in the wrong places: very little construction in the prosperous South
Very little new housing in e.g. Oxford & Cambridge (compared to say Doncaster or Barnsley)
Intro – Stylized Facts Features of British system Empirical evidence Assessment of housing policies Conclusions

Derived research questions
13
What factors constrain housing supply (and thereby cause the corresponding high level and volatility of prices)?
Might the British system of land use planning be a – or the main – culprit?
Intro – Stylized Facts Features of British system Empirical evidence Assessment of housing policies Conclusions

Overview
14
1. The key policy issue – some stylized facts
2. Features of the British system of land use planning and testable implications
3. Empirical evidence: Impact of planning constraints on house prices
4. Assessment of housing policies in light of existing institutional setting
5. Conclusions
Intro – Stylized Facts Features of British system Empirical evidence Assessment of housing policies Conclusions

Some background: The British system of land use planning
15
Today’s planning system established in 1947 through Town and Country Planning Act
Key features
Expropriated development rights of land owners
Designated ‘use’ classes, whereas any change of ‘use’ requires development control permission (granted at local level)
Aim is ‘development control’ or ‘containment’
Intro – Stylized Facts Features of British system Empirical evidence Assessment of housing policies Conclusions
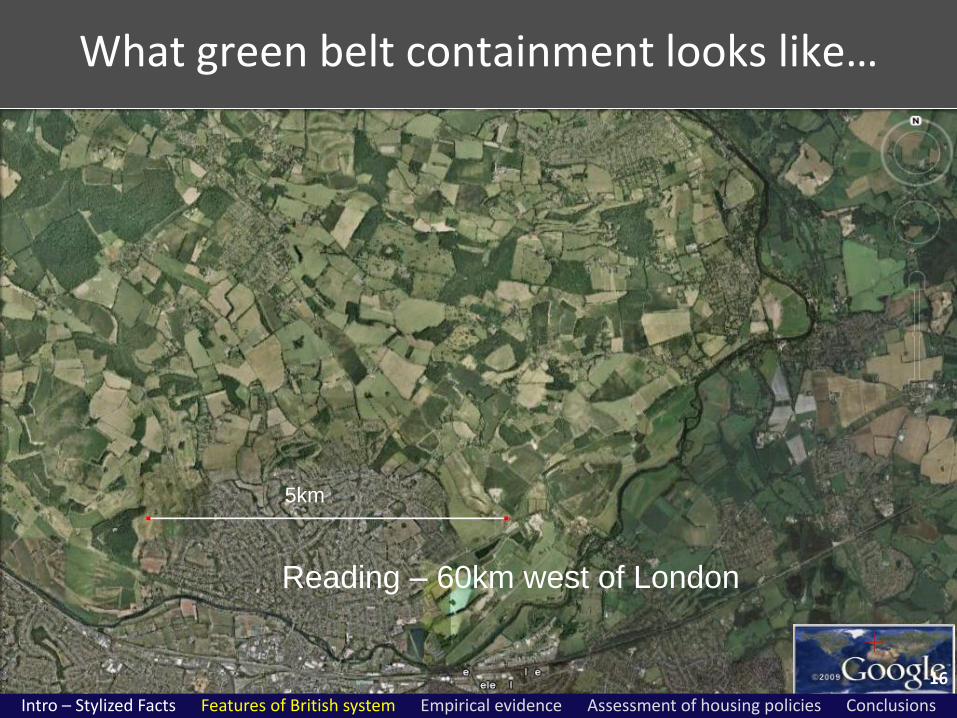
What green belt containment looks like…
16
5km
Reading – 60km west of London
Intro – Stylized Facts Features of British system Empirical evidence Assessment of housing policies Conclusions

And in London…
17
Source: Barney’s blog
(http://barneystringer.wordpress.com/2013/11/21/londons-green-belt)
Intro – Stylized Facts Features of British system Empirical evidence Assessment of housing policies Conclusions
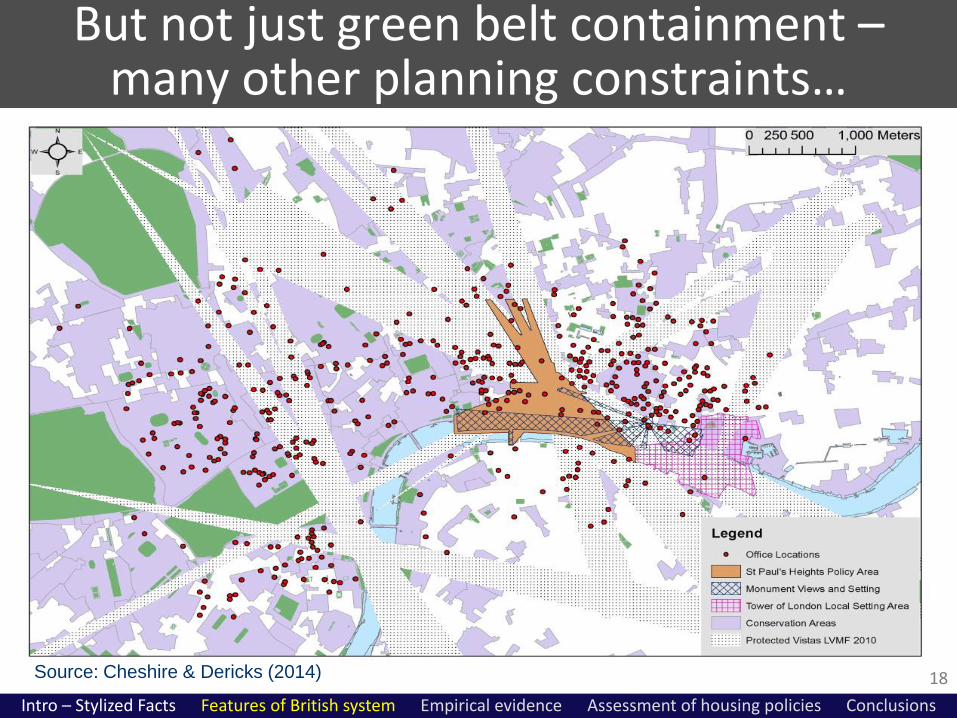
But not just green belt containment – many other planning constraints…
18 Source: Cheshire & Dericks (2014)
Intro – Stylized Facts Features of British system Empirical evidence Assessment of housing policies Conclusions

The planning system does affect urban form…
19
Dutch concentrated dispersal
Wider South East
green belt constraint
Flemish region dispersal Source: Echenique (2009)
Reading
Similar densities
Less restrictive
planning
associated with
more sprawl…
19
Intro – Stylized Facts Features of British system Empirical evidence Assessment of housing policies Conclusions

Who decides in UK?
20
Local Planning Authorities (LPAs) grant or reject planning applications Problem: Since 1947 virtually no fiscal incentives
at local level to permit development (costs far exceed benefits)
Underlying causes?
UK = highly centralized country, virtually no fiscal power at local level
Political power tilted towards homeowners (NIMBYs)
Local long-run supply curve nearly vertical…
Intro – Stylized Facts Features of British system Empirical evidence Assessment of housing policies Conclusions

Theoretical prediction…
21
House
prices
Housing
stock
Demand today
Long-run supply
Demand
tomorrow
Intro – Stylized Facts Features of British system Empirical evidence Assessment of housing policies Conclusions

Theoretical prediction…
22
House
prices
Housing
stock
Demand today
Long-run supply
Demand
tomorrow
Intro – Stylized Facts Features of British system Empirical evidence Assessment of housing policies Conclusions

How to test?
23
Hilber and Vermeulen (2016)
Exploit spatial variation in three different types of supply constraints: regulatory, scarcity of developable land and topography
Interact supply constraints with demand shifters (local earnings; labour demand shock)
Use instrumental variable technique to identify causal effect of local supply constraints measures on local house prices
Intro – Stylized Facts Features of British system Empirical evidence Assessment of housing policies Conclusions

24
Average refusal rate
(major residential
projects) 1979-2008
Share developable
land developed,
1990
Elevation range
Source: Hilber and Vermeulen (2016)
Intro – Stylized Facts Features of British system Empirical evidence Assessment of housing policies Conclusions

Main findings
25
Tight local planning constraints in parts of England (in conjunction with strong demand) are to a large extent responsible for extraordinarily high house prices
Local scarcity of developable land matters but very non-linearly (only in most developed locations)
Topography matters in statistical sense but very little in economic (quantitative) sense…
Intro – Stylized Facts Features of British system Empirical evidence Assessment of housing policies Conclusions

Quantitative effects (based on IV with all instruments)
26
If planning were completely relaxed in average LPA:
House prices in average LPA: -35%
and developable land were abundant:
House prices in average LPA: -45% (Δ= -10%)
and LPA were completely flat:
House prices in average LPA: -48% (Δ= -3%)
Note: These are likely lower bound estimates for a number of reasons (see Hilber and Vermeulen, 2016, for details)
Intro – Stylized Facts Features of British system Empirical evidence Assessment of housing policies Conclusions

27
What would house prices in average English LPA be if…
50000
100000
150000
200000
250000
Hou
se p
rice
s in
20
08
pou
nd
s
1974 1980 1990 2000 2008Year
Predicted real house prices in average English LPA
Prediction with refusal rate set to zero
- and share developed set to zero
- and elevation range set to zero
- and earnings assumed constant
226k
147k
124k 117k 112k
27
Intro – Stylized Facts Features of British system Empirical evidence Assessment of housing policies Conclusions

North East vs. South East & 90th vs. 10th percentile
50000
100000
150000
200000
250000
300000
Hou
se p
rice
s in
20
08
pou
nd
s
1974 1980 1990 2000 2008Year
Predicted real house prices in average English LPA
Prediction with refusal rate as in NE / SE
Prediction with refusal rate as 10th/90th percentile
Had the SE the restrictiveness of the NE,
house prices in the SE would be 25% lower!
28
Intro – Stylized Facts Features of British system Empirical evidence Assessment of housing policies Conclusions

But large variation across locations…
29
-.5
0
.5
1
1.5
Log
of re
al h
ouse p
rice
s (1
974
= 0
)
1974 1980 1990 2000 2008Year
Predicted log real house prices in Westminster
Prediction with refusal rate set to zero
- and share developed set to zero
- and elevation range set to zero
- and earnings assumed constant
-.5
0
.5
1
1.5
Log
of re
al h
ouse
pri
ces
(19
74
= 0
)
1974 1980 1990 2000 2008Year
Predicted log real house prices in Reading
Prediction with refusal rate set to zero
- and share developed set to zero
- and elevation range set to zero
- and earnings assumed constant
-.5
0
.5
1
1.5
Log
of re
al h
ouse p
rice
s (1
974
= 0
)
1974 1980 1990 2000 2008Year
Predicted log real house prices in Darlington
Prediction with refusal rate set to zero
- and share developed set to zero
- and elevation range set to zero
- and earnings assumed constant
-.5
0
.5
1
1.5
Log
of re
al h
ouse p
rice
s (1
974
= 0
)
1974 1980 1990 2000 2008Year
Predicted log real house prices in Newcastle upon Tyne
Prediction with refusal rate set to zero
- and share developed set to zero
- and elevation range set to zero
- and earnings assumed constant 29
Intro – Stylized Facts Features of British system Empirical evidence Assessment of housing policies Conclusions

Preliminary conclusions: There are two fundamental issues…
30
1. Planning system effectively assigns development rights to local policy makers, planners & NIMBYs
In contrast: In most other countries, development is rule based – if land is zoned as residential, presumption is in favour of development
2. Lack of fiscal incentives to develop at local level
Discourages local authorities to permit development (most costs – little benefits!) – NIMBYism reinforces
Creates incentives to impose horizontal restrictions (Green Belt) and vertical ones (height restrictions)
1. + 2. jointly cause affordability crisis!
Intro – Stylized Facts Features of British system Empirical evidence Assessment of housing policies Conclusions

Overview
31
1. The key policy issue – some stylized facts
2. Features of the British system of land use planning and testable implications
3. Empirical evidence: Impact of planning constraints on house prices
4. Assessment of housing policies in light of existing institutional setting
5. Conclusions
Intro – Stylized Facts Features of British system Empirical evidence Assessment of housing policies Conclusions

Some existing and proposed policies…
32
1. Housing construction targets
2. Help-to-Buy and other demand subsidies
3. Devolving fiscal power by abolishing uniform business rate (Chancellor announcement in Oct.)
4. Increase in stamp duty on buy-to-let properties & second homes (Autumn Statement)
5. Limit on increase of rents for social tenants (Chancellor announcement)
6. Allowing local authorities to build starter homes on Green Belt (DCLG consultation document)
7. Expansion of Right-to-Buy (Autumn Statement)
Intro – Stylized Facts Features of British system Empirical evidence Assessment of housing policies Conclusions

1. Housing construction targets
33
Idea: Announce housing construction targets to encourage development
Problem: Targets alone neither tilt development rights in favour of development nor do they provide fiscal incentives
Expected effect: Nil!
Evidence: Construction in decline since 1970 despite ever increasing targets by all parties and consecutive governments of different colours
Intro – Stylized Facts Features of British system Empirical evidence Assessment of housing policies Conclusions

2. Help-to-Buy & other subsidies to homebuyers
34
Idea: Subsidise demand for owner-occupied housing
Problem: Local supply extremely price inelastic, in particular in London & South East
Expected effect: Policy raises prices but does not spur development
Evidence:
House prices in London rose by 25.8% b/w 2013Q2 and 2014Q4 & there was no housing boom!
Evidence from US: In tightly regulated cities demand subsidies are counterproductive (Hilber & Turner 2014)
Intro – Stylized Facts Features of British system Empirical evidence Assessment of housing policies Conclusions

3. Devolving fiscal power by abolishing uniform business rate
35
Idea: Devolve fiscal power to tax businesses to local authorities (LAs)
Expected effects:
If LAs can keep revenue should provide more incentive to permit commercial development on brownfield land, great but…
Problem: May divert brownfield land away from housing (substitution effect) so probably even less new housing!
(If central government grants were to fully offset business rate revenue: then no effect at all)
Intro – Stylized Facts Features of British system Empirical evidence Assessment of housing policies Conclusions

4. Increase in stamp duty on buy-to-let properties & second homes
36
Idea: Discourage buy-to-let & second homes
Expected effects: Makes buy-to-let and second homes less attractive compared to owner-occupation
Buy-to-let: Increase in stamp duty will reduce supply of private rental homes Increase in private rents & possibly slight reduction in price of owner-occupied homes
Second homes: Might increase supply of primary homes in short-run and slightly reduce house prices (good!) but may provide even fewer incentives to add new housing (bad!)
Overall: Likely zero sum; private rental will become less affordable and owner-occupied housing slightly more affordable
Intro – Stylized Facts Features of British system Empirical evidence Assessment of housing policies Conclusions

5. Limit on increase of rents for social tenants
37
Idea: Make social housing more affordably by limiting social rent increase (to e.g. 1% p.a.)
Problem: Reduces book value of social rented housing stock reduces ability of housing associations to finance additional social housing development
Expected effects: Less new social housing few lucky social tenants but even greater affordability crisis for all other young and low income households
Intro – Stylized Facts Features of British system Empirical evidence Assessment of housing policies Conclusions

6. Allowing local authorities to build starter homes on Green Belt
38
Idea: Relax (somewhat) constraints to build starter homes at edge of green belts & on brown-field land within green belts
Expected effects:
Tiny fraction of green belt is brownfield
Only possible if local authority wants it!
Problem: Local authorities still have no fiscal incentives to develop, especially not in green belt, so at best ‘a drop on a hot stone’.
But does send signal that low-amenity-value land in green belts may no longer be sacrosanct!
Intro – Stylized Facts Features of British system Empirical evidence Assessment of housing policies Conclusions

7. Expansion of Right-to-Buy
39
Idea: Expand RTB to housing association tenants
Expected effects:
Incentivises owner-occupation – may or may not be welfare increasing
But in any case: at huge cost to taxpayer because housing associations must be compensated for losses
IF they are not: Policy will endanger ability of associations to finance new homes, so may reduce new construction
Also creates more ‘homevoter’ NIMBYs, which in turn may further reduce new housing construction!
Intro – Stylized Facts Features of British system Empirical evidence Assessment of housing policies Conclusions

Conclusions
40
Planning serves important purpose - in principle it can improve welfare through correcting market failure such as externalities and public goods
But British planning and tax systems have serious “design flaws”:
‘Development control’ blindly favours containment and generates great degree of uncertainty
Lack of local fiscal incentives reinforces problem
Existing and proposed policies do not tackle these flaws – policies are, at best, ineffective but often counterproductive
Intro – Stylized Facts Features of British system Empirical evidence Assessment of housing policies Conclusions

So what ought policy makers do? Some guiding principles…
41
Radical reforms needed that simultaneously address flaws of planning and tax system
Planning system ought to…
1. Focus on correcting market failures: Designate parks, areas of natural beauty, historic buildings etc. that are off hands from (re-)development and
2. Change to rule based zoning system: Introduce presumption in favour of development in areas that are not protected
Intro – Stylized Facts Features of British system Empirical evidence Assessment of housing policies Conclusions

So what ought policy makers do? Some guiding principles…
42
Tax system ought to…
1. Align fiscal incentives to develop: Local residents & neighbours who bear costs also ought to be able to reap benefits
2. Move away from stamp duty & demand subsidies towards impact fees (reflecting marginal social costs) and genuine local property tax or LVT
3. Consider permitting private compensation payments
Intro – Stylized Facts Features of British system Empirical evidence Assessment of housing policies Conclusions

Q & A
Thank you!
Presentation with references & hyperlinks will be downloadable from:
http://personal.lse.ac.uk/hilber/
43

References & Further Readings
44
Cheshire, P. (2009) Urban Containment, Housing Affordability and Price Stability – Irreconcilable Goals. SERC Policy Paper No. 4, September.
Cheshire, P. and G. Dericks (2014) ‘Iconic Design’ as Deadweight Loss: Rent Acquisition by Design in the Constrained London Office Market. SERC Discussion Paper No. 154, January.
Cheshire, P. and C. Hilber (2008) Office Space Supply Restrictions in Britain: The Political Economy of Market Revenge. Economic Journal 118(529), F185-F221. (Latest discussion paper version)
Cheshire, P., C. Hilber and I. Kaplanis (2015) Land Use Regulation and Productivity – Land Matters: Evidence from a Supermarket Chain. Journal of Economic Geography 15(1), 43-73. (Latest discussion paper version)
Cheshire, P. and S. Sheppard (2005) The Introduction of Price Signals into Land Use Planning Decision-making: A Proposal. Urban Studies 42(4), 647-663.
DeFusco, A., W. Ding, F. Ferreira and J. Gyourko (2013) The Role of Contagion in the Last American Housing Cycle. Wharton School, mimeo, June.

References & Further Readings (cont.)
45
Echenique, M. (2009) Sustainable Cities. Presentation given at the Spatial Economics Research Centre Policy Seminar, London, 15 October 2009.
Glaeser, E.L., J. Gyourko, and A. Saiz, (2008). Housing supply and housing bubbles. Journal of Urban Economics 64(2), pp. 198-217.
Globalpropertyguide.com (http://www.globalpropertyguide. com/most-expensive-cities; last accessed: 1 February 2015)
Hilber, C. (2013) Help to Buy will likely have the effect of pushing up house prices further, making housing become less – not more – affordable for young would-be-owners. British Politics and Policy at LSE Blog, June 25.
Hilber, C. (2015a) UK Housing and Planning Policies: The evidence from economic research. CEP 2015 Election Analysis Series – Paper EA033.
Hilber, C. (2015b) Help-to-Buy ISAs Will End up Feathering Nests of the Wealthy – Here is How. The Conversation, 19 March.
Hilber, C. (2015c) Deep-rooted vested interests are to blame for our housing crisis,” Disclaimer, May.

References & Further Readings (cont.)
46
Hilber, C. (forthcoming) The Economic Implications of House Price Capitalization: A Synthesis. Appears in Real Estate Economics. (Latest DP version)
Hilber, C. and T. Lyytikäinen (2015) Transfer Taxes and Household Mobility: Distortion on the Housing or Labor Market? SERC DP No. 187, October.
Hilber, C., T. Lyytikäinen and W. Vermeulen (2011) Capitalization of Central Government Grants into Local House Prices: Panel Data Evidence from England. Regional Science and Urban Economics 41(4), 394-406. (Latest DP version)
Hilber, C. and C. Mayer (2009) Why Do Households Without Children Support Local Public Schools? Linking House Price Capitalization to School Spending. Journal of Urban Economics 65(1): 74-90. (Latest DP version)
Hilber, C and F. Robert-Nicoud (2013) On the Origins of Land Use Regulations: Theory and Evidence from US Metro Areas. Journal of Urban Economics 75(1), 29-43. (Latest DP version)
Hilber, C. and O. Schöni (2016) Housing Policies in the United Kingdom, Switzerland and the United States: Lessons Learned. Asian Development Bank Institute Working Paper No. 569, April.
References & Further Readings (cont.)
47
Hilber, C. and O. Schöni (2016) The Housing Market Impacts of Banning Second Home Investments. Mimeo, London School of Economics, May. (Preliminary WP)
Hilber, C. and T. Turner (2014) The Mortgage Interest Deduction and its Impact on Homeownership Decisions. Review of Economics and Statistics, Vol. 96, No. 4, 618-637 (Latest DP version)
Hilber, C. and W. Vermeulen (2010) The Impacts of Restricting Housing Supply on House Prices and Affordability – Final Report. London: Department for Communities and Local Government. (Link to report)
Hilber, C. and W. Vermeulen (2016) The Impact of Supply Constraints on House Prices in England. Economic Journal, Vol. 126, No. 591, 358-405. (Latest DP version)
KingSturge (2004) Global Industrial and Office Rents Survey, London: KingSturge.
Mirrlees, J., S. Adam, T. Besley, R. Blundell, S. Bond, R. Chote, M. Gammie, P. Johnson, G. Myles and J. Poterba (2011) Tax by Design: the Mirrlees Review. Oxford University Press.
Statistics Sweden (2005) Housing Statistics in the European Union 2004, Karlskrona: Boverket, Publikationsservice.