uk inflammatory bowel disease (ibd) audit...national clinical audit of biological therapies uk...
TRANSCRIPT

National clinical audit of biological therapies UK inflammatory bowel disease (IBD) audit Adult report September 2015 Prepared by the Clinical Effectiveness and Evaluation Unit at the Royal College of Physicians on behalf of the IBD programme steering group

National clinical audit of biological therapies. Adult report. September 2015. UK IBD audit
The Royal College of Physicians The Royal College of Physicians (RCP) plays a leading role in the delivery of high-quality patient care by setting standards of medical practice and promoting clinical excellence. We provide physicians in over 30 medical specialties with education, training and support throughout their careers. As an independent charity representing more than 30,000 fellows and members worldwide, we advise and work with government, patients, allied healthcare professionals and the public to improve health and healthcare. The Clinical Effectiveness and Evaluation Unit (CEEU) of the RCP runs projects that aim to improve healthcare in line with the best evidence for clinical practice: guideline development, national comparative clinical audit, the measurement of clinical and patient outcomes, and clinical change management. All work is carried out in collaboration with relevant specialist societies, patient groups and NHS bodies.
Healthcare Quality Improvement Partnership The national clinical audit of biological therapies is commissioned by the Healthcare Quality Improvement Partnership (HQIP) as part of the National Clinical Audit Programme (NCA). HQIP is led by a consortium of the Academy of Medical Royal Colleges, the Royal College of Nursing and National Voices. Its aim is to promote quality improvement, and in particular to increase the impact that clinical audit has on healthcare quality in England and Wales. HQIP holds the contract to manage and develop the NCA Programme, comprising more than 30 clinical audits that cover care provided to people with a wide range of medical, surgical and mental health conditions. The programme is funded by NHS England, the Welsh Government and, with some individual audits, also funded by the Health Department of the Scottish Government, DHSSPS Northern Ireland and the Channel Islands. Citation for this document: Royal College of Physicians. National clinical audit of biological therapies: adult report. UK inflammatory bowel disease (IBD) audit. London: Royal College of Physicians, 2015. Copyright All rights reserved. No part of this publication may be reproduced in any form (including photocopying or storing it in any medium by electronic means and whether or not transiently or incidentally to some other use of this publication) without the written permission of the copyright owner. Applications for the copyright owner’s written permission to reproduce any part of this publication should be addressed to the publisher. Copyright © Healthcare Quality Improvement Partnership 2015 ISBN 978-1-86016-569-6 eISBN 978-1-86016-570-2 Royal College of Physicians 11 St Andrews Place Regent’s Park London NW1 4LE www.rcplondon.ac.uk Registered Charity No 210508
2 © Healthcare Quality Improvement Partnership 2015

National clinical audit of biological therapies. Adult report. September 2015. UK IBD audit
Document purpose To disseminate the results of the national inflammatory bowel disease (IBD) biological therapy audit
Title National clinical audit of biological therapies. UK inflammatory bowel disease (IBD) audit. Adult report. September 2015.
Author On behalf of the IBD programme steering group Publication date 24 September 2015 Audience Healthcare professionals, NHS managers, service commissioners and
policymakers Description This is the fourth biological therapy report published from the UK IBD audit.
This report is addressed to anyone who is interested in IBD. It publishes national- and hospital-level findings on the efficacy, safety and appropriate use of biological therapies for patients newly started on biologics since its inception on 12 September 2011 until 28 February 2015.
Supersedes National clinical audit of biological therapies. UK inflammatory bowel disease (IBD) audit. Adult report. September 2014.
Related publications IBD Standards Group, 2013. Standards for the healthcare of people who have inflammatory bowel disease, IBD standards, 2013 update. www.ibdstandards.org.uk
Mowat C, Cole A, Windsor A et al, on behalf of the IBD Section of the British Society of Gastroenterology. Guidelines for the management of inflammatory bowel disease in adults. Gut 2011;60:571–607.
National Institute for Health and Care Excellence, 2008. Technology appraisal 163: Infliximab for acute exacerbations of ulcerative colitis. www.nice.org.uk/guidance/TA163
National Institute for Health and Care Excellence, 2011. Technology appraisal 187: Infliximab (review) and adalimumab for the treatment of Crohn’s disease. www.nice.org.uk/guidance/TA187
National Institute for Health and Care Excellence, 2015. Technology appraisal 329: Infliximab, adalimumab and golimumab for treating moderately to severely active ulcerative colitis after the failure of conventional therapy (including a review of TA140 and TA262). www.nice.org.uk/guidance/TA329
National Institute for Health and Care Excellence, 2015. Quality standard 81: Inflammatory bowel disease. www.nice.org.uk/guidance/QS81
Royal College of Physicians, 2014. Experience of inpatients with ulcerative colitis throughout the UK.
Royal College of Physicians, 2014. National audit of inflammatory bowel disease (IBD) service provision. Adult report.
Royal College of Physicians, 2014. National clinical audit of inpatient care for adults with ulcerative colitis.
Contact [email protected]
3 © Healthcare Quality Improvement Partnership 2015

National clinical audit of biological therapies. Adult report. September 2015. UK IBD audit
Commissioned by:
In partnership with:
4 © Healthcare Quality Improvement Partnership 2015

National clinical audit of biological therapies. Adult report. September 2015. UK IBD audit
Contents Report preparation............................................................................................................................ 7
Biological therapy audit subgroup .................................................................................................. 7 IBD programme team at the Royal College of Physicians ................................................................. 7 Acknowledgements ....................................................................................................................... 7
Executive summary ........................................................................................................................... 8 Background ................................................................................................................................... 8 Key messages ................................................................................................................................ 8 Key findings ................................................................................................................................... 9
Clinical findings ..................................................................................................................................... 9 Participation findings.......................................................................................................................... 10
Recommendations ....................................................................................................................... 11 Implementing change: action plan ............................................................................................... 12
1: Introduction and methods ........................................................................................................... 15 Introduction ................................................................................................................................ 15 Aims of the biological therapies audit .......................................................................................... 15 Methods...................................................................................................................................... 15
Definition of a ‘site’ ............................................................................................................................ 15
Eligibility and participation ................................................................................................................. 15 PANTs ................................................................................................................................................. 15 Inclusion and exclusion criteria .......................................................................................................... 16 Denominators ..................................................................................................................................... 16
Data-collection tool ............................................................................................................................ 16 Site-level data ..................................................................................................................................... 16 Evidence ............................................................................................................................................. 16
Availability of audit results in the public domain .......................................................................... 17 Presentation of results ................................................................................................................. 17
2: Summary of key results ............................................................................................................... 18 Consort diagram – initial treatment ............................................................................................. 18 Key data tables ............................................................................................................................ 19 Audit objectives ........................................................................................................................... 25
Safety .................................................................................................................................................. 25 Efficacy ............................................................................................................................................... 26 Appropriateness of prescribing anti-TNFα ......................................................................................... 27 Patient-reported outcome measures ................................................................................................. 28
3: Background information .............................................................................................................. 29 The burden of inflammatory bowel disease .................................................................................. 29 The UK IBD audit ......................................................................................................................... 29 The benefits of the biological therapies audit ............................................................................... 29
4: The biological therapies audit ...................................................................................................... 30 What is the role of biological therapy in the treatment of IBD? ..................................................... 30
Infliximab ............................................................................................................................................ 30
5 © Healthcare Quality Improvement Partnership 2015

National clinical audit of biological therapies. Adult report. September 2015. UK IBD audit
Adalimumab ....................................................................................................................................... 30 Approval in the UK ............................................................................................................................. 30
Data entry into the biological therapies audit ............................................................................... 31 Patient demographics category ......................................................................................................... 31 Disease details category ..................................................................................................................... 31 Initial treatment category .................................................................................................................. 31
Follow-up treatment category ........................................................................................................... 31 IBD-related surgery category ............................................................................................................. 31 PROMs category ................................................................................................................................. 31
Continued development of the biological therapies audit web tool ............................................... 32 Existing patients ................................................................................................................................. 32
Reporting functions ............................................................................................................................ 32 Data import function .......................................................................................................................... 32 Reduction of mandatory fields ........................................................................................................... 32
System security of the biological therapies audit web tool ............................................................ 34 5: Full national audit results tables .................................................................................................. 35
Crohn’s disease details................................................................................................................. 35 Crohn’s disease initial treatment .................................................................................................. 36 Crohn’s disease follow-up treatment at 3 months......................................................................... 40 Crohn’s disease follow-up treatment at 12 months ....................................................................... 43 Ulcerative colitis disease details ................................................................................................... 46 Ulcerative colitis initial treatment ................................................................................................ 47 Ulcerative colitis follow-up treatment at 3 months ....................................................................... 50 Ulcerative colitis follow-up treatment at 12 months ..................................................................... 52 Inflammatory bowel disease type unclassified disease details ...................................................... 54 Inflammatory bowel disease type unclassified initial treatment .................................................... 55 Inflammatory bowel disease type unclassified follow-up treatment at 3 months ........................... 57 Inflammatory bowel disease type unclassified follow-up treatment at 12 months ......................... 59 IBD-related surgery ...................................................................................................................... 60 Patient-reported outcome measures (PROMs) ............................................................................. 62
EQ-5D.................................................................................................................................................. 62 CUCQ-12 ............................................................................................................................................. 62
6: Participation and individual site key indicator data ....................................................................... 64 Participation ................................................................................................................................ 64 Key indicator data for individual sites ........................................................................................... 65
Appendices ..................................................................................................................................... 93 Appendix 1: Acronyms used in this report .................................................................................... 93 Appendix 2: Biological therapy audit governance ......................................................................... 94
Audit governance ............................................................................................................................... 94
IBD programme steering group members ......................................................................................... 94 Appendix 3: Consort diagram – follow-up treatment .................................................................... 96
References ...................................................................................................................................... 97
6 © Healthcare Quality Improvement Partnership 2015

National clinical audit of biological therapies. Adult report. September 2015. UK IBD audit
Report preparation The report was prepared by the biological therapy audit subgroup on behalf of the IBD programme steering group. (A full list of steering group members can be found in Appendix 2.)
Biological therapy audit subgroup Dr Ian Arnott Clinical director, IBD programme steering group; consultant gastroenterologist, Western General Hospital, Edinburgh Dr Stuart Bloom Consultant gastroenterologist, University College Hospital, London Dr Fraser Cummings Consultant gastroenterologist, University Hospital Southampton Mr Omar Faiz Consultant colorectal surgeon, St Mark’s Hospital, Harrow Dr Karen Kemp IBD clinical nurse specialist, Manchester Royal Infirmary Dr Richard Russell Consultant paediatric gastroenterologist, Royal Hospital for Sick Children (Yorkhill), Glasgow Ms Anja St Clair-Jones Lead pharmacist – surgery and digestive diseases, Royal Sussex County Hospital, Brighton Professor John Williams Consultant gastroenterologist, Abertawe Bro Morgannwg University Health Board; director, Health Informatics Unit, Royal College of Physicians
IBD programme team at the Royal College of Physicians Ms Kajal Mortier Project manager, IBD programme, Clinical Effectiveness and Evaluation Unit Ms Susan Murray Programme manager, IBD programme, Clinical Effectiveness and Evaluation Unit Ms Aimee Protheroe Programme development manager, IBD programme, Clinical Effectiveness and Evaluation Unit Dr Linda Williams Medical statistician, Centre for Population Health Sciences, University of Edinburgh
Acknowledgements The IBD programme steering group would like to thank all hospitals that continue to contribute to this national audit. We would also like to thank all who have participated in piloting and development of the UK IBD audit since it began in 2005. Thanks also to participating NHS hospitals that have provided invaluable suggestions on ways to improve the audit. The web-based data collection tool was developed by Westcliff Solutions Ltd: www.westcliffsolutions.co.uk
7 © Healthcare Quality Improvement Partnership 2015

National clinical audit of biological therapies. Adult report. September 2015. UK IBD audit
Executive summary
Background Biological therapies are the newest group of drugs to be used in inflammatory bowel disease (IBD). Most of these drugs work by targeting a protein in the body called tumour necrosis factor alpha (TNFα). Overproduction of this protein is thought to be partly responsible for the chronic inflammation in patients with IBD. The purpose of this audit is to measure the efficacy, safety and appropriate use of the biological therapies infliximab and adalimumab, also known as anti-TNFα drugs, in patients with IBD in the UK. The audit also aims to capture patients’ views on their quality of life at intervals during their treatment. This is the fourth report of the biological therapy element of the UK IBD audit; all analyses within this report include only those patients who were newly started on biological therapies between 12 September 2011 (the start of data collection) and 28 February 2015. The data contained within this report have only been taken from completed submissions within the biological therapy audit web tool (www.ibdbiologicsaudit.org). The biological therapies audit provides IBD teams with the means to meet Standard A6 of the IBD standards;1 specifically, regular review of patient outcomes and auditing of biological therapy. Participation in the audit provides the opportunity to review compliance with National Institute for Health and Care Excellence (NICE) recommendations technology appraisal 1872 and technology appraisal 3293 and also fulfils NICE quality statement 4: monitoring drug treatment in quality standard 81.4 Key messages Participation in the biological therapies audit has improved substantially over time. Of 159 adult trusts / health boards eligible to participate in this audit, 152 (96%) are participating in either the audit or the Personalised Anti-TNF Therapy in Crohn’s disease study (PANTs).5 A total of 4718 adult patients have now been included in this national analysis. This is a clear demonstration of the effectiveness of collaboration between national audit and research, which results in a reduced burden of data entry for clinicians and greater engagement. At some sites, data from only a minority of cases are being entered. The organisational audit in 2013 collected data on the number of patients newly started on biological therapies. Although 40% of sites estimated this figure, when current data are compared with this, it appears possible that only 22% of eligible new starters have been audited. The data presented in this report demonstrate that biological therapies for IBD are effective and relatively safe treatments. Patterns of use are changing, with earlier use in patients with less severe disease. It is likely that this reflects more appropriate prescribing as physicians become more familiar with these drugs. It is also clear that only a minority of patients have their treatment stopped when effective, as recommended in the NICE guidance. Further audit will clarify this issue, identifying those patients in whom treatment can be stopped. These data are vital for local quality improvement.
8 © Healthcare Quality Improvement Partnership 2015

National clinical audit of biological therapies. Adult report. September 2015. UK IBD audit
HBI
Key findings Clinical findings
of audited adult patients were being treated with biological therapies within 2 years of being diagnosed with Crohn’s disease (CD). (Section 5, p 35)
Response to treatment is not related to duration of disease: the response rate was 79% in patients treated within 1 year of diagnosis and 81% in those treated 6–10 years from diagnosis. (Section 2, p 21)
Response to treatment
Remission achieved
Treatment of CD with a biological therapy is effective: 80% of adult patients audited experienced a response, with remission in 68%. (Section 2, p 21) Quality of life also improved after treatment, with a 61% reduction in median Crohn's and ulcerative colitis questionnaire (CUCQ)-12 scores. (Section 2, p 28)
Over the last three rounds of audit, pre-treatment Harvey–Bradshaw index (HBI) has fallen from 9 to 7. (Section 2, p 22)
Use of concomitant immunosuppression therapy has also fallen from 58% to 34%, which suggests earlier use of biological therapies in patients with milder disease. (Section 2, p 22)
of patients reported an adverse event when assessed at 3-month follow-up. Infection was seen in 2% of patients and mortality in 0.1%; no malignancies were reported. (Section 2, p 25)
Treatment was stopped in of patients with CD who were followed up at 12 months.
The audit data suggest that the treatment was discontinued because it was effective in 34% of these patients, while another 23% stopped treatment after experiencing side effects / an adverse event. (Section 5, p 43)
9
7
34%
58%
Immunosuppression
8%
41%
9%
9 © Healthcare Quality Improvement Partnership 2015

National clinical audit of biological therapies. Adult report. September 2015. UK IBD audit
Participation findings
The number of sites engaging with the biological therapy audit since its inception has been gradually increasing:
from
to
of adult trusts participating in the UK. (Section 6, p 64)
Although participation in the audit has improved over time, only about 1 in 5 eligible patients were audited in 2013. (Section 2, p 24)
Submission of follow-up data has improved but remains incomplete. (Section 2, p 19)
Only 33% of adult patients audited had complete follow-up data at 3 months.
The proportion is even lower for 12-month follow-up, with only 12% of patients recorded as having been followed up at this timepoint.
More patient-reported outcome measures (PROMs) were completed at the start of treatment (30%) than for the previous report (14%), although fewer PROMs were completed at the 3- and 12-month review points (25% and 22%, respectively).6 (Section 2, p 28)
96% 2015
54% 2012
10 © Healthcare Quality Improvement Partnership 2015

National clinical audit of biological therapies. Adult report. September 2015. UK IBD audit
Recommendations 1 Sites that prescribe and administer biological therapies to their patients with inflammatory
bowel disease (IBD) should continue to participate in the national biological therapy audit. They should aim to submit complete data on all new starters. This includes data at baseline and at least 3- and 12-month follow-up. Sites that enter data to the Personalised Anti-TNF Therapy study (PANTs) are counted as participating; these sites are reminded that data on patients not applicable for inclusion in the research study should be entered into the biological therapy audit web tool so that all new starters on biological therapies are captured.
2 Disease activity should be routinely assessed and monitored, especially at baseline and again at
3- and 12-month follow-up.
3 Sites should continue to encourage patients to complete patient-reported outcome measures (PROMs) at baseline, as they provide an indication of patient outcomes and the quality of care delivered to patients. It is important to ensure that PROMs are completed at follow-up.
4 The audit has been extended to include patients started on biosimilar versions of infliximab and other biological treatments. Patients newly started on these treatments should now be audited.
5 Sites should use the ‘Export data’ function of the web tool to check the completeness of the
data entered. Exported data can also be used for any local analyses, which can support quality improvement activities.
6 Sites should continue to monitor safety and efficacy over the long term and should stop biological therapies in patients who have failed to respond to treatment.
7 The findings and recommendations of this report should be shared at relevant multidisciplinary team, clinical governance and audit meetings, and a local action plan for implementing change should be devised.
11 © Healthcare Quality Improvement Partnership 2015

National clinical audit of biological therapies. Adult report. Septem
ber 2015. UK IBD audit
©
Healthcare Quality Im
provement Partnership 2015
12
Implementing change: action plan This action plan has been produced to enable you to take forward the recommendations of this national audit. It can be adapted through the addition of further actions that you feel are appropriate for your own service. You can download a copy of this action plan from www.rcplondon.ac.uk/ibd. National recommendation Action required Staff responsible Progress at your site
(Include date of review, name of individual responsible for action)
1 Sites that prescribe and administer biological therapies to their patients with inflammatory bowel disease (IBD) should continue to participate in the national biological therapy audit. They should aim to submit complete data on all new starters. This includes data at baseline and at least 3- and 12-month follow-up. Sites that enter data to the Personalised Anti-TNF Therapy in Crohn’s disease study (PANTs) are counted as participating; these sites are reminded that data on patients not applicable for inclusion in the research study should be entered into the biological therapy audit web tool so that all new starters on biological therapies are captured.
Eligible sites should ensure that all newly started patients are entered into the biological therapies audit. Have a system in place to ensure that data are collected at 3- and 12-month follow-up.
Consultant gastroenterologists IBD nurses Infusion clinic staff
2 Disease activity should be routinely assessed and monitored, especially at baseline and again at 3- and 12-month follow-up.
Ensure that the relevant disease activity index is available in clinical areas. Ensure that IBD clinical teams are made aware of its availability and importance. Disease activity scoring forms for patients can be downloaded directly from the biological therapy audit web tool (www.ibdbiologicsaudit.org).
Consultant gastroenterologists IBD nurses Infusion clinic staff

National clinical audit of biological therapies. Adult report. Septem
ber 2015. UK IBD audit
© Healthcare Q
uality Improvem
ent Partnership 2015
National recommendation Action required Staff responsible Progress at your site (Include date of review, name of individual responsible for action)
3 Sites should continue to encourage patients to complete patient-reported outcome measures (PROMs) at baseline, as they provide an indication of patient outcomes and the quality of care delivered to patients. It is important to ensure that PROMs are completed at follow-up.
Ensure that the PROM forms are available in clinical areas. Ensure that IBD clinical teams are made aware of their availability and importance. PROM forms for patients can be downloaded directly from the biological therapy audit web tool (www.ibdbiologicsaudit.org).
Consultant gastroenterologists IBD nurses Infusion clinic staff
4 The audit has been extended to include patients started on biosimilar versions of infliximab and other biological treatments. Patients newly started on these treatments should now be audited.
Ensure that data on all patients newly started on biosimilar versions of drugs are entered into the biological therapies audit. Have a system in place to ensure that data are collected at 3- and 12-month follow-up.
Consultant gastroenterologists IBD nurses Infusion clinic staff
5 Sites should use the ‘Export data’ function of the web tool to check the completeness of the data entered. Exported data can also be used for any local analyses, which can support quality improvement activities.
Ensure that staff are aware that the export function can be used at any time. Site-level data can be analysed at any time, independent of the annual report. Data can be exported directly from the biological therapy audit web tool by clicking the ‘Export data’ function (www.ibdbiologicsaudit.org).
NHS managers Consultant gastroenterologists
6 Sites should continue to monitor safety and efficacy over the long term and should stop biological therapies in patients who have failed to respond to treatment.
In keeping with guidance from the National Institute for Health and Care Excellence (NICE), processes should be put in place to ensure that patients are assessed at 12 months.
Consultant gastroenterologists Infusion clinic staff
13

National clinical audit of biological therapies. Adult report. Septem
ber 2015. UK IBD audit
©
Healthcare Quality Im
provement Partnership 2015
14
National recommendation Action required Staff responsible Progress at your site (Include date of review, name of individual responsible for action)
7 The findings and recommendations of this report should be shared at relevant multidisciplinary team, clinical governance and audit meetings, and a local action plan for implementing change should be devised.
Identify an appropriate time to discuss the results of the audit and decide key priority areas for improvement. Present the findings and recommendations at an appropriate meeting and ensure that action plans for implementing change are devised.
NHS managers Consultant gastroenterologists IBD nurses Members of the IBD team
8 ENTER THE LOCAL ACTIONS YOU HAVE IDENTIFIED HERE
9 ENTER THE LOCAL ACTIONS YOU HAVE IDENTIFIED HERE

National clinical audit of biological therapies. Adult report. September 2015. UK IBD audit
1: Introduction and methods
Introduction Biological therapies are the newest group of drugs to be used in inflammatory bowel disease (IBD). Most of these drugs work by targeting a protein in the body called tumour necrosis factor alpha (TNFα). Overproduction of this protein is thought to be partly responsible for the chronic inflammation in patients with IBD. Biological therapies have revolutionised the treatment of IBD, with usage increasing rapidly in the UK over the past few years. Available data suggest that they are effective treatments, with a relatively low frequency of adverse events. They remain a significant cost burden for hospitals in the UK – approximately £10,000 per patient per year – and thus audit of their effectiveness, safety and appropriateness remains a clinical priority. Further information about biological therapies and their licensing can be found in section 4, p 30.
Aims of the biological therapies audit To assess nationally:
1 the appropriate use/prescribing of biological therapies in the treatment of IBD 2 the efficacy of biological therapies in the treatment of IBD 3 the safety of biological therapies in the treatment of IBD 4 the views of patients with IBD on their quality of life at defined intervals throughout their use of
biological therapies.
Methods This is a prospective audit, with data collection taking place in ‘real time’ during the clinical appointment with the patient. Participating sites are asked to identify and enter data on patients newly started on biological therapies. Data entry takes place in the form of ‘submissions’ to a web-based data collection tool (www.ibdbiologicsaudit.org). A submission refers to data entered in any of the following categories: patient demographics, IBD disease details, initial anti-TNFα treatment, follow-up anti-TNFα treatment and IBD-related surgery. Further detail about each of the categories can be found on p 31 of this report. Definition of a ‘site’ Lead clinicians are asked to collect and submit data on the basis of a unified IBD service that would be registered as a named ‘site’. This is typically a single hospital within a trust / health board, but where more than one hospital under a trust / health board offers independent IBD services, data are entered for separate ‘sites’. Some organisations that run a coordinated IBD service across several hospitals with the same staff participate in the audit as one trust / health board-wide site. Eligibility and participation Sites are eligible to participate in the biological therapies audit if they prescribe and administer biological therapy to their patients with IBD. Of the 159 adult trusts / health boards eligible to participate in the IBD audit in the UK, 152 are participating in the biological therapies element and/or in the Personalised Anti-TNF Therapy in Crohn’s disease (CD) study (PANTs); see below for further information). These 152 trusts / health boards provided the 194 sites that submitted data. Further information on participation and a list of participating and non-participating sites can be found in section 6, p 64 of this report. PANTs This is a 3-year, prospective, uncontrolled, cohort study investigating primary non-response, loss of response and adverse drug reactions to infliximab and adalimumab in patients with severe, active, luminal CD. The collected clinical data are aligned with data collected by the biological therapy audit. Relevant anonymised data from PANTs have been included and analysed in this report. Sites participating in PANTs are reminded that patients not eligible for inclusion in this research study should
15 © Healthcare Quality Improvement Partnership 2015

National clinical audit of biological therapies. Adult report. September 2015. UK IBD audit
still be entered on to the biological therapy audit web tool so that all new starters are captured. Sites submitting data to PANTs are indicated by an asterisk in the list of participating and non-participating sites in section 6, p 64 of this report. Inclusion and exclusion criteria Only patients with diagnosed IBD – that is, CD, ulcerative colitis (UC) and IBD type unclassified (IBDU) – who have been started on biological therapy for the treatment of their IBD are included. Patients of all ages are included in the audit. Sites that do not provide any biological treatment to their patients with IBD are excluded from participation. The process of including and excluding data in national analyses is detailed in the consort diagram on p 18 of this report. Denominators Denominators throughout the report vary depending on the number of submissions to which the analysed data relate. A submission refers to data entered in any of the following categories: patient demographics, IBD disease details, initial treatment, follow-up treatment and IBD-related surgery. For example, a single patient can have multiple initial or follow-up treatments and may have been treated with one or both drug types. The denominators can vary considerably, so readers should review all table notes and explanatory text provided within the report. Data-collection tool Security and confidentiality are maintained during data collection by using unique usernames and passwords; only the lead clinician at each site can authorise local access. Data can be saved during and at the end of an input session, and online help – including definitions and clarifications of data items, internal logical data checks and instant feedback mechanisms – ensure that high-quality data are collected. For an explanation of the different submission types in the biological therapies audit, please see p 31 of this report. Site-level data The small numbers of patients with UC and IBDU mean that site-level data are restricted to patients with CD. The IBD programme steering group, having taken statistical advice, has identified a sample size of fewer than six patients as potentially compromising patient anonymity in the age and gender fields in Table 2. Results in site reports that meet this criterion have therefore been replaced with ‘n<6’. In the case of the national report, no data will appear in the ‘Your site’ columns, but these have been left in situ to show the format of the individualised site reports. Evidence Guidance referred to within this document is taken from the following sources:
• IBD Standards Group, 2013. Standards for the healthcare of people who have inflammatory bowel disease, IBD standards, 2013 update. www.ibdstandards.org.uk [Accessed 16 July 2015].
• Mowat C, Cole A, Windsor A et al, on behalf of the IBD Section of the British Society of Gastroenterology. Guidelines for the management of inflammatory bowel disease in adults. Gut 2011;60:571–607.
• National Institute for Health and Care Excellence, 2008. Technology appraisal 163: Infliximab for acute exacerbations of ulcerative colitis. www.nice.org.uk/guidance/TA163. [Accessed 16 July 2015].
• National Institute for Health and Care Excellence, 2011. Technology appraisal 187: Infliximab (review) and adalimumab for the treatment of Crohn’s disease. www.nice.org.uk/guidance/TA187 [Accessed 16 July 2015].
• National Institute for Health and Care Excellence, 2015. Technology appraisal 329: Infliximab, adalimumab and golimumab for treating moderately to severely active ulcerative colitis after the failure of conventional therapy (including a review of TA140 and TA262). www.nice.org.uk/guidance/TA329 [Accessed 16 July 2015].
16 © Healthcare Quality Improvement Partnership 2015

National clinical audit of biological therapies. Adult report. September 2015. UK IBD audit
• National Institute for Health and Care Excellence, 2015. Quality standard 81: Inflammatory bowel disease. www.nice.org.uk/guidance/QS81 [Accessed 16 July 2015].
• Royal College of Physicians, 2014. Experience of inpatients with ulcerative colitis throughout the UK.
• Royal College of Physicians, 2014. National audit of inflammatory bowel disease (IBD) service provision. Adult report.
• Royal College of Physicians, 2014. National clinical audit of inpatient care for adults with ulcerative colitis.
Availability of audit results in the public domain Full and executive summary copies of this report are available in the public domain via the Royal College of Physicians (RCP) website (www.rcplondon.ac.uk/biologics). The national report of results will be made available to NHS England; the Department of Health, Social Services and Public Safety in Northern Ireland; Healthcare Improvement Scotland; and the Department for Health and Social Services in Wales. A number of key indicators for each of the 194 participating sites are published in the public domain in section 6, pp 64–85 of this report; these findings are also available via www.data.gov.uk, in line with the government’s transparency agenda.
Presentation of results National results are presented as percentages for categorical data and as medians and interquartile ranges (IQRs) for numerical data. This report summarises data on adults provided by sites that registered to participate in the audit and indicated that they provide their IBD service to mainly adult patients. A separate report for paediatric IBD services can be viewed on the RCP website (www.rcplondon.ac.uk/biologics). When measures are comparable, both adult and paediatric data are provided for review.
17 © Healthcare Quality Improvement Partnership 2015

National clinical audit of biological therapies. Adult report. September 2015. UK IBD audit
2: Summary of key results Consort diagram – initial treatment On 28 February 2015, 9460 individual adult patient demographic submissions had been entered on the web tool. Readers are reminded that individual results are often a subset of this number and that the context and actual number of cases should be considered when interpreting findings. Fig 1 is therefore integral to understanding the patient numbers and the reasons that patients were excluded from analysis when considering the results in this report. Fig 1 Consort diagram for initial treatment. CD = Crohn’s disease; IBDU = inflammatory bowel disease type unclassified; UC = ulcerative colitis. All analyses within this report include all patients who were newly started on biological therapies since 12 September 2011 (the start of the audit). A consort diagram detailing patient numbers and reasons for exclusion from follow-up treatment data can be found in Appendix 3, p 96.
n=2001 Adalimumab Patients:
CD (n=1894) UC (n=83)
IBDU (n=24)
n=2717 Infliximab patients:
CD (n=2006) UC (n=633) IBDU (n=78)
n=7395 Patients with
first initial treatments
n=820 Patients from Personalised
Anti-TNF Therapy in CD study (PANTs)
n=3111, Patients excluded because
initial treatment was before 12 September 2011 or patient was not a new
starter on biological therapies n=3898
Patients with complete audit data (demographic, disease, and initial treatment data)
n=7009 Patients with
demographic, disease and initial treatment data
n=8108 Initial treatments
n=7381 Patients with
disease details
n=9460 Patients with
demographic details
n=4718 Patients in
initial treatment analysis
18 © Healthcare Quality Improvement Partnership 2015

National clinical audit of biological therapies. Adult report. September 2015. UK IBD audit
Key data tables Understanding these results The tables in this section use key data items to address the objectives of the biological therapies audit and provide an overall view of the main characteristics of the included patients. It is important to note that this report is patient focused rather than treatment based; therefore, although some of the tables may appear similar to those in the reports produced in 2013 and 2014, these analyses have been conducted differently, so it is not advisable to compare directly with those in the previous reports. Table 1 Patient summary This table provides a summary of the patients and treatments included in the national analysis. The consort diagram in Fig 1 (p 18) shows that only those patients with at least one initial treatment were included in the analyses. Thereafter, the numbers reduce based on whether patients were recorded as having been followed up at 3 and 12 months after initial treatment. For the follow-up timepoint, a 1-month window either side was used in order to best capture patients – eg for 3-month follow-up, data entered 60–120 days after initial treatment were included.
Patient group Initial treatment (n)
3-month follow-up (n)
12-month follow-up (n)
CD patients 3900 1343 520 Adalimumab 1894 525 181 Infliximab 2006 818 339
UC patients 716 176 52 Adalimumab 83 19 3 Infliximab 633 157 49
IBDU Patients 102 42 14 Adalimumab 24 12 2 Infliximab 78 30 12
Total patients 4718 1561 586 YOUR SITE - Patients with CD
CD = Crohn’s disease; IBDU, inflammatory bowel disease type unclassified; UC, ulcerative colitis. Table 2 Key items to compare data from adult and paediatric patients with CD This table compares demographic data for adult and paediatric patients with CD treated with infliximab or adalimumab. The denominators differ when questions were not answered.
General patient characteristics CD
YOUR SITE Adult Paediatric
Total number of patients n=3900 n=579 Gender: male (%, n/N) 47% (1837/3884) 63% (365/579) Age at diagnosis, years, median (IQR)
n=3739 27 (20, 39)
n=566 13 (10, 14)
Age at initial treatment, years, median (IQR)
n=3894 36 (26, 49)
n=578 14 (12, 16)
Time from diagnosis to treatment, years, median (IQR)
n=3739 4 (1, 12)
n=567 1 (1, 2)
CD = Crohn’s disease; IQR = interquartile range.
19 © Healthcare Quality Improvement Partnership 2015

National clinical audit of biological therapies. Adult report. September 2015. UK IBD audit
Table 3 Disease distribution Crohn’s disease can be classified in terms of severity – mild, moderate or severe – or by the Montreal classification, which proposes the maximum extent of involvement as the acute factor.7 This table describes the distribution of CD across audited adult and paediatric patients treated with adalimumab or infliximab.
Disease distribution CD
YOUR SITE Adult (%, n/N)
Paediatric (%, n/N)
n=3900 n=579
Terminal ileum (L1) 27% (1035/3849) 12% (68/573)
Colonic (L2) 31% (1188/3849) 31% (176/573)
Ileocolonic (L3) 36% (1380/3849) 49% (283/573)
None of these 6% (239/3849) 8% (46/573)
Any part of the gut proximal to the terminal ileum (L4)
Yes= 45% (1312/2925)
Yes= 71% (352/495)
Perianal involvement Yes= 31% (838/2688)
Yes= 47% (187/397)
CD = Crohn’s disease.
20 © Healthcare Quality Improvement Partnership 2015

National clinical audit of biological therapies. Adult report. September 2015. UK IBD audit
Table 4 Response to therapy This table shows response to therapy in patients with CD who were treated with infliximab or adalimumab. Results are displayed at the 3-month follow-up timepoint. The Harvey–Bradshaw index (HBI) is used to quantify disease activity for adult patients with CD. The Paediatric Crohn’s Disease Activity Index (PCDAI) is used to measure disease activity for paediatric patients with CD. The denominators change when dates of diagnosis for patients are missing.
CD patient group Response to treatment* at 3-month follow-up (%, n/N) Time from diagnosis to initial treatment in years <1 1–2 3–5 6–10 >10 Total
Adult 79% (121/154)
79% (115/145)
80% (89/112)
81% (86/106)
77% (159/207)
80% (570/715)
Paediatric 73% (35/48)
78% (52/67)
82% (18/22)
75% (9/12)
0% (0/0)
77% (114/149)
YOUR SITE *Decrease of >3 in Harvey–Bradshaw index for adult patients and >15 in Paediatric Crohn’s Disease Activity Index for paediatric patients. CD = Crohn’s disease. Table 5 Remission achieved This table shows whether remission was achieved in patients with CD who were treated with infliximab or adalimumab. Results are displayed at the 3-month follow-up timepoint. As before, the HBI was used to quantify disease activity in adults with CD and the PCDAI to measure disease activity for paediatric patients with CD, and the denominators change when dates of diagnosis for patients are missing.
CD patient group Remission* achieved when followed up at 3 months (%, n/N) Time from diagnosis to initial treatment in years <1 1–2 3–5 6–10 >10 Total
Adult 68% (105/155)
67% (101/150)
72% (83/116)
71% (78/110)
64% (135/210)
68% (502/741)
Paediatric 59% (30/51)
66% (45/68)
68% (15/22)
75% (9/12)
0% (0/0)
55% (54/99)
YOUR SITE *Harvey–Bradshaw index (HBI) score <4 for adult patients and Paediatric Crohn’s Disease Activity Index (PCDAI) score <10 for paediatric patients. CD = Crohn’s disease. Table 6 Concomitant therapy This table shows the percentage of all adult patients with CD on any immunosuppressant or steroid as concomitant therapy during their treatment with biological therapies. Data collected in PANTs have not been included in this analysis owing to time constraints but are expected to be included in the next report.
Type of concomitant therapy Treatment time (%, n/N) Initial treatment 3-month follow-up 12-month follow-up
Immunosuppressants* 53% (1644/3080) 48% (479/1000) 48% (192/404)
YOUR SITE
Steroids† 27% (819/3080) 6% (64/1000) 5% (21/404)
YOUR SITE
*Immunosuppressants include azathioprine, mercaptopurine and methotrexate. †Steroids include budesonide, hydrocortisone, methylprednisolone and prednisolone.
21 © Healthcare Quality Improvement Partnership 2015

National clinical audit of biological therapies. Adult report. September 2015. UK IBD audit
Table 7 Analysis of results over time This table compares some key results over time for adults with IBD included in the audit according to reporting timescales. A reduction in site participation between 2014 and 2015 was due to the reconfiguration of services across sites during the year.
Result
Audit period
June 2012 (12.09.11–29.02.12)
August 2013 (01.03.12–28.02.13)
September 2014 (01.03.13–28.02.14)
September 2015 (01.03.14–28.02.15)
Participation in the biological therapy audit Adult sites with data included in analysis (n) 78 94 143 134
Adult patients audited initiating biological therapies Patients with CD (n) 347 837 1252 1464 Patients with UC (n) 49 146 236 285 Patients with IBDU (n) 20 29 22 31 Total (n) 416 1012 1510 1780
Treatment time Time from diagnosis to initial treatment (years, median IQR)
n=413 4 (1, 11)
n=1007 4 (1, 11)
n=1475 4 (1, 12)
n=1657 4 (1, 10)
Adverse events Adverse events reported at initial treatment (%, n/N) 2% (9/416) 3% (26/1012) 3% (40/1510) 2% (42/1780)
Disease activity reported at initial treatment for adult patients
HBI score, median (IQR) n=226 6 (0, 10)
n=421 9 (6, 12)
n=710 8 (4, 11)
n=925 7 (4, 10)*
SCCAI score, median (IQR) n=44 6 (0, 9)
n=90 9 (6, 11)
n=99 8 (6, 11)
n=129 9 (6, 12)
Adult patients with CD on concomitant therapies at initial treatment Immunosuppressants (%, n/N) 54% (189/347) 58% (482/837) 38% (473/1252) 34% (500/1464)*
Steroids (%, n/N) 27% (93/347) 27% (222/837) 22% (274/1252) 16% (230/1464)
*p<0.001. CD = Crohn’s disease; HBI = Harvey–Bradshaw index; IBDU = inflammatory bowel disease type unclassified; IQR = interquartile range; SCCAI = Simple Clinical Colitis Activity Index; UC = ulcerative colitis.
22 © Healthcare Quality Improvement Partnership 2015

National clinical audit of biological therapies. Adult report. September 2015. UK IBD audit
Table 8 National comparison of key results for adults with CD This table depicts national variation in the results of the biological therapy audit between England, Northern Ireland, Scotland and Wales. It only includes sites that submitted enough data to be included in the national analysis. A full list of participating and non-participating sites can be found in section 6, p 64 of this report.
Result Country
England Northern Ireland Scotland Wales
Sites participating in the audit (%, n/n) 84% (141/167)
75% (9/12)
52% (11/21)
44% (7/16)
Patients audited (n) 3531 90 126 153 Time from diagnosis to initial treatment (years, median (IQR))
n=3379 4 (1, 12)
n=90 4 (1, 10)
n=119 5 (1, 12)
n=151 4 (1, 12)
Patients with an adverse reaction recorded during initial treatment (%, n/n)
3% (97/3531)
2% (2/90)
2% (3/126)
3% (4/153)
Disease severity (HBI) at initial treatment, median (IQR)
n=2082 8 (4, 11)
n=27 9 (5, 11)
n=66 6 (3, 9)
n=109 7 (4, 10)
Patients with follow-up recorded at 3 months (%, n/N)
35% (1238/3531)
11% (10/90)
31% (39/126)
37% (56/153)
Patients on biological therapy who were appropriately prescribed anti-TNFα in compliance with NICE technology appraisal 1872 criterion 1.1 (%, n/N)
46% (949/2082)
56% (15/27)
33% (22/66)
46% (50/109)
HBI = Harvey–Bradshaw index; IQR = interquartile range; TNFα = tumour necrosis factor alpha.
23 © Healthcare Quality Improvement Partnership 2015

National clinical audit of biological therapies. Adult report. September 2015. UK IBD audit
Tables 9 and 10 Biological therapies audit case ascertainment These two tables compare results as reported in the National audit of inflammatory bowel disease (IBD) service provision (September 2014).8 Sites participating in this audit were asked to report on the number of patients with IBD who had newly started on infliximab or adalimumab between 1 January 2013 and 31 December 2013. Sites were able to indicate whether the figure was an estimate or was taken from an existing database of patients. The number of patients reported as newly started on biological therapy in the organisational audit was then compared with the actual number of patients audited in the biological therapy audit for the same time period and used to produce a case ascertainment figure.
Patients newly started on adalimumab National YOUR SITE Patients with IBD who were newly started on adalimumab between 1 January 2013 and 31 December 2013, as reported in organisational audit (September 2014)8 (n)
2692 (reported by 171 sites)
Newly started patients – estimated (n) 949 (reported by 69 sites)
Newly started patients – taken from a database (n) 1728 (reported by 101 sites)
Newly started patients – taken from unknown source (n) 15 (reported by 1 site)
Patients with IBD entered into biological therapies audit who were newly started on adalimumab between 1 January 2013 and 31 December 2013 (n)
566
Case ascertainment rate (%) 21% IBD = inflammatory bowel disease.
Patients newly started on infliximab National YOUR SITE Patients with IBD who were newly started on infliximab between 1 January 2013 and 31 December 2013, as reported in organisational audit (September 2014)8 (n)
3400 (reported by 170 sites)
Newly started patients – estimated (n) 1330 (reported by 68 sites)
Newly started patients – taken from a database (n) 2048 (reported by 101 sites)
Newly started patients – taken from unknown source (n) 22 (reported by 1 site)
Number of patients with IBD who were newly started on infliximab between 1 January 2013 and 31 December 2013, as entered into biological therapies audit (n)
793
Case ascertainment rate (%) 23% IBD = inflammatory bowel disease.
24 © Healthcare Quality Improvement Partnership 2015

National clinical audit of biological therapies. Adult report. September 2015. UK IBD audit
Audit objectives Safety Table 11 Adverse events This table shows the percentage of all adult patients for whom an adverse reaction was recorded during their treatment, by type of reaction.
Adverse event (%, n) Initial treatment (n=4718)
3-month follow-up (n=1516)
12-month follow-up (n=586)
Adverse event recorded Yes= 3% (117) 8% (126) 6% (33)
Abdominal pain 0.04% (2) 0.3% (5) 0.2% (1) Alopecia 0% (0) 0.1% (1) 0.2% (1) Angioedema of upper airway 0.06% (3) 0.1% (2) 0.2% (1) Arthralgia 0.3% (13) 0.6% (10) 0% (0) Blood abnormality 0.02% (1) 0.4% (7) 0% (0) Bronchospasm (cough/wheeze/dyspnoea) 0.3% (13) 0.5% (8) 0.5% (3)
Cardiac failure 0% (0) 0% (0) 0% (0) Chest pain 0.1% (5) 0.1% (1) 0% (0) Chills 0.04% (2) 0.1% (1) 0.9% (5) Confirmed demyelination 0.04% (2) 0% (0) 0% (0) Death 0% (0) 0.1% (1) 0% (0) Difficulty breathing 0% (0) 0.2% (3) 0% (0) Dizziness 0.3% (12) 0.4% (6) 0% (0) Fatigue 0.1% (5) 0.3% (5) 0.2% (1) Fever 0.2% (9) 0.2% (3) 0% (0) Flushing 0.3% (16) 0.7% (11) 0.2% (1) Headache 0.4% (21) 0.4% (6) 0.5% (3) Hypotension 0.1% (5) 0.3% (4) 0% (0) Infection 0.1% (4) 2% (36) 2% (11) Injection site reaction 0.1% (4) 0.2% (3) 0% (0) Itching 0.3% (12) 0.3% (5) 0.2% (1) Limb weakness 0.04% (2) 0.1% (1) 0% (0) Malignancy 0% (0) 0% (0) 0% (0) Nausea 0.4% (17) 0.7% (11) 0.2% (1) Panic attacks 0.1% (5) 0.1% (1) 0% (0) Rash 0.4% (18) 1% (21) 0.3% (2) Serum sickness-like reaction 0% (0) 0% (0) 0% (0) Urticaria 0.04% (2) 0.3% (4) 0% (0) Other 0.7% (32) 2% (24) 2% (10)
25 © Healthcare Quality Improvement Partnership 2015

National clinical audit of biological therapies. Adult report. September 2015. UK IBD audit
Efficacy Disease activity for adult patients at the time of initial treatment was compared with that at the follow-up nearest to 3 and 12 months from the date of the initial treatment. Follow-up data include only those patients who had an initial treatment. Table 12 Disease activity – CD When severity of CD is classified by HBI, a score <5 is considered to be clinical remission and >16 is considered to be severe disease.
HBI score Initial treatment 3-month follow-up 12-month follow-up
Adalimumab, median (IQR) n=1081 8 (4, 11)
n=264 3 (1, 6)
n=95 3 (1, 5)
Infliximab, median (IQR) n=1201 7 (4, 10)
n=524 2 (1, 5)
n=215 2 (0, 4)
Total n=2282 8 (4, 10)
n=788 3 (1, 6)
n=310 2 (0, 5)
YOUR SITE
HBI = Harvey–Bradshaw index; IQR = interquartile range. Table 13 Disease activity – UC When severity of UC is classified by SCCAI, a score of <3 is considered to be remission and >13 is considered to be severe disease.
SCCAI score Initial treatment 3-month follow-up 12-month follow-up
Adalimumab, median (IQR) n=41 7 (6, 8)
n=9 3 (1, 6) n=2
Infliximab, median (IQR) n=321 9 (6, 11)
n=77 2 (0, 6)
n=18 3 (1, 4)
Total n=362 9 (6, 11)
n=86 2 (0, 5)
n=20 3 (1, 4)
IQR = interquartile range; SCCAI = Simple Clinical Colitis Activity Index. Table 14 Surgery This table shows combined surgical activity for patients with CD, UC and IBDU recorded in the 6 months before and after treatment with biological therapies. Further information about the surgical data collected in the biological therapies audit can be found on p 60 of this report.
Surgical activity Adult (%, n/N))
Paediatric (%, n/N)
Pre-treatment surgery recorded Yes 23% (1066/4718) 9% (65/696) Patients with surgery recorded 6 months before starting biological therapies 5% (244/4718) 6% (39/696)
Patients with surgery recorded 6 months after starting biological therapies 3% (157/4718) 5% (31/696)
26 © Healthcare Quality Improvement Partnership 2015

National clinical audit of biological therapies. Adult report. September 2015. UK IBD audit
Appropriateness of prescribing anti-TNFα Detailed information about the NICE guidance and recommendations for use of biological therapies in patients with IBD in the UK can be found in section 4, p 30 of this report. In Tables 15 and 16, NICE criterion 1.1 from technology appraisal 1872 and criterion 1.1 from technology appraisal 3293 have been used to assess the appropriateness of prescribing biological therapy. Table 15 Compliance with NICE technology appraisal 187 This table shows compliance with criterion 1.1 of NICE technology appraisal 1872 in adult patients with CD. Patients with no recorded HBI were excluded from this analysis.
NICE technology appraisal 187 National CD data, % (n/N) YOUR SITE
Criterion 1.1 Infliximab and adalimumab are recommended as treatment options for adults with severe active CD if (a) the disease has not responded to conventional therapy or (b) the person is intolerant of or have contraindications to conventional therapy (mercaptopurine, azathioprine, methotrexate, prednisolone, budesonide, methylprednisolone or hydrocortisone)
Patients with CD on biological therapy with HBI score ≥8 before starting anti-TNFα treatment 51% (1159/2282)
Patients with CD who were treated with conventional therapy at time of or prior to starting biological therapy 86% (1951/2282)
Patients with CD on biological therapy who were appropriately prescribed anti-TNFα treatment in compliance with criterion 1.1 of NICE technology appraisal 187
45% (1035/2282)
CD = Crohn’s disease; HBI = Harvey–Bradshaw index; NICE = National Institute for Health and Clinical Excellence; TNFα = tumour necrosis factor alpha. Although compliance with NICE guidance seems to be low for patients with CD, many patients are likely to have had the prerequisite disease activity before starting biological therapy. Many patients will have been treated with corticosteroids, resulting in the observed values. Table 16 Compliance with NICE technology appraisal 329 This table shows compliance with criterion 1.1 of NICE technology appraisal 3293 in adult patients with UC. Patients with no recorded SCCAI were excluded from this analysis.
NICE technology appraisal 329 National UC data (%, n/N)
Criterion 1.1 Infliximab, Adalimumab and golimumab are recommended as treatment options for adults with moderate to severe active UC (a) whose disease has responded inadequately to conventional therapy or (b) are intolerant of or have contraindications to conventional therapy (mercaptopurine, azathioprine, methotrexate, prednisolone, budesonide, methylprednisolone or hydrocortisone)
Patients on biological therapy with SCCAI score ≥5 before starting anti-TNFα treatment
87% (276/318)
Patients who were treated with conventional therapy at time of or prior to starting biological therapy
95% (301/318)
Patients on biological therapy who were appropriately prescribed anti-TNFα therapy in compliance with criterion 1.1 of NICE technology appraisal 329
82% (262/318)
SCCAI = Simple Clinical Colitis Activity Index; NICE = National Institute for Health and Care Excellence; TNFα = tumour necrosis factor alpha; UC = ulcerative colitis.
27 © Healthcare Quality Improvement Partnership 2015

National clinical audit of biological therapies. Adult report. September 2015. UK IBD audit
Patient-reported outcome measures Table 17 PROMs questionnaire for IBD (IBD-PROM) This table gives completion rates and results of the IBD-PROM questionnaires used in the biological therapies audit – the EQ-5D9 and Crohn’s and ulcerative colitis questionnaire (CUCQ)-1210 – for all adult patients calculated. Total EQ-5D scores range from 0 (worst health / death) to 1 (best health), with an increase in score denoting improved health. Total CUCQ-12 scores range from 0 (best health) to 168 (poor health), with each question scored between 0 (best) and 14 (poor). Further information about the EQ-5D and CUCQ-12 can be found on pp 62–63 of this report.
IBD-PROM Initial treatment 3-month follow-up
12-month follow-up
Patients with completed IBD-PROM (%, n/N)
30% (1416/4718)
25% (384/1561)
22% (129/586)
YOUR SITE number of patients with IBD-PROM completed
Patients with EQ-5D data completed, (%, n/N)
97% (1367/1416)
94% (361/384)
44% (57/129)
EQ-5D score, median (IQR) 0.76 (0.66, 0.85) 0.80 (0.73, 1) 0.80 (0.69, 1) Patients with CUCQ-12 data completed (%, n/N)
89% (1256/1416)
87% (332/384)
87% (112/129)
CUCQ-12 score, median (IQR) 68 (39, 100) 34 (14, 60) 27 (10, 49) CUCQ = Crohn's and ulcerative colitis questionnaire; IBD = inflammatory bowel disease; IQR = interquartile range; PROMs = patient-reported outcome measures.
28 © Healthcare Quality Improvement Partnership 2015

National clinical audit of biological therapies. Adult report. September 2015. UK IBD audit
3: Background information The burden of inflammatory bowel disease The inflammatory bowel diseases UC and CD are lifelong inflammatory conditions that involve the gastrointestinal tract. The incidence of IBD has risen dramatically in recent decades and continues to do so; it is reported to be as high as 24.3 and 12.7 per 100,000 persons per year in Europe for UC and CD, respectively. The reported prevalence in Europe is as high as 505 and 322 per 100,000 persons for UC and CD, respectively.11 Inflammatory bowel disease first presents most commonly in the second and third decades of life, but much of the recent increase has been observed in childhood, notably with CD in children increasing threefold in 30 years. Between 20% and 30% of patients with UC will require colectomy, and about 50–70% of patients with CD require surgery. The main symptoms of both conditions include diarrhoea, abdominal pain, anaemia and an overwhelming sense of fatigue, with, for some patients, associated features such as arthritis, anal disease, fistulae, abscesses and skin problems, which can also contribute to poor quality of life. In addition, IBD has wide-ranging effects on growth and pubertal development, psychological health, education and employment, family life, fertility and pregnancy. Effective multidisciplinary care can attenuate relapse, prolong remission, treat complications and improve quality of life. The UK IBD audit The UK IBD audit seeks to improve the quality and safety of care for all patients with IBD throughout the UK by auditing individual patient care and the provision and organisation of IBD service resources and by reporting on inpatient experience and PROMs. The biological therapies audit is one element of the wider UK IBD audit. This report follows the national reports published in 2012, 2013 and 2014. It builds on the previous reports as a continuous audit with increasing rates of participation, and it provides further evidence about the safety, efficacy and appropriate use of biological therapies. Furthermore, it enables participating sites to benchmark their performance against national data. All data should be considered within the context of the actual number of treatments. Further information on the work of the UK IBD audit project can be accessed via the IBD page of the RCP website (www.rcplondon.ac.uk/ibd). The benefits of the biological therapies audit The biological therapies audit is an electronic register of patients receiving treatment and enables IBD teams to: • monitor the disease activity of patients over the course of their treatment with biological drugs • monitor and encourage improved management at patient and service levels, data on adverse
events, dose escalation and treatment regimens • capture the views of patients locally on their quality of life at intervals throughout their treatment • benchmark local results against national-level data • generate individual patient summaries • generate letters detailing treatment plans • assess compliance with the IBD standards and NICE quality standard 81.1,4
29 © Healthcare Quality Improvement Partnership 2015

National clinical audit of biological therapies. Adult report. September 2015. UK IBD audit
4: The biological therapies audit What is the role of biological therapy in the treatment of IBD? Infliximab Infliximab (Remicade®) is a chimeric anti-TNFα monoclonal antibody with potent anti-inflammatory effects that are possibly dependent on apoptosis of inflammatory cells. Controlled trials have demonstrated efficacy in both active and fistulating CD. Infliximab is typically administered via an intravenous infusion during a hospital appointment under the supervision of a suitably qualified health professional. Adalimumab Adalimumab (Humira™) is a recombinant human immunoglobulin (IgG1) monoclonal antibody containing only human peptide sequences. Adalimumab is typically delivered via a self-administered injection. Patients are provided with a home supply of the medication and, following tuition and close monitoring, are able to manage their own treatment with regular medical follow-up. Approval in the UK In multi-technology appraisal 187 for patients with CD,2 NICE made the following recommendations:
• Infliximab and adalimumab may be used within their licensed indications as treatment options for adults with severe active CD, whose disease has not responded to conventional therapy (including immunosuppressive and/or corticosteroid treatments).
• Infliximab has been recommended for the treatment of active fistulating CD in patients whose disease has not responded to conventional therapy or have medical contraindications for such therapies.
• Infliximab is recommended for the treatment of people aged 6–17 years with severe, active CD, whose disease has not responded to conventional therapy (including corticosteroids, immunomodulators and primary nutrition therapy) or have contraindications to conventional therapy.
• Infliximab and adalimumab should be given as a planned course of treatment until treatment failure (including the need for surgery) or until 12 months after the start of treatment, whichever is shorter. Patients’ disease should then be reassessed to determine whether ongoing treatment is still clinically appropriate.
In multi-technology appraisal 329 for patients with UC,3 NICE made the following recommendations:
• Infliximab and adalimumab may be used within their licensed indications as treatment for moderate to severe active UC in adults whose disease has responded inadequately to conventional therapy or who cannot tolerate or have medical contraindications for such therapies.
• Infliximab has been recommended for treating severely active UC in children and young people aged 6–17 years whose disease has responded inadequately to conventional therapy or who cannot tolerate or have medical contraindications for such therapies.
• Infliximab or adalimumab should be given as a planned course of treatment until treatment failure (including the need for surgery) or until 12 months after the start of treatment, whichever occurs first. Patients’ disease should then be reassessed to determine whether ongoing treatment is still clinically appropriate.
In technology appraisal 163,12 NICE made the following recommendation:
• Infliximab as an option for the treatment of acute exacerbations of severely active UC only in patients for whom ciclosporin is contraindicated or clinically inappropriate.
30 © Healthcare Quality Improvement Partnership 2015

National clinical audit of biological therapies. Adult report. September 2015. UK IBD audit
Data entry into the biological therapies audit Data entry takes place in the form of ‘submissions’ to a web-based data collection tool. A submission refers to data entered in any of the following categories: patient demographics, IBD details, initial treatment, follow-up treatment and IBD-related surgery. Once all mandatory fields are completed within a category, the data are locked to form a completed submission, and they are then suitable for inclusion in national findings. Only locked data can be viewed by the UK IBD audit project team. The full audit dataset is available from the RCP website (www.rcplondon.ac.uk/biologics). Patient demographics category Patients are identified prospectively when the decision to treat using biological therapies is made by a clinician. The demographic details of this patient are entered using the web tool; this includes a number of patient identifiers that are pseudonymised at the point of data entry and are visible only to the participating site. Details of the patient’s consultant and GP can also be entered, although this is not mandatory for the audit. Disease details category This section requires sites to provide details of the patient’s IBD history, including the extent of their disease, any related comorbid conditions and details of any surgical procedures undertaken prior to the initiation of biological therapies. Initial treatment category This section collects details of the initial or baseline treatment. The site indicates whether the patient has CD, UC or IBDU and whether they are being treated with adalimumab or infliximab. The system then generates appropriate questions for these options. Information is collected about pre-treatment investigations and screening up to the point of completion or abandonment of the treatment, with details of any treatment reactions that occur. Follow-up treatment category Each follow-up treatment that is entered must relate to a previously entered initial treatment submission. An unlimited number of follow-up treatments can be completed to allow outgoing data collection as the patient continues to be treated with biological therapies. The outcome of each follow-up treatment – that is, whether treatment will continue or be stopped – must be provided. Details of any adverse events are recorded for each follow-up treatment. IBD-related surgery category Details of IBD-related surgery can be added to the web tool at any time. A prompt to update this section of the web tool appears at the conclusion of all initial and follow-up treatment submissions. This allows identification of any escalation of treatment that is required while a patient is being treated with biological therapy. PROMs category Data on PROMs are collected at initial treatment and can then be recorded at any additional follow-up. For the purpose of the audit, the PROMs completed at 3- and 12-month follow-up treatments are of interest. For further information about PROMs data, see pp 62–63.
31 © Healthcare Quality Improvement Partnership 2015

National clinical audit of biological therapies. Adult report. September 2015. UK IBD audit
Continued development of the biological therapies audit web tool The biological therapies audit web tool has been continually updated and developed in line with the requirements identified through feedback from participants and to reflect emerging evidence. Some examples of the adaptations made to date are summarised below. Biosimilars From March 2015, to reflect emerging evidence and changing practice, the biological therapies audit was expanded to allow auditing of patients who are newly started on biosimilar versions of the biological drugs. Existing patients This was one of the first adaptations of the system and allowed the inclusion of data for patients already established on biological therapy in addition to those newly started on these drugs. This allowed sites to begin to build their own local registers of patients being treated with biological therapies. This report does not contain analyses of data entered for patients already established on biological therapy; data for these patients are collected only by those sites that wish to use the data at a local level. Reporting functions Sites can produce patient and treatment summary reports when required; these are summarised briefly below.
Patient summary report This is a printable summary of all treatments provided for a specific patient over the course of their management; details of any adverse events, acute reactions and relevant surgery are listed. A graphical display of the patient’s disease severity scores over time allows a simple visual representation of the success/failure of treatment to encourage action when required. The patient summary can be filed in the patient’s case notes or provided with an accompanying letter to the patient’s GP.
Treatment summary report This is a printable summary of any isolated initial or follow-up treatment; again, this can be filed in the case notes to avoid duplication of effort or included in correspondence with a GP to inform them of the treatment provided to their patient on any particular occasion. Data import function The ‘Import data’ function allows users to upload data held in other spreadsheets or registers directly into the biological therapy audit web tool through a simple template. This avoids duplication of both effort and data entry on sites. Reduction of mandatory fields Following feedback from users regarding the length of time taken to enter submissions onto the web tool, the number of mandatory fields is under constant review and is regularly reduced to make the process of entering and locking data faster and simpler. Download function Users are able to download their previous site reports, printable versions of the audit tools, help notes and a user guide to assist them with data entry. Data export function Users are able to export all data that they have submitted since the start of the audit directly from the audit web tool. Data are exported in the form of an editable Excel file.
32
© Healthcare Quality Improvement Partnership 2015

National clinical audit of biological therapies. Adult report. September 2015. UK IBD audit
Dashboard The dashboard is the latest development for the web tool. It is split into various sections, each giving sites a glance at their activity on the audit to date. Fig 2 outlines the functions available on the dashboard. Fig 2 Functions of the biological therapy audit dashboard
Patient summary This gives an overview of how many patients have been added to the web tool by the site. It also flags up any patients for whom a follow-up treatment has not been recorded in the last 90 days.
Performance summary This gives the site an idea of how well they are performing in terms of locking their complete submissions. A happy, neutral or unhappy face is displayed depending on the percentage of locked submissions.
Submissions summary This pie chart displays locked versus unlocked submissions. When the link is clicked, the site can see all of their unlocked submissions.
Patients initiating biologics graph This shows how many patients the site has started on each of the different biological therapies.
Activity over time This gives sites an overview of submissions entered in each category over time, including the year of data entry.
33 © Healthcare Quality Improvement Partnership 2015

National clinical audit of biological therapies. Adult report. September 2015. UK IBD audit
System security of the biological therapies audit web tool The document Biological therapies audit system and hosted server security details outlines the system security information provided to all sites invited to participate in the audit and is available on the RCP website (www.rcplondon.ac.uk/biologics).13 The document gives an overview of the security measures in place, while providing assurance that security procedures designed by Microsoft and other industry-standard bodies have been followed. The contracted system developer also implemented the recommended procedures contained within the NHS document Securing web infrastructure and supporting services good practice guideline.14 Further details can be found on the following: physical data centre (location, security, admission control, climatisation, electricity and fire protection), operating system (version, user access, security, encryption, updates and patches, and backups), database software (version, user access and encryption) and application software (source control, user access and encryption). The purpose of collecting patient-identifiable data was to make the system useful for staff at a local site level by enabling full monitoring and interpretation of the data for the purpose of immediate local service improvement and patient care. Patient-identifiable data can be viewed only by registered members of the local team, whose access to the site will have been approved via the local clinical lead (nearly always a consultant gastroenterologist). Sites using the web tool cannot view data entered at other participating sites. The UK IBD audit project team have administrative control to analyse anonymised data only and are not able to view any patient-identifiable information. In accordance with the principles of the Data Protection Act, sites participating in the biological therapies audit are reminded that patients should be informed of the use of their data by means of the information leaflets and posters provided by the UK IBD audit project team.
34 © Healthcare Quality Improvement Partnership 2015

National clinical audit of biological therapies. Adult report. September 2015. UK IBD audit
5: Full national audit results tables
Crohn’s disease details
CD: disease details
Frequency (%, n) Infliximab Adalimumab National (n=2006)
YOUR SITE National (n=1894)
YOUR SITE
Diagnosis
Maximal disease distribution at the time of decision to initiate biological therapy, as defined by the Montreal classification
(n=1973) (n=1876)
Terminal ileum (L1) 25% (501) 29% (534)
Colonic (L2) 34% (671) 28% (517)
Ileocolonic (L3) 34% (678) 37% (702)
None of these 6% (123) 7% (123) Any part of the gut proximal to the terminal ileum (L4) (n=1438) (n=1487)
Yes 42% (604) 48% (708)
Perianal involvement? (n=1357) (n=1331)
Yes 36% (484) 27% (354) Time between date of diagnosis and date of initial treatment (n=1912) (n=1823)
<1 year 26% (497) 18% (330)
1–2 years 18% (351) 20% (367)
3–5 years 15% (287) 16% (294)
6–10 years 15% (287) 17% (314)
>10 years 26% (490) 28% (518) CD = Crohn’s disease.
35 © Healthcare Quality Improvement Partnership 2015

National clinical audit of biological therapies. Adult report. September 2015. UK IBD audit
Crohn’s disease initial treatment
CD: initial treatment
Frequency (%, n) Infliximab Adalimumab National (n=2006)
YOUR SITE National (n=1894)
YOUR SITE
Consent
Was informed consent to receive anti-TNFα treatment taken from this patient?
Yes 98% (1973) 99% (1872)
No 2% (33) 1% (22)
If yes, was this verbal or written? (n=1973) (n=1872)
Verbal 63% (1247) 63% (1175)
Written 37% (726) 37% (697)
Treatment details
Time between date of decision to start and date of initial treatment (first loading dose)
Median (IQR) time (days) 16 (6, 36) 21 (10, 42) What was the clinical indication for this treatment? (n=1926) (n=1851)
Severe perianal CD 15% (297) 9% (157)
Active luminal CD 81% (1560) 88% (1625)
Fistulating CD 1% (22) 0.5% (10)
Other clinical indication 2% (29) 1% (21)
Not known 1% (19) 2% (38)
Dose given at this infusion (mg/kg) (n=1594)
5 100% (1590) NA NA
10 0.3% (4) NA NA
Duration of infusion (mins) (n=1105)
30 0.3% (3) NA NA
60 0.7% (8) NA NA
120 95% (1054) NA NA
180 3% (37) NA NA
240 0.2% (2) NA NA
Other 0.1% (1) NA NA
Infusion completion outcome (n=1528)
Completed successfully at prescribed rate 98% (1492) NA NA
Completed successfully at lower rate 0.9% (13) NA NA Restart infusion at lower rate and discontinued 0.2% (3) NA NA
Infusion discontinued and not restarted 1% (19) NA NA
Other 0.1% (1) NA NA CD = Crohn’s disease; IQR = interquartile range; NA = not applicable; TNFα = tumour necrosis factor alpha.
36 © Healthcare Quality Improvement Partnership 2015

National clinical audit of biological therapies. Adult report. September 2015. UK IBD audit
CD: initial treatment
Frequency (%, n) Infliximab Adalimumab National (n=2006)
YOUR SITE National (n=1894)
YOUR SITE
Treatment details continued
Induction dose (mg) (n=1870)
160/80 NA NA 80% (1492)
80/40 NA NA 18% (342)
Other NA NA 2% (36)
Planned maintenance dose (mg) (n=1662)
40 mg every other week NA NA 95% (1573)
40 mg every week NA NA 5% (74)
Other NA NA 0.9% (15)
Were any adverse events recorded for this treatment?
Yes 3% (58) 3% (48)
Which adverse events? (more than one may have been selected)
Abdominal pain 0.1% (1) 0.1% (1)
Angioedema of upper airway 0.1% (2) 0.1% (1)
Arthralgia 0.5% (9) 0.2% (3)
Blood abnormality 0% (0) 0.1% (1)
Bronchospasm (cough/wheeze/dyspnoea) 0.5% (10) 0.1% (1)
Chest pain 0.1% (3) 0.1% (1)
Chills 0% (0) 0.1% (2)
Confirmed demyelination 0% (0) 0.1% (2)
Dizziness 0.2% (4) 0.3% (5)
Fatigue 0.1% (2) 0.1% (2)
Fever 0.3% (6) 0.1% (2)
Flushing 0.6% (12) 0% (0)
Headache 0.6% (13) 0.3% (6)
Hypotension 0.1% (2) 0.1% (1)
Infection 0.1% (1) 0.2% (3)
Injection site reaction 0% (0) 0.2% (4)
Itching 0.4% (8) 0.2% (3)
Nausea 0.3% (6) 0.5% (9)
Panic attacks 0.1% (1) 0% (0)
Rash 0.5% (9) 0.5% (9)
Serum sickness-like reaction 0% (0) 0% (0)
Urticaria 0.1% (2) 0% (0)
Other 0.4% (8) 0.2% (4) CD = Crohn’s disease; NA = not applicable.
37 © Healthcare Quality Improvement Partnership 2015

National clinical audit of biological therapies. Adult report. September 2015. UK IBD audit
CD: initial treatment
Frequency (%, n) Infliximab Adalimumab National (n=2006)
YOUR SITE National (n=1894)
YOUR SITE
Treatment details continued Is the patient receiving any concomitant therapies for the management of IBD at the time of this treatment?
(n=1528) (n=1552)
Yes 75% (1140) 72% (1120)
If yes, indicate which concomitant therapies (more than one may have been selected)
Allopurinol 0.3% (4) 0.1% (1)
Azathioprine/mercaptopurine 51% (772) 45% (701)
5-aminosalicylic acid 20% (300) 17% (267)
Antibiotics 2% (28) 1% (16)
Ciclosporin 0.1% (2) 0% (0)
Dietary therapy 3% (42) 2% (36)
Methotrexate 4% (62) 7% (113)
Mycophenolate 0.1% (2) 0% (0)
Steroids 27% (412) 26% (407)
Other 1% (16) 2% (25) Has the patient failed to respond or are they intolerant to immunosuppressive drugs / corticosteroids?
(n=2006) (n=1894)
Yes 62% (1250) 69% (1313)
If yes, indicate which previous therapies (more than one may have been selected)
Allopurinol 0.1% (2) 0% (0)
Azathioprine/mercaptopurine 42% (835) 49% (933)
5-aminosalicylic acid 16% (324) 17% (326)
Antibiotics 7% (145) 6% (104)
Anti-TNFα 4% (82) 10% (183)
Ciclosporin 0.2% (4) 0.1% (2)
Dietary therapy 5% (100) 4% (84)
Methotrexate 6% (115) 9% (162)
Mycophenolate 0.1% (3) 0.1% (2)
Steroids 30% (606) 29% (547)
Tacrolimus 0.1% (1) 0.1% (1)
Topical 0% (0) 0.1% (1)
Ustekinumab 0% (0) 0.1% (1)
Other 0.7% (14) 0.8% (16) CD = Crohn’s disease; IBD = inflammatory bowel disease; TNFα = tumour necrosis factor alpha.
38 © Healthcare Quality Improvement Partnership 2015

National clinical audit of biological therapies. Adult report. September 2015. UK IBD audit
CD: initial treatment
Frequency (%, n) Infliximab Adalimumab National (n=2006)
YOUR SITE National (n=1894)
YOUR SITE
Disease severity score
Severity of disease (n=1107) (n=1160)
Mild 7% (75) 6% (67)
Moderate 43% (480) 45% (526)
Severe 50% (552) 49% (567) CD = Crohn’s disease.
39 © Healthcare Quality Improvement Partnership 2015

National clinical audit of biological therapies. Adult report. September 2015. UK IBD audit
Crohn’s disease follow-up treatment at 3 months
CD: follow-up treatment at 3 months
Frequency (%, n) Infliximab Adalimumab National (n=818)
YOUR SITE National (n=525)
YOUR SITE
Follow-up treatment details
Infliximab dose given (mg/kg) (n=803)
5 99% (795) NA NA
10 0.4% (3) NA NA
Other 0.6% (5) NA NA
Review of treatment plan
Continue treatment 94% (772) 89% (467)
Stop treatment 6% (46) 11% (58) If treatment was stopped, what were the reasons for stopping? (n=46) (n=58)
Treatment effective and discontinued 2% (1) 0% (0)
Loss of response 11% (5) 17% (10)
Poor response 37% (17) 31% (18)
Side effects / adverse events 33% (15) 41% (24)
Patient became pregnant since initiating anti-TNFα treatment 0% (0) 2% (1)
Patient choice 11% (5) 5% (3)
Other 7% (3) 3% (2) If continuing adalimumab treatment, planned continued treatment frequency? (n=453)
Every week NA NA 5% (21)
Every other week NA NA 95% (432) If continuing adalimumab treatment, planned continued treatment dose (mg) (n=467)
40 NA NA 99% (461)
80 NA NA 1% (6) Did the patient report complete compliance with the maintenance regime since the last adalimumab review?
(n=440)
Yes NA NA 95% (419)
No NA NA 5% (21) If incomplete compliance, state reason (more than one may have been selected) (n=21)
Number of missed doses NA NA 14% (3)
Increased interval between doses NA NA 14% (3)
Patient missed out some treatment weeks NA NA 38% (8)
Patient stopped treatment NA NA 19% (4) Compliance affected due to interventions in treatment NA NA 10% (2)
Other compliance difference NA NA 10% (2) CD = Crohn’s disease; NA = not applicable; TNFα = tumour necrosis factor alpha.
40 © Healthcare Quality Improvement Partnership 2015

National clinical audit of biological therapies. Adult report. September 2015. UK IBD audit
CD: follow-up treatment at 3 months
Frequency (%, n) Infliximab Adalimumab National (n=818)
YOUR SITE National (n=525)
YOUR SITE
Follow-up treatment details continued
Were there any adverse events since the last review?
Yes 6% (51) 11% (57)
What adverse events? (more than one may have been selected)
Abdominal pain 0.1% (1) 0.4% (2)
Alopecia 0% (0) 0.2% (1)
Angioedema of upper airway 0.1% (1) 0% (0)
Arthralgia 0.6% (5) 1% (5)
Blood abnormality 0.2% (2) 0.8% (4)
Bronchospasm (cough/wheeze/dyspnoea) 0.4% (3) 0.2% (1)
Cardiac failure 0.1% (1) 0% (0)
Chest pain 0.1% (1) 0% (0)
Chills 0.1% (1) 0% (0)
Death 0.1% (1) 0% (0)
Difficulty breathing 0.2% (2) 0.2% (1)
Dizziness 0.4% (3) 0.2% (1)
Fatigue 0.1% (1) 0.6% (3)
Fever 0.1% (1) 0.4% (2)
Flushing 0.6% (5) 0.2% (1)
Headache 0.5% (4) 0% (0)
Hypotension 0.1% (1) 0.2% (1)
Infection 2% (13) 0.2% (1)
Injection site reaction 0% (0) 0.6% (3)
Itching 0.1% (1) 0.6% (3)
Nausea 0.6% (5) 1% (5)
Rash 0.9% (7) 3% (13)
Urticaria 0% (0) 0.6% (3)
Other 2% (12) 2% (10) CD = Crohn’s disease; NA = not applicable.
41 © Healthcare Quality Improvement Partnership 2015

National clinical audit of biological therapies. Adult report. September 2015. UK IBD audit
CD: follow-up treatment at 3 months
Frequency (%, n) Infliximab Adalimumab National (n=818)
YOUR SITE National (n=525)
YOUR SITE
Follow-up treatment details continued Is the patient currently receiving any other therapies for the management of IBD? (n=554) (n=446)
Yes 63% (351) 55% (246)
If yes, indicate which other therapies (more than one may have been selected)
Allopurinol 0.2% (1) 0% (0)
Azathioprine/mercaptopurine 50% (277) 35% (156)
Methotrexate 4% (20) 6% (27)
Steroids 4% (23) 9% (41)
5-aminosalicylic acid 17% (92) 10% (46)
Antibiotics 0% (0) 0.4% (2)
Dietary therapy 1% (6) 2% (9)
Topical 0% (0) 0.2% (1)
Other 0.7% (4) 3% (13)
Disease severity score
Severity of disease (n=363) (n=321)
Mild 54% (195) 48% (153)
Moderate 29% (104) 37% (120)
Severe 18% (64) 15% (48) CD = Crohn’s disease; IBD = inflammatory bowel disease; NA = not applicable.
42 © Healthcare Quality Improvement Partnership 2015

National clinical audit of biological therapies. Adult report. September 2015. UK IBD audit
Crohn’s disease follow-up treatment at 12 months
CD: follow-up treatment at 12 months
Frequency (%, n) Infliximab Adalimumab National (n=339)
YOUR SITE National (n=181)
YOUR SITE
Follow-up treatment details Infliximab dose given at this treatment (mg/kg) (n=334)
5 97% (323) NA NA
10 3% (9) NA NA
Other 0.6% (2) NA NA
Review of treatment plan
Continue treatment 93% (314) 88% (159)
Stop treatment 7% (25) 12% (22) If treatment was stopped, what were the reasons for stopping? (n=25) (n=22)
Loss of response 16% (4) 9% (2)
Treatment effective and discontinued 40% (10) 27% (6)
Side effects / adverse events 20% (5) 27% (6)
Funding 4% (1) 5% (1)
Poor response 4% (1) 9% (2)
Patient choice 4% (1) 9% (2) Patient became pregnant since initiating anti-TNFα treatment 4% (1) 9% (2)
Other 4% (1) 5% (1) If continuing adalimumab treatment, planned continued treatment frequency (n=154)
Every week NA NA 12% (19)
Every other week NA NA 86% (133)
Other NA NA 1% (2)
If continuing adalimumab treatment, planned continued treatment dose (mg) (n=158)
20/25 NA NA 0.6% (1)
30 NA NA 0.6% (1)
40 NA NA 96% (152)
80 NA NA 3% (4) Did the patient report complete compliance with the maintenance regime since the last adalimumab review?
(n=157)
Yes NA NA 93% (146)
No NA NA 7% (11) CD = Crohn’s disease; NA = not applicable; TNFα = tumour necrosis factor alpha.
43 © Healthcare Quality Improvement Partnership 2015

National clinical audit of biological therapies. Adult report. September 2015. UK IBD audit
CD: follow-up treatment at 12 months
Frequency (%, n) Infliximab Adalimumab National (n=339)
YOUR SITE National (n=181)
YOUR SITE
Follow-up treatment details continued If incomplete compliance, state reason (more than one may have been selected) (n=11)
Number of missed doses NA NA 36% (4)
Patient missed out some treatment weeks NA NA 36% (4)
Patient stopped treatment NA NA 27% (3)
Were there any adverse events since the last review?
Yes 6% (20) 6% (11)
What adverse events? (more than one may have been selected)
Abdominal pain 0% (0) 0.6% (1)
Alopecia 0.3% (1) 0% (0)
Angioedema of upper airway 0% (0) 0.6% (1)
Bronchospasm (cough/wheeze/dyspnoea) 0.6% (2) 0.6% (1)
Chills 1% (4) 0.6% (1)
Fatigue 0% (0) 0.6% (1)
Flushing 0.3% (1) 0% (0)
Headache 0.3% (1) 0.6% (1)
Infection 3% (9) 1% (2)
Itching 0.3% (1) 0% (0)
Malignancy 0.3% (1) 0% (0)
Rash 0.3% (1) 0.6% (1)
Serum sickness-like reaction 0.3% (1) 0% (0)
Other 2% (5) 2% (4) Is the patient currently receiving any other therapies for the management of IBD? (n=247) (n=157)
Yes 58% (143) 59% (93)
If yes, indicate which other therapies (more than one may have been selected)
Allopurinol 0.4% (1) 0% (0)
Azathioprine/mercaptopurine 45% (112) 40% (62)
5-aminosalicylic acid 14% (34) 12% (18)
Antibiotics 0% (0) 0.6% (1)
Dietary therapy 0.4% (1) 0% (0)
Methotrexate 3% (7) 7% (11)
Mycophenolate 0% (0) 0% (0)
Steroids 2% (6) 10% (15)
Other 1% (3) 3% (5) CD = Crohn’s disease; IBD = inflammatory bowel disease; NA = not applicable.
44 © Healthcare Quality Improvement Partnership 2015

National clinical audit of biological therapies. Adult report. September 2015. UK IBD audit
CD: follow-up treatment at 12 months
Frequency (%, n) Infliximab Adalimumab National (n=339)
YOUR SITE National (n=181)
YOUR SITE
Disease severity score
Severity of disease (n=193) (n=140)
Remission 0% (0) 0.7% (1)
Mild 60% (116) 58% (81)
Moderate 25% (49) 30% (42)
Severe 15% (28) 11% (16) CD = Crohn’s disease.
45 © Healthcare Quality Improvement Partnership 2015

National clinical audit of biological therapies. Adult report. September 2015. UK IBD audit
Ulcerative colitis disease details
UC: disease details
Frequency (%, n) Infliximab Adalimumab National (n=633)
National (n=83)
Diagnosis
Maximal disease distribution at the time of decision to initiate biological therapy, as defined by the Montreal classification
(n=632)
Proctitis (E1) 10% (61) 6% (5)
Left sided (E2) 45% (284) 37% (31)
Extensive (E3) 45% (287) 57% (47) Time between date of diagnosis and date of initial treatment (n=630) (n=81)
<1 year ago 31% (195) 16% (13)
1–2 years ago 22% (139) 30% (24)
3–5 years ago 16% (101) 26% (21)
6–10 years ago 15% (97) 14% (11)
>10 years ago 16% (98) 15% (12) UC = ulcerative colitis.
46 © Healthcare Quality Improvement Partnership 2015

National clinical audit of biological therapies. Adult report. September 2015. UK IBD audit
Ulcerative colitis initial treatment
UC: initial treatment
Frequency (%, n) Infliximab Adalimumab National (n=633)
National (n=83)
Consent
Was informed consent to receive anti-TNFα treatment taken from this patient?
Yes 99% (624) 100% (83)
No 1% (9) 0% (0)
If yes, was this verbal or written? (n=624)
Verbal 79% (495) 80% (66)
Written 21% (129) 21% (17)
Treatment details
Time between date of decision to start and date of initial treatment (first loading dose)
Median (IQR) time (days) 5 (1,17) 23 (10, 45) What was the clinical indication for this treatment? (n=632)
Acute severe UC 69% (436) 40% (33)
Chronic refractory UC 28% (179) 53% (44)
Other clinical indication 1% (7) 4% (3)
Not known 2% (10) 4% (3)
Dose given at this infusion (mg/kg) (n=485)
5 100% (484) NA
10 0.2% (1) NA
Duration of infusion (mins) (n=476)
60 2% (7) NA
120 96% (457) NA
180 3% (12) NA
Infusion completion outcome
Completed successfully at prescribed rate 98% (622) NA
Completed successfully at lower rate 0.8% (5) NA
Infusion discontinued and not restarted 0.8% (5) NA
Other 0.2% (1) NA
Induction dose (mg)
160/80 NA 89% (74)
80/40 NA 10% (8)
Other NA 1% (1)
Planned maintenance dose
40 mg every other week NA 94% (78)
40 mg every week NA 6% (5) IQR = interquartile range; NA = not applicable; TNFα = tumour necrosis factor alpha; UC = ulcerative colitis.
47 © Healthcare Quality Improvement Partnership 2015

National clinical audit of biological therapies. Adult report. September 2015. UK IBD audit
UC: initial treatment
Frequency (%, n) Infliximab Adalimumab National (n=633)
National (n=83)
Treatment details continued
Were any adverse events recorded for this treatment?
Yes 2% (10) 1% (1)
Which acute reactions? (more than one may have been selected)
Arthralgia 0.2% (1) 0% (0)
Bronchospasm (cough/wheeze/dyspnoea) 0.3% (2) 0% (0)
Chest pain 0.2% (1) 0% (0)
Dizziness 0.5% (3) 0% (0)
Fatigue 0.2% (1) 0% (0)
Hypotension 0.3% (2) 0% (0)
Itching 0.2% (1) 0% (0)
Nausea 0.3% (2) 0% (0)
Other 0.5% (3) 1% (1)
Is the patient receiving any concomitant therapies for the management of IBD at the time of this treatment?
Yes 89% (561) 87% (72)
If yes, indicate which concomitant therapies (more than one may have been selected)
Allopurinol 0.2% (1) 0% (0)
Azathioprine/mercaptopurine 46% (288) 42% (35)
5-aminosalicylic acid 46% (293) 48% (40)
Antibiotics 2% (12) 2% (2)
Dietary therapy 0.6% (4) 0% (0)
Methotrexate 4% (22) 5% (4)
Mycophenolate 0.8% (5) 0% (0)
Steroids 54% (344) 42% (35)
Tacrolimus 0.3% (2) 0% (0)
Topical 0% (0) 1% (1)
Other 2% (11) 1% (1) IBD = inflammatory bowel disease; UC = ulcerative colitis.
48 © Healthcare Quality Improvement Partnership 2015

National clinical audit of biological therapies. Adult report. September 2015. UK IBD audit
UC: initial treatment
Frequency (%, n) Infliximab Adalimumab National (n=633)
National (n=83)
Treatment details continued
Has the patient failed to respond or are they intolerant to immunosuppressive drugs / corticosteroids?
Yes 64% (403) 78% (65)
If yes, indicate which previous therapies (more than one therapy may have been selected)
Azathioprine/mercaptopurine 41% (260) 63% (52)
5-aminosalicylic acid 25% (155) 28% (23)
Antibiotics 0.6% (4) 0% (0)
Anti-TNFα 1% (7) 21% (17)
Ciclosporin 1% (7) 1% (1)
Methotrexate 5% (29) 12% (10)
Steroids 34% (218) 22% (18)
Tacrolimus 0.3% (2) 1% (1)
Other 0.3% (2) 1% (1)
Disease severity score
Severity of disease (n=513) (n=71)
Mild 4% (19) 3% (2)
Moderate 24% (125) 42% (30)
Severe 72% (369) 55% (39) TNFα = tumour necrosis factor alpha; UC = ulcerative colitis.
49 © Healthcare Quality Improvement Partnership 2015

National clinical audit of biological therapies. Adult report. September 2015. UK IBD audit
Ulcerative colitis follow-up treatment at 3 months
UC: follow-up treatment at 3 months
Frequency (%, n) Infliximab Adalimumab National (n=157)
National (n=19)
Follow-up treatment details
Infliximab dose given at this treatment (mg/kg)
5 99% (155) NA
10 0.6% (1) NA
Other 0.6% (1) NA
Review of treatment plan
Continue treatment 82% (128) 74% (14)
Stop treatment 19% (29) 26% (5) If treatment was stopped, what were the reasons for stopping? (n=29) (n=5)
Treatment effective and discontinued 41% (12) 0% (0)
Loss of response 3% (1) 20% (1)
Poor response 17% (5) 60% (3)
Side effects / adverse events 28% (8) 20% (1)
Funding 7% (2) 0% (0)
Other 3% (1) 0% (0) If continuing adalimumab treatment, planned continued treatment frequency (n=14)
Every week NA 7% (1)
Every other week NA 93% (13) If continuing adalimumab treatment, planned continued treatment dose (mg) (n=14)
80 NA 7% (1)
40 NA 93% (13)
Did the patient report complete compliance with the maintenance regime since the last adalimumab review?
Yes NA 90% (17)
No NA 11% (2)
If incomplete compliance, state reason (n=2)
Patient missed out some treatment weeks NA 50% (1)
Other compliance difference NA 50% (1) NA = not applicable; UC = ulcerative colitis.
50 © Healthcare Quality Improvement Partnership 2015

National clinical audit of biological therapies. Adult report. September 2015. UK IBD audit
UC: follow-up treatment at 3 months
Frequency (%, n) Infliximab Adalimumab National (n=157)
National (n=19)
Follow-up treatment details continued
Were there any adverse events since the last review?
Yes 9% (14) 16% (3)
What adverse events? (more than one may have been selected)
Abdominal pain 1% (2) 0% (0)
Angioedema of upper airway 0.6% (1) 0% (0)
Blood abnormality 0.6% (1) 0% (0)
Bronchospasm (cough/wheeze/dyspnoea) 2% (3) 0% (0)
Dizziness 0% (0) 5% (1)
Fatigue 0% (0) 5% (1)
Flushing 3% (4) 5% (1)
Headache 1% (2) 0% (0)
Hypotension 1% (2) 0% (0)
Infection 3% (5) 11% (2)
Itching 0.6% (1) 0% (0)
Nausea 0.6% (1) 0% (0)
Rash 0.6% (1) 0% (0)
Suspected demyelination 0.6% (1) 0% (0)
Urticaria 0.6% (1) 0% (0)
Other 0.6% (1) 5% (1)
Is the patient currently receiving any other therapies for the management of IBD?
Yes 74% (116) 79% (15)
If yes, indicate which other therapies (more than one may have been selected)
Allopurinol 0.6% (1) 0% (0)
Azathioprine/mercaptopurine 55% (87) 16% (3)
Methotrexate 1% (2) 5% (1)
Steroids 7% (11) 16% (3)
5-aminosalicylic acid 32% (50) 53% (10)
Other 0.6% (1) 0% (0)
Disease severity score
Severity of disease (n=128) (n=15)
Mild 56% (71) 47% (7)
Moderate 28% (36) 13% (2)
Severe 16% (21) 40% (6) IBD = inflammatory bowel disease; UC = ulcerative colitis.
51 © Healthcare Quality Improvement Partnership 2015

National clinical audit of biological therapies. Adult report. September 2015. UK IBD audit
Ulcerative colitis follow-up treatment at 12 months
UC: follow-up treatment at 12 months
Frequency (%, n) Infliximab Adalimumab National (n=49)
National (n=3)
Follow-up treatment details
Infliximab dose given at this treatment (mg/kg)
5 96% (47) NA
10 2% (1) NA
Other 2% (1) NA
Review of treatment plan
Continue treatment 94% (46) 67% (2)
Stop treatment 6% (3) 33% (1) If treatment was stopped, what were the reasons for stopping? (n=3) (n=1)
Treatment effective and discontinued 33% (1) 100% (1)
Side effects / adverse events 33% (1) 0% (0)
Funding 33% (1) 0% (0) If continuing adalimumab treatment, planned continued treatment frequency (n=2)
Every other week NA 100% (2) If continuing adalimumab treatment, planned continued treatment dose (mg) (n=2)
40 NA 100% (2)
Did the patient report complete compliance with the maintenance regime since the last adalimumab review?
Yes NA 100% (3)
Were there any adverse events since the last review?
Yes 2% (1) 33% (1)
What adverse events? (more than one may have been selected)
Nausea 2% (1) 0% (0)
Other 0% (0) 33% (1)
Is the patient currently receiving any other therapies for the management of IBD?
Yes 86% (42) 100% (3)
If yes, indicate which other therapies (more than one may have been selected)
Azathioprine/mercaptopurine 59% (29) 67% (2)
5-aminosalicylic acid 51% (25) 33% (1)
Methotrexate 6% (3) 33% (1)
Steroids 2% (1) 33% (1)
Other 2% (1) 0% (0) IBD = inflammatory bowel disease; NA = not applicable; UC = ulcerative colitis.
52 © Healthcare Quality Improvement Partnership 2015

National clinical audit of biological therapies. Adult report. September 2015. UK IBD audit
UC: follow-up treatment at 12 months
Frequency (%, n) Infliximab Adalimumab National (n=49)
National (n=3)
Disease severity score
Severity of disease (n=43) (n=2)
Mild 51% (22) 100% (2)
Moderate 33% (14) 0% (0)
Severe 16% (7) 0% (0) UC = ulcerative colitis.
53 © Healthcare Quality Improvement Partnership 2015

National clinical audit of biological therapies. Adult report. September 2015. UK IBD audit
Inflammatory bowel disease type unclassified disease details
IBDU: disease details
Frequency (%, n) Infliximab Adalimumab National (n=78)
National (n=24)
Diagnosis
Maximal disease distribution at the time of decision to initiate biological therapy, as defined by the Montreal classification Proctitis (E1) 1% (1) 4% (1)
Left sided (E2) 44% (34) 54% (13)
Extensive (E3) 55% (43) 42% (10)
Time between date of diagnosis and date of initial treatment
<1 year 39% (30) 13% (3)
1–2 years 28% (22) 25% (6)
3–5 years 21% (16) 25% (6)
6–10 years 5% (4) 8% (2)
>10 years 8% (6) 29% (7) IBDU = inflammatory bowel disease type unclassified.
54 © Healthcare Quality Improvement Partnership 2015

National clinical audit of biological therapies. Adult report. September 2015. UK IBD audit
Inflammatory bowel disease type unclassified initial treatment
IBDU: initial treatment
Frequency (%, n) Infliximab Adalimumab National (n=78)
National (n=24)
Consent
Was informed consent to receive anti-TNFα treatment taken from this patient?
Yes 99% (77) 100% (24)
No 1% (1) 0% (0)
If yes, was this verbal or written? (n=77)
Verbal 71% (55) 92% (22)
Written 29% (22) 8% (2)
Treatment details
Time between date of decision to start and date of initial treatment (first loading dose)
Median (IQR), days 9 (2, 21) 15 (4, 30) What was the clinical indication for this treatment? (n=77)
Acute severe IBDU 66% (51) 46% (11)
Chronic refractory IBDU 34% (26) 50 (12)
Other clinical indication 3% (2) 4% (1)
Dose given at this infusion (mg/kg) (n=64)
5 98% (63) NA
10 2% (1) NA
Duration of infusion (mins) (n=63)
120 97% (61) NA
180 3% (2) NA
Infusion completion outcome
Completed successfully at prescribed rate 97% (76) NA
Infusion discontinued and not restarted 1% (1) NA
Other 1% (1) NA
Induction dose (mg)
160/80 NA 63% (15)
80/40 NA 38% (9)
Planned maintenance dose
40 mg every other week NA 92% (22)
40 mg every week NA 8% (2)
Were any adverse events recorded for this treatment?
Yes 0% (0) 0% (0) IBDU = inflammatory bowel disease type unclassified; IQR = interquartile range; NA = not applicable; TNFα = tumour necrosis factor alpha.
55 © Healthcare Quality Improvement Partnership 2015

National clinical audit of biological therapies. Adult report. September 2015. UK IBD audit
IBDU: initial treatment
Frequency (%, n) Infliximab Adalimumab National (n=78)
National (n=24)
Treatment details continued
Is the patient receiving any concomitant therapies for the management of IBD at the time of this treatment?
Yes 92% (72) 88% (21)
If yes, indicate which concomitant therapies (more than one may have been selected)
Allopurinol 0% (0) 4% (1)
Azathioprine/mercaptopurine 41% (32) 63% (15)
Methotrexate 3% (2) 8% (2)
Steroids 59% (46) 42% (10)
5-aminosalicylic acid 55% (43) 46% (11)
Antibiotics 1% (1) 0% (0)
Has the patient failed to respond or are they intolerant to immunosuppressive drugs / corticosteroids?
Yes 65% (51) 67% (16)
If yes, indicate which previous therapies (more than one may have been selected)
Azathioprine/mercaptopurine 41% (32) 46% (11)
Methotrexate 8% (6) 8% (2)
Steroids 27% (21) 29% (7)
Anti-TNFα 1% (1) 25% (6)
5-aminosalicylic acid 22% (17) 25% (6)
Ciclosporin 4% (3) 0% (0)
Disease severity score
Severity of disease (n=50) (n=12)
Mild 8% (4) 0% (0)
Moderate 36% (18) 75% (9)
Severe 56% (28) 25% (3) IBD = inflammatory bowel disease; IBDU = inflammatory bowel disease type unclassified; TNFα = tumour necrosis factor alpha.
56 © Healthcare Quality Improvement Partnership 2015

National clinical audit of biological therapies. Adult report. September 2015. UK IBD audit
Inflammatory bowel disease type unclassified follow-up treatment at 3 months
IBDU: follow-up treatment at 3 months
Frequency (%, n) Infliximab Adalimumab National (n=30)
National (n=12)
Follow-up treatment details
Infliximab dose given at this treatment (mg/kg)
5 100% (30) NA
Review of treatment plan
Continue treatment 93% (28) 92% (11)
Stop treatment 7% (2) 8% (1) If treatment was stopped, what were the reasons for stopping? (n=2) (n=1)
Poor response 0% (0) 100% (1)
Side effects / adverse events 50% (1) 0% (0)
Other 50% (1) 0% (0) If continuing adalimumab treatment, planned continued treatment frequency (n=11)
Every other week NA 100% (11) If continuing adalimumab treatment, planned continued treatment dose (mg) (n=11)
40 NA 100% (11)
Did the patient report complete compliance with the maintenance regime since the last adalimumab review?
Yes NA 100% (12)
Did the patient report any adverse events?
Yes 3% (1) 0% (0)
Which adverse events? (more than one may have been selected)
Bronchospasm (cough/wheeze/dyspnoea) 3% (1) 0% (0)
Dizziness 3% (1) 0% (0)
Panic attacks 3% (1) 0% (0)
Is the patient currently receiving any other therapies for the management of IBD?
Yes 77% (23) 75% (9)
If yes, indicate which other therapies (more than one may have been selected)
Azathioprine/mercaptopurine 57% (17) 67% (8)
Steroids 17% (5) 17% (2)
5-aminosalicylic acid 50% (15) 25% (3) IBD = inflammatory bowel disease; IBDU = inflammatory bowel disease type unclassified; NA = not applicable.
57 © Healthcare Quality Improvement Partnership 2015

National clinical audit of biological therapies. Adult report. September 2015. UK IBD audit
IBDU: follow-up treatment at 3 months
Frequency (%, n) Infliximab Adalimumab National (n=30)
National (n=12)
Disease severity score
Severity of disease (n=18) (n=5)
Mild 56% (10) 40% (2)
Moderate 33% (6) 40% (2)
Severe 11% (2) 20% (1) IBDU = inflammatory bowel disease type unclassified.
58 © Healthcare Quality Improvement Partnership 2015

National clinical audit of biological therapies. Adult report. September 2015. UK IBD audit
Inflammatory bowel disease type unclassified follow-up treatment at 12 months
IBDU: follow-up treatment at 12 months
Frequency (%, n) Infliximab Adalimumab National (n=12)
National (n=2)
Follow-up treatment details
Infliximab dose given at this treatment (mg/kg)
5 100% (12) NA
Review of treatment plan
Continue treatment 83% (10) 50% (1)
Stop treatment 17% (2) 50% (1) If treatment was stopped, what were the reasons for stopping? (n=2) (n=1)
Loss of response 50% (1) 0% (0)
Treatment effective and discontinued 50% (1) 100% (1) If continuing adalimumab treatment, planned continued treatment frequency (n=1)
Every week NA 100% (1) If continuing adalimumab treatment, planned continued treatment dose (mg) (n=1)
40 NA 100% (1)
Did the patient report complete compliance with the maintenance regime since the last adalimumab review?
Yes NA 100% (2)
Did the patient report any adverse events?
Yes 0% (0) 0% (0)
Is the patient currently receiving any other therapies for the management of IBD?
Yes 58% (7) 100% (2)
If yes, indicate which other therapies (more than one may have been selected)
Azathioprine/mercaptopurine 42% (5) 100% (2)
5-aminosalicylic acid 33% (4) 0% (0)
Steroids 8% (1) 50% (1)
Disease severity score
Severity of disease (n=10) (n=1)
Mild 80% (8) 100% (1)
Moderate 20% (2) 0% (0) IBD = inflammatory bowel disease; IBDU = inflammatory bowel disease type unclassified.
59 © Healthcare Quality Improvement Partnership 2015

National clinical audit of biological therapies. Adult report. September 2015. UK IBD audit
IBD-related surgery Of the analysed adult patients, 1241 had one or more surgical procedures related to their IBD. The surgery performed on these patients is categorised according to whether it was carried out before or after biological therapies were started. Only surgeries for patients included in the national analysis are presented in tables 18–20. One table is given for each disease type. Table 18 Surgical procedures in adult patients with CD
CD-related surgery
Adult patients with surgery recorded (n=1151)
Before starting biological therapy (n=1034)*
After starting biological therapy (n=200)*
Surgical procedure by type (%, n)
Anterior resection 0.3% (3) 0% (0)
Appendicectomy 2% (15) 0% (0)
Cholecystectomy 1% (11) 0% (0)
Colectomy and ileostomy 6% (62) 8% (15)
Drainage of abscess 3% (30) 3% (5)
Excision of fistula 2% (15) 0% (0)
Gastric surgery 0.1% (1) 0.5% (1)
Other surgical procedure 22% (226) 25% (50)
Partial colectomy 5% (48) 2% (4)
Perianal surgery 23% (238) 24% (47)
Proctectomy 0.3% (3) 0% (0)
Right hemicolectomy / ileocaecal resection 42% (431) 16% (31)
Small bowel resection 22% (225) 22% (44)
Stoma formation 2% (21) 0.5% (1)
Stricturoplasty 4% (43) 4% (8)
Total colectomy with ileorectal anastomosis 0.4% (4) 0% (0)
Total proctocolectomy ileoanal pouch 1% (14) 0% (0)
Total proctocolectomy permanent ileostomy 3 (31) 4 (8) *Patients may have one or more surgeries recorded. CD = Crohn’s disease.
60 © Healthcare Quality Improvement Partnership 2015

National clinical audit of biological therapies. Adult report. September 2015. UK IBD audit
Table 19 Surgical procedures in adult patients with UC
UC-related surgery
Adult patients with surgery recorded (n=78) Before starting biological therapy (n=26)*
After starting biological therapy (n=54)*
Surgical procedure by type (%, n)
Appendicectomy 4% (1) 0% (0)
Colectomy and ileostomy 46% (12) 74% (40)
Other surgical procedure 35% (9) 6% (3)
Partial colectomy 4% (1) 4% (2)
Perianal surgery 15% (4) 6% (3)
Right hemicolectomy / ileocaecal resection 4% (1) 0% (0)
Small bowel resection 4% (1) 0% (0)
Total proctocolectomy ileoanal pouch 15% (4) 4% (2)
Total proctocolectomy permanent ileostomy 0% (0) 9% (5) *Patients may have one or more surgeries recorded. UC = ulcerative colitis.
Table 20 Surgical procedures in adult patients with IBDU
IBDU-related surgery
Adult patients with surgery recorded (n=12) Before starting biological therapy (n=6)*
Before starting biological therapy (n=7)*
Surgical procedure by type (%, n)
Colectomy and ileostomy 17% (1) 71% (5)
Perianal surgery 67% (4) 14% (1)
Total proctocolectomy ileoanal pouch 17% (1) 14% (1) *Patients may have one or more surgeries recorded. IBDU = inflammatory bowel disease type unclassified.
61 © Healthcare Quality Improvement Partnership 2015

National clinical audit of biological therapies. Adult report. September 2015. UK IBD audit
Patient-reported outcome measures (PROMs) Outcome measures have traditionally relied on disease activity indexes, but these measures fail to assess the patient’s subjective view of their experience. Patient-reported outcome measures therefore evaluate quality from the patient’s perspective. Typically, they are short, self-completed questionnaires that measure the patient’s health status or health-related quality of life at a single point in time. The health status information is collected from patients by way of PROMs questionnaires completed before, during and after an intervention (in this case, initiation of biological therapy) and provides an indication of the outcomes or quality of care delivered to patients. EQ-5D The EQ-5D is a standardised instrument for use as a measure of health outcome. It provides a simple descriptive profile and a single index value for health status. It was primarily designed for self-completion by respondents and is ideally suited for use in clinics. The EQ-5D is a descriptive system of health-related quality of life states consisting of five dimensions (mobility, self-care, usual activities, pain/discomfort and anxiety/depression), each of which can take one of three responses depending on level of severity – no problems / some or moderate problems / extreme problems – within a particular EQ-5D dimension. Total EQ-5D scores range from 0 (worst health / death) to 1 (best health), with an increase in score denoting improved health. Scores from each domain are weighted and converted into a single weighted summary index. The data within this report are presented in the form of a median (IQR). The EQ-5D has been shown to be valid, reliable and responsive in patients with IBD.15 In total, 1416 EQ-5D questionnaires were completed at an initial treatment for patients taking infliximab and adalimumab and for all disease types, with a median (IQR) score of 0.76 (0.66, 0.85). At 3-month follow-up, 361 EQ-5D questionnaires were completed for patients taking infliximab and adalimumab and for all disease types, with a median (IQR) score of 0.80 (0.73, 1.0). At 12-month follow-up, 57 EQ-5D questionnaires were completed for patients taking infliximab and adalimumab and for all disease types, with a median (IQR) score of 0.80 (0.69, 1.0). The limited number of patients with EQ-5D scores at initial and follow-up treatment means that the difference between the EQ-5D scores at these timepoints could not be calculated. However, the median scores at these two stages was calculated for all patients who had a score; comparison of these medians showed an increase in the median EQ-5D score of 0.04 between initial and 3-month follow-up treatment. This may suggest a clinical improvement in quality of life after patients started biological therapies. CUCQ-12 The CUCQ-12 is a relatively new and shortened version of the 32-item Crohn’s and Colitis Questionnaire (CCQ-32) – a quality of life measurement tool developed specifically for use with patients with IBD to measure active disease and long-term monitoring of the condition. The items in the CUCQ-12 questionnaire address the following 12 dimensions: sleeping, appetite, energy level, rushing to the toilet, being bloated, incomplete emptying of bowels, blood in stool, generally unwell, faecal incontinence, nocturnal diarrhoea, passing wind and effect on leisure activity. Each question is scored between 0 (best health) and 14 (poor health), corresponding to the number of days affected by a parameter in a fortnight, giving a total CUCQ-12 score ranging from 0 (best health) to 168 (poor health). Remission in patients with UC and CD is suggested by CUCQ-12 scores of <45 and <50, respectively. The minimum significant change in CUCQ-12 is 13 for both UC and CD. Early results have shown that the CUCQ-12 performs well in patients with IBD, with positive correlations compared with the EQ-5D and 12-item short-form (SF-12).
62 © Healthcare Quality Improvement Partnership 2015

National clinical audit of biological therapies. Adult report. September 2015. UK IBD audit
In total, 1256 CUCQ-12 questionnaires were completed at initial treatment for patients taking infliximab and adalimumab and for all disease types. The median (IQR) score of 68 (39, 100) suggests active IBD at this timepoint. At follow-up treatment, 332 questionnaires were completed for patients taking infliximab and adalimumab and for all disease types. The median (IQR) score was 34 (14, 60). The limited number of patients with CUCQ-12 scores at initial and follow-up treatment means that the difference between the CUCQ-12 scores at these timepoints could not be calculated. However, the median scores at these two stages could be calculated for all patients who had a score; comparison of these medians showed a reduction in the median CUCQ-12 score of 34 between initial and follow-up treatment. This may suggest a clinically significant improvement in quality of life after starting biological therapies. The CUCQ-12 findings of the biological therapy audit will be used to inform learning and the ongoing validity assessment of this PROM tool. Table 17 from section 2 of this report is provided again for reference. Table 17 PROMs questionnaire for IBD (IBD-PROM)
IBD-PROM Initial treatment
3-month follow-up
12-month follow-up
Patients with IBD-PROM completed (%, n/N)
30% (1416/4718)
25% (384/1561)
22% (129/586)
Patients with EQ-5D data completed (%, n/N)
97% (1367/1416)
94% (361/384)
44% (57/129)
EQ-5D score, median (IQR) 0.76 (0.66, 0.85) 0.80 (0.73, 1) 0.80 (0.69, 1) Patients with CUCQ-12 data completed (%, n/N)
89% (1256/1416)
87% (332/384)
87% (112/129)
CUCQ-12 score, median (IQR) 68 (39, 100) 34 (14, 60) 27 (10, 49) CUCQ-12 = Crohn’s and ulcerative colitis questionnaire; IBD = inflammatory bowel disease; IQR = interquartile range; PROMs = patient-reported outcome measures.
63 © Healthcare Quality Improvement Partnership 2015

National clinical audit of biological therapies. Adult report. September 2015. UK IBD audit
6: Participation and individual site key indicator data
Participation Since the audit’s inception, levels of participation have varied. Participation falls into one of three main categories:
• Sites that have been entering data, which are known as participating sites (or participants), which can be broken down into three further categories:
- Those that have entered data regularly over the past year of data collection - Those that have previously entered data into the audit but have not done so during the
past year of data collection - Those that have entered data but the data do not meet the audit criteria (for example,
already established patients or unlocked submissions). • Sites that have never entered any data to the audit, which are known as non-participating sites
(or non-participant). • Sites that do not administer biological therapies to their patients with IBD, which are known as
not eligible. Table 21 shows the different levels of adult site participation.
Table 21 Participation status for adult sites
Participation status for adult sites Sites (n) Participated with regular data entry 151 Participated but data submitted do not meet audit criteria 11 Previously participated but no data entered during past year of data collection 32 Not participated 20 Not eligible to participate 2 Total number of adult sites 216
Table 22 Adult site participation status over time Table 22 shows participation of adult sites, trusts / health boards by country over time. Some services have reconfigured, so participating denominators vary.
Participating site Audit reporting dates (%, n/N) June 2012 August 2013 September 2014 September 2015
England Sites 43% (76/177) 68% (115/169) 90% (149/165) 96% (160/166) Trusts 52% (75/143) 79% (106/135) 94% (133/141) 98% (134/137) Northern Ireland Sites 17% (2/12) 67% (8/12) 92% (11/12) 92% (11/12) Trusts 40% (2/5) 100% (5/5) 100% (5/5) 100% (5/5) Scotland Sites 44% (8/18) 67% (12/18) 55% (11/20) 62% (13/21) Health boards 80% (8/10) 82% (9/11) 64% (7/11) 91% (10/11) Wales Sites 41% (7/17) 39% (7/18) 60% (9/15) 67% (10/15) Health boards 67% (4/6) 67% (4/6) 67% (4/6) 67% (4/6) Total Sites 42% (93/224) 65% (142/217) 84% (180/214) 90% (194/216) Trusts / health boards 54% (89/164) 79% (124/157) 91% (149/163) 96% (153/159)
64 © Healthcare Quality Improvement Partnership 2015

National clinical audit of biological therapies. Adult report. Septem
ber 2015. UK IBD audit
© Healthcare Q
uality Improvem
ent Partnership 2015
Key indicator data for individual sites This table gives named key site data in alphabetical order of participating site in England, Northern Ireland, Scotland and Wales. These key indicators were agreed by the IBD programme steering group as reflecting the areas of particular importance to people with IBD. An asterisk next to the name of the site in the table denotes that the site has taken part in PANTs.
Participation status
Crohn’s disease patients – time from diagnosis to initial treatment, years, Median (IQR)
Initial treatment Harvey Bradshaw Index, Median (IQR)
Crohn’s disease patients – remission achieved
Crohn’s disease patients – On concomitant immunosuppression at start of treatment
Crohn’s disease patients with adverse event recorded at 3 month follow-up
All patients –PROMs completed at start of treatment
Results (n=3739) 4 (1, 12)
n=2282 8 (4, 10) 68% (502/741) 53% (1644/3080) n=1343
8% (108) 30% (1416/4718)
England (n=167) Aintree University Hospitals NHS Foundation Trust
Aintree University Hospital Participant n=22 3 (1, 8) n<6 n<6 64% (14/22) 13% (1/8) 6% (2/32)
Airedale NHS Foundation Trust
Airedale General Hospital* Participant n=28 2 (1, 9)
n=26 10 (7, 12) 60% (6/10) 20% (5/25) 18% (2/11) 45% (17/38)
Ashford and St Peter’s Hospitals NHS Foundation Trust
Ashford Hospital and St Peter's Hospital Participant but data submitted do not meet audit criteria
Barking, Havering and Redbridge Hospitals NHS Trust
King George Hospital and Queens Hospital combined Participant n=46
5 (1, 10) n=22 11 (7, 13) 71% (5/7) 59% (27/46) 4% (1/26) 0% (0/63)
Barnsley Hospital NHS Foundation Trust
Barnsley District General Hospital Participant n=50 3 (1, 12) n<6 n=0 43% (22/51) 4% (1/24) 0% (0/68)
65

National clinical audit of biological therapies. Adult report. Septem
ber 2015. UK IBD audit
©
Healthcare Quality Im
provement Partnership 2015
66
Participation status
Crohn’s disease patients – time from diagnosis to initial treatment, years, Median (IQR)
Initial treatment Harvey Bradshaw Index, Median (IQR)
Crohn’s disease patients – remission achieved
Crohn’s disease patients – On concomitant immunosuppression at start of treatment
Crohn’s disease patients with adverse event recorded at 3 month follow-up
All patients –PROMs completed at start of treatment
Results (n=3739) 4 (1, 12)
n=2282 8 (4, 10) 68% (502/741) 53% (1644/3080) n=1343
8% (108) 30% (1416/4718)
Barts Health NHS Trust
Newham University Hospital Participant n=12 2 (1, 16) n<6 n=0 50% (6/12) 0% (0/7) 0% (0/14)
The Royal London Hospital and St Bartholomew’s Hospital combined Participant n=28
4 (2, 10) n=24 5 (1, 8) 90% (9/10) 73% (8/11) 0% (0/11) 56% (18/32)
Whipps Cross University Hospital Participant but data submitted do not meet audit criteria
Basildon and Thurrock University Hospitals NHS Foundation Trust
Basildon Hospital* Participant n=24 4 (1, 15)
n=26 10 (6, 11) 67% (4/6) 57% (8/14) 0% (0/6) 52% (14/27)
Blackpool Teaching Hospitals NHS Foundation Trust
Blackpool Victoria Hospital* Participant n=7 0 (0, 2)
n=8 11 (5, 13) n<6 n<6 50% (1/2) 88% (7/8)
Bradford Teaching Hospitals Foundation Trust
Bradford Royal Infirmary* Participant n=34 3 (1, 13)
n=19 5 (3, 8) 57% (4/7) 52% (12/23) 15% (2/13) 44% (18/41)
Brighton and Sussex University Hospitals NHS Trust
Royal Sussex County Hospital* and Princess Royal Hospital combined Participant n=39
8 (1, 21) n=16 6 (2, 10) 56% (5/9) 58% (22/38) 0% (0/17) 7% (4/56)
Buckinghamshire Healthcare NHS Trust
Stoke Mandeville Hospital and Wycombe General Hospital combined Previous participant but no data entered in past year

© Healthcare Q
uality Improvem
ent Partnership 2015
National clinical audit of biological therapies. Adult report. Septem
ber 2015. UK IBD audit
Participation status
Crohn’s disease patients – time from diagnosis to initial treatment, years, Median (IQR)
Initial treatment Harvey Bradshaw Index, Median (IQR)
Crohn’s disease patients – remission achieved
Crohn’s disease patients – On concomitant immunosuppression at start of treatment
Crohn’s disease patients with adverse event recorded at 3 month follow-up
All patients –PROMs completed at start of treatment
Results (n=3739) 4 (1, 12)
n=2282 8 (4, 10) 68% (502/741) 53% (1644/3080) n=1343
8% (108) 30% (1416/4718)
Burton Hospitals NHS Foundation Trust
Queen’s Hospital, Burton Participant n=14 3 (1, 16) n<6 n=0 21% (3/14) n<6 0% (0/20)
Calderdale and Huddersfield NHS Foundation Trust
Huddersfield Royal Infirmary and Calderdale Hospital* combined Participant n=37
7 (1, 13) n=7 6 (0, 12) n<6 73% (24/33) n<6 13% (7/54)
Cambridge University Hospitals NHS Foundation Trust
Addenbrooke’s Hospital* Participant n=26 11 (5, 16)
n=7 7 (5, 14) n<6 46% (11/24) n<6 21% (8/39)
Central Manchester University Hospitals NHS Foundation Trust
Manchester Royal Infirmary* Participant n=14 2 (1, 5)
n=13 3 (2, 7) n=0 33% (2/6) n<6 52% (11/21)
Trafford General Hospital Participant n=10 2 (1, 8) n<6 n=0 40% (4/10) n=0 0% (0/10)
Chelsea and Westminster Hospital NHS Foundation Trust
Chelsea and Westminster Hospital* Participant n<6 n<6 n<6 n<6 n<6 n<6
Chesterfield Royal Hospital NHS Foundation Trust
Chesterfield Royal Hospital* Participant n=55 4 (1, 10)
n=47 8 (4, 10) 70% (14/20) 46% (24/52) 14% (3/21) 10% (7/67)
City Hospitals Sunderland NHS Foundation Trust
Sunderland Royal Hospital* Participant n=11 4 (1, 10)
n=7 9 (7, 11) n<6 n=0 n<6 100% (13/13)
67

National clinical audit of biological therapies. Adult report. Septem
ber 2015. UK IBD audit
©
Healthcare Quality Im
provement Partnership 2015
68
Participation status
Crohn’s disease patients – time from diagnosis to initial treatment, years, Median (IQR)
Initial treatment Harvey Bradshaw Index, Median (IQR)
Crohn’s disease patients – remission achieved
Crohn’s disease patients – On concomitant immunosuppression at start of treatment
Crohn’s disease patients with adverse event recorded at 3 month follow-up
All patients –PROMs completed at start of treatment
Results (n=3739) 4 (1, 12)
n=2282 8 (4, 10) 68% (502/741) 53% (1644/3080) n=1343
8% (108) 30% (1416/4718)
Colchester Hospital University NHS Foundation Trust
Colchester General Hospital* Participant n=32 10 (3, 17)
n=16 14 (10, 16) 50% (3/6) 61% (17/28) 9% (2/22) 11% (4/37)
Countess of Chester Hospital NHS Foundation Trust
Countess of Chester Hospital Participant n=25 6 (2, 14)
n=23 5 (1, 9) 75% (15/20) 48% (12/25) 9% (2/22) 0% (0/51)
County Durham and Darlington NHS Foundation Trust Darlington Memorial Hospital and Bishop Auckland Hospital combined* Participant n=27
3 (1, 13) n=28 9 (6, 12) n<6 68% (17/25) 0% (0/6) 16% (7/43)
University Hospital of North Durham Participant n=9 5 (2, 9)
n=9 7 (6, 10) n<6 44% (4/9) n<6 9% (1/11)
Croydon Health Services NHS Trust
Croydon University Hospital Participant n=20 8 (1, 16)
n=16 7 (6, 10) 57% (4/7) 90% (18/20) 0% (0/7) 0% (0/23)
Dartford and Gravesham NHS Trust
Darent Valley Hospital Previous participant but no data entered in past year
Derby Hospitals NHS Foundation Trust
Royal Derby Hospital* Participant n=11 7 (1, 15)
n=9 9 (6, 11) n=0 25% (2/8) n<6 47% (8/17)
Doncaster and Bassetlaw Hospitals NHS Foundation Trust Doncaster Royal Infirmary* and Bassetlaw District General Hospital combined
Participant n<6 n<6 n<6 n<6 n<6 n<6

© Healthcare Q
uality Improvem
ent Partnership 2015
National clinical audit of biological therapies. Adult report. Septem
ber 2015. UK IBD audit
Participation status
Crohn’s disease patients – time from diagnosis to initial treatment, years, Median (IQR)
Initial treatment Harvey Bradshaw Index, Median (IQR)
Crohn’s disease patients – remission achieved
Crohn’s disease patients – On concomitant immunosuppression at start of treatment
Crohn’s disease patients with adverse event recorded at 3 month follow-up
All patients –PROMs completed at start of treatment
Results (n=3739) 4 (1, 12)
n=2282 8 (4, 10) 68% (502/741) 53% (1644/3080) n=1343
8% (108) 30% (1416/4718)
Dorset County Hospital NHS Foundation Trust
Dorset County Hospital* Participant n=6 4 (1, 10)
n=6 5 (4, 11) n<6 n=0 n<6 100% (6/6)
Ealing Hospital NHS Trust
Ealing Hospital Non-participant
East and North Hertfordshire NHS Trust Lister Hospital* and Queen Elizabeth II Hospital combined Participant n=59
5 (1, 12) n=59 9 (7, 13) 70% (14/20) 59% (30/51) 0% (0/23) 73% (52/71)
East Cheshire NHS Trust
Macclesfield District General Hospital Participant n=25 5 (2, 9)
n=24 11 (9, 12) n=0 68% (17/25) n=0 0% (0/27)
East Kent Hospitals University NHS Foundation Trust William Harvey Hospital, Kent and Canterbury Hospital and Queen Elizabeth The Queen Mother Hospital combined
Participant n=7 10 (1, 20) n<6 n=0 43% (3/7) n=0 0% (0/7)
East Lancashire Hospitals NHS Trust
Royal Blackburn Hospital and Burnley District General Hospital combined Participant n=73
4 (1, 11) n=48 7 (3, 11) 42% (10/24) 23% (17/75) 3% (1/40) 50% (46/93)
East Sussex Healthcare Trust Eastbourne District General Hospital and Conquest Hospital combined* Participant n=8
1 (0, 13) n<6 n<6 n<6 n<6 40% (4/10)
69

National clinical audit of biological therapies. Adult report. Septem
ber 2015. UK IBD audit
©
Healthcare Quality Im
provement Partnership 2015
70
Participation status
Crohn’s disease patients – time from diagnosis to initial treatment, years, Median (IQR)
Initial treatment Harvey Bradshaw Index, Median (IQR)
Crohn’s disease patients – remission achieved
Crohn’s disease patients – On concomitant immunosuppression at start of treatment
Crohn’s disease patients with adverse event recorded at 3 month follow-up
All patients –PROMs completed at start of treatment
Results (n=3739) 4 (1, 12)
n=2282 8 (4, 10) 68% (502/741) 53% (1644/3080) n=1343
8% (108) 30% (1416/4718)
Epsom and St Helier University Hospitals NHS Trust
Epsom General Hospital Participant n=7 3 (2, 23)
n=7 10 (9, 12) n<6 71% (5/7) n<6 0% (0/10)
St Helier Hospital Participant n=6 4 (1, 11) n<6 n=0 83% (5/6) n=0 17% (1/6)
Frimley Health NHS Foundation Trust
Frimley Park Hospital* Participant n=32 7 (2, 16)
n=27 11 (7, 14) 70% (7/10) 78% (21/27) 13% (2/16) 14% (5/35)
Heatherwood Hospital Non-participant
Wexham Park Hospital Participant n<6 n<6 n<6 n<6 n<6 n<6
Gateshead Health NHS Foundation Trust
Queen Elizabeth Hospital, Gateshead Participant but data submitted do not meet audit criteria
George Eliot Hospital NHS Trust
George Eliot Hospital Participant n=37 1 (0, 2) n<6 n=0 43% (16/37) 0% (0/12) 50% (21/42)
Gloucestershire Hospitals NHS Foundation Trust Gloucestershire Royal Hospital and Cheltenham General Hospital combined*
Participant n=13 1 (0, 9)
n=17 4 (2, 8) 67% (4/6) n=0 14% (1/7) 88% (15/17)
Great Western Hospitals NHS Foundation Trust
Great Western Hospital Participant n=53 4 (1, 11) n<6 n=0 40% (21/53) 100% (1/1) 0% (0/69)

© Healthcare Q
uality Improvem
ent Partnership 2015
National clinical audit of biological therapies. Adult report. Septem
ber 2015. UK IBD audit
Participation status
Crohn’s disease patients – time from diagnosis to initial treatment, years, Median (IQR)
Initial treatment Harvey Bradshaw Index, Median (IQR)
Crohn’s disease patients – remission achieved
Crohn’s disease patients – On concomitant immunosuppression at start of treatment
Crohn’s disease patients with adverse event recorded at 3 month follow-up
All patients –PROMs completed at start of treatment
Results (n=3739) 4 (1, 12)
n=2282 8 (4, 10) 68% (502/741) 53% (1644/3080) n=1343
8% (108) 30% (1416/4718)
Guy’s and St Thomas’ NHS Foundation Trust Guy’s Hospital and St Thomas’ Hospital combined* Participant n=14
1 (1, 6) n=17 5 (4, 9) n<6 n=0 n<6 94% (16/17)
Hampshire Hospitals NHS Foundation Trust Basingstoke and North Hampshire Hospitals* Participant n=10
3 (1, 14) n=10 9 (5, 12) n<6 n=0 n<6 100% (10/10)
Royal Hampshire County Hospital* Participant n=12 2 (0, 19)
n=15 7 (4, 15) n<6 n=0 n<6 93% (14/15)
Harrogate and District NHS Foundation Trust
Harrogate District Hospital
Previous participant but no data entered in past year
n=8 4 (1, 7) n<6 n=0 50% (4/8) n=0 0% (0/10)
Heart of England NHS Foundation Trust Birmingham Heartlands Hospital and Solihull Hospital combined Participant n<6 n<6 n<6 n<6 n<6 n<6
Good Hope Hospital Participant n=6 5 (2, 10) n<6 n=0 67% (4/6) n<6 0% (0/7)
Hinchingbrooke Health Care NHS Trust
Hinchingbrooke Hospital Participant but data submitted do not meet audit criteria
Homerton University Hospital NHS Foundation Trust
Homerton University Hospital Participant n=49 4 (1, 12)
n=44 9 (7, 10) 32% (6/19) 84% (41/49) 5% (1/21) 6% (4/63)
71

National clinical audit of biological therapies. Adult report. Septem
ber 2015. UK IBD audit
©
Healthcare Quality Im
provement Partnership 2015
72
Participation status
Crohn’s disease patients – time from diagnosis to initial treatment, years, Median (IQR)
Initial treatment Harvey Bradshaw Index, Median (IQR)
Crohn’s disease patients – remission achieved
Crohn’s disease patients – On concomitant immunosuppression at start of treatment
Crohn’s disease patients with adverse event recorded at 3 month follow-up
All patients –PROMs completed at start of treatment
Results (n=3739) 4 (1, 12)
n=2282 8 (4, 10) 68% (502/741) 53% (1644/3080) n=1343
8% (108) 30% (1416/4718)
Hull and East Yorkshire Hospitals NHS Trust Hull Royal Infirmary* and Castle Hill Hospital combined Participant n=62
2 (0, 8) n=49 5 (2, 7) 79% (19/24) 63% (17/27) 5% (2/40) 79% (53/67)
Imperial College Healthcare NHS Trust Charing Cross Hospital, Hammersmith Hospital and St Mary’s Hospital combined
Previous participant but no data entered in past year
James Paget University Hospitals NHS Foundation Trust
James Paget Hospital* Participant n=6 0 (0, 3)
n=6 7 (1, 10) n<6 n<6 n<6 83% (5/6)
Kettering General Hospital NHS Foundation Trust
Kettering General Hospital Previous participant but no data entered in past year
King’s College Hospital NHS Foundation Trust
King’s College Hospital Participant n<6 n<6 n<6 n<6 n<6 n<6
Princess Royal University Hospital Participant n=8 4 (1, 12) n<6 n=0 63% (5/8) n=0 0% (0/16)
Kingston Hospital NHS Trust
Kingston Hospital Participant n=15 1 (1, 6) n<6 n=0 73% (11/15) n=0 0% (0/19)
Lancashire Teaching Hospitals NHS Foundation Trust
Royal Preston Hospital and Chorley and South Ribble Hospital combined Participant but data submitted do not meet audit criteria

© Healthcare Q
uality Improvem
ent Partnership 2015
National clinical audit of biological therapies. Adult report. Septem
ber 2015. UK IBD audit
Participation status
Crohn’s disease patients – time from diagnosis to initial treatment, years, Median (IQR)
Initial treatment Harvey Bradshaw Index, Median (IQR)
Crohn’s disease patients – remission achieved
Crohn’s disease patients – On concomitant immunosuppression at start of treatment
Crohn’s disease patients with adverse event recorded at 3 month follow-up
All patients –PROMs completed at start of treatment
Results (n=3739) 4 (1, 12)
n=2282 8 (4, 10) 68% (502/741) 53% (1644/3080) n=1343
8% (108) 30% (1416/4718)
Lewisham and Greenwich NHS Trust
Lewisham Hospital Participant n<6 n<6 n=0 n<6 n<6 0% (0/7)
Queen Elizabeth Hospital, Woolwich Participant but data submitted do not meet audit criteria
London North West Healthcare NHS Trust
Central Middlesex Hospital Participant but data submitted do not meet audit criteria
Northwick Park and St Mark's Hospitals Combined* Participant n=14
20 (8, 29) n=16 5 (2, 10) 67% (8/12) n=0 0% (0/12) 100% (16/16)
Luton and Dunstable Hospital NHS Foundation Trust
Luton and Dunstable Hospital* Participant n<6 n<6 n=0 n=0 n<6 0% (0/6)
Maidstone and Tunbridge Wells NHS Trust
Maidstone Hospital* Participant n<6 n<6 n<6 n<6 n<6 n<6
Tunbridge Wells Hospital Participant n=19 8 (3, 16)
n=11 9 (0, 9) n=0 53% (10/19) n<6 10% (2/20)
Medway NHS Foundation Trust
Medway Maritime Hospital Participant n=18 4 (2, 13) n<6 n=0 72% (13/18) n<6 0% (0/20)
Mid Cheshire Hospitals NHS Foundation Trust
Leighton Hospital* Participant n<6 n<6 n<6 n<6 n<6 n<6
73

National clinical audit of biological therapies. Adult report. Septem
ber 2015. UK IBD audit
©
Healthcare Quality Im
provement Partnership 2015
74
Participation status
Crohn’s disease patients – time from diagnosis to initial treatment, years, Median (IQR)
Initial treatment Harvey Bradshaw Index, Median (IQR)
Crohn’s disease patients – remission achieved
Crohn’s disease patients – On concomitant immunosuppression at start of treatment
Crohn’s disease patients with adverse event recorded at 3 month follow-up
All patients –PROMs completed at start of treatment
Results (n=3739) 4 (1, 12)
n=2282 8 (4, 10) 68% (502/741) 53% (1644/3080) n=1343
8% (108) 30% (1416/4718)
Mid Essex Hospitals NHS Trust
Broomfield Hospital Participant n=25 6 (2, 12)
n=23 10 (9, 12) n=0 52% (13/25) n=0 0% (0/25)
Milton Keynes Hospital NHS Foundation Trust
Milton Keynes Hospital* Participant n<6 n=8 7 (4, 11) n<6 n=0 n<6 100% (8/8)
NHS Isle of Wight
St Mary’s Hospital Previous participant but no data entered in past year
Norfolk and Norwich University Hospitals NHS Foundation Trust Norfolk and Norwich University Hospital* Participant n=12
4 (2, 9) n=12 3 (1, 6) n<6 n=0 n<6 100% (12/12)
North Bristol NHS Trust
Southmead hospital Participant n=13 3 (1, 10) n<6 n=0 62% (8/13) n<6 7% (1/14)
North Cumbria University Hospitals NHS Trust
Cumberland Infirmary* Participant n=13 4 (2, 9) n<6 n=0 46% (5/11) n<6 14% (2/14)
West Cumberland Hospital* Participant n=9 2 (1, 8) n<6 n=0 100% (7/7) n<6 13% (2/15)
North Middlesex University Hospital NHS Trust
North Middlesex University Hospital Previous participant but no data entered in past year

© Healthcare Q
uality Improvem
ent Partnership 2015
National clinical audit of biological therapies. Adult report. Septem
ber 2015. UK IBD audit
Participation status
Crohn’s disease patients – time from diagnosis to initial treatment, years, Median (IQR)
Initial treatment Harvey Bradshaw Index, Median (IQR)
Crohn’s disease patients – remission achieved
Crohn’s disease patients – On concomitant immunosuppression at start of treatment
Crohn’s disease patients with adverse event recorded at 3 month follow-up
All patients –PROMs completed at start of treatment
Results (n=3739) 4 (1, 12)
n=2282 8 (4, 10) 68% (502/741) 53% (1644/3080) n=1343
8% (108) 30% (1416/4718)
North Tees and Hartlepool NHS Foundation Trust
University Hospital of Hartlepool Participant n<6 n<6 n<6 n<6 n<6 n<6
University Hospital of North Tees Participant n=31 4 (1, 13) n<6 n=0 55% (17/31) 11% (2/19) 13% (5/40)
Northampton General Hospital NHS Trust
Northampton General Hospital Participant n=36 6 (1, 13) n<6 n<6 44% (16/36) 0% (0/9) 0% (0/53)
Northern Devon Healthcare NHS Trust
North Devon District Hospital
Previous participant but no data entered in past year
n<6 n<6 n<6 n<6 n<6 n<6
Northern Lincolnshire and Goole Hospitals NHS Foundation Trust
Diana, Princess of Wales Hospital Participant n=26 4 (1, 9) n<6 n=0 62% (16/26) n<6 0% (0/45)
Scunthorpe General Hospital
Previous participant but no data entered in past year
n=9 4 (2, 10) n<6 n=0 67% (6/9) n<6 0% (0/10)
Northumbria Healthcare NHS Foundation Trust Northumbria Healthcare NHS Foundation Trust (Wansbeck, North Tyneside and Hexham General Hospitals combined)
Participant n=28 5 (1, 12)
n=27 11 (8, 14) 43% (3/7) 61% (17/28) 0% (0/8) 38% (12/32)
75

National clinical audit of biological therapies. Adult report. Septem
ber 2015. UK IBD audit
©
Healthcare Quality Im
provement Partnership 2015
76
Participation status
Crohn’s disease patients – time from diagnosis to initial treatment, years, Median (IQR)
Initial treatment Harvey Bradshaw Index, Median (IQR)
Crohn’s disease patients – remission achieved
Crohn’s disease patients – On concomitant immunosuppression at start of treatment
Crohn’s disease patients with adverse event recorded at 3 month follow-up
All patients –PROMs completed at start of treatment
Results (n=3739) 4 (1, 12)
n=2282 8 (4, 10) 68% (502/741) 53% (1644/3080) n=1343
8% (108) 30% (1416/4718)
Nottingham University Hospital NHS Trust Queen’s Medical Centre* and Nottingham City Hospital combined Participant n=7
3 (1, 17) n=10 7 (3, 9) n<6 n=0 33% (2/6) 100% (10/10)
Oxford University Hospitals NHS Trust The John Radcliffe Hospital and Horton General Hospital combined Participant n=36
3 (1, 8) n<6 n=0 67% (24/36) 13% (1/8) 0% (0/41)
Peterborough and Stamford Hospitals NHS Foundation Trust
Peterborough City Hospital Participant n=26 8 (2, 22) n<6 n<6 65% (17/26) 0% (0/8) 0% (0/31)
Plymouth Hospitals NHS Trust
Derriford Hospital* Participant n=9 0 (0, 7)
n=10 4 (2, 8) n=0 n=0 0% (0/6) 93% (13/14)
Poole Hospital NHS Foundation Trust
Poole General Hospital* Participant n=8 5 (0, 10)
n=8 6 (3, 8) n=0 n=0 n<6 94% (15/16)
Portsmouth Hospitals NHS Trust
Queen Alexandra Hospital* Participant n=51 6 (1, 14)
n=10 4 (4, 7) 57% (4/7) 64% (27/42) 0% (0/7) 12% (8/65)
Princess Alexandra Hospital NHS Trust
Princess Alexandra Hospital, Harlow* Participant n=14 4 (0, 13)
n=17 11 (6, 15) n<6 n=0 0% (0/6) 100% (17/17)
Royal Berkshire NHS Foundation Trust
Royal Berkshire Hospital* Participant n=9 1 (1, 13)
n=10 5 (3, 14) n<6 n=0 n<6 100% (10/10)

© Healthcare Q
uality Improvem
ent Partnership 2015
National clinical audit of biological therapies. Adult report. Septem
ber 2015. UK IBD audit
Participation status
Crohn’s disease patients – time from diagnosis to initial treatment, years, Median (IQR)
Initial treatment Harvey Bradshaw Index, Median (IQR)
Crohn’s disease patients – remission achieved
Crohn’s disease patients – On concomitant immunosuppression at start of treatment
Crohn’s disease patients with adverse event recorded at 3 month follow-up
All patients –PROMs completed at start of treatment
Results (n=3739) 4 (1, 12)
n=2282 8 (4, 10) 68% (502/741) 53% (1644/3080) n=1343
8% (108) 30% (1416/4718)
Royal Bolton Hospital NHS Foundation Trust
Royal Bolton Hospital Participant n=65 6 (2, 12)
n=45 5 (3, 9) 38% (3/8) 81% (54/67) 6% (1/16) 10% (9/91)
Royal Bournemouth and Christchurch Hospitals NHS Foundation Trust
Royal Bournemouth Hospital* Participant n=97 5 (1, 15)
n=95 7 (5, 11) 64% (28/44) 60% (55/91) 6% (3/48) 8% (10/121)
Royal Cornwall Hospitals NHS Trust
Royal Cornwall Hospital* Participant n=27 7 (2, 16)
n=10 6 (2, 6) n<6 57% (13/23) 0% (0/11) 30% (11/37)
Royal Devon and Exeter NHS Foundation Trust
Royal Devon and Exeter Hospital* Participant n=47 1 (0, 4)
n=48 6 (3, 10) 81% (21/26) n=0 4% (1/27) 86% (42/49)
Royal Free London NHS Foundation Trust
Barnet General Hospital
Previous participant but no data entered in past year
n=6 4 (1, 15)
n=6 22 (14, 25) n=0 83% (5/6) n=0 0% (0/8)
Royal Free Hospital* Participant n=8 6 (2, 14) n<6 n=0 50% (3/6) n<6 42% (5/12)
Royal Liverpool and Broadgreen University Hospitals NHS Trust
Royal Liverpool University Hospital Participant n=28 2 (1, 7)
n=27 7 (0, 10) n<6 64% (18/28) 0% (0/6) 0% (0/33)
Royal Surrey County Hospital NHS Foundation Trust
Royal Surrey County Hospital Participant n=7 10 (2, 27)
n=6 14 (12, 14) n=0 71% (5/7) n=0 0% (0/9)
77

National clinical audit of biological therapies. Adult report. Septem
ber 2015. UK IBD audit
©
Healthcare Quality Im
provement Partnership 2015
78
Participation status
Crohn’s disease patients – time from diagnosis to initial treatment, years, Median (IQR)
Initial treatment Harvey Bradshaw Index, Median (IQR)
Crohn’s disease patients – remission achieved
Crohn’s disease patients – On concomitant immunosuppression at start of treatment
Crohn’s disease patients with adverse event recorded at 3 month follow-up
All patients –PROMs completed at start of treatment
Results (n=3739) 4 (1, 12)
n=2282 8 (4, 10) 68% (502/741) 53% (1644/3080) n=1343
8% (108) 30% (1416/4718)
Royal United Hospital Bath NHS Trust
Royal United Hospital Non-participant
Salford Royal NHS Foundation Trust
Salford Royal Hospital* Participant n=108 7 (2, 15)
n=85 9 (8, 11) 12% (6/49) 36% (38/106) 13% (7/56) 2% (2/114)
Salisbury NHS Foundation Trust
Salisbury District General Hospital Participant n=19 2 (1, 6) n<6 n=0 37% (7/19) n<6 0% (0/32)
Sandwell and West Birmingham Hospitals NHS Trust Birmingham City Hospital and Sandwell Hospital combined* Participant n=20
6 (1, 12) n=11 8 (5, 9) n<6 75% (6/8) n<6 44% (10/23)
Sheffield Teaching Hospitals NHS Foundation Trust
Royal Hallamshire Hospital and Northern General Hospital combined Participant n=145
6 (2, 13) n=99 7 (4, 10) 64% (16/25) 44% (64/146) 0% (0/42) 65% (125/192)
Sherwood Forest Hospitals NHS Foundation Trust King’s Mill Hospital and Newark Hospital combined* Participant n=30
2 (1, 9) n=20 4 (2, 7) 67% (4/6) 33% (5/15) 10% (1/10) 55% (18/33)
South Devon Healthcare NHS Foundation Trust
Torbay Hospital* Participant n=24 5 (1, 18)
n=24 8 (4, 12) 64% (7/11) n=0 23% (3/13) 100% (24/24)
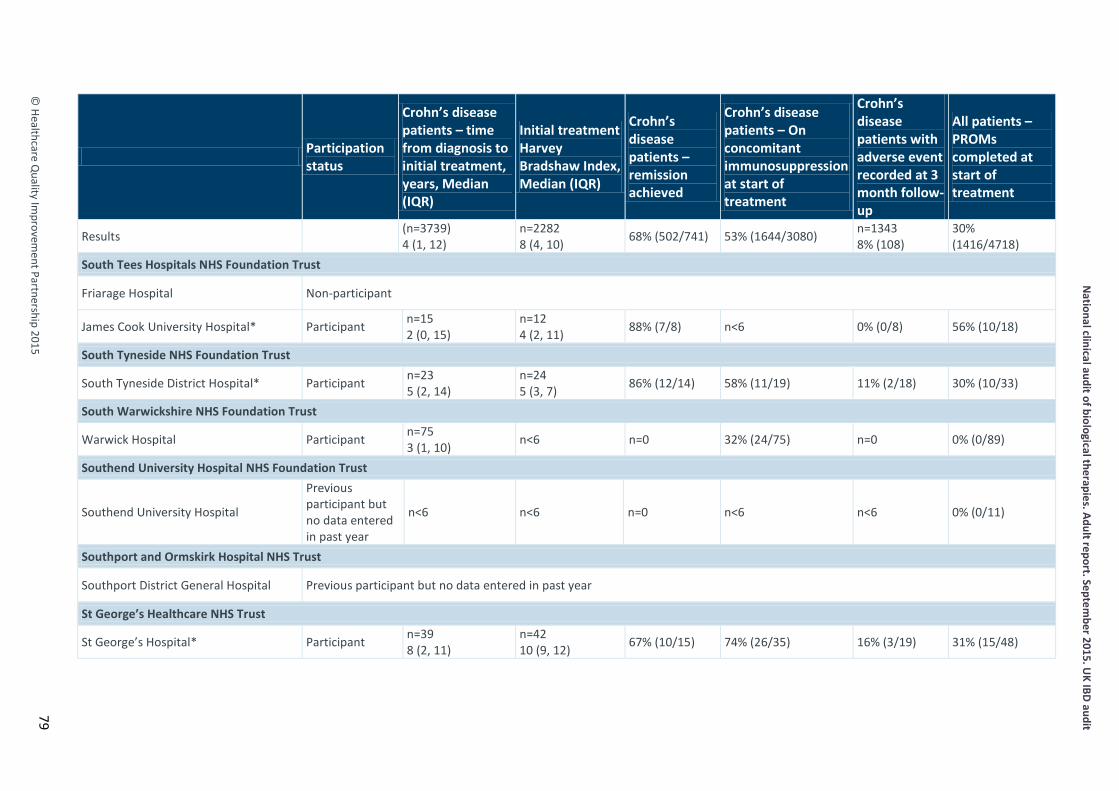
© Healthcare Q
uality Improvem
ent Partnership 2015
National clinical audit of biological therapies. Adult report. Septem
ber 2015. UK IBD audit
Participation status
Crohn’s disease patients – time from diagnosis to initial treatment, years, Median (IQR)
Initial treatment Harvey Bradshaw Index, Median (IQR)
Crohn’s disease patients – remission achieved
Crohn’s disease patients – On concomitant immunosuppression at start of treatment
Crohn’s disease patients with adverse event recorded at 3 month follow-up
All patients –PROMs completed at start of treatment
Results (n=3739) 4 (1, 12)
n=2282 8 (4, 10) 68% (502/741) 53% (1644/3080) n=1343
8% (108) 30% (1416/4718)
South Tees Hospitals NHS Foundation Trust
Friarage Hospital Non-participant
James Cook University Hospital* Participant n=15 2 (0, 15)
n=12 4 (2, 11) 88% (7/8) n<6 0% (0/8) 56% (10/18)
South Tyneside NHS Foundation Trust
South Tyneside District Hospital* Participant n=23 5 (2, 14)
n=24 5 (3, 7) 86% (12/14) 58% (11/19) 11% (2/18) 30% (10/33)
South Warwickshire NHS Foundation Trust
Warwick Hospital Participant n=75 3 (1, 10) n<6 n=0 32% (24/75) n=0 0% (0/89)
Southend University Hospital NHS Foundation Trust
Southend University Hospital
Previous participant but no data entered in past year
n<6 n<6 n=0 n<6 n<6 0% (0/11)
Southport and Ormskirk Hospital NHS Trust
Southport District General Hospital Previous participant but no data entered in past year
St George’s Healthcare NHS Trust
St George’s Hospital* Participant n=39 8 (2, 11)
n=42 10 (9, 12) 67% (10/15) 74% (26/35) 16% (3/19) 31% (15/48)
79

National clinical audit of biological therapies. Adult report. Septem
ber 2015. UK IBD audit
©
Healthcare Quality Im
provement Partnership 2015
80
Participation status
Crohn’s disease patients – time from diagnosis to initial treatment, years, Median (IQR)
Initial treatment Harvey Bradshaw Index, Median (IQR)
Crohn’s disease patients – remission achieved
Crohn’s disease patients – On concomitant immunosuppression at start of treatment
Crohn’s disease patients with adverse event recorded at 3 month follow-up
All patients –PROMs completed at start of treatment
Results (n=3739) 4 (1, 12)
n=2282 8 (4, 10) 68% (502/741) 53% (1644/3080) n=1343
8% (108) 30% (1416/4718)
St Helens and Knowsley Hospitals NHS Trust
Whiston Hospital Participant but data submitted do not meet audit criteria
Stockport NHS Foundation Trust
Stepping Hill Hospital* Participant n<6 n<6 n<6 n<6 n<6 n<6
Surrey and Sussex Healthcare NHS Trust
East Surrey Hospital Previous participant but no data entered in past year
Tameside Hospital NHS Foundation Trust
Tameside General Hospital* Participant n<6 n<6 n<6 n<6 n<6 43% (3/7)
Taunton and Somerset NHS Foundation Trust
Musgrove Park Hospital* Participant n=14 4 (1, 17)
n=11 0 (0, 5) n<6 55% (6/11) n<6 95% (19/20)
The Dudley Group NHS Foundation Trust
Russells Hall Hospital* Participant n=43 4 (1, 12)
n=39 8 (5, 10) n<6 62% (26/42) 10% (1/10) 49% (32/65)
The Hillingdon Hospitals NHS Foundation Trust
Hillingdon Hospital Non-participant
The Ipswich Hospital NHS Trust
The Ipswich Hospital Previous participant but no data entered in past year

© Healthcare Q
uality Improvem
ent Partnership 2015
National clinical audit of biological therapies. Adult report. Septem
ber 2015. UK IBD audit
Participation status
Crohn’s disease patients – time from diagnosis to initial treatment, years, Median (IQR)
Initial treatment Harvey Bradshaw Index, Median (IQR)
Crohn’s disease patients – remission achieved
Crohn’s disease patients – On concomitant immunosuppression at start of treatment
Crohn’s disease patients with adverse event recorded at 3 month follow-up
All patients –PROMs completed at start of treatment
Results (n=3739) 4 (1, 12)
n=2282 8 (4, 10) 68% (502/741) 53% (1644/3080) n=1343
8% (108) 30% (1416/4718)
The Leeds Teaching Hospitals NHS Trust
Leeds General Infirmary* Participant n<6 n<6 n=0 n<6 n<6 n<6
St James’s University Hospital Leeds* Participant n=14 5 (1, 10)
n=15 5 (2, 7) 67% (4/6) n=0 13% (1/8) 94% (16/17)
The Mid Yorkshire Hospitals NHS Trust
Dewsbury and District Hospital Non-participant
Pinderfields General Hospital and Pontefract Hospitals combined* Participant n=12
2 (0, 5) n=16 2 (0, 9) n<6 n=0 0% (0/6) 82% (14/17)
The Newcastle upon Tyne Hospitals NHS Foundation Trust
Freeman Hospital Participant n=40 9 (2, 20)
n=10 11 (6, 17) n<6 43% (17/40) 5% (1/22) 0% (0/43)
Royal Victoria Infirmary, Newcastle* Participant n=23 3 (1, 10)
n=24 6 (3, 10) 83% (15/18) n=0 5% (1/19) 100% (24/24)
The Pennine Acute Hospitals NHS Trust The Royal Oldham Hospital, Fairfield General Hospital, North Manchester General Hospital and Rochdale Infirmary combined*
Participant n=88 5 (1, 11)
n=11 5 (4, 10) n<6 55% (43/78) n<6 9% (10/107)
The Queen Elizabeth Hospital King’s Lynn NHS Foundation Trust
The Queen Elizabeth Hospital Previous participant but no data entered in past year
81

National clinical audit of biological therapies. Adult report. Septem
ber 2015. UK IBD audit
©
Healthcare Quality Im
provement Partnership 2015
82
Participation status
Crohn’s disease patients – time from diagnosis to initial treatment, years, Median (IQR)
Initial treatment Harvey Bradshaw Index, Median (IQR)
Crohn’s disease patients – remission achieved
Crohn’s disease patients – On concomitant immunosuppression at start of treatment
Crohn’s disease patients with adverse event recorded at 3 month follow-up
All patients –PROMs completed at start of treatment
Results (n=3739) 4 (1, 12)
n=2282 8 (4, 10) 68% (502/741) 53% (1644/3080) n=1343
8% (108) 30% (1416/4718)
The Rotherham NHS Foundation Trust
Rotherham Hospital Participant n=13 5 (2, 12)
n=6 11 (5, 18) n<6 54% (7/13) n<6 0% (0/17)
The Royal Wolverhampton Hospitals NHS Trust
Cannock Chase Hospital Participant n<6 n<6 n=0 n<6 n<6 n<6
New Cross Hospital* Participant n=60 5 (2, 12)
n=46 8 (5, 9) 47% (9/19) 46% (25/54) 0% (0/21) 26% (22/84)
The Shrewsbury and Telford Hospital NHS Trust
Royal Shrewsbury Hospital* and Princess Royal Hospital combined Participant n=13
6 (1, 11) n=15 5 (4, 10) 71% (5/7) n<6 0% (0/8) 88% (14/16)
United Lincolnshire Hospitals NHS Trust
Grantham and District Hospital* Participant n=6 1 (1, 6)
n=6 8 (1, 8) n<6 n<6 n<6 14% (1/7)
Lincoln County Hospital* Participant n=18 2 (1, 5)
n=6 6 (5, 10) n<6 53% (8/15) n<6 13% (3/23)
Pilgrim Hospital Participant n=17 5 (1, 17) n<6 n=0 53% (9/17) 17% (1/6) 0% (0/19)
University College London Hospitals NHS Foundation Trust
University College Hospital* Participant n=70 4 (1, 8)
n=57 7 (3, 9) 73% (16/22) 75% (51/68) 10% (3/30) 4% (3/80)

© Healthcare Q
uality Improvem
ent Partnership 2015
National clinical audit of biological therapies. Adult report. Septem
ber 2015. UK IBD audit
Participation status
Crohn’s disease patients – time from diagnosis to initial treatment, years, Median (IQR)
Initial treatment Harvey Bradshaw Index, Median (IQR)
Crohn’s disease patients – remission achieved
Crohn’s disease patients – On concomitant immunosuppression at start of treatment
Crohn’s disease patients with adverse event recorded at 3 month follow-up
All patients –PROMs completed at start of treatment
Results (n=3739) 4 (1, 12)
n=2282 8 (4, 10) 68% (502/741) 53% (1644/3080) n=1343
8% (108) 30% (1416/4718)
University Hospitals of North Midlands NHS Trust
County Hospital Participant but data submitted do not meet audit criteria
The Royal Stoke University Hospital* Participant n<6 n<6 n<6 n<6 n<6 n<6
University Hospital of South Manchester NHS Foundation Trust
Wythenshawe Hospital* Participant n=30 4 (1, 10)
n=29 10 (6, 14) 83% (5/6) 59% (10/17) 0% (0/6) 34% (13/38)
University Hospital Southampton NHS Foundation Trust
Southampton General Hospital* Participant n=48 3 (1, 10)
n=47 7 (4, 13) 52% (11/21) 46% (5/11) 10% (3/30) 77% (46/60)
University Hospitals Birmingham NHS Foundation Trust
Queen Elizabeth Hospital, Birmingham Participant n=134 8 (3, 15)
n=14 8 (3, 11) n=0 44% (60/135) 11% (11/102) 5% (9/170)
New Queen Elizabeth Hospital Birmingham* Participant n=7
3 (0, 15) n=9 4 (0, 10) n<6 n=0 n<6 100% (10/10)
University Hospitals Coventry and Warwickshire NHS Trust
University Hospital, Coventry* Participant n=18 4 (1, 19)
n=18 5 (3, 9) n<6 n=0 n<6 100% (18/18)
University Hospitals of Bristol NHS Foundation Trust
Bristol Royal Infirmary* Participant n=10 3 (1, 5)
n=6 6 (2, 9) n<6 44% (4/9) n<6 15% (2/13)
83

National clinical audit of biological therapies. Adult report. Septem
ber 2015. UK IBD audit
©
Healthcare Quality Im
provement Partnership 2015
84
Participation status
Crohn’s disease patients – time from diagnosis to initial treatment, years, Median (IQR)
Initial treatment Harvey Bradshaw Index, Median (IQR)
Crohn’s disease patients – remission achieved
Crohn’s disease patients – On concomitant immunosuppression at start of treatment
Crohn’s disease patients with adverse event recorded at 3 month follow-up
All patients –PROMs completed at start of treatment
Results (n=3739) 4 (1, 12)
n=2282 8 (4, 10) 68% (502/741) 53% (1644/3080) n=1343
8% (108) 30% (1416/4718)
University Hospitals of Leicester NHS Trust
Leicester Royal Infirmary
Previous participant but no data entered in past year
n=8 2 (1, 3) n<6 n=0 38% (3/8) n=0 0% (0/8)
Leicester General Hospital* Participant n<6 n<6 n<6 n<6 n<6 n<6
University Hospitals of Morecombe Bay NHS Foundation Trust Furness General and Royal Lancaster Infirmary and Westmorland General Hospitals combined
Participant n=22 9 (2, 20) n<6 n=0 59% (13/22) n<6 0% (0/27)
Walsall Healthcare NHS Trust
Walsall Manor Hospital
Previous participant but no data entered in past year
n=21 2 (1, 8)
n=19 13 (10, 16) n<6 52% (11/21) n<6 65% (20/31)
Warrington and Halton Hospitals NHS Foundation Trust
Warrington District General Hospital* Participant n=18 5 (2, 11)
n=17 7 (5, 13) n<6 n<6 n<6 57% (13/23)
West Hertfordshire Hospitals NHS Trust Watford General Hospital* and Hemel Hempstead General Hospital combined Participant n=66
3 (1, 10) n=48 10 (8, 13) 65% (11/17) 51% (32/63) 5% (2/40) 4% (3/70)
West Middlesex University Hospital NHS Trust
West Middlesex University Hospital* Participant n=17 5 (2, 13)
n=17 10 (8, 12) n=0 56% (9/16) n<6 5% (1/22)
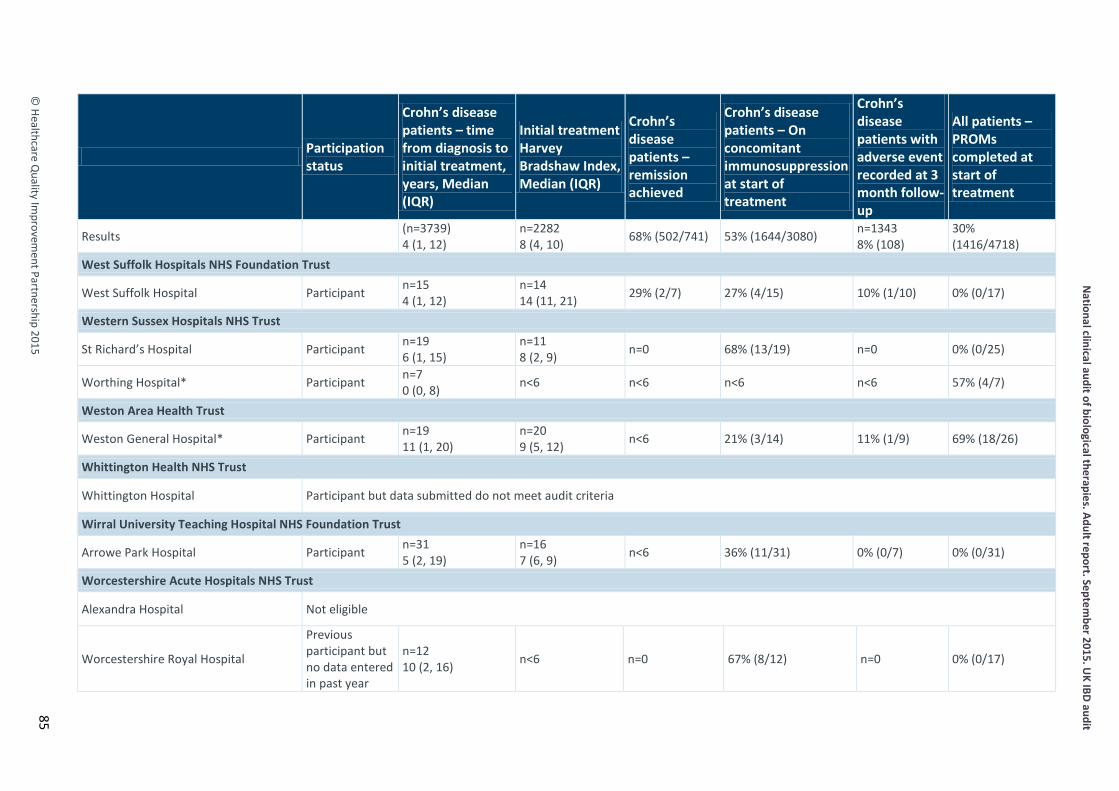
© Healthcare Q
uality Improvem
ent Partnership 2015
National clinical audit of biological therapies. Adult report. Septem
ber 2015. UK IBD audit
Participation status
Crohn’s disease patients – time from diagnosis to initial treatment, years, Median (IQR)
Initial treatment Harvey Bradshaw Index, Median (IQR)
Crohn’s disease patients – remission achieved
Crohn’s disease patients – On concomitant immunosuppression at start of treatment
Crohn’s disease patients with adverse event recorded at 3 month follow-up
All patients –PROMs completed at start of treatment
Results (n=3739) 4 (1, 12)
n=2282 8 (4, 10) 68% (502/741) 53% (1644/3080) n=1343
8% (108) 30% (1416/4718)
West Suffolk Hospitals NHS Foundation Trust
West Suffolk Hospital Participant n=15 4 (1, 12)
n=14 14 (11, 21) 29% (2/7) 27% (4/15) 10% (1/10) 0% (0/17)
Western Sussex Hospitals NHS Trust
St Richard’s Hospital Participant n=19 6 (1, 15)
n=11 8 (2, 9) n=0 68% (13/19) n=0 0% (0/25)
Worthing Hospital* Participant n=7 0 (0, 8) n<6 n<6 n<6 n<6 57% (4/7)
Weston Area Health Trust
Weston General Hospital* Participant n=19 11 (1, 20)
n=20 9 (5, 12) n<6 21% (3/14) 11% (1/9) 69% (18/26)
Whittington Health NHS Trust
Whittington Hospital Participant but data submitted do not meet audit criteria
Wirral University Teaching Hospital NHS Foundation Trust
Arrowe Park Hospital Participant n=31 5 (2, 19)
n=16 7 (6, 9) n<6 36% (11/31) 0% (0/7) 0% (0/31)
Worcestershire Acute Hospitals NHS Trust
Alexandra Hospital Not eligible
Worcestershire Royal Hospital
Previous participant but no data entered in past year
n=12 10 (2, 16) n<6 n=0 67% (8/12) n=0 0% (0/17)
85

National clinical audit of biological therapies. Adult report. Septem
ber 2015. UK IBD audit
©
Healthcare Quality Im
provement Partnership 2015
86
Participation status
Crohn’s disease patients – time from diagnosis to initial treatment, years, Median (IQR)
Initial treatment Harvey Bradshaw Index, Median (IQR)
Crohn’s disease patients – remission achieved
Crohn’s disease patients – On concomitant immunosuppression at start of treatment
Crohn’s disease patients with adverse event recorded at 3 month follow-up
All patients –PROMs completed at start of treatment
Results (n=3739) 4 (1, 12)
n=2282 8 (4, 10) 68% (502/741) 53% (1644/3080) n=1343
8% (108) 30% (1416/4718)
Wrightington, Wigan and Leigh NHS Foundation Trust
Royal Albert Edward Infirmary* Participant n=7 6 (2, 33)
n=7 7 (1, 11) n<6 n=0 n<6 100% (7/7)
Wye Valley NHS Trust
County Hospital, Hereford Participant n=19 2 (1, 9)
n=18 9 (7, 14) 38% (3/8) 42% (8/19) 0% (0/8) 0% (0/20)
Yeovil District Hospital NHS Foundation Trust
Yeovil District Hospital* Participant n=37 6 (1, 16)
n=23 6 (4, 7) 60% (6/10) 36% (11/31) 33% (7/21) 92% (54/59)
York Teaching Hospital NHS Foundation Trust
Scarborough General Hospital Previous participant but no data entered in past year
York Hospital Participant n=15 4 (1, 12) n<6 n=0 60% (9/15) n=0 0% (0/18)
Northern Ireland (n=12) Belfast Health and Social Care Trust
Belfast City Hospital Participant n=30 3 (1, 10)
n=7 6 (5, 8) n=0 67% (20/30) n<6 23% (8/35)
Mater Hospital Previous participant but no data entered in past year
Royal Victoria Hospital Participant n=15 5 (0, 14) n<6 n=0 80% (12/15) n=0 0% (0/16)

© Healthcare Q
uality Improvem
ent Partnership 2015
National clinical audit of biological therapies. Adult report. Septem
ber 2015. UK IBD audit
Participation status
Crohn’s disease patients – time from diagnosis to initial treatment, years, Median (IQR)
Initial treatment Harvey Bradshaw Index, Median (IQR)
Crohn’s disease patients – remission achieved
Crohn’s disease patients – On concomitant immunosuppression at start of treatment
Crohn’s disease patients with adverse event recorded at 3 month follow-up
All patients –PROMs completed at start of treatment
Results (n=3739) 4 (1, 12)
n=2282 8 (4, 10) 68% (502/741) 53% (1644/3080) n=1343
8% (108) 30% (1416/4718)
Northern Health and Social Care Trust
Antrim Area Hospital Previous participant but no data entered in past year
Causeway Hospital Participant n=8 5 (1, 8) n<6 n=0 25% (2/8) n=0 0% (0/13)
South Eastern Health and Social Care Trust
Downe Hospital Non-participant
Lagan Valley Hospital Participant n=6 3 (1, 5)
n=6 11 (7, 16) n=0 50% (3/6) n<6 0% (0/6)
Ulster Hospital Participant n<6 n<6 n<6 n<6 n<6 n<6
Southern Health and Social Care Trust
Craigavon Area Hospital
Previous participant but no data entered in past year
n=8 7 (1, 14) n<6 n=0 88% (7/8) n=0 9% (1/11)
Daisy Hill Hospital Participant n=7 3 (0, 10) n<6 n=0 43% (3/7) n<6 44% (4/9)
Western Health and Social Care Trust
Altnagelvin Area Hospital
Previous participant but no data entered in past year
n=8 13 (3, 22)
n=8 10 (4, 13) n=0 50% (4/8) n=0 0% (0/9)
South West Acute Hospital Previous participant but no data entered in past year
87

National clinical audit of biological therapies. Adult report. Septem
ber 2015. UK IBD audit
©
Healthcare Quality Im
provement Partnership 2015
88
Participation status
Crohn’s disease patients – time from diagnosis to initial treatment, years, Median (IQR)
Initial treatment Harvey Bradshaw Index, Median (IQR)
Crohn’s disease patients – remission achieved
Crohn’s disease patients – On concomitant immunosuppression at start of treatment
Crohn’s disease patients with adverse event recorded at 3 month follow-up
All patients –PROMs completed at start of treatment
Results (n=3739) 4 (1, 12)
n=2282 8 (4, 10) 68% (502/741) 53% (1644/3080) n=1343
8% (108) 30% (1416/4718)
Scotland (n=21) NHS Ayrshire and Arran
University Hospital Ayr Non-participant
University Hospital Crosshouse Previous participant but no data entered in past year
NHS Borders
Borders General Hospital Previous participant but no data entered in past year
NHS Dumfries and Galloway
Dumfries and Galloway Royal Infirmary Participant n<6 n<6 n<6 n<6 n<6 n<6
NHS Fife
Queen Margaret Hospital Non-participant
Victoria Hospital* Participant n<6 n<6 n<6 n<6 n<6 n<6
NHS Forth Valley
Forth Valley Royal Hospital* Participant n=46 4 (1, 9)
n=18 4 (0, 8) 86% (6/7) 65% (22/34) 5% (1/22) 96% (65/68)
NHS Grampian
Aberdeen Royal Infirmary Non-participant

© Healthcare Q
uality Improvem
ent Partnership 2015
National clinical audit of biological therapies. Adult report. Septem
ber 2015. UK IBD audit
Participation status
Crohn’s disease patients – time from diagnosis to initial treatment, years, Median (IQR)
Initial treatment Harvey Bradshaw Index, Median (IQR)
Crohn’s disease patients – remission achieved
Crohn’s disease patients – On concomitant immunosuppression at start of treatment
Crohn’s disease patients with adverse event recorded at 3 month follow-up
All patients –PROMs completed at start of treatment
Results (n=3739) 4 (1, 12)
n=2282 8 (4, 10) 68% (502/741) 53% (1644/3080) n=1343
8% (108) 30% (1416/4718)
NHS Greater Glasgow and Clyde
Glasgow Royal Infirmary* Participant n=11 5 (1, 7)
n=11 5 (3, 9) n<6 n=0 n<6 91% (10/11)
Inverclyde Royal Hospital Previous participant but no data entered in past year
Royal Alexandra Hospital Previous participant but no data entered in past year
Southern General Hospital Non-participant
Victoria Infirmary Non-participant
Western Infirmary Non-participant
NHS Highland
Raigmore Hospital Non-participant
NHS Lanarkshire
Hairmyres Hospital Participant n=9 8 (2, 14)
n=8 8 (4, 9) n<6 44% (4/9) n<6 0% (0/9)
Monklands Hospital Participant n=14 8 (1, 17)
n=7 9 (5, 10) n<6 57% (8/14) n<6 43% (6/14)
Wishaw General Hospital Previous participant but no data entered past year
89

National clinical audit of biological therapies. Adult report. Septem
ber 2015. UK IBD audit
©
Healthcare Quality Im
provement Partnership 2015
90
Participation status
Crohn’s disease patients – time from diagnosis to initial treatment, years, Median (IQR)
Initial treatment Harvey Bradshaw Index, Median (IQR)
Crohn’s disease patients – remission achieved
Crohn’s disease patients – On concomitant immunosuppression at start of treatment
Crohn’s disease patients with adverse event recorded at 3 month follow-up
All patients –PROMs completed at start of treatment
Results (n=3739) 4 (1, 12)
n=2282 8 (4, 10) 68% (502/741) 53% (1644/3080) n=1343
8% (108) 30% (1416/4718)
NHS Lothian
St John’s Hospital at Howden Non-participant
Western General Hospital and Royal Infirmary of Edinburgh combined* Participant n=17
4 (1, 9) n=14 7 (4, 10) n<6 n<6 0% (0/6) 62% (13/21)
NHS Tayside
Ninewells Hospital* Participant n=15 5 (2, 18)
n=7 6 (0, 8) n=0 47% (7/15) n<6 23% (6/26)
Wales (n=16) Abertawe Bro Morgannwg University Health Board
Morriston Hospital Not eligible
Princess of Wales Hospital Non-participant
Aneurin Bevan University Health Board
Nevill Hall Hospital Participant n=41 4 (1, 8)
n=24 6 (2, 10) n<6 49% (20/41) 0% (0/9) 46% (23/50)
Royal Gwent Hospital Participant n=18 4 (1, 11)
n=16 8 (4, 10) n<6 44% (8/18) n<6 75% (18/24)

© Healthcare Q
uality Improvem
ent Partnership 2015
National clinical audit of biological therapies. Adult report. Septem
ber 2015. UK IBD audit
Participation status
Crohn’s disease patients – time from diagnosis to initial treatment, years, Median (IQR)
Initial treatment Harvey Bradshaw Index, Median (IQR)
Crohn’s disease patients – remission achieved
Crohn’s disease patients – On concomitant immunosuppression at start of treatment
Crohn’s disease patients with adverse event recorded at 3 month follow-up
All patients –PROMs completed at start of treatment
Results (n=3739) 4 (1, 12)
n=2282 8 (4, 10) 68% (502/741) 53% (1644/3080) n=1343
8% (108) 30% (1416/4718)
Betsi Cadwaladr University Health Board
Glan Clwyd Hospital Non-participant
Llandudno General Hospital Previous participant but no data entered in past year
Wrexham Maelor Hospital Participant n=38 3 (1, 13)
n=19 10 (8, 12) n<6 45% (17/38) 7% (2/29) 19% (8/42)
Ysbyty Gwynedd Participant but data submitted do not meet audit criteria
Cardiff and Vale University Health Board
University Hospital Llandough Participant n=10 8 (3, 16)
n=10 6 (3, 8) n=0 64% (7/11) n=0 39% (5/13)
University Hospital of Wales
Previous participant but no data entered in past year
n=25 3 (1, 12)
n=22 5 (3, 9) 89% (8/9) 76% (19/25) 0% (0/9) 78% (21/27)
Cwm Taf University Health Board
Prince Charles Hospital Non-participant
Royal Glamorgan Hospital Non-participant
91

National clinical audit of biological therapies. Adult report. Septem
ber 2015. UK IBD audit
©
Healthcare Quality Im
provement Partnership 2015
92
Participation status
Crohn’s disease patients – time from diagnosis to initial treatment, years, Median (IQR)
Initial treatment Harvey Bradshaw Index, Median (IQR)
Crohn’s disease patients – remission achieved
Crohn’s disease patients – On concomitant immunosuppression at start of treatment
Crohn’s disease patients with adverse event recorded at 3 month follow-up
All patients –PROMs completed at start of treatment
Results (n=3739) 4 (1, 12)
n=2282 8 (4, 10) 68% (502/741) 53% (1644/3080) n=1343
8% (108) 30% (1416/4718)
Hywel Dda University Health Board
Bronglais General Hospital Participant n<6 n<6 n<6 n<6 n<6 n<6
Glangwili General Hospital Previous participant but no data entered in past year
Prince Philip Hospital Non-participant
Withybush General Hospital Participant n=17 5 (1, 13)
n=16 8 (6, 10) n<6 77% (13/17) n<6 30% (6/20)
CD = Crohn’s disease; IQR = interquartile range; PROMs = patient-reported outcome measures.

National clinical audit of biological therapies. Adult report. September 2015. UK IBD audit
Appendices
Appendix 1: Acronyms used in this report Anti-TNFα Anti-tumour necrosis factor alpha AoMRC Academy of Medical Royal Colleges CD Crohn’s disease CEEU Clinical Effectiveness and Evaluation Unit CUCQ-12 Crohn’s and ulcerative colitis questionnaire HBI Harvey–Bradshaw index HQIP Healthcare Quality Improvement Partnership IBD Inflammatory bowel disease IBDU Inflammatory bowel disease type unclassified IQR Interquartile range NCAPOP National Clinical Audit and Patient Outcomes Programme NICE National Institute for Health and Care Excellence PANTs Personalised Anti-TNF Therapy in Crohn’s disease study PCDAI Paediatric Crohn’s Disease Activity Index PROMs Patient-reported outcome measures RCN Royal College of Nursing RCP Royal College of Physicians SCCAI Simple Clinical Colitis Activity Index UC Ulcerative colitis
93 © Healthcare Quality Improvement Partnership 2015

National clinical audit of biological therapies. Adult report. September 2015. UK IBD audit
Appendix 2: Biological therapy audit governance Audit governance The fourth round of the UK IBD audit is guided by the multidisciplinary IBD programme steering group, which is a collaborative partnership between gastroenterologists (the British Society of Gastroenterology), colorectal surgeons (the Association of Coloproctology of Great Britain and Ireland), patients (Crohn’s and Colitis UK), physicians (the RCP), nurses (the Royal College of Nursing (RCN), pharmacists (the Royal Pharmaceutical Society), dietitians (the British Dietetic Association) and paediatric gastroenterologists (the British Society of Paediatric Gastroenterology, Hepatology and Nutrition). The audit is commissioned by HQIP as part of the National Clinical Audit and Patient Outcomes Programme (NCAPOP). The audit is managed by the Clinical Effectiveness and Evaluation Unit of the RCP. Each hospital identified an overall clinical lead who was responsible for data collection and entry for their IBD service. Data were collected by hospitals using a standardised method. Any enquiries in relation to the work of the UK IBD audit can be directed to [email protected]. IBD programme steering group members The names of members of the biological therapy audit subgroup are shown in bold. This is the group of people tasked with leading this particular element of the UK IBD audit and who contributed considerably to the development of this element of work. Association of Coloproctology of Great Britain and Ireland
Mr Omar Faiz, consultant colorectal surgeon, St Mark’s Hospital, Harrow Mr Graeme Wilson, consultant colorectal surgeon, Western General Hospital, Edinburgh
British Dietetic Association Ms Katie Keetarut, senior IBD dietitian, University College Hospital, London
British Society of Gastroenterology Dr Ian Arnott, clinical director of the IBD programme, chair of the UK IBD audit steering group; consultant gastroenterologist, Western General Hospital, Edinburgh Dr Stuart Bloom, consultant gastroenterologist, University College Hospital, London Dr Keith Bodger, consultant physician and gastroenterologist, University Hospital Aintree, Liverpool Dr Fraser Cummings, consultant gastroenterologist, University Hospital Southampton Professor Chris Probert, consultant gastroenterologist, Royal Liverpool University Hospital Dr Ian Shaw, IBD programme associate director; consultant gastroenterologist, Gloucestershire Royal Hospital Dr Graham Turner, consultant gastroenterologist, Royal Victoria Hospital, Belfast Professor John Williams, consultant gastroenterologist, Abertawe Bro Morgannwg University Health Board; director, Health Informatics Unit, RCP
British Society of Paediatric Gastroenterology, Hepatology and Nutrition Dr Charles Charlton, consultant paediatric gastroenterologist, Queens Medical Centre, Nottingham Dr Sally Mitton, consultant paediatric gastroenterologist, St George’s Hospital, London Dr Richard Russell, consultant paediatric gastroenterologist, Royal Hospital for Sick Children (Yorkhill), Glasgow
Crohn’s and Colitis UK (NACC) Mr David Barker, chief executive Mr Peter Canham, patient involvement adviser Ms Jackie Glatter, health service development adviser Revd Ian Johnston, patient representative
Primary Care Society for Gastroenterology Dr Jamie Dalrymple, GP partner, Drayton and St Faiths medical practice
94 © Healthcare Quality Improvement Partnership 2015

National clinical audit of biological therapies. Adult report. September 2015. UK IBD audit
Royal College of Nursing
Ms Kay Crook, paediatric gastroenterology clinical nurse specialist, St Mark’s Hospital, Harrow Ms Diane Hall, clinical nurse specialist, Heartlands Hospital, Birmingham Dr Karen Kemp, IBD clinical nurse specialist, Manchester Royal Infirmary
Royal College of Physicians Ms Rhona Buckingham, operations director, CEEU Ms Kajal Mortier, project manager, UK IBD programme Ms Susan Murray, programme manager, UK IBD programme Ms Aimee Protheroe, programme development manager, UK IBD disease programme Dr Kevin Stewart, clinical director, CEEU
Royal Pharmaceutical Society of Great Britain Ms Anja St Clair-Jones, lead pharmacist – surgery and digestive diseases, Royal Sussex County Hospital, Brighton
95 © Healthcare Quality Improvement Partnership 2015
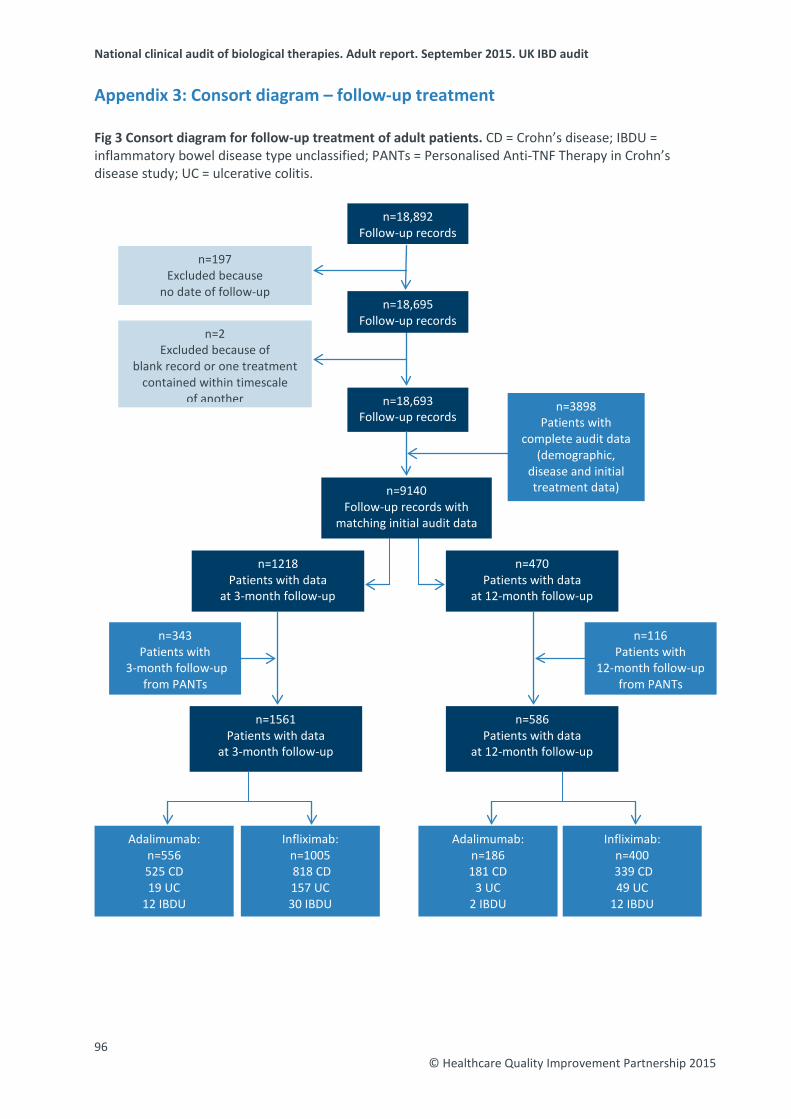
National clinical audit of biological therapies. Adult report. September 2015. UK IBD audit
Appendix 3: Consort diagram – follow-up treatment Fig 3 Consort diagram for follow-up treatment of adult patients. CD = Crohn’s disease; IBDU = inflammatory bowel disease type unclassified; PANTs = Personalised Anti-TNF Therapy in Crohn’s disease study; UC = ulcerative colitis.
n=470 Patients with data
at 12-month follow-up
n=3898 Patients with
complete audit data (demographic,
disease and initial treatment data) n=9140
Follow-up records with matching initial audit data
n=18,892 Follow-up records
n=18,693 Follow-up records
n=197 Excluded because
no date of follow-up
n=2 Excluded because of
blank record or one treatment contained within timescale
of another
n=1218 Patients with data
at 3-month follow-up
n=586 Patients with data
at 12-month follow-up
n=116 Patients with
12-month follow-up from PANTs
n=1561 Patients with data
at 3-month follow-up
n=343 Patients with
3-month follow-up from PANTs
Adalimumab: n=186 181 CD
3 UC 2 IBDU
Infliximab: n=400
339 CD 49 UC
12 IBDU
Adalimumab: n=556 525 CD 19 UC
12 IBDU
Infliximab: n=1005 818 CD 157 UC 30 IBDU
n=18,695 Follow-up records
96 © Healthcare Quality Improvement Partnership 2015

National clinical audit of biological therapies. Adult report. September 2015. UK IBD audit
References 1 IBD Standards Group, 2013. Standards for the healthcare of people who have inflammatory bowel
disease, IBD standards, 2013 update. www.ibdstandards.org.uk [Accessed 17 July 2015]. 2 National Institute for Health and Care Excellence, 2011. Technology appraisal 187: Infliximab
(review) and adalimumab for the treatment of Crohn’s disease. www.nice.org.uk/guidance/TA187 [Accessed 17 July 2015].
3 National Institute for Health and Care Excellence, 2011. Technology appraisal 329: Infliximab, adalimumab and golimumab for treating moderately to severely active ulcerative colitis after the failure of conventional therapy (including a review of TA140 and TA262). www.nice.org.uk/guidance/TA329 [Accessed 17 July 2015].
4 National Institute for Health and Care Excellence, 2015. Quality standard 81: Inflammatory bowel disease. www.nice.org.uk/guidance/QS81 [Accessed 17 July 2015].
5 Personalised Anti-TNF Therapy in Crohn’s disease study (PANTs). www.pantsdb.co.uk [Accessed 17 July 2015].
6 Royal College of Physicians, 2014. National clinical audit of biological therapies. UK IBD audit. Adult report. www.rcplondon.ac.uk/sites/default/files/national_clinical_audit_report_of_biological _therapies_-_adult_report_sep_2014_web.pdf [Accessed 1 September 2015].
7 Satsangi J, Silverberg MS, Vermeire S, Colombel JF. The Montreal classification of inflammatory bowel disease: controversies, consensus, and implications. Gut. 2006;55:749–53
8 Royal College of Physicians, 2014. National audit of inflammatory bowel disease (IBD) service provision. Adult report. www.rcplondon.ac.uk/sites/default/files/national_ibd_organisational _audit_adult_report_final_web.pdf [Accessed 1 September 2015].
9 EuroQol. EQ-5D™ is a standardised instrument for use as a measure of health outcome. www.euroqol.org [Accessed 17 July 2015].
10 Alrubaiy L, Cheung WY, Dodds F, Hutchings HA, Russell IT et al. Development of a short questionnaire to assess the quality of life in Crohn’s disease and ulcerative colitis. J Crohns Colitis 2015;9:66–76.
11 Molodecky NA, Soon IS, Rabi DM et al. Increasing incidence and prevalence of the inflammatory bowel diseases with time, based on systematic review. Gastroenterology 2012;142:46–54.
12 National Institute for Health and Care Excellence, 2008. Technology appraisal 163: Infliximab for acute exacerbations of ulcerative colitis. www.nice.org.uk/guidance/TA163 [Accessed 17 July 2015].
13 Royal College of Physicians, 2011. UK inflammatory bowel disease audit biologics audit system and hosted server security details. www.rcplondon.ac.uk/sites/default/files/biologics_audit_system_and_hosted_server_security_information.pdf [Accessed 1 September 2015].
14 Health and Social Care Information Centre, 2010. Securing web infrastructure and supporting services: good practice guide. http://systems.hscic.gov.uk/infogov/security/infrasec/gpg/ Securing-Web.pdf [Accessed 1 September 2015].
15 König HH, Ulshöfer A, Gregor M et al. Eur J Gastroenterol Hepatol 2002;14:1205–15.
97 © Healthcare Quality Improvement Partnership 2015

Royal College of Physicians 11 St Andrews Place Regent’s Park London NW1 4LE
Inflammatory bowel disease programme: Clinical Effectiveness and Evaluation Unit Tel: +44 20 3075 1565 / 1566 Email: [email protected]
www.rcplondon.ac.uk/ibd