uk national energy and climate plan (necp)...continuous trading in the intra- day, day-ahead,...
TRANSCRIPT

January 2019
THE UK’S DRAFT INTEGRATED NATIONAL ENERGY AND CLIMATE PLAN (NECP)

© Crown copyright 2019
This publication is licensed under the terms of the Open Government Licence v3.0 except where otherwise stated. To view this licence, visit nationalarchives.gov.uk/doc/open-government-licence/version/3 or write to the Information Policy Team, The National Archives, Kew, London TW9 4DU, or email: [email protected].
Where we have identified any third-party copyright information you will need to obtain permission from the copyright holders concerned.
Any enquiries regarding this publication should be sent to us at: [email protected]

3
Contents 1. OVERVIEW AND PROCESS FOR ESTABLISHING THE PLAN _____________________ 5
1.1 Executive Summary ____________________________________________________ 5
1.2 Overview of current policy situation _______________________________________ 12
1.3 Consultations and involvement of national and EU entities and their outcome _______ 14
1.4 Regional cooperation in preparing the plan _________________________________ 18
2. NATIONAL OBJECTIVES AND TARGETS ____________________________________ 20
2.1. Dimension decarbonisation _____________________________________________ 20
2.2 Dimension energy efficiency _____________________________________________ 27
2.3 Dimension energy security ______________________________________________ 32
2.4 Dimension internal energy market ________________________________________ 37
2.5 Dimension research, innovation and competitiveness _________________________ 44
3. POLICIES AND MEASURES _______________________________________________ 51
3.1 Dimension Decarbonisation _____________________________________________ 51
3.2 Dimension energy efficiency _____________________________________________ 75
3.3 Dimension energy security ______________________________________________ 78
3.4 Dimension internal energy market ________________________________________ 79
3.5 Dimension research, innovation and competitiveness _________________________ 84
SECTION B: ANALYTICAL BASIS ___________________________________________ 92
4. CURRENT SITUATION AND PROJECTIONS WITH EXISTING POLICIES AND MEASURES ______________________________________________________________ 92
4.1 Projected evolution of main exogenous factors influencing energy system and GHG emission developments ___________________________________________________ 92
4.2 Dimension Decarbonisation _____________________________________________ 97
4.3 Dimension Energy efficiency ___________________________________________ 111
4.4 Dimension energy security _____________________________________________ 116
4.5 Dimension internal energy market _______________________________________ 122
5. IMPACT ASSESSMENT OF PLANNED POLICIES AND MEASURES ______________ 129

The UK’s draft National Energy and Climate Plan (NECP)
4
On the 29 March 2019, the UK will leave the European Union and begin a new chapter in its history. As part of this, the UK has set out in its White Paper our proposals for an ambitious economic relationship with the European Union along with a security partnership.
On energy, the UK is seeking cooperation with the EU to support the delivery of cost efficient, clean and secure supplies of electricity and gas, based on competitive markets and non-discriminatory access to networks. This includes a framework to facilitate technical cooperation between electricity and gas network organisations and agreement on mechanisms to ensure efficient trade over the interconnectors over different timeframes.
On climate, the UK recognises the shared interest in global action on climate change and the mutual benefits of a broad agreement on climate change cooperation. The UK’s world leading climate ambitions and our high standards set out in domestic law are more stretching than our current obligations under EU law and will be maintained after we leave the EU.

The UK’s draft National Energy and Climate Plan (NECP)
5
1. OVERVIEW AND PROCESS FOR ESTABLISHING THE PLAN
1.1 Executive Summary
i Political, economic, environmental, and social context of the plan
ii Strategy relating to the five dimensions of the Energy Union
This section addresses 1.1(i) and (ii).
The UK was one of the first countries to recognise and act on the economic and security threats of climate change and has been among the most successful countries in the developed world at growing its economy while reducing emissions. Since 1990, the UK has cut emissions by over 40% whilst growing the economy by over two-thirds (see Figure 1)1.
Figure 1: GDP and emissions for the UK and G72
Internationally, the UK together with the EU played a central role in securing the United Nations 2015 Paris Agreement. The UK is fully committed to working with other countries to achieve the Paris Agreement goals. The UK is one of the largest contributors of international climate finance, having committed to spending £5.8 billion on this between 2016 and 20213. Additionally, the UK is promoting global alliances to encourage clean growth, such as the Powering Past Coal Alliance, to reduce emissions from the most polluting fuel.
1 UK Government Response to Committee on Climate Change, https://www.gov.uk/government/publications/committee-on-climate-changes-2018-progress-report-government-response 2 UK Government Response to Committee on Climate Change, https://www.gov.uk/government/publications/committee-on-climate-changes-2018-progress-report-government-response 3 International Climate Finance, UK Government, https://www.gov.uk/guidance/international-climate-finance

The UK’s draft National Energy and Climate Plan (NECP)
6
The Climate Change Act
The Climate Change Act 2008 set in legislation the UK's approach to tackling and responding to climate change. It introduced the UK’s long-term legally binding 2050 target to reduce greenhouse gas emissions by at least 80% relative to 1990 levels. It also introduced ‘carbon budgets’ which cap emissions over successive 5-year periods and must be set 12 years in advance. The Climate Change Act also requires the UK to produce a UK Climate Change Risk Assessment (CCRA) every five years. The CCRA assesses current and future risks to and opportunities for the UK from climate change. In addition, the Climate Change Act requires the UK Government to produce a National Adaptation Programme (NAP) to respond to the risk assessment. Finally, the Climate Change Act gives powers to the UK Government to require certain organisations to report on how they are adapting to climate change through the Adaptation Reporting Power.
Request for advice on UK climate targets
The UK is committed to maintaining a robust climate framework that takes into account evolving scientific knowledge on climate change. Following the publication of the Intergovernmental Panel on Climate Change’s (IPPC) special report on global warming of 1.5°C, the UK Government asked our independent experts, the Committee on Climate Change (CCC), for their advice on the implications of the Paris Agreement for the UK’s long-term emissions reduction targets, including on setting a net zero target4. We have requested advice on:
• setting a date for achieving net zero greenhouse gas emissions across the economy
• whether we need to raise our 2050 target of cutting emissions by at least 80% relative to 1990 levels to meet international climate targets set out in the Paris Agreement
• how emissions reductions might be achieved across the economy
• the expected costs and benefits in comparison to current targets
We expect to receive the CCC’s advice in Spring 2019, and we will consider their advice carefully when it is received.
The Clean Growth Strategy and Clean Growth Grand Challenge
In October 2017, the UK Government published its Clean Growth Strategy (CGS) setting out ambitious policies and proposals, through to 2032 and beyond, to reduce emissions across the economy and promote clean growth.
In November 2017 the UK published its modern Industrial Strategy, which includes a Clean Growth Grand Challenge. The Grand Challenge aims to put the UK at the forefront of industries of the future, by maximising the advantages for UK industry from the global shift to low carbon.
4 UK climate targets: request for advice from the Committee on Climate Change, October 2018,
https://www.gov.uk/government/publications/uk-climate-targets-request-for-advice-from-the-committee-on-climate-change

The UK’s draft National Energy and Climate Plan (NECP)
7
25 Year Environment Plan
Building on the proposals set out in the CGS, the UK outlined its plans to improve the environment in the 25 Year Environment Plan. The 25 Year Environment Plan was published in January 2018 and sets out the UK’s approach to deliver on our ambition to leave our environment in a better state than we inherited, and to fully seize the opportunities of clean growth.
The Second National Adaptation Programme (NAP) and the third strategy for Adaptation Reporting Power (ARP)
The UK Government works in climate adaptation on a five yearly cycle, which includes the Climate Change Risk Assessment (CCRA), followed by a National Adaptation Programme (NAP), setting out actions to address the risks identified in the CCRA5. The second NAP was published in July 2018 and addresses the key risks highlighted in the second CCRA, published in January 2017 and was developed working with and drawing on the 25 Year Environment Plan. It presents a set of actions in a broad range of areas: natural environment, infrastructure, people and built environment, business and industry, and local government.
The NAP is primarily for England but also covers reserved and non-devolved matters. Devolved administrations lead their own adaptation programmes.
The Adaptation Reporting Power helps ensure that ‘persons or bodies with a function of a public nature’ and ‘statutory undertakers’ (reporting organisations) are taking actions to adapt to climate change by reporting on how they are addressing current and future climate impacts. The adaptation reporting process has been through two cycles so far. In 2009 the statutory power was used and organisations were mandated to report. In the second cycle of adaptation reporting in 2013, the UK Government chose a voluntary, light touch and flexible approach to reporting. Ministers decided to continue with a voluntary, sector-focused approach. The reporting window for the third ARP cycle will open in 2019 and close at the end of 2021. These reports also provide insight into the resilience of key sections of the country’s infrastructure. Gas and electricity companies complete ARP reports for the sector.
Strategies and legislation in Northern Ireland, Scotland and Wales
Energy policy is mainly devolved to Northern Ireland and partly devolved to Wales and Scotland. Climate change policy is devolved to Wales, Scotland and Northern Ireland, although the UK Government retains control over many energy policy areas and also some other important policy areas which deliver emissions reductions.
Northern Ireland In Northern Ireland energy policy and the independent regulation of energy companies are devolved matters. Northern Ireland’s current energy strategy is set out in the Strategic Energy Framework (SEF) for the period 2010-2020. Northern Ireland’s future energy strategy is likely to concentrate on a more consumer-led decentralised energy system and decarbonisation in areas such as electricity, heat and transport. The Department for Economy NI is currently preparing a public engagement exercise to help shape proposals for a new energy strategy.
5 Climate change: a second national adaptation programme (2018 to 2023), July 2018, https://www.gov.uk/government/publications/climate-change-second-national-adaptation-programme-2018-to-2023

The UK’s draft National Energy and Climate Plan (NECP)
8
The Northern Ireland Authority for Utility Regulation (NIAUR) is responsible for regulating the electricity, gas, water and sewerage industries in Northern Ireland.
Northern Ireland has operated a single wholesale electricity market called the Single Electricity Market (SEM) with the Republic of Ireland since November 2007. The SEM has been undergoing extensive redesign to comply with the EU Target Model for the harmonisation of arrangements for trading electricity across Member States. The new arrangements are being progressed under the Integrated Single Electricity Market (I-SEM) programme. Reforms to the SEM went live on 1 October 2018. They are designed to introduce efficiencies of interconnector flows, encourage new investment in the market, apply downward pressure on prices, and create enhanced trading opportunities and options through the introduction of continuous trading in the intra-day, day-ahead, forwards, and balancing timeframes. The first auction took place at the end of 2017; further auctions are taking place later this year and in March 2019.
Scotland The Climate Change (Scotland) Act 2009 requires Scottish Ministers to reduce emissions in Scotland by at least 80% by 2050, with an interim target of 42% by 2020 and annual targets for each year to 2050.
A new Climate Change Bill6 was introduced to the Scottish Parliament in May 2018, with increased targets in response to the UN Paris Agreement. The Bill increases Scotland’s 2050 target to a 90% reduction in emissions of all greenhouse gases, which means net-zero emissions of carbon dioxide. In other words, the Bill means that Scotland would be carbon neutral by 2050.
The Climate Change Plan7 published in February 2018 sets out the Scottish Government’s comprehensive package of policies and proposals for meeting emissions reduction targets over the period to 2018 – 2032. The first annual report monitoring progress towards the Plan was published in October 20188.
The Scottish Government also published an Energy Strategy9 in December 2017 which sets out a vision for the future of energy in Scotland to 2050. The Energy Strategy is fully consistent with the aims of the Climate Change Plan, taking a wider view of the long-term transformational change which will be required in the energy sector. Together the Energy Strategy and the Climate Change Plan provide the strategic framework for Scotland’s transition to a low carbon economy – reducing greenhouse gas emissions whilst maximising the social and economic opportunities. The framework covers reserved areas as well as devolved, focusing action on those areas which the Scottish Government can directly affect.
Wales The Environment (Wales) Act 201610 requires Welsh Ministers to reduce emissions in Wales by at least 80% by 2050. This Act also requires Welsh Ministers to set interim emissions
6 Scottish Government Climate Change Bill, https://www.gov.scot/policies/climate-change/climate-change-bill/ 7 Climate Change Plan: third report on proposals and policies 2018-2032, published 2018, https://www.gov.scot/publications/scottish-governments-climate-change-plan-third-report-proposals-policies-2018/ 8 Scottish Government Climate Change Plan: monitoring report 2018, https://www.gov.scot/binaries/content/documents/govscot/publications/report/2018/10/climate-change-plan-monitoring-report-2018/documents/00542587-pdf/00542587-pdf/govscot%3Adocument 9 Scottish Energy Strategy: The Future of Energy in Scotland, 2017, https://www2.gov.scot/Resource/0052/00529523.pdf 10 Environment (Wales) Act 2016, https://gov.wales/topics/environmentcountryside/consmanagement/natural-resources-management/environment-act/?Lang=en&skip=1&lang=en
The UK’s draft National Energy and Climate Plan (NECP)
9
reduction targets for the years 2020, 2030 and 2040, and establish a system of carbon budgeting that together create an emissions reduction pathway to the 2050 target.
Since the Environment (Wales) Act was passed, the Welsh Government has focused on establishing a regulatory and policy framework to meet the statutory commitment, based on significant stakeholder engagement and advice from the Committee on Climate Change. The National Assembly for Wales will be asked to approve the interim targets and first two carbon budgets in December 2018. Following consultation, the Welsh Government will publish its plan for achieving the first carbon budget in March 2019.
Five dimensions of the Energy Union
The UK’s ambitious energy and climate legislation and strategies support the five dimensions of the Energy Union.
Energy security The UK is committed to ensuring there are secure supplies for consumers, regardless of the energy mix, and the CGS sets out actions to enhance energy security by delivering a more diverse and reliable energy mix. The UK is supporting smarter, flexible networks thereby enabling the integration of clean generation.
Energy efficiency To meet the UK’s 2050 climate change target (to reduce emissions by at least 80% by 2050, compared to 1990 levels), emissions from buildings will need to be near zero, coupled with action on industrial processes. This requires improving energy efficiency and energy management, and decarbonising nearly all heating and cooling of buildings. To achieve this, the UK is taking a range of actions including addressing barriers to energy efficiency and low carbon investment, such as supporting organisations to access finance.
The CGS provides a framework for driving UK policy on energy efficiency. Some recent policies and measures on energy efficiency that have already been implemented include commitments to fund energy efficiency improvements in the public sector, industry, business and homes – for example, through the Energy Company Obligation (ECO).
Northern Ireland contributes to the UK’s energy efficiency targets with the Northern Ireland Sustainable Energy Programme (NISEP) delivering up to 200GWh per year of energy savings as required by Article 7 of the Energy Efficiency Directive 11. Northern Ireland is currently developing a Northern Ireland energy efficiency action plan as part of a wider Energy Strategy, which aims to ensure co-ordinated and effective delivery of energy efficiency policies and programmes across Northern Ireland.
In Scotland, the Energy Efficient Scotland Routemap and Transition Programme was launched in May 201812. This ambitious 20-year programme contains a set of actions to make Scotland’s buildings near zero carbon wherever feasible by 2040 and to do so in a way that is socially and economically sustainable. The Programme will see around £10-12 billion of public and private sector investment in energy efficiency and heat decarbonisation over the 20-year period generating economic opportunity across the whole of Scotland. Energy Efficient Scotland has two main objectives: to remove poor energy efficiency as a driver for fuel poverty
11 UK National Energy Efficiency Action Plan 2014, https://www.gov.uk/government/publications/the-uks-national-energy-efficiency-action-plan-and-building-renovation-strategy 12 Energy Efficient Scotland Route Map, May 2018, https://www.gov.scot/publications/energy-efficient-scotland-route-map/pages/1/

The UK’s draft National Energy and Climate Plan (NECP)
10
and reduce greenhouse gas emissions through more energy efficient buildings and decarbonising Scotland’s heat supply.
In Wales, the Welsh Government has invested more than £240 million since 2011 to improve the energy efficiency of more than 45,000 homes of those on low incomes or living in the most disadvantaged areas of Wales. The Welsh Government is investing a further £104 million in the Warm Homes programme for the period 2017-2021, improving up to 25,000 homes and leveraging up to £24 million of EU funding13.
Decarbonisation Through the Climate Change Act, the UK has established in law the first five carbon budgets covering the period from 2008-2032, with the sixth carbon budget due to be set in 2021. The UK has outperformed the target emissions reduction of its first carbon budget (2008 to 2012) and is projected to outperform against the second and third budgets (2013 to 2022). The CGS sets out ambitious policies across all sectors of the economy to deliver the fourth and fifth carbon budgets (covering the periods 2023-2027 and 2028-2032).
Scotland has met its annual emissions reduction targets for each of the three years (2014, 2015 and 2016). Actual emissions from Scotland have been reduced by almost half (49%) between the 1990 baseline and 201614. Emissions in Wales have been reduced by 14% in the same period, with fluctuation throughout the time series15.
Internal energy market The UK Government recognises a range of benefits that interconnection can provide and strongly supports greater electricity trading with our European partners. The electricity system in Great Britain is currently connected to north-west Europe via 3GW of interconnector capacity. 1GW of interconnection also links GB with the Single Electricity Market on the island of Ireland. Further interconnection projects are currently under construction (4.4GW) or seeking regulatory approval (4GW) and, as set out in our CGS, project assessments indicate the potential for a further 9.5GW interconnection beyond this in the early to mid-2020s. This is expected to increase our level of interconnection by 2030.
The UK continues to be a lead actor in the transformation of energy markets and has strongly supported the EU’s direction in this area, most recently during the Clean Energy Package negotiations, to deliver open, transparent and competitive markets. We continue to support developing liberalised markets and successfully using competition to drive down energy prices. We are embracing the opportunity to increase renewable generation, decarbonise the economy and maintain affordability. We are implementing rules for a well-functioning internal energy market and our recent Electricity Market Reform introduced measures on, for example, Contracts for Difference and wholesale market liquidity. The CGS outlines the UK’s commitment to move towards a more dynamic market, empowering the consumer and realising the potential of renewables, small scale generation, greater flexibility, smart metering and the digital revolution.
Research, innovation and competitiveness The UK’s early action on clean growth means that it has nurtured a broad range of low carbon industries, including some sectors in which we have world leading positions. This success is built upon wider strengths – the UK’s scientific research base, expertise in high-value service
13 Warm Home Programme, Welsh Government website, https://gov.wales/topics/environmentcountryside/energy/efficiency/warm-homes 14 Scottish greenhouse gas emissions 2016, June 2018 https://www.gov.scot/publications/scottish-greenhouse-gas-emissions-2016/ 15 Greenhouse Gas Inventories for England, Scotland, Wales & Northern Ireland: 1990-2016, http://naei.beis.gov.uk/reports/reports?section_id=4

The UK’s draft National Energy and Climate Plan (NECP)
11
and financial industries, and a regulatory framework that provides long-term direction and support for innovation and excellence in the design and manufacturing of leading-edge technology.
This progress has been aided by the falling costs of many low carbon technologies: renewable power sources like solar and wind are comparable in cost to coal and gas in many countries; energy efficient light bulbs are over 80% cheaper today than in 2010; and the cost of electric vehicle battery packs has tumbled by over 70% in this time16. As a result of this technological innovation, new high value jobs, industries and companies have been created. This is driving a new, technologically innovative, high growth and high value ‘low carbon’ sector of the UK economy.
Due to the UK’s world leading expertise in technologies such as offshore wind, power electronics for low carbon vehicles and electric motors, and global leadership in green finance, we are successfully exporting goods and services around the world. For example, in 2017, 1 in every 8 battery electric cars driven in Europe was built in the UK17. This progress means there are nearly 400,000 jobs in low carbon businesses and their supply chains, employing people in locations across the country18.
Capturing part of the global opportunity while continuing to drive down carbon emissions from our own activities provides a huge economic opportunity for the UK. By one estimate, the UK low carbon economy could grow by an estimated 11% per year between 2015 and 2030 – 4 times faster than the rest of the economy – and could deliver between £60 billion and £170 billion of export sales of goods and services by 203019. This means that clean growth can play a central part in our Industrial Strategy – building on our strengths to drive economic growth and boost earning power across the country.
The Department for Business, Energy and Industrial Strategy (BEIS) holds the responsibility for strategic oversight of climate and energy science and innovation across UK Government, promoting and protecting the UK Government’s policy interests. Its Science and Innovation for Climate and Energy Directorate (SICE) provides the science and engineering evidence and data to support, constructively challenge and enable development and delivery of national energy policy.
Wider prioritisation of activity, research and innovation spending on energy is co-ordinated through the UK Government’s Energy Innovation Board (EIB), with SICE providing the secretariat for this. There is currently no separate energy research and innovation strategy, prioritisation decisions are informed by the Industrial Strategy and the CGS.
iii Overview table with key objectives, policies and measures of the plan
Section 3.1.1 contains Figure 8, which sets out key policies and measures.
16 Clean Growth Strategy, 2017: https://www.gov.uk/government/publications/clean-growth-strategy 17 The Road to zero 2018, https://www.gov.uk/government/publications/reducing-emissions-from-road-transport-road-to-zero-strategy 18 ONS (2016) UK Environmental Accounts: Low Carbon and Renewable Energy Economy Survey, Final estimates: 2016 https://www.ons.gov.uk/economy/environmentalaccounts/bulletins/finalestimates/2016 19 Ricardo Energy and Environment for the Committee on Climate Change (2017) UK business opportunities of moving to a low-carbon economy (supporting data tables) https://www.theccc.org.uk/publication/uk-energy-prices-and-bills-2017-report-supporting-research/

The UK’s draft National Energy and Climate Plan (NECP)
12
1.2 Overview of current policy situation
i National and Union energy system and policy context of the national plan (84)
ii Current energy and climate policies and measures relating to the five dimensions of the Energy Union
This section addresses 1.2(i) and (ii). The CGS sets out the UK’s proposals to deliver increased economic growth and decreased emissions, consistent with the five dimensions of the Energy Union:
• Accelerating clean growth
• Improving business and industry efficiency
• Improving UK homes
• Accelerating the shift to low carbon transport
• Delivering clean, smart, flexible power
• Enhancing the benefits and value of our natural resources
• Leading in the public sector
Section 3.1.1 contains Figure 8, which sets out key policies and measures.
The Climate Change Plan sets out the Scottish Government’s policies and proposals to reduce emissions over the period to 2032 in line with the 80% reduction target in the 2009 Act.
The Welsh Government’s Low Carbon Delivery Plan is due to be published in March 2019 and will set out policies and proposals for meeting the first Welsh carbon budget (2016-2020).
iii Key issues of cross-border relevance
The UK is part of the wider North Seas region, which has a large renewable energy potential. More information on this cooperation is set out in section 1.4(ii).
Another forum for regional cooperation is the Energy Work Sector under the British Irish Council (BIC). This provides opportunities for the governments of the UK, Ireland, Scotland, Wales, Isle of Man, Jersey and Guernsey to share information and work together on energy issues of common interest.
Northern Ireland and Ireland have a shared wholesale single electricity market (SEM). The SEM has been undergoing extensive redesign. The new arrangements are being progressed under the Integrated Single Electricity Market (I-SEM) programme. Reforms to the SEM went live on 1 October 2018. These introduce new and more efficient wholesale trading arrangements, closer integration with other electricity markets and a more competitive capacity mechanism.
iv Administrative structure of implementing national energy and climate policies
Under the 2008 Climate Change Act, the UK is legally required to reduce greenhouse gas emissions by at least 80% by 2050 on 1990 levels. To ensure the UK is on a pathway to

The UK’s draft National Energy and Climate Plan (NECP)
13
achieving the 2050 target, the UK Government is obliged to set legally binding five-year caps on emissions twelve years in advance (Carbon Budgets). Additionally, the UK is required to publish a report setting out the policies and proposals to meet budgets after setting each carbon budget. See Figure 2 for the UK’s actual and projected performance against the carbon budgets.
Figure 2: Performance against carbon budgets, Mt20
Carbon budget: 1 (2008-12)
2 (2013-17)
3 (2018-22)
4 (2023-27)
5 (2028-32)
Actual Projection Projection Projection Projection
Carbon Budget level: cumulative emissions
3,018 2,782 2,544 1,950 1,725
Average required reduction vs 1990 emissions, %
-25% -31% -37% -51% -57%
2017 Existing policies
Projected emissions, Mt
2,982 2,657 2,401 2,044 1,921
Existing and new policies and proposals21
Projected emissions, Mt
2,982 2,657 2,401 2,014 1,841
Result vs. Budget, emissions, Mt
-36 -125 -143 64 116
Result vs. Budget, %
-1.2% -4.5% -5.6% 3.3% 6.7%
The Climate Change Act also established the Committee on Climate Change (CCC), an independent statutory body, to advise the UK Government and the Devolved Administrations on setting and meeting carbon budgets and other related matters.
The Scottish Parliament passed the Climate Change (Scotland) Act in 2009, establishing Scotland’s 2050 target and the supporting framework of interim and annual targets. The 20 Updated Energy and Emissions Projections, 2017, https://www.gov.uk/government/uploads/system/uploads/attachment_data/file/671187/Updated_energy_and_emissions_projections_2017.pdf 21 Includes emissions reduction estimates of a subset of new early stage policies and proposals from the CGS showing an additional potential reduction of up to 30Mt and 80Mt over the fourth and fifth carbon budget periods respectively. These projections are based on the EEP reference case (central assumption).

The UK’s draft National Energy and Climate Plan (NECP)
14
Scottish Government is required to publish reports every five years setting out the policies and proposals to meet annual targets over periods of around the next fifteen years. The Climate Change (Scotland) Act also establishes Scotland specific roles for the CCC as an independent advisory body. A new Climate Change Bill was introduced to the Scottish Parliament in May 2018, with increased targets in response to the UN Paris Agreement. The Bill increases Scotland’s 2050 target to a 90% reduction in emissions of all greenhouse gases, which means net-zero emissions of carbon dioxide and that Scotland would be carbon neutral by 2050.
1.3 Consultations and involvement of national and EU entities and their outcome
i Involvement of the national parliament
In accordance with the Climate Change Act, a carbon budget must be made by order, subject to affirmative resolution procedure22. Before laying a draft statutory instrument containing an order setting a carbon budget, the UK Government must take into account the advice of the CCC as well as any representations made by the Devolved Administrations.
A carbon budget must be set with a view to meeting the 2050 target and complying with European and international obligations of the UK. The Climate Change Act sets out a number of matters that must also be taken into account when deciding the level of a carbon budget23.
In Scotland, the Climate Change (Scotland) Act 2009, requires that Scottish Ministers set annual targets, in secondary legislation, for each year from 2010 to 2050. Scottish Ministers also take advice from the CCC on the targets before these are set.
In Wales, the Welsh Ministers must lay carbon budgets in the National Assembly for Wales. Before doing so, they must obtain and have regard to advice from the CCC when making regulations under the Environment (Wales) Act 2016, including setting carbon budgets. This Act sets out the matters Welsh Ministers must take into account when setting a carbon budget24.
Reporting to Parliament
The UK Government must lay before Parliament an Annual Statement of Emissions by 31 March in the second year following that to which it relates. It must also prepare and lay a Final Statement for each budgetary period by 31 May in the second year following the end of the period to which it relates, setting out, among other things, the final amount for the period of UK emissions, removals and net emissions of each greenhouse gas.
In June each year (and in July in the second year after the end of a budgetary period), the CCC must lay before Parliament a report setting out its views on progress against the carbon budgets and 2050 target, to which the UK Government is required to respond by October. In the second year after the end of a budgetary period the report will also set out the CCC’s views on how the UK performed on meeting the last carbon budget.
22 More information on the affirmative resolution procedure can be found at: https://www.parliament.uk/site-information/glossary/affirmative-procedure/ 23 See s10(2) of the CCA: https://www.legislation.gov.uk/ukpga/2008/27/section/10 24 Environment (Wales) Act 2016, Section 32(3): http://www.legislation.gov.uk/anaw/2016/3/section/32/enacted

The UK’s draft National Energy and Climate Plan (NECP)
15
In Scotland, Scottish Ministers must lay before the Scottish Parliament an annual report that states whether the annual target has been met. The CCC must lay before the Scottish Parliament an annual report setting out Scotland’s progress against achieving its targets and the Scottish Government provide a response to this report.
In Wales, the Welsh Government must lay a statement in the Assembly no later than two years after the end of each budget outlining:
• Final amount of net Welsh emissions
• Number of offsets used
The Welsh Government must lay a statement in the Assembly, within two years of the interim target year outlining:
• Final amount of net Welsh emissions for the target year
• Number of offsets used for the year
• Why the target has been met or missed
ii Involvement of local and regional authorities
The BEIS Local Energy Programme, which was announced in the CGS, is designed to maximise local contributions to clean growth. The programme works with Local Enterprise Partnerships, local authorities and communities to drive development of clean growth as a core plank of Local Industrial Strategies and, critically, support local clean growth investment.
The Scottish Government has an ambition to achieve 1GW of community and locally owned renewables by 2020, and 2GW by 2030, as well as an ambition to spread the economic benefits of commercial renewables schemes through shared ownership with communities25. As of June 2017 there was an estimated minimum of 666 MW of community and locally owned renewable energy capacity operating in Scotland. Local government in Scotland is already playing a key role in delivering energy efficiency programmes, primarily for the domestic sector. The Scottish Government sees a stronger role for local government in the future. There has also been a consultation this year on the possible introduction of a statutory duty on local authorities to develop Local Heat and Energy Efficiency Strategies (LHEES), to be delivered in consultation with members of the local community and in collaboration with community planning partners. This would provide the link between the delivery of long-term targets and national policies, and the delivery of energy efficiency and heat decarbonisation on the ground. A position paper on Local Energy Systems in Scotland is being developed, further to a commitment made in the Energy Strategy.
The Welsh Government is supporting local authorities in the development of energy plans. There are transformative opportunities in developing local or regional energy plans, driven by network and/or national regional energy data, which will help decision-making and enable us to meet decarbonisation objectives in Wales. The Welsh Government has committed to providing support to enable regional strategic energy plans to be developed, as part of the Cardiff City Region and the Mid Wales and North Wales Growth Deals work. This will build on earlier work undertaken in the Swansea Bay City Region by the Institute of Welsh Affairs and Regen26.
25 Source: Renewable and low carbon energy, Scottish Government website, https://www.gov.scot/policies/renewable-and-low-carbon-energy/local-and-small-scale-renewables/ 26 Swansea Bay City Region: A Renewable Energy Future, April 2018, https://www.iwa.wales/wp-content/uploads/2018/04/Regen-SBCR-A-Renewable-Future-FINAL.pdf
The UK’s draft National Energy and Climate Plan (NECP)
16
Using the learning from this work, the Welsh Government will explore the potential for developing more locally-owned energy plans, which could lead to pipelines of energy projects and provide more clarity on the energy infrastructure required for a low carbon energy system in Wales.
The Welsh Government has set a target of 1GW of locally-owned renewable electricity capacity by 2030 and an expectation that new renewable energy projects from 2020 have an element of local ownership. At the end of 2017 there was 750MW of renewable energy in local ownership in Wales. 529MW of this capacity is renewable electricity and 221MW is renewable heat. In total there are over 63,000 locally-owned renewable energy projects in Wales27.
iii Consultations of stakeholders, including the social partners, and engagement of civil society and the general public
The UK is committed to proper public participation and consultation and is committed to meeting its obligations under Article 7 of the Aarhus Convention, which are set out in the UK’s published Consultation Principles28.
The UK Government has conducted a number of public consultations across the five dimensions, including on the UK Industrial Strategy Green paper29. A list of stakeholder and public consultations is set out below.
In summer 2018, the Welsh Government consulted on early ideas for meeting the 2030 target across all emissions sectors30. Further policy-specific engagement and consultation will follow as appropriate.
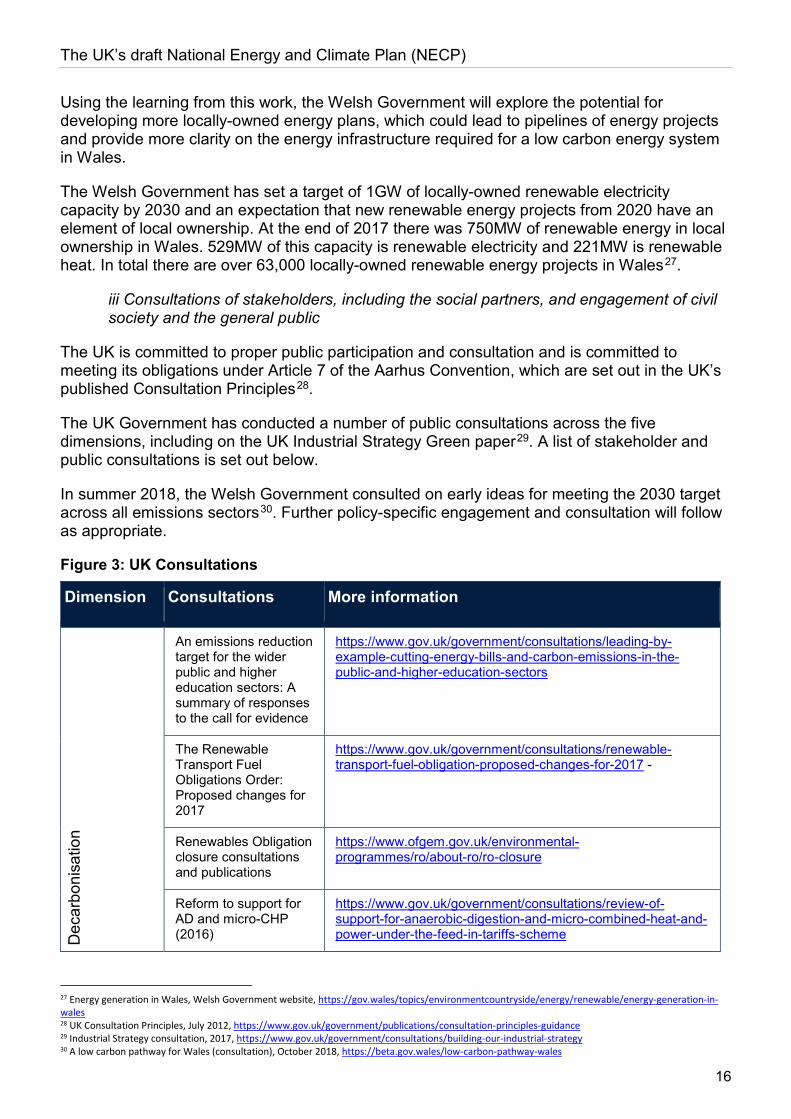
Figure 3: UK Consultations
Dimension Consultations More information
Dec
arbo
nisa
tion
An emissions reduction target for the wider public and higher education sectors: A summary of responses to the call for evidence
https://www.gov.uk/government/consultations/leading-by-example-cutting-energy-bills-and-carbon-emissions-in-the-public-and-higher-education-sectors
The Renewable Transport Fuel Obligations Order: Proposed changes for 2017
https://www.gov.uk/government/consultations/renewable-transport-fuel-obligation-proposed-changes-for-2017 -
Renewables Obligation closure consultations and publications
https://www.ofgem.gov.uk/environmental-programmes/ro/about-ro/ro-closure
Reform to support for AD and micro-CHP (2016)
https://www.gov.uk/government/consultations/review-of-support-for-anaerobic-digestion-and-micro-combined-heat-and-power-under-the-feed-in-tariffs-scheme
27 Energy generation in Wales, Welsh Government website, https://gov.wales/topics/environmentcountryside/energy/renewable/energy-generation-in-wales 28 UK Consultation Principles, July 2012, https://www.gov.uk/government/publications/consultation-principles-guidance 29 Industrial Strategy consultation, 2017, https://www.gov.uk/government/consultations/building-our-industrial-strategy 30 A low carbon pathway for Wales (consultation), October 2018, https://beta.gov.wales/low-carbon-pathway-wales

The UK’s draft National Energy and Climate Plan (NECP)
17
Feed-in-Tariffs https://www.gov.uk/government/consultations/feed-in-tariffs-scheme
Contracts for Difference publications
https://www.gov.uk/government/groups/contracts-for-difference-cfd-scheme
Ener
gy e
ffici
ency
Building a market for energy efficiency: Call for evidence
https://www.gov.uk/government/consultations/building-a-market-for-energy-efficiency-call-for-evidence
Energy Performance Certificates in buildings: Call for evidence
https://www.gov.uk/government/consultations/energy-performance-certificates-in-buildings-call-for-evidence
Call for evidence and summary of responses on the Green Deal Framework
https://www.gov.uk/government/consultations/call-for-evidence-on-the-reform-of-the-green-deal-framework
Widening eligibility for energy intensive industries for renewable cost exemption schemes
https://www.gov.uk/government/consultations/widening-eligibility-for-renewable-electricity-cost-relief-schemes
Energy Company Obligation
https://www.gov.uk/government/uploads/system/uploads/attachment_data/file/696448/ECO3_consultation.pdf
Heat Networks Investment Project
https://www.gov.uk/government/consultations/consultation-on-the-heat-networks-investment-project-hnip
Warm Home Discount https://www.gov.uk/government/uploads/system/uploads/attachment_data/file/696467/WHD_extension_consultation.pdf
Ener
gy S
ecur
ity
Capacity Market-related publications and consultations
https://www.ofgem.gov.uk/electricity/wholesale-market/market-efficiency-review-and-reform/electricity-market-reform/capacity-market-cm-rules
Capacity Market https://www.ofgem.gov.uk/electricity/wholesale-market/market-efficiency-review-and-reform/electricity-market-reform/capacity-market-cm-rules
Inte
rnal
Ene
rgy
Mar
ket Ofgem Decision on
SVT-Default Tariff Cap https://www.ofgem.gov.uk/publications-and-updates/default-tariff-cap-decision-overview
RIIO 2 framework Consultation
https://www.ofgem.gov.uk/publications-and-updates/riio-2-framework-consultation
The most recent consultation by Ofgem on the needs case for the connection to Hinkley Point C
https://www.ofgem.gov.uk/publications-and-updates/hinkley-seabank-consultation-final-needs-case-and-potential-delivery-models
Res
earc
h,
inno
vatio & Smart meter
interoperability https://www.gov.uk/government/consultations/maximising-interoperability-for-first-generation-smets1-smart-meters

The UK’s draft National Energy and Climate Plan (NECP)
18
https://www.gov.uk/government/consultations/enrolment-of-smets1-meter-cohorts-with-the-data-communications-company
The annual Green Great Britain week was introduced in 2018 and held for the first time from 15 to 19 October 2018. It has been designed to highlight the opportunities clean growth offers the UK and raise understanding of how business and the public can contribute to tackling climate change.
iv Consultations of other Member States
The UK has worked closely with other Member States that are also party to the North Seas Energy Cooperative (NSEC). Through an iterative process the NSEC has developed content for the regional cooperation sections of this plan that outline the UK’s continued cooperation with other Member States within the Cooperative. The UK has worked with other Member States on various technical and policy aspects of the draft NECP during workshop sessions at the NECP Technical Working Groups meetings.
v Iterative process with the Commission
A representative from BEIS has attended NECP Technical Working Group meetings, and has taken on board Commission advice in the development of the draft plan. BEIS has responded to all Commission surveys on a quarterly basis, answering a series of questions on the development and progress of the report.
1.4 Regional cooperation in preparing the plan
i Elements subject to joint or coordinated planning with other Member States (93)
ii Explanation of how regional cooperation is considered in the plan (94)
This covers (i) and (ii).
The UK is part of the wider North Seas region, which has a large renewable energy potential. The European Commission has estimated that offshore wind from the North Seas can cover up to 12% of the electric power consumption in the EU by 2030. Offshore wind generation and grid infrastructure projects may have cross-border effects on energy prices, security of supply and the environment, including availability of marine space as well as the pace of innovation. The North Seas countries therefore have great benefits to gain from cooperation.
The North Seas Energy Cooperation (NSEC) is a voluntary, bottom up, market-oriented, regional cooperation initiative established in 2016, which seeks to create synergies and to avoid incompatibilities between national policies and to foster joint strategies where possible and beneficial. The aim is to coordinate and facilitate further cost-effective deployment of offshore renewable energy in particular wind, ensuring a sustainable, secure and affordable energy supply in the North Seas countries through increased and better coordinated offshore wind deployment, as well as potential joint projects or cluster projects. The NSEC focuses on a step-by-step approach with the perspective of further integration and increased efficiency of wholesale electricity markets in the longer term, while contributing to a reduction of greenhouse gas emissions, lowering average wholesale price spreads and enhancing security of supply in the region.

The UK’s draft National Energy and Climate Plan (NECP)
19
The NSEC consists of 10 countries with participation from the European Commission; Belgium, the Netherlands, Luxembourg, France, Germany, UK, Ireland, Norway, Sweden and Denmark.
The support groups under the cooperation focus on the following subjects:
SG1: Maritime Spatial Planning
SG2: Development and regulation of offshore grids and other offshore infrastructure
SG3: Support framework and finance for offshore wind projects
SG4: Standards, technical rules and regulations in the offshore wind sector
In preparing this plan, the UK made use of the NSEC, in which experts in the support groups shared information and experiences on specific aspects, for example on offshore wind development.
With regard to measures, the UK benefits from the NSEC in several ways. The work of the NSEC provides a platform for the exchange of best practice regarding the design of support schemes and to exchange and work on new concepts tackling new challenges in relation to support for offshore wind. The NSEC also serves as a platform to jointly work on concepts for potential joint wind offshore projects (3.1.2), for coordinated electricity infrastructure including transmission infrastructure.

The UK’s draft National Energy and Climate Plan (NECP)
20
2. NATIONAL OBJECTIVES AND TARGETS
2.1. Dimension decarbonisation
2.1.1 Greenhouse Gas (GHG) emissions and removals
i The elements set out in Article 4(a)(1)
ii Where applicable, other national objectives and targets consistent with the Paris Agreement and the existing long-term strategies. Where applicable for the contribution to the overall Union commitment of reducing the GHG emissions, other objectives and targets, including sector targets and adaptation goals, if available
The UK’s long-term relationship with the EU on the extent of the longer-term cooperation on the Paris Agreement is a matter for the future economic partnership negotiations. The Paris Agreement on climate change entered into force on 4 November 2016. It was ratified by the UK on 18 November 2016. Parties to the Paris Agreement are required to prepare, communicate and maintain successive Nationally Determined Contributions (NDCs). As a Member State, the UK is part of the joint EU/Member State NDC for the period of 2021-2030, which commits the EU to at least 40% reduction in greenhouse gas emissions by 2030 compared to 1990 levels. The EU has adopted a legally binding domestic framework to meet its NDC commitments in both the traded sector (covered by Directive 2003/87/EC ) and the non-traded sector. The non-traded sector is covered by the following legislation.
Effort Sharing Regulation
EU Member States have binding annual greenhouse gas emission targets for 2021-2030 for those sectors of the economy that fall outside the scope of the EU ETS, such as transport, buildings, waste and agriculture. As a whole, the EU has committed to reduce emissions in these sectors by 30% by 2030 compared to 2005.
Land use, land use change and forestry (LULUCF)31
Under further EU legislation adopted in May 2018, EU Member States agreed to ensure that greenhouse gas (GHG) accounted emissions from land use, land use change and forestry (LULUCF) are offset by at least an equivalent accounted sink for the periods from 2021 to 2025 and from 2026 to 2030 individually, as specified in article 4 of the Regulation (EU) 2018/841. There are several flexible mechanisms to help Member States comply. As such the UK is required to ensure that its LULUCF emissions do not exceed its LULUCF removals for the periods from 2021 to 2025 and from 2026 to 2030 individually, as specified in article 4 of the Regulation (EU) 2018/841.
The UK Climate Change Act 2008, including Carbon Budgets
This is explained in 1.1(ii) and 1.3(i).
31 This analysis is based on reported emissions, not on accounted emissions following the regulation 2018/841

The UK’s draft National Energy and Climate Plan (NECP)
21
Devolved Climate Change Legislation
Climate change policy is devolved to Wales, Scotland and Northern Ireland, although the UK Government retains control over many policy areas that have great potential for emissions reduction.
The Environment (Wales) Act 2016 requires Welsh Ministers to reduce emissions in Wales by at least 80% in 2050. This Act also requires Welsh Ministers to set interim emissions reduction targets for the years 2020, 2030 and 2040, and establish a system of carbon budgeting that together create an emissions reduction pathway to the 2050 target.
The Climate Change (Scotland) Act 200932 requires Scottish Ministers to ensure that emissions in Scotland are reduced by at least 80% by 2050, with an interim target of 42% by 2020 and annual targets for each year to 2050. A new Climate Change Bill33 was introduced to the Scottish Parliament in May 2018, with increased targets in response to the UN Paris Agreement. The Bill increases Scotland’s 2050 target to a 90% reduction in emissions of all greenhouse gases, which means net-zero emissions of carbon dioxide. In other words, the Bill means that Scotland would be carbon neutral by 2050. The Bill also sets all targets based on actual Scottish emissions from all sectors, rather than adjusting for the operation of the EU Emissions Trading System.
2.1.2 Renewable energy
i The elements set out in point (a)(2) of Article 4
ii Estimated trajectories for the sectoral share of renewable energy in final energy consumption from 2021 to 2030 in the electricity, heating and cooling, and transport sector
iii Estimated trajectories by renewable energy technology that the Member State projects to use to achieve the overall and sectoral trajectories for renewable energy from 2021 to 2030 including expected total gross final energy consumption per technology and sector in Mtoe and total planned installed capacity (divided by new capacity and repowering) per technology and sector in MW
iv Estimated trajectories on bioenergy demand, disaggregated between heat, electricity and transport, and on biomass supply by feedstocks and origin (distinguishing between domestic production and imports). For forest biomass, an assessment of its source and impact on the LULUCF sink
Section (i), (ii), (iii) and (iv) are addressed together in this section.
The CGS sets out the UK Government’s continued support for the development and deployment of renewables. The UK’s long-term relationship with the EU on renewable energy is a matter for the future economic partnership negotiations. The Scottish Climate Change Plan34 and Scottish Energy Strategy35 place a strong emphasis on the strength and potential for growth in the Scottish renewable energy sector – setting a target of 50% of all of Scotland’s
32 Climate Change (Scotland) Act 2009, http://www.legislation.gov.uk/asp/2009/12/pdfs/asp_20090012_en.pdf 33 Climate Change (Scotland) Bill 2018, http://www.parliament.scot/S5_Bills/Climate%20Change%20(Emissions%20Reduction%20Targets)%20(Scotland)%20Bill/SPBill30S052018.pdf 34Scottish Climate Change Plan, https://www.gov.scot/publications/scottish-governments-climate-change-plan-third-report-proposals-policies-2018/ 35Scottish Energy Strategy, https://www.gov.scot/publications/scottish-energy-strategy-future-energy-scotland-9781788515276/

The UK’s draft National Energy and Climate Plan (NECP)
22
heat, transport and electricity consumption to be supplied from renewable sources. The Welsh Government has set targets for generating 70% of its electricity consumption from renewable energy by 2030, for 1GW of renewable electricity capacity in Wales to be locally owned by 2030 and for new renewable energy projects to have at least an element of local ownership by 202036.
Electricity
The UK’s low carbon policies and abundant natural resources have seen renewable electricity capacity increase by more than three times since 201037.
In 2017, renewable electricity accounted for more than a quarter (27.9%) of the UK’s electricity generation (as measured using the RED methodology)38. That year was also a record year for renewable electricity generation in Scotland, with 69% of electricity demand met by renewables39. The equivalent of 48% of electricity consumption in Wales was generated from renewable sources, up from 43% in 2016. 22% of electricity generated in Wales came from renewable sources40.
The UK already has a world-leading offshore wind sector and is well placed to benefit from further investment in renewables innovation to accelerate cost reduction.
The UK Government expects to invest around £900 million of public funds between 2015 and 2021 in research and innovation in the power sector, including around £177 million in partnership with the Research Councils and Innovate UK to further reduce the cost of renewables. Innovation opportunities are likely to arise in a number of areas, including floating offshore wind platforms and advanced solar PV technologies41.
The UK Government is working to improve the route to market for renewable technologies. The next Contracts for Difference allocation round for less established technologies such as offshore wind will open by May 2019. The Government intends to run subsequent auctions around every 2 years after this. Depending on the price achieved, these auctions will deliver up to 2GW of offshore wind each year in the 2020s42.
36 Electricity generation announcement, Welsh Government website, 2017, https://gov.wales/newsroom/environmentandcountryside/2017/170928-lesley-griffiths-high-on-ambition-for-clean-energy 37 Digest of UK Energy Statistics (DUKES) 2018, Table 6.7, https://www.gov.uk/government/statistics/digest-of-uk-energy-statistics-dukes-2018-main-report 38 DUKES Report, July 2018 https://www.gov.uk/government/statistics/digest-of-uk-energy-statistics-dukes-2018-main-report 39 Energy Statistics for Scotland Q2 Figures, September 2018, https://www2.gov.scot/Resource/0054/00541525.pdf 40 Energy generation in Wales, Welsh Government website, https://gov.wales/topics/environmentcountryside/energy/renewable/energy-generation-in-wales 41 Clean Growth Strategy, 2017, https://www.gov.uk/government/uploads/system/uploads/attachment_data/file/700496/clean-growth-strategy-correction-april-2018.pdf 42 Press release July 2018, UK Government website https://www.gov.uk/government/news/a-boost-for-north-east-innovation-to-promote-high-quality-jobs-and-growth

The UK’s draft National Energy and Climate Plan (NECP)
23
Figure 4: UK Renewable Electricity Generation in 201743
Renewable Electricity Generation in Northern Ireland
The consumption of electricity from renewable sources in Northern Ireland has risen from 3% in 200544 to 35.2% during the period April 2017 to March 201845. This is largely attributed to the success of the Northern Ireland Renewables Obligation. These installations have a capacity to generate 1,638MW of renewable electricity as of September 201846. With a further 158MW of capacity scheduled to be added to the grid within the next few months, it is envisaged that capacity will increase to almost 1,800 MW (which equates to NI’s peak winter demand), ensuring that the target set by the Northern Ireland Executive in 2010 (that the level of electricity consumed from renewable sources would reach 40% by 2020) will have been met, if not exceeded.
Heat
In 2017, 7.7% of UK energy for heating and cooling came from renewable sources47. Through the Renewable Heat Incentive (RHI), the UK Government is spending £4.5 billion between 2016 and 2021 to support innovative low carbon heat technologies in homes and businesses, such as heat pumps, biomass boilers and solar water heaters48. Beyond the RHI, our ambition is to phase out the installation of high carbon fossil fuel heating in new and existing off gas grid residential buildings during the 2020s, starting with new homes as these lend themselves more readily to other forms of low carbon heating49. The Government published a call for evidence50 in March 2018 asking for views on options to inform policy development for a Future Framework for Heat in Buildings. A response to this call for evidence will be published in due course.
43 Energy Trends Data, June 2018, https://www.gov.uk/government/collections/energy-trends#2018 44 Electricty consumption and renewable generation in Northern Ireland 2017-18, https://www.economy-ni.gov.uk/publications/electricity-consumption-and-renewable-generation-northern-ireland-april-2017-march-2018 45 Explanatory Memorandum to the Renewables Obligation Order (Northern Ireland) 2005, http://www.legislation.gov.uk/nisr/2005/38/pdfs/nisrem_20050038_en.pdf 46 https://www.uregni.gov.uk/sites/uregni/files/media-files/RGLG%20Presentation%2004-Sep-2018.pdf 47 Digest of UK Energy Statistics (DUKES) 2018, Table 6.7, https://www.gov.uk/government/statistics/renewable-sources-of-energy-chapter-6-digest-of-united-kingdom-energy-statistics-dukes 48 Non-Domestic Renewable Heat Incentive, https://assets.publishing.service.gov.uk/government/uploads/system/uploads/attachment_data/file/711966/non-domestic-rhi-further-amendments-government-response-part-2.pdf 49 Clean Growth Strategy, https://www.gov.uk/government/publications/clean-growth-strategy 50 https://www.gov.uk/government/consultations/a-future-framework-for-heat-in-buildings-call-for-evidence
The UK’s draft National Energy and Climate Plan (NECP)
24
The Northern Ireland RHI Scheme commenced in 2012, based on the RHI Scheme introduced in the rest of the UK but with differences in tariffs and tariff structures51.
In May 2018, the UK Government launched the Buildings Mission,52 the first mission under the Clean Growth Grand Challenge, which aims to at least halve the energy use of new buildings by 2030, reduce the cost of retrofitting efficiency measures in existing buildings, and to ensure homes and businesses are heated by clean energy sources. The Mission was backed by £170 million of public money through the Transforming Construction Industrial Strategy Challenge Fund53. We expect this will be matched by £250 million of private sector investment, meaning over £400 million will be invested in new construction products, technologies and techniques.
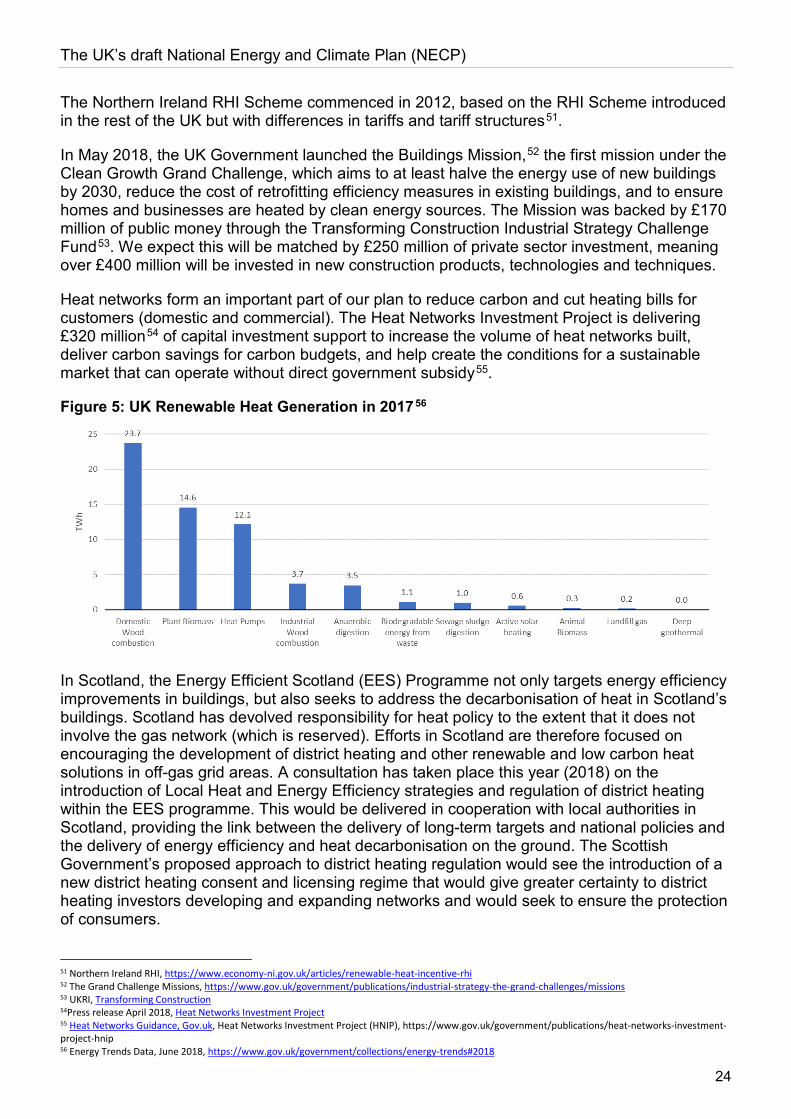
Heat networks form an important part of our plan to reduce carbon and cut heating bills for customers (domestic and commercial). The Heat Networks Investment Project is delivering £320 million54 of capital investment support to increase the volume of heat networks built, deliver carbon savings for carbon budgets, and help create the conditions for a sustainable market that can operate without direct government subsidy55.
Figure 5: UK Renewable Heat Generation in 201756
In Scotland, the Energy Efficient Scotland (EES) Programme not only targets energy efficiency improvements in buildings, but also seeks to address the decarbonisation of heat in Scotland’s buildings. Scotland has devolved responsibility for heat policy to the extent that it does not involve the gas network (which is reserved). Efforts in Scotland are therefore focused on encouraging the development of district heating and other renewable and low carbon heat solutions in off-gas grid areas. A consultation has taken place this year (2018) on the introduction of Local Heat and Energy Efficiency strategies and regulation of district heating within the EES programme. This would be delivered in cooperation with local authorities in Scotland, providing the link between the delivery of long-term targets and national policies and the delivery of energy efficiency and heat decarbonisation on the ground. The Scottish Government’s proposed approach to district heating regulation would see the introduction of a new district heating consent and licensing regime that would give greater certainty to district heating investors developing and expanding networks and would seek to ensure the protection of consumers.
51 Northern Ireland RHI, https://www.economy-ni.gov.uk/articles/renewable-heat-incentive-rhi 52 The Grand Challenge Missions, https://www.gov.uk/government/publications/industrial-strategy-the-grand-challenges/missions 53 UKRI, Transforming Construction 54Press release April 2018, Heat Networks Investment Project 55 Heat Networks Guidance, Gov.uk, Heat Networks Investment Project (HNIP), https://www.gov.uk/government/publications/heat-networks-investment-project-hnip 56 Energy Trends Data, June 2018, https://www.gov.uk/government/collections/energy-trends#2018
The UK’s draft National Energy and Climate Plan (NECP)
25
Both fuel poverty and social housing standards are devolved to Wales and these powers have been used to improve the efficiency of heating in private and social housing stock respectively. Building Regulations are also devolved to Wales, and the Welsh Government is currently scoping out the topics that will be in its review of building regulations, with public consultation expected to take place in spring 2019.
The Welsh Government’s work on energy planning at the regional and local level will provide stronger insights into the opportunities and priorities for heat in Wales. The Welsh Government is conducting a review of the available evidence on heat to support the development of heat policy for Wales. Wales is already hosting a number of pilots to help develop knowledge in this area, and is well placed to derive benefit from developing skills and economic opportunities in relation to heat.
Transport
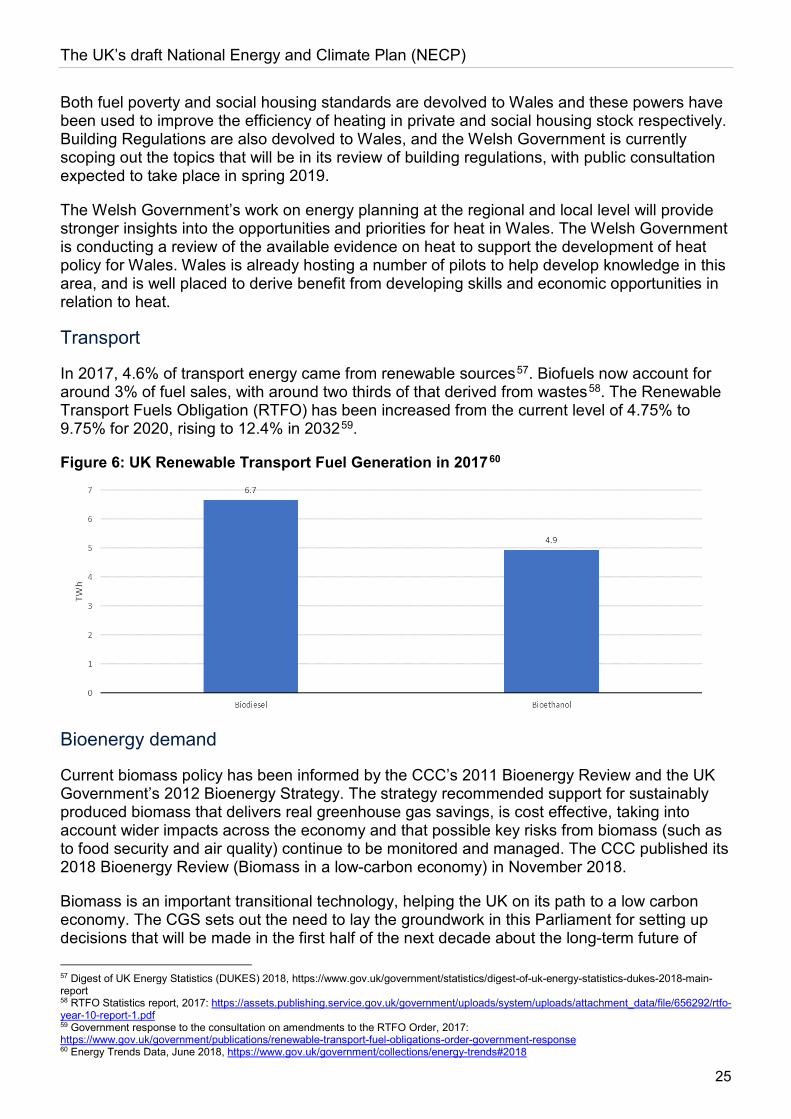
In 2017, 4.6% of transport energy came from renewable sources57. Biofuels now account for around 3% of fuel sales, with around two thirds of that derived from wastes58. The Renewable Transport Fuels Obligation (RTFO) has been increased from the current level of 4.75% to 9.75% for 2020, rising to 12.4% in 203259.
Figure 6: UK Renewable Transport Fuel Generation in 201760
Bioenergy demand
Current biomass policy has been informed by the CCC’s 2011 Bioenergy Review and the UK Government’s 2012 Bioenergy Strategy. The strategy recommended support for sustainably produced biomass that delivers real greenhouse gas savings, is cost effective, taking into account wider impacts across the economy and that possible key risks from biomass (such as to food security and air quality) continue to be monitored and managed. The CCC published its 2018 Bioenergy Review (Biomass in a low-carbon economy) in November 2018.
Biomass is an important transitional technology, helping the UK on its path to a low carbon economy. The CGS sets out the need to lay the groundwork in this Parliament for setting up decisions that will be made in the first half of the next decade about the long-term future of 57 Digest of UK Energy Statistics (DUKES) 2018, https://www.gov.uk/government/statistics/digest-of-uk-energy-statistics-dukes-2018-main-report 58 RTFO Statistics report, 2017: https://assets.publishing.service.gov.uk/government/uploads/system/uploads/attachment_data/file/656292/rtfo-year-10-report-1.pdf 59 Government response to the consultation on amendments to the RTFO Order, 2017: https://www.gov.uk/government/publications/renewable-transport-fuel-obligations-order-government-response 60 Energy Trends Data, June 2018, https://www.gov.uk/government/collections/energy-trends#2018

The UK’s draft National Energy and Climate Plan (NECP)
26
heat; the role that bioenergy can play in this is currently being explored. The Renewable Heat Incentive, which supports solid biomass and biogas technologies for heat, and biomethane injection to the gas grid, has budget confirmed to 2021. The UK Government, however, recognises that there are scenarios where bioenergy could further support the decarbonisation of heat, for example in buildings that are currently dependent on coal and oil, and for which electrification is not the most suitable option, or where high temperature dispatchable heat is required for industry.
Bioenergy for transport is expected to be used in all forms of transport including for aviation fuels. It is incentivised via the RTFO and is expected to deliver around 27TWh of biomass derived energy in transport in 203261.
Biomass supply
In the UK the main biomass feedstocks are:
a. Biomass wastes sourced from food, sewage, or the biomass portion of mixed black bag waste – if not used for biomass these wastes would go to landfill and produce methane62. Use in the energy sector avoids these additional emissions and provide generators a fee for accepting the waste63.
b. Woody/dry biomass residues – sourced from managed forestry or by-products from agriculture (such as straw) or timber production. The effects of this harvesting are reported in the UK emission inventory. The UK also imports woody biomass from North America and Europe which is reported in accordance with the source country’s inventory.
c. Energy crops – domestically produced, these include fast-growing trees or grasses grown on low grade farm land that is not suitable for food production.
d. Other crops – domestically and internationally produced, these include food crops such as oil seed rape and sugar beet.
The Renewable Heat Incentive scheme64 has imposed restrictions on the use of energy crops, to encourage the use of at least 50% agriculture and food waste feedstocks rather than energy crops. This change came into effect on 22 May 2018. In transport, the RTFO includes a cap on the amount of incentive available for fuels made from ‘other crops’. This is set at 4% in 2018/19 and reduces to 2% in 203265. Detailed data is available on the origin and type of biomass feedstocks used to supply biofuels in the UK market. Nearly one third of biomass is sourced domestically and the remainder is imported. In 2016/17 two thirds of renewable fuels supplied were made from wastes66.
61 Renewable transport fuel obligations order: government response (2017), https://www.gov.uk/government/publications/renewable-transport-
fuel-obligations-order-government-response 62 For example, the Renewable energy directives provides a credit for the avoided emissions from methane when using wet wastes such as manure in anaerobic digestion (http://publications.jrc.ec.europa.eu/repository/bitstream/JRC104759/ld1a27215enn.pdf) 63 Anaerobic digestion plants are paid between £0-65 per tonne to take source separated food waste. Energy from waste incinerators are paid between £26 and £144 per tonne to process “refuse derived fuel”. (source: http://www.wrap.org.uk/sites/files/wrap/Gate%20Fees%20report%202017_FINAL_clean.pdf) 64 The Renewable Heat Incentive: A reformed Scheme (Consultation response), 2016: https://assets.publishing.service.gov.uk/government/uploads/system/uploads/attachment_data/file/577024/RHI_Reform_Government_response_FINAL.pdf 65 Renewable transport fuel obligations order: government response (2017), https://www.gov.uk/government/publications/renewable-transport-fuel-obligations-order-government-response 66 Biofuels statistics, published 2013, https://www.gov.uk/government/collections/biofuels-statistics

The UK’s draft National Energy and Climate Plan (NECP)
27
Detail on the volumes and types of biomass expected to be used to meet the RTFO targets in the period to 2032 is available in the cost benefit analysis that accompanied the legislation67.
v Where applicable, other national trajectories and objectives, including those that are long term or sectoral (e.g. share of renewable energy in district heating, renewable energy use in buildings, renewable energy produced by cities, energy communities and self-consumers, energy recovered from the sludge acquired through the treatment of wastewater)
Not applicable.
2.2 Dimension energy efficiency
i The elements set out in point (b) of Article 4
ii The indicative milestones for 2030, 2040 and 2050, the domestically established measurable progress indicators, an evidence-based estimate of expected energy savings and wider benefits, and their contributions to the Union's energy efficiency targets as included in the roadmaps set out in the long-term renovation strategies for the national stock of residential and non-residential buildings, both public and private, in accordance with Article 2a of Directive 2010/31/EU
The UK’s long-term relationship with the EU on energy efficiency is a matter for the future economic partnership negotiations.
Our homes and commercial buildings have become more efficient in the way they use energy which helps to reduce emissions and also cut energy bills. For example, average household energy consumption has fallen by 17% since 1990. We have also improved the energy efficiency of non-domestic buildings since 1990, with emissions 18% lower in 201568.
Final energy demand is projected to be 134 Mtoe in 2025, 3% lower than in 2016. It is then projected to increase again after 2025, as the effects of included policies diminish and macroeconomic drivers continue to increase demand. Projected final energy demand is expected to increase by 2% in 2035 compared to 201669. The UK 2020 target under Article 7 is 324 TWh of energy savings as measured on a Gross Calorific Value basis. The 2018 annual assessment reported a total of 432 TWh of energy savings as measured on a Gross Calorific Value70.
In future, the UK’s efforts to decarbonise will require increased investment across the energy system. However, our focus on innovation will ensure we minimise the costs of this investment as much as possible and further improvements in energy efficiency will continue to drive down bills.
We cannot predict the exact technological changes that will help us deliver on the fourth and fifth carbon budgets (and beyond). The approach could involve: emissions from business and the public sector falling by 30% by 2032 on today’s levels through significant improvements in energy efficiency; reducing energy use per unit of output as well as reducing the carbon
67 Cost Benefit Analysis: Amendments to the RTFO, 2017, http://www.legislation.gov.uk/uksi/2018/374/pdfs/uksiod_20180374_en.pdf 68 Clean Growth Strategy, 2017, https://www.gov.uk/government/publications/clean-growth-strategy 69 Energy and emissions projections (EEP) 2017, https://www.gov.uk/government/publications/updated-energy-and-emissions-projections-2017 70 National Energy Efficiency Action Plans, 2018 Annual Report, https://ec.europa.eu/energy/sites/ener/files/documents/uk_annual_report_2018_en.pdf

The UK’s draft National Energy and Climate Plan (NECP)
28
content of industrial energy use by at least 14% by 2032; or switching to cleaner fuels. Our proposals will contribute to this, for example improving business energy efficiency and standards for commercial buildings and agreeing tighter targets to reduce central government emissions71.
Homes
2050 A pathway to achieve the UK’s fifth carbon budget (2028-2032) and longer-term emissions reduction targets to 2050 (80% reduction against 1990 levels) could involve emissions from homes falling 19% from current levels, with household energy use falling 9% through a combination of switching to low carbon heating and greater energy efficiency which will in turn help to reduce bills72.
2030 The decision pathways of the CGS give an overview of how the policies and proposals set out in the Strategy map over time. They include future policy development such as publications, key decisions, reviews and consultations, which aim to unlock future carbon savings73.
To achieve the UK’s carbon targets, we will need to ensure that existing buildings waste even less energy. The illustrative 2032 pathway in the CGS could see a further 6-9 million properties insulated. This would involve focusing on those occupied by households in fuel poverty in particular, where the aim is to upgrade fuel poor homes to an energy performance certificate (EPC) rating of C or better by 2030. More broadly, our aspiration is that as many homes as possible are improved to EPC Band C by 2035, where practical, cost-effective and affordable74. The CGS contains a number of policies and proposals outlining how we intend to achieve this, for example:
• Developing a long-term trajectory to improve the energy performance standards of privately-rented homes, with the aim of upgrading as many as possible to EPC Band C by 2030 where practical, cost-effective and affordable;
• Consulting on how social housing can meet similar standards over this period;
• Consulting on strengthening energy performance standards for new and existing homes under Building Regulations, including futureproofing new homes for low carbon heating systems.
Building Regulations are devolved to Wales and the Welsh Government is currently scoping out the topics that will be in its review of building regulations. Public consultation on this is expected to take place in spring 2019.
71 Clean Growth Strategy, 2017, https://www.gov.uk/government/publications/clean-growth-strategy 72 Clean Growth Strategy, 2017, https://www.gov.uk/government/publications/clean-growth-strategy 73 Page 127, Clean Growth Strategy, 2017, https://www.gov.uk/government/publications/clean-growth-strategy 74 Clean Growth Strategy, 2017, https://www.gov.uk/government/publications/clean-growth-strategy

The UK’s draft National Energy and Climate Plan (NECP)
29
Public Sector
2050 The CGS sets out the challenge facing the public sector in meeting the UK’s 2050 target, and the leadership role the public sector can play in reducing carbon emissions. Central government has already shown what is possible through its Greening Government Commitments which include a greenhouse gas reduction target75. However, to meet the UK’s 2050 target, emissions from the buildings and activities of the public sector will need to be near zero. This will mean improving energy efficiency and energy management, and decarbonising the heating and cooling of buildings76.
2030 The decision pathways of the CGS give an overview of how the policies and proposals set out in the Strategy map over time. They include future policy development such as publications, key decisions, reviews and consultations, which aim to unlock future carbon savings77.
The illustrative pathway to 2032 sees emissions from the public sector falling by around 50% compared to today. This would require the UK Government to go further with longer-term emissions reduction targets across the public sector and address the barriers to energy efficiency and low carbon investment78.
As a first step, the UK Government has introduced the new Emissions Reduction Pledge79 - a voluntary wider public and higher education sector target of a 30% reduction in greenhouse gases by 2020/21, against a 2009/10 baseline – and will explore the possibility of moving to a more ambitious target during the 2020s. The UK also announced a new, more ambitious set of Greening Government Commitments greenhouse gas emission reduction targets for 2020 – the central government target is a 43% reduction in greenhouse gases80. In addition, the UK Government also announced a review of carbon reduction policies across the public sector and plans to publish a decarbonisation roadmap in 201981.
Energy efficiency is supported by a revolving interest-free loan scheme for the public sector outside central government, managed by Salix Finance. As of 2017, the loan scheme has funded over 16,000 projects, improving public sector and higher education buildings for occupants and is projected to save the sector around £55 million on energy bills this year. As at end 2017/18, the loan scheme administrator had managed £210 million, and this will rise to £385 million by 2020. This revolving loan scheme will continue to be recycled to at least 202582.
The UK Government is also supporting the development of the energy services market; it is currently working with Local Partnerships to provide capacity support to public bodies across
75 Greening Government Commitments, https://www.gov.uk/government/collections/greening-government-commitments 76 Clean Growth Strategy, https://www.gov.uk/government/publications/clean-growth-strategy 77 Clean Growth Strategy, page 127, https://www.gov.uk/government/publications/clean-growth-strategy 78 Clean Growth Strategy, https://www.gov.uk/government/publications/clean-growth-strategy 79 Emissions reduction pledge 2020, https://www.gov.uk/government/publications/emissions-reduction-pledge-2020-emissions-reporting-in-public-and-higher-education-sectors 80 Greening Government Commitments 2016 to 2020, https://www.gov.uk/government/publications/greening-government-commitments-2016-to-2020/greening-government-commitments-2016-to-2020#annex-a--greenhouse-gas-reduction-table 81 Delivery Clean Growth, October 2018, https://assets.publishing.service.gov.uk/government/uploads/system/uploads/attachment_data/file/748296/delivering-clean-growth.pdf 82 Cutting Energy Bills and Carbon Emissions in the Wider Public and Higher Education Sectors, 2017 https://assets.publishing.service.gov.uk/government/uploads/system/uploads/attachment_data/file/651224/BEIS-Consultation-Document-Public_Sector-CFE-FINAL.pdf

The UK’s draft National Energy and Climate Plan (NECP)
30
England to access an energy services procurement framework under the Re-Fit programme. Similar support is provided by the Greater London Authority in London.
In Scotland, the Climate Change (Duties of Public Bodies: Reporting Requirements) (Scotland) Order 2015 requires all public bodies classified as ‘major players’ to publish annual climate change reports83.
Through mandatory climate change reporting, 181 ‘major players’ are able to showcase leadership and action. These examples of good practice and innovation are shared to encourage wider action on climate change throughout the public sector.
The Welsh Government has called for the public sector in Wales to be carbon neutral by 2030. This requires large-scale delivery of energy efficiency and renewable energy projects within the public and community sectors and will deliver significant economic benefit. Wales will have approximately £80 million invested in public sector energy efficiency and renewable energy projects by 2020. The loans are further supported by the provision of expert technical, commercial and financial expertise through the Welsh Government Energy Service84. The service has enabled £55 million of zero-interest loans across the public sector in Wales between 2016 and 2018 and also supported the delivery of a further £27.5 million of energy and energy efficiency projects, where finance was secured from alternative routes. The projects supported will realise savings of £183 million for the public sector over the life of the installed technologies and also reduce carbon emissions by 820,000 tonnes.
Business and Industry
2050 To meet the UK’s 2050 target the deep decarbonisation of industry will need to go beyond energy efficiency and deploy more innovative technologies such as Carbon Capture, Usage and Storage (CCUS). This is detailed in section 2.5(ii).
2030 The decision pathways of the CGS give an overview of how the policies and proposals set out in the Strategy map over time. They include future policy development such as publications, key decisions, reviews and consultations, which aim to unlock future carbon savings85.
Business and industry are responsible for around 25% of UK emissions86. In the CGS, the UK Government set a stretching ambition to support businesses to improve their energy efficiency by at least 20% by 2030. This could deliver up to £6 billion in cost savings by 2030 and contribute up to 22MtCO2e of non-traded carbon savings towards the fifth carbon budget87. This would build on the significant existing support for energy efficiency in business and industry such as the Climate Change Agreements Scheme and the Energy Savings Opportunity Scheme.
The CGS committed the UK Government to consult on a package of measures to support businesses to improve how productively they use energy, including actions that could be taken to improve the take up of energy efficiency measures across buildings. We published a call for
83 The Climate Change (Duties of Public Bodies: Reporting Requirements) (Scotland) Order 2015, http://www.legislation.gov.uk/ssi/2015/347/pdfs/ssi_20150347_en.pdf 84 Welsh Government Energy Service, http://localenergy.gov.wales 85Page 127, Clean Growth Strategy, https://www.gov.uk/government/publications/clean-growth-strategy 86Clean Growth Strategy, https://www.gov.uk/government/publications/clean-growth-strategy 87 Call for Evidence, July 2018, https://www.gov.uk/government/consultations/helping-businesses-to-improve-the-way-they-use-energy-call-for-evidence

The UK’s draft National Energy and Climate Plan (NECP)
31
evidence in July 2018 seeking views on the level of ambition and how we plan to measure our progress to meet the ambition of improving business energy use by at least 20% by 2030. Our focus on buildings includes the following measures:
1. Consult on improving the energy efficiency of new and existing commercial buildings.
2. Consult on raising minimum standards of energy efficiency for rented commercial buildings.
3. Explore how voluntary building standards can support future improvements in commercial building performance.
The Scottish Government’s Energy Strategy commits to identifying the main barriers to investment and developing opportunities to incentivise industrial energy efficiency and decarbonisation. In consultation with energy intensive industry (EII) stakeholders that are operating in Scotland, it is identifying gaps in support and building an evidence base for monitoring the impact of support measures. A paper for discussion will consider options to encourage more investment in industrial energy productivity or decarbonisation, including aligning support with the Energy Efficient Scotland programme.
Local energy
The UK is also committed to supporting local leadership and has already given additional powers and responsibilities through the Cities and Local Government Devolution Act 201688. A number of Local Devolution deals have been agreed between the UK Government and local areas including Cornwall, Sheffield, Greater Manchester and Liverpool. Many of the Local Devolution deals incorporate energy commitments; including support for home energy efficiency, deep geothermal, tidal power and community energy initiatives.
In 2018 the Welsh Government published a call for evidence to inform the approach to delivering the 1GW local energy target89. This looked at how increasing local ownership of renewable energy generation can secure benefits in a more equitable way. It also sought evidence on effective ways of increasing local and shared ownership, which could inform future Welsh Government support. A response to the Call for Evidence will be published in December 2018.
iii Where applicable, other national objectives, including long term targets or strategies and sectoral targets, and national objectives in areas such as energy efficiency in the transport sector and with regard to heating and cooling
New cars and vans registered in the UK market are regulated by EU regulations 443/2009 and 510/2011 respectively. These regulations set fleet-wide tailpipe emissions targets for new cars and vans registered into the EU and EEA markets (bar Switzerland), currently set at 130g CO2/km and 175g CO2/km, lowering to 95g CO2/km and 147g CO2/km in 2020. Manufacturers are setting individual targets for their fleet average and there are heavy fines for non-compliance. The European Council, Parliament and Commission are currently in trilogue discussions for additional targets in 2025 and 2030.
88 Cities and Local Government Devolution Act 2016, http://www.legislation.gov.uk/ukpga/2016/1/contents/enacted 89 Locally owned renewable energy – A Call for evidence, January 2018, https://gov.wales/topics/environmentcountryside/energy/renewable/local-renewable-energy-generation/call-for-evidence

The UK’s draft National Energy and Climate Plan (NECP)
32
The road freight sector has agreed a voluntary industry-wide commitment to reduce HGV CO2 emissions by 15% by 2025. This was announced in the Road to Zero Strategy90 in July 2018 and also by road freight trade bodies. We will work with industry to help operators contribute to this commitment by reducing their CO2 emissions.
The European Commission published a legislative proposal to introduce CO2 emission standards for heavy-duty vehicles. This proposal includes mandatory targets for manufacturers to reduce the CO2 emissions of their new HDVs by 15% by 2025 and 30% by 2030. It also includes incentives for manufacturers to supply zero and low emission HDVs. The UK Government’s ambition for decarbonising road transport and developing zero and low emission vehicles is clearly set out in recent strategies, including the Road to Zero, Clean Growth Strategy and Industrial Strategy.
2.3 Dimension energy security
i The elements set out in point (c) of Article 4
These are addressed in respect to resilience within the Security of Supply report91. Also see 2.3(ii) and (iv).
ii National objectives with regard to increasing: the diversification of energy sources and supply from third countries for the purpose of increasing the resilience of regional and national energy systems
BEIS works with industry, regulators, sector bodies and other stakeholders to improve and maintain the resilience of the energy infrastructure, networks and assets, to reduce vulnerabilities, and ensure an effective response to actual or potentially disruptive incidents.
The UK Government recognises a range of benefits that interconnection can provide. By giving access to generation beyond national borders it can improve security of supply when market prices reflect scarcity and flows across interconnectors follow prices. Interconnection can also help with the integration of intermittent sources of energy and the associated system balancing. In terms of interconnection with third countries, the NorthConnect project between Great Britain and Norway has been granted a Cap and Floor regime in principle and the UK Government continues to explore the potential of further projects with Norway and Iceland.
iii Where applicable, national objectives with regard to reducing energy import dependency from third countries, for the purpose of increasing the resilience of regional and national energy systems
The UK set out a strategy to maximise economic recovery of petroleum from the UKCS, based on the UKCS Maximising Recovery Review (Wood review, 2014). Based on the recommendations of the review, the UK Government established an independent regulator, the Oil and Gas Authority (OGA), which is now a Government Company with new competences under the Energy Act 2016 to enable maximising economic recovery (MER) of UKCS hydrocarbons. OGA issued the MER UK Strategy in March 2016 and supports the cost-effective decommissioning of offshore installations.
90 The Road to Zero, July 2018, https://assets.publishing.service.gov.uk/government/uploads/system/uploads/attachment_data/file/739460/road-to-zero.pdf 91 Statutory security of supply report: 2018, https://www.gov.uk/government/publications/statutory-security-of-supply-report-2018

The UK’s draft National Energy and Climate Plan (NECP)
33
The UK Government introduced measures including abolishing the Petroleum Revenue Tax and cutting the supplementary charge from 32% to 10% and has supported seismic surveys in under-explored areas of the UKCS. Operators in the UKCS will be able to transfer part of their tax history when assets change hands in order to facilitate the transfer of late-life oil and gas assets. This will allow new investors to benefit from tax relief when assets are eventually decommissioned and help extend field life.
iv National objectives with regard to increasing the flexibility of the national energy system, in particular by means of deploying domestic energy sources, demand response and energy storage
The UK imports natural gas from third countries in two ways: pipelines from Norway and LNG import and regassification facilities. The UK currently has an import deliverability of ~57bcm/y from Norway and ~49bcm/y from LNG import terminals92.
The UK is connected to global gas markets through three LNG import terminals. The UK currently has the infrastructure capacity to import around 49bcm/y of LNG through: Milford Haven (South Hook and Dragon, 21bcm/y and 8bcm/y respectively) and Isle of Grain (20bcm/y)93. This means the UK has the second largest LNG infrastructure in Europe, behind Spain94.
These terminals connect the UK to any LNG producing country, although historically the majority of UK LNG has come from Qatar (around 84% of total UK LNG imports in 2017), the world’s largest LNG producer. Send-out from LNG terminals was lower in winter 2017/18 with respect to the previous three winters.
In response to the decline in production from the United Kingdom Continental Shelf (UKCS), the Oil and Gas Authority was established with a remit of maximising economic recovery from the UKCS. It has a number of strategies in place to deliver this aim, working closely with industry, to improve exploration rates, technology innovation and deployment.
92 Gas Ten Year Statement, National Grid 2017, https://www.nationalgrid.com/sites/default/files/documents/GTYS%202017_1.pdft/ 93 Digest of UK Energy Statistics 2017, Table 4.4 94 Gas Infrastructure Europe (GIE) LNG Map, December 2016

The UK’s draft National Energy and Climate Plan (NECP)
34
Figure 7: UK Oil and gas production and reserves, 1980-201795
*From 2015, contingent resources have been re-categorised and removed from the probable and proven reserves category.
The number of wells in the exploration, appraisal and development phases has been on a downwards trend since 2008. In 2015 and 2016 the UK Government has provided £40 million for seismic surveys to encourage exploration in under-explored areas.
The development of a successful UK shale gas industry has the potential to improve investment prospects for the production sector in the longer-term. However, it is not yet known whether it will be possible to commercially or technically extract shale gas in the UK. BEIS works closely with regulators and industry to encourage the development of a safe and environmentally sound shale industry in the UK, ensuring that robust regulations are in place to safeguard public safety and protect the environment. Having given careful consideration to the evidence submitted and after scrutiny from the department, on 24 July 2018 BEIS Ministers granted the first Hydraulic Fracturing Consent for shale gas extraction to shale gas operator Cuadrilla Bowland Limited.
Demand Response
The conclusions of Ofgem’s Gas Significant Code Review (SCR)96 placed an obligation on National Grid to develop a centralised gas demand side response (DSR) mechanism to encourage greater demand-side participation from industrial and commercial users. National Grid’s proposed DSR methodology was approved by Ofgem and went live in October 2016. This service allows large gas consumers to offer, via a centralised mechanism, to reduce the amount of gas they use during times of system stress in exchange for a payment. National Grid published its first Gas DSR Annual Report in April 201797.
In July 2017, BEIS and Ofgem published Upgrading our Energy System: Smart Systems and Flexibility Plan98, which sets out 29 actions that the UK Government, Ofgem, and industry will
95 UK energy in brief 2018, https://www.gov.uk/government/statistics/uk-energy-in-brief-2018 96 Gas Significant Code Review (SCR), 2014, https://www.ofgem.gov.uk/publications-and-updates/gas-security-supply-significant-code-review-conclusions 97 Gas Demand Side Response (DSR), Annual Report 2016/17, National Grid https://www.nationalgrid.com/sites/default/files/documents/8589939979-National%20Grid%20-%20Gas%20DSR%20Annual%20Report%202016_17.pdf 98 Upgrading our Energy System: Smart Systems and Flexibility Plan, July 2017 https://www.gov.uk/government/publications/upgrading-our-energy-system-smart-systems-and-flexibility-plan
-
500
1,000
1,500
2,000
2,500
3,000
1980
1985
1990
1995
2000
2005
2010
20152017
Gas p
rodu
ctio
n an
d re
serv
esM
illio
n to
nnes
Cumulative production
Remaining reserves - proven and probable*
-
500
1,000
1,500
2,000
2,500
3,000
3,500
4,000
1980
1985
1990
1995
2000
2005
2010
20152017
Oil
prod
uctio
n an
d re
serv
esM
illio
n to
nnes
Cumulative production
Remaining reserves - proven and probable*

The UK’s draft National Energy and Climate Plan (NECP)
35
undertake. The aim is to remove barriers to smart technologies, including storage; enable smart homes and businesses; and make electricity markets work towards flexibility. We aim to implement the actions in the Plan by 2022, enabling the electricity system to work more flexibly and efficiently, potentially unlocking £17-40 billion in savings across the electricity system by 2050. In October 2018, BEIS and Ofgem published a progress update99 to the Plan showing that 15 of the 29 actions have now been implemented. It also sets out the UK Government and Ofgem’s forward priorities in this area, which include 9 new actions beyond those set out in the original Plan.
Unconventional gas resources (including shale development)
The UK Government is committed to a low carbon and affordable future for our energy. Gas, the least polluting fossil fuel, still meets a third of our energy demand and we will need it for many years to come. In May 2018, the UK Government reiterated its view that there are potentially substantial benefits from the safe and sustainable exploration and development of our onshore shale gas resources. Correspondingly, shale gas could be a new domestic source of natural gas for the UK as production from the North Sea declines and we rely increasingly on imports.
However, the UK Government has been clear that shale gas development must be safe and environmentally sound. In the UK, we have been regulating for gas and oil drilling, both onshore and offshore, for many years and have tough regulations in place to ensure on-site safety, prevent water contamination, and mitigate seismic activity and air pollution.
Developing shale gas could create a new British industry, providing many direct, highly skilled jobs. In addition, a thriving UK shale industry could indirectly support other industries and help our local and national economy. To determine the potential of the industry and how development will proceed, we require exploration to go ahead and the UK Government is supporting this as long as it is done safely.
The UK Government continues to support the development of British shale gas by:
• Establishing a Shale Environmental Regulator Group, which brings the regulators (Oil and Gas Authority, Health and Safety Executive and Environment Agency) together as a virtual body. The Shale Environmental Regulator Group will act as one, coherent, single face for local authorities and industry, helping to resolve regulatory issues on sites and sharing best practice with local authorities considering shale gas planning applications;
• Providing support for those involved in decision making by launching a new £1.6 million shale support fund over the next two years to build capacity and capability in local authorities dealing with shale planning applications; and creating a new planning brokerage service for shale applications to provide guidance to developers and local authorities on the planning process to help facilitate timely decision making;
• Appointing the first Commissioner for Shale Gas. The Commissioner will be a contact point for residents and communities, to listen to their concerns, refer them to relevant and factual research and help improve communication with regulators and industry;
99 Upgrading Our Energy System: Progress Update, October 2018, https://www.ofgem.gov.uk/system/files/docs/2018/10/smart_systems_and_flexibility_plan_progress_update.pdf

The UK’s draft National Energy and Climate Plan (NECP)
36
• Consulting on the inclusion of production shale sites into the Nationally Significant Infrastructure Projects (NSIP) regime and on the inclusion of non-hydraulic fracturing exploratory drilling as a permitted development right; and
• Finally, the UK Government has announced the Shale Wealth Fund, which will provide additional resources to local communities, over and above industry schemes and other sources of government funding.
In 2018, onshore oil and gas licensing powers in Scotland and Wales were devolved to both Scottish and Welsh Ministers respectively and Wales and Scotland have adopted their own policy positions with respect to unconventional oil and gas exploration100.
Shale gas reserves
The areas identified by the British Geological Survey with potentially large reserves of shale gas and oil are the Bowland-Hodder area in Northern England and the Midlands, the Weald Basin in Southern England and the Midland Valley of Scotland. UK geology is promising but we make no assumptions about production levels and it is unknown what can be technologically and economically extracted. We need exploration to determine the potential and possible production levels by testing flow rate and gas quality.
The Bowland-Hodder area extends from the east coast of England to the west. The British Geological Survey has estimated that this area could contain a volume of 1329 trillion cubic feet (TCF) of shale gas (the UK consumed 2.5 TCF of gas in 2014)101 .
Government incentives to promote exploration & production, changes in upstream regulatory regime
In its 2015 and 2016 budgets, the UK Government provided a £2.3 billion fiscal package to support the offshore industry. The UK Government announcements included:
• The establishment of the Oil and Gas Authority to be a strong and independent regulator and supporter of the oil and gas industry;
• Zero rating the Petroleum Revenue Tax and cutting the supplementary charge from 32% to 10%;
• Providing £40 million for seismic surveys in under developed areas of the UK Continental Shelf; and
• A £250 million Aberdeen City Region Deal in collaboration with Scottish Government, which included a £90 million UK contribution for the new Oil and Gas Technology Centre.
In the Autumn budget 2017, the UK Government announced that operators in the UKCS will be able to transfer part of their tax history when assets change hands in order to facilitate the transfer of late-life oil and gas assets. This will allow new investors to benefit from tax relief when assets are eventually decommissioned and help extend field life.
100 Scottish Government position statement, December 2017, https://www.gov.scot/publications/unconventional-oil-and-gas-position-statement/ 101 Bowland Shale Gas, British Geological Survey, https://www.bgs.ac.uk/research/energy/shaleGas/bowlandShaleGas.html

The UK’s draft National Energy and Climate Plan (NECP)
37
2.4 Dimension internal energy market
2.4.1 Electricity interconnectivity
i The level of electricity interconnectivity that the Member State aims for in 2030 in consideration of the electricity interconnection target for 2030 of at least 15 %, with a strategy with the level from 2021 onwards defined in close cooperation with affected Member States, taking into account the 2020 interconnection target of 10 % and the following indicators of the urgency of action:
- Price differential in the wholesale market exceeding an indicative threshold of EUR 2/MWh between Member States, regions or bidding zones;
- Nominal transmission capacity of interconnectors below 30 % of peak load;
- Nominal transmission capacity of interconnectors below 30 % of installed renewable generation.
Each new interconnector shall be subject to a socioeconomic and environmental cost-benefit analysis and implemented only if the potential benefits outweigh the costs
The UK Government recognises the potential for further interconnection to contribute to energy security, affordability and decarbonisation objectives and supports projects which support these outcomes. The GB electricity system is currently connected with north-west Europe via 3GW interconnector capacity – 2GW with France and 1GW with the Netherlands. 1GW of interconnection also links GB and the Single Electricity Market (SEM) on the island of Ireland102.
The UK provides a supportive policy environment for further interconnection projects, including through the regulatory route of the Cap and Floor regime and an exempted route for merchant projects. Currently, an additional 4.4GW of capacity is under construction, linking GB with Norway, France, and Belgium, due for completion by 2021. Further interconnection projects are currently under construction (4.4GW) or seeking regulatory approval (4GW) and, as set out in the UK’s CGS, project assessments indicate the potential for a further 9.5GW interconnection beyond this in the early to mid-2020s. This is expected to increase our level of interconnection by 2030.
The UK is involved in the NSEC work on concrete concepts for joint offshore projects or cluster projects. The NSEC has identified a list of potential areas and projects in the region, where joint projects could be most beneficial. These include: (1) IJmuiden Ver offshore wind farm to UK, (2) CGS IJmuiden Ver – Norfolk, (3) COBRA Cable, (4) DE offshore wind farm connected to NL and (5) North Seas Wind Power Hub. The NSEC is working on developing concrete concepts for the implementation of selected projects from the above list.
102 Electricity Interconnectors, Ofgem, https://www.ofgem.gov.uk/electricity/transmission-networks/electricity-interconnectors
The UK’s draft National Energy and Climate Plan (NECP)
38
2.4.2 Energy transmission infrastructure
i Key electricity and gas transmission infrastructure projects, and, where relevant, modernisation projects, that are necessary for the achievement of objectives and targets under the five dimensions of the Energy Union Strategy
There are a number of electricity transmission projects which achieve the objectives and targets of the Energy Union Strategy, such as the Western HVDV link which will help transport renewable energy from Scotland to England and Wales103. For examples of similar projects please see the transmission owners’ projects update104.
In the gas sector, the iron mains risk reduction programme which seeks to replace fractured iron mains pipe with plastic is also improving the efficiency of the gas network by reducing leaks of uncombusted gas. Ofgem are currently consulting on the RIIO2 price control mechanism for the period from 2021. This will help direct investment in the gas network, including expenditure on resilience and decarbonisation.
ii Where applicable, main infrastructure projects envisaged other than Projects of Common Interest (PCIs)
In addition to the list for PCI interconnector projects, the NeuConnect interconnector project has been granted regulatory approval in principle through Ofgem’s Cap and Floor regime105. Further projects, which have not yet applied for regulatory approval, are listed on the Ten Year Network Development Plan.
The UK Government requires the electricity transmission operator to submit updates on the progress of infrastructure projects on a quarterly basis. This information is published online106 .
2.4.3 Market integration
i National objectives related to other aspects of the internal energy market such as increasing system flexibility, in particular related to the promotion of competitively determined electricity prices in line with relevant sectoral law, market integration and coupling, aimed at increasing the tradeable capacity of existing interconnectors, smart grids, aggregation, demand response, storage, distributed generation, mechanisms for dispatching, re-dispatching and curtailment, and real-time price signals, including a timeframe for when the objectives shall be met
The UK is leading in digitalisation and smart energy services. In July 2017, BEIS and Ofgem published Upgrading our Energy System: Smart Systems and Flexibility Plan107, which sets out 29 actions that the UK Government, Ofgem, and industry will undertake. The aim is to remove barriers to smart technologies, including storage; enable smart homes and businesses; and make electricity markets work towards flexibility. We aim to implement the actions in the Plan by 2022, enabling the electricity system to work more flexibly and efficiently, potentially unlocking £17-40 billion in savings for the system, by 2050. In October 2018, BEIS and Ofgem
103 Western Link Project, http://www.westernhvdclink.co.uk/the-project.aspx 104 Electricity transmission networks: major projects update, 2018, https://www.gov.uk/government/publications/electricity-transmission-networks-major-projects-update 105 Decision on the Initial Project Assessment of the GridLink, NeuConnect and NorthConnect interconnectors, January 2018, https://www.ofgem.gov.uk/publications-and-updates/decision-initial-project-assessment-gridlink-neuconnect-and-northconnect-interconnectors 106 Electricity transmission networks: major projects update, 2018, https://www.gov.uk/government/publications/electricity-transmission-networks-major-projects-update 107 Upgrading our Energy System: Smart Systems and Flexibility Plan, July 2017 https://www.gov.uk/government/publications/upgrading-our-energy-system-smart-systems-and-flexibility-plan
The UK’s draft National Energy and Climate Plan (NECP)
39
published a progress update108 to the Plan showing that 15 of the 29 actions have now been implemented. It also sets out the UK Government and Ofgem’s forward priorities in this area, which include nine new actions beyond those set out in the original Plan.
ii Where applicable, national objectives related to the non-discriminatory participation of renewable energy, demand response and storage, including via aggregation, in all energy markets including a timeframe for when the objectives are to be met
Not applicable.
iii Where applicable, national objectives with regard to ensuring that consumers participate in the energy system and benefit from self-generation and new technologies, including smart meters
Self-Generation: Feed-In Tariff Scheme (FiTs) and future for small-scale low-carbon generation
The Feed-in Tariff (FITs) scheme was introduced on 1 April 2010 covering England, Scotland and Wales, under powers in the Energy Act 2008. The intention was to encourage the deployment of small-scale (up to 5MW), low-carbon electricity generation, particularly by organisations, businesses, communities and individuals that have not traditionally engaged in the electricity market.
The technologies supported under FITs are: solar PV, onshore wind, hydropower, anaerobic digestion (AD), and micro (<2kW) combined heat and power (micro-CHP)109.
Under the scheme generators receive three sources of income/savings:
• Generation tariff - a payment for every kWh generated, dependent on the technology and capacity of the installation, and date installed;
• Export tariff - an additional payment for every kWh exported to the local electricity network, and
• Bill savings - additional benefit from usage of electricity “onsite” as opposed to paying the retail price for importing that energy from the grid.
Tariffs are calculated to give rates of return that encourage investment but prevent overcompensation. Payments to generators are made by electricity suppliers and then passed on to consumers through electricity bills.
The UK Government announced the closure of the FITs generation tariff on 1 April 2015 and published a consultation on the full closure of FITs scheme110 on 19 July 2018. Along with this consultation, the UK Government published a response to an earlier consultation on
108 Upgrading Our Energy System: Progress Update, October 2018, https://www.ofgem.gov.uk/publications-and-updates/upgrading-our-energy-system-smart-systems-and-flexibility-plan-progress-update 109 About the FIT scheme, https://www.ofgem.gov.uk/environmental-programmes/fit/about-fit-scheme 110 Consultation on closure of FITs, July 2018, available at: https://www.gov.uk/government/consultations/feed-in-tariffs-scheme

The UK’s draft National Energy and Climate Plan (NECP)
40
implementing an EII exemption from the indirect costs of the FITs111, and a call for evidence on the future for small-scale low-carbon generation112.
The call for evidence sought to identify:
• The challenges and opportunities from small-scale low-carbon electricity generation in contributing to the UK Government’s objectives for clean, affordable, secure and flexible power; and
• The role for the UK Government and the private sector in overcoming these challenges and realising these opportunities.
In this context, the evidence provided, and responses received as part of this call for evidence will be considered and used to inform policy development ahead of a UK Government response in due course. The call for evidence closed on 31 August 2018 and the responses are being reviewed.
Smart meters
The UK Government is committed to ensuring that smart meters are offered to every GB home and small business by the end of 2020. Smart meters are the next generation of gas and electricity meters which offer a range of intelligent functions and provide consumers with more accurate information on their energy usage and cost. Every domestic consumer is also offered an In Home Display, which gives consumers easy access to their energy consumption data in pounds and pence to help them manage and reduce their energy consumption, save money and reduce emissions.
The UK Government’s latest Cost Benefit Analysis estimates the roll-out of smart meters will deliver total net benefits of around £5.7 billion, the majority of which come from consumer energy savings and industry operational cost savings113 .
More broadly, the rollout is an important part of our move towards a smarter, more flexible energy system114. Smart meters will enable suppliers to offer smart tariffs and innovation in smart products using energy consumption data. Smart meters will also make it easier for consumers to switch energy supplier.
The UK Government has developed a comprehensive consumer engagement strategy to help consumers benefit from smart metering. Energy suppliers hold the primary consumer engagement role as the main point of contact for customers before, during and after smart meter installation. A mandatory installation code of practice requires energy suppliers to take consumers’ specific needs into account. This ensures that all consumers, particularly vulnerable consumers, can access the benefits of smart metering. In addition, Smart Energy GB (SEGB), an independent body funded by energy suppliers, is delivering a national engagement programme to raise awareness and drive behaviour change. As part of this work SEGB is partnering with grassroots organisations around Great Britain to reach all types of consumers including the most vulnerable. Research by SEGB shows that the majority (83%) of people with smart meters say they have a better idea of what they are spending on energy. 111 Government response to implementing an exemption for energy intensive industries from the indirect costs of the renewables obligation and feed-in tariff schemes, available at: https://www.gov.uk/government/consultations/implementing-an-exemption-for-energy-intensive-industries-from-the-indirect-costs-of-the-ro-and-the-fits 112 Call for evidence on the future for small-scale low-carbon generation, July 2018, available at: https://www.gov.uk/government/consultations/the-future-for-small-scale-low-carbon-generation-a-call-for-evidence 113 Smart meter roll-out (GB): cost-benefit analysis, 2016: https://www.gov.uk/government/publications/smart-meter-roll-out-gb-cost-benefit-analysis 114 Upgrading our Energy System – smart systems and flexibility plan, July 2017: https://www.ofgem.gov.uk/publications-and-updates/upgrading-our-energy-system-smart-systems-and-flexibility-plan

The UK’s draft National Energy and Climate Plan (NECP)
41
More than eight in ten (81%) of people with smart meters say they have taken at least one step to use less energy115.
There are now over 12.8 million smart and advanced meters operating in smart mode across homes and businesses in Great Britain116.
In Scotland the Energy Strategy committed to deliver a Smart Meter Advice Project delivered through Home Energy Scotland to enable customers to make the most of the energy use data provided by their smart meters. The project is set to go live at the end of 2018 but this timescale is dependent on the enrolment of compliant SMETS2 meters onto the smart meter communication platform117.
iv National objectives with regard to ensuring electricity system adequacy, as well as for the flexibility of the energy system with regard to renewable energy production, including a timeframe for when the objectives are to be met
Capacity Market
The UK Government has established in law a reliability standard for system adequacy in GB. This is set at 3 hours Loss of Load Expectation (LOLE), i.e. the expectation that there will be three hours per year on average where generation in the market may not meet demand, and other measures may be needed. Capacity Market (CM) auctions are held each year with targets set at the level needed to meet this reliability standard. Generators and others compete in these CM auctions to obtain agreements under which they commit to making their capacity available when needed, in return for guaranteed payments.
The most recent CM auctions took place in early 2018, and the majority of the capacity needed through to 2021/22 has now been secured. The next auction was scheduled for early 2019, however a recent judgement in the General Court of the Court of Justice of the European Union which went against the EU Commission has had the effect of annulling the original State aid approval for the CM. The UK Government is actively working with the Commission to reinstate the Capacity Market as soon as possible.
Section 3.3(i) contains information on flexibility.
v Where applicable, national objectives to protect energy consumers and improve the competitiveness of the retail energy sector
The UK plans for the next 10 years include:
Tariff Cap:
• Following the coming into force of the Domestic Gas & Electricity (Tariff Cap) Act 2018, Ofgem the national regulator for GB, has consulted and is in the process of implementing a price cap on the rate that suppliers charge consumers on standard
115 Smart Energy Outlook, October 2018 edition: https://www.smartenergygb.org/en/resources/press-centre/press-releases-folder/smart-energy-outlook-oct18
116 Statistical release and data: Smart Meters, Great Britain, quarter 3 2018, published November 2018 https://www.gov.uk/government/statistics/statistical-release-and-data-smart-meters-great-britain-quarter-3-2018 117 Energy Savings Trust website: http://www.energysavingtrust.org.uk/energy-saving-trust%E2%80%99s-views-maximising-interoperability-smets1-meters
The UK’s draft National Energy and Climate Plan (NECP)
42
variable and default rate tariffs for their energy. The cap will take effect on 1 January 2019118.
• It is intended to protect consumers until the conditions for effective competition are in place. The cap is a temporary measure running until 2020 initially. It may be extended by one year at a time until the end of 2023 at the latest. This will be informed by a report by Ofgem. The cap will provide protection for around 11 million households119.
Engaging consumers:
• Ofgem are introducing a principles-based approach which allows bills to be simplified with information presented in a way that works for consumers. This approach balances the protection of consumers with greater room for flexibility and innovation in the future.
• Ofgem are also conducting trials to discover what works in engaging customers without irritating them. These trials will be scaled up and rolled out nationally if successful.
Use of data:
• The UK Government is to revise the Midata programme to ensure domestic customers can access their data electronically in order to conduct an accurate cross-market comparison.
• Ofgem is working on developing and utilising a database with details from suppliers of their domestic and microbusiness customers who have been on a standard variable or default tariff for three or more years to enable rival suppliers to prompt customers to engage.
• Price comparison websites to be granted access to the Electricity Central Online Enquiry Service and gas and electricity customers’ data to reduce errors in switching process. There will be an annual report on the development of this work.
• Ofgem is considering the move to market-wide half-hourly electricity settlement; and intend to reach a decision on whether and how to implement it in the second half of 2019.
• The UK Government is committed to every household and small business being offered a smart meter by the end of 2020.
Faster switching:
• Ofgem and the UK Government are moving to faster and more reliable switching for customers.
In Scotland, the Energy Strategy committed to protecting consumers from excessive or avoidable costs, and to promote the benefits of smarter domestic energy applications and systems. In the first half of 2019 the Scottish Government will publish a Consumer Vision and Action Plan to set out the steps that the Scottish Government, working with partners, will take to ensure consumers’ needs and interests are understood as we move to a low carbon Scotland.
118 Press release, September 2018, OFGEM: https://www.ofgem.gov.uk/publications-and-updates/ofgem-proposes-price-cap-give-11-million-customers-fairer-deal-their-energy 119 Domestic Gas and Electricity (Tariff Cap) Bill: Impact Assessment, February 2018: https://www.gov.uk/government/publications/domestic-gas-and-electricity-tariff-cap-bill-impact-assessment

The UK’s draft National Energy and Climate Plan (NECP)
43
The Scottish Government also announced, in October 2017, an ambition to establish a public energy company with the aim of supporting efforts to tackle fuel poverty and helping to achieve climate change targets120. It will be publicly-owned and run on a not-for-profit basis. The company will offer energy at a fair price and ultimately will contribute to economic development through supporting renewable energy ambitions. A full public consultation will follow the publication of an outline business case in 2019.
2.4.4 Energy poverty
i Where applicable, national objectives with regard to energy poverty including a timeframe for when the objectives are to be met
Energy Poverty, known as fuel poverty in the UK, is a devolved issue, with separate objectives in each administration.
England The Fuel Poverty (England) Regulations 2014121 created an objective for improving the energy performance of as many fuel poor homes in England as is reasonably practicable to a minimum of Band C by 31 December 2030. The fuel poverty strategy for England includes interim milestones for as many fuel poor homes as is reasonably practicable to achieve a minimum energy efficiency rating of Band E by 2020 and Band D by 2025.
Wales Since 2011, the Welsh Government has invested more than £240 million to improve the energy efficiency more than 45,000 homes of those on low incomes or living in the most disadvantaged areas of Wales. The Welsh Government is investing a further £104 million in the Warm Homes programme for the period (2017-2021), improving up to 25,000 homes and levering in up to £24 million of EU funding122.
Northern Ireland The Northern Ireland Executive’s fuel poverty strategy is delivered mainly through the Affordable Warmth Scheme123. The Scheme identifies and assists those low-income households most at risk of fuel poverty. The Scheme identifies and assists those low-income households most at risk of fuel poverty. Since its inception in September 2014 the Affordable Warmth Scheme has invested more than £60 million improving the energy efficiency of 14,000 low income households.
Scotland The Fuel Poverty (Target, Definition and Strategy) (Scotland) Bill (“the Bill”) was introduced to the Scottish Parliament on 26 June 2018124. It includes a target that in 2040 no more than 5% of Scottish households will be in fuel poverty and sets out a new definition of fuel poverty. Alongside the Bill, the Scottish Government have published a draft Fuel Poverty Strategy125,
120 Public Energy Company, Scottish Government website, https://www2.gov.scot/Topics/Business-Industry/Energy/POEC 121The Fuel Poverty (England) Regulations 2014: https://www.legislation.gov.uk/uksi/2014/3220/contents/made 122 Written Statement - Increasing the Scale and Rate of Residential Energy Efficiency Retrofit in Wales, November 2017, https://gov.wales/about/cabinet/cabinetstatements/2017/energyretrofits/?lang=en 123 Northern Ireland Affordable Warmth Scheme, https://www.nihe.gov.uk/index/benefits/affordable_warmth_scheme.htm; current AWS Fuel Poverty Strategy, https://www.communities-ni.gov.uk/publications/fuel-poverty-strategy 124 Fuel Poverty (Target, Definition and Strategy) (Scotland) Bill 2018, https://www.gov.scot/binaries/content/documents/govscot/publications/publication/2018/06/guide-fuel-poverty-target-definition-strategy-scotland-bill-2018/documents/00537536-pdf/00537536-pdf/govscot%3Adocument 125 Draft Fuel Poverty Strategy for Scotland 2018, https://www.gov.scot/publications/draft-fuel-poverty-scotland-2018/

The UK’s draft National Energy and Climate Plan (NECP)
44
which sets out more information on the actions they are taking to support householders. A final strategy will be published within a year Section 3 of the Act coming into force.
By the end of 2021, the Scottish Government will have allocated over £1 billion since 2009 to tackling fuel poverty and improving energy efficiency and are on track to deliver their 2016 Programme for Scottish Government commitment to make half a billion pounds available over four years to address these issues, making people’s homes warmer and cheaper to heat.
The Scottish House Condition Survey126 shows that just over two-fifths (43%) of homes in 2016 rated EPC band C or above, an increase of 77% since 2010. In the delivery of Scotland’s Energy Efficient Scotland Programme priority will be given to improving the homes of fuel poor households. The programme sets a target for all Scottish homes to achieve an EPC band C by 2040 (where technically feasible and cost effective), with interim, more stretching targets for the social and private rented sector. To support the ambition of eradicating fuel poverty by removing poor energy efficiency as a driver the Scottish Government are consulting on setting a more ambitious target for those households in fuel poverty - for all homes with households in fuel poverty to reach EPC band C by 2030 and EPC band B by 2040 (where technically feasible and cost effective).
2.5 Dimension research, innovation and competitiveness
i National objectives and funding targets for public and, where available, private research and innovation relating to the Energy Union including, where appropriate, a timeframe for when the objectives are to be met
Through our Industrial Strategy, the UK Government has set a Clean Growth Grand Challenge to put the UK at the forefront of the industries of the future. The UK Government will maximise the advantages for UK industry from the global shift to clean growth – through leading the world in the development, manufacture and use of low carbon technologies, systems and services that cost less than high carbon alternatives. As part of this Grand Challenge, the UK will:
1. Develop smart systems for cheap and clean energy across power, heating and transport
2. Transform construction techniques to dramatically improve efficiency (with up to £170 million available through wave 2 of the Industrial Strategy Challenge Fund up to 2021)
3. Work with industry to make the UK’s energy intensive industries competitive in the clean economy
4. Put the UK at the forefront of the global move to high-efficiency agriculture
5. Make the UK the global standard-setter for finance that supports clean growth
126 Scottish House Condition Survey, 2017, https://www.gov.scot/binaries/content/documents/govscot/publications/statistics-publication/2017/12/scottish-house-condition-survey-2016-key-findings/documents/00528448-pdf/00528448-pdf/govscot%3Adocument

The UK’s draft National Energy and Climate Plan (NECP)
45
The UK Government has significantly increased its investment in low carbon innovation. From 2015 to 2021 we expect to invest more than £2.5 billion in research, development and the demonstration of low carbon energy, transport, agriculture and waste127. This includes128:
• Up to £505 million from BEIS’s Energy Innovation Programme, which aims to accelerate the commercialisation of innovative clean energy technologies and processes.
• Up to £1.2 billion of funding from the combination of UK Research Councils and Innovate UK – now being brought into one organisation with the creation of UK Research and Innovation. These investments include funding for the Energy Systems Catapult and the Offshore Renewable Energy Catapult.
• Up to £246 million for the Faraday Challenge, which will ensure the UK builds on its strengths and leads the world in the design, development and manufacture of electric batteries.
• Up to £620 million from a range of UK Government Departments, including BEIS, DfT, DfID and Defra and additional Industrial Strategy Challenge Fund support.
• In addition to this UK Government funding, Ofgem is making up to £720 million of regulated expenditure available to gas and electric companies in Great Britain, to support smarter, more flexible, efficient, and resilient networks.
• The UK Government is also stimulating industry-academia collaboration for example through the Agri-tech catalyst, which will help improve agricultural productivity and contribute to more environmentally sustainable agricultural systems.
The UK’s Office of National Statistics (ONS) publishes estimates of total private sector R&D, but this is not broken down by Energy Technology Research, Development and Innovation (ETRDI). We are not aware of any formal reporting of data broken down in this way as there is no formal record of different private sector ETRDI projects.
The UK Government actively encourages private sector participation in public ETRDI Programmes, recognizing the clear economic benefits such as supporting jobs and increasing export potential.
Co-ordination of UK energy research and innovation activity
The Energy Innovation Board was formed in November 2016 and replaces and builds on the work of the former Low Carbon Innovation Coordination Group (LCICG), as the strategic body aligning low carbon innovation investments across the UK Government and regulated bodies (Ofgem). It plays a strategic role in aligning domestic and international clean tech investments across the UK Government.
The Board is currently chaired by the UK Government Chief Scientific Advisor and is attended by senior civil servants across BEIS, Innovate UK, Research Councils, Ministry of Housing, Communities and Local Government, Department for International Development, Department for Transport, Ofgem, and with the Treasury as observers. The Board is internal to the UK Government but is seeking external members with industry insights to provide external challenge. The Board meets on a regular basis to discuss a range of clean technology innovation topics.
127 Energy Innovation, https://www.gov.uk/guidance/energy-innovation 128 Energy innovation, https://www.gov.uk/guidance/energy-innovation

The UK’s draft National Energy and Climate Plan (NECP)
46
Prioritisation of UK energy research and innovation activity
The Energy Innovation Needs Assessment (EINA) project is a two-phased effort to develop a set of reports to provide evidence for the innovation needs of a range of clean energy technologies, and the systems and processes in which they are utilised. These reports will build on the evidence developed as part of the Technology Innovation Needs Assessment (TINA) project, conducted during the 2010-2015 Parliament. The objectives of the EINAs are:
• To create a methodology for conducting assessments of future innovation needs in a way that will produce comparable outputs across different technologies
• To facilitate efforts across government to identify strategic energy innovation areas for investment
• To analyse the role of technologies in the energy system
• To quantify the scale of the opportunity to UK and regions of:
o reducing technology costs
o expanding economic growth
• To help understand the uncertainty associated with the above estimates
The EINAs will assess themes such as power generation including bioenergy, carbon capture and storage, hydrogen, demand and supply of heating and transport.
Currently the methodology is being tested through a small-scale pilot of heating technologies and the objective of the pilot is to test the effectiveness of the methodology. If the methodology is deemed to be successful, the plan is to start producing evidence in 2019 with a view towards 2050.
In Scotland, the Energy Strategy emphasised the importance of attracting, retaining and developing low carbon innovators who will shape the future. Alongside the publication of the Scottish Energy Strategy in December 2017, the Scottish Government announced the creation of a £20 million Energy Investment Fund, building on the success of the Renewable Energy Investment Fund, and a £60 million Low Carbon Innovation Fund, to provide support for renewable and low carbon infrastructure over and above wider interventions to support innovation129. The programme aims to stimulate commercial interest and investment, maximising Scotland’s vast potential in the low carbon sector, building on the success of the Low Carbon Infrastructure Transition Programme (LCITP) which has allocated around £40 million to 16 low carbon capital projects since 2015. The invitation for the LCITP Low Carbon Innovation Fund launched in January 2018, seeking applications in three priority areas: Low Carbon Heat, Integrated Energy Systems and Ultra Low Emission Vehicle Infrastructure: 14 projects have now received offers of development support.
The energy sector in Wales has benefited considerably from European structural funds. The funding awarded includes building research capacity at Welsh universities, enabling collaborative research, development and demonstrators, and investment in renewables and marine energy development. During the period 2014-2018 over £60 million has been invested.
129 Low Carbon Infrastructure Transition Programme: https://www.gov.scot/policies/renewable-and-low-carbon-energy/low-carbon-infrastructure-transition-programme/

The UK’s draft National Energy and Climate Plan (NECP)
47
In addition, the Smart Living Programme works with local authorities to develop innovative demonstrators in Smart Living130. Examples of projects to receive EU funding include:
• FLEXIS131: World-leading energy research scheme, involving collaborations with industry and research organisations in Wales, Europe and around the world. FLEXIS investigates how multiple energy sources can be supplied to consumers through more flexible and efficient systems that integrate traditional and renewable energy sources.
• SPECIFIC132: Developing and delivering the first examples of buildings as power stations which are able to generate, store and release their own energy both thermal and electrical.
• Caerau Local Heat Scheme: Using underground mine-water to warm 150 homes in Caerau Bridgend. Water in the underground mine workings of the former Caerau colliery has been naturally heated by the earth, and will be harnessed using heat pump technology and a network of pipes as a geothermal source of energy.
• WaveSub: Enabling the design, manufacture and testing of a prototype Wave Energy Converter within the Haven Waterway Enterprise Zone.
ii Where available, national 2050 objectives related to the promotion of clean energy technologies and, where appropriate, national objectives including long term targets (2050) for deployment of low-carbon technologies, including for decarbonising energy- and carbon-intensive industrial sectors and, where applicable, for related carbon transport and storage infrastructure
The CGS includes three illustrative pathways to meeting our long-term target of reducing emissions by at least 80% relative to 1990 levels by 2050. These do not represent the most likely or preferred pathways to meeting the 2050 target, but show that the 2032 pathway would leave open a wide range of options for 2050 - different pathways within this range, and beyond this range, are also possible. The pathways explored are:
• An Electricity pathway - where all cars and vans are electric, four in five buildings use electric heating, electricity is the main low carbon energy source for the industry sector and around one in five buildings uses a largely low carbon district heat network.
• A Hydrogen pathway- where all cars and vans are fuelled by hydrogen, the majority of buildings use a hydrogen grid and CCUS captures and stores emissions.
• A Negative Emissions pathway- where negative emissions in the electricity sector create “headroom” for other sectors such as transport, buildings and agriculture to decarbonise more slowly.
The UK Government outlined its new approach to CCUS in the Clean Growth Strategy. It aims to ensure that the UK has the option of deploying CCUS at scale during the 2030s, subject to costs coming down sufficiently. To this end, the UK Government has set out actions under
130 Smart Living, Welsh Government website, July 2018: https://gov.wales/topics/businessandeconomy/creating-a-sustainable-economy/smart-living 131 Meeting the energy demands of the future: http://www.flexis.wales/ 132 Active Buildings website: http://specific.eu.com/

The UK’s draft National Energy and Climate Plan (NECP)
48
three themes: 1) Re-affirming our commitment to deploying CCUS in the UK subject to cost reduction, 2) innovation and 3) international collaboration.
Since the publication of the CGS, the UK Government has established a CCUS Council, co-chaired by the Minister of State for Energy and Clean Growth and Carbon Trust and Shell, with senior representatives from across the CCUS sector to review progress and priorities on CCUS. The UK Government also established a CCUS Cost Challenge Taskforce of over 50 representatives from the CCUS sector to provide advice on the steps needed to reduce the cost of deploying CCUS in the UK. The Taskforce presented its report to the UK Government in July 2018, setting out the industry’s view on how best to progress CCUS in the UK133. The UK Government has also begun work to review delivery and investment models for CCUS in the UK and continues to engage with ongoing initiatives in Teesside, Merseyside and Grangemouth to test the potential for development of CCUS industrial decarbonisation clusters. The UK Government has published a CCUS Action Plan134, setting out its view on the next steps which industry and government need to take to achieve the UK Government’s ambition of having the option to deploy CCUS at scale during the 2030s, subject to costs coming down sufficiently.
Since 2011 the UK Government has invested over £130 million in R&D and innovation support to develop CCUS in the UK. The Government is continuing this support by committing to spend up to £100 million from BEIS’s Energy Innovation Programme135 to support industry and CCUS innovation and deployment in the UK and in 2018 announced over £40 million of innovation support for CCUS to support cost reduction and the development of the technology.
The UK Government is committed to maintaining a leading position in global collaboration and capacity building on CCUS and to work internationally to drive down the cost and accelerate deployment of CCUS. In May 2018, the UK took on leadership (with Saudi Arabia and Mexico) of the Carbon Capture Challenge under Mission Innovation.
In November 2018, the UK together with the International Energy Agency hosted the first ever summit on Carbon Capture and Storage (CCUS), attended by 50 international leaders, CEOs of major energy companies, manufacturing businesses and finance firms136. The UK also announced it would be setting out an action plan to enable the development of the UK's first CCUS project at COP24 in December. The plan commits the UK to:
• next year setting out how to enable the UK’s first CCUS facility
• investing £20 million in supporting the construction of CCUS technologies at industrial sites across the UK, as part of £45 million commitment to innovation
• investing up to £315 million in decarbonising industry, including the potential to use CCUS
• beginning work with the Oil and Gas Authority, industry and the Crown Estate and Crown Estate Scotland to identify existing oil and gas infrastructure which could be transformed for CCUS projects
133Delivering clean growth: CCUS Cost Challenge Taskforce report: https://www.gov.uk/government/publications/delivering-clean-growth-ccus-cost-challenge-taskforce-report 134 The UK carbon capture usage and storage deployment pathway, November 2018 https://www.gov.uk/government/publications/the-uk-carbon-capture-usage-and-storage-ccus-deployment-pathway-an-action-plan 135 Funding for low carbon industry, January 2017: https://www.gov.uk/guidance/funding-for-low-carbon-industry 136 Press release: ‘Plan to enable first UK carbon capture project from the mid 2020s announced at world-first summit’, https://www.gov.uk/government/news/plan-to-enable-first-uk-carbon-capture-project-from-the-mid-2020s-announced-at-world-first-summit

The UK’s draft National Energy and Climate Plan (NECP)
49
The Scottish Energy Strategy sets two ambitious targets for 2030:
• The equivalent of 50% of Scotland’s heat, transport and electricity consumption to be met from renewable sources, and
• An increase of 30% in the productivity of our energy use across the Scottish economy.
The Scottish Government have also set interim targets for 100% of Scotland’s electricity and for 11% of Scotland’s non-electrical heat demand to come from renewable sources by 2020. And for a 12% reduction in energy consumption by 2020.
Like the CGS, the Scottish Energy Strategy is not prescriptive in setting out the pathway by which decarbonisation will ultimately be delivered – instead it offers two illustrative examples, a Hydrogen Future and an Electric Future, both of which are consistent with Scotland’s Climate Change targets. These are designed to aid the consideration of developments in the near-term, and the influence they may have on the eventual shape of the system.
In terms of low carbon and renewable transport, the Scottish Government have committed to phasing out the need for new petrol and diesel cars and vans by 2032, through expanding the electric charging infrastructure in Scotland, accelerating the procurement of ultra-low emission vehicles (ULEV) in the public and private sectors, and introducing large scale pilots to remove barriers to and encourage private motorists to use ULEVs.
iii Where applicable, national objectives with regard to competitiveness
Public investment in economic infrastructure will have doubled in a decade by 2022-2023. This investment will be delivered through a strengthened institutional framework, with longer-term budgets, the advice of the National Infrastructure Commission, an increased focus on the effective delivery of projects in departments, and five-year capital investment programmes for road, rail, water and flooding.
The UK Government will take a more strategic approach to our investment in the design of relevant markets, focusing on three principles. We will:
• Invest in ways that support all the objectives of the Industrial Strategy: increasing innovation, developing skills, growing business, and driving productivity and earning power in urban and rural locations across the UK;
• Take greater account of disparities in productivity and economic opportunity between different parts of the UK, ensuring our investments drive growth across all regions of the UK; and
• Invest to increase UK competitiveness in relation to long-term global economic changes, such as the shift to clean growth. These will be positive choices that enable the UK economy to flourish in the context of these transformational changes.
Innovation in clean growth will be important for low cost, low carbon infrastructure systems, as well as for realising industrial opportunities. We will increase support for clean growth innovation by making this a strategic priority for the Industrial Strategy Challenge Fund.
This will build on the more than £2.5 billion of government investment in low carbon innovation by 2021 set out in the CGS137. In addition to the Faraday Challenge for battery technology, the 137 Clean Growth Strategy, 2017: https://www.gov.uk/government/uploads/system/uploads/attachment_data/file/700496/clean-growth-strategy-correction-april-2018.pdf

The UK’s draft National Energy and Climate Plan (NECP)
50
UK Government has announced three new Industrial Strategy programmes in Clean Growth across energy, construction and agriculture. We will continue to build our international partnerships in clean growth research and innovation: the UK is a proud member of Mission Innovation – a global initiative that aims to reinvigorate and accelerate the global clean energy revolution. We will strengthen support to commercialise new clean technologies through our investments in patient capital, beginning with a new equity fund for which we will provide up to £20 million.
We will use all the government tools available to support innovation in a low carbon economy including market design, taxation and regulation. We will also aim to accelerate private investment and promote market growth.
We will promote overseas investment in the UK’s clean economy and strengthen our support for UK exporters through better identification of overseas opportunities, industry briefings, overseas missions, pavilions at key international events and campaigns for sectors and industries that are delivering clean growth. We will also promote the UK’s exceptional expertise through the Green is GREAT campaign to amplify the UK’s global reputation for excellence in this area138.
In Scotland the Energy Strategy highlights the huge economic opportunity that the transition to a low carbon economy presents. Scotland has a well-established oil and gas sector, a proud engineering heritage and enviable natural resources, which has provided the platform for the recent growth in renewable energy deployment. Building on these strengths will help the UK as a whole to create a modern, integrated, low carbon energy system, and support the delivery of the ambitions and priorities set out in Scotland’s Economic Strategy. Scotland’s rich energy history and expertise will support greater internationalisation by strengthening renewable supply chains and research dissemination. The Scottish Government is committed to building on Scotland’s international reputation for excellence in energy, and to forging collaborative partnerships with other countries.
138 Industrial Strategy, 2017: https://www.gov.uk/government/uploads/system/uploads/attachment_data/file/730043/industrial-strategy-white-paper-print-ready-a4-version.pdf

The UK’s draft National Energy and Climate Plan (NECP)
51
3. POLICIES AND MEASURES
3.1 Dimension Decarbonisation
3.1.1 GHG emissions and removals
i Policies and measures to achieve the target set under Regulation (EU) 2018/842 as referred in point 2.1.1 and policies and measures to comply with Regulation (EU) 2018/841, covering all key emitting sectors and sectors for the enhancement of removals, with an outlook to the long-term vision and goal to become a low emission economy and achieving a balance between emissions and removals in accordance with the Paris Agreement
ii Where relevant, regional cooperation in this area
iii Without prejudice to the applicability of state aid rules, financing measures, including Union support and the use of Union funds, in this area at national level, where applicable
The UK has a significant package of policies and measures to meet its targets. Many of the policies described cross different sectors and involve a number of delivery mechanisms.
Figure 8 below was published in the UK’s 7th National Communication in December 2017139 and summarises these policies, some of which have been updated. Not all of these policies apply across all of the Devolved Administrations.
In Scotland, the policies and proposals for meeting statutory emissions reduction targets are set out in the Scottish Government’s Climate Change Plan140 published in February 2018, and the Energy Strategy141 published December 2017. The specific policies and proposals that apply to Scotland are therefore not listed below but can be accessed through these documents.
The Welsh Government’s Low Carbon Delivery Plan is due to be published in March 2019, and will set out policies and proposals for meeting the first Welsh carbon budget (2016-2020).
139 Seventh National Communication – Annex I, https://unfccc.int/node/28527 140 Climate Change Plan: third report on proposals and policies 2018-2032 (RPP3): https://www.gov.scot/publications/scottish-governments-climate-change-plan-third-report-proposals-policies-2018/ 141 Scottish Energy Strategy: The Future of Energy in Scotland, 2017 https://www2.gov.scot/Resource/0052/00529523.pdf

The UK’s draft National Energy and Climate Plan (NECP)
52
Figure 8: Summary of the UK’s policies outlined in the UK’s 7th National Communication Energy supply
Policy name Status Type of measure
Impacting traded or non-traded sectors
Climate Change Levy (CCL) 2001 (Implemented) Economic, Regulatory EU ETS, ESR
The Climate Change Levy (CCL) was introduced in 2001. It is levied on the supply of energy to business and public sector consumers. Each of the four main groups of taxable commodities (electricity, gas, solid fuels, and liquefied petroleum gas [LPG]) has its own main rate per unit of energy. The main rates of the CCL are intended to incentivise businesses to reduce their energy consumption. Eligible energy-intensive industries may pay reduced main rates of CCL through CCAs, or be exempt from the CCL for mineralogical/metallurgical processes.
Renewables Obligation 2002-2017 (Implemented) Regulatory, Economic EU ETS, ESR
Sets an annual obligation on electricity suppliers to source a proportion of their generation from renewable sources. The RO closed to new applicants on 31 March 2017. NIRO in Northern Ireland was introduced in 2005 and closed to new applications on 31 March 2017.
EU Emissions Trading System 2005 (Implemented) Economic EU ETS, ESR
It sets an emissions target (cap) for installations covered by the system (across the EU), with the carbon market determining the carbon price, and therefore where emissions can be reduced most cheaply. It guarantees that total emissions in the sectors covered will not exceed the cap set, and in doing so drives investments in low-carbon technologies, leading to cutting emissions of carbon dioxide (CO2) and other greenhouse gases at least cost. Large Combustion Plant Directive 2007 (Expired) Regulatory EU ETS, ESR The Large Combustion Plant Directive (LCPD, 2001/80/EC) sets limits on emissions of sulphur dioxide, nitrogen oxides, and dust from combustion plants with a thermal capacity of 50 MW or greater. Has now been replaced by the Industrial Emissions Directive. Additional renewables in generation (Renewable Energy Strategy)
2009 (Implemented) Regulatory, Economic EU ETS, ESR
Increases Renewable Obligation (RO) targets in electricity supply so as meet the UK’s overall renewables target for 2020 as set out in the Renewables Directive (RED, 2009/28/EC).
Feed in Tariffs (FITS) (GB only) 2010-2019 (Implemented) Regulatory, Economic EU ETS, ESR
Feed-in Tariffs (FITs) support organisations, businesses, communities and individuals to generate low-carbon electricity using small-scale (5 MW or less total installed capacity) systems. Electricity suppliers are obliged to pay the regulated tariffs to eligible generators.
Carbon Price Floor 2013 (Implemented) Economic EU ETS, ESR
The Carbon Price Floor (CPF) is designed to further reduce the use of emission-intensive fossil fuels and increase the proportion of electricity generation and supply from low carbon sources Contract for Difference (CfD) (2014-2020) (GB only)
2014-2020 (Implemented) Economic EU ETS, ESR
Offers Contracts for Difference (CfDs) in the electricity generation market for low carbon and renewable sources, CfDs will replace Renewable Obligation Certificates (ROCs) which are due to be phased out from 2017. Current policy offers CfD for new capacity through auctions. Industrial Emissions Directive (as it applies to Large Combustion Plant) 2016 (Adopted) Regulatory EU ETS, ESR As transposed into UK law, the IED replaced the LCPD from 1 January 2016 with similar although more stringent provisions set out in chapter III of the Industrial Emissions Directive (2010/75/EU) (IED). Those provisions already apply in respect to any plant newly permitted since 7 January 2013. Three compliance routes were available to generating plants; to abate emissions and comply with more stringent limits by 2020; to comply with less stringent limits but face a 1,500 hour per year load factor constrain; or to close by 2023.

The UK’s draft National Energy and Climate Plan (NECP)
53
Capacity Mechanism 2014 (Currently suspended) Economic EU ETS, ESR
Part of the UK Government’s Electricity Market Reform package, the Capacity Market ensures that sufficient capacity is available to meet peak demand, encouraging construction and use of new low carbon generation capacity. CCL Budget 2016 Changes 2019 (Adopted) Economic, Regulatory EU ETS, ESR Budget 2016 announced that CCL rates will increase from April 2019, moving to an electricity-to-gas ratio of 2.5:1 compared to the previous 2.9:1 ratio. In the longer term, the UK Government intends to rebalance the rates further, reaching a ratio of 1:1 by 2025. The changes in CCL between 2019 and 2021 were announced in the Budget 2018, but the rates from 2021 onwards, have not yet been announced.
Contract for Difference (CfD) (2021-2035) 2021-2035 (Planned) Economic EU ETS, ESR
Planned continuation of Contracts for Difference (CfDs) for new low carbon capacity after 2020. Energy consumption across homes, business & public sector
Policy name Status Type of measure
Impacting traded or non-traded sectors
Carbon Trust measures 2002-2012 (Expired) Information, Education EU ETS, ESR
The Carbon Trust provides a range of measures from general advice to in-depth consultancy and accreditation, to reduce emissions and save energy and money to businesses and public sector organisations of all sizes.
Building Regulations Part L (2002+2005/6) 2002 (Implemented) Regulatory EU ETS, ESR
Building Regulations set minimum energy performance standards for new buildings and when people carry out controlled ‘building work’ to existing properties including extensions, conversions and certain categories of renovation and replacement windows and boilers. Small and Medium Enterprises (SME) Loans
2004-2012 (Expired) Economic EU ETS, ESR
The Carbon Trust provided interest free loans of £3,000 - £400,000 for small and medium sized businesses to invest in energy efficiency equipment and renewable technologies. These loans were designed so that in most cases the forecast reduction in energy costs would be similar to the total repayment amount. Energy Performance of Buildings Directive (EPBD) 2007 (Expired)
Regulatory, Information EU ETS, ESR
Energy Performance Certificates (EPCs) are required when any building is sold, rented out or constructed, and after refurbishment when construction work is undertaken to a building and the modifications change the number of parts designed or altered for separate use and include the provision or extension of any fixed services for heating, hot water, air-conditioning and mechanical ventilation. EPCs give information on a building's energy efficiency in a sliding scale from 'A' (very efficient) to 'G' (least efficient). Products Policy (Implemented)
2008 (Implemented) Regulatory EU ETS, ESR
The EU Ecodesign Directive and the Energy Labelling Framework Regulation respectively operate by setting minimum performance and information requirements for energy using products placed to take the least efficient products off the market and to give consumers clear information to make informed purchasing decisions. This is implemented through product specific EU regulations.
CRC Energy Efficiency Scheme 2010 (Implemented) Economic, Information EU ETS, ESR
The CRC Energy Efficiency Scheme is a mandatory UK-wide emissions trading scheme (launched in 2010). It encourages the uptake of energy efficiency measures in large non-energy intensive private and public sector organisations that use energy not covered by the EU ETS or Climate Change Agreements. It covers around 5000 medium and large users of energy across the business and public sector. The scheme is split into phases. Phase 1 ran from 1 April 2010 until 31 March 2014. Phase 2 covers emissions from 1 April 2014 until 31 March 2019. In the 2016 Spring Budget, the Chancellor announced there would be no further sales of CRC allowances after Phase 2 (i.e. following the 2018/19 compliance year) and legislation was laid in July 2018 to close the scheme after Phase 2. From April 2019, the CCL will be increased to recover the revenue forgone from CRC allowances and a new streamlined energy and carbon reporting framework for quoted companies of all sizes and large unquoted companies and large Limited Liability Partnerships will come into force UJ-wide.
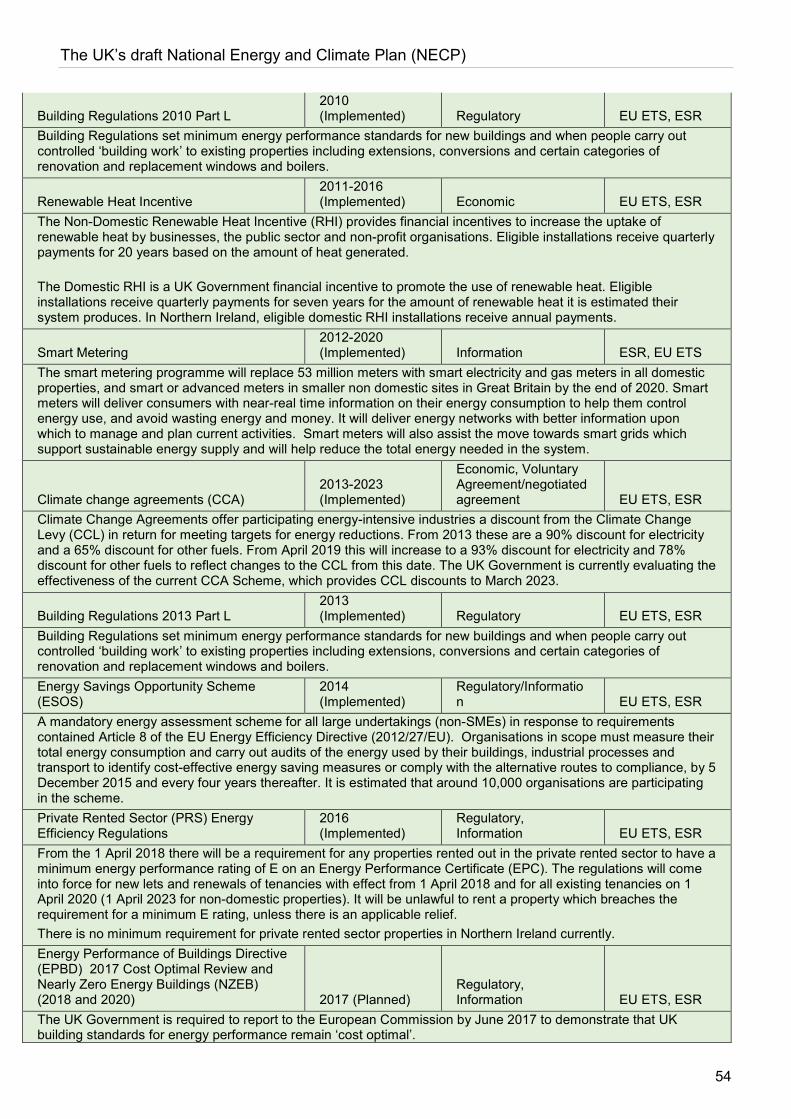
The UK’s draft National Energy and Climate Plan (NECP)
54
Building Regulations 2010 Part L 2010 (Implemented) Regulatory EU ETS, ESR
Building Regulations set minimum energy performance standards for new buildings and when people carry out controlled ‘building work’ to existing properties including extensions, conversions and certain categories of renovation and replacement windows and boilers.
Renewable Heat Incentive 2011-2016 (Implemented) Economic EU ETS, ESR
The Non-Domestic Renewable Heat Incentive (RHI) provides financial incentives to increase the uptake of renewable heat by businesses, the public sector and non-profit organisations. Eligible installations receive quarterly payments for 20 years based on the amount of heat generated. The Domestic RHI is a UK Government financial incentive to promote the use of renewable heat. Eligible installations receive quarterly payments for seven years for the amount of renewable heat it is estimated their system produces. In Northern Ireland, eligible domestic RHI installations receive annual payments.
Smart Metering 2012-2020 (Implemented) Information ESR, EU ETS
The smart metering programme will replace 53 million meters with smart electricity and gas meters in all domestic properties, and smart or advanced meters in smaller non domestic sites in Great Britain by the end of 2020. Smart meters will deliver consumers with near-real time information on their energy consumption to help them control energy use, and avoid wasting energy and money. It will deliver energy networks with better information upon which to manage and plan current activities. Smart meters will also assist the move towards smart grids which support sustainable energy supply and will help reduce the total energy needed in the system.
Climate change agreements (CCA) 2013-2023 (Implemented)
Economic, Voluntary Agreement/negotiated agreement EU ETS, ESR
Climate Change Agreements offer participating energy-intensive industries a discount from the Climate Change Levy (CCL) in return for meeting targets for energy reductions. From 2013 these are a 90% discount for electricity and a 65% discount for other fuels. From April 2019 this will increase to a 93% discount for electricity and 78% discount for other fuels to reflect changes to the CCL from this date. The UK Government is currently evaluating the effectiveness of the current CCA Scheme, which provides CCL discounts to March 2023.
Building Regulations 2013 Part L 2013 (Implemented) Regulatory EU ETS, ESR
Building Regulations set minimum energy performance standards for new buildings and when people carry out controlled ‘building work’ to existing properties including extensions, conversions and certain categories of renovation and replacement windows and boilers. Energy Savings Opportunity Scheme (ESOS)
2014 (Implemented)
Regulatory/Information EU ETS, ESR
A mandatory energy assessment scheme for all large undertakings (non-SMEs) in response to requirements contained Article 8 of the EU Energy Efficiency Directive (2012/27/EU). Organisations in scope must measure their total energy consumption and carry out audits of the energy used by their buildings, industrial processes and transport to identify cost-effective energy saving measures or comply with the alternative routes to compliance, by 5 December 2015 and every four years thereafter. It is estimated that around 10,000 organisations are participating in the scheme. Private Rented Sector (PRS) Energy Efficiency Regulations
2016 (Implemented)
Regulatory, Information EU ETS, ESR
From the 1 April 2018 there will be a requirement for any properties rented out in the private rented sector to have a minimum energy performance rating of E on an Energy Performance Certificate (EPC). The regulations will come into force for new lets and renewals of tenancies with effect from 1 April 2018 and for all existing tenancies on 1 April 2020 (1 April 2023 for non-domestic properties). It will be unlawful to rent a property which breaches the requirement for a minimum E rating, unless there is an applicable relief. There is no minimum requirement for private rented sector properties in Northern Ireland currently. Energy Performance of Buildings Directive (EPBD) 2017 Cost Optimal Review and Nearly Zero Energy Buildings (NZEB) (2018 and 2020) 2017 (Planned)
Regulatory, Information EU ETS, ESR
The UK Government is required to report to the European Commission by June 2017 to demonstrate that UK building standards for energy performance remain ‘cost optimal’.

The UK’s draft National Energy and Climate Plan (NECP)
55
Cost-optimal energy performance means that the lifetime cost-benefit analysis is positive. Minimum energy performance requirements must be compared against calculated cost-optimal levels using the Comparative Methodology Framework. Products Policy 2017 (Adopted) Regulatory EU ETS, ESR The EU Ecodesign Directive and the Energy Labelling Framework Regulation respectively operate by setting minimum performance and information requirements for energy using products placed to take the least efficient products off the market and to give consumers clear information to make informed purchasing decisions. This is implemented through product specific EU regulations. Renewable heat incentive (planned funding)
2017-2021 (Planned) Economic EU ETS, ESR
The Non-Domestic Renewable Heat Incentive (RHI) provides financial incentives to increase the uptake of renewable heat by businesses, the public sector and non-profit organisations. Eligible installations receive quarterly payments for 20 years based on the amount of heat generated. The Domestic RHI is a government financial incentive to promote the use of renewable heat. Eligible installations receive quarterly payments for seven years for the amount of renewable heat it is estimated their system produces. The domestic and non-domestic RHI in Northern Ireland were suspended to new applicants on 29 February 2016. Amendments to Heat Networks Metering & Billing Regulations (2014) 2017 (Planned) Regulatory EU ETS, ESR UK legislation requiring heat network operators to submit data on networks and to install heat meters/heat cost allocators in buildings on networks unless it is not cost-effective to do so. The amendments will revise the cost-effectiveness methodology and address ambiguities in the existing legislation. Public Sector Energy Efficiency Loans Scheme
2004-2015 (Implemented) Economic EU ETS, ESR
The Public Sector Energy Efficiency Loans Scheme, managed by Salix Finance Ltd, provides interest-free loans in England to public sector organisations for energy efficiency schemes. These loans are intended to provide the capital cost of energy efficiency retrofit work and other measures to be installed. These loans have a payback period of five years (eight for schools) during which the repayments are met with the energy bill savings from the energy efficiency measures. Thus, once the loan has been paid off, the organisations continue to benefit from energy savings for the lifetime of these measures. This funding is then recycled once it has been returned to the Scheme and once again loaned out. BEIS provides the most amount of funding to the Scheme but there is also some funding from Scotland, Wales and the Department for Education. Wales will have invested approximately £80 million in public sector energy efficiency and renewable energy projects by 2020. The loans are further supported by the provision of expert technical, commercial and financial expertise through the Welsh Government Energy Service. The service has enabled £55 million of zero-interest loans across the public sector in Wales between 2016 and 2018 and also supported the delivery of a further £27.5 million of energy and energy efficiency projects, where finance was secured from alternative routes. The projects supported will realise savings of £183 million for the public sector over the life of the installed technologies and also reduce carbon emissions by 820,000 tonnes 142. Energy Performance of Buildings Directive (EPBD) Recast 2010 2015 (Adopted)
Regulatory, Information EU ETS, ESR
Extension of the EPBD requirement for public buildings to display Energy Performance Certificates to include buildings over 250m2 from 9 July 2015.
Warm Front 2000-2013 (Expired) Economic EU ETS, ESR
Warm Front installed heating and insulation measures to make homes warmer and more energy efficient for private sector households in England vulnerable to fuel poverty. The scheme offered a package of heating and insulation measures of up to £3,500 (or £6,000 where oil central heating or other alternative technologies are recommended). EEC1, EEC2 (2002- 2008) & Baseline Carbon Emissions Reductions Target (CERT) (2008-2010)
2002-2009 (Expired) Regulatory EU ETS, ESR
Energy Efficiency Commitment I (EEC I): GB wide regulation that required all electricity and gas suppliers with 15,000 or more domestic customers to achieve a combined energy saving of 62 TWh by 2005 by incentivising their customers to install energy-efficiency measures in homes. EEC II - energy suppliers with more than 50,000 domestic customers required to deliver a total of 130 TWh lifetime energy use reductions in GB households, primarily through the promotion of energy efficiency measures. Carbon Emission Reduction Target (CERT) – GB regulation that required all domestic energy suppliers with a
142 Written Statement - Increasing the Scale and Rate of Residential Energy Efficiency Retrofit in Wales, November 2017, https://gov.wales/about/cabinet/cabinetstatements/2017/energyretrofits/?lang=en

The UK’s draft National Energy and Climate Plan (NECP)
56
customer base in excess of 50,000 domestic customers to make savings in the amount of CO2 emitted by householders. Community Energy Saving Programme (CESP)
2009-2012 (Expired) Regulatory ESR, EU ETS
Community Energy Saving Programme (CESP) - area based regulation that targeted households across Great Britain, in areas of low income, to improve energy efficiency standards, and reduce fuel bills. CESP was funded by an obligation on larger energy suppliers and also the larger, electricity generators. Carbon Emissions Reduction Target (CERT) Uplift and Extension (2010-2012)
2010-2013 (Expired) Regulatory EU ETS, ESR
CERT extension - increased the targets originally set under CERT by 20% and required domestic energy suppliers with a customer base in excess of 50,000 (later increased to 250,000) to make savings in the amount of CO2 emitted by householders. The extension also refocused subsidy towards insulation measures and away from electricity saving measures such as low energy lighting - and introduced a super priority group (households in receipt of certain means-tested benefits) to make energy reductions in low income and vulnerable households.
Energy Company Obligation 1 and 2 2013 -2017 (Expired) Economic, Regulatory EU ETS, ESR
The Energy Company Obligation (ECO) is a statutory obligation on energy suppliers with over 250,000 domestic customers and delivering over a certain amount of electricity or gas to make reductions in carbon emissions or achieve heating cost savings in domestic households. ECO focuses on insulation measures, and also heating improvements to low income and vulnerable households. It ran until March 2017. ECO initially ran to March 2015 (also known as ‘ECO1’) and was extended in April 2014 to March 2017 (‘ECO2’).
Heat Networks Investment Project 2017-2021 (Adopted) Economic EU ETS, ESR
The Heat Networks Investment Project (HNIP) capital investment programme is expected to support up to 200 projects by 2021 through grants and loans and other mechanisms and to lever in up to wider investment, reducing bills, cutting carbon and forming a key part of wider urban regeneration in many locations.
Energy Company Obligation 2 Extension 2017-2018 (Implemented) Economic, Regulatory EU ETS, ESR
The 2015 Spending Review announced that ECO will be replaced with a new, lower cost scheme that will run for 5 years (April 2017 to March 2022) and will tackle the root causes of fuel poverty. The 5 year extension will take place in two phases, with the ECO 2 Extension (April 2017 - September 2018) acting as a bridge between the expired ECO scheme and the new fuel poverty focused scheme, ECO 3, which will run from autumn 2018 to March 2022.
Energy Company Obligation 3 2018 -2022 (Implemented) Economic, Regulatory ESR
The 2015 Spending Review announced that ECO will be replaced with a new, lower cost scheme that will run for 5 years (April 2017 to March 2022) and will tackle the root causes of fuel poverty. The 5 year extension will take place in the two phases, with the ECO Extension (April 2017 - Sept 2018) acting as a bridge between the expired ECO scheme and the new fuel poverty focussed scheme, ECO 3, which will run from autumn 2018 to March 2022. Transport
Policy name Status Type of measure
Impacting traded or non-traded sectors
PSV Fuel Efficiency Policies 2006/07-2019 (Implemented)
Regulatory, Information, Voluntary Agreement ESR
The Green Bus Fund (GBF) allowed bus companies and local authorities in England to compete for funds to help them buy new low carbon emission buses. The four rounds of the fund, which ran from 2009- 2014, added around 1250 Low Carbon Emission Buses onto England's roads. The GBF was replaced in 2015 by the Low Emission Bus Fund (LEBS) which offered £30m for bus operators and local authorities across England and Wales to bid for low emission buses and supporting infrastructure. This scheme funding was open from 2016-2019 and the successful bidders were announced in July 2016, adding more than 300 extra low emission buses to fleets. In Autumn 2016, a further £100m was announced to increase the amount of low emission buses on the road. £11.1m was used to fund those who narrowly missed out on LEBS funding, and £48m formed the Ultra-Low Emission Bus Scheme which was launched in March 2018. Winners of this scheme will be announced by the end of 2018. The remaining funding formed the Clean Bus Technology Fund, which was used to fund retrofitting solutions for existing bus fleets to a minimum Euro VI standard, and the winners of this fund was announced in February 2018. This was in addition to the previous £27m of Clean Bus Technology Fund rounds in 2013 and 2015. There was also a £5m Clean

The UK’s draft National Energy and Climate Plan (NECP)
57
Vehicle Technology Fund in 2014. These funding schemes have contributed to an extra 5000 low emission buses on the road143. Renewable Transport Fuel Obligation, (RTFO)
2007 - 2032 (Implemented) Regulatory ESR
The RTFO sets phased targets for biofuel use by diesel and petrol suppliers to be achieved by 2020 and on to 2032. Targets are by volume rather than by energy. Implements the EU Renewables Energy Directive (2009/28/EC) and ILUC Directive (EU) 2015/1513. Advanced Biofuel Demonstration Competition 2014-2018 Economic ESR The Advanced Biofuel Demonstration Competition made available £15.6 million to enable the construction of two demonstration-scale advanced biofuel plants
Local Sustainable Transport Fund 2011-2016 (Implemented) Economic ESR
£600m of capital and revenue funding between 2011 and 2015 to support sustainable travel investments by local government. The projects include promoting public transport, encouraging uptake of cycling and walking, and raising awareness of the alternative transport modes available to commuters and residents Awards were made through competitive bidding processes. Since then central government has made an additional Local Sustainable Transport Fund revenue funding of £65m (2015/16) and Access Fund £20m (p.a. 2016/17 to 2019/20) available for similar schemes144.
Car Fuel Efficiency Policies 2012 (Implemented)
Regulatory, Information, Voluntary Agreement EU ETS, ESR
EC Regulation 443/2009 sets fuel efficiency targets for new cars to be achieved by 2015 and 2020. The regulation translates a fleet average CO2 tailpipe emissions target for new vehicles sold into the EU market into specific targets for individual manufacturers according to the mass of their fleet. Heavy fines are imposed for non-compliance. The 2021 target is for a fleet average of 95g CO2/km across the single market, with a transition period where 95% of a manufacturer’s fleet must meet the 95g target by 2020. Complementary measures are a collection of technologies that could improve 'real world' fuel efficiency of cars which wouldn't be fully captured in new car CO2 target and could improve fuel efficiency within the existing fleet. These include gear shift indicators, tyre pressure monitoring systems more efficient mobile air-conditioning and low rolling resistance tyres. EC Regulation 661/2009 sets minimum requirements and introduce labelling for the rolling resistance, wet grip and external rolling noise of tyres. Measures to support the uptake of ultra low emission vehicles include the Plug-in Car and Plug-in Van Grants towards ultra-low emission vehicle (ULEV) cars and vans, as well as various tax incentives including lower rates for Vehicle Excise Duty and Company Car Tax. EV infrastructure is directly supported through the Workplace Charging Scheme grants for EV charge points for employees and fleets, the Electric Vehicle Home charge Scheme grants towards home EV charge points and the On-street Residential Charging Scheme. Highways England have committed £15 million to ensure EV charge points are available every 20 miles(32.2km) on the Strategic Road Network.
Van Fuel Efficiency Policies 2012 (Implemented)
Regulatory, Information, Voluntary Agreement ESR
EC Regulation 510/2011 sets fuel efficiency targets for new Light Commercial Vehicles (LCV) to be achieved by 2017 and 2020. EC Regulation 661/2009 sets minimum requirements and introduces labelling for the rolling resistance, wet grip and external rolling noise of tyres. The regulation translates a fleet average CO2 tailpipe emissions target for new vehicles sold into the EU market into specific targets for individual manufacturers according to the mass of their fleet. Heavy fines are imposed for non-compliance. The 2020 target is for a fleet average of 147g CO2 /km and represents a reduction of 19% from the 2012 average. Measures include the Plug-in Car and Plug-in Van Grants towards ultra-low emission vehicle (ULEV) cars and vans, as well as various tax incentives including lower rates for Vehicle Excise Duty and Company Car Tax. EV
143 Renewable transport fuel obligations order: government response (2017), https://www.gov.uk/government/publications/renewable-transport-fuel-obligations-order-government-response 144 Government response to call for evidence: Cycling and walking Investment Strategy (Safety Review) https://assets.publishing.service.gov.uk/government/uploads/system/uploads/attachment_data/file/758519/cycling-walking-investment-strategy-safety-review.pdf

The UK’s draft National Energy and Climate Plan (NECP)
58
infrastructure is directly supported through the Workplace Charging Scheme grants for EV charge points for employees and fleets, the Electric Vehicle Home charge Scheme grants towards home EV charge points and the On-street Residential Charging Scheme. Highways England have committed £15 million to ensure EV charge points are available every 20 miles (32.2km) on the Strategic Road Network.
HGV Fuel Efficiency Policies 2012 (Implemented)
Regulatory, Information, Voluntary Agreement ESR
EC Regulation 661/2009 sets minimum requirements and introduces labelling for the rolling resistance, wet grip and external rolling noise of tyres. Industry and government are taking a range of actions to reduce freight emissions, including the Freight Transport Association's Logistics Carbon Reduction Scheme, which encourages members to record, report and reduce emissions from freight. The Mode Shift Revenue Support scheme encourages modal shift from road to rail or inland waterway where the costs are higher than road, and where there are environmental benefits to be gained. It currently helps to remove around 800,000 lorry journeys a year from Britain's roads. A similar scheme, Waterborne Freight Grant, can provide assistance with the operating costs associated with coastal or short sea shipping.
HGV natural gas policy 2012 (Implemented) Economic, Research ESR
The UK Government has implemented measures to encourage alternatively fuelled HGVs including through reduced fuel duty rates for road fuel gases and increasing rewards for renewable gaseous fuels under the Renewable Transport Fuel Obligation. The UK Government has helped operators establish and run fleets of alternatively fuelled HGVs through the Low Carbon Truck Trial. £11.3 million funding has been provided, via competition, to part fund and test around 370 commercial vehicles, with most using a gas or dual fuel system (diesel and gas), and to develop refuelling infrastructure. Savings for this policy are captured within HGV fuel efficiency policies.
Rail Electrification 2013-2019 (Implemented) Economic EU ETS, ESR
Programme of rail electrification underway to replace older diesel trains with modern, low-emission electric or bi-mode trains 145. Future Fuels for Flight and Freight Competition
2018-2021 (Adopted) Economic ESR
The Future Fuels for Flight and Freight Competition makes £22 million of funding available to projects that will produce low carbon waste-based fuels to be used in aviation and freight. Industrial processes
Policy name Status Type of measure
Impacting traded or non-traded sectors
Ozone Depleting Substances Regulation 2001 (Implemented ) Regulatory ESR
This regulation implements obligations under the Montreal Protocol and EU Regulations (2037/2000/ EC and 1005/2009/EC) on ozone depleting substances. With the exemption of some critical use exemptions, CFCs and halon use is banned and HCFC use was banned from 2015. Most ozone depleting substances are potent greenhouse gases, so reductions in their use both protects the ozone layer and provides some GHG emissions mitigation.
Fluorinated GHG Regulation 2007 (Implemented) Regulatory ESR, EU ETS
Control (containment, prevention and reduction) of F-gas emissions through recovery, leak reduction and repair and some very limited use bans. Mandatory certification requirements to work with F gases. F-gas regulation 2014 2015 (Adopted) Regulatory ESR Introduced an 80% phase down in the quantities of F gases that can be placed on the EU market delivered via a gradually reducing quota system; a number of bans on the use of certain F gases in some new equipment; a ban
145 DfT Rolling Stock Perspective, Third Edition (2017). Section 6.5 Sustainable Development Principles.

The UK’s draft National Energy and Climate Plan (NECP)
59
on the use of very high GWP HFCs for the servicing of certain types of refrigeration equipment; some strengthening of obligations in 2006 Regulation related to leak checking, repairs, F gas recovery and technician training. Waste, Agriculture, Land Use and Forestry
Policy name Status Type of measure
Impacting traded or non-traded sectors
Waste measures
Various (earliest 1996) (Implemented ) Fiscal, regulatory ESR
There are a number of waste measures with the aim of increasing recycling/reuse and reduce harmful disposal. The Waste Framework Directive (2008/98/EC): is the general framework of waste management requirements and sets rules governing the separate collection of waste. The Landfill Directive (1999/31/EC): sets rules governing the disposal of waste to landfill, The UK Landfill Tax: a tax on waste sent to landfill. There are other waste measures targeting other waste streams, such as the Waste Incineration Directive (2000/76/EC). The overall effect is reducing environmental impacts of waste, such as landfilling biodegradable waste and its associated CH4 emissions. Environmental Stewardship (Entry Level Schemes and Higher Level Stewardship)
2005 (Implemented) Economic ESR
Provides income foregone support under Pillar 2 of the Common Agricultural Policy (CAP) for farmers to undertake management options that benefit biodiversity, resource protection and water quality.
Catchment Sensitive Farming 2006 (Implemented) Economic, information ESR
Delivers practical solutions and targeted support to enable farmers and land managers to take voluntary action to reduce diffuse water pollution from agriculture to protect water bodies and the environment.
Soils For Profit 2009-2013 (Expired) Education ESR
Provides on farm reviews and training on soils manures and nutrients. The programme closed in 2013.
Agricultural Action Plan 2010-2022 (Implemented)
Voluntary Agreement, Information, Education ESR
Range of resource-efficient and land management measures to reduce emissions to meet UK carbon budgets.
Nitrates Action Plan 2013 (Implemented)
Regulatory, Information ESR
Improved compliance with the Nitrate Directive (91/676/EEC). Designated revised "Nitrate Vulnerable Zones" (NVC); established a range of mandatory measures to reduce nitrate pollution to water in NVC. Also Code of Good Practice outside NVZs.
Agri- Tech Strategy 2014 (Implemented) Economic ESR
Co-funded by industry and addressing industry priorities. Funding is split been projects - “the Agri-Tech Catalyst” – and new Centres of Agricultural Innovation. These technologies can contribute to agricultural efficiency and reduce GHG emissions.
CAP Cross Compliance 2015 (Implemented) Regulatory LULUCF
• Good Agricultural and Environmental Conditions in place to ensure minimum soil cover, to maintain soil organic matter and to minimise erosion. • Implementation of the Nitrates Directive. • Retention of permanent pasture (up to 2014 – now under Greening measures). Common Agricultural Policy (CAP) Greening
2015 (Implemented) Regulatory LULUCF
• Obtain consent before improving grassland that has not been cultivated for 15 years or more (Environmental Impact Assessment/EIA). • Select a range of Ecological Focus Area (EFA) measures to meet new standards: relevant actions include enhanced buffer strips, cover crops and growing N-fixing crops. • In Wales consent must be obtained to improve grassland that has less than 25% rye grass. • In Wales under Common Agricultural Policy (CAP) Greening, farmers can select a number of relevant EFA measures including, fallow land, short rotation coppice and nitrogen fixing crops.

The UK’s draft National Energy and Climate Plan (NECP)
60
• In Northern Ireland, under CAP Greening, farmers can select a number of relevant EFA measures including, landscape features, fallow land, agro-forestry, short rotational coppice and nitrogen fixing crops. Forestry Act, Felling Licence Regulations and Environmental Impact (Forestry) regulations
1999 (Implemented) Regulatory LULUCF
Strong regulatory framework that controls felling, only allows deforestation for purposes of nature conservation and prevents afforestation of deep peat. Legislation updated 1999.
Rural Development Programme 2007-2020 (Implemented) Economic LULUCF
Woodland creation grants provided through EU co-financed Rural Development Programmes in all four countries of the UK.
Woodland Carbon Code 2011 (Implemented)
Voluntary Agreement, Information LULUCF
Woodland Carbon Code (UK coverage): voluntary standard for forest carbon projects to attract private finance to woodland expansion.
Wood fuel Implementation Plan 2011-2014 (Expired)
Information, Education, Economic LULUCF
Initiative to develop supply chains, including through support for harvesting/processing and woodland access, to increase wood fuel supply from existing woodland.
Grown in Britain 2013 (Implemented)
Voluntary Agreement, Information, Education LULUCF
Industry-led action plan announced in the UK Government's Forestry and Woodlands Policy Statement (2013) which aspires to encourage businesses to invest in woodland creation and sustainable forest management practice.
Woodland Creation Planning Grant 2015 (Implemented)
Information, Education, Economic LULUCF
Grant to support the planning of large-scale productive woodlands, compliant with the UK Forestry Standard.
Woodland Carbon Fund 2016 (Implemented)
Voluntary Agreement, Information LULUCF
Exchequer-funded grant to support the creation of large-scale productive woodlands which also enhance natural capital.
Revised UK Forestry Standard 2017 (Implemented)
Regulatory, Information LULUCF
Revised (2017) national standard for sustainable forest management including a new guideline on climate change (2011), covering both adaptation and mitigation. Natural England’s Strategic Approach to the Restoration of Blanket Bog
2015 (Implemented) Information LULUCF
Natural England published the Strategy for the Restoration of Blanket Bog in England in 2015. The approach sets out the extent, nature and importance of the blanket bog resource across England and what is currently being done to conserve it, as well as setting out the required management and timeframe for delivery to achieve an improvement in site condition across the resource at a strategic level. Natural Environment White Paper (NEWP) targets on horticultural peat
2011 (Implemented) Information, Other LULUCF
The Sustainable Growing Media Taskforce was set up to look at ways in which the barriers to the use of peat alternatives could be overcome. The UK Government published its response to the Task Force’s report and draft roadmap in 2013 which set out where our resources will be focused. A policy review was published in 2017 assessing the delivery of the roadmap and identifying further actions necessary to achieve a transition to sustainable growing media and reduced peat use.
Peat Restoration Northern Ireland 2018 (Implemented) Voluntary LULUCF
Northern Ireland (NI) will include peatland restoration measures within the new agri-environment scheme, the Environmental Farming Scheme (EFS), as part of its NI Rural Development Programme 2014-2020.
Peat Restoration Wales 2015 (Implemented) Voluntary LULUCF
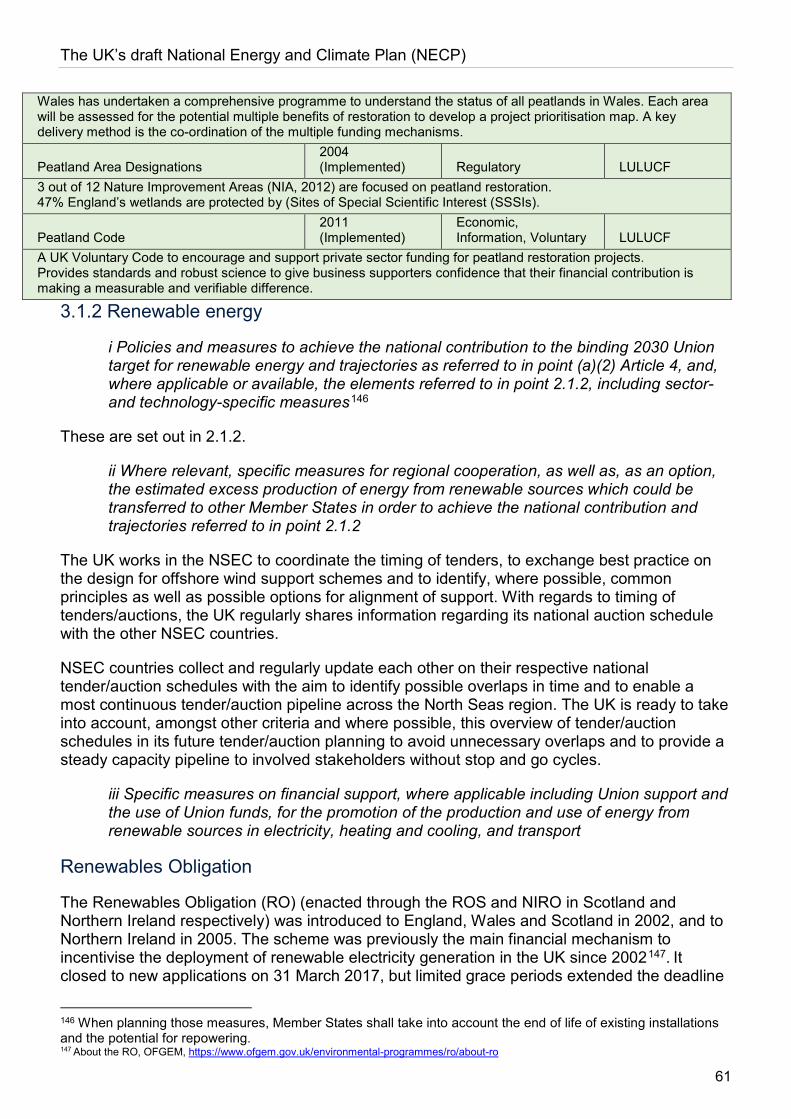
The UK’s draft National Energy and Climate Plan (NECP)
61
Wales has undertaken a comprehensive programme to understand the status of all peatlands in Wales. Each area will be assessed for the potential multiple benefits of restoration to develop a project prioritisation map. A key delivery method is the co-ordination of the multiple funding mechanisms.
Peatland Area Designations 2004 (Implemented) Regulatory LULUCF
3 out of 12 Nature Improvement Areas (NIA, 2012) are focused on peatland restoration. 47% England’s wetlands are protected by (Sites of Special Scientific Interest (SSSIs).
Peatland Code 2011 (Implemented)
Economic, Information, Voluntary LULUCF
A UK Voluntary Code to encourage and support private sector funding for peatland restoration projects. Provides standards and robust science to give business supporters confidence that their financial contribution is making a measurable and verifiable difference.
3.1.2 Renewable energy
i Policies and measures to achieve the national contribution to the binding 2030 Union target for renewable energy and trajectories as referred to in point (a)(2) Article 4, and, where applicable or available, the elements referred to in point 2.1.2, including sector- and technology-specific measures146
These are set out in 2.1.2.
ii Where relevant, specific measures for regional cooperation, as well as, as an option, the estimated excess production of energy from renewable sources which could be transferred to other Member States in order to achieve the national contribution and trajectories referred to in point 2.1.2
The UK works in the NSEC to coordinate the timing of tenders, to exchange best practice on the design for offshore wind support schemes and to identify, where possible, common principles as well as possible options for alignment of support. With regards to timing of tenders/auctions, the UK regularly shares information regarding its national auction schedule with the other NSEC countries.
NSEC countries collect and regularly update each other on their respective national tender/auction schedules with the aim to identify possible overlaps in time and to enable a most continuous tender/auction pipeline across the North Seas region. The UK is ready to take into account, amongst other criteria and where possible, this overview of tender/auction schedules in its future tender/auction planning to avoid unnecessary overlaps and to provide a steady capacity pipeline to involved stakeholders without stop and go cycles.
iii Specific measures on financial support, where applicable including Union support and the use of Union funds, for the promotion of the production and use of energy from renewable sources in electricity, heating and cooling, and transport
Renewables Obligation
The Renewables Obligation (RO) (enacted through the ROS and NIRO in Scotland and Northern Ireland respectively) was introduced to England, Wales and Scotland in 2002, and to Northern Ireland in 2005. The scheme was previously the main financial mechanism to incentivise the deployment of renewable electricity generation in the UK since 2002147. It closed to new applications on 31 March 2017, but limited grace periods extended the deadline
146 When planning those measures, Member States shall take into account the end of life of existing installations and the potential for repowering. 147 About the RO, OFGEM, https://www.ofgem.gov.uk/environmental-programmes/ro/about-ro

The UK’s draft National Energy and Climate Plan (NECP)
62
for certain projects up to 31 March 2019. Existing projects receive support for 20 years or until final closure of the scheme on 31 March 2037, whichever is earlier.
The scheme operates by putting an obligation on UK electricity suppliers to present a certain number of Renewables Obligation Certificates (ROCs) to Ofgem in respect of each MWh of electricity supplied during an obligation year. Suppliers buy these ROCs from renewable generators (or traders). Generators obtain them free of charge from Ofgem in relation to the renewable electricity they generate. The scheme is paid for by consumers through their energy bills and the UK Government is committed to keeping these bills as low as possible. By the end of March 2017, 25,156 stations had been accredited, with a renewable energy capacity of 29.2GW. In 2016/17, 65.2TWh of renewable electricity was generated at a scheme cost of £4.5 billion148. The RO has now been replaced by the Contracts for Difference scheme in GB.
The Feed-in-Tariffs Scheme
The Feed-in Tariff (FITs) scheme was introduced to England, Scotland and Wales on 1 April 2010, under powers in the Energy Act 2008. The intention was to encourage deployment of small-scale (up to 5MW) low-carbon electricity generation, particularly by organisations, businesses, communities and individuals that have not traditionally engaged in the electricity market149.
The technologies supported under FITs are: solar PV, onshore wind, hydropower, anaerobic digestion (AD), and micro (<2kW) combined heat and power (micro-CHP).
Under the scheme, generators receive three sources of income/savings:
• Generation tariff - a payment for every kWh generated, dependent on the technology and capacity of the installation, and date installed
• Export tariff - an additional payment for every kWh exported to the local electricity network
• Bill savings - additional benefit from usage of electricity “on-site” as opposed to paying the retail price for importing that energy from the grid
Tariffs are calculated to give rates of return that encourage investment but prevent overcompensation. Payments to generators are made quarterly by electricity suppliers and then passed on to consumers through electricity bills. The scheme is capped, meaning there are a limited number of generators who can receive a feed-in-tariff.
Since its introduction, the FIT scheme has supported over 800,000 installations, or 6GW of capacity. 99% of installations are solar, which consist of 80% of overall capacity150.
A periodic review of the scheme was conducted in the second half of 2015, as required by our EU State Aid approval to carry out a review every three years. The purpose of the review was to ensure tariff levels provided sufficient incentive to potential generators whilst not over-compensating them. Following the review, the UK Government acted to bring costs under control to protect households and businesses. Our measures sought to maintain a viable small-scale renewables industry which could continue to reduce its costs and move towards subsidy free deployment. The UK Government response to the FIT review introduced a 148 Renewables Obligation (RO) Annual Report 2016-17, https://www.ofgem.gov.uk/publications-and-updates/renewables-obligation-ro-annual-report-2016-17 149 About the FIT Scheme, OFGEM, https://www.ofgem.gov.uk/environmental-programmes/fit/about-fit-scheme 150 Monthly feed-in tariff commissioned installations, 2014: https://www.gov.uk/government/statistics/monthly-small-scale-renewable-deployment

The UK’s draft National Energy and Climate Plan (NECP)
63
capping mechanism to put the scheme on a more sustainable footing and announced the closure of the generation tariff in 2019.
On 19 July 2018 a consultation was issued proposing to close the export tariff alongside the generation tariff as the UK Government does not believe that the current FITs flat rate aligns with its vision for fairer, cost reflective pricing. On the same day, the UK Government also published a call for evidence to further understand the challenges and opportunities for small-scale low-carbon generation, including rooftop solar.
The call for evidence sought to identify:
• The challenges to, and opportunities for, small-scale low-carbon electricity generation in contributing to the UK Government’s objectives for clean, affordable, secure and flexible power; and
• The role for the UK Government and the private sector in overcoming these challenges and realising these opportunities.
In this context, the evidence provided, and responses received as part of this call for evidence will be considered and used to inform policy development ahead of a government response in due course. The call for evidence closed on 31 August 2018 and the responses are being reviewed.
Contracts for Difference (CfD) Scheme
The Contracts for Difference (CfD) scheme was introduced in GB in 2014 and is the UK Government’s main mechanism for supporting new low carbon electricity generation projects151. The scheme has been a success, delivering substantial new investment and helping deliver significant reductions in the costs of some renewable technologies.
A CfD is a 15-year private law contract between a low-carbon electricity generator and the Low Carbon Contracts Company (LCCC), a UK Government-owned company. A generator is paid for the electricity they generate, the difference between the strike price and the reference price. The cost is met by consumers via a levy on electricity suppliers.
Contracts are awarded in a series of competitive ‘pay as clear’ auctions, with the lowest price bids being successful, which drives efficiency and cost reduction. The clearing price for new offshore wind projects, for example, has fallen from £114 per MWh152 (2012 prices) in the first auction in 2015 to £57.5 per MWh153 (2012 prices) in the most recent auction in 2017.
The CfD scheme currently supports 42 renewable electricity projects across a range of technologies, totalling nearly 10GW of new renewable electricity capacity. The combined estimated budget spend for both allocation rounds was £491 million (2012 prices)154.
Below is a list of each technology capacity offered contracts:
151 Electricity Market Reform: Contracts for Difference: https://www.gov.uk/government/collections/electricity-market-reform-contracts-for-difference 152 CfD First Round allocation results: https://www.gov.uk/government/uploads/system/uploads/attachment_data/file/407059/Contracts_for_Difference_-_Auction_Results_-_Official_Statistics.pdf 153 CfD Second Round allocation results: https://www.gov.uk/government/uploads/system/uploads/attachment_data/file/643560/CFD_allocation_round_2_outcome_FINAL.pdf 154 Electricity Market Reform: Contracts for Difference, https://www.gov.uk/government/collections/electricity-market-reform-contracts-for-difference

The UK’s draft National Energy and Climate Plan (NECP)
64
• Advanced Conversion Technologies – 126.31MW
• Biomass Conversion – 1065MW
• Dedicated Biomass with CHP – 384.64MW
• Energy from Waste with Combined Heat and Power - 94.75MW
• Offshore Wind – 7543MW
• Onshore Wind - 748.55MW
• Solar PV - 71.55MW
The CGS announced up to £557 million of annual support for further CfDs, providing developers with the confidence they need to invest in bringing forward new projects155.
The next CfD allocation round for less established technologies such as offshore wind will open by May 2019. The UK Government plans to hold another allocation round in 2021 and further auctions around every two years after that. Depending on the price achieved, these auctions could deliver between 1 and 2GW of offshore wind each year in the 2020s.
In the NSEC, the UK also contributes to the work of analysing and developing options for further mobilisation of investment capital for joint projects; for example, through EU funds such as EFSI and CEF as well as institutional investors. Such joint projects could be cross-border projects for renewable energy in accordance with the CEF proposal.
iv Where applicable, the assessment of the support for electricity from renewable sources that Member States are to carry out pursuant to Article 6(4) of Directive (EU) 2018/...
Not applicable.
v Specific measures to introduce one or more contact points, streamline administrative procedures, provide information and training, and facilitate the uptake of power purchase agreements
Summary of the policies and measures under the enabling framework Member States have to put in place pursuant to Article 21(6) and Article 22(5) of Directive (EU) 2018/... to promote and facilitate the development of renewable self-consumption and renewable energy communities
These are outlined in 2.4.3(iii).
vi Assessment of the necessity to build new infrastructure for district heating and cooling produced from renewable sources
In 2014 the UK carried out the first comprehensive assessment of the investment picture and pipeline in the UK energy sector156. The assessment identified an enormous investment opportunity for new and renewable forms of heating, including heat networks. In the right circumstances, particularly where there is high heat demand, a high proportion of non-
155 Clean Growth Strategy, 2017: https://www.gov.uk/government/publications/clean-growth-strategy 156 Delivering UK Energy Investment, July 2014: https://www.gov.uk/government/uploads/system/uploads/attachment_data/file/331071/DECC_Energy_Investment_Report.pdf

The UK’s draft National Energy and Climate Plan (NECP)
65
domestic consumers, new buildings and/or proximity to low-cost large-scale heat sources, heat networks are a highly cost effective and non-disruptive way to reduce carbon emissions.
The UK Government is committed to significantly expanding the district heating sector. The CGS makes clear that heat networks have the potential to play a significant role in the decarbonisation of heat. In each of the Strategy’s three illustrative pathways to 2050, heat networks are projected to meet 17% of heat demand in homes and up to 24% of heat demand in the non-industrial business and public sector buildings. There are currently over 14,000 heat networks in the UK. Of these, approximately 12,000 are communal heat networks (serving only one building) and 2,000 are district heat networks (serving multiple buildings). District heat networks currently supply around 10TWh of annual heat demand157.
A study158 commissioned by the CCC in 2015 developed three core scenarios for deployment of district heating to 2050. Under the central scenario analysis, this study estimates that 18% of buildings’ heat will need to be supplied by heat networks by 2050 if the UK is to meet its carbon budgets cost effectively. While the majority of schemes in the UK are currently based on Gas CHP, this study expects gas CHP to play a limited role in the longer term and forecasts the use of a wide range of heat supply technologies by 2050 (primarily heat pumps, biomass and waste heat) reflecting the variety in locally-available secondary heat sources. In 2015 the UK also published its national comprehensive assessment of the potential for district heating and cooling in the UK159.
The UK Government plans to publish further details on the approach to delivering a future market framework that will enable sustained investment in heat networks, strengthen consumer protections and move towards low carbon heat sources.
In 2015 the Scottish Government published a Heat Policy Statement setting out how low carbon heat can reach more householders, businesses and communities and a clear framework for investment in the future of heat in Scotland. The ambition is to achieve 1.5TWh of Scotland's heat demand to be delivered by district or communal heating and to have 40,000 homes connected by 2020160. The Scottish Government’s Climate Change Plan sets out a pathway for low carbon heat that will see around 45% of buildings’ heat met by low carbon sources by 2032. To support this, the Scottish Government is developing the Energy Efficient Scotland programme, and as part of this, in 2017 and 2018 consulted on the development of a policy and regulatory system to develop district heating in a strategic manner, and provide appropriate conditions on the ground to accelerate the delivery of district heating and to grow this market. Northern Ireland is currently developing a long-term energy strategy, looking to 2030 and beyond, which will include considerations around heat policy.
Policy initiatives to support district heating
In 2013, the UK Government set up the Heat Network Delivery Unit (HNDU) to support local authorities in England and Wales through the early stages of heat network project
157 Energy Trends: March 2018, Experimental statistics on heat networks: https://www.gov.uk/government/publications/energy-trends-march-2018-special-feature-article-experimental-statistics-on-heat-networks 158 Research on district heating and local approaches to heat decarbonisation: A study for the CCC, 2015: https://www.theccc.org.uk/wp-content/uploads/2015/11/Element-Energy-for-CCC-Research-on-district-heating-and-local-approaches-to-heat-decarbonisation.pdf 159 National Comprehensive Assessment of the Potential for Combined Heat and power and District Heating and Cooling in the UK, 2015: https://www.gov.uk/government/uploads/system/uploads/attachment_data/file/499417/Final_NCA_Report_for_publication.pd 160 Heat Policy Statement, Scottish Government 2015: https://beta.gov.scot/publications/heat-policy-statement-towards-decarbonising-heat-maximising-opportunities-scotland/

The UK’s draft National Energy and Climate Plan (NECP)
66
development. Through HNDU support the UK Government has invested over £17 million in grant funding to more than 200 projects across 140 local authorities161.
The UK Government is investing £320 million in efficient heat network projects through the Heat Networks Investment Project (HNIP). The funding will be allocated from April 2019 for up to three years, with £18.5 million of funding already allocated to eight pilot projects162.
The Renewable Heat Incentive scheme (RHI) supports the deployment of heat networks by incentivising the take up of those technologies that will play a strategic role in the long-term decarbonisation of the UK; for example, large biomass and heat pumps. Heat network projects can become accredited to the non-domestic RHI to secure a tariff guarantee, so long as their heat generation plant meets the scheme criteria. The Northern Ireland RHI schemes were suspended for new applicants on 29 February 2016.
In Scotland, the District Heating Loan Fund offers loans to support the development of district heating networks. Since 2011, more than £15 million has been lent to 50 different projects across Scotland163.
vii Where applicable, specific measures on the promotion of the use of energy from biomass, especially for new biomass mobilisation taking into account:
- biomass availability, including sustainable biomass: both domestic potential and imports from third countries
- other biomass uses by other sectors (agriculture and forest-based sectors); as well as measures for the sustainability of biomass production and use
Promotion of the use of energy from biomass
In 2017, biomass made up 10.3%164 of UK electricity (in Q3) and 70%165 of renewable heat generation. The UK has mandatory sustainability criteria for heat and power generation. These criteria are made up of the land criteria which focus on the land from which the biomass is sourced and greenhouse gas criteria which account for the life cycle emissions of the biomass.
Biomass is incentivised for electricity through the schemes outlined in section 3.1.2(iii) and generators only receive subsidies for the electricity output which complies with our sustainability criteria.
In Scotland, a Bioenergy action plan is being developed to provide a clearer scope for the development of bioenergy within the Scottish Energy system. Research has been commissioned to assess the potential contribution that bioenergy can make towards meeting Scottish energy demand, considering scale, local restrictions and bioenergy resources. There is potential for bioenergy to deliver another source of renewable energy; one that is low in cost and will help to tackle fuel poverty in Scotland.
161 Heat Networks Delivery Unit, https://www.gov.uk/guidance/heat-networks-delivery-unit 162 Heat Networks Investment Project (HNIP), https://www.gov.uk/government/publications/heat-networks-investment-project-hnip-scheme-overview 163 District Heating Loan, Energy Savings Trust: http://www.energysavingtrust.org.uk/scotland/grants-loans/district-heating-loan 164 Energy Trends: electricity, 2013: https://www.gov.uk/government/statistics/electricity-section-5-energy-trends 165 Biomass consists of wood, waste wood, animal biomass and plant biomass. Digest of UK Energy Statistics (DUKES) 2018, https://www.gov.uk/government/statistics/digest-of-uk-energy-statistics-dukes-2018-main-report

The UK’s draft National Energy and Climate Plan (NECP)
67
Renewable Heat Incentive (RHI)
The non-domestic RHI was introduced in 2011, with the domestic RHI following in 2014. The schemes are designed to help bridge the gap between the costs of fossil fuel heating technologies and low-carbon alternatives. Participants receive a tariff, set in pence per kilowatt hour of heat used, for either 7 (domestic RHI) or 20 years (non-domestic RHI), which is set at a level to cover the additional costs of the low-carbon heating installation. Both RHI schemes cover a range of technologies, including solid biomass heating, and for the non-domestic scheme, biogas heating and biomethane injection to the gas grid.
Renewable Transport Fuel Obligation (RTFO)
Introduced in 2008 under the Energy Act, the RTFO scheme is the main mechanism to ensure the deployment of sustainable renewable fuels in transport.
The RTFO requires fuel suppliers to ensure that a specified proportion of their overall fuel supply into the UK market is from a renewable source. Suppliers can choose to meet their obligation by:
• Supplying fuel that meets the relevant sustainability criteria
• Buying RTF certificates from others who have supplied fuel that meets the criteria
• Paying a ‘buy-out’ in respect of each litre of shortfall in meeting their obligation.
The RTFO has developed over time, introducing mandatory sustainability criteria to implement the Renewable Energy Directive and more recently to introduce restrictions on the use of food crops to address concerns around indirect land use change. The latest changes were introduced in April 2018. These include:
• Setting a target trajectory for low carbon fuels to 2032 (rising from ~3% of transport energy today to ~7% by 2032)
• Establishing a sub target for advanced fuels from wastes
• Extending eligibility to low carbon aviation fuels
• Limiting the contribution of crops from a maximum of 4% in 2020, declining to a maximum of 2% in 2032.

The UK’s draft National Energy and Climate Plan (NECP)
68
3.1.3 Other elements of the dimension
i Where applicable, national policies and measures affecting the EU ETS sector and assessment of the complementarity and impacts on the EU ETS
Emissions from installations in the EU ETS decreased by around 8% between 2013 and 2016, which represents half of the third trading period (2013-2020)166. After 4 years of the second trading period, emissions are now 26% below 2005 levels. This is below the 2020 target of a 21% ETS reduction below 2005 levels, as set out in the Climate and Energy Package167.
In Scotland, the EU ETS has helped to drive reductions in actual Scottish emissions. Emissions from energy supply are down 69% from the baseline and those from business and industrial processes are down 40%168. In Wales the majority of emissions come from heavy industry and electricity generation, referred to as the ‘traded sector’ under the EU ETS169.
The Carbon Price Support rate
In Great Britain, the Total Carbon Price (TCP) for energy generation is made up of the EU Emissions Trading System price and the Carbon Price Support (CPS) rate. The CPS was implemented to support the EU ETS and underpins the price of carbon at a level that drives low carbon investment and taxes fossil fuels used to generate electricity. The CPS rate does not apply to energy generators in Northern Ireland.
HM Treasury confirms CPS rates in advance of delivery at Budget, and all revenue from the CPS is retained by the Treasury.
Past rates
The CPS rate was introduced in April 2013. At Budget 2014170, the UK Government announced that the CPS rate would be capped at £18/tCO2 from 2016-17 to 2019-20 to limit the competitive disadvantage faced by business and reduce energy bills for consumers. At Budget 2016, the cap was maintained at £18/tCO2 from 2016-17 to 2019-20171. At Budget 2018, the UK government announced that CPS rates will be frozen at £18/CO2 in 2020-21 following the rise in the EU ETS price. From 2021-22, the UK Government will seek to reduce CPS rates if the TCP remains high172.
The Carbon Price Support rate will continue to apply after the UK leaves the EU.
Small Emitters Scheme
The UK’s Small Emitter and Hospital Opt-out Scheme (Article 27) provisions recognise the fact that lower emitters on average face a much higher cost of compliance per TCO2 than larger emitters. This means that administration costs are significantly higher for smaller emitters, with larger emitters taking advantage of economies of scale to keep costs down.
An assessment of the administrative costs faced by UK operators during Phases I (2005-2007) and II (2008-2012) of the ETS found that smaller emitters accounting for 2% of emissions,
166 EU Emissions Trading (EU ETS): https://ec.europa.eu/clima/policies/ets_en 167 Trends and projections in the EU ETS 2017, https://www.eea.europa.eu/publications/trends-and-projections-EU-ETS-2017/at_download/file 168 Scottish greenhouse gas emissions 2016, published June 2018, https://www.gov.scot/publications/scottish-greenhouse-gas-emissions-2016/pages/3/ 169 National Atmospheric Emissions Inventory: http://naei.beis.gov.uk/reports/reports?report_id=958 170 2014 UK Budget, https://www.gov.uk/government/publications/budget-2014-documents 171 2016 UK Budget, https://www.gov.uk/government/publications/budget-2016-documents 172 2018 UK Budget, https://www.gov.uk/government/publications/budget-2018-documents
The UK’s draft National Energy and Climate Plan (NECP)
69
incurred approximately 20% of the total administrative burden (across the 60% of all installations covered by the assessment). The largest 8% of emitters were responsible for 60% of emissions and incurred 45% of the administrative burden173.
The UK Government continues to pursue it’s ‘better regulation’ agenda, which aims to reduce regulatory burdens on business, thereby helping to boost economic growth. In climate change policy terms, this translates into a commitment to ensuring that regulatory effort is focused on those areas of greatest risk to achieving our climate emission reduction goals and that the administrative costs of delivering these goals are minimised. Therefore, all effort should be made to reduce the compliance burden on small emitters.
The UK’s Small Emitter and Hospital Opt-out Scheme (Article 27) allows eligible installations to be excluded from Phase 3 (2013 to 2020) of the EU ETS. The scheme has been approved by the European Commission.
The current UK opt-out scheme was designed in consultation with industry and aims to offer a simple, deregulatory alternative to the EU ETS whilst maintaining the incentives for emission reductions. The opt-out scheme offers deregulatory savings through:
• an option for risk-based auditing of emissions instead of third-party verification;
• no requirement to hold an active registry operator holding account;
• the replacement of the requirement to surrender allowances with an installation emission reduction target;
• a less burdensome procedure for adjusting targets to take into account changes in capacity.
Ultra-Small Emitters Scheme
For Phase 4 (2021-2030), as well as the Small Emitters Scheme, there will be the option of an Ultra-Small Emitters Scheme. The UK’s Ultra Small Emitters Scheme will comply with the EU ETS framework regarding optional exclusion of installations emitting less than 2,500 tons. The UK, or any other Member State, may exclude from the EU ETS installations which have reported emissions of less than 2500 tonnes of carbon dioxide equivalent, excluding emissions from biomass.
Indirect compensation payments
Article 10a (6) of the revised EU Emissions Trading Scheme Directive, which took effect on 8 April 2018, requires Member States to publish annually, from 2018, the amount of compensation paid to sectors exposed to “genuine risk of carbon leakage due to significant indirect costs that are actually incurred from greenhouse gas emission costs passed on in electricity prices”. In 2018, the UK published a report detailing the amount of EU ETS Indirect Cost Compensation awarded in 2017:
173 Aether (2010). Assessing the cost to UK operators of compliance with the EU Emissions Trading System

The UK’s draft National Energy and Climate Plan (NECP)
70
Figure 9: 2017 indirect cost compensation report174
The UK Government’s current commitment is to provide compensation until 2020.
ii Policies and measures to achieve other national targets, where applicable
Not applicable.
iii Policies and measures to achieve low emission mobility (including electrification of transport)
The UK Government recognises that transport is one of the key areas where we must step up the pace of progress in reducing emissions. Our main focus is road transport, which accounts for over 90% of transport greenhouse gas emissions and a significant proportion of air pollutant emissions175. The UK Government is also taking action to support modal shift, enabling people to choose the most sustainable mode of travel for their journey. We are investing in public transport and walking and cycling, as well as driving down emissions from aviation and shipping176. The UK’s decarbonisation of transport is supported by around £841 million of public innovation funding for low carbon transport technology and fuels out to 2021177.
Since 2007, Innovate UK, along with BEIS and more recently, the Office for Low Emission Vehicles, has invested in a series of funding opportunities to support low and zero emission vehicle technologies178. This investment includes £321 million in grants to industry and a further £568 million of further support packages. There have been over 1,100 project partners, with more than 300 projects supported.
Cars, vans, motorcycles and taxis
In the Road to Zero strategy, published in 2018, the UK Government reaffirmed that it will end the sale of new conventional petrol and diesel cars and vans by 2040179. By 2030, the UK 174 Reporting of indirect cost compensation payments made to industry in the UK in 2017, published 2018: https://www.gov.uk/government/uploads/system/uploads/attachment_data/file/723181/Indirect_Cost_Compensation_EU_ETS_UK_Publication_2017_Revised.pdf 175 BEIS (2018) Final UK greenhouse gas emissions national statistics: 1990 – 2016 (online): https://www.gov.uk/government/ statistics/final-uk-greenhouse-gas-emissionsnational-statistics-1990-2016 176 BEIS (2018) Final UK greenhouse gas emissions national statistics: 1990 – 2016 (online): https://www.gov.uk/government/ statistics/final-uk-greenhouse-gas-emissionsnational-statistics-1990-2016 177 Clean Growth Strategy, 2017 https://www.gov.uk/government/publications/clean-growth-strategy 178 Innovate UK, Low and zero emission vehicles: Impact review 2018 (2018): https://assets.publishing.service.gov.uk/government/uploads/system/uploads/attachment_data/file/739389/18.1136.051_Innovate_UK_LCV_Impact_Report_Web_enabled_PDF_AW_FINAL_V2_1.3MB.pdf. 179 Department for Transport, The Road to Zero (2018): https://assets.publishing.service.gov.uk/government/uploads/system/uploads/attachment_data/file/739460/road-to-zero.pdf.
Sector No. of Businesses EU ETS compensation (£)
Iron & Steel 9 5.9 million
Chemicals 15 5.9 million
Paper 29 4.6 million
Non-ferrous metals 6 0.4 million

The UK’s draft National Energy and Climate Plan (NECP)
71
Government wants to see at least 50% and as many as 70% of new car sales to be ultra low emission, and up to 40% of new van sales180. This transition is expected to be industry and consumer led, supported by government policies and measures. The public sector is leading by example, by ensuring 25% of the central government car fleet is ultra low emission by 2022, and that all new car purchases are ultra low emission by default, ensuring 100% of the central government car fleet to be ultra low emission by 2030.
The UK Government offers a range of incentives to help consumers make the shift to cleaner vehicles, including through the tax system, direct grants and other financial support.
Our package of support for the transition to zero emission vehicles amounts to investment of nearly £1.5 billion out to 2021. As part of this, the UK Government will continue to offer grants for plug-in cars, vans, taxis and motorcycles until at least 2020, with consumer incentives in some form continuing beyond that date. Thanks to UK Government leadership, a growing private sector and local authority engagement, the UK now has around 14,000 public chargepoints. At least 1,300 are rapid devices; one of the largest networks in Europe. The UK Government’s grant schemes and £400 million public-private Charging Infrastructure Investment Fund will see thousands more electric vehicle chargepoints installed across the UK. The Road to Zero strategy includes new commitments to massively expand electric and low emission vehicle infrastructure across the country. The UK Government is consulting on proposals for chargepoints to be installed with all newly built homes in England, where appropriate, and also wants all new lampposts to include charging infrastructure. The UK Government has taken new powers through the Automated and Electric Vehicles Act 2018 to ensure that chargepoints can be easily accessed and used across the UK, and that they are smart ready.
The UK continues to work at a European level to develop ambitious CO2 performance standards for new cars and vans beyond 2020.
The UK has invested £14 million for chargepoint infrastructure for taxis, working with a network of ten local authorities to share best practice. The UK Government is now providing a further £6 million to help more local areas install taxi chargepoint infrastructure181.
HGVs and road freight
The UK Government’s long-term goal for HGVs is the development and deployment of zero emission technologies. As solutions emerge, it remains essential to scale up and expand efficiency measures that can reduce emissions now. The UK Government is supporting this by:
• Working with industry to develop an Ultra Low Emission Truck standard to provide clarity on its emission reduction expectations.
• Working at a European level to develop ambitious CO2 performance standards for new trucks.
• A new industry-wide voluntary target for reducing HGV greenhouse gas emissions by 15% by 2025, from 2015 levels.
• Maintaining the small and medium-sized enterprise HGV fleet review scheme, which advises companies on ways to reduce carbon dioxide emissions.
180 The Road to Zero, https://www.gov.uk/government/publications/reducing-emissions-from-road-transport-road-to-zero-strategy 181 The Road to Zero, 2018: https://www.gov.uk/government/publications/reducing-emissions-from-road-transport-road-to-zero-strategy

The UK’s draft National Energy and Climate Plan (NECP)
72
• Extending the Longer Semi-Trailer trial until 2027, to further demonstrate the efficiencies gained through more effective use of the road network.
• Extending the plug-in van grant to cover all HGVs weighing more than 3.5 tonnes.
• OLEV and Innovate UK awarding £20 million of grant funding to 20 projects under the Low Emissions Freight and Logistics Trial182 and £18 million R&D funding focused solely on innovative low emission HGV technologies.
• Progressing planning for trials of HGV platoons, which could bring significant fuel and emissions savings, with the first on-road trials expected in spring 2019.
Rail freight
The UK Government’s Rail Freight Strategy183, published in 2016, highlighted the potential for increasing rail freight. The UK Government has committed to providing grants of more than £15 million until at least March 2020 to help with the operating costs associated with running rail or water freight, where this is more expensive than road transport. In Network Rail Control Period 5 (2014-2019), the UK Government is investing £235 million in the Strategic Freight Network, to improve the capacity and capability of the rail network for freight. The Statement of Funds Available for Control Period 6 (2019-2024) includes funding for continued investment in improving the rail freight network.
Public transport
Rail
The UK Government has said that the rail sector must play its part in decarbonising transport, and that it wants to see all diesel-only trains taken off the track by 2040. Earlier this year, the UK Government called on the industry to produce a vision for how it will decarbonise; a taskforce being led by the Rail Safety and Standards Board is expected to report shortly. The UK Government is also seeking to encourage further passenger uptake of rail travel, by improving the consumer experience of fares and ticketing through a range of measures.
The UK Government is clear that rail electrification should only be undertaken where it is cost-effective, and where it will deliver passenger benefits such as journey time savings. Journey time savings can sometimes be made by alternative means such as track straightening and it is likely there will always be a proportion of the rail network where electrification does not deliver additional benefits. The UK Government is promoting the transition to bi-mode (modern diesel / electric) trains, and trains using alternative technologies such as power by batteries or hydrogen fuel cells, through the inclusion of environmental trajectories in the invitations to tender for rail franchises, thereby encouraging the market to investigate alternative fuels and drive trains that reduce emissions.
As battery technology improves, it is expected that the diesel engines in bi-modes would be replaced altogether, with batteries powering the train between the electrified sections of the network, or those batteries and diesel engines being replaced with hydrogen units.
182 TRL, Low Emissions Freight and Logistics Trial, https://left.trl.co.uk/ 183 Department for Transport, Rail Freight Strategy (2016): https://assets.publishing.service.gov.uk/government/uploads/system/uploads/attachment_data/file/552492/rail-freight-strategy.pdf.

The UK’s draft National Energy and Climate Plan (NECP)
73
Buses
As for other road vehicles, the UK Government ultimately wants to see all buses become zero emission. The UK Government is building on previous investments with the launch of a new ultra low emission buses scheme, with £48 million provided to accelerate the uptake of these buses and related infrastructure in England and Wales184.
The UK Government also works to increase bus usage. The £220 million Clean Air Fund is available for investment in a range of measures, including bus priority measures, which improve reliability and reduce journey times185. The £1.7 billion Transforming Cities Fund is also providing support for public transport in some of England’s largest cities186.
The Bus Services Act 2017 gives local authorities new powers to work with operators to improve passengers’ experience of bus travel. It introduces new bus franchising powers for local authorities, and partnership powers for bus operators, among other tools. Regulations made under the new open data provisions and new ticketing powers should make it easier for passengers in England (outside London) to use buses, move between different modes of transport and to access timetables, routes, fares, tickets, real time information and the actual location of bus services.
More generally, the UK Government already provides around £2 billion to bus operators and local authorities to support bus services, and £250 million is provided via the Bus Service Operators Grant, with £43 million of this directly devolved to local authorities to support bus services that are not commercially viable187. The UK Government also supports free off-peak travel for older and disabled persons through the English National Concessionary Travel Pass188.
Low carbon fuels
The UK Government introduced legislation in April to almost double the use of low carbon fuels in transport, increasing the obligation level under the Renewable Transport Fuels Obligation to 9.75% by volume in 2020, and rising to 12.4% by volume in 2032189. The UK Government has also launched the £22 million Future Fuels for Flight and Freight Competition to develop proposals for advanced fuels production plants.
Walking and cycling
The UK Government is now implementing the Cycling and Walking Investment Strategy (CWIS) , which was published in 2017190. The ambition for England by 2040 is to make cycling and walking the natural choices for shorter journeys, or as part of a longer journey. The CWIS also sets out some nearer term aims and targets for 2025, including an aim to double cycling to 1.6 billion stages by 2025. The CWIS identified £1.2 billion available for investment in cycling and walking out to 2021. Since the strategy’s publication, local councils and metro mayors have been greatly attracted by the benefits of cycling and walking, and they have allocated an 184 Ultra-low emission bus scheme, March 2015: https://www.gov.uk/government/publications/low-emission-bus-scheme 185 Press release, March 2018: https://www.gov.uk/government/news/260-million-of-clean-air-funding-launched-by-government 186 UK Government website, news article published March 2018: https://www.gov.uk/government/news/transport-secretary-welcomes-next-step-in-17-billion-fund-to-transform-local-journeys 187 Bus service: Grants and funding, published May 2015: https://www.gov.uk/government/collections/bus-services-grants-and-funding 188 Free bus passes for older and disabled people protected for the future, published April 2018: https://www.gov.uk/government/news/free-bus-passes-for-older-and-disabled-people-protected-for-the-future 189 Renewable Transport Fuel Obligation Order, Government Response to the consultation on amendments, 2017: https://assets.publishing.service.gov.uk/government/uploads/system/uploads/attachment_data/file/644843/renewable-transport-fuel-obligations-order-government-response-to-consultations-on-amendments.pdf 190 Department for Transport, Cycling and Walking Investment Strategy (2017): https://www.gov.uk/guidance/renewable-transport-fuels-obligation.

The UK’s draft National Energy and Climate Plan (NECP)
74
additional £700 million to safe infrastructure and other Active Travel projects. The result is that almost £2 billion is being invested in this area over this Parliament. This represents an expected uplift of nearly 60% on the investment levels projected in 2017, reflecting the growing importance of this agenda.
Further investment in cycling and walking could be provided as part of the £1.7 billion Transforming Cities Fund, the £5.5bn Housing Infrastructure Fund34, the £1 billion Sport England Strategy, the £220 million Clear Air Fund and through the HS2 road safety fund. An additional £770 million was announced in the Autumn Budget to extend the Transforming Cities Fund by a further year, and the new High Streets funding will also provide further support.
Aviation and shipping
The UK Government is continuing to modernise its aviation and shipping sectors, both through international action, such as standards and offsetting schemes, and domestically; for example, by working with industry to develop sustainable alternative fuels, improved design efficiency and new propulsion technologies.
The UK Government will publish an Aviation Strategy in the first half of 2019, which will put in place a framework for tackling carbon emissions from UK aviation out to 2050. The UK Government will consider all cost-effective measures to ensure that the sector contributes to the UK’s emissions reduction obligations. Industry and the UK Government have made a joint £3.9 billion commitment between 2013 and 2026 to the development of new aircraft technology with the Aerospace Technology Institute. The Renewable Transport Fuel Obligation has also been extended to include incentives to use biofuels in aviation.
On international shipping, the UK played a key role in reaching a global deal at the International Maritime Organization in April 2018 that will see these greenhouse gas emissions reduced by at least 50% by 2050, against a 2008 baseline, while pursuing efforts to phase out these emissions entirely as soon as possible. Domestically, the UK Government is working with ship owners and ports to identify the barriers faced in supplying and using sustainable alternative fuels and cleaner emissions technologies, to explore possible solutions. In addition, operational improvements are expected to play a role, including better use of ship capacity. In spring 2019, the UK Government will publish a Clean Maritime Plan, which will address the challenge of tackling the maritime sector’s emissions of greenhouse gases and air pollutants.
iv Where applicable, national policies, timelines and measures planned to phase out energy subsidies, in particular for fossil fuels
Not applicable.

The UK’s draft National Energy and Climate Plan (NECP)
75
3.2 Dimension energy efficiency
Planned policies, measures and programmes to achieve the indicative national energy efficiency contributions for 2030 as well as other objectives referred to in point 2.2, including planned measures and instruments (also of a financial nature) to promote the energy performance of buildings, in particular with regard to the following:
i Energy efficiency obligation schemes and alternative policy measures under Articles 7a and 7b and Article 20(6) of Directive 2012/27/EU and to be prepared in accordance with Annex III to this Regulation
The Energy Company Obligation (ECO) is a statutory scheme that places an obligation on energy suppliers to deliver energy efficiency (for example; solid wall insulation, loft insulation) and heating measures to domestic households in Great Britain.
ECO has been in place since April 2013. As of July 2018, it had delivered 2.4 million measures to approximately 1.8 million homes. The 2015 Spending Review committed £640 million per annum from April 2017 to March 2022191. The CGS announced that domestic energy efficiency would be funded to at least this level until 2028.
The new ECO scheme will come into force on 3 December 2018 and will run until March 2022. The new scheme provides support to low income, vulnerable and fuel poor households. Further information on the ECO Scheme is available at: https://www.ofgem.gov.uk/environmental-programmes/eco.
ii Financing measures, including Union support and the use of Union funds, in the area at national level
The CGS set out an aspiration for as many homes as possible to be EPC band C by 2035, where practical, cost-effective and affordable. To achieve this aspiration, the UK Government will:
1. Support around £3.6 billion of investment to upgrade around a million homes through the Energy Company Obligation (ECO), and extending support for home energy efficiency improvements until 2028 at the current level of ECO funding (i.e. £640 million per annum)192.
2. Build a market for energy efficiency by making it as easy as possible for people to pay for and make home energy efficiency improvements. Alongside the CGS, the UK Government published a Call for Evidence on Building a Market for Energy efficiency on additional measures to encourage energy performance improvements193. The consultation period closed on 9 January 2018. The UK Government will use this information provided to inform the development of an action plan for years to come, which will be published later in the year.
191 Energy Company Obligation 2018-2022, https://assets.publishing.service.gov.uk/government/uploads/system/uploads/attachment_data/file/749011/energy-company-obligation-innovation-guidance.pdf 192 Household Energy Efficiency Headline Release, https://www.gov.uk/government/uploads/system/uploads/attachment_data/file/694012/Headline_Release_-_HEE_stats_27_Mar_2018_FINAL.pdf 193 Building a market for energy efficiency: call for evidence, 2017: https://www.gov.uk/government/consultations/building-a-market-for-energy-efficiency-call-for-evidence

The UK’s draft National Energy and Climate Plan (NECP)
76
3. Review the Green Deal Framework to improve and simplify this. Launched in 2013, the Green Deal enables consumers to take out loans to pay for energy efficiency improvements in their properties, with repayments made through their energy bill. The UK Government intends to improve the Framework, so that it can best support future use of “pay as you save”, as well as simplify and reduce costs, whilst providing adequate protection for consumers. A Call for Evidence was published late in 2017 and the summary of responses to the Call for Evidence was published in July 2018. A consultation will follow on any proposed changes.
There is also potential for the energy services market to deliver more investment in energy efficiency to businesses. The CGS sets out the UK Government’s ambition to reduce business energy use by 20% by 2030. To achieve a 20% ambition will require action across all businesses. The UK Government’s modelling suggests that the majority of improvements could come from improving the efficiency of how energy is used in commercial and industrial buildings, in both the private rented sector and owner-occupied sectors.
The UK Government is working with business and finance stakeholders to improve the market for energy services, building confidence across commercial and industrial customers. Delivering our ambition will present opportunities for green finance. The UK Government’s call for evidence is seeking views on the potential role for the UK Government in setting standards for the energy efficiency market; increasing the use of digital tools, and the availability of data and encouraging more lenders into the market.
The CGS also set out the challenge facing the public sector in meeting the UK’s 2050 target. The pathway set out to 2032 sees emissions from the public sector falling by around 50% compared to 2017. This will require UK Government to go further with longer term emissions reduction targets across the public sector, addressing the barriers to energy efficiency and low carbon investment, and making the case for action internally.
The UK Government has already shown what is possible through the Greening Government Commitments which include a greenhouse gas emissions reduction target and has recently set a new, higher target of a 43% reduction by 2020 from a 2009-10 baseline across the central government estate. The UK Government has also introduced a voluntary target - the Emissions Reduction Pledge - for the wider public sector and higher education sector, of a 30% reduction in greenhouse gas emissions by 2020 from a 2009-10 baseline, and will explore the possibility of moving to a more ambitious target during the 2020s.
A call for evidence was launched in October 2017: Leading by example: cutting energy bills and carbon emissions in the public and higher education sectors. A summary of responses was published in July 2018 and further analysis will feed into a review of carbon reduction policies across the public sector. The UK Government intends to publish a decarbonisation roadmap in 2019.
Energy efficiency is also being supported by a revolving interest-free loan scheme for the public sector, managed by Salix Finance. By 2017 the loan scheme had funded over 16,000 projects, improving public sector and higher education buildings for its users and is projected to save the sector around £55 million on energy bills this year. The loan scheme administrator currently manages £240 million, and this will rise to £385 million by 2020. This revolving loan scheme will continue to be recycled to at least 2025. The UK Government is also supporting development of the energy services market, currently working with Local Partnerships to provide capacity support to public bodies across England to access an energy services procurement framework under the Re:Fit programme. Similar support is provided by the Greater London Authority in London and the Welsh Government in Wales.

The UK’s draft National Energy and Climate Plan (NECP)
77
iii Long-term renovation strategy to support the renovation of the national stock of residential and non-residential buildings, both public and private194, including policies, measures and actions to stimulate cost-effective deep renovation and policies and actions to target the worst performing segments of the national building stock, in accordance with Article 2a of Directive 2010/31/EU
This is set out in the UK’s 2014 National Energy Efficiency Action Plan195 and within the UK Government’s Clean Growth Strategy. See also 3.2(v).
iv Description of policy and measures to promote energy services in the public sector and measures to remove regulatory and non-regulatory barriers that impede the uptake of energy performance contracting and other energy efficiency service models196
The UK Government is supporting development of the energy services market, currently working with Local Partnerships to provide capacity support to public bodies across England to access an energy services procurement framework under the Re-Fit programme. Similar support is provided by the Greater London Authority in London.
Energy efficiency is also supported by a revolving interest-free loan scheme for the public sector, managed by Salix Finance. As of 2017, the loan scheme has funded over 16,000 projects, improving public sector and higher education buildings for its users and is projected to save the sector around £55 million on energy bills this year. As at end 2017/18, the loan scheme administrator manages £210 million, and this will rise to £385 million by 2020. This revolving loan scheme will continue to be recycled to at least 2025197.
The UK Government has also made available a model Energy Performance Contract198, which includes guidance notes and a guide to best practices for the public sector and a list of registered energy service providers, in accordance with Article 18 of the 2012 EU Energy Efficiency Directive199.
In the business sector, BEIS recently published research that it had commissioned to understand the potential size of the energy services market and the drivers and barriers to further growth200. The UK Government also published a call for evidence to seek views on how the UK Government could help businesses improve the way they use energy, including whether the UK Government could stimulate the energy services market for businesses.
v Other planned policies, measures and programmes to achieve the indicative national energy efficiency contributions for 2030 as well as other objectives referred to in point 2.2 (for example measures to promote the exemplary role of public buildings and energy-efficient public procurement, measures to promote energy audits and energy management systems201, consumer information and training measures202, and other measures to promote energy efficiency203)
194 In accordance with Article 2a of Directive 2010/31/EU 195 UK National Energy Efficiency Action Plan (NEEAP), 2014 https://ec.europa.eu/energy/sites/ener/files/documents/neeap_2014.zip 196In accordance with Article 18 of Directive 2012/27/EU 197 Cutting Energy Bills and Carbon Emissions in the Wider Public and Higher Education Sectors, https://assets.publishing.service.gov.uk/government/uploads/system/uploads/attachment_data/file/651224/BEIS-Consultation-Document-Public_Sector-CFE-FINAL.pdf 198 Model Energy Performance Contract, 2015, https://www.gov.uk/government/publications/energy-performance-contract-epc 199 Registered energy service providers, published 2014: https://www.gov.uk/government/publications/registered-energy-service-providers 200 The Non Domestic Energy Efficiency Services Market, May 2018: https://www.gov.uk/government/publications/non-domestic-energy-efficiency-services-market 201 In accordance with Article 8 of Directive 2012/27/EU 202 In accordance with Articles 12 and 17 of Directive 2012/27/EU 203 In accordance with Article 19 of Directive 2012/27/EU

The UK’s draft National Energy and Climate Plan (NECP)
78
These are outlined in 2.2(i) and 3.2(viii).
vi Where applicable, a description of policies and measures to promote the role of local energy communities in contributing to the implementation of policies and measures in points i, ii, iii and iv
The UK Government recognises that local delivery is critical to achieve objectives set out in the national Industrial Strategy and CGS. BEIS has recently launched an £8 million Local Energy Programme. This has supported all Local Enterprise Partnerships in England to develop local energy strategies, is funding five regional energy hubs across England and a range of toolkits to increase local capacity.
As highlighted in the CGS, the UK Government is also committed to supporting local leadership and has already given additional powers and responsibilities through the Cities and Local Government Devolution Act 2016. A number of Local Devolution deals have been agreed between the Government and local areas including Cornwall, Sheffield, Greater Manchester and Liverpool. Many of the Local Devolution deals incorporate energy commitments; including support for home energy efficiency, deep geothermal, tidal power and community energy initiatives.
The UK Government is supporting development of the energy services market, currently working with Local Partnerships to provide capacity support to public bodies across England to access an energy services procurement framework under the Re-Fit programme. Similar support is provided by the Greater London Authority in London.
vii Description of measures to develop measures to utilise energy efficiency potentials of gas and electricity infrastructure204
The Ofgem assessment of the energy efficiency potential of Great Britain’s gas and electricity infrastructure was published in 2015, in line with the Energy Efficiency Directive. The report assessed the energy efficiency potential of gas and electricity infrastructure and described measures in place and their expected benefits alongside potential measures that could improve energy efficiency in future205. These measures continue to be progressed under the mechanisms described in 3.4 below.
viii Regional cooperation in this area, where applicable
Not applicable.
3.3 Dimension energy security
i Policies and measures related to the elements set out in point 2.3206
These are outlined in 2.4.3(i).
204 In accordance with Article 15(2) of Directive 2012/27/EU 205 Energy Efficiency Directive: An assessment of the energy efficiency potential of Great Britain’s gas and electricity infrastructure, 2015: https://www.ofgem.gov.uk/publications-and-updates/energy-efficiency-directive-assessment-energy-efficiency-potential-great-britain-s-gas-and-electricity-infrastructure 206 Consistency shall be ensured with the preventive action and emergency plans under Regulation (EU) 2017/1938 of the European
Parliament and of the Council of 25 October 2017 concerning measures to safeguard the security of gas supply and repealing Regulation (EU) No 994/2010 (OJ L 280, 28.10.2017, p. 1) as well as the risk preparedness plans under Regulation (EU) 2018/... [as proposed by COM(2016) 862 on risk-preparedness in the electricity sector and repealing Directive 2005/89/EC].

The UK’s draft National Energy and Climate Plan (NECP)
79
ii Regional cooperation in this area
Not applicable.
iii Where applicable, financing measures in this area at national level, including Union support and the use of Union funds
Not applicable.
3.4 Dimension internal energy market207
Electricity infrastructure
i Policies and measures to achieve the targeted level of interconnectivity as set out in point (d) of Article 4
These are outlined in section 2.4
ii Regional cooperation in this area208
The North Seas Energy Cooperation aims to facilitate the further cost-effective deployment of offshore renewable energy with the aim of ensuring a sustainable, secure and affordable energy supply in the North Seas countries thereby also facilitating further interconnection, further integration and increased efficiency of wholesale electricity markets in the longer term. The UK works together with other North Seas Energy Cooperation countries on the possibilities for concrete cooperation projects. Besides joint offshore wind projects that would be connected to, and supported by, several other Member States (see 3.1.2), this includes the work on possible 'hybrid' solutions that would use a grid connection cable for evacuating offshore wind as well as interconnection capacity between countries, and on the corresponding market arrangements.
The UK is contributing to the development of a regional study looking at the possibilities for cooperation on hybrid projects and identifying and addressing possible legal, regulatory and commercial barriers. Further work is planned on synergies between offshore wind and offshore oil and gas installations.
iii Where applicable, financing measures in this area at national level, including Union support and the use of Union funds
Several interconnectors between the UK and EU have received European Investment Bank financing. This includes €150 million for the BritNed electricity interconnector (2009) connecting it with the Netherlands209 and €425 million for the UK-Belgium gas interconnector (1996)210, and €300 million for the Eirgrid East-West electricity interconnector between Ireland and Wales (2009)211.
A number of UK projects have received grant funding from the Connecting Europe Facility. To date, this provided grant funding, of over €70 million for electricity transmission projects in the
207 Policies and measures shall reflect the energy efficiency first principle. 208 Other than the PCI Regional Groups established under Regulation (EU) No 347/2013. 209 http://www.eib.org/en/projects/loan/loan/20070229 210 http://www.eib.org/en/projects/loan/loan/19941152 211 http://www.eib.org/en/projects/loan/loan/20080326

The UK’s draft National Energy and Climate Plan (NECP)
80
UK and over €30 million for gas transmission projects in the UK which bring a cross border benefit212.
3.4.2 Energy transmission infrastructure
i Policies and measures related to the elements set out in point 2.4.2, including, where applicable, specific measures to enable the delivery of Projects of Common Interest (PCIs) and other key infrastructure projects
Energy network companies in England, Scotland and Wales are regulated by Ofgem, the independent energy regulator, via a price control process called RIIO. This process ensures that energy network companies maintain a safe and secure network and invest in new infrastructure where needed whilst ensuring value for money for consumers.
Ofgem introduced a ‘Cap and Floor’ regulatory regime for interconnection in 2014213. The ‘Cap and Floor’ regime has reduced risks and unlocked substantial investment in interconnection, reflected in the number of new interconnectors under construction from Great Britain and those that have received regulatory approval for projects.
Electricity interconnectors developed under this regime can earn revenue from the allocation of capacity to users who want to flow electricity between GB and its neighbours. The floor is the minimum amount of revenue that an interconnector can earn, which means that if an interconnector does not receive enough revenue from its operations, its revenue will be ‘topped up’ to the floor level. These funds are transferred from National Grid, which will in turn recover the sum from transmission charges applied to all users of the national electricity transmission system. The cap is the maximum amount of revenue an interconnector can earn; if an interconnector’s revenue exceeds the cap, it will transfer the excess revenue to National Grid, which will in turn reduce transmission charges. For consumers, the cap on revenues provides benefits in return for their exposure in underwriting the floor.
As an alternative to the cap and floor, interconnector developers can seek an exemption from the regulatory regime. Exempt interconnectors would usually apply for exemptions from European legislation to facilitate this route. Under this exemption, an interconnector developer would face greater upside and downside risks on their investment.
ii Regional cooperation in this area214
Through the Political Declaration on energy cooperation between the North Seas countries (2016) the UK Government is an active participant in facilitating the further cost-effective deployment of offshore renewable energy and interconnection in the North Seas region with a view to further integrate and increase the efficiency of wholesale electricity markets.
Ofgem is a member of the Agency for the Cooperation of European Regulators (ACER) and policy teams are actively involved in the Electricity Working Group, Gas Working Group, Market Integrity and Transparency Working Group Implementation, Monitoring and Procedures Working Group. ACER's mission is to foster cooperation among European energy regulators and ensure market integration and harmonisation of regulatory frameworks.
212 https://ec.europa.eu/inea/en/connecting-europe-facility/cef-energy/cef-energy-projects-and-actions 213 Electricity interconnectors: https://www.ofgem.gov.uk/electricity/transmission-networks/electricity-interconnectors 214 Other than the PCI Regional Groups established under Regulation (EU) No 347/2013.

The UK’s draft National Energy and Climate Plan (NECP)
81
Ofgem is also a member of the Council of the European Energy Regulators (CEER) which acts as a focal point for information exchange and assistance between Europe's national energy regulators.
Regional cooperation on transmission infrastructure also proceeds at ministry and regulator level through bilateral and regional engagement on current and future transmission assets.
iii Where applicable, financing measures in this area at national level, including Union support and the use of Union funds
Energy network companies are regulated by Ofgem in Great Britain, the independent energy regulator through a price control process called RIIO215. GB energy network investment is funded by a combination of debt and equity investment. All equity investment is made by private sector investors, mostly through private ownership but in some cases via the purchase of shares on the stock exchange (i.e. for publicly listed companies). Most debt finance is raised in the capital markets via the issuing of bonds, or otherwise via commercial banks loans. Some network companies in the GB have also received lending from the European Investment Bank (EIB). EIB loans typically have lower interest rates than commercial bank debt, all else being equal.
3.4.3 Market integration
i Policies and measures related to the elements set out in point 2.4.3
See section 2.4.3.
ii Measures to increase the flexibility of the energy system with regard to renewable energy production such as smart grids, aggregation, demand response, storage, distributed generation, mechanisms for dispatching, re-dispatching and curtailment, real-time price signals, including the roll-out of intraday market coupling and cross-border balancing markets
See Section 2.4.3(i).
iii Where applicable, measures to ensure the non-discriminatory participation of renewable energy, demand response and storage, including via aggregation, in all energy markets
Not applicable.
iv Policies and measures to protect consumers, especially vulnerable and, where applicable, energy poor consumers, and to improve the competitiveness and contestability of the retail energy market
There are nearly 70 energy suppliers in the domestic retail energy market216. Evidence shows competition continues to benefit household consumers who are able and willing to shop around, meaning they can usually get a good deal. However, competition is not working well for consumers who are less active. 60% of consumers are on a default variable tariff, which can be around £320 more expensive each year than the cheapest fixed-term deals217.
215 Network regulation – the ‘RIIO’ Model: https://www.ofgem.gov.uk/network-regulation-riio-model 216 Ofgem, State of the energy market 2018, https://www.ofgem.gov.uk/publications-and-updates/state-energy-market-2018 217 Ofgem, State of the energy market 2018, https://www.ofgem.gov.uk/publications-and-updates/state-energy-market-2018

The UK’s draft National Energy and Climate Plan (NECP)
82
To achieve a competitive market that is innovative, adaptive and flourishing, the UK Government and Ofgem have introduced measures including:
• obligations on energy suppliers to take all reasonable steps to install smart meters in every home and small business in GB by the end of 2020;
• moving to faster and more reliable switching for customers; and
• Ofgem trials including writing letters to disengaged customers offering cheaper market deals.
To protect disengaged consumers who are on poor value tariffs, the UK Government has introduced the Domestic Gas and Electricity (Tariff Cap) Act 2018, which will require the energy regulator, Ofgem to set a price cap that will protect the 11 million households who are currently on standard variable and default tariffs, who aren’t already protected by other measures. This is a temporary cap in place until 2020, when Ofgem must report on the conditions for effective competition in the market and recommend to the UK Government whether it should be extended. The cap can be extended annually for a year at a time up to the end of 2023.
See section 2.4.4(i).
v Description of measures to enable and develop demand response including those addressing tariffs to support dynamic pricing218
The UK Government has been working with Ofgem (the independent energy market regulator) to manage the transition to a smarter, more flexible system. In July 2017, the UK Government jointly published the Smart Systems and Flexibility Plan (SSFP)219, which outlines 29 actions for government, Ofgem and industry to lead on in order to realise the transition to a more flexible system.
The SSFP includes a number of measures to enable and develop demand response and support dynamic pricing, including:
• the roll-out of smart meters to all domestic and smaller non-domestic premises by the end of 2020;
• consideration of the case for moving to half-hourly electricity settlement on a market-wide basis;
• proposals to set standards for smart appliances, in order to stimulate the market and increase consumer demand; and
• up to £70 million innovation support for smart technologies up to 2021, with a £7.5 million non-domestic DSR competition and a £7.75 million domestic DSR competition underway.
218 In accordance with Article 15(8) of Directive 2012/27/EU 219 Upgrading our Energy System: Smart systems and Flexibility Plan, July 2017, https://www.gov.uk/government/publications/upgrading-our-energy-system-smart-systems-and-flexibility-plan

The UK’s draft National Energy and Climate Plan (NECP)
83
3.4.4 Energy poverty
i Where applicable, policies and measures to achieve the objectives set out in point 2.4.4
These are set out in 2.4.4(i).
The Energy Company Obligation is a £640 million per annum scheme designed to improve the energy performance of homes in England, Scotland and Wales. The UK Government announced that for 2018-2022 the scheme will be focused entirely on low income and vulnerable households220.
The Warm Home Discount221 is a scheme that provides over 2 million low income and vulnerable households in England, Scotland and Wales with a rebate of £140 off their winter energy bill.
Scotland The Scottish Government has been working with local areas to ensure that local needs are reflected in delivery, making for more effective measures and improved lives, and is aligning this work with policies across the Government to tackle poverty and improve homes.
For those on the lowest incomes, the Scottish Government will continue to offer grant support. For those who can self-fund, it offers interest free loans. The Scottish Government funds Home Energy Scotland to provide free and impartial expert advice to people on how to make homes cheaper and easier to heat, support on switching energy supplier and a referral service for benefit maximisation. The Scottish Government’s Home Energy Efficiency Programmes Area Based Scheme (HEEPS:ABS) distributes funding based on an assessment of need. Their HEEPS Equity loan pilot scheme was extended in June 2018 from Glasgow, Perth & Kinross and Argyll and Bute areas to cover additional areas Inverclyde, Renfrewshire, Stirling, Dundee and Western Isles.
The Scottish Government’s national fuel poverty scheme Warmer Homes Scotland scheme is delivered on a regional basis, including a separate islands region, to ensure those living in more remote parts of the country get the same level of service as urban areas.
In a recent review of the Scottish Government’s Warmer Homes Scotland, new renewable measures have been added to the suite of measures already available for those in fuel poverty where appropriate including ground source heat pumps, micro-hydro, micro wind and micro-CHP.
These measures provide opportunities for greener, more innovative solutions, that may be of particular benefits to those households in rural and island areas that are not served by the gas grid. It also provides the Scottish Government with the building blocks for using innovative technologies and tackling fuel poverty in the future through providing opportunities to build up the skills and accreditations of contractors to undertake new types of work in the renewables sector.
220 Energy Company Obligation: ECO3, 2018 to 2022: Government Response to the ECO3, 2018 to 2022 Consultation, July 2018: https://www.gov.uk/government/uploads/system/uploads/attachment_data/file/727065/Energy_Company_Obligation_ECO3_2018-2022.pdfhttps://www.gov.uk/government/uploads/system/uploads/attachment_data/file/727065/Energy_Company_Obligation_ECO3_2018-2022.pdf 221 Warm Home Discount Scheme 2018-2019 Government Response: https://assets.publishing.service.gov.uk/government/uploads/system/uploads/attachment_data/file/716698/FINAL_WHD_Government_response_FINAL_.pdf

The UK’s draft National Energy and Climate Plan (NECP)
84
In addition, the Scottish Government is including new enabling measures such as asbestos removal and the replacement of existing unsafe oil storage tanks. This will help those households who are most in need to gain access to the scheme where financial constraints would previously have prevented them from doing so, allowing more fuel poor homes to benefit from Warmer Homes Scotland.
3.5 Dimension research, innovation and competitiveness
i Policies and measures related to the elements set out in point 2.5
The UK Government has set out a Grand Challenge of Clean Growth to put the UK at the forefront of the industries of the future. This is set out in section 2.5(i). Some specific examples of activity included in this £2.5 billion of UK spending are included below for illustrative purposes222.
BEIS Energy Innovation Programme
BEIS has a £505 million Energy Innovation Programme which aims to accelerate the commercialisation of innovative clean energy technologies and processes into the 2020s and 2030s223. As set out in the CGS, the BEIS Energy Innovation Programme224 will invest around:
• £70 million in smart systems
• £90 million in the built environment (energy efficiency and heating)
• £100 million in industrial decarbonisation and carbon capture, use and storage (CCUS)
• £180 million in nuclear innovation (fission)
• £15 million in renewables innovation
• £50 million in support for energy entrepreneurs and green financing
From the BEIS Energy Innovation Programme, the UK is progressing well in terms of contractually committing funding to projects and will be adding to this list over the duration of the programme. These include:
Renewable Innovation
• The UK is working with other countries to develop shared solutions to reduce the cost of renewable energy technologies. This includes UK investments through the European Research Area Network (ERANet) of around £700,000 in bioenergy demonstration projects and up to £8 million in the ‘DemoWind’ programme to reduce the cost of offshore wind technologies.
222 Source Energy Innovation government webpage, updated October 2017: www.gov.uk/guidance/energy-innovation 223 Energy Innovation, https://www.gov.uk/guidance/energy-innovation 224 Source Clean Growth Strategy, 2017, https://www.gov.uk/government/uploads/system/uploads/attachment_data/file/700496/clean-growth-strategy-correction-april-2018.pdf

The UK’s draft National Energy and Climate Plan (NECP)
85
• Up to £1.3 million in an Offshore Renewable Innovation Hub, which is led by the Offshore Renewable Energy Catapult and Knowledge Transfer Network to bring the offshore wind industry together to solve common innovation challenges.
Smart Systems Innovation
• Up to £9 million to reduce the cost of energy storage technologies (including electricity storage, thermal storage, and power-to-gas technologies).
• Up to £600,000 on feasibility studies for a potential first of a kind large-scale future energy storage demonstrator.
• Up to £7.6 million for innovative demonstrations of energy demand side response technologies in UK businesses or public sector organisations to reduce their energy use in peak times and provide flexibility to the energy system.
• Up to £30 million (£18 million from the BEIS Energy Innovation Programme, £12 million from the Office for Low Emission Vehicles) for an electric vehicle-to-grid programme to invest in demonstrators and feasibility studies.
• Up to £600,000 to fund flexible market feasibility studies, as part of the Upgrading our Energy System: Smart Systems and Flexibility Plan.
• Up to £7.75 million from 2018-2021 to support innovative domestic applications of Demand Side Response (DSR) technologies and business models.
• Up to £8.8 million to develop innovative approaches to energy management using smart meter data, tailored to the needs of smaller non-domestic sites.
Nuclear Innovation
• Up to £20 million over 2016-2018 to support innovation in the civil nuclear sector.
• Up to £7 million to ensure UK regulators are able to build the capability and capacity required to support the development of advanced technologies.
Industrial Innovation
• Up to £9.2 million over the next 4 years on an industrial energy efficiency accelerator to seek industry-specific solutions which are close to commercialisation, by leveraging private sector investment and strengthening UK supply chains to reduce energy costs for UK industry.
• Up to £20 million to design and construct carbon capture and utilisation (CCU) demonstration projects.
• Up to £20 million to stimulate early investment in fuel switching processes and technologies, so that a range of technologies are available by 2030 and beyond.
Energy Entrepreneurs and Green Financing
• Up to £13 million for phase 5 and up to £11 million for phase 6 of the BEIS Energy Entrepreneurs Fund, which seeks the best ideas from the public and private sector, particularly aimed at small and medium-sized enterprises, and supports the demonstration of state-of-the-art energy technologies;

The UK’s draft National Energy and Climate Plan (NECP)
86
• Up to £20 million of new investment to support clean technology early stage funding.
Built Environment Innovation
• Up to £9.8 million for the second phase of work led by the Energy Systems Catapult on the ‘Smart Systems and Heat’ programme. The programme will help develop local energy plans alongside Local Authorities and support the development of low carbon heating projects across the UK.
• Up to £25 million to investigate the potential uses of hydrogen gas for heating and testing the possibility of domestic gas pipes and appliances.
• Up to £10 million to develop technologies that reduce the carbon emissions associated with providing heat and hot water to UK buildings.
• Up to £10 million to develop technologies and approaches to improving the energy efficiency of existing UK buildings.
• We are partnering internationally, to accelerate the development of innovative, clean energy technologies, driving forward our own transition to a low carbon economy and positioning the UK as a world leader in these areas.
Green Finance
• The UK Government is supporting private investment into sustainable projects and infrastructure. A Green Finance Initiative was launched by the City of London, in partnership with government, in January 2016. The initiative brought together international expertise from across the financial and professional services sector to provide public and market leadership on green finance.
• BEIS and HM Treasury co-hosted a Green Finance Taskforce last year, which published a set of recommendations on how to accelerate green finance.
• The UK Government is currently working with the City of London to launch the Green Finance Institute next year to act as a hub for green finance and ensure our expertise is available to UK and international partners. This delivers on the first recommendation of the taskforce.
• The UK Government will be publishing a Green Finance Strategy in Spring 2019 to set its green finance objectives and address the Green Taskforce’s recommendations.
• The UK Government endorses the Task Force on Climate-related Financial Disclosures’ recommendations and encourages all listed companies to implement them. These recommendations aim to integrate the risks and opportunities posed by climate change into mainstream financial disclosures.
• In October, the Prudential Regulation Authority (PRA) set out for consultation their supervisory expectations for banks and insurers to consider climate risks, including both physical and transition risk in their decision making. This is a world first for a central bank.
• The British Standards Institution (BSI) will be chairing a new ISO Sustainable Finance Technical Committee to develop globally recognised standards in sustainable finance, and will also be developing two new domestic sustainable finance Publicly Available Specification (PAS) standards in the UK in close collaboration with industry.

The UK’s draft National Energy and Climate Plan (NECP)
87
• The UK Government will also be working with mortgage lenders to support the development of green mortgage products that take account of the lower lending risk associated with more efficient properties and the reduced outgoings for customers living in more energy efficient homes.
Scotland
Scotland’s energy sector has benefited from EU funding for energy infrastructure projects and research and development, particularly in the pursuit of new, low carbon technologies and enabling infrastructure, such as offshore wind, marine renewables and integrated hydrogen solutions. For example:
• Scotland’s energy sector has benefited from EU funding for energy infrastructure projects and research and development, particularly in the pursuit of new, low carbon technologies and enabling infrastructure, such as offshore wind, marine renewables and integrated hydrogen solutions.
• Orkney, for example, is home to what was the UK’s first smart grid, connecting renewable generation to Orkney’s distribution network at a considerably lower cost than conventional network connection. The ‘Surf ‘n’ Turf’ project demonstrates a fully integrated energy model, with hydrogen produced using electricity from tidal and onshore wind turbines. This is stored in a fuel cell, and used to provide low carbon heat, power and transport. A European-funded project called ‘BIG HIT’ will build on the Surf ‘n’ Turf project in Orkney by producing hydrogen from renewable sources for transport and heating225.
• The Scottish Government launched the Low Carbon Infrastructure Transition Programme (LCITP) in March 2015, in partnership with Scottish Enterprise, Highlands and Islands Enterprise, Scottish Futures Trust and sector specialists. It is a Strategic Intervention supported by the European Structural and Investment Funds, and European match funding for the LCITP is guaranteed up until Autumn 2021226.
ii Where applicable, cooperation with other Member States in this area, including, where appropriate, information on how the SET Plan objectives and policies are being translated to a national context
The UK is a very active contributor to the ongoing work of the EU’s Strategic Energy Technology (SET) Plan, providing the Chair for two of its governance bodies (SET Plan Bureau and Joint Actions Working Group). The UK has participated in ten (out of fifteen) temporary working groups for the implementation of the integrated SET Plan, co-leading the one on nuclear safety. In addition, the UK is participating in 6 ERA-NET Co-Funds launched under H2020 (CCS, Bioenergy, Ocean energy, Smart grids, Solar Energy and Offshore Wind) leading those on Bioenergy, Ocean energy and Offshore Wind.
For Horizon 2020, the UK is involved in almost half of all successful H2020 Energy project proposals, providing evidence of the significant strengths and engagement from the UK’s energy research and innovation community towards delivering SET Plan objectives. SET Plan
225 Building Innovative Green Hydrogen Systems in Isolated Territories: https://www.bighit.eu/ 226 Renewable and low carbon energy, Scottish Government website: https://www.gov.scot/policies/renewable-and-low-carbon-energy/low-carbon-infrastructure-transition-programme/

The UK’s draft National Energy and Climate Plan (NECP)
88
delivery continues to form a major driver of the priorities and spending under H2020’s energy theme.
SET Plan objectives and policies in the energy technology areas relevant to the UK, already align well with our existing activities and we are actively looking for opportunities to increase bilateral and multilateral collaboration in these areas through the SET Plan’s governance structures.
UK International Energy Innovation activity can be split into 4 main areas::
• UK Government funding for R&D collaboration with developed countries
• UK Government funding for R&D collaboration with, in or targeting developing countries (usually classified as Overseas Development Assistance or ODA)
• European funding for UK organisations
• UK membership of multilateral organisations and fora
The UK Government funding in this area is delivered by different organisations, pursuing slightly different objectives. For example, UKRI typically focusses on excellent science and academic collaboration; whereas BEIS Energy Innovation focuses on industrial collaborations.
The UK’s Energy Innovation Board has an International Working Group (sub-Group to the EIB) tasked with developing cross-government co-operation opportunities and knowledge sharing related to international research and innovation collaboration. As part of its work, it has been developing an International Strategic Framework. Pooling a wide range of inputs from government funding organisations and stakeholders, the Framework identifies international objectives, key technology development needs, which countries have strengths in these areas and existing co-operation initiatives. The objective is to arrive at a menu of opportunities for international collaboration that can then be prioritised and pursued.
Examples of existing cross-Government activity
1. Energy Catalyst: Since 2013, BEIS, UKRI and DfID (since 2016) have provided funding enabling the Energy Catalyst programme to invest almost £100 million in grant funding across more than 750 organisations and 250 projects, via 6 rounds of open competition. Since DFID joined in round 4, the programme has included international Overseas Development Assistance (ODA) alongside the original UK focus.
2. International Climate Fund / Energy Innovation: The BEIS portion of the International Climate Fund, jointly administered with DFID and DEFRA, includes a commitment to invest £40 million on Energy Innovation projects. Officials are currently designing this in close consultation with other departments.
UK Government funding for R&D collaboration with developed countries
Across the UK Government, we expect to launch R&D collaborations with developed countries including the US, Canada and South Korea. UKRI (both Research Councils and Innovate UK) have run several competitions with these countries in the current spending review period. As part of future collaborations, BEIS and UKRI will discuss the possibility of co-funding calls.

The UK’s draft National Energy and Climate Plan (NECP)
89
The draft International Research and Innovation Strategy has recognised the issue of a relative lack of funding for collaboration with developed countries within the broader international research context, and is proposing a new non-ODA fund to support such collaboration.
UK Government funding for R&D collaboration with, in or targeting developing countries (usually classified as ODA)
As part of the UK’s Overseas Development Aid (ODA) funding, the UK Government has a substantial activity of R&D collaboration in developing countries, part of a wider set of ODA activities which span the full spectrum from R&D to technical assistance, and supporting innovation in market design and regulatory frameworks.
UK ODA funding for international energy innovation is delivered through many programmes and organisations, namely: BEIS (Newton Fund, Global Challenge Research Fund, and International Climate Fund); UKRI (Newton Fund, Global Challenge Research Fund); and DfID.
European funding for UK organisations
EU funding for energy innovation is largely delivered through two programmes: Horizon 2020 (the EU’s main R&D programme) & Euratom, and the European Regional Development Fund (ERDF).
EU: The UK is a very active contributor to the ongoing work of the EU’s Strategic Energy Technology (SET) Plan, providing the Chair for two of its governance bodies (SET Plan Bureau and Joint Actions Working Group). The UK participates in ten (out of fifteen) temporary working groups for the implementation of the integrated SET Plan, co-leading the one on nuclear safety. In addition, the UK is participating in 6 ERA-NETs launched under H2020 (CCS, Bioenergy, Wind, Smart grids, Ocean energy and Solar Energy). Regarding Horizon 2020, the UK is involved in almost half of all successful H2020 Energy project proposals enabling UK organisations to benefit from the results.
UK membership of multilateral organisations and fora
The UK is a member of several multilateral organisations which aim to share information on energy innovation activity including:
• Mission Innovation
• Clean Energy Ministerial
• International Energy Agency (the UK is active in IEA Governance structures including providing a Vice-Chair to the CERT. The UK is also active in the Energy Technology Network’s Technology Collaboration Programmes - UK organisations participate in c22 of these)
• International Renewable Energy Agency
• World Bank Group, particularly the Energy Sector Management Assistance Programme (ESMAP)

The UK’s draft National Energy and Climate Plan (NECP)
90
Areas of potential interest identified for UK international energy activity:
1. Efficient, resilient, smart networks (including: off-grid access, mini-grids and embedded mini-grids; storage and system balancing, and; vehicle charging
2. Electricity Supply – low cost renewables (also nuclear, CCS)
3. Heating and Cooling in Buildings
4. Industrial Energy Efficiency
5. Energy for Mobility
6. Land use and land waste (Including land-use for bioenergy)
7. Hydrogen
8. Supporting potentially disruptive technologies, systems and materials
9. Skills and capacity to support the energy transition
10. Increased Global Access to Affordable, Reliable Energy
11. Common Financial and Non-Financial Barriers
12. Supporting new supply chains, business models and customer value propositions
Mission Innovation:
There is strong momentum behind Mission Innovation227. Since Mission Innovation (MI) launched in 2015, MI estimates that members have committed in excess of US$31 billion to accelerate innovation in clean energy, three new members have joined Mission Innovation, it has brought together over 3,000 technical experts and innovators and more than 20 new international partnerships in clean energy between MI members have been announced.
The UK has a considerable leadership role in the initiative and as part of our involvement has pledged to double central government funding for energy innovation, to in excess of £400 million in 2020/21. The UK took over as Head of the Secretariat from the US on 1 October 2017. We are Vice-Chair of the Steering Committee and a member of all Innovation Challenges. The UK led the development of seven Innovation Challenges to deepen collaboration and information sharing between members. We are a member of all seven and co-lead the Affordable Heating and Cooling in Buildings Innovation Challenge with the UAE and EC.
The key Mission Innovation and UK priorities through to 2021 are:
• Deliver a substantial boost in public-sector investment in clean energy R&D
• Increase private sector engagement and investment in energy innovation
• Build new or strengthened international networks and partnerships in energy innovation
227 Mission Innovation, http://mission-innovation.net/

The UK’s draft National Energy and Climate Plan (NECP)
91
• Increase awareness of the transformational potential of energy innovation, the progress being made, and the remaining gaps and opportunities
As part of Mission Innovation, the UK is working with both the Breakthrough Energy Coalition (BEC) and the World Economic forum (WEF). At the One Planet Summit in Paris (December 2017), Breakthrough Energy founder Bill Gates announced public-private collaborations with five Mission Innovation members: Canada, European Commission, France, Mexico, and the United Kingdom. By combining government expertise and the Coalition’s convening power the partnership aims to focus on ensuring that the UK is one of the most attractive places in the world to invest in clean energy innovation and more rapidly bring breakthroughs from the lab to market.
We are building on the WEF’s System Initiative on Shaping the Future of Energy to explore whether the outcomes of that project are relevant to the UK context. This includes a planned joint workshop with business leaders and policy makers in May 2018. The WEF is also working with MI to run a series of round table events at the Mission Innovation Ministerial in May 2018.
iii Where applicable, financing measures in this area at national level, including Union support and the use of Union funds
Our vision for a knowledge-led economy is underpinned by world-leading research, world-class facilities and international collaborations that push scientific frontiers and attract the brightest talents, from Nobel Prize winners to ambitious graduate students. ‘Innovation clusters’ will form and grow around our universities and research organisations, bringing together world-class research, business expertise and entrepreneurial drive. These clusters can create thousands of skilled jobs in R&D, innovation and wider sectors, driven by the growth in science, technology, engineering and maths (STEM) skills led by new teachers and more doctorates.
We will work with industry in the coming months to develop a roadmap for meeting this target. This will provide a framework to drive business investment in R&D and focus on key sectors, technologies and clusters, including by optimising government investment to drive private investment in R&D and considering further opportunities to improve the business environment, including access to finance, regulatory frameworks, and intellectual property. This will maximise the impact of public investment in science and innovation to support businesses to invest more and drive outputs to realise our commitment to invest 2.4% of GDP in R&D.
Increasing investment in R&D to 2.4% of GDP in a decade is ambitious and will require concerted effort by the UK Government and business. As a first step we will invest an additional £2.3 billion over what was previously planned in 2021/22, raising total public investment in R&D to approximately £12.5 billion in that year alone. This investment will see public R&D spending increase as a share of GDP every year. It means that we will have raised public investment in R&D from around £9.5 billion last year (2016/17) to around £12.5 billion in 2021/22.
This is an extra £7 billion over five years – the biggest ever increase in public funding of R&D. The UK Government will invest strategically in technologies and ideas closer to market to drive UK competitiveness, while also continuing to fund the curiosity-driven research that is fundamental to the quality of our work and ensures our place as a world-leading knowledge economy.

The UK’s draft National Energy and Climate Plan (NECP)
92
SECTION B: ANALYTICAL BASIS228
4. CURRENT SITUATION AND PROJECTIONS WITH EXISTING POLICIES AND MEASURES229,230 In the 2017 Energy and Emissions Projections, projections of energy demand and greenhouse gas emissions extend to 2035.
4.1 Projected evolution of main exogenous factors influencing energy system and GHG emission developments
The UK’s energy and emissions projections are based on a set of key assumptions about UK economic growth, demographic changes in the UK and future fuel price trajectories. The main sources of the projections are the forecasts made by the UK’s Office for Budget Responsibility and Office for National Statistics. Fuel prices are produced by BEIS. Socio-economic growth projections are shown in Figure 10 below.
i Macroeconomic forecasts (GDP and population growth)
The Updated Energy and Emissions Projections (2017)231 used the following assumptons about macroeconomic forecasts, shown in Figure 10232. Over the projections period (2018 to 2035), the real UK GDP growth rate is projected to be between 1.6% (in 2018) and 2.3% (2028 onwards) over the projections period. Population growth is forecast to slow to 0.4% by 2035. Growth in the number of households is projected to decrease from 1.0% in 2016 to 0.6% in 2035. This is higher than growth in population due to shrinking household size.
228 See Part 2 for a detailed list of parameters and variables to be reported in Section B of the Plan. 229 Current situation shall reflect the date of submission of the national plan (or latest available date). Existing policies and measures encompass implemented and adopted policies and measures. Adopted policies and measures are those for which an official government decision has been made by the date of submission of the national plan and there is a clear commitment to proceed with implementation. Implemented policies and measures are those for which one or more of the following applies at the date of submission of the national plan or progress report: directly applicable European legislation or national legislation is in force, one or more voluntary agreements have been established, financial resources have been allocated, human resources have been mobilised. 230 The selection of exogenous factors may be based on the assumptions made in the EU Reference Scenario 2016 or other subsequent policy scenarios for the same variables. Besides, Member States specific results of the EU Reference Scenario 2016 as well as results of subsequent policy scenarios may also be a useful source of information when developing national projections with existing policies and measures and impact assessments. 231 Updated Energy and Emissions Projections 2017, https://www.gov.uk/government/collections/energy-and-emissions-projections 232 Updated Energy and Emissions Projections, Annex M: Growth assumptions and prices, https://www.gov.uk/government/publications/updated-energy-and-emissions-projections-2017

The UK’s draft National Energy and Climate Plan (NECP)
93
Figure 10: UK Growth Projections, percentage per annum233
% per annum Actual Projection
Year 2015 2016 2020 2025 2030 2035
GDP 2.2% 1.8% 1.9% 2.1% 2.3% 2.3%
Population 0.8% 0.7% 0.6% 0.6% 0.5% 0.4%
Households 1.0% 1.0% 0.9% 0.8% 0.7% 0.6%
ii Sectoral changes expected to impact the energy system and GHG emissions
Projections of energy demand in manufacturing industries and construction and in the commercial sector are calculated using projections of sectorial economic growth. Growth projections are calculated using historical relationships with GDP.
These are set out in 4.2.1.
iii Global energy trends, international fossil fuel prices, EU ETS carbon price
The main sources of the projections are the forecasts made by the UK’s Office for Budget Responsibility and Office for National Statistics. BEIS produces the fuel prices. As of 2018, the UK’s projections of energy demand and greenhouse gas emissions go to 2035.
Global Energy Trends
The UK Government develops and implements policies with the aim of reducing Greenhouse Gas (GHG) emissions in line with the carbon budgets and current international commitments. These projections indicate the broad scale of action that may be needed to keep emissions within the carbon budgets.
Between 1990 and 2015, UK GHG emissions fell by over 40% whilst the economy grew by over 70%234. In comparison, G7 emissions fell by 4% and G7 GDP grew by 65%. Emissions are projected to continue falling against the backdrop of a growing economy.
Legally binding carbon budgets are set for five-year periods, shown in Figure 11.
233 Updated Energy and Emissions Projections, Annex M: Growth assumptions and prices, https://www.gov.uk/government/publications/updated-energy-and-emissions-projections-2017 234 Committee on Climate Change, UK Government Response, https://www.gov.uk/government/publications/committee-on-climate-changes-2018-progress-report-government-response

The UK’s draft National Energy and Climate Plan (NECP)
94
Figure 11: Performance against carbon budgets, MtCO2e235
Carbon budget: 1 (2008-12)
2 (2013-17)
3 (2018-22)
4 (2023-27)
5 (2028-32)
Actual Projection Projection Projection Projection
Carbon Budget level: cumulative emissions
3,018 2,782 2,544 1,950 1,725
Average required reduction vs 1990 emissions, %
-25% -31% -37% -51% -57%
2017 Existing policies
Projected emissions, Mt
2,982 2,657 2,401 2,044 1,921
Existing and new policies and proposals236
Projected emissions, Mt
2,982 2,657 2,401 2,014 1,841
Result vs. Budget, emissions, Mt
-36 -125 -143 64 116
Result vs. Budget, %
-1.2% -4.5% -5.6% 3.3% 6.7%
Cumulative surplus (+) or deficit (-), Mt
+125 +268 +204 +88
Fossil Fuel Prices
Fossil fuel price projections237 and carbon prices projections238 are updated annually by BEIS. Key fossil fuel and carbon price values are set out below in Figure 12 and exchange rates are shown in Figure 13.
235 Updated Energy and Emissions Projections, Annex M: Growth assumptions and prices, Table 2.1 https://www.gov.uk/government/publications/updated-energy-and-emissions-projections-2017 236 Includes emissions reduction estimates of a subset of new early stage policies and proposals from the CGS showing an additional potential reduction of up to 30Mt and 80Mt over the fourth and fifth carbon budget periods respectively. These projections are based on the EEP reference case (central assumption). 237 Fossil Fuel Price Assumptions, 2017, https://www.gov.uk/government/publications/fossil-fuel-price-assumptions-2017 238 Updated Short-Term Traded Carbon Values, 2018 https://www.gov.uk/government/uploads/system/uploads/attachment_data/file/671191/Updated_short-term_traded_carbon_values_for_modelling_purposes.pdf; Carbon Valuation, 2018 https://www.gov.uk/government/collections/carbon-valuation--2

The UK’s draft National Energy and Climate Plan (NECP)
95
Figure 12: Central Fossil Fuel and Carbon Prices, 2017 prices239
2017 prices Actual Projection
Units 2015 2016 2020 2025 2030 2035
Crude oil (Brent 1 month) $/bbl 55.9 45.8 57.0 69.0 80.0 80.0
Gas (NBP) p/therm 44.5 35.6 43.0 55.0 67.0 67.0
Coal (CIF ARA) $/tonne 58.0 57.0 65.0 77.0 88.0 88.0
EU ETS carbon price £/tCO2 5.8 4.5 4.6 13.2 39.4 39.4
Figure 13: Exchange Rates, Against Sterling240
Currency Units Actual Projection
2015 2016 2020 2025 2030 2035
US Dollars $ per £ 1.5 1.4 1.3 1.3 1.3 1.3
Euros € per £ 1.4 1.2 1.1 1.1 1.1 1.1
BEIS produces a set of fossil fuel price assumptions based on available evidence around these fundamentals and their potential development over time to yield a plausible range for future prices. These assumptions are required for long-term modelling of the UK energy system and economic appraisal. They are not forecasts of future energy prices.
Combining high supply with the low demand and low supply with high demand to construct the long term low and high price assumptions for each fuel yields long term price assumptions that span a wide range of possible outcomes. While the long-term demand projections and supply outlooks are from different sources, we considered these combinations to be plausible for each fuel.
EU ETS Carbon Price
Pricing emissions provides a cost-effective and technology neutral way of reducing carbon emissions and mobilising the private sector. In the UK, pricing policies like Carbon Price
239 Updated Energy and Emissions Projections, Annex M: Growth assumptions and prices https://www.gov.uk/government/publications/updated-energy-and-emissions-projections-2017 240 Updated Energy and Emissions Projections, Annex M: Growth assumptions and prices https://www.gov.uk/government/publications/updated-energy-and-emissions-projections-2017

The UK’s draft National Energy and Climate Plan (NECP)
96
Support (CPS), and the EU Emissions Trading System (EU ETS) have already helped to drive a switch from coal to gas generation in the power sector.
The UK considers that long-term certainty on carbon pricing is crucial for businesses, and, as set out in the CGS, is committed to a robust carbon price. The UK remain firmly committed to carbon pricing as an emissions reduction tool, whilst ensuring energy and trade intensive businesses are appropriately protected from any detrimental impacts on competitiveness.
BEIS’ short-term traded carbon values for modelling purposes are used to demonstrate the financial cost of purchasing allowances under the EU ETS. The short-term traded carbon values for UK public policy appraisal are produced for the period up to 2020 under all three scenarios (central, high and low), and are linearly extended beyond 2020 to reach BEIS’s long-term carbon values for the period beyond 2030. These long-term carbon values reflect the costs required to limit global temperature increases to 2 degrees centigrade above pre-industrial levels. BEIS’s latest short-term traded values can be found in the Updated Short-Term Traded Carbon Values publication241.
iv Technology cost developments
Electricity generation costs are a fundamental part of energy market analysis, and a good understanding of these costs is important when analysing and designing policy.
BEIS regularly produces updated estimates of the costs and technical specifications for different generation technologies.
Costs in the report are presented as levelised costs, which is a measure of the average cost per MWh generated over the full lifetime of a plant including planning costs, construction costs, operating costs, and carbon costs. It reflects the cost of building, operating and decommissioning a generic plant for each technology. Potential revenue streams are not considered. All estimates are in 2014 real values.
BEIS’s most recent assessment of electricity generation costs can be found in the Electricity Generation Cost Report242 which covers both renewable and non-renewable technologies; Figure 14 (below) gives the most recent levelised cost estimates for key technologies in a range of commissioning years from this report. BEIS is currently undertaking a review of the evidence on electricity generation.
241 Carbon valuation, January 2018, https://www.gov.uk/government/collections/carbon-valuation--2 242 Electricity Generation Cost Report, 2016, https://assets.publishing.service.gov.uk/government/uploads/system/uploads/attachment_data/file/566567/BEIS_Electricity_Generation_Cost_Report.pdf

The UK’s draft National Energy and Climate Plan (NECP)
97
Figure 14: Levelised Cost Estimates for NOAK Projects Commissioning in 2020
Technology-specific Hurdle rates, £/MWh, 2014 prices
CCGT H Class
OCGT 600MW (500hrs)
Offshore Wind
Large Scale Solar PV
Onshore Wind
Pre Development Costs
0 5 5 6 4
Construction Costs 7 63 73 52 44
Fixed O&M 2 17 24 9 10
Variable O&M 3 3 3 0 5
Fuel Costs 35 52 0 0 0
Carbon Costs 19 28 0 0 0
Total 66 166 106 67 63
4.2 Dimension Decarbonisation
4.2.1 GHG emissions and removals
i Trends in current GHG emissions and removals in the EU ETS, effort sharing and LULUCF sectors and different energy sectors
UK GHG emissions have decreased by over 40% between 1990 and 2016, as shown by Figure 15243. This has been driven by several factors such as restructuring in the energy supply industry (concerted move away from coal and oil generation towards use of gas and increase in renewables), energy efficiency, pollution control measures in the industrial processes sector and other policies that reduced emissions of non-carbon dioxide GHGs, most notably the increase in landfill methane capture and oxidation. More details can be found in the UK’s annual GHG emissions inventory.
243 Covers total UK emissions excluding the impact of Gibraltar. 2016 Greenhouse Gas Emissions Statistics, BEIS, https://www.gov.uk/government/collections/final-uk-greenhouse-gas-emissions-national-statistics

The UK’s draft National Energy and Climate Plan (NECP)
98
Figure 15: Total emissions of GHGs, UK, 1990–2016, MtCO2e244
Figure 16 below summarises the UK’s historical and projected GHG emissions by sector. Projections have been presented ‘with existing measures’. These include those measures which have been implemented or adopted and exclude planned policies. The UK updates its national emissions projections for CO2 and the other GHGs annually to take account of new data including revisions to policy savings estimates, fossil fuel prices, carbon price projections, growth projections and cost estimates for the power sector. There are also improvements to the underlying energy and emissions projection model.
UK GHG emissions including LULUCF are currently projected to be 49% below 1990 levels in 2020 and 53% below in 2030244. For estimates excluding Land Use, Land Use Change and Forestry (LULUCF), the percentages are very similar. Land use, land-use change and forestry (LULUCF) emissions and removals are reported in the UK’s GHG inventory in accordance with the rules for reporting the emissions and removals of this sector under the UNFCCC. This reporting basis includes an estimate of all anthropogenic sources minus sinks from the LULUCF sector.
244 2016 Greenhouse Gas Emissions Statistics, BEIS, https://www.gov.uk/government/collections/final-uk-greenhouse-gas-emissions-national-statistics

The UK’s draft National Energy and Climate Plan (NECP)
99
ii Projections of sectoral developments with existing national and Union policies and measures at least until 2040 (including for the year 2030)
Figure 16: UK Greenhouse gas emissions by source sector, MtCO2e245
Inventory Projections
Sector 1990 1995 2000 2005 2010 2015 2020 2025 2030 2035
Agriculture 58.9
58.3
54.8
51.1
48.6
49.1
46.6
44.8
44.4
44.3
Business 114.4
112.2
116.2
109.8
94.8
84.6
75.9
66.4
59.7
57.2
Energy Supply
277.9
237.8
220.9
231.0
206.7
144.1
86.0
67.7
74.0
76.0
Industrial processes
60.0
50.9
27.1
20.6
12.7
12.7
10.0
9.4
9.0
8.8
Land use, land use change and forestry
5.7
3.1
0.5
- 3.2
- 5.8
- 7.4
- 1.2
- 9.0
- 6.8
- 5.3
Public 13.5
13.3
12.1
11.2
9.7
8.1
7.0
6.9
7.5
7.9
Residential 80.1
81.7
88.7
85.7
87.5
66.3
66.4
67.3
71.3
74.9
Transport 121.9
122.2
126.7
130.4
120.1
120.0
116.4
112.2
109.1
107.6
Waste Management
66.6
69.0
62.7
49.2
31.7
18.2
13.7
12.0
11.0
10.5
Total net GHG emissions
799.0
748.5
709.7
685.8
605.9
495.7
410.9
377.6
379.2
382.0
The emissions above have been reported on the same basis as the UK Climate Change Act, covering the UK only excluding Gibraltar.
245 Updated Energy and Emissions Projections 2017, https://www.gov.uk/government/publications/updated-energy-and-emissions-projections-2017. Note that projections include UK only excluding Gibraltar.

The UK’s draft National Energy and Climate Plan (NECP)
100
Progress across the emissions trading (EU ETS) and non-traded (effort sharing regulation) sectors
The traded sector is largely made up of power and heavy industry emissions (reported within the energy supply and business sectors in Figure 16). The Updated EEP 2017246 give figures which show that these sectors made up around 36% of UK emissions in 2015 and are projected to decrease by almost 40% as we progress towards 2030 with existing measures relative to 2015. With planned measures this reduction may increase to as much as 50%. The remaining sectors covered by the effort sharing regulation (excluding LULUCF) have fallen by around 17% between 2008 and 2015. They are projected to decrease by a further 14% by 2030, before planned and CGS policies are taken into account.
Figure 17: Projected UK emissions (with existing measures)247
Residential buildings Emissions in the residential sector arise from fuel combustion for heating, cooking, garden machinery, fluorinated gases released from aerosols and metered dose inhalers (such as those used for asthma sufferers), and carbon emissions released from the breakdown of consumer products (such as detergents). In 2015, residential sector emissions made up 13% of the UK total, estimated as 66 MtCO2e, compared to 1990 emissions of 80 MtCO2e, a reduction of approximately 17%248. A number of factors have had a major influence on emissions from homes, including a growth in demand for underlying energy services (such as warmer homes, hot water and home entertainment) and background improvement in energy
246 Updated Energy and Emissions Projections 2017, Annex A, https://www.gov.uk/government/publications/updated-energy-and-emissions-projections-2017 247 Updated Energy and Emissions Projections 2017, Annex A, https://www.gov.uk/government/publications/updated-energy-and-emissions-projections-2017 248 Updated Energy and Emissions Projections 2017, Annex A, https://www.gov.uk/government/publications/updated-energy-and-emissions-projections-2017
-100
0
100
200
300
400
500
600
700
2008 2013 2018 2023 2028 2033
(Em
issio
ns) M
tCO
2e
Non-traded (effort sharing) sectors
All sectors
Traded (EU ETS) sectors
Land use change and forestry (LULUCF)

The UK’s draft National Energy and Climate Plan (NECP)
101
efficiency. The average household’s energy consumption has fallen by over 17% since 1990249.
The principal long-term driver of emissions in UK households is the household numbers themselves. These are projected to increase over the whole period both due to population growth in the UK and due to the disproportionate increase in smaller households. Up to 2020 the impact of increases in population and housing are offset by the impact of existing energy and emission reduction policies, for example, through the improved insulation of homes. The overall impact of these factors has driven a projected rise in domestic emissions by 12 MtCO2e (18%) by 2035 compared to 2015250.
Public sector Emissions from the public sector occur from the combustion of fuel in public sector buildings. This includes public administration and defence; compulsory social security; education; and health and social work. Public sector emissions fell from an estimated 13 MtCO2e in 1990 to 8 MtCO2e in 2015, a reduction of 40%. In 2015 this sector represented 2% of total emissions251. Emissions from public services are projected to remain broadly constant until the mid-2020s before rising slightly in the late 2020s and 2030s.
Transport The transport sector includes emissions from domestic aviation, road transport, diesel railways and domestic shipping (coastal, inland waterways). Transport accounted for almost a quarter (24%) of UK GHG emissions in 2015252. Since 1990 emissions in this sector have reduced by around 2%. While new cars in the UK are up to 16% more efficient than they were in 2000253, this improvement has been largely offset by a 9% increase in road traffic to 2015254, with the number of registered vehicles increasing over the same period from 28.9 million to 36.5 million255.
Transport emissions are projected to be 4% lower than 1990 levels by 2020 and 11% lower by 2030. The underlying growth in road transport use, which was interrupted by the economic recession from 2008, is projected to resume. However, measures to improve vehicle efficiency; such as the EU tailpipe emissions targets for new cars and vans, or to directly reduce emissions, such as mandating greater use of biofuels and providing incentives to encourage the adoption of electric vehicles are expected to reduce annual emissions between now and 2030.
Waste The waste management sector includes emissions from waste disposed to landfill sites, waste incineration, and the treatment of waste water. Emissions from disposal of waste have decreased by 73% since 1990256. This decrease has been realised mainly due to tighter 249 BEIS (2017) Energy Consumption in the UK, https://www.gov.uk/government/statistics/energy-consumption-in-the-uk. Change in average consumption per household 1990-2016. 250 Updated Energy and Emissions Projections 2017, Annex A, https://www.gov.uk/government/publications/updated-energy-and-emissions-projections-2017 251 Updated Energy and Emissions Projections 2017, Annex A, https://www.gov.uk/government/publications/updated-energy-and-emissions-projections-2017 252 Updated Energy and Emissions Projections 2017, Annex A, https://www.gov.uk/government/publications/updated-energy-and-emissions-projections-2017 253 Fuel efficiencies are from DfT modelling using DfT (2017) Vehicle statistics; ICCT (2015) From Laboratory to Road: A 2015 update http://www.theicct.org/ laboratory-road-2015-update 254 DfT (2016) Road traffic estimates in Great Britain: 2015 https://www.gov.uk/government/statistics/road-traffic-estimates-in-great-britain-2015 . Measured in ‘vehicle miles’ which combines the number of vehicles on the road and how far they drive. 255 DfT (2017) Licensed vehicles and new registration tables, https://www.gov.uk/government/statistical-data-sets/all-vehicles-veh01 256 Updated Energy and Emissions Projections 2017, Annex A, https://www.gov.uk/government/publications/updated-energy-and-emissions-projections-2017

The UK’s draft National Energy and Climate Plan (NECP)
102
regulation of landfills, through fitting of methane recovery systems on landfills, and increasing diversion of biodegradable waste from landfill, plus more diversion away from landfills in response to the UK landfill tax and policies to meet the requirements of the EU Landfill Directive.
Annual GHG emissions from waste management are projected to fall to 79% below 1990 levels by 2020 and by 83% by 2030257. The continuing reduction in waste emissions is caused by the continuing decrease in landfill emissions as more waste is preferentially sent to alternative disposal routes (incineration, biological waste treatment (BWT) and recycling) and small further improvements in landfill efficiency are made. The policy which partially drives this, the Landfill Directive, expires in 2020. Therefore, the proportion of waste going to landfill is projected to stop decreasing post 2020, although emissions reductions should continue as landfill emissions lag behind disposal. Partially counteracting the decrease in landfill emissions are projected increases in BWT emissions and domestic wastewater emissions.
Agriculture The agriculture sector includes emissions from livestock and agricultural soils, stationary combustion sources and off-road machinery (e.g. tractors). There are also small amounts of emissions of CO2 from the breakdown of pesticides. In 1990, GHG emissions from agriculture were estimated to be 59 MtCO2e or 7% of total UK GHG emissions. Emissions from this sector have fallen by an estimated 17% between 1990 and 2015258. The fall in emissions is the result of decreasing animal numbers and fertiliser use. Emissions from this sector are projected to be fairly stable through the 2020s and 2030s. The CGS sets out further proposals for the agricultural sector; we want low emission, highly productive land while ensuring we hand our environment on to the next generation in a better state than we found it.
Energy supply Energy supply was responsible for an estimated 144 MtCO2e or 29% of total GHG gas emissions in 2015. Between 1990 and 2015 there has been a 48% decrease in GHG emissions from the energy supply sector259. This decrease has resulted mainly from the switch from coal to gas and renewable power such as wind and solar, with biomass conversions also playing an important transitional role, alongside improvements in the efficiency of our economy. In 2017, over 50% of our electricity came from low carbon sources, with the rest mainly coming from coal and gas260. Coal use fell to record low levels last year, and on 21 April 2017, for the first time since 1882, GB did not use any coal for a 24-hour period261. At the same time, we have ensured a secure supply of electricity.
Energy supply emissions are projected to be 69% lower than 1990 levels by 2020 and 73% below by 2030262. Following a sharp fall in coal fired generation in 2016, a further gradual decline in fossil fuel-based generation out to 2035 is projected. This is displaced by more renewables and eventually nuclear based generation with increased imports (via interconnectors) until new nuclear capacity reduces the need for this in the 2030s. As a
257 Updated Energy and Emissions Projections 2017, Annex A, https://www.gov.uk/government/publications/updated-energy-and-emissions-projections-2017 258 Updated Energy and Emissions Projections 2017, Annex A, https://www.gov.uk/government/publications/updated-energy-and-emissions-projections-2017 259 Updated Energy and Emissions Projections 2017, Annex A, https://www.gov.uk/government/publications/updated-energy-and-emissions-projections-2017 260 Digest of UK Energy Statistics (DUKES) 2018, https://www.gov.uk/government/statistics/digest-of-uk-energy-statistics-dukes-2018-main-report 261 Financial Times (2017) Britain passes historic milestone with first days of coal-free power https://www.ft.com/content/fc2c8d12-191d-11e6-bb7d-ee563a5a1cc1 BEIS (2017) Energy Trends June 2017 https://www.gov.uk/government/collections/energy-trends 262 Updated Energy and Emissions Projections 2017, Annex A, https://www.gov.uk/government/publications/updated-energy-and-emissions-projections-2017

The UK’s draft National Energy and Climate Plan (NECP)
103
consequence, emissions from electricity production are projected to fall steadily over the full period to 2035, shown in Figure 18.
Figure 18: Emissions intensity of electricity supply (UK coverage, with additional measures), gCO2e/KWh263
Business & industrial processes The business sector covers emissions from stationary combustion in all industrial and commercial sectors (including the combustion of fuel to provide the heat required for certain industrial processes or for heating), industrial off-road machinery, refrigeration and air conditioning, and the use of fluorinated gases for other applications. In 2015, emissions from this sector were estimated to be 26% below 1990 levels and represented an estimated 17% of total emissions264. Several factors contributed to this decrease; primarily due to a reduction in emissions from industrial combustion, including iron and steel. Each tonne of steel produced in the UK requires 40% less energy to produce than 40 years ago265. Emissions in this area are projected to fall to 34% below 1990 levels by 2020, and to 48% below by 2030266. Improvements over time are attributable to the impact of policies that encourage energy efficiency, such as Building Regulations, minimum energy efficiency standards for new products and economic measures such as the Carbon Reduction Commitment and the Renewable Heat Incentive.
The industrial processes sector contains all emissions from industry except for those associated with fuel combustion. Sources include metal production, mineral products (cement and lime) and chemical production. Industrial process emissions have decreased by an estimated 79% since 1990. The largest reductions are due to emissions trading schemes and the chemical manufacturing industry, most notably the abatement of N2O emissions from nitric and adipic acid manufacture in response to Integrated Pollution Prevention Control. Emissions 263 Updated Energy and Emissions Projections 2017, Figure 5.2, https://www.gov.uk/government/publications/updated-energy-and-emissions-projections-2017 264 Updated Energy and Emissions Projections 2017, Annex A, https://www.gov.uk/government/publications/updated-energy-and-emissions-projections-2017 265 WSP and Parsons Brinckerhoff & DNV GL (2015) Report prepared for DECC & BIS: Industrial Decarbonisation & Energy Efficiency Roadmaps to 2050 https://www. gov.uk/government/publications/industrial-decarbonisation-and-energy-efficiency-roadmaps-to-2050 266 Updated Energy and Emissions Projections 2017, Annex A, https://www.gov.uk/government/publications/updated-energy-and-emissions-projections-2017
2017 2022 2027 2032 0
50
100
150
200
250

The UK’s draft National Energy and Climate Plan (NECP)
104
from industrial processes are projected to fall to 83% below 1990 levels by 2020 and 85% below by 2030267.
Land use, land use change and forestry (LULUCF) The UK has moved from being a net source of CO2 from LULUCF activities in 1990 to a net sink for all years since 2000. Between 1990 and 2015, total emissions of direct GHGs from the LULUCF sector decreased by an estimated 13MtCO2e. The size of the net sink has increased by around 2 MtCO2e between 2010 and 2015268. The land use categories which have the greatest effect on the net LULUCF emissions / removals are forest land (a net sink), cropland (a net source) and grassland (a net sink). Emissions from cropland have decreased by 24% since 1990 (8% since 2010). Net removals from grassland have increased by 17% since 1990.
From 1990, the amount of carbon stored in UK trees has been increasing, with the accumulation rate reaching a net sink of 15.7 MtCO2/year in 2015. However, the UK’s experts expect this balance to change in future as forests mature (in mature forests carbon uptake is reduced) and more are felled (and replanted) as part of the sustainable forest management cycle. By 2030 the accumulation rate is projected to have fallen substantially.
4.2.2 Renewable energy
i Current share of renewable energy in gross final energy consumption and in different sectors (heating and cooling, electricity and transport) as well as per technology in each of these sectors
All figures used in this section are 2017 outturn data, taken from Digest of UK Energy Statistics 2018, Tables 6.6 and 6.7269. Figures 19 to 22 use data from Table 6.7 which is measured using net calorific values; it also normalises wind and hydro generation and includes only heat pumps with a seasonal performance factor above 2.5. In contrast, Figures 23 to 26 use data from Table 6.6 which uses gross calorific values and includes all heat pumps.
Figure 19 shows that currently, renewable energy makes up over 10% of capped gross final energy consumption. Of all final consumption of renewable energy, electricity generation makes up around 60%, heating and cooling 30% and transport biofuels less than 10%.
267 Updated Energy and Emissions Projections 2017, Annex A, https://www.gov.uk/government/publications/updated-energy-and-emissions-projections-2017 268 Updated Energy and Emissions Projections 2017, Annex A, https://www.gov.uk/government/publications/updated-energy-and-emissions-projections-2017 269 Digest of UK Energy Statistics 2018, https://www.gov.uk/government/statistics/digest-of-uk-energy-statistics-dukes-2018-main-report

The UK’s draft National Energy and Climate Plan (NECP)
105
Figure 19: Overall renewables
Sector Thousand tonnes of oil equivalent (measured using net calorific values)
Electricity generation 8,397
Heating and cooling 4,254
Transport biofuels (restricted to those meeting sustainability criteria from 2011)
925
Total Final Consumption of Renewable Energy
13,575
Capped Gross Final Energy Consumption (CGFEC)
133,725
Current share of renewable energy in gross final energy consumption (headline 2009 Renewable Energy Directive percentage)270
10.2%
Figure 20 shows the renewable make up of the electricity generation component; around 28% of all electricity came from renewable sources. This component has the highest renewable share, versus heating and cooling and transport. Half of all renewable electricity came from wind generation.
Figure 20: Electricity generation component
Component Thousand tonnes of oil equivalent (measured using net calorific values)
Total renewable generation from all compliant sources271
8,401
Total Gross Electricity Consumption272 30,135
Percentage of electricity from renewable sources
27.9%
270 Includes adjustments for losses, and generation own use of electricity, combined with the capping mechanism for air transport as specified in the Directive. 271 The electricity figure under overall directive target (Figure 19) excludes the renewable electricity component of transport to prevent double counting – this is the cause of the 4 ktoe discrepancy between renewable energy used for electricity generation in Figure 19 and total renewable generation from all compliant sources in Figure 20. 272 Excludes generation from pumped storage.

The UK’s draft National Energy and Climate Plan (NECP)
106
Figure 21 shows the renewable make up of the heating component; around 8% of all heating and cooling came from renewable sources.
Figure 21: Heat component
Component Thousand tonnes of oil equivalent (measured using net calorific values)
Renewable energy for heating and cooling 4,254
Total Gross energy consumption for heating and cooling
54,979
Percentage of heating and cooling energy from renewable sources
7.7%
Figure 22 shows the renewable make up of the transport component; around 5% of all transport energy came from renewable sources. This is made up largely of renewable electricity and compliant biofuels.
Figure 22: Transport component (excluding air transport)
Component273 Thousand tonnes of oil equivalent (measured using net calorific values)
Total transport component numerator (including weighted components)
1,906
Total transport component denominator (including weighted components)
41,323
Percentage of transport energy from renewable sources
4.6%
Figure 23 shows the renewable sources used to generate electricity. Bioenergy makes up the largest proportion of this (59%), with plant biomass being the largest contributor within this. Onshore wind and offshore wind make up the next largest proportion of this; 18% and 13% respectively.
273 Some sustainable biofuels are double weighted in the numerator of this calculation, as specified by the Directive.

The UK’s draft National Energy and Climate Plan (NECP)
107
Figure 23: Renewable sources used to generate electricity
Source Energy values, thousand tonnes of oil equivalent (measured using gross calorific values)
Share of total
Onshore Wind 2,501 18%
Offshore Wind 1,798 13%
Marine energy274 0.4 0%
Solar photovoltaics 991 7%
Small scale hydro 114 1%
Large scale hydro275 396 3%
Bioenergy: 8,196 59%
of which Landfill gas 1,405 10%
of which Sewage gas 317 2%
of which Biodegradable energy from waste
1,185 8%
of which Co-firing with fossil fuels 18 0%
of which Animal biomass276 226 2%
of which Anaerobic digestion 810 6%
of which Plant biomass277 4,235 30%
Total 13,996 100%
Non-biodegradable wastes278 1,191
274 Wave and tidal stream, including EMEC test facility. 275 Excluding pumped storage stations 276 Includes heat from farm waste digestion, and meat and bone combustion. 277 Includes heat from straw, energy crops, paper and packaging. 278 Non-biodegradable part of municipal solid waste plus waste tyres, hospital waste, and general industrial waste.
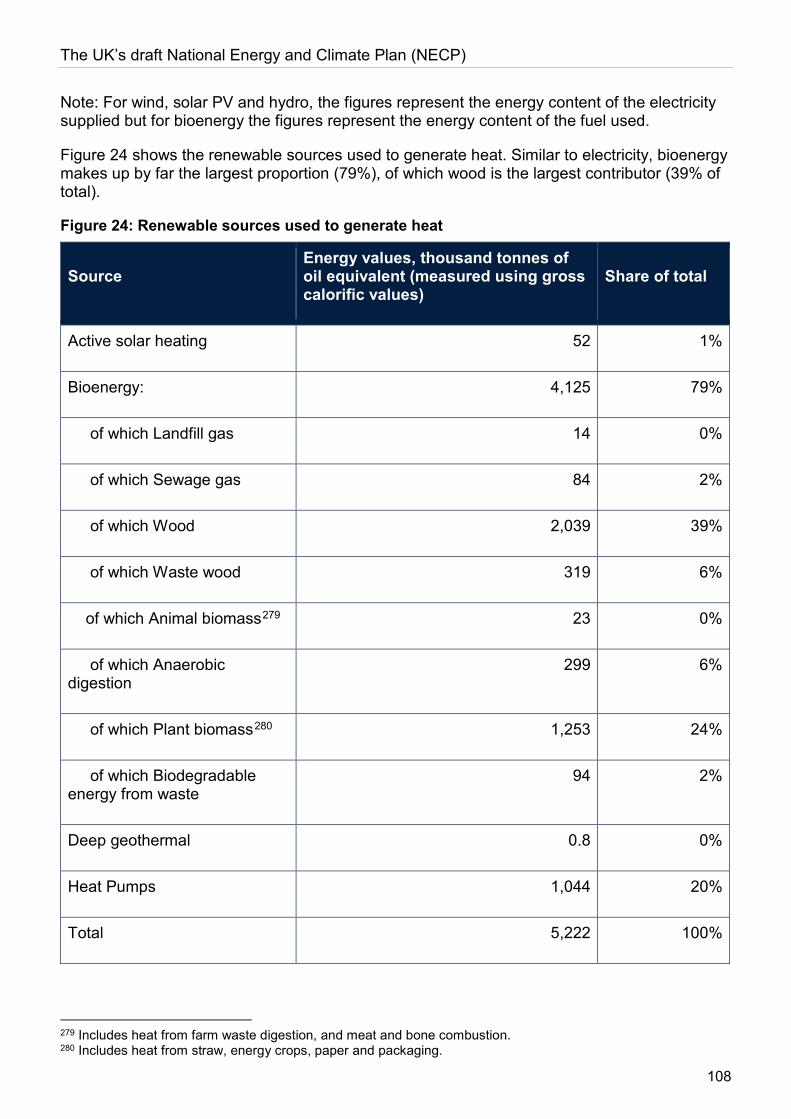
The UK’s draft National Energy and Climate Plan (NECP)
108
Note: For wind, solar PV and hydro, the figures represent the energy content of the electricity supplied but for bioenergy the figures represent the energy content of the fuel used.
Figure 24 shows the renewable sources used to generate heat. Similar to electricity, bioenergy makes up by far the largest proportion (79%), of which wood is the largest contributor (39% of total).
Figure 24: Renewable sources used to generate heat
Source Energy values, thousand tonnes of oil equivalent (measured using gross calorific values)
Share of total
Active solar heating 52 1%
Bioenergy: 4,125 79%
of which Landfill gas 14 0%
of which Sewage gas 84 2%
of which Wood 2,039 39%
of which Waste wood 319 6%
of which Animal biomass279 23 0%
of which Anaerobic digestion
299 6%
of which Plant biomass280 1,253 24%
of which Biodegradable energy from waste
94 2%
Deep geothermal 0.8 0%
Heat Pumps 1,044 20%
Total 5,222 100%
279 Includes heat from farm waste digestion, and meat and bone combustion. 280 Includes heat from straw, energy crops, paper and packaging.

The UK’s draft National Energy and Climate Plan (NECP)
109
Source Energy values, thousand tonnes of oil equivalent (measured using gross calorific values)
Share of total
Non-biodegradable wastes281 169
Figure 25 shows the renewable sources used as transport fuels. Biodiesel makes up the largest proportion, at 57%, while bioethanol makes up 43%.
Figure 25: Renewable sources used as transport fuels
Fuel Energy values, thousand tonnes of oil equivalent (measured using gross calorific values)
Share of total
Bioethanol 424 43%
Biodiesel 573 57%
Total 997 100%
Figure 26 shows the renewable sources used for total renewable energy. Bioenergy is the largest proportion, at over 60%, followed by onshore wind (12%) and offshore wind (9%).
Figure 26: Total use of renewable sources and wastes
Energy values, thousand tonnes of oil equivalent (measured using gross calorific values)
Share of total
Solar heating and photovoltaics 1,043 5%
Onshore wind 2,501 12%
Offshore wind 1,798 9%
Marine energy (wave and tidal stream) 0.4 0%
Hydro 510 3%
281 Non-biodegradable part of municipal solid waste plus waste tyres, hospital waste, and general industrial waste.

The UK’s draft National Energy and Climate Plan (NECP)
110
Energy values, thousand tonnes of oil equivalent (measured using gross calorific values)
Share of total
Bioenergy 12,321 61%
Deep geothermal 0.8 0%
Heat pumps 1,044 5%
Transport biofuels 997 5%
Total 20,216 100%
Non-biodegradable wastes282 1,359
ii Indicative projections of development with existing policies for the year 2030 (with an outlook to the year 2040)
In the UK Government’s Energy and Emissions Projections (EEP) 2017283, which should be considered alongside the CGS which sets out ambitious policies and proposals to meet the UK’s carbon reduction targets, 63GW of renewable electricity generation is expected in 2030284. This accounts for around 50% of total electricity generation. In an EEP 2017 reference scenario, 161 TWh of renewable electricity generation is expected in 2030, rising to 163 TWh in a high fossil fuel price scenario, which is over 50% of total electricity generation285. Up to 2020, the reference scenario reflects current power sector policies. Beyond 2020, the reference scenario includes some assumptions that go beyond current UK Government policy, and is therefore illustrative. The results do not indicate a preferred outcome and should also be treated as illustrative.
The EEP (2017) also states that renewables are projected to meet 10% of industrial energy demand in 2030 compared to 6% in 2016. For the services sector, the share of demand met by electricity and renewables is projected to increase to 59% in 2035 from 47% in 2016.
Figure 27, below, shows the projections of generation by technology for all power producers to 2035.
282 Non-biodegradable part of municipal solid waste plus waste tyres, hospital waste, and general industrial waste.
283 Updated energy and emissions projections: 2017, https://www.gov.uk/government/publications/updated-energy-and-emissions-projections-2017 284 Updated energy and emissions projections: 2017, Annex L, https://www.gov.uk/government/publications/updated-energy-and-emissions-projections-2017 285 Updated energy and emissions projections: 2017, Annex J, https://www.gov.uk/government/publications/updated-energy-and-emissions-projections-2017

The UK’s draft National Energy and Climate Plan (NECP)
111
Figure 27: UK electricity generation and net imports, TWh286
4.3 Dimension Energy efficiency
i Current primary and final energy consumption in the economy and per sector (including industry, residential, service and transport)
Figure 28: Primary and Final Energy Consumption287
ii Current potential for the application of high-efficiency cogeneration and efficient district heating and cooling288
Cogeneration & district heating
In 2016, the Department of Energy & Climate Change published the national comprehensive assessment of the potential for combined heat and power (CHP) and district heating and cooling in the UK289, which laid out the technical and socially cost-effective potential for CHP
286 Updated energy and emissions projections: 2017, https://www.gov.uk/government/publications/updated-energy-and-emissions-projections-2017 287 This figure reports the latest UK statistical data required by point (a) of Annex XIV of the Directive, DUKES 2018, https://www.gov.uk/government/statistics/digest-of-uk-energy-statistics-dukes-2018-main-report 288 In accordance with Article 14(1) of Directive 2012/27/EU 289 Ricardo Energy & Environment (2015) Report for DECC: National Comprehensive Assessment of the Potential for Combined Heat and Power and District Heating and Cooling in the UK, https://www.gov.uk/government/publications/the-national-comprehensive-assessment-of-the-potential-for-combined-heat-and-power-and-district-heating-and-cooling-in-the-uk
2007 2015 2016 2017 Units (i) primary energy consumption; 212.2 183.0 180.5 178.1 mtoe (ncv) (ii) total final energy consumption; 145.2 131.0 133.6 132.6 mtoe (ncv) (iii) final energy consumption by sector mtoe (ncv) — industry 28.9 22.8 22.4 22.7 mtoe (ncv) — transport (passenger) 43.0 38.3 39.2 39.7 mtoe (ncv) — transport (freight) 13.6 13.7 13.7 13.7 mtoe (ncv) — households 41.7 37.3 38.5 37.1 mtoe (ncv) — services (excl agriculture) 17.2 17.8 18.4 18.1 mtoe (ncv) — agriculture 0.9 1.2 1.3 1.4 mtoe (ncv)

The UK’s draft National Energy and Climate Plan (NECP)
112
(referred to as high-efficiency cogeneration in Member States) and efficient district heating and cooling in the UK, up to 2030. Figure 29 sets outs the conclusions of cost and benefit analysis to determine the social cost-effectiveness under three potential scenarios:
i A scenario where there is no government policy around de-risking investments in infrastructure, and with IAG 2014 central scenario carbon prices (“full financing costs”).
ii A scenario where the cost of securing the necessary finance is set at zero; in other words a totally de-risked capital-raising scenario and with IAG central scenario carbon prices (“zero financing costs”).
iii A scenario with a very high carbon price of £500/tCO2 for all years and the same assumption as i) for cost of capital (“extreme carbon price”).
Figure 29: Summary of UK cost-effective potential of high-efficiency solutions by scenario, TWh of heat output pa290
Scenario i) Full financing costs TWh pa
ii) Zero financing costs TWh pa
iii) Extreme carbon price TWh pa Solution
High-efficiency, total 131 314 358
Individual 116 128 200
District heating 15 186 158
Conventional, total 334 168 120
Total heat output 465 481 477
Figure 30: Summary of the recent development of CHP291
Unit 2013 2014 2015 2016 2017
Number of schemes 2,024 2,071 2,130 2,224 2,386
Net No. of schemes added during year
84 47 59 94 162
Electrical capacity MWe 5,919 5,888 5,708 5,625 5,835
290 Source: Ricardo Energy & Environment (2015) National Comprehensive Assessment of the Potential for Combined Heat and Power and District Heating and Cooling in the UK (published February 2016) 291 DUKES 2018, https://www.gov.uk/government/statistics/digest-of-uk-energy-statistics-dukes-2018-main-report

The UK’s draft National Energy and Climate Plan (NECP)
113
Unit 2013 2014 2015 2016 2017
Net capacity added during year
MWe -45 -32 -179 -83 209
Capacity added in percentage terms
% -0.8 -0.5 -3.0 -1.5 3.7
Heat capacity MWth 22,161 22,223 20,091 19,795 20,191
Heat to power ratio 2.27 2.13 2.06 1.99 1.95
Fuel input GWh 88,403 86,184 82,576 85,123 90,279
Electricity generation (CHP)
GWh 19,515 19,690 19,534 20,405 21,648
Heat generation (CHP) GWh 44,342 41,950 40,234 40,670 42,238
Overall efficiency % 72.2 71.5 72.4 71.7 70.8
Load factor (CHPQA) % 37.6 38.2 39.1 41.4 42.4
Load factor (Actual) % 51.7 52.3 51.0 60.0 56.4
In the UK, Good Quality CHP denotes schemes that have been certified as being highly efficient through the UK’s CHP Quality Assurance (CHPQA) programme. The criteria used are in line with the requirements for high efficiency CHP set down in the Energy Efficiency Directive (2012/27/EU). In 2017 the installed capacity of Good Quality CHP increased by 209 MWe from the previous year (Figure 30) and the amount of good quality electricity produced in 2017 was 21.6 TWh, which is 6.1% higher than in 2016. This corresponds to 6.4% of all electricity generated in the UK in 2017292.
In March 2018 BEIS published the first Experimental statistics on heat networks293, based on data collected under the Heat Network (Metering and Billing) Regulations. According to these, there are 2087 heat networks in the UK, which supply 10,074GWh of heating and hot water and 202GWh of cooling.
292 DUKES 2018 https://www.gov.uk/government/statistics/digest-of-uk-energy-statistics-dukes-2018-main-report (published July 2018) 293 Experimental statistics on heat networks, March 2018 https://www.gov.uk/government/publications/energy-trends-march-2018-special-feature-article-experimental-statistics-on-heat-networks

The UK’s draft National Energy and Climate Plan (NECP)
114
iii Projections considering existing energy efficiency policies, measures and programmes as described in point 1.2.(ii) for primary and final energy consumption for each sector at least until 2040 (including for the year 2030)294
The UK’s 2032 pathway, as set out by the CGS295, would result in changes in fuel consumption across the whole economy, with estimated impacts set out in Figure 31 (below). In total, the 2032 pathway would reduce final consumption by around 14% in 2032 relative to projected energy consumption under existing polices, as a result of further improvements in fuel efficiency. The reduction in fossil fuel consumption will help improve energy security but the pathway is also characterized by a shift from end-user fossil fuel consumption towards biomass and electricity.
Figure 31: Change in Annual Final Energy Consumption in 2032, Relative to the Existing Policies Scenario296
Figure 32: Final Energy Consumption Intensity of GDP 297
294 This reference business as usual projection shall be the basis for the 2030 final and primary energy consumption target which is described in 2.3 and conversion factors. 295 Clean Growth Strategy, October 2017, https://www.gov.uk/government/uploads/system/uploads/attachment_data/file/700496/clean-growth-strategy-correction-april-2018.pdf https://www.gov.uk/government/uploads/system/uploads/attachment_data/file/700496/clean-growth-strategy-correction-april-2018.pdf 296 Clean Growth Strategy, October 2017, https://www.gov.uk/government/uploads/system/uploads/attachment_data/file/700496/clean-growth-strategy-correction-april-2018.pdf 297 Committee on Climate Change’s 2018 Progress Report: Government Response, https://assets.publishing.service.gov.uk/government/uploads/system/uploads/attachment_data/file/748296/delivering-clean-growth.pdf

The UK’s draft National Energy and Climate Plan (NECP)
115
Figure 33: Final Home Energy Use Per Household (MWh/household)298
Figure 34: Final Energy Use per £million Output for Non-Industrial Business and Public Sectors (MWh/£million)299
298 Committee on Climate Change’s 2018 Progress Report: Government Response, https://assets.publishing.service.gov.uk/government/uploads/system/uploads/attachment_data/file/748296/delivering-clean-growth.pdf 299 Committee on Climate Change’s 2018 Progress Report: Government Response, https://assets.publishing.service.gov.uk/government/uploads/system/uploads/attachment_data/file/748296/delivering-clean-growth.pdf

The UK’s draft National Energy and Climate Plan (NECP)
116
Figure 35: Final Energy Use per £million Output for Industrial Business (MWh/£million)300
iv Cost-optimal levels of minimum energy performance requirements resulting from national calculations, in accordance with Article 5 of Directive 2010/31/EU
The UK has prepared and submitted a report to the European Commission that contains this information.
4.4 Dimension energy security
i Current energy mix, domestic energy resources, import dependency, including relevant risks
In 2017 fossil fuels accounted for 80.1% of the UK’s energy supply - a record low level. The main fossil fuels used in the UK are coal, gas and oil. However, the proportion of energy supplied from low carbon sources is increasing and now accounts for 18.4%. Nuclear makes up the greatest share of these low carbon sources at 7.9% of energy supplies in the UK301.
The UK’s net import dependency has fallen 2.2% since 2015 but still accounts for 36% of energy supplies. Figure 36 (below) shows that the UK’s net import dependency has fluctuated since 1970.
300 Committee on Climate Change’s 2018 Progress Report: Government Response, https://assets.publishing.service.gov.uk/government/uploads/system/uploads/attachment_data/file/748296/delivering-clean-growth.pdf 301 Digest of United Kingdom Energy Statistics 2018 https://www.gov.uk/government/collections/digest-of-uk-energy-statistics-dukes#2018

The UK’s draft National Energy and Climate Plan (NECP)
117
Figure 36: The UK’s net import dependency since 1970302
The UK’s sources of electricity generation can be seen in Figure 37 (below). This shows the shift in fuel mix away from coal and a rise in low carbon generation including renewables, which now account for 29.3% of UK’s electricity supply. The UK remained a net importer of electricity in 2017, with net imports contributing 4.2% of electricity supply. This is slightly lower than the 5% of supply in 2016303.
Figure 37: UK electricity generation by fuel type
302 Digest of United Kingdom Energy Statistics 2018 https://www.gov.uk/government/collections/digest-of-uk-energy-statistics-dukes#2018 303 Digest of United Kingdom Energy Statistics 2018 https://www.gov.uk/government/collections/digest-of-uk-energy-statistics-dukes2018

The UK’s draft National Energy and Climate Plan (NECP)
118
Gas
Domestic UKCS production (also referred to as North Sea gas) is a key source of gas for the UK, accounting for almost 36% of gas supplies in winter 2017/18304. Production from the UK Continental Shelf has, since 2014, increased year-on-year due to the development of new fields, increased production at some of the existing fields and production of cushion gas from the Rough storage facility as it is prepared for closure305. The UK remains, along with the Netherlands, one of the two major gas-producing nations within the EU.
The UK has a diverse range of sources of gas supply, including domestic production, pipeline imports from Norway and mainland Europe, LNG from global markets, and storage (which is not strictly speaking a ‘source’ of gas but is an important source of system flexibility).
Currently, the UK has an import deliverability306 of ~56 bcm/y from Norway307, ~43 bcm/y from capacity connected to the Continent, and ~49 bcm/y from LNG import terminals308. As UKCS production declines, imports will play an increasing role in meeting UK gas demand. Domestic production of gas from shale could offset an increasing dependence on imports; however, to what extent it is not clear and, as such, is not factored into BEIS’ assessments of security of supply.
Oil
The Oil and Gas Authority estimates that there are 501 million tonnes of proven and probable (2P) oil reserves at the end of 2017, of which 330 million tonnes are proven reserves309.
Crude Oil
The UK is a significant exporter of crude oils, as well as an importer, and the direction of this trade is dependent on the prevailing market conditions. Crude oil exports increased in 2017 to reach over 34 million tonnes due to strong demand from refineries in the Middle East. Historically crude oil has been principally exported to the Netherlands, Germany, France and the US, which together comprised 60% of total crude exports in 2017310.
The UK’s own production of crude oil would have been sufficient to meet roughly 80% of UK refinery demand in 2017, but the increase in the diversity of sources coming into the UK reduced the impact of a disruption to any one source of supply on the UK. In 2016, 15% of UK crude oil production was used by UK refineries.
Refined product
In 2017, UK refinery production was 31% petrol, 24% diesel and 9% aviation fuel, with the remaining volumes primarily being other light and heavy distillates. This is significantly different
304 National Grid, 2018 Winter Review, Table 3.2, https://www.nationalgrideso.com/sites/eso/files/documents/2018%20Winter%20Review%20and%20Consultation.pdf 305 Without the contribution made by the extraction of cushion gas from the Rough storage facility, overall UKCS production would have fallen by 1.5%. 306 Nameplate deliverability figures may differ from actual operational deliverability. 307 Norway is a crucial gas supplier to the UK, supplying 39% of total gas in winter 2017/18 and accounting for over 60% of total imports in quarter one of 2018. 308 Gas Ten Year Statement 2017. Nameplate deliverability figures may differ from actual operational deliverability. 309 Statutory security of supply report: 2018, https://www.gov.uk/government/publications/statutory-security-of-supply-report-2018 310 Statutory security of supply report: 2018, https://www.gov.uk/government/publications/statutory-security-of-supply-report-2018

The UK’s draft National Energy and Climate Plan (NECP)
119
from the demand pattern. To balance demand, the UK trades widely and is one of the largest importers of jet fuel and road diesel in the OECD and one of the largest exporters of petrol311.
Approximately 39% of fuel produced by UK refineries in 2017 was exported, of which 47% was petrol and 13% fuel oil.
Imports of diesel road fuel and jet fuel to the UK are increasing. In 2013, the UK became a net importer of petroleum products for the first time since 1984. In 2017, the UK was a net importer by 10.4 million tonnes, 3% down on 2016.
ii Projections of development with existing policies and measures at least until 2040 (including for the year 2030)
Each year National Grid publishes its Future Energy Scenarios312. This publication sets out a range of credible projected scenarios for Great Britain’s energy landscape over the next 30-50 years. These four scenarios are based on the speed of decarbonisation (driven by policy, economics and consumer attitudes) and the level of decentralisation (proximity of production and management of energy to the end consumer). This is not a UK Government publication, and so the scenarios can only be used as an illustration of the potential development of the UK’s energy mix.
Scenarios:
1. Consumer Renewables: sets out what Great Britain’s energy systems could look like if the 2050 decarbonisation target is met and there is a more decentralised energy landscape.
2. Two Degrees: explores how the 2050 decarbonisation target can be achieved using large, centralised technologies.
3. Steady Progression: predicts a scenario in which Great Britain makes progress towards but does not meet the 2050 decarbonisation target using centralised technologies.
4. Consumer Evolution: a more decentralised scenario which makes progress towards the decarbonisation target but fails to achieve 80% carbon emissions reduction by 2050.
Electricity
Figure 38 shows how the technologies currently making up GB electricity generation capacity could change over the next 30 years. In all scenarios there is a marked increase in the amount of renewable and low carbon generation up to 2050, although the pace of change differs. This reflects an ongoing trend in GB electricity supply driven by technological progress, an increasing policy focus on climate change and evolving economic conditions.
311 Statutory security of supply report: 2018, https://www.gov.uk/government/publications/statutory-security-of-supply-report-2018 312 Source: National Grid, Future Energy Scenarios 2018, http://fes.nationalgrid.com/

The UK’s draft National Energy and Climate Plan (NECP)
120
Figure 38: Projected UK electricity supply313
Gas
The gas supply in Great Britain has dramatically changed over the past 15 years. Great Britain has gone from having a self-sufficient gas supply in 2000 to being dependent on imported gas for around half of our needs in 2017. National Grid’s Future Energy Scenarios predict similarly large changes over the next 30 years, as shown in the four scenarios below. In all scenarios, except Steady Progression, the UK Continental Shelf declines and is exhausted by 2050.
Gas demand under the Community Renewables scenario, shown in Figure 39, is lower than in any of the other scenarios. Projected gas supply under this scenario primarily comes from imports.
Figure 39: Projected UK gas supply under Community Renewables scenario314
313 Source: National Grid, Future Energy Scenarios 2018, http://fes.nationalgrid.com/media/1358/fes-2018-scenario-framework-assumptions_version-10-for-website.xlsx. CR is community renewables; TD is two degrees; SP is steady progression; CE is consumer evolution. 314 Source: National Grid, Future Energy Scenarios 2018, http://fes.nationalgrid.com/media/1358/fes-2018-scenario-framework-assumptions_version-10-for-website.xlsx

The UK’s draft National Energy and Climate Plan (NECP)
121
By contrast in the Two Degrees scenario, Figure 40, gas is used for conversion to hydrogen, leading to high gas demand. As a result, UK Continental Shelf gas receives greater policy support and continues to be part of gas supplies until 2048. Reliance on imported gas is at its highest in this scenario, reaching 90% in mid 2040s.
Figure 40: Projected UK gas supply under the Two Degrees Scenario315
Similarly, in Steady Progression scenario, Figure 41, UK Continental Shelf gas receives policy support and is still part of the supply mix until 2050. Green gas doesn’t form part of the energy mix in any year, but there is some development of shale gas.
Figure 41: Projected UK gas supply under the Steady Progression Scenario316
315 Source: National Grid, Future Energy Scenarios 2018, http://fes.nationalgrid.com/media/1358/fes-2018-scenario-framework-assumptions_version-10-for-website.xlsx 316 Source: National Grid, Future Energy Scenarios 2018, http://fes.nationalgrid.com/media/1358/fes-2018-scenario-framework-assumptions_version-10-for-website.xlsx

The UK’s draft National Energy and Climate Plan (NECP)
122
In Figure 42, UK Continental Shelf gas is still part of gas supplies by 2050, and shale gas also provides a significant contribution. However, there is still a requirement for imported gas and under this scenario Norwegian gas makes its biggest contribution to Great Britain’s gas supplies.
Figure 42: Projected UK gas supply under the Consumer Evolution Scenario317
4.5 Dimension internal energy market
4.5.1 Electricity interconnectivity
ii Current interconnection level and main interconnectors318
The GB electricity system is currently connected with north-west Europe via 3GW interconnector capacity; 2GW with France (IFA) and 1GW with the Netherlands (BritNed). 1GW of interconnection also links GB and the Single Electricity Market (SEM) on the island of Ireland (Moyle 500MW and East-West Interconnector 500MW). A 1GW interconnector with Belgium, Nemo Link, is due for completion in early 2019. An overview of existing and future interconnector projects can be found on Ofgem’s website319.
ii Projections of interconnector expansion requirements (including for the year 2030)320
The UK Government will work to ensure significant private investment in new electricity interconnectors, which will help reduce prices for consumers, ensure a more secure grid and help integrate clean generation. Project assessments indicate the potential for at least 9.5GW
317 Source: National Grid, Future Energy Scenarios 2018, http://fes.nationalgrid.com/media/1358/fes-2018-scenario-framework-assumptions_version-10-for-website.xlsx 318 With reference to overviews of existing transmission infrastructure by Transmission System Operators (TSOs). 319 Electricity interconnectors: https://www.ofgem.gov.uk/electricity/transmission-networks/electricity-interconnectors 320 With reference to national network development plans and regional investment plans of TSOs.

The UK’s draft National Energy and Climate Plan (NECP)
123
more interconnection by the early-to-mid 2020s, in addition to the 4GW today and the 4.4GW under construction321.
4.5.2 Energy transmission infrastructure
i Key characteristics of the existing transmission infrastructure for electricity and gas322
This is set out in 2.4.2(i).
ii Projections of network expansion requirements at least until 2040 (including for the year 2030)323
The system operator for Great Britain, National Grid Electricity System Operator, publishes two main reports each year which consider the future needs of the electricity system. The first is the Network Options Assessment324, which describes the major projects considered to meet the needs of GB’s electricity transmission system as described by the Electricity Ten Year Statement325. The second is the Future Energy Scenarios document, which identifies long term demand options326.
4.5.3 Electricity and gas markets, energy prices
i Current situation of electricity and gas markets, including energy prices
Wholesale The GB wholesale electricity market is where generators and suppliers trade electricity products ahead of final delivery to the consumer. Energy companies are legally required to be licensed by Ofgem to operate in the market. Trading occurs within GB, but also with European partners over electricity interconnectors. British electricity generation comes from diversified sources comprising nuclear, natural gas, coal, and varied renewable sources including wind, solar, and biomass. The GB wholesale electricity market is well connected with neighbouring countries, including France, Ireland, and the Netherland, with substantial capacity of further interconnection planned. Most electricity is generated at large power stations connected to the national transmission network, but it can also be generated in smaller scale power stations that are connected to the regional distribution networks, or even generated off-grid. A time-series of wholesale prices is illustrated below, and more can be accessed on the Ofgem data portal327.
Northern Ireland has operated a single wholesale electricity market called the Single Electricity Market (SEM) with the Republic of Ireland since November 2007. The SEM has been undergoing extensive redesign to comply with the EU Target Model for harmonisation of arrangements on trading electricity across Member States. The new arrangements are being progressed under the Integrated Single Electricity Market (I-SEM) programme. Reforms to the SEM went live on 1 October 2018. They are designed to introduce efficiencies of interconnector flows, encourage new investment in the market, apply downward pressure on prices, and create enhanced trading opportunities and options through the introduction of continuous trading in the intra-day, day-ahead, forwards, and balancing timeframes. The first
321 Clean Growth Strategy, 2017 https://www.gov.uk/government/publications/clean-growth-strategy 322 With reference to overviews of existing transmission infrastructure by TSOs. 323 With reference to national network development plans and regional investment plans of TSOs. 324 https://www.nationalgrid.com/sites/default/files/documents/Network-Options-Assessment-2017-18.pdf 325 https://www.nationalgrid.com/sites/default/files/documents/ETYS%202017.pdf 326 http://fes.nationalgrid.com/media/1363/fes-interactive-version-final.pdf 327 https://www.ofgem.gov.uk/data-portal/all-charts?search_api_views_fulltext=wholesale+price

The UK’s draft National Energy and Climate Plan (NECP)
124
auction took place at the end of 2017, a further auction is taking place later this year and another in March 2019.
The Single Electricity Market Operator (SEMO) facilitates the continuous operation and administration of the SEM. SEMO is a joint venture between EirGrid plc (the Transmission System Operator in the Republic of Ireland), and the System Operator for Northern Ireland (SONI), which acts as Transmission System Operator in Northern Ireland. SEMO is managed as a contractual joint venture between EirGrid and SONI and is licensed and regulated cooperatively by the Commission for Regulation of Utilities in Ireland and the Utility Regulator for Northern Ireland (NIAUR).
Retail In June 2018, there were 64 suppliers offering both gas and electricity in the GB domestic retail market, plus seven gas-only, and two electricity-only suppliers328. The six largest suppliers account for approximately three-quarters of domestic retail supply market, or 75% and 76% in gas and electricity respectively329. British Gas, which is owned by parent company Centrica, is the largest supplier of both gas and electricity, covering 30% of the gas market and 20% of the electricity market330. These suppliers together lost around five percentage points of market share between June 2017 and June 2018 in both fuels. Between June 2017 and June 2018, the largest firms have lost 1.4 million meter-points in electricity331.
Retail markets are still concentrated, but concentration is declining due to new entry at a sustained pace. In June 2018, the Herfindahl-Hirschman Index (HHI) was around 1,500 for gas in June 2018 and around 1,250 for electricity332. Typically, the Competition and Markets Authority (CMA) regards markets with an HHI below 1000 as un-concentrated, markets with HHI between 1,000 and 2,000 as concentrated, and markets with an HHI above 2,000 as highly concentrated333.
In Northern Ireland, there are five domestic electricity suppliers, and nine industrial and commercial suppliers 334. Analysis using figures for Q3 2018 highlights how, at 56.4%, a significant number of customers remain with the previously incumbent supplier Power NI, whose retail prices are currently subject to a price control for domestic consumers335.
328 Ofgem, State of the Energy Market 2018, https://www.ofgem.gov.uk/publications-and-updates/state-energy-market-2018 329 Ofgem, State of the Energy Market 2018, https://www.ofgem.gov.uk/publications-and-updates/state-energy-market-2018 330 Ofgem, State of the Energy Market 2018, https://www.ofgem.gov.uk/publications-and-updates/state-energy-market-2018 331 Ofgem, State of the Energy Market 2018, https://www.ofgem.gov.uk/publications-and-updates/state-energy-market-2018 332 Ofgem, State of the Energy Market 2018, https://www.ofgem.gov.uk/publications-and-updates/state-energy-market-2018 333 Ofgem, State of the Energy Market 2018, https://www.ofgem.gov.uk/publications-and-updates/state-energy-market-2018 334 Retail Market Monitoring Report, Quarterly Transparency Report, Quarter 2, 2018, https://www.uregni.gov.uk/sites/uregni/files/media-files/2018-08-31%20Transparency%20Report%20Q2%202018%20FINAL.pdf 335 Northern Ireland Utility Regulator Retail market monitoring: Quarterly transparency report July to September 2018, https://www.uregni.gov.uk/sites/uregni/files/media-files/2018-11-30%20Transparency%20Report%20Q3%202018%20FINAL.pdf

The UK’s draft National Energy and Climate Plan (NECP)
125
Figure 43: Electricity Prices, Day Ahead Baseload Contracts, Monthly Average336
ii Projections of development with existing policies and measures at least until 2040 (including for the year 2030)
The Energy Act 2013 established the two main mechanisms of energy market reform; the Capacity Market and Contracts for Difference. The Capacity Market was introduced to improve security of supply, however a recent judgement in the General Court of the Court of Justice of the European Union, which went against the EU Commission has had the effect of annulling the original State aid approval for the CM. The UK Government is actively working with the Commission to reinstate the Capacity Market as soon as possible.
The Contracts for Difference scheme was introduced to incentivise investment in low-carbon electricity generation. The UK Government has also introduced carbon prices above those set across the EU – in 2016, power stations were charged an average of £22 per tonne of carbon dioxide emitted. Increasing carbon prices helped make coal less profitable than gas for power generation in the UK.
‘Secure and Promote’ was a policy introduced in 2014 to increase liquidity by requiring the largest generating companies to provide better access to hedging products for smaller companies. This has led to improvements across some liquidity health indicators such as bid-offer spreads, and total traded volume. However, there have been additional explanations proposed for the improvements in these indicators.
Further detail on these energy market reforms can be found in Ofgem’s State of the Market Report337.
The Smart Systems Plan sets out the UK Government’s approach to realising a smart, flexible energy system offering significant benefits for consumers and the economy, helping us use energy more flexibly and increasing the efficiency of the whole energy system338.
336 ICIS, tables accessible: https://www.ofgem.gov.uk/data-portal/wholesale-market-indicators#thumbchart-c8115141186863184-n95196 337 Available at: https://www.ofgem.gov.uk/system/files/docs/2017/10/state_of_the_market_report_2017_web_1.pdf 338 A Smart, Flexible Energy System: A Call for Evidence, November 2016, https://www.gov.uk/government/uploads/system/uploads/attachment_data/file/576367/Smart_Flexibility_Energy_-_Call_for_Evidence1.pdf

The UK’s draft National Energy and Climate Plan (NECP)
126
4.6 Dimension research, innovation and competitiveness
Consumers are at the heart of our development of the system, which can give them choice and control over how they use electricity, including any that they generate themselves. Our approach is firmly rooted in enabling competition and markets to deliver on price, quality and choice, and we want flexible solutions to compete with each other and with more traditional solutions.
i Current situation of the low-carbon-technologies sector and, to the extent possible, its position on the global market (that analysis is to be carried out at Union or global level)
In 2017, over 50% of the UK’s electricity came from low carbon sources, which was a record high. The UK’s low carbon policies have seen renewable electricity capacity increase by more than three times since 2010339.
The CGS outlines how UK homes and commercial buildings have become more efficient in the way they use energy which helps to reduce emissions and also cut energy bills; for example in 2016, average household energy consumption fell by 17% compared with 1990 levels. Automotive engine technology has helped reduce emissions per kilometre driven by up to 16% and driving a new car bought in 2015 will save car owners up to £200 on their annual fuel bill, compared to a car bought new in 2000. In 2016, England recycled nearly four times more than it did in 2000340.
This progress has been aided by the falling costs of many low carbon technologies: renewable power sources like solar and wind are comparable in cost to coal and gas in many countries; energy efficient light bulbs were over 80% cheaper in 2016 than in 2010; and the cost of electric vehicle battery packs has tumbled by over 70% in this time341.
As a result of this technological innovation, new high value jobs, industries and companies have been created. And this is driving a new, technologically innovative, high growth and high value “low carbon” sector of the UK economy. Not only are we rapidly decarbonising parts of the domestic economy, but thanks to our world leading expertise in technologies such as offshore wind, power electronics for low carbon vehicles and electric motors, and global leadership in green finance, we are successfully exporting goods and services around the world; for example, one in every five electric vehicles driven in Europe is made in the UK. The latest published data found that in 2016 there were 208,000 full time equivalent employees working directly in the low carbon and renewable energy economy342.
This progress has altered the way that we see many of the trade-offs between investing in low carbon technologies that help secure our future but that might incur costs today. It is clear that actions to cut our emissions can be a win-win: cutting consumer bills, driving economic growth, creating high value jobs and helping to improve our quality of life343.
339 Diguest of UK Energy Statistics (DUKES) 2018, https://assets.publishing.service.gov.uk/government/uploads/system/uploads/attachment_data/file/736148/DUKES_2018.pdf 340 The Clean Growth Strategy, https://www.gov.uk/government/publications/clean-growth-strategy 341 The Clean Growth Strategy, https://www.gov.uk/government/publications/clean-growth-strategy 342 UK Environmental Accounts, 2016 Final Estimates, https://www.ons.gov.uk/releases/lowcarbonandrenewableenergysurvey2016 343 The Clean Growth Strategy, https://www.gov.uk/government/publications/clean-growth-strategy

The UK’s draft National Energy and Climate Plan (NECP)
127
ii Current level of public and, where available, private research and innovation spending on low-carbon-technologies, current number of patents, and current number of researchers
This is set out in section 2.5(i).
The UK’s Office of National Statistics (ONS) publishes estimates of total private sector R&D, but this is not broken down by ETRDI. We are not aware of any formal reporting of data broken down in this way as there is no formal record of different private sector ETRDI projects.
The UK Government actively encourages private sector participation in public ETRDI Programmes, recognizing the clear economic benefits such as supporting jobs and increasing export potential.
iii Breakdown of current price elements that make up the main three price components (energy, network, taxes/levies)
UK Energy price breakdowns 2017344 Figure 44: Household Gas and Electricity price breakdowns
Figure 45: Medium Business energy price breakdowns, excluding VAT
344 Eurostat Energy Statistics, https://ec.europa.eu/eurostat/data/database?p_p_id=NavTreeportletprod_WAR_NavTreeportletprod_INSTANCE_nPqeVbPXRmWQ&p_p_lifecycle=0&p_p_state=normal&p_p_mode=view&p_p_col_id=column-2&p_p_col_pos=1&p_p_col_count=2
Per Mwh Gas (D2)
Euros Pounds Euro PoundsEnergy and Supply 30.2 27.0 82.0 73.2
Network Costs 12.9 11.5 43.8 39.1
Taxes, Fees, Levies and charges 3.7 3.3 48.8 43.6
Total 46.8 41.8 174.6 155.9Source: Eurostat
Electricity (DC)
Per Mwh
Euros Pounds Euro PoundsEnergy and Supply 16.7 14.9 63.2 56.4
Network Costs 5.3 4.7 28.5 25.4
Taxes, Fees, Levies and charges 1.3 1.1 25.9 23.1
Total 23.3 20.7 117.6 104.9Source: Eurostat
Gas (I3) Electricity (ID)

The UK’s draft National Energy and Climate Plan (NECP)
128
Figure 46: Large Gas Business & Extra-Large Electricity Business energy price breakdowns, excluding VAT
iv Description of energy subsidies, including for fossil fuels (125)
The UK has support schemes for renewables, which are described in 2.3(iii) and 3.1.2.
Per Mwh
Euros Pounds Euro PoundsEnergy and Supply 13.1 11.7 68.1 60.8
Network Costs 4.1 3.7 27.8 24.8
Taxes, Fees, Levies and charges 0.9 0.8 19.0 17.0
Total 18.1 16.2 114.9 102.6Source: Eurostat
Electricity (IF)Gas (I4)

The UK’s draft National Energy and Climate Plan (NECP)
129
5. IMPACT ASSESSMENT OF PLANNED POLICIES AND MEASURES345
5.1 Impacts of planned policies and measures described in section 3 on energy system and GHG emissions and removals including comparison to projections with existing policies and measures (as described in section 4)
i Projections of the development of the energy system and GHG emissions and removals as well as, where relevant of emissions of air pollutants in accordance with Directive (EU) 2016/2284 under the planned policies and measures at least until ten years after the period covered by the plan (including for the last year of the period covered by the plan), including relevant Union policies and measures
The projections presented in section 4 (the ‘with existing measures’ scenario) include the impact of all the UK’s implemented and adopted policies and measures. It does not include those policies which are classified as planned.
The UK treats the policies adopted before 2009, when carbon budgets were set at the time of the 2009 Budget and the Low Carbon Transition Plan (LCTP)346, as part of the baseline. Figures 47 and 48 show the estimated emissions savings and the effect on projected emissions attributable to policies adopted between April 2009 and July 2017, as published in the 2017 UK EEP. For example, in 2020 we project that existing UK policies will deliver emissions reductions of almost 70 MtCO2e. Further emissions reductions are expected from planned policies.
345 Planned policies and measures are options under discussion and having a realistic chance of being adopted and implemented after the date of submission of the national plan. The resulting projections under section 5.1.i shall therefore include not only implemented and adopted policies and measures (projections with existing policies and measures), but also planned policies and measures. 346 https://www.gov.uk/government/publications/the-uk-low-carbon-transition-plan-national-strategy-for-climateand-energy

The UK’s draft National Energy and Climate Plan (NECP)
130
Figure 47: Projected impact of policies347
To avoid double counting in the calculation of savings from policies, our projections use a hierarchy of mitigation actions which consider energy demand and emissions reductions after the application of measures further up the hierarchy. This hierarchy considers the level of imperative imposed by a policy, that is to say whether there is regulation, incentive or advice, and the date of implementation of a policy.
Figure 48: Projected impact of policies adopted in the period 2009-2017348
2015 2020 2025 2030 2035
Baseline emissions 521 480 466 477 491
Emissions including all implemented or adopted measures 496 411 378 379 382
Emissions including all implemented, adopted and planned measures 496 403 369 358 348
The differences in projected emissions between scenarios does not exactly match the sum of emissions reductions provided by individual policies due to price interactions and adjustments to policy impacts to improve accuracy.
The CGS sets out, in addition, over fifty policies and proposals that will drive emissions down throughout the next decade and beyond. Through preparing this Strategy, the UK Government has identified areas where it will need to see the greatest progress, both through technological breakthroughs and large-scale deployment, if it is to meet its national emissions reduction targets. It is initially estimated that some of these proposals could provide additional savings 348 Updated Energy and Emissions Projections, 2017, Annex A https://www.gov.uk/government/publications/updated-energy-and-emissions-projections-2017
0
100
200
300
400
500
600
2015 2020 2025 2030 2035
GHG
emiss
ions
(MtC
O2e
)
Quantified savings from planned measuresQuantified savings from measures adopted 2009-17Baseline emissionsEmissions including all implemented or adopted measuresEmissions including all implemented, adopted and planned measures
The UK’s draft National Energy and Climate Plan (NECP)
131
of up to 110 MtCO2e over years 2023-32349. Work is ongoing to fully quantify the impacts of the strategy. As we move forward and develop the full range of policies and proposals, we will publish individual impact assessments as appropriate with updated analysis.
ii Assessment of policy interactions (between existing policies and measures and planned policies and measures within a policy dimension and between existing policies and measures and planned policies and measures of different dimensions) at least until the last year of the period covered by the plan, in particular to establish a robust understanding of the impact of energy efficiency / energy savings policies on the sizing of the energy system and to reduce the risk of stranded investment in energy supply
To avoid double counting in the calculation of savings from policies, our projections use a hierarchy of mitigation actions; energy demand and emissions reductions for a given policy are considered after the application of measures further up the hierarchy. This hierarchy considers the level of imperative imposed by a policy (i.e. whether it enforces regulation, incentive or advice) and the date of implementation of a policy.
The Updated EEP 2017, Annex D350, gives details on how policy interactions are addressed in our modelling of energy savings. For example, when evaluating the potential savings of a particular policy, the savings of existing policies are taken into account to ensure that the savings are only attributed to one policy. New policies will be incorporated once they are sufficiently advanced to meet the criteria set out in the UNFCCC definitions. Where possible, policies are modelled by incorporating them into the BEIS Energy and Emissions Model. Other policies enter the model as demand reductions or as an off-model adjustment.
iii Assessment of interactions between existing policies and measures and planned policies and measures, and between those policies and measures and Union climate and energy policy measures
This information is set out in 3.1.1, which details the policies and measures drawn from the National Communication351.
The UK Government has a rigorous monitoring and reporting framework to track progress against its domestic and international targets. Each year the UK Government published its Greenhouse Gas Inventory, and Energy and Emissions Projections.
The Climate Change Act (2008) requires the UK Government to set five yearly carbon budgets, and then produce a plan to meet these budgets. The most recent was the Clean Growth Strategy, published in October 2017. The CCC, the UK’s independent advisory body, published an assessment of this plan in January 2018.
The CCC also produces an annual progress report, with the UK Government laying a response before Parliament. From 2018, the UK Government will use its response to the CCC’s annual progress report to bring together reporting against the Clean Growth on the emission intensity ratio, metrics and actions. The UK publish our performance against the Emissions Intensity Ratio on an annual basis. UK Government will also update key elements of the Strategy in line
349 Updated Energy and Emissions Projections, 2017, Annex A https://www.gov.uk/government/publications/updated-energy-and-emissions-projections-2017 350 Updated Energy and Emissions Projections, 2017, Annex D https://www.gov.uk/government/publications/updated-energy-and-emissions-projections-2017 351 7th National Communication, December 2017, http://unfccc.int/files/national_reports/annex_i_natcom/submitted_natcom/application/pdf/19603845_united_kingdom-nc7-br3-1-gbr_nc7_and_br3_with_annexes_(1).pdf

The UK’s draft National Energy and Climate Plan (NECP)
132
with our annual statutory responses to the CCC’s reports on progress, ahead of setting the sixth carbon budget by 30 June 2021.
5.2 Macroeconomic and, to the extent feasible, the health, environmental, employment and education, skills and social impacts including just transition aspects (in terms of costs and benefits as well as cost-effectiveness) of the planned policies and measures described in section 3 at least until the last year of the period covered by the plan, including comparison to projections with existing policies and measures
The UK is likely to feel the impact of climate change both directly and through impacts in other parts of the world. In its recent UK Climate Change Risk Assessment, the UK Government endorsed the six key climate change risks for the UK identified in an independent review by the Adaptation Sub-Committee: flooding and coastal change; shortages in public water supply; risks to health, wellbeing and productivity from high temperatures; risks to natural capital and our ecosystems; risks to food security and trade; and new pests and diseases. Therefore, future investments are likely to be highly sensitive to how climate change evolves over the next two to three decades.
The UK’s current target is to reduce its GHG emissions by at least 80% by the year 2050, relative to 1990 levels. This 2050 target was set to be consistent with keeping the global average temperature to around 2°C above pre-industrial levels with a 50% likelihood. Following the publication of the Intergovernmental Panel on Climate Change’s (IPPC) special report on global warming of 1.5°C, the UK Government asked its independent experts, the CCC, for their advice on the implications of the Paris Agreement for the UK’s long-term emissions reduction targets, including on setting a net zero target352. The UK Government has requested advice on:
• setting a date for achieving net zero greenhouse gas emissions across the economy
• whether we need to raise our 2050 target of cutting emissions by at least 80% relative to 1990 levels to meet international climate targets set out in the Paris Agreement
• how emissions reductions might be achieved across the economy
• the expected costs and benefits in comparison to current targets
We expect to receive the CCC’s advice in Spring 2019, and we will consider their advice carefully when it is received.
Actions to mitigate climate change can have wider positive impacts on the economy and the environment, beyond the direct benefits of avoided climate change. There is strong evidence that well-designed climate mitigation action can provide substantial co-benefits while
352 UK climate targets: request for advice from the Committee on Climate Change, October 2018,
https://www.gov.uk/government/publications/uk-climate-targets-request-for-advice-from-the-committee-on-climate-change

The UK’s draft National Energy and Climate Plan (NECP)
133
minimising any possible adverse side-effects. Co-benefits can include substantial air quality improvements from avoided fuel combustion and health and wellbeing benefits of active travel.
Analysis for the Committee on Climate Change has suggested that if we continue to develop and build on our strengths we can capture significant economic benefits from our decarbonising trends. The UK’s low carbon economy could grow at around 11% a year between 2015 and 2030; four times faster than the average growth rate for the UK economy overall. This would mean the low carbon economy would increase from around 2% of the UK’s total output to around 8% by 2030353. This is highlighted in Figure 49. The innovation and investment required to drive down emissions in the transport, business, domestic and industrial sector can create more jobs and more export opportunities354.
Figure 49: Potential Growth in the UK Low Carbon Economy355
5.3 Overview of investment needs
i existing investment flows and forward investment assumptions with regard to the planned policies and measures
The ambitious CGS sets out proposals across the economy – in homes, business, transport, and the natural environment; building on the progress made so far, to meet the fourth and fifth carbon budgets.
353 The Clean Growth Strategy, 2017 https://www.gov.uk/government/publications/clean-growth-strategy 354 The Clean Growth Strategy, 2017 https://www.gov.uk/government/publications/clean-growth-strategy 355 The Clean Growth Strategy, 2017 https://www.gov.uk/government/publications/clean-growth-strategy

The UK’s draft National Energy and Climate Plan (NECP)
134
Figure 50: Examples of UK Investment Pledges in the Clean Growth Strategy 356
Investment Amount Investment Area
£2.5 billion Supporting low carbon innovation from 2015 to 2021.
£162 million Research and innovation in energy, resource and process efficiency.
Up to £20 million Support new clean technology early investment funding.
Up to £100 million Innovation in carbon capture usage and storage technologies.
£14 million Support innovative energy technologies and processes through the Entrepreneurs Fund.
Around £3.6 billion Upgrade around a million homes through the Energy Company Obligation (ECO), and to extend support for home energy efficiency improvements until 2028 at the current level of ECO funding.
£4.5 billion Reforming the Renewable Heat Incentive and supporting innovative low carbon heat technologies in homes and businesses between 2016 and 2021.
£1.5 billion support a new clean
Supporting the take-up of ultra low emission vehicles.
£184 million + two new £10 million innovation programmes
Develop new energy efficiency and heating technologies to enable lower cost low carbon homes.
£80 million Electric vehicle charging infrastructure deployment.
£250 million (matched by industry)
Research, development and demonstration of Connected and Autonomous Vehicle technologies.
£841 million Innovation in low carbon transport technology and fuels.
Up to £557 million Further Pot 2 Contract for Difference auctions.
£900 million Innovation in smart systems, renewable and nuclear energy.
356 The Clean Growth Strategy, 2017 https://www.gov.uk/government/publications/clean-growth-strategy. This is not an exhaustive list of all future UK government investments.

The UK’s draft National Energy and Climate Plan (NECP)
135
Investment Amount Investment Area
£99 million Innovation technology and research for agri-tech, land use, greenhouse gas removal technologies, waste and resource efficiency.
£255 million Funding for public sector energy efficiency improvements in England.
More broadly, the National Productivity Investment Fund will provide an additional £4.7 billion, with an extra £2 billion a year by 2020-21, representing the largest increase in public spending on UK science, research and innovation since 1979357.
Green finance will be central to delivery of the CGS. In September 2017, the Minister for Energy and Clean Growth and the Economic Secretary convened an independent Green Finance Taskforce, comprising senior industry leaders from the finance sector, academia, international institutions and civil society. Within six months, the Taskforce consulted over 140 organisations and delivered 30 ambitious recommendations to the UK Government in its report ‘Accelerating Green Finance’. These recommendations give advice on delivery of the public and private investment we need to meet our carbon budgets and maximise the UK’s share of the global green finance market.
The UK has delivered on a number of the Taskforce’s recommendations and will be producing a Green Finance Strategy in Spring 2019. This will set out the UK’s approach to maintaining its position as a world leader in green finance and ensure the country capitalises on the opportunities arising from clean growth.
ii sector- or market-risk factors or barriers in the national or regional context
The UK needs to drive ambitious decarbonisation of its electricity supply to meet its legally binding carbon reduction obligations under the Climate Change Act 2008. Decarbonisation must be achieved while maintaining security of supply (including a diversity of generation) and in the most cost-effective way, to provide affordable electricity for consumers and the UK economy more generally.
New low-carbon generators and investors often have to overcome relatively high barriers to market entry. High construction costs and market illiquidity make it more difficult for low-carbon generation to compete with fossil fuels and impede market access. Small and independent players are also particularly affected by the risk of not being able to find long-term buyers for their electricity.
As highlighted by the Committee on Climate Change, greenhouse gas removal (GGR) technologies are likely to have an important role to play in offsetting difficult to cut emissions, by removing greenhouse gases from the air. However, there are uncertainties around their costs, deployment potential and impacts on the environment.
357 The Clean Growth Strategy, 2017 https://www.gov.uk/government/publications/clean-growth-strategy

The UK’s draft National Energy and Climate Plan (NECP)
136
iii analysis of additional public finance support or resources to fill identified gaps identified under point ii
The Contracts for Difference (CfD) scheme for renewables is designed to decarbonise the electricity system cost-effectively, making the development of renewable generation cheaper for both investors and consumers. They are designed to increase certainty over returns to the generator in order to bring forward investment in new low carbon electricity generating capacity at minimum cost to consumers, whilst retaining the need for the generator to sell its power in the commercial market. The CfD provides greater long-term predictability of revenues to developers by reducing the exposure to volatile wholesale prices, thereby reducing the cost of capital and thus the level of support required. The two-way nature of the CfD also reduces or removes support for generators when electricity wholesale prices are high.
The CfD also mitigates problems faced by independent generators by reducing the long-term price risk they face, which will make Power Purchase Agreements (PPAs) simpler and less costly for offtakers to provide and should lead to greater competition in the market. The ‘Offtaker of Last Resort’ scheme provides eligible independent renewable generators holding a CfD with a guaranteed ‘backstop’ route-to-market, which enables them to have more flexibility in their contracting strategy for the sale of their power, supporting competition and reducing overall support costs. The total budget of the CfD scheme (as set out in the State aid approval for the scheme, 2014) is £15 billion. In the first auction held in 2014/15, developers of 27 projects (over 2GW) were offered contracts. At the time of contract award, the estimated budget spend was calculated as £315 million (2012 prices). In the second auction in 2017, developers of 11 projects (3.3GW capacity) were offered contracts. At the time of contract award, the estimated budget spend was calculated as £176 million (2012 prices).
To help promote and support GGR technologies, the UK Government has created a programme of research and development, which aims to improve our understanding and overcome unceratinties. We have been working with the Research Councils, who launched a new £8.6 million research programme looking at all GGR tehcnologies in April 2017. The UK Government will also consider the scope for removing barriers and strengthening incentives to support the deployment of FFR, for example by developing a carbon offset market and exploring how UK timber could be used in construction.
5.4 Impacts of planned policies and measures described in section 3 on other Member States and regional cooperation at least until the last year of the period covered by the plan, including comparison to projections with existing policies and measures
i Impacts on the energy system in neighbouring and other Member States in the region to the extent possible
The UK remains a net importer of electricity and imported 14.8 TWh of electricity in 2017. In Q4 2017 French nuclear outages resulted in increased French electricity prices and increased UK exports.

The UK’s draft National Energy and Climate Plan (NECP)
137
Figure 51: Net Imports Via Interconnectors, 2015-2017
ii Impacts on energy prices, utilities and energy market integration
Innovation must be harnessed in ways that bring benefits to all consumers. Many consumers already generate their own electricity and can monitor and control their consumption using smart meters. In the future, the traditional ‘supplier hub’ model, whereby suppliers manage most interactions with consumers and the wider market, may break down. Peer-to-peer energy trading and greater customer ownership of their data should allow different ways of engaging with the energy system. Ofgem’s State of the Market report 2018 sets out the challenges to ensure that a transformed energy market works for all consumers.
A number of environmental and social policy costs, related to government programmes, are levied onto energy customer bills. These policies are designed to deliver low-carbon, secure and affordable energy supplies, help households and businesses save energy and support low income and vulnerable consumers. Ofgem data in its 2018 State of the Market report suggest that all policies added around £108 to a typical dual fuel household bill in 2017358.
Some of the UK Government’s environmental and social programmes include:
• Separate domestic and non-domestic Renewable Heat Incentives – financial incentives to increase the take up of renewable heat and reduce carbon emissions;
• Energy Company Obligation (ECO) – designed to improve the energy performance of houses in GB.
• Warm Home Discount (WHD) – scheme provides over 2 million low income and vulnerable households in GB with a rebate of £140 off their winter electricity bill.
• Capacity Market (CM) – The Capacity Market allows the country to secure reliable and necessary electricity capacity to meet peak demand. The UK Government is actively working with the Commission to reinstate the Capacity Market as soon as possible following the judgement that annulled State aid approval.
• Feed-in tariffs (GB only) – promote uptake of a range of small-scale renewable and low-carbon electricity generation technologies. The scheme is being phased out from 31 March 2019.
• Renewables Obligation (RO) – RO scheme has been the main financial mechanism since 2002 to incentivise deployment of renewable energy electricity generation in the
358 Ofgem, State of the Energy Market 2018, https://www.ofgem.gov.uk/publications-and-updates/state-energy-market-2018

The UK’s draft National Energy and Climate Plan (NECP)
138
UK. The RO has been replaced by the Contracts for Difference (CfD) scheme in Great Britain.
• Contracts for Difference – CfDs are now the UK Government’s main mechanism in Great Britain for supporting large-scale renewable electricity generation. The scheme has delivered 10GW of new capacity and significant investment since 2015.
• Assistance for Areas with High Electricity Distribution Costs - AAHEDC protects domestic and non-domestic consumers from the high costs of distributing energy in the north of Scotland.
The UK Government is also committed to ensuring that every home and small business in the country is offered a smart meter by the end of 2020359.
In addition, to protect disengaged consumers who are on poor value tariffs, the UK Government has introduced the Domestic Gas and Electricity (Tariff Cap) Act 2018, which will require the energy regulator, Ofgem to set a temporary price cap that will protect 11 million households who are currently on standard variable and default tariffs. The price cap is temporary and will run for an initial period to 2020 with the possibility for three one-year extensions.
iii Where relevant, impacts on regional cooperation
Not applicable.
359 Smart meter roll-out (GB): cost-benefit analysis, 2016: https://www.gov.uk/government/publications/smart-meter-roll-out-gb-cost-benefit-analysis

This publication is available from: www.gov.uk/government/publications/uk-national-energy-and-climate-plan-necp
If you need a version of this document in a more accessible format, please email [email protected]. Please tell us what format you need. It will help us if you say what assistive technology you use.