uk national forestry accounting plan 2021-2025
TRANSCRIPT
January 2020
NATIONAL FORESTRY ACCOUNTING PLAN OF THE UNITED KINGDOM Forest Reference Level for the Period 2021-2025
BEIS Research Paper Number 050/1819


3
Contents Chapter 1: General introduction ________________________________________________ 6
1.1: General description of the forest reference level of the United-Kingdom ____________ 6
1.2: Consideration to the criteria as set in Annex IV of the LULUCF Regulation _________ 7
Chapter 2: Preamble for the forest reference level _________________________________ 11
2.1: Carbon pools and greenhouse gases included in the forest reference level ________ 11
2.2: Demonstration of consistency between the carbon pools included in the Forest Reference Level _________________________________________________________ 11
2.3: Description of the long-term forest strategy _________________________________ 12
2.3.1: Overall description of the forests and forest management in the United Kingdom and the adopted national policies ______________________________________________ 12
2.3.2: Description of future harvesting rates under different policy scenarios _________ 15
Chapter 3: Description of the modelling approach _________________________________ 18
3.1: Description of the general approach as applied for estimating the forest reference level ______________________________________________________________________ 18
3.2: Documentation of data sources as applied for estimating the forest reference level __ 22
3.2.1: Documentation of stratification of the managed forest land _________________ 22
3.2.2: Documentation of sustainable forest management practices as applied in the estimation of the forest reference level ______________________________________ 32
3.3: Detailed description of the modelling framework as applied in the estimation of the forest reference level __________________________________________________________ 47
Chapter 4: Forest Reference Level ____________________________________________ 63
4.1: Forest Reference Level and detailed description of the development of the carbon pools ______________________________________________________________________ 63
4.1.1 Forest Reference Level and detailed description of the development of the carbon pools for a transition period of 20 years _____________________________________ 63
4.1.2 Forest Reference Level and detailed description of the development of the carbon pools for a transition period of 30 years _____________________________________ 64
4.2: Consistency between the forest reference level and the latest national inventory report ______________________________________________________________________ 65
Consistency of FRL projection with Regulation (EU) 525/2013 ____________________ 67
Consistency of FRL projection with long-term emissions goal ____________________ 68
4.3: Calculated carbon pools and greenhouse gases for the forest reference level ______ 70
References _______________________________________________________________ 72
Annex 1 Handling of minor species in modelling through association with major UK tree species __________________________________________________________________ 78
Annex 2 Detailed stratification of UK forest area (not allowing for soil class) _____________ 82
Annex 3 Worked examples of detailed calculation of detailed Forest Management Practices137

4
Introduction ____________________________________________________________ 137
Models involving no thinning _______________________________________________ 137
Example (1): Calculations for Sitka spruce, Yield Class 12, no thinning, 1.7 metre initial planting spacing ______________________________________________________ 138
Example (2): Scots pine, Yield Class 8, intermediate thinning, 1.4 metre initial planting spacing. _____________________________________________________________ 140
Example (3): Oak, Yield Class 6, intermediate thin, 1.2 metre initial planting spacing. _ 141
Annex 4 Methodology and rules applied in development of estimates of rotations applied to forest strata in FMPs for the public forest estates in England, Wales and Scotland _______ 143
Methodology ___________________________________________________________ 143
Main analysis: Step 1 ____________________________________________________ 143
Main analysis: Step 2 ____________________________________________________ 144
Main analysis: Step 3 ____________________________________________________ 144
Main analysis: Step 4 ____________________________________________________ 144
Rules ________________________________________________________________ 145
Annex 5 Description of detailed Forest Management Practices (FMPs) _______________ 147
Forest Management Practice involving no harvesting ___________________________ 147
Public forest estate (England, Scotland and Wales): Forest Management Practices involving clearcutting with no thinning during the rotation ________________________________ 147
Public forest estate (England, Scotland and Wales): Forest Management Practices involving clearcutting with thinning during the rotation ___________________________________ 156
Public forest estate (England, Scotland and Wales): Forest Management Practices involving “continuous cover”, i.e. continuous thinning and forest regeneration without clearcutting 182
Private forest estate (England, Scotland and Wales): Forest Management Practices involving clearcutting with no thinning during the rotation ________________________________ 189
Private forest estate (England, Scotland and Wales): Forest Management Practices involving clearcutting with thinning during the rotation ___________________________________ 205
Public and private forest estate (Northern Ireland): Forest Management Practices involving clearcutting with no thinning during the rotation ________________________________ 223
Public and private forest estate (Northern Ireland): Forest Management Practices involving clearcutting with thinning during the rotation ___________________________________ 227
Annex 6 Detailed assignment of FMPs to the forest strata _________________________ 233
England, Public forest estate ______________________________________________ 233
England, Private sector ___________________________________________________ 242
Scotland, Public forest estate ______________________________________________ 250
Scotland, Private sector __________________________________________________ 259
Wales, Public forest estate ________________________________________________ 266
Wales, Private sector ____________________________________________________ 276
Northern Ireland, Public forest estate ________________________________________ 283

5
Northern Ireland, Private sector ____________________________________________ 287
Annex 7 Content of the explanatory note on the final UK National Forest Accounting Plan _ 293
Technical recommendations in the European Commission SWD ___________________ 293
Conclusions of the LULUCF Expert Group ____________________________________ 293
Other issues ___________________________________________________________ 293
References ____________________________________________________________ 294

6
Chapter 1: General introduction
1.1: General description of the forest reference level of the United-Kingdom
The Land Use Land Use Change and Forestry (LULUCF) Regulation (EU 2018/841) was adopted by the European Union (EU) in May 2018. It both provides accounting rules for the LULUCF sector and sets a target that net accounted emissions in this sector be zero or less. Following article 6 of this regulation, Member States shall establish national forestry accounting plans (NFAP), including a proposed forest reference level (FRL) for the period from 2021 to 2025 and further guidance on how to do so was published by the European Commission in July 2018 (FRL guidance).
The FRL for the United Kingdom for the period 2021 to 2025 is -20 701.55 kilotonnes carbon dioxide equivalent per year (kt CO2e yr-1) including the contribution from harvested wood products (HWP), as calculated by applying the production approach and Tier 1 methods including default half-life values as defined in relevant guidance from the Intergovernmental Panel on Climate Change (IPCC Guidance).
The FRL not including the contribution from HWP, i.e. assuming a steady-state HWP pool, is -19 755.26 kt CO2e yr-1.
Within this National Forestry Accounting Plan, the Forest Reference Level has been calculated by assuming that the transition to managed forest land already occurs 20 years after the date of conversion to ensure consistency with emissions and removals reported for forest land remaining forest land in the existing greenhouse gas inventories. Following article 6(2) of the LULUCF Regulation, the UK intends to categorise cropland, grassland, wetland, settlements or other land converted to forest land as making the transition to managed forest land from 30 years after the date of conversion. This will be implemented to satisfy the criteria A.a of annex VI of the LULUCF regulation (see discussion in section 4.2). It will be realised through a technical correction to the forest reference level.
Contributions to emissions from biomass burning are included in the Natural Disturbance Background Level (249 kt CO2e yr-1) in this revised FRL. The other non-CO2 emissions reported on managed forest land, namely N2O emissions from soil drainage are also included in the FRL.
The FRL presented here is consistent with the UK’s 1990-2017 greenhouse gas (GHG) Inventory. The FRL projection diverges from 2010 onwards, when the forest management assumptions for the reference period of 2000 to 2009 that are described in this document are applied.

7
1.2: Consideration to the criteria as set in Annex IV of the LULUCF Regulation
According to article 8(4) of the LULUCF Regulation, Member States shall determine their FRL based on eight criteria (a-k) below. This section described how the FRL established by the UK respect those criteria.
It also includes, as Table 1.1, a description of where the various elements listed in section B of Annex IV of the LULUCF regulation are included in the present NFAP.
(a) the reference level shall be consistent with the goal of achieving a balance between anthropogenic emissions by sources and removals by sinks of greenhouse gases in the second half of this century, including enhancing the potential removals by ageing forest stocks that may otherwise show progressively declining sinks;
The FRL has been set in a way that assumes a continuation of Forest Management Practices (FMPs) and patterns of biomass use as characterised for the Reference Period of 2000 to 2009. Hence, the FRL provides an accounted emission incentive for actions that lead to greater removals compared with the continuation of existing practices and equally gives an accounted emission disincentive for actions that lead to greater emissions.
The long-term development of the FRL follows the FMPs characterised for the Reference Period, but also allows for age related effects relevant for the UK forest area. The forest age class distribution in the UK is very skewed, particularly for productive coniferous forests, as a result of significant afforestation activities between 1920 and 1990, and particularly between 1950 and 1980. Relatively large areas of coniferous forest are currently reaching economic maturity and are being clearcut. The FRL is based on the assumption that these forest areas will be restocked, thereby maintaining the forest sink. This assumption is supported by the Forestry Act 1967, which allows felling licences to require restocking of forest stands in most cases. In the longer term, the FRL indicates lower levels of wood production than currently, reflecting a period during which restocked forest areas are regrowing and there is less potential for production whilst maintaining the forest sink.
(b) the reference level shall ensure that the mere presence of carbon stocks is excluded from accounting;
Following the regulation, the FRL supports an accounting approach that covers net changes in forest carbon stocks, rather than the total existing carbon stocks in forests.
(c) the reference level should ensure a robust and credible accounting system that ensures that emissions and removals resulting from biomass use are properly accounted for;
The FRL has been set in a way that assumes a continuation of Forest Management Practices and patterns of biomass use as characterised for the Reference Period of 2000 to 2009. Any changes to levels of harvesting or patterns of biomass use compared with those of the Reference Period will lead to accounted emissions or removals, as appropriate, depending on the nature of the changes.

8
(d) the reference level shall include the carbon pool of harvested wood products, thereby providing a comparison between assuming instantaneous oxidation and applying the first-order decay function and half-life values;
The FRL has been reported with and without the contribution of HWP. Where the HWP contribution has been included, the production approach has been applied in conjunction with Tier 1 methods including default half-life values, as defined in relevant IPCC Guidance. For the FRL without HWP, the assumption has been made of a steady-state HWP pool.
(e) a constant ratio between solid and energy use of forest biomass as documented in the period from 2000 to 2009 shall be assumed;
The ratio between solid and energy use of forest biomass was characterised for the Reference Period and has been applied for the construction of the FRL
(f) the reference level should be consistent with the objective of contributing to the conservation of biodiversity and the sustainable use of natural resources, as set out in the EU forest strategy, Member States’ national forest policies, and the EU biodiversity strategy;
The UK Forestry Standard specifies good forest management including criteria covering sustainable yield, conservation of biodiversity and natural resources such as water, as well as carbon stocks. This Standard, referring to countries’ biodiversity strategies, and its supporting assurance scheme (UKWAS) have been existence since before the Reference Period of 2000 and 2009 and have been applied to the bulk of the UK forest area over this period. The major forest area in the UK not covered by the Forestry Standard and UKWAS consists of woodlands not historically or currently under active management for the production of timber. Additionally, all felling of more than 5 m3 in any calendar quarter (2 m3 if sold) requires a licence under the terms of the Felling Licence Regulations.
(g) the reference level shall be consistent with the national projections of anthropogenic greenhouse gas emissions by sources and removals by sinks reported under Regulation (EU) No 525/2013;
The FRL has been constructed to ensure consistency by reporting all relevant forest carbon pools and based on the same methodologies and data referred to when reporting results under Regulation (EU) 525/2013.
(h) the reference level shall be consistent with greenhouse gas inventories and relevant historical data and shall be based on transparent, complete, consistent, comparable and accurate information. In particular, the model used to construct the reference level shall be able to reproduce historical data from the National Greenhouse Gas Inventory.
The UK uses the same modelling framework for calculating the FRL and for calculating GHG Inventory results for Managed Forest Land. In addition, the forest strata characterised for the FRL calculations are the same as those used in calculating GHG Inventories. Hence, if the Forest Management Practices assumed in calculating a GHG inventory are used as inputs to the FRL modelling framework, the results are identical to those reported in the GHG Inventory for the pools and gases covered by the FRL.

9
Table 1.1: Equivalence table including explicit references of where the Annex IV B. elements are documented in the NFAP submission.
Annex IV B. paragraph item
Elements of the national forestry accounting plan according to Annex IV B.
Chapter of the NFAP containing the information
(a) A general description of the determination of the forest reference level.
Sections 1.1 and 3.1
(a) Description of how the criteria in LULUCF Regulation were taken into account.
Section 1.2
(b) Identification of the carbon pools and greenhouse gases which have been included in the forest reference level.
Sections 2.1 and 4.1
(b) Reasons for omitting a carbon pool from the forest reference level determination.
Section 2.1
(b) Demonstration of the consistency between the carbon pools included in the forest reference level.
Section 2.2
(c) A description of approaches, methods and models, including quantitative information, used in the determination of the forest reference level, consistent with the most recently submitted national inventory report.
Sections 3.1, 3.2 and 3.3. Annexes 1 to 6
(c) A description of documentary information on sustainable forest management practices and intensity.
Sections 1.2 (f) and 2.3.1
(c) A description of adopted national policies. Section 2.3.1 (d) Information on how harvesting rates are
expected to develop under different policy scenarios.
Section 2.3.2
(e) A description of how the following element was considered in the determination of the forest reference level:
See below
(i) The area under forest management Section 3.2.2, including Tables 3.2, 3.5 to 3.9, and notably Tables 3.10 and 3.11
(ii) Emissions and removals from forests and harvested wood products as shown in greenhouse gas inventories and relevant historical data
Section 4.2, including Figures 4.1 and 4.2 and Table 4.3 Supporting information in Section 3.3 including Tables 3.12, 3.13 and 3.14
10
Annex IV B. paragraph item
Elements of the national forestry accounting plan according to Annex IV B.
Chapter of the NFAP containing the information
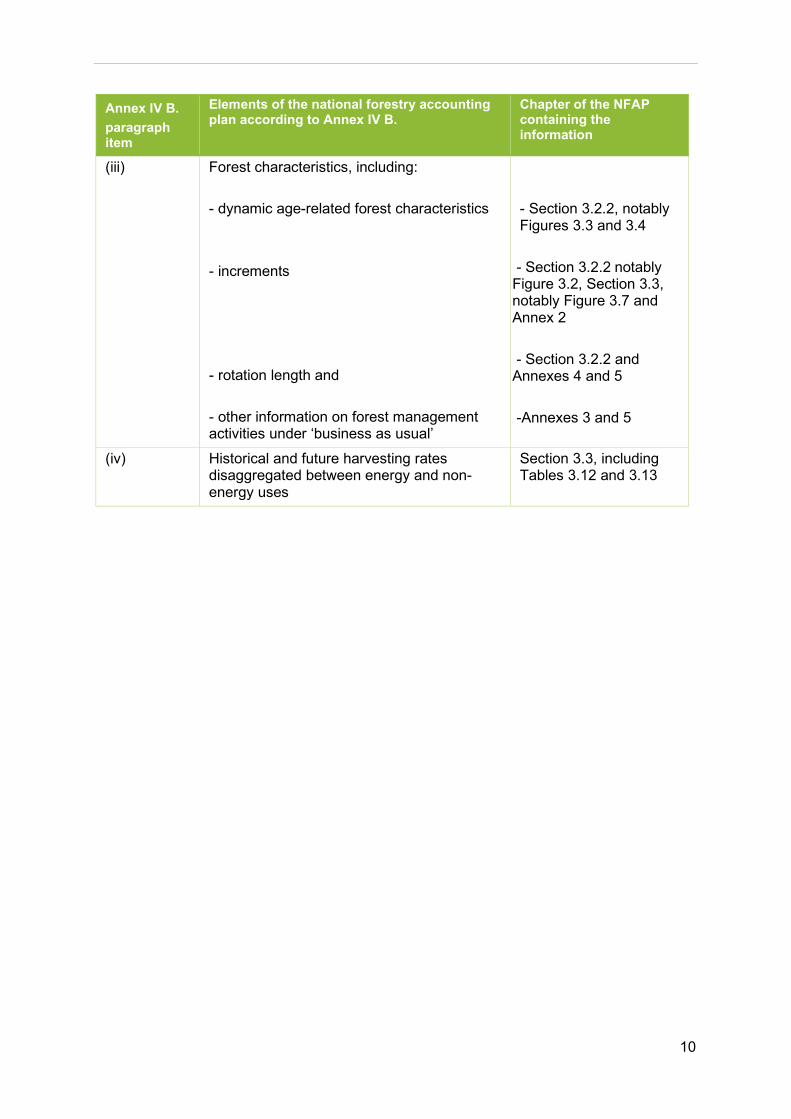
(iii) Forest characteristics, including: - dynamic age-related forest characteristics - increments - rotation length and - other information on forest management activities under ‘business as usual’
- Section 3.2.2, notably Figures 3.3 and 3.4
- Section 3.2.2 notably Figure 3.2, Section 3.3, notably Figure 3.7 and Annex 2 - Section 3.2.2 and Annexes 4 and 5 -Annexes 3 and 5
(iv) Historical and future harvesting rates disaggregated between energy and non-energy uses
Section 3.3, including Tables 3.12 and 3.13

11
Chapter 2: Preamble for the forest reference level
2.1: Carbon pools and greenhouse gases included in the forest reference level
Emissions and removals of carbon dioxide (CO2), as well as emissions of methane (CH4) and nitrous oxide (N2O) occurring on managed forest land are included in the FRL.
Consistent with the UK GHG Inventory, the following pools of carbon are included in calculating the FRL:
• Aboveground tree biomass (foliage, branchwood, stemwood and bark)
• Belowground biomass (coarse roots)
• Dead wood (standing and fallen)
• Litter
• Soil organic matter to a soil depth of 1 metre (including fine roots)
• Harvested wood products (HWP).
Consistent with the inventory, biomass in understorey vegetation is assumed to remain constant over time.
Emissions from fire (CO2, N2O and CH4) are included through the background level for natural disturbances.
Emissions of N2O from the drainage of soils are included in the FRL.
Emissions of N2O from fertiliser application are only reported under land converted to forest land and are therefore not included in the FRL.
2.2: Demonstration of consistency between the carbon pools included in the Forest Reference Level
The modelling framework applied for calculating the FRL (and also the GHG Inventory) is based on the principle of conservation of carbon. It follows that:
The accumulation or loss of carbon in the living biomass carbon pool is modelled explicitly as net carbon stock changes. Consistently defined gains associated with tree growth and losses associated with tree respiration and mortality are implicit in the carbon stock changes.

12
Losses from living biomass associated with tree harvesting are modelled explicitly.
Losses due to mortality enter the deadwood and litter pools or are lost from the system, according to defined turnover rates. Carbon lost from the system is implicitly assumed to be oxidised to the atmosphere.
The turnover of deadwood and litter results in losses to the atmosphere or inputs to soil organic matter. In principle, deadwood (i.e. forest residues) could be lost through harvesting but this practice is currently rare in the UK.
The accumulation or loss of carbon in the deadwood and litter pools is the net result of the inputs from the living biomass pool and losses from turnover.
There are also losses of soil organic matter, according to defined turnover rates.
The accumulation or loss of carbon in the soil carbon pool is the net result of inputs from deadwood or litter and losses from turnover.
Harvested wood is oxidised to the atmosphere as part of wood processing or when burnt for energy purposes or otherwise enters the HWP carbon pool. Losses of carbon from the HWP carbon pool occur according to the half-lives of defined HWP commodity classes.
The accumulation or loss of carbon in the HWP carbon pool is the net result of inputs from harvesting and losses from processing, burning or disposal of HWP.
The modelling framework involves an approach that ensures that changes in carbon stocks in the pools described above are consistent. For example, an increase in the carbon stock in HWP must involve a commensurate decrease in the carbon stock in living biomass. In this way, changes in carbon stocks in deadwood, litter, soil and HWP can be traced back to carbon stock changes in living biomass, ensuring that gains and losses associated with each carbon pool (represented implicitly) are consistent. Further description of the modelling approach is given in Section 3.1.
2.3: Description of the long-term forest strategy
2.3.1: Overall description of the forests and forest management in the United Kingdom and the adopted national policies
Forestry policy is devolved in the UK and so forestry policy is led by the Department for Environment, Food and Rural Affairs in England, the Department of Agriculture, Environment and Rural Affairs in Northern Ireland, the Scottish Government in Scotland and the Welsh Government in Wales. Gibraltar does not have any forest land. All four countries have established policies for woodland creation, currently co-financed through the EU Rural Development Programme. The development of the Woodland Carbon Code, including its launch on an international carbon registry is attracting private and corporate funding additional to the Rural Development Programme. A revised UK Forestry Standard (UKFS), including Guidelines on Forests and Climate Change, was published in July 2017. The requirement for climate change mitigation is that ‘forest management should contribute to climate

13
change mitigation over the long term through the net capture and storage of carbon in the forest ecosystem and in wood products’. Meeting the requirements of the UKFS is a condition of grant-aid, and also underpins both the Woodland Carbon Code and forest certification under the UK Woodland Assurance Standard. A strong regulatory framework continues to protect existing woodland from deforestation and degradation.
The Clean Growth Strategy (CGS) was published in October 2017 and sets out broad aspirations to enhance the rate of afforestation and use of timber in construction in an illustrative pathway towards meeting the UK’s fifth carbon budget (2028-32) and to generate longer term emissions reductions. The fifth carbon budget is set in regulations under the Climate Change Act 2008 at 1,725 Mt CO2e requiring annualised emissions over the period 2028 to 2032 to be 57% lower than they were in 1990. This includes LULUCF sector emissions. The CGS also committed to ‘set up a stronger and more attractive domestic carbon offset market that will encourage more businesses to support cost effective emissions reductions, such as through planting trees’ and to ‘unlock private finance to invest in forestry by establishing forestry investment zones to offer investors streamlined decision making and more certainty, within shorter timelines’.
England, Scotland and Wales also have established Strategies that aim to increase the contribution of both existing and new woodlands to renewable energy production. For example, the supply of small to medium scale heat in off gas grid areas is the focus of Forestry Commission England’s Woodfuel Implementation Plan, which is supported by renewable energy policies including the Renewable Heat Incentive.
The Climate Change Act 2008 included a long-term target that the UK net carbon account in 2050 should be at least 80% lower than the 1990 baseline. The Climate Change Act 2008 (2050 Target Amendment) Order 2019 changed that target to at least 100% lower. Hence requiring the UK to achieve net zero emissions by 2050.
England In England, the government’s 25 year Environment Plan published in January 2018 includes an aspiration to increase woodland cover from 10% to 12% by 2060, with 180,000ha more woodland by 2042. The plan includes a focus on woodland to maximise their natural capital benefits, including kickstart funding for the Northern Forest, support larger scale woodland creation the Woodland Carbon Fund and the appointment of a national Tree Champion.
The Environmental Impact Assessment (Forestry) Regulations were revised in May 2017, requiring more information to be provided by proposers of afforestation projects, while increasing the EIA threshold in areas mapped as low risk if a UKFS-compliant woodland creation plan is submitted. The objective of raising the threshold was to encourage the planting of larger woodlands, in part, to contribute to emissions reduction. The design of larger scale productive woodlands is supported through the Woodland Creation Planning Grant (from 2015), while their establishment is financed through the Woodland Carbon Fund (from 2016). A policy on when to convert woods and forests to open habitats in England is in place, which includes as assessment of implications for carbon balance in the process of prioritising sites for restoration. The development of a thriving forestry sector, through an industry-led action plan (Grown
14
in Britain), is highlighted as an essential element to achieve woodland planting aspirations and deliver emissions savings in other sectors through the sustainable use of woodfuel as a source of renewable energy and harvested wood products substituting for other materials.
Scotland In Scotland, forestry is recognised as having an important role in mitigating the impacts of climate change through carbon storage and sequestration and the Scottish Government is committed to expanding the woodland resource throughout Scotland.
The Climate Change Plan (third report on policies and proposals, 2018) sets out how the Scottish Government will meet its greenhouse gas emission reduction targets for the period 2017-2032 and includes ambitious woodland creation targets, aiming to increase forest and woodland cover from around 18% to 21% of the land area of Scotland by 2032. This equates to 10 000 hectares of new woodland per year until 2020-21, with stepped increases thereafter to 15 000 hectares per year from 2025.
These ambitions were reaffirmed in Scotland’s Forestry Strategy 2019-2029, which identified the expansion of forests and woodlands across Scotland as a priority for action. The 2019-2020 Programme for Government also reiterated the Scottish Government’s support for woodland expansion, announcing additional funding to seek to create 12,000 hectares of new woodland in 2019-20, an ambitious aim and 2,000 hectares more than the Climate Change Plan target for the same period.
The creation of these new woodlands and forests will be underpinned by the internationally recognised principles of sustainable forest management and the principle of the right tree, in the right place, for the right purpose. The Forestry Grant Scheme offers financial support for the creation of new woodland and the sustainable management of existing woodland and all applications are assessed against the UK Forestry Standard, which defines the agreed approach to sustainable forest management across all four administrations of the UK.
To complement woodland creation, a framework to better control woodland removal is also in place. The Climate Change Plan also includes a policy to increase emissions abatement through greater use of Scottish timber in building construction and refurbishment.
Wales To promote sustainable land use, “Woodlands for Wales” is the Welsh Government’s fifty-year Strategy. It is the Welsh Government’s aim to achieve at least the minimum planting rate of 2,000 hectares each year from 2020 and over time to increase planting to levels that enable Wales to deliver the legal obligation entered into with the Environment (Wales) Act 2016.
Northern Ireland The duties and powers of the Forest Service are set out in the Forestry Act (Northern Ireland) 2010. Forest policy is to expand the area under forest and to manage forests sustainably, so as to supply a wide range of forestry services. These are chiefly
15
timber, public access and environmental services. Privately owned forests are subject to certain provisions of the Act, and this and support for forest expansion is administered by the Forest Service. The Forest Service holds both Forestry Stewardship Council (FSC) and Programme for the Endorsement of Forestry Certification (PEFC) accreditation for its standard of forest management, certifying that it manages forests in a sustainable manner. The policy set out in the 2006 Forestry Strategy is to steadily expand tree cover and to manage woods and forests sustainably. This policy aims to steadily expand tree cover with the aim of increasing forest cover to 12% of land area by 2050. The intention is to provide new woodland supplying a range of ecosystem services including: public access; carbon capture; reduction of flood risk, timber production and biodiversity. An additional programme, the Rural Development Programme, provides a basis for the continued promotion of forest expansion by private landowners and public bodies through grant aid. Under this programme approximately 200 hectares of new forest planting annually will be grant aided until 2020.
2.3.2: Description of future harvesting rates under different policy scenarios
Currently, there are no published forecasts of potential future wood production in the UK involving scenarios for the management of forest land explicitly related to climate change policy. The Forestry Commission (2014ab) has published forecasts for several scenarios exploring the possible impacts of policies related to the promotion of biodiversity and rural development through the management of forest areas in Great Britain. In broad terms, amongst other factors, these scenarios explore changes to existing forest management practices involving:
• Creation of more open space within forests or restocking with broadleaves when clearcutting coniferous forest areas, in order to comply with UKFS.
• Mobilisation of some or all of the available wood resource in broadleaved forest areas, where these are currently unmanaged. This aims at improving habitat quality in response to the peculiar nature of woodlands in the UK where most have been managed in the past and are now “undermanaged”, leading to them being over-stood/dense but not approaching “old-growth” status.
The scenarios also looked at the impacts of varying clearcutting rotations on the magnitude and time course of wood production.
For existing coniferous forests in Great Britain (i.e. not allowing for woodland creation), the scenarios suggest that wood production may be sustained or could potentially increase over the next 10 to 15 years, at between 10 and 12.5 million cubic metres per year over bark standing. However, all scenarios suggest that wood production from coniferous forests is likely to drop in the later part of this century, to between 6 and 8 million cubic metres per year in the absence of additional woodland creation. This is illustrated in Figure 2.1 which shows 50-year forecasts for three scenarios of wood production from coniferous forests in Britain over a 50 year period from 2011 (Forestry Commission, 2014a). The drop in wood production reflects high rates of afforestation between 1920 and 1990, which has created a skewed age distribution within coniferous forest areas. The scenarios illustrated in Figure 2.1 vary

16
principally in terms of the assumed rotations and proportions of forest area restocked on clearcutting. These scenarios affect the detailed time course of wood production but not the general trends.
Figure 2.1. Forecast of wood production from coniferous forests in Britain for 50 years from 2011, showing three possible scenarios for harvesting and restocking.
For broadleaved forests in Great Britain, statistics suggest that wood production has been declining since the 1970s (Forestry Commission, 2018). The statistics and the forecast scenarios suggest that currently commercial hardwood production is very low (less than 1 million cubic metres per year over bark standing). However, the forecast scenarios also suggest that there could be significant potential to increase production to between 3 and 6 million cubic metres per year by introducing active management in broadleaved forest areas that are currently unmanaged (Forestry Commission, 2014b). This is illustrated in Figure 2.2 which shows 50-year forecasts for four scenarios of wood production from broadleaved forests in Britain over a 50 year period from 2011 (Forestry Commission, 2014b). The blue line in Figure 2.2 effectively represents business as usual management of broadleaved forests with the other results representing theoretical wood mobilisation scenarios.
4,000
5,000
6,000
7,000
8,000
9,000
10,000
11,000
12,000
13,000
14,000
2013-16 2017-21 2022-26 2027-31 2032-36 2037-41 2042-46 2047-51 2052-56 2057-61
2. Modified biologicalpotential, 10%reduction in coniferstocked area
5. Felling and thinningto the 2005 industry ‘view’
6. Felling stands whenthey achieve a topheight of 25m
Vol
ume
(thi
nnin
g &
fel
ling)
Ave
rage
ann
ual p
rodu
ctio
n pe
r pe
riod
(000
sof
cubi
cm
etre
sov
erba
rk s
tand
ing)

17
Figure 2.2. Forecast of wood production from broadleaved forests in Britain for 50 years from 2011, showing four possible scenarios for mobilisation of the wood resource.
The construction of the FRL is based on the assumption that forest management characterised for a Reference Period of 2000 to 2009 is continued into the future. None of the above scenarios are exactly consistent with such an assumption. However, a forecast of wood production from coniferous forests based on assumptions developed for the FRL should have the same order of magnitude as indicated by the scenarios in Figure 2.1 and show a similar longer term trend. For broadleaved forests, a forecast based on assumptions developed for the FRL should be similar to the blue line in Figure 2.2. However, the forest statistics for the 2000-2009 period are focussed on commercial wood harvest being derived from sawmill returns, and underestimate non-commercial hardwood harvest. Improved statistics on non-commercial hardwood harvest might result in a technical correction of the FRL.
0
2,000
4,000
6,000
8,000
10,000
12,00020
13-2
016
2017
-202
1
2022
-202
6
2027
-203
1
2032
-203
6
2037
-204
1
2042
-204
6
2047
-205
1
2052
-205
6
2057
-206
1
Thin and fell only whereevidence of thinningpractice (BLV2)
Thin and fell all stands(BLV3)
Thin and fell all stands.Management regimes thatmaximise yield (BLV4)
75% of woodlands undermanagement plans
Vol
ume
(thi
nnin
g &
fel
ling)
Ave
rage
ann
ual p
rodu
ctio
n pe
r pe
riod
(000
sof
cubi
cm
etre
sov
erba
rk s
tand
ing)

18
Chapter 3: Description of the modelling approach
3.1: Description of the general approach as applied for estimating the forest reference level
This section describes the general approach applied for estimating the FRL and a related approach to estimating the contribution of managed land to CO2 emissions and removals, as applied in UK GHG inventories. An appreciation of the approach taken in GHG inventories is helpful for understanding the approach taken for the FRL, and in particular where differences in methods are involved.
The essential steps involved in estimating the CO2 emissions and removals of Managed Forest Land for a GHG inventory are described in Box 3.1. The variations in these steps applied for the purposes of constructing the FRL are described in Box 3.2. The modelling methodologies in Boxes 3.1 and 3.2 are applied separately to data available for each country (England, Scotland, Wales and Northern Ireland) and for coniferous and broadleaved forest areas.
Box 3.1 Essential steps in modelling Managed Forest Land for GHG Inventory calculations
Step 1. Stratify the forest area according to the following classification:
• Country (England, Scotland, Wales, Northern Ireland)
• Forest ownership (public forest estate and private sector)
• Tree species (as represented in the CARBINE model, see Section 3.3)
• Potential increment (expressed as yield class, see Matthews et al., 2016a)
• High-level management type
• Soil class (mineral, organic).
The approach to stratification is discussed in more detail in Section 3.2.1. There are four possible high-level management types:
1. No harvesting (no thinning and no clearcutting)
2. No thinning with clearcutting
3. Thinning with clearcutting
19
4. Continuous thinning (harvesting by thinning involving the continuous maintenance of forest cover, i.e. without clearcutting).
Step 2. Assume that any thinning is carried out according to standard prescriptions as described in British Forestry Commission yield tables (Matthews et al., 2016ab). Essentially this involves:
• Specifying a recommended age of first thinning (based on a standard yield table)
• Harvesting every 5 years from the age of first thinning
• Harvesting a prescribed fixed stem volume at each thinning (defined in terms of harvested standing timber over bark, based on a standard yield table)
• After forests have reached economic maturity, harvesting a gradually diminishing stem volume at each thinning (defined in terms of harvested standing timber over bark, based on a standard yield table), unless managing based on continuous thinning, in which case the fixed thinning volume is maintained.
For some tree species, the first thinning may involve harvesting a different volume compared with the prescribed fixed stem volume mentioned above. These cases may be regarded as pre-commercial thinnings.
Step 3. For each stratum involving a high-level management type of 2 or 3 (i.e. involving clearcutting), specify a range of rotation ages (minimum to maximum) which may be applied. Generally, these rotations reflect either economic or silvicultural principles, being around the time of maximum volume production for conifers and similarly for broadleaves, although rotations may be extended to increase sawlog production in broadleaves (Matthews et al., 2016ab).
Step 4. Derive the age distribution for each stratum based on data available from the most recent National Forest Inventory (NFI) or similar data source (e.g. management records maintained for the public forest estate).
Step 5. Use the following inputs to an optimisation procedure:
• The age distribution for each stratum
• The high-level management types assigned to each stratum (including rotation ranges)
• Records for annual afforestation rates since 1920
• Reported statistics on annual wood production (softwood and hardwood) since 1975.

20
The optimisation procedure involves:
• Adjusting the specific rotations applied to strata (within the specified ranges) and
• Adjusting the allocation of forest areas in private ownership between high-level management type 1 (no harvesting) on the one hand and the other high-level forest management types on the other hand.
The optimisation procedure constructs an annual sequence for the creation of forest areas in each stratum (which may be referred to as a “planting sequence”), that best matches (or reconciles with) the input age distribution, annual afforestation rates and reported wood production.
Step 6. Compile a set of input data for the CARBINE forest sector accounting model consisting of:
• The parameters defining each stratum (including the detailed rotations, where relevant)
• The annual sequence for the creation of forest areas in each stratum.
Step 7. Run the CARBINE model using the input data prepared in Step 6 and process the outputs for reporting as part of a GHG inventory.
21
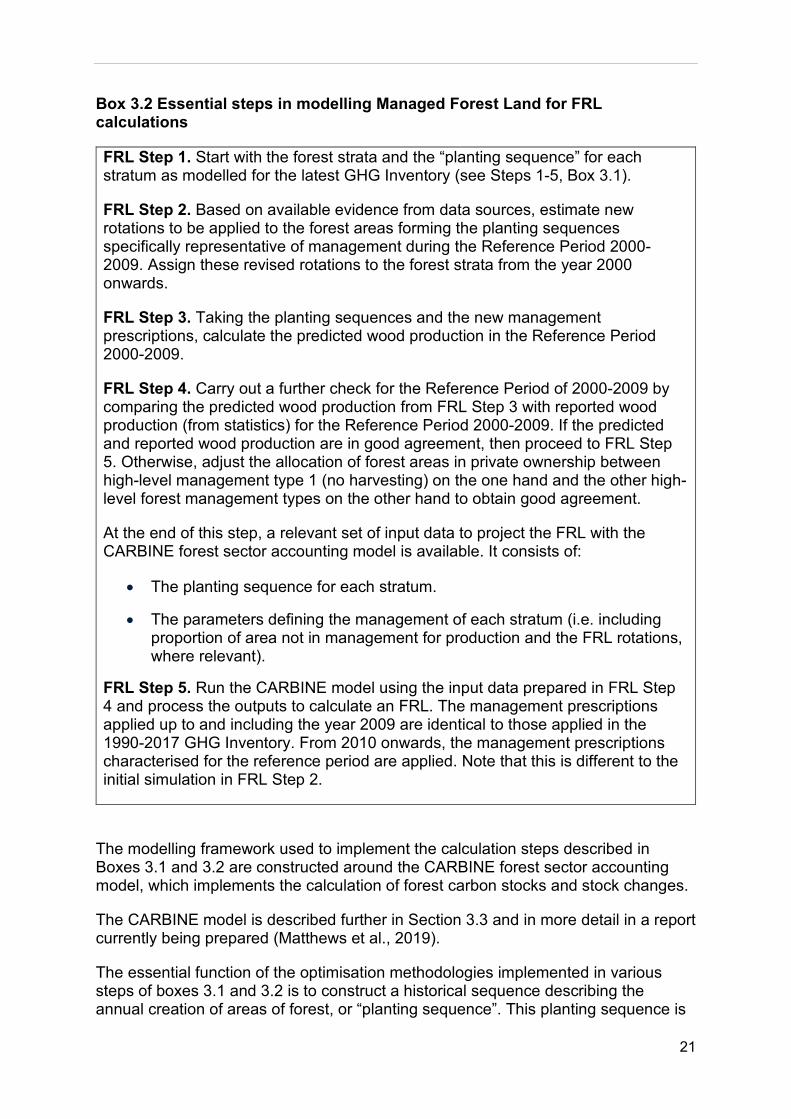
Box 3.2 Essential steps in modelling Managed Forest Land for FRL calculations
FRL Step 1. Start with the forest strata and the “planting sequence” for each stratum as modelled for the latest GHG Inventory (see Steps 1-5, Box 3.1).
FRL Step 2. Based on available evidence from data sources, estimate new rotations to be applied to the forest areas forming the planting sequences specifically representative of management during the Reference Period 2000-2009. Assign these revised rotations to the forest strata from the year 2000 onwards.
FRL Step 3. Taking the planting sequences and the new management prescriptions, calculate the predicted wood production in the Reference Period 2000-2009.
FRL Step 4. Carry out a further check for the Reference Period of 2000-2009 by comparing the predicted wood production from FRL Step 3 with reported wood production (from statistics) for the Reference Period 2000-2009. If the predicted and reported wood production are in good agreement, then proceed to FRL Step 5. Otherwise, adjust the allocation of forest areas in private ownership between high-level management type 1 (no harvesting) on the one hand and the other high-level forest management types on the other hand to obtain good agreement.
At the end of this step, a relevant set of input data to project the FRL with the CARBINE forest sector accounting model is available. It consists of:
• The planting sequence for each stratum.
• The parameters defining the management of each stratum (i.e. including proportion of area not in management for production and the FRL rotations, where relevant).
FRL Step 5. Run the CARBINE model using the input data prepared in FRL Step 4 and process the outputs to calculate an FRL. The management prescriptions applied up to and including the year 2009 are identical to those applied in the 1990-2017 GHG Inventory. From 2010 onwards, the management prescriptions characterised for the reference period are applied. Note that this is different to the initial simulation in FRL Step 2.
The modelling framework used to implement the calculation steps described in Boxes 3.1 and 3.2 are constructed around the CARBINE forest sector accounting model, which implements the calculation of forest carbon stocks and stock changes.
The CARBINE model is described further in Section 3.3 and in more detail in a report currently being prepared (Matthews et al., 2019).
The essential function of the optimisation methodologies implemented in various steps of boxes 3.1 and 3.2 is to construct a historical sequence describing the annual creation of areas of forest, or “planting sequence”. This planting sequence is

22
used as input data to the CARBINE model, which grows the forest areas forward through time, and calculates the development of the forest area age class distribution and carbon stocks and stock changes. For the GHG Inventory, the planting sequence is derived directly from the forest area age class distribution reported in the latest NFI and other relevant data sources (Step 4, Box 3.1), and the management parameters applied to the forest strata, the simulated forest area age class distribution produced by the CARBINE model is a good match for the reported distribution.
The CARBINE simulation for the FRL also uses the planting sequence derived for the GHG Inventory but, from 2010 onwards, applies management parameters applicable for the Reference Period of 2000-2009. This is in contrast to the modelling for the GHG Inventory, which may adjust management including forest rotations after 2009 to reconcile simulated wood production with the production reported between 2010 and the reporting year of the GHG Inventory. It follows that the FRL and GHG Inventory should be in agreement up to and including the year 2009. After 2009, if the management parameters characterised for the Reference Period are significantly different to those applied in the GHG Inventory, which reflect developments in harvest intensity in the later period, then the simulated forest area age class distribution for the FRL projection will develop differently to that simulated for the GHG Inventory. The forest area age class distributions simulated for the FRL in the NFI reporting year will then be different to the reported distribution.
3.2: Documentation of data sources as applied for estimating the forest reference level
3.2.1: Documentation of stratification of the managed forest land
The development of estimates of GHG emissions and removals, as reported for Managed Forest Land in UK GHG Inventories, is based on several sources of data as shown in Table 3.1. These data sources were also referred to in defining the forest strata for the development of the FRL. The forest area of the United Kingdom is summarised in Table 3.2.
When reporting GHG inventories, the UK defines a forest as having a minimum area of 0.1 ha and a minimum width of 20 m, together with a tree canopy cover of 20% and a potential tree height of 2 m. This definition has also been adopted for the purposes of constructing the FRL.
The National Forest Inventory (NFI, Forestry Commission, 2012) reports on forest areas for a minimum area of 0.5 ha, hence this information has been supplemented with additional data from a separate NFI study that identified small woodlands (Forestry Commission, 2017).
The data in Table 3.2 are the result of combining information from several sources (see Table 3.1) with different reporting years (i.e. 2011 for private forests, 2014 for public forests and 2016 for small woodlands in England, Scotland and Wales, and 2013 for forest areas in Northern Ireland). For consistency, data from these sources have been adjusted where needed to permit reporting in Table 3.2 on a consistent

23
basis for a reporting year of 2011, as well as consistency with forest areas reported in the CRF for the UK GHG Inventory. These adjustments were based on the modelling undertaken for the construction of GHG inventories and the FRL as described in this document, in particular in Boxes 3.1 and 3.2. The year 2011 is the earliest year for which forest inventory data are reported based on the latest NFI, the main source for data on forest areas. Hence, data for this reporting year is the closest available to the Reference Period of 2000-2009. This data source was preferred rather than referring to data from earlier forest inventories, which were started in the 1990s and which do not report on certain variables that are important for this modelling exercise (e.g. yield class, see discussion of increment later in this section). The Statistics Group of Forest Research provided recently updated forest area statistics for the 2011 Forestry Statistics report, in which generally small, but registerable corrections have been made to reported areas for some countries in the original publication.
Forestry statistics and the GHG Inventory for the UK suggest a total forest area of just over 3.5 million hectares, including about 475 thousand hectares of non-wooded areas (i.e. integral open space, including areas of rocky ground, roads, rides and streams or land prepared for planting). There are significant forest areas in England, Scotland, Wales and Northern Ireland, although the area in Northern Ireland is relatively small, at less than 5% of the UK forest area.
Table 3.1 Data sources for the development of forest strata
Forest characteristics
Data references Stratum ID where the characteristics and reference are relevant
Area of strata 1) Public forests (England, Scotland, Wales) 2) Private forests (England, Scotland, Wales) 3) Northern Ireland forests (Public and Private) 4) Small woodlands (England, Scotland, Wales)
Forestry Commission, 2011; SCDB, 2014*; Forestry Commission, 2014c* Forestry Commission, 2011; Forestry Commission, 2014c* NIFS, 2013* Forestry Commission, 2017*
Tables 3.2, 3.4, 3.5, 3.6, 3.7 and Annexes 2 and 6 Tables 3.2, 3.4, 3.5, 3.6, 3.7 and Annexes 2 and 6 Tables 3.2 and 3.8 and Annexes 2 and 6 Tables 3.2, 3.4, 3.5, 3.6, 3.7 and Annexes 2 and 6
Historical afforestation 1) England, Scotland and Wales (Public and Private) 2) Northern Ireland (Public and Private)
Forestry Commission records (see Cannell and Dewar, 1995) Cannell et al., 1996
Box 3.1 (Section 3.1) Box 3.1 (Section 3.1)
Soil class Webb et al. (2013) Section 3.2.1

24
* Note: for the purposes of reporting in this National Forest Accounting Plan, data sources have been adjusted for a consistent reporting year of 2011 and to ensure compatibility with forest areas reported in the CRF in the UK 1990-2017 GHG Inventory.

25
Table 3.2 Summary of United Kingdom forest areas
Country Ownership Coniferous Broadleaved Total wooded Non-wooded
Total
England
Public 115 405.8 48 253.2 163 659.0 52 703.9 216 363
Private 203 624.3 1 104 585.5 1 308 209.8 84 905.7 1 393 115
Total 319 030.1 1 152 838.7 1 471 868.8 137 609.5 1 609 478
Scotland Public 320 580.7 27 875.9 348 456.6 137 364.6 485 821
Private 524 146.2 313 413.7 837 559.9 126 304.8 963 865
Total 844 726.9 341 289.6 1 186 016.5 263 669.5 1 449 686
Wales Public 78 613.0 9 992.3 88 605.3 28 024.2 116 629
Private 52 472.7 157 182.9 209 655.6 31 435.8 241 091
Total 131 085.6 167 175.2 298 260.9 59 460.0 357 721
N. Ireland Public 46 714.0 1 721.5 48 435.5 - -
Private 8 711.6 40 661.0 (12 039.4)
49 372.6 (20 751.0)
- -
Total 55 425.6 42 382.5 (13 760.9)
97 808.1 (69 186.5)
14 303.9 112 112
UK Public 561 313.4 87 843.0 649 156.4 - -
Private 788 954.8 1 615 843.1 (1 587 221.5)
2 404 797.9 (2 376 176.3)
- -
Total 1 350 286.2 1 703 686.1 (1 675 064.4)
3 053 972.3 (3 025 332.7)
475 024.7 3 528 997
Notes:
Sums of areas may not precisely agree with reported total areas shown in the table because of rounding.
Coniferous, broadleaved and total wooded areas are based on areas reported in the GB NFI for a forest inventory year of 2011 and the Northern Ireland Woodland Basemap for 2013 in conjunction with records for the Public forest estates, also including areas for small woodlands in England, Scotland and Wales (between 0.1 and 0.5 ha in area), expressed for a consistent reporting year of 2011. This combination of areas may differ from total forest areas reported by the UK and its Devolved Administrations.
For Northern Ireland private forests, total stocked areas are given with the areas modelled in GHG inventories given in brackets.
It should be clarified that the forest areas shown in Table 3.2 for wooded land (i.e. the coniferous, broadleaved and total wooded areas) represent “stocked areas” or “net areas”, i.e. land occupied by trees, not including associated areas of land cover such as forest roads, rides, rocky ground, rivers etc.
For Northern Ireland private forests, areas include an area of about 28.6 kha of old, unproductive and unmanaged woodlands. These have been registered in Northern Ireland woodland surveys more recently than 2011 and the area is also included in the CRF of UK GHG inventories. However, these old and unmanaged woodlands are assumed to be in carbon balance and carbon stock changes are not modelled in GHG inventories. The modelled areas are shown in brackets in Table 3.2.
26
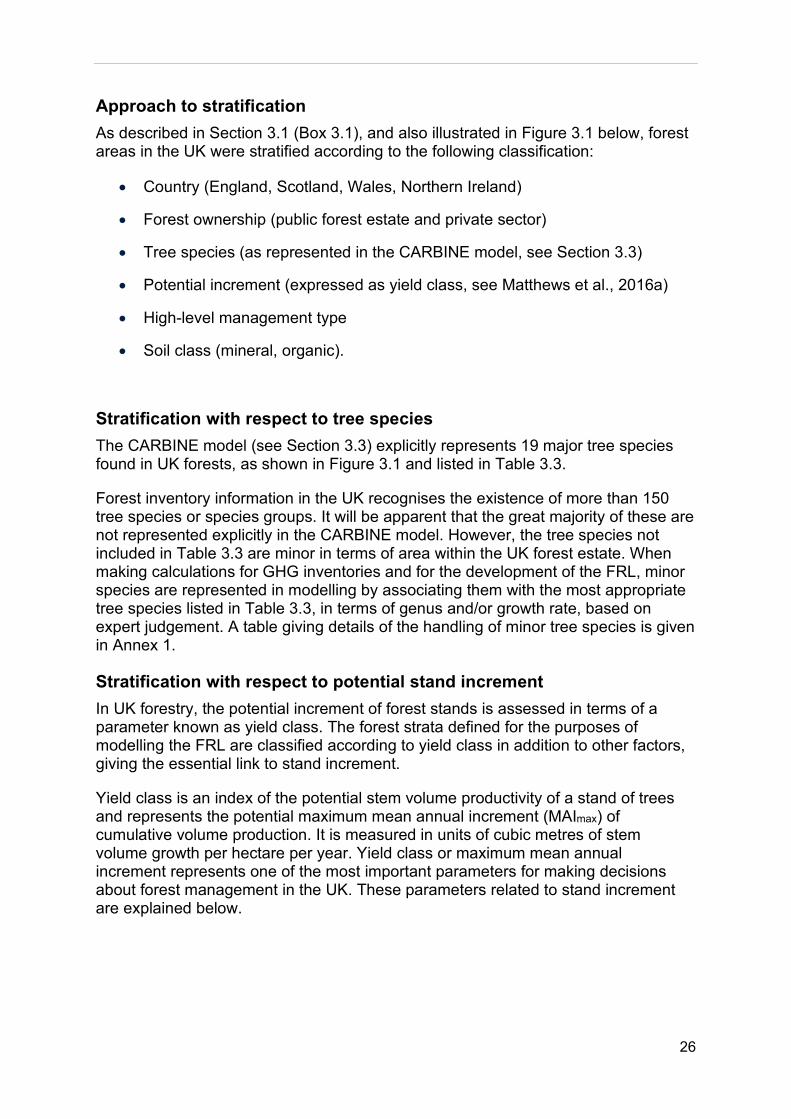
Approach to stratification As described in Section 3.1 (Box 3.1), and also illustrated in Figure 3.1 below, forest areas in the UK were stratified according to the following classification:
• Country (England, Scotland, Wales, Northern Ireland)
• Forest ownership (public forest estate and private sector)
• Tree species (as represented in the CARBINE model, see Section 3.3)
• Potential increment (expressed as yield class, see Matthews et al., 2016a)
• High-level management type
• Soil class (mineral, organic).
Stratification with respect to tree species The CARBINE model (see Section 3.3) explicitly represents 19 major tree species found in UK forests, as shown in Figure 3.1 and listed in Table 3.3.
Forest inventory information in the UK recognises the existence of more than 150 tree species or species groups. It will be apparent that the great majority of these are not represented explicitly in the CARBINE model. However, the tree species not included in Table 3.3 are minor in terms of area within the UK forest estate. When making calculations for GHG inventories and for the development of the FRL, minor species are represented in modelling by associating them with the most appropriate tree species listed in Table 3.3, in terms of genus and/or growth rate, based on expert judgement. A table giving details of the handling of minor tree species is given in Annex 1.
Stratification with respect to potential stand increment In UK forestry, the potential increment of forest stands is assessed in terms of a parameter known as yield class. The forest strata defined for the purposes of modelling the FRL are classified according to yield class in addition to other factors, giving the essential link to stand increment.
Yield class is an index of the potential stem volume productivity of a stand of trees and represents the potential maximum mean annual increment (MAImax) of cumulative volume production. It is measured in units of cubic metres of stem volume growth per hectare per year. Yield class or maximum mean annual increment represents one of the most important parameters for making decisions about forest management in the UK. These parameters related to stand increment are explained below.

27
Figure 3.1. Illustration of steps in forest area stratification

28
Table 3.3 Tree species represented in the CARBINE model and used in forest area stratification
Common species name Latin name CARBINE species code Norway spruce Picea abies NS
Sitka spruce Picea sitchensis SS
Scots pine Pinus sylvestris SP
Corsican pine Pinus nigra subspecies (ssp.) Laricio
CP
Lodgepole pine Pinus contorta LP
European larch Larix decidua EL
Japanese/hybrid larch Larix kaempferi/L. JL
Douglas fir Pseudotsuga menziesii DF
Grand fir Abies grandis GF
Noble fir Abies procera NF
Western hemlock Tsuga heterophylla WH
Western red cedar Thuja plicata RC
Oak Quercus species pluralis (spp.)
OK
Ash Fraxinus excelsior AH
Beech Fagus sylvatica BE
Birch Betula spp. BI
Sycamore Acer pseudoplatanus SY
Poplar Populus. spp. PO
Nothofagus Nothofagus spp. NO
Cumulative volume production An important measure of volume productivity in UK forestry is cumulative volume production. Cumulative timber volume production is the standing stem volume per hectare attained by a forest stand in a given year plus the sum of per hectare stem volumes removed as thinnings up to that year. Cumulative volume production represents the total production of timber volume from a stand up to a given year in the stand’s development.
An example of cumulative volume production as measured in a permanent sample plot of even-aged Sitka spruce is given in Table 3.4. As an illustration of how cumulative volume production is calculated, in Table 3.4 cumulative production up to age 44 years is:
369 + 34 + 33 + 49 + 24 + 35 + 61 + 53 = 658 cubic metres per hectare.

29
Table 3.4 Standing volume and production in an even-aged stand of Sitka spruce in Britain (Forestry Commission permanent mensuration sample plot
1222, Brendon, Somerset, established 1948, felled 1986 at age 57).
Year Stand age (years)
Top height (m)
Volume per hectare (m3 ha-1) Mean annual increment (m3 ha-1 yr-1)
Volume standing after thinning
Volume removed as thinnings
Cumulative volume
1948 19 8.6 103 34 137 7.2
1951 22 10.0 - 33 - -
1953 24 11.1 121 49 237 9.9
1958 29 14.5 - 24 - -
1963 34 16.0 262 35 437 12.9
1967 38 17.8 272 61 508 13.3
1973 44 21.3 369 53 658 15.0
1978 49 23.4 396 59 744 15.2
1986 57 - 531 - 879 15.4
The main applications of cumulative volume production are in economic analysis and in support of practical forest management. In essence, cumulative volume production represents the out-turn of commercial stem volume from a stand up to a given year in the stand’s development.
Current annual increment Current annual increment (CAI) is strictly the rate of cumulative volume production for a given year. For example, suppose the cumulative volume production of a 35 year old stand of trees is 500 cubic metres per hectare, and that by the time the stand is 36 years old the cumulative volume production has risen to 520 cubic metres per hectare. The CAI of the stand at age 36 is then calculated as 520 – 500 = 20 cubic metres per hectare per year.
For ease of calculation and for practical reasons, CAI is frequently approximated from two measurements of cumulative volume production taken more than one year apart. For example, the CAI of the Sitka spruce stand in Table 3.4 at age 22 years could be approximated as (237−137 cubic metres) ÷ 5 years = 100 ÷ 5 = 10.0 cubic metres per hectare per year. It is important to note that, because of the way it is calculated, strictly, this example of an estimate of current annual increment applies ‘on average’ for the stand between the ages of 19 and 24 years.

30
Mean annual increment Mean annual increment (MAI) is the average rate of cumulative volume production up to a given year. In even-aged stands, MAI is calculated by dividing cumulative volume production by age. For example, for the Sitka spruce stand in Table 3.4, the mean annual increment up to age 44 years is 658 ÷ 44 = 15.0 cubic metres per hectare per year.
Development of MAI and CAI over time For an even-aged stand of trees, both MAI and CAI follow a characteristic pattern of development with respect to stand age, as shown in Figure 3.2. In this example, the curves are based on a yield model for Sitka spruce in Great Britain for which MAImax is 11 m3 ha-1 yr-1, occurring at a stand age of 54 years. The above curves clearly illustrate that the MAImax of sawlogs (i.e. roundwood with a minimum top diameter, under bark, of 16 cm) is lower, and occurs later than the equivalent MAImax for total volume production; in this example stand, the MAImax of sawlogs is 7.9 m3 ha-1 yr-1 and is reached at a stand age of 69 years.
Figure 3.2. Trajectories of mean annual increment (MAI) of cumulative volume production, current annual increment (CAI) and sawlog mean annual increment (Sawlog MAI) for an even-aged stand of unthinned Sitka spruce.
In the early years of stand development, both CAI and MAI rise steadily from zero to reach maximum values before declining again. The annual volume increment (CAI) reaches a peak earlier, and always achieves a higher maximum value, than MAI. Maximum MAI is reached at the age (tmax) where the descending CAI curve crosses the MAI curve. For typical even-aged conifer stands grown in the UK, maximum MAI
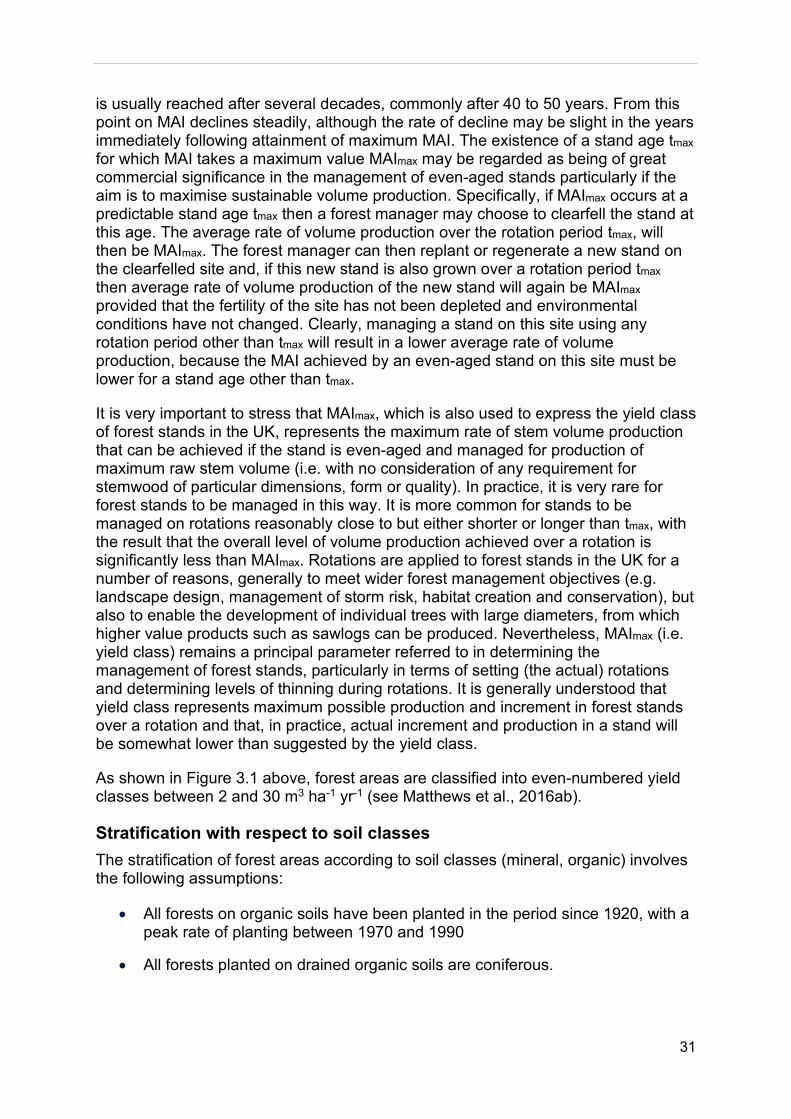
31
is usually reached after several decades, commonly after 40 to 50 years. From this point on MAI declines steadily, although the rate of decline may be slight in the years immediately following attainment of maximum MAI. The existence of a stand age tmax for which MAI takes a maximum value MAImax may be regarded as being of great commercial significance in the management of even-aged stands particularly if the aim is to maximise sustainable volume production. Specifically, if MAImax occurs at a predictable stand age tmax then a forest manager may choose to clearfell the stand at this age. The average rate of volume production over the rotation period tmax, will then be MAImax. The forest manager can then replant or regenerate a new stand on the clearfelled site and, if this new stand is also grown over a rotation period tmax then average rate of volume production of the new stand will again be MAImax provided that the fertility of the site has not been depleted and environmental conditions have not changed. Clearly, managing a stand on this site using any rotation period other than tmax will result in a lower average rate of volume production, because the MAI achieved by an even-aged stand on this site must be lower for a stand age other than tmax.
It is very important to stress that MAImax, which is also used to express the yield class of forest stands in the UK, represents the maximum rate of stem volume production that can be achieved if the stand is even-aged and managed for production of maximum raw stem volume (i.e. with no consideration of any requirement for stemwood of particular dimensions, form or quality). In practice, it is very rare for forest stands to be managed in this way. It is more common for stands to be managed on rotations reasonably close to but either shorter or longer than tmax, with the result that the overall level of volume production achieved over a rotation is significantly less than MAImax. Rotations are applied to forest stands in the UK for a number of reasons, generally to meet wider forest management objectives (e.g. landscape design, management of storm risk, habitat creation and conservation), but also to enable the development of individual trees with large diameters, from which higher value products such as sawlogs can be produced. Nevertheless, MAImax (i.e. yield class) remains a principal parameter referred to in determining the management of forest stands, particularly in terms of setting (the actual) rotations and determining levels of thinning during rotations. It is generally understood that yield class represents maximum possible production and increment in forest stands over a rotation and that, in practice, actual increment and production in a stand will be somewhat lower than suggested by the yield class.
As shown in Figure 3.1 above, forest areas are classified into even-numbered yield classes between 2 and 30 m3 ha-1 yr-1 (see Matthews et al., 2016ab).
Stratification with respect to soil classes The stratification of forest areas according to soil classes (mineral, organic) involves the following assumptions:
• All forests on organic soils have been planted in the period since 1920, with a peak rate of planting between 1970 and 1990
• All forests planted on drained organic soils are coniferous.

32
• The distribution of coniferous tree species and yield classes planted on either organic or mineral soils is the same – this assumption is made in the absence of published analysis suggesting the distributions may be different.
The proportions of total forest area on organic soils in Great Britain have been estimated through comparison of the NFI map with soil maps (Webb et al., 2013), giving estimates for the percentage of forest area on organic soils in England, Scotland and Wales of 4.9%, 16.0% and 4.9%, respectively.
For Northern Ireland, the area of coniferous forest on organic soils is understood to be relatively high and has been estimated as 50%.
Detailed forest strata The tables in Annex 2 show the detailed breakdown of forest area in the UK according to country, ownership, CARBINE tree species and yield class. This information is given in an Annex because of the very large number of strata (more than 1,000 in total). However, it should be noted that detailed information on the breakdown of the forest area in Northern Ireland by tree species and yield class is not available separately for the public forest estate and private sector. Hence, tree species and yield classes have been allocated to the public forest estate and private sector on a pro-rata basis (i.e. referring to the total areas of coniferous and broadleaved forest in public and private ownership, see Table 3.2). Strictly, a single set of strata with respect to tree species and yield class can be applied for public and private forests combined in Northern Ireland, which would reduce the total number of strata.
3.2.2: Documentation of sustainable forest management practices as applied in the estimation of the forest reference level
As explained in Section 3.1 (see Box 3.1), the development of GHG Inventories and the FRL involves stratifying the forest area in the UK (see Section 3.2.1) and then assigning four possible high-level management types to these strata:
• No harvesting (no thinning and no clearcutting)
• No thinning with clearcutting
• Thinning with clearcutting
• Continuous thinning (harvesting by thinning involving the continuous maintenance of forest cover, i.e. without clearcutting).
Forest strata in England, Scotland, Wales and Northern Ireland, under public and private ownership, were first assigned to each of these four management types, and then each stratum was assigned a detailed FMP. The methodology applied to work out the assignment of high-level management types and the detailed FMPs to forest areas is described subsequently.

33
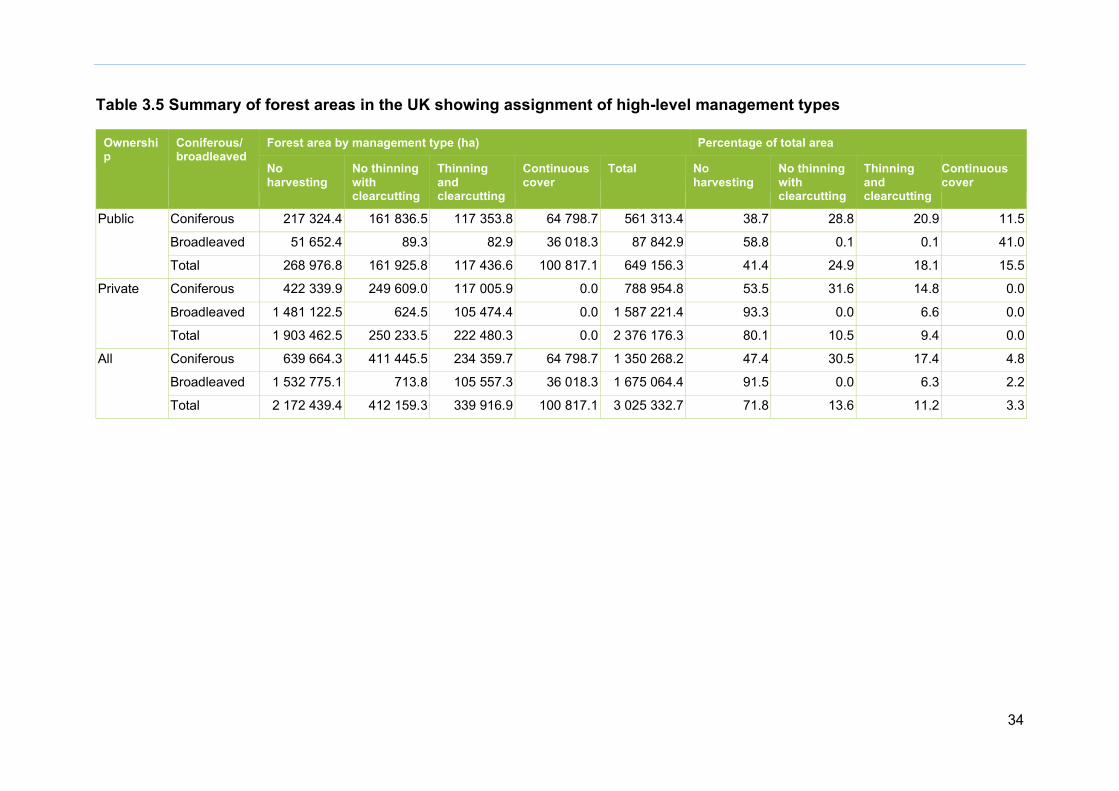
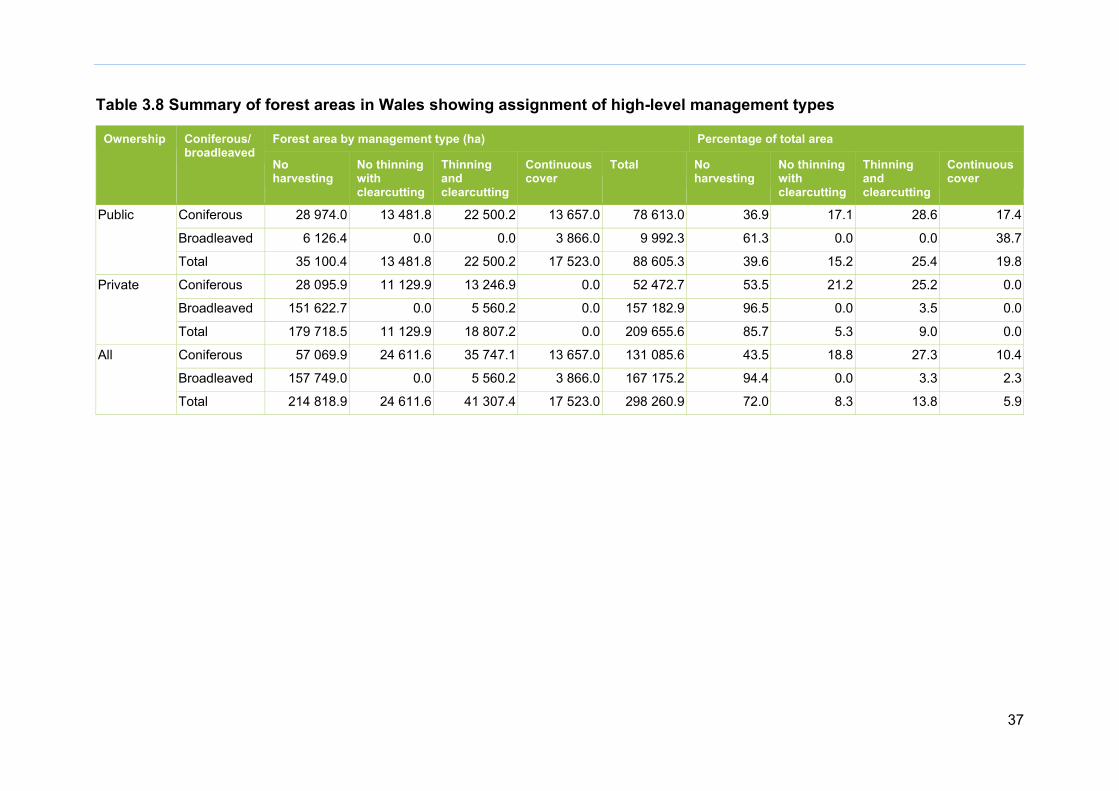
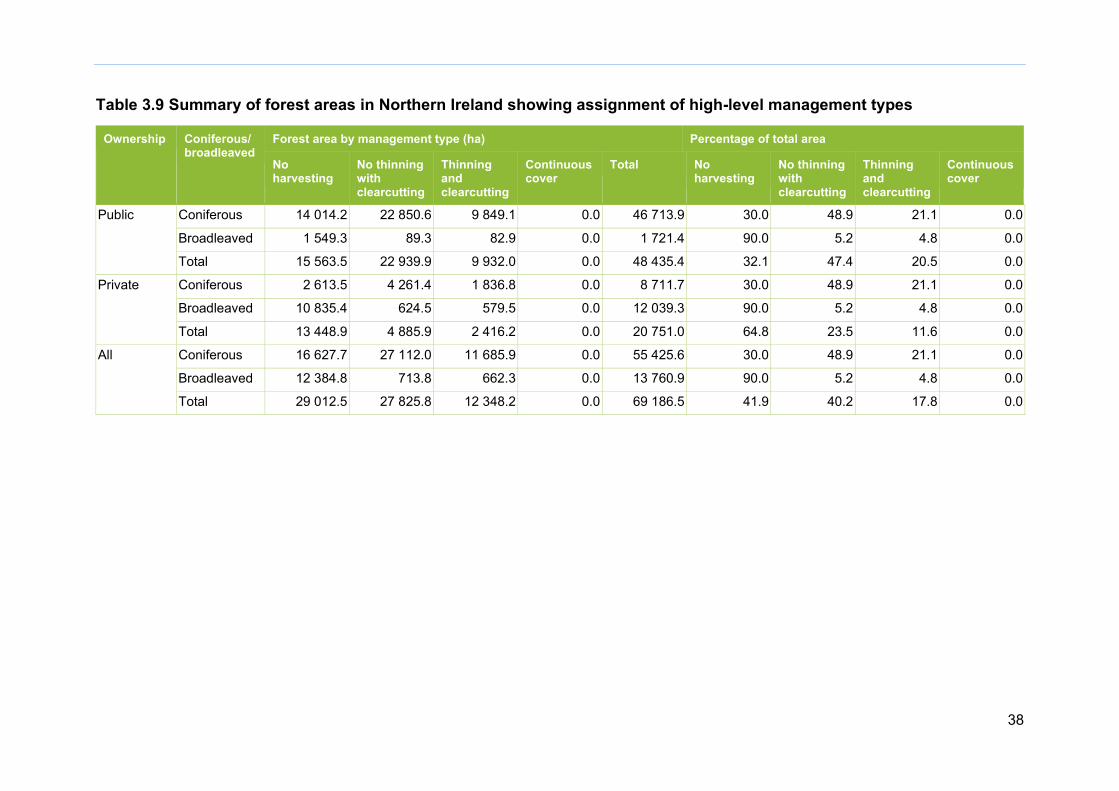
Table 3.5 summarises the assignment of coniferous and broadleaved areas to the high-level management types to forest areas in the UK. Tables 3.6, 3.7, 3.8 and 3.9 show the disaggregated results for England, Scotland, Wales and Northern Ireland respectively. Note that the non-wooded areas (and areas not modelled) shown in Table 3. 2 (Section 3.2.1) are not relevant (since there are no trees on this component of the forest land), hence these were assigned a “null” FMP (i.e. no relevant management).
The relative areas of each forest stratum associated with each high-level management type were estimated based on:
• An analysis of management information reported for the Reference Period, as recorded in databases maintained for the public forest estate in England, Scotland, Wales and Northern Ireland.
• Assumptions about levels of management and thinning (and non-thinning) of forest areas made as part of a forecasting exercise undertaken by the Forestry Commission for the private sector in England, Scotland and Wales in 2006 (Halsall et al., 2006).
The relative area in each stratum assigned to the high-level forest management type of “no harvesting” was refined as part of the subsequent process of reconciling forest management assumptions with the forest age class distribution and reported levels of commercial wood production (see Section 3.1, Boxes 3.1 and 3.2). This refinement ensures that the assumptions taken for the private sector are consistent with the harvest rates observed over the period 2000-2009, hence adjusting the assumptions made about current and future production made in the original 2006 forecasting exercise, which are used as an initial inputs to the modelling, given the limited data available describing details of actual management for the private sector. Were further relevant data from the relevant period to become available, we may make a technical correction to reflect it.
34
Table 3.5 Summary of forest areas in the UK showing assignment of high-level management types
Ownership
Coniferous/ broadleaved
Forest area by management type (ha) Percentage of total area
No harvesting
No thinning with clearcutting
Thinning and clearcutting
Continuous cover
Total No harvesting
No thinning with clearcutting
Thinning and clearcutting
Continuous cover
Public Coniferous 217 324.4 161 836.5 117 353.8 64 798.7 561 313.4 38.7 28.8 20.9 11.5
Broadleaved 51 652.4 89.3 82.9 36 018.3 87 842.9 58.8 0.1 0.1 41.0
Total 268 976.8 161 925.8 117 436.6 100 817.1 649 156.3 41.4 24.9 18.1 15.5
Private Coniferous 422 339.9 249 609.0 117 005.9 0.0 788 954.8 53.5 31.6 14.8 0.0
Broadleaved 1 481 122.5 624.5 105 474.4 0.0 1 587 221.4 93.3 0.0 6.6 0.0
Total 1 903 462.5 250 233.5 222 480.3 0.0 2 376 176.3 80.1 10.5 9.4 0.0
All Coniferous 639 664.3 411 445.5 234 359.7 64 798.7 1 350 268.2 47.4 30.5 17.4 4.8
Broadleaved 1 532 775.1 713.8 105 557.3 36 018.3 1 675 064.4 91.5 0.0 6.3 2.2
Total 2 172 439.4 412 159.3 339 916.9 100 817.1 3 025 332.7 71.8 13.6 11.2 3.3

35
Table 3.6 Summary of forest areas in England showing assignment of high-level management types
Ownership Coniferous/ broadleaved
Forest area by management type (ha) Percentage of total area
No harvesting
No thinning with clearcutting
Thinning and clearcutting
Continuous cover
Total No harvesting
No thinning with clearcutting
Thinning and clearcutting
Continuous cover
Public Coniferous 28 826.2 23 256.5 39 708.8 23 614.3 115 405.8 25.0 20.2 34.4 20.5
Broadleaved 16 762.4 0.0 0.0 31 490.8 48 253.2 34.7 0.0 0.0 65.3
Total 45 588.6 23 256.5 39 708.8 55 105.1 163 659.0 27.9 14.2 24.3 33.7
Private Coniferous 152 634.0 16 331.0 34 659.3 0.0 203 624.3 75.0 8.0 17.0 0.0
Broadleaved 1 025 557.0 0.0 79 028.5 0.0 1 104 585.5 92.8 0.0 7.2 0.0
Total 1 178 191.0 16 331.0 113 687.8 0.0 1 308 209.8 90.1 1.2 8.7 0.0
All Coniferous 181 460.1 39 587.5 74 368.2 23 614.3 319 030.1 56.9 12.4 23.3 7.4
Broadleaved 1 042 319.4 0.0 79 028.5 31 490.8 1 152 838.7 90.4 0.0 6.9 2.7
Total 1 223 779.6 39 587.5 153 396.6 55 105.1 1 471 868.8 83.1 2.7 10.4 3.7

36
Table 3.7 Summary of forest areas in the Scotland showing assignment of high-level management types
Ownership Coniferous/ broadleaved
Forest area by management type (ha) Percentage of total area
No harvesting
No thinning with clearcutting
Thinning and clearcutting
Continuous cover
Total No harvesting
No thinning with clearcutting
Thinning and clearcutting
Continuous cover
Public Coniferous 145 510.0 102 247.7 45 295.6 27 527.4 320 580.7 45.4 31.9 14.1 8.6
Broadleaved 27 214.4 0.0 0.0 661.5 27 875.9 97.6 0.0 0.0 2.4
Total 172 724.4 102 247.7 45 295.6 28 189.0 348 456.6 49.6 29.3 13.0 8.1
Private Coniferous 238 996.6 217 886.8 67 262.9 0.0 524 146.2 45.6 41.6 12.8 0.0
Broadleaved 293 107.5 0.0 20 306.2 0.0 313 413.7 93.5 0.0 6.5 0.0
Total 532 104.0 217 886.8 87 569.1 0.0 837 559.9 63.5 26.0 10.5 0.0
All Coniferous 384 506.6 320 134.5 112 558.5 27 527.4 844 726.9 45.5 37.9 13.3 3.3
Broadleaved 320 321.8 0.0 20 306.2 661.5 341 289.6 93.9 0.0 5.9 0.2
Total 704 828.4 320 134.5 132 864.7 28 189.0 1 186 016.5 59.4 27.0 11.2 2.4
37
Table 3.8 Summary of forest areas in Wales showing assignment of high-level management types
Ownership Coniferous/ broadleaved
Forest area by management type (ha) Percentage of total area
No harvesting
No thinning with clearcutting
Thinning and clearcutting
Continuous cover
Total No harvesting
No thinning with clearcutting
Thinning and clearcutting
Continuous cover
Public Coniferous 28 974.0 13 481.8 22 500.2 13 657.0 78 613.0 36.9 17.1 28.6 17.4
Broadleaved 6 126.4 0.0 0.0 3 866.0 9 992.3 61.3 0.0 0.0 38.7
Total 35 100.4 13 481.8 22 500.2 17 523.0 88 605.3 39.6 15.2 25.4 19.8
Private Coniferous 28 095.9 11 129.9 13 246.9 0.0 52 472.7 53.5 21.2 25.2 0.0
Broadleaved 151 622.7 0.0 5 560.2 0.0 157 182.9 96.5 0.0 3.5 0.0
Total 179 718.5 11 129.9 18 807.2 0.0 209 655.6 85.7 5.3 9.0 0.0
All Coniferous 57 069.9 24 611.6 35 747.1 13 657.0 131 085.6 43.5 18.8 27.3 10.4
Broadleaved 157 749.0 0.0 5 560.2 3 866.0 167 175.2 94.4 0.0 3.3 2.3
Total 214 818.9 24 611.6 41 307.4 17 523.0 298 260.9 72.0 8.3 13.8 5.9
38
Table 3.9 Summary of forest areas in Northern Ireland showing assignment of high-level management types
Ownership Coniferous/ broadleaved
Forest area by management type (ha) Percentage of total area
No harvesting
No thinning with clearcutting
Thinning and clearcutting
Continuous cover
Total No harvesting
No thinning with clearcutting
Thinning and clearcutting
Continuous cover
Public Coniferous 14 014.2 22 850.6 9 849.1 0.0 46 713.9 30.0 48.9 21.1 0.0
Broadleaved 1 549.3 89.3 82.9 0.0 1 721.4 90.0 5.2 4.8 0.0
Total 15 563.5 22 939.9 9 932.0 0.0 48 435.4 32.1 47.4 20.5 0.0
Private Coniferous 2 613.5 4 261.4 1 836.8 0.0 8 711.7 30.0 48.9 21.1 0.0
Broadleaved 10 835.4 624.5 579.5 0.0 12 039.3 90.0 5.2 4.8 0.0
Total 13 448.9 4 885.9 2 416.2 0.0 20 751.0 64.8 23.5 11.6 0.0
All Coniferous 16 627.7 27 112.0 11 685.9 0.0 55 425.6 30.0 48.9 21.1 0.0
Broadleaved 12 384.8 713.8 662.3 0.0 13 760.9 90.0 5.2 4.8 0.0
Total 29 012.5 27 825.8 12 348.2 0.0 69 186.5 41.9 40.2 17.8 0.0

39
For the purposes of developing the FRL, in addition to assigning high-level forest management types to the forest strata, it is also necessary to define detailed Forest Management Practices (FMPs) to forest areas, stratified according to the system illustrated in Figure 3.1 above. These detailed FMPs define:
• The timing of thinnings (with respect to the age of forest areas) and the quantities of biomass harvested
• For FMPs involving clearcutting, the rotation ages assigned to forest areas and quantities of biomass harvested when clearcutting.
The timing of thinnings and quantities of biomass removed depend on tree species and yield class and are based principally on yield tables describing conventional forestry practice in the UK (Matthews et al., 2016ab). In Annex 3, worked examples are given explaining how these details have been calculated and presented in the detailed descriptions of the FMPs.
The rotations assigned to forest areas involving clearcutting vary with country, forest ownership, tree species and yield class, and also depend on whether or not forest areas are thinned. Crucially, these rotations have been characterised based on information sources available for the public forest estate and for the private sector, for the Reference Period of 2000 to 2009.
For the public forest estate in England, Scotland and Wales, rotations have been characterised by analysing apparent clearcutting activities, as indicated by information available in the public forest sub-compartment databases for each country, for each year from 2000 to 2009. A description of the methodology applied for this analysis is given in Annex 4.
For the private sector in England, Scotland and Wales, rotations have been based on those assigned to forest areas as part of a forecasting exercise carried out by the Forestry Commission for the private sector in 2006 (Halsall et al., 2006). These rotations were characterised through consultation with forestry sector expert groups in England, Scotland and Wales, undertaken specifically for the 2006 forecasting exercise and represent the best available proxy for rotations applied in areas managed for production in private sector forests in the period 2000-2009.
For Northern Ireland, only very limited evidence is available on rotation ages applied to forest areas. Hence, the rotation ages assigned (where relevant) have been based on those suggested as consistent with optimal economic management in British yield tables (Matthews et al., 2016a), for both public and private forests. It should be noted that the total area of broadleaved forests in Northern Ireland assigned to high-level forest management types involving clearcutting is very small (see Table 3.8 above).
The detailed FMPs developed according to the methods described above (and in Annexes 3 and 4) are given in Annex 5. Essentially, individual FMPs have been defined for combinations of:
• Country
• Forest ownership

40
• Tree species
• Yield class
• High-level forest management type.
There is a single FMP for the high-level forest management type of “no harvesting”, essentially involving no thinning or clearcutting. For the high-level management type of “continuous cover”, the detailed FMPs vary with tree species and yield class but not with country or forest ownership.
The FMPs given in the tables in Annex 5 can be related to forest strata in terms of tree species and yield class by referring to codes also included in the tables for each of the FMPs. For example, the code, “SSYC12NTS” indicates that the FMP is applicable for the forest area stratum of Sitka spruce (SS), yield class 12 (YC12), no thinning with clearcutting (NT) in Scotland (S). Similarly, the code, “GFYC22THESW” indicates that the FMP is applicable for the forest area stratum of grand fir (GF), yield class 22 (YC22), thinning with clearcutting (TH) in England, Scotland and Wales (ESW).
The detailed assignment of FMPs to the forest strata in Annex 2, by FMP index number and by country, forest ownership, tree species and yield class, is given in Annex 6. The areas of individual strata are also shown. These allocations of FMPs to strata are entirely based on information relevant for the Reference Period, and their allocations of the FMPs to strata remain constant for the entire projection made for constructing the FRL, i.e. historically, during the Reference Period and subsequently up to and during the Compliance Period.
Projected forest area The information presented above and in Section 3.2.1 constitutes the essential input data for the process of developing the FRL, as specified in Boxes 3.1 and 3.2 (Section 3.1). The FRL methodology enables the area of Managed Forest Land, distributed according to age classes, to be projected over the Reference Period, up to the present and into the future.
Table 3.10 shows the breakdown of total forest area in the UK in 2011, according to the FRL methodology, showing the contributions from Managed Forest Land, land converted to forest land from other land uses, and non-wooded areas within forests.
According to Table 3.10, Managed Forest Land in 2011 represents 88% of the total wooded forest area in the UK. Hence, the contribution of land converted to forest land to the total wooded forest area is relatively large, at 12%. This reflects the relatively high levels of afforestation in the UK in previous decades.

41
Table 3.10 Modelled forest area in 2011 according to FRL methodology
Component of stocked forest area Area (ha)
Managed forest land 3 120 779
Land converted to forest land 408 219
Total forest area 3 528 997
Note: Forest areas include non-wooded land categorised as part of Forest Land i.e. including associated areas of land cover such as forest roads, rides, rocky ground, rivers etc.
Land converted to Forest Land makes a transition to Managed Forest Land after 20 years. This is consistent with the UK GHG Inventory submitted to the UNFCCC in 2019 covering years 1990 to 2017.
For the modelling of Managed Forest Land from the Reference Period up to and including the Compliance Period, the UK is assuming the dynamic development of managed forest land. Hence, changes in the development of the area of Managed Forest Land are modelled in the projection of the FRL. This has involved calculating the area of Managed Forest Land for each individual year, allowing for historical and projected gains in forest area from afforestation and losses in forest area from deforestation. The annual rates for both afforestation and deforestation, as applied in the 1990-2017 GHG Inventory are also applied in the modelling of the FRL. The rates estimated for the year 2017 are then projected into the future for projecting the FRL.
Table 3.11 shows the modelled evolution of the area of Managed Forest Land over the Reference Period of 2000 to 2009, projected up to the year 2025.
Over the period 2000 to 2017, the area of Managed Forest Land has increased by around 27.5 thousand hectares per year. This reflects the balance between gains from land converted to forest land making the transition to Managed Forest Land and losses due to deforestation. Since there is currently no information on the age-distribution of the area of small woods (between 0.1 and 0.5 ha) which are not included in the forest planting statistics, it was assumed to have established evenly between 1900 and 1970. Variations in the rate of change reflect variations in historical and projected rates of afforestation (20 years beforehand) and also variations in the rate of deforestation over the period. Tree planting rates in the UK have declined since the early 1990s and the projected area of Managed Forest Land from 2017 increases between 2017 and 2025 at around 18 thousand hectares per year with a decreasing trend.
Figures 3.3 and 3.4 illustrate the modelled development of the age class distribution of the area of wooded Managed Forest Land in the UK:
• Over the period 2000 to 2025 according to the FRL projection (Figure 3.3) and
• Over the period 2000 to 2015 for the 1990-2017 GHG Inventory (Figure 3.4).

42
Table 3.11 Modelled wooded area of Managed Forest Land over the period 2000 to 2025
Year Wooded area (ha) Annual change (ha yr-1)
2000 2 775 439 -
2001 2 799 984 24 545
2002 2 823 295 23 311
2003 2 848 438 25 144
2004 2 876 713 28 275
2005 2 905 356 28 642
2006 2 938 564 33 208
2007 2 976 949 38 385
2008 3 019 186 42 237
2009 3 060 095 40 908
2010 3 099 270 39 175
2011 3 120 779 21 509
2012 3 142 503 21 724
2013 3 165 275 22 772
2014 3 189 320 24 046
2015 3 210 237 20 916
2016 3 229 244 19 007
2017 3 249 811 20 567
2018 3 270 167 20 355
2019 3 290 760 20 594
2020 3 311 877 21 117
2021 3 329 800 17 923
2022 3 346 964 17 164
2023 3 362 119 15 155
2024 3 379 723 17 604
2025 3 394 873 15 150
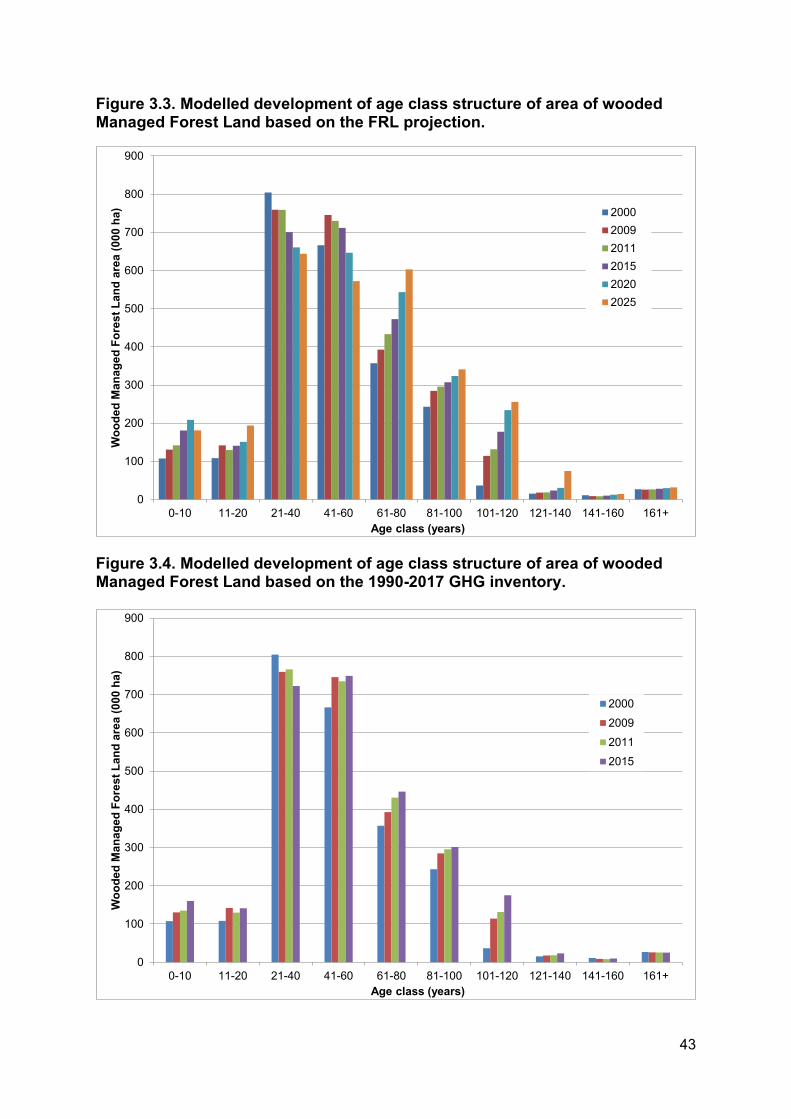
43
Figure 3.3. Modelled development of age class structure of area of wooded Managed Forest Land based on the FRL projection.
Figure 3.4. Modelled development of age class structure of area of wooded Managed Forest Land based on the 1990-2017 GHG inventory.
0
100
200
300
400
500
600
700
800
900
0-10 11-20 21-40 41-60 61-80 81-100 101-120 121-140 141-160 161+
Woo
ded
Man
aged
For
est L
and
area
(000
ha)
Age class (years)
200020092011201520202025
0
100
200
300
400
500
600
700
800
900
0-10 11-20 21-40 41-60 61-80 81-100 101-120 121-140 141-160 161+
Woo
ded
Man
aged
For
est L
and
area
(000
ha)
Age class (years)
2000200920112015

44
Up to 2011, the age class distributions in Figures 3.3 and 3.4 are essentially the same, showing the consistency of the modelling of the FRL with the GHG inventory up to the year 2010. In 2015, there are differences in the age class distributions of the FRL projection and the GHG Inventory, although these are difficult to discern from the figures. Under the FRL projection, there is less area in the age classes 21-40 years and 41-60 years, indicating more felling (clearcutting) in these age classes, compared with the GHG Inventory. Conversely, there is more area in age class 61-80 years for the FRL projection, indicating slightly less felling in this age class. Essentially, this phenomenon reflects the continued growth of areas not being harvested on shorter rotations under the FRL projection, compared with the GHG Inventory. Overall more area is felled in the GHG Inventory projection.
The general pattern described above is apparent in 2011 and more pronounced in the simulated age class distributions for 2015.
As described in Box 3.2 and the associated discussion, in “FRL Step 4” (Box 3.2), a check is carried out to ensure that simulated and reported wood production during the Reference Period are consistent. Figure 3.5 shows statistics on wood production in the UK for the period 2000 to 2009, compared with simulated wood production, as generated by the modelling framework (see Sections 3.1 and 3.3), when the FMPs developed for the FRL are applied, starting in the year 2000.
Figure 3.5. Comparison of reported and simulated wood production over the Reference Period.
0
2,000
4,000
6,000
8,000
10,000
12,000
2000 2001 2002 2003 2004 2005 2006 2007 2008 2009
Woo
d pr
oduc
tion
(000
m3 )
Year
Reported
Reference Period NFAP management

45
Simulated and reported wood production are fairly consistent, and simulated wood production does not deviate from reported production by more than about 5%. A better match could be achieved (as is the case in the 1990-2017 GHG Inventory simulation) but only by not following precisely the FMPs characterised based on the evidence available for the Reference Period.
Figure 3.6 shows reported statistics on wood production in the UK from 1976 to 2017, compared with simulated wood production, as generated for the modelling framework (see Sections 3.1 and 3.3), when the FMPs developed for the FRL are applied. It should be noted that, for the construction of the FRL projection (“FRL Step 5”, Box 3.2), the FMPs characterised for the Reference Period are applied from the year 2010, rather than the year 2000, which was the case in Figure 3.5. For the FRL, a projection of the level of wood production is given up to 2025. The simulated wood production for the 1990-2017 GHG inventory (up to 2017) is shown for comparison.
Figure 3.6. Comparison of reported and simulated wood production between 1976 and 2017, with FRL projection to 2025
For most years, wood production simulated by the modelling framework is very close to reported production, and for many years simulated and reported production are almost indistinguishible. The biggest deviations in the GHG inventory simulation are from 2012 onwards, where the model is responding to a pronounced rise in reported wood production. This increase is the result of market conditions, which in turn reflect the age class distribution of forest areas (particularly coniferous areas), with large areas at ages around those conventionally associated with final harvest (clearfelling and restocking). There may also be some “rebound” in production levels, following an apparent levelling off during 2005 to 2009, possibly in response to the global economic difficulties experienced over this period.
0
2,000
4,000
6,000
8,000
10,000
12,000
14,000
16,000
1970 1980 1990 2000 2010 2020 2030
Woo
d pr
oduc
tion
(000
m3 )
Year
Reported
1990-2017i
FRL

46
Simulated wood production for the GHG inventory and the FRL are effectively identical up to the end of the Reference Period in 2009. Between 2010 and 2013, simulated wood production for the FRL departs from the projection for the GHG inventory and levels off. From 2014, the FRL projection exhibits a decreasing trend such that, by 2025, production is simulated to return to levels observed around the beginning of the Reference Period (2000). The marked change in trend shown in the FRL projection, compared with the GHG inventory projection and reported wood production, reflects the forest management prescriptions (thinning and felling) characterised for the Reference Period, which do not represent the apparently enhanced levels of harvesting in more recent years, and may instead be more influenced by the somewhat depressed trend in production during 2005 to 2009.
Comparison of forest increment and harvest levels Figure 3.7 shows a projection of the increment of UK forests over the period 2000 to 2050, in comparison with wood harvesting levels, as simulated for the FRL projection. For the purposes of this comparison:
• Forest increment is based on the current annual increment of standing stem volume over bark, net of losses due to mortality
• Harvesting levels are based on equivalent standing stem volume over bark.
Both of the above quantities are given in units of thousands of cubic metres per year. However this scales linearily with carbon.
Figure 3.7. Projected net forest increment compared with annual harvesting over the period 2000 to 2050 as simulated for the FRL projection.
0
5,000
10,000
15,000
20,000
25,000
2000 2005 2010 2015 2020 2025 2030 2035 2040 2045 2050
Stan
ding
vol
ume
('000
m3 )
Year
Volume increment
Harvested volume
47
Projected increment is fairly stable over the period 2000 to 2050 (around 21 Mm3 yr-1), although it begins to diminish slowly after about 2015. This reflects the projected evolution of the age class distribution of UK forests, and in particular the presence of a significant component of ageing forests (which are not being harvested).
Projected harvesting levels appear to be in a fairly constant ratio to forest increment. Generally, less than half of the potential increment is harvested in any given year. This suggests that a significant proportion of managed UK forests are not being utilised for wood production (based on the levels of harvest reported in the Forestry Commission harvest statistics for the Reference Period of 2000 to 2009). This may be one explanation for the apparently marked rise in harvesting levels observed in wood production statistics in more recent years (see preceding discussion and in particular Figure 3.6). It should be noted that the apparently significant underutilisation of managed forests in the UK over the period 2000-2009 could have led to issues in the long term if this practice had been continued, because of increased risks of storm and fire damage in ageing forest stands, and possibly greater vulnerability to attacks from pests and diseases. As discussed in section 2.3.2, it may also be partially an artefact due to the underestimation of hardwood harvest as the statistics are focused mainly on commercial wood harvest being derived from sawmill returns and underestimate non-commercial hardwood harvest. Improved statistics on non-commercial hardwood harvest might result in a technical correction of the FRL.
3.3: Detailed description of the modelling framework as applied in the estimation of the forest reference level
Overview
The modelling framework applied for the estimation of the FRL is based on the CARBINE forest sector carbon accounting model, developed by Forest Research. Examples of calculations made by the CARBINE model have been included in earlier reports (e.g. Morison et al. 2012; Matthews et al., 2014, 2015).
The CARBINE model was first developed by the Research Division of the Forestry Commission (now Forest Research) in 1988 (Thompson and Matthews, 1989). Essentially it is an analytical model of the exchanges of carbon that take place between the atmosphere, forest ecosystems (trees, deadwood, litter and soil) and the wider forestry sector (harvested wood products) as a result of tree growth, mortality and harvesting (Thompson and Matthews, 1989; Matthews, 1991; Morison et al., 2012). Other land uses are represented in CARBINE ‘at the margin’, i.e. to the extent necessary to represent land use transformations involving forests such as afforestation of cropland or grassland or conversion of forest to other land uses (deforestation). CARBINE also represents other economic sectors ‘at the margin’, notably the Energy and Construction sectors, in order to estimate the impacts of changes in patterns of timber harvesting and utilisation on consumption of fossil fuels and alternative materials, and consequent changes in GHG emissions (Matthews, 1994, 1996).

48
CARBINE has common features of structure and functionality with other analytical forest sector and forest carbon accounting models, notably EFISCEN (Schelhaas et al., 2007), C-Flow (Dewar, 1990, 1991; Cannell and Dewar, 1995), CO2FIX (Mohren and Klein Goldewijk, 1990; Nabuurs, 1996; Mohren et al., 1999), CBM-CFS3 (Kurz et al., 2009), C-change (Beets et al., 1999) and GORCAM (Marland and Schlamadinger, 1995, 1999; Schlamadinger and Marland, 1996). Studies comparing CARBINE and C-Flow (the other main forest carbon accounting model developed in the UK) revealed many similarities and consistencies in the functioning and results produced by the two models (Robertson et al., 2003; Matthews et al., 2014c).
The CARBINE model also has the capacity to produce estimates of other variables not directly to do with forest carbon but of great relevance to decisions about forest management, for example:
• Levels of wood and timber production (which can be broken down into specific wood product categories if required)
• The development of forest area age class distributions over time
• Changes in the species composition of forests in response to management interventions (where relevant).
In terms of documentation, the CARBINE model has been described and discussed in a number of papers (Thompson and Matthews, 1989; Matthews, 1991, 1994, 1996; Matthews and Broadmeadow, 2009; Morison et al., 2012). The development and improvement of the model has been a significant exercise covering many years and the publication of a complete description of CARBINE is planned. A full description is in preparation (Matthews et al., 2018).
A schematic diagram of the structure of the CARBINE model is given in Figure 3.8.

49
Figure 3.8. Diagram illustrating the scope, structure and function of the CARBINE model.
Tree growth, management and wood production
The main driving module of CARBINE consists of a set of computerised mathematical functions and algorithms describing the accumulation (and loss) of carbon in tree biomass of different forestry systems at the per-hectare scale. Different functions and algorithms are used to represent distinct forestry systems, defined in terms of:
• Tree species composition
• Tree growth rate (yield class)
• Management regime applied.
The tree species and growth rates represented are based on yield models originally produced by the British Forestry Commission (Matthews et al., 2016ab). The tree species covered include examples for coniferous species of spruces, pines, firs, larches, cedars, cypresses and all the major temperate and boreal broadleaf tree species. Growth rates in terms of mean annual increment (MAI) of stem volume can be represented in the range from 2 m3 ha-1 yr-1 up to 30 m3 ha-1 yr-1.
As already explained, the mathematical functions describing forest development and levels of harvesting are based on standard models of forest growth and yield
HWP retention/destructionmodel
HWP emissions displacementfactors
Carbon stocks, gains and losses in trees Transfer of carbon to HWP
Transfer of carbon to litter
Transfer of carbon to soil
Carbon stocks, gains and losses in soil
Carbon stocks, gains andlosses in wood products
Displaced fossil fuel emissionsin energy/construction sectors
Library of tree (stand) carbon dynamics equations/production schedules by: Species Growth rate Management regime
Harvested wood products allocation model
Fuelwood Paper Board/joinery Sawnwood
Short-lived Long-lived
Soil carbon allocation/decomposition model
Short-lived Long-lived Inert
Carbon stocks, gains and losses in litter
Litter retention/decomposition model
Natural disturbance
KEY:
= Process
= Carbon pool

50
developed by the British Forestry Commission (Matthews et al., 2016ab). However, these are implemented in CARBINE as a dynamic yield model, known as M1 (Arcangeli and Matthews, unpublished model), which enables the representation of a wide range of management prescriptions (e.g. in terms of patterns of thinning and felling). Basic management regimes represented in the CARBINE model include:
• No thinning and no clearcutting (i.e. effectively no management for production)
• No thinning with clearcutting on a specified rotation
• Thinning with clearcutting on a specified rotation
• ‘Continuous cover’ silviculture (i.e. forest management with harvesting that also aims to always maintain tree cover on the land).
It is also possible to specify detailed rotations and levels of thinning, and changes in the management of forest areas over time, involving transitions between the broad management regimes indicated above, and also adjustments to rotations and transitions in tree species and growth rates on restocking.
Tree biomass and carbon
In CARBINE, stem biomass is estimated by multiplying estimates of stem volume by a value for the basic density of wood for the relevant tree species, expressed as oven dry tonnes of mass per cubic metre of ‘green’ timber volume (Lavers, 1983). Biomass estimates are converted to equivalent estimates of carbon by multiplying by a standard value for wood carbon content of 0.5 tC odt-1 (Matthews, 1993).
Carbon and biomass in tree roots, branches and foliage are estimated based on allometric relationships with stemwood. These relationships are based on interpretation of summary estimates of root, branch, foliage and stem biomass using the Forestry Commission BSORT forest stand biomass model (Matthews and Duckworth, 2005; Jenkins et al., 2013).
Deadwood and litter carbon
CARBINE includes a sub-model for representing accumulation and loss of carbon in dead wood and litter. Inputs of litter are related to the standing biomass of trees and also to rates of tree mortality. Levels of tree mortality are represented implicitly in the standard Forestry Commission growth models, and explicit estimates are included in models for stands subject to no thinning, where mortality levels are high. Root and branch wood volume associated with dead trees is estimated in the same way as for living stemwood, by reference to allometric relationships. Deadwood and litter is assumed to decay according to a first order process, with rate constants that are normally set to be consistent with boreal and temperate conditions (Balster and Marshall, 2000; Brunner et al., 2013; Godbold et al., 2003; Janssens et al., 2002; Konôpka et al., 2006; Kurz and Beukema, 1996; Perruchoud, et al., 1999; Ťupek et al., 2015) but can be adjusted for Mediterranean and tropical conditions.
Soil carbon

51
The CARBINE model includes an advanced sub-model for representing soil carbon pools and dynamics, based on the ECOSSE soil carbon model (Smith et al., 2007). CARBINE represents inputs of organic matter to forest soils from litter and fine root turnover. The relative contributions due to fine root turnover and litter vary with soil type and tree species/growth rate.
Harvested Wood Products
The CARBINE model includes a representation of the fate of forest biomass and carbon following harvesting and conversion into useful wood products, including bioenergy.
Carbon stock changes in harvested wood products are calculated by applying the production approach and Tier 1 methods including default half-life values as defined in relevant guidance from the Intergovernmental Panel on Climate Change (IPCC Guidance).
Allocation of harvested wood to product types (energy and solid wood)
Regulation 2018/841 requires that, in simulating the projection for the FRL, harvested wood is allocated for use for energy purposes and for solid wood products according to a constant ratio characterised for the Reference Period. In other words, the proportions of harvested and wood allocated to energy and non-energy uses are held constant, based on the proportions for the Reference Period. Table 3.12 shows the allocation of wood harvested from UK forests to semi-finished wood product types, as defined in in IPCC Good Practice Guidance (IPCC, 2013), as characterised for the Reference Period of 2000 to 2009 from reported statistics (Forestry Commission, 2018).

52
Table 3.12 Allocation of harvested wood to semi-finished wood product types during the Reference Period
Year Sawnwood (%)
Wood-based panels (%)
Paper (%) Woodfuel/ wood used for energy purposes (%)
2000 39.11 37.66 13.34 9.89
2001 39.30 37.73 13.07 9.90
2002 39.85 36.08 13.83 10.24
2003 39.76 35.85 14.04 10.35
2004 40.54 37.23 11.60 10.63
2005 40.07 36.52 11.34 12.08
2006 41.86 36.01 8.46 13.66
2007 42.32 35.11 6.73 15.83
2008 41.46 33.59 7.63 17.33
2009 40.09 30.96 7.10 21.86
Mean allocation of harvested wood for use for energy purposes (%) 13.18
The percentage of harvested wood used for energy purposes (“Wood fuel”) varies from about 10% to nearly 22% from year to year in the forest statistics and may be noted to be increasing over the period. The mean percentage is 13.18%. This percentage was applied for the modelling of the FRL projection to allocate harvested wood to use for energy purposes. The remainder was allocated for use in solid wood or composite wood products. Table 3.13 shows simulated annual wood production as allocated to types of semi-finished wood product, as simulated for the FRL projection for the period of 2000 to 2025, expressed in units of megatonnes carbon (MtC). As discussed in section 2.3.2, the forest statistics for the 2000-2009 period are focussed on commercial wood harvest being derived from sawmill returns and underestimate non-commercial hardwood harvest. Improved statistics on non-commercial hardwood harvest might result in a technical correction of the FRL.
During the Reference Period, the allocation of harvested wood to semi-finished wood product types conforms to reported statistics and the 1990-2017 GHG Inventory. From 2010 onwards, the percentage allocation of harvested wood for use for energy purposes is seen to be held constant at the value characterised above for the Reference Period. The percentage allocations to the solid wood product types vary slightly from year to year, depending on the relative contributions to harvested wood from softwoods and hardwoods, as simulated for the FRL projection.

53
Table 3.13 Allocation of harvested wood to semi-finished wood product types for the FRL projection for the period 2000 to 2009
Year Quantity harvested (MtC) Allocation (%)
Sawn-wood Wood-based panels Paper Energy Sawn-wood Wood-based panels Paper Energy
2000 0.6311 0.6077 0.2153 0.1597 39.11 37.66 13.34 9.89
2001 0.6361 0.6107 0.2116 0.1602 39.30 37.73 13.07 9.90
2002 0.6492 0.5879 0.2253 0.1669 39.85 36.08 13.83 10.24
2003 0.6686 0.6027 0.2361 0.1740 39.76 35.85 14.04 10.35
2004 0.7068 0.6489 0.2022 0.1854 40.54 37.23 11.60 10.63
2005 0.7024 0.6402 0.1988 0.2117 40.07 36.52 11.34 12.08
2006 0.7358 0.6329 0.1487 0.2402 41.86 36.01 8.46 13.66
2007 0.7783 0.6457 0.1238 0.2911 42.32 35.11 6.73 15.83
2008 0.7285 0.5901 0.1340 0.3045 41.46 33.59 7.63 17.33
2009 0.7245 0.5595 0.1283 0.3951 40.09 30.96 7.10 21.86
2010 0.8867 0.6738 0.1187 0.2549 45.84 34.84 6.14 13.18
2011 0.9102 0.6799 0.1218 0.2598 46.16 34.48 6.18 13.18
2012 0.9490 0.6711 0.1258 0.2650 47.19 33.37 6.26 13.18
2013 0.9666 0.6574 0.1224 0.2651 48.06 32.68 6.09 13.18
2014 0.9765 0.6455 0.1173 0.2640 48.75 32.22 5.85 13.18
2015 0.8563 0.5977 0.1048 0.2366 47.69 33.29 5.84 13.18
2016 0.8695 0.5892 0.1018 0.2368 48.38 32.78 5.66 13.18
2017 0.8776 0.5547 0.1049 0.2333 49.57 31.33 5.92 13.18

54
Year Quantity harvested (MtC) Allocation (%)
Sawn-wood Wood-based panels Paper Energy Sawn-wood Wood-based panels Paper Energy
2018 0.8578 0.5373 0.1016 0.2272 49.76 31.17 5.89 13.18
2019 0.8625 0.5313 0.1005 0.2268 50.11 30.87 5.84 13.18
2020 0.8022 0.5030 0.0951 0.2125 49.74 31.19 5.90 13.18
2021 0.8126 0.5059 0.0957 0.2146 49.89 31.06 5.87 13.18
2022 0.8100 0.4986 0.0943 0.2129 50.13 30.86 5.84 13.18
2023 0.8074 0.4946 0.0935 0.2118 50.23 30.77 5.82 13.18
2024 0.7931 0.4794 0.0907 0.2069 50.51 30.53 5.77 13.18
2025 0.7405 0.4636 0.0877 0.1961 49.77 31.16 5.89 13.18
55
Input data to CARBINE
To run the CARBINE model, it is necessary to provide input data on forest areas broken into components consisting of:
• Area of forest component (ha)
• Year in which the forest component was originally planted or naturally regenerated
• Soil type associated with the forest component (essentially mineral or organic)
• Land use prior to planting or regeneration of forest (essentially arable or grassland)
• Species composition of forest component (including details of any changes in species over time), see Table 3.3 in Section 3.2.1
• Potential productivity of forest component (expressed as maximum potential stem volume production, in even-numbered classes of cubic metres per hectare per year, see Matthews et al., 2016a).
• Management prescription (details of any thinning, felling and rotation to be applied, including specifying how these details may change over time)
• Specification for how any harvested wood is used.
Potential productivity (or increment/yield class) may also be specified to change over time, so as to represent potential impacts of climate change on forest growth and development. However, this feature of the model has not been used for the purposes of calculating GHG inventories for Managed Forest Land or for developing the FRL, since no systematic data are available as a basis for such modelling. Hence, the modelling of forests for these purposes does not represent the potential effects of climate change on forest growth.
It should be apparent from the above discussion that the CARBINE model is configured to work with input data and to produce the output results needed to implement the methodologies described in Boxes 3.1 and 3.2 in Section 3.1.
Natural Disturbances
The inclusion of Natural Disturbances within the Reference Level is based on a background level established as consistently as possible with the requirements set in Annex VI of the regulation (EU) 2018/841 using available information. Before any application of the provision of article 10 of the regulation, a technical correction will be performed to establish an estimate of the impact of natural disturbances for the full period 2001-2020.
The United Kingdom natural disturbance background level covers:
(i) wildfires (CO2, CH4, N2O from the combustion of biomass and dead organic matter);

56
(ii) extreme weather events, such as windstorms (CO2, assuminginstantaneous oxidation of the biomass pools);
(iii) Insect pest and disease infestation (CO2, assuming instantaneousoxidation of the biomass pools);
(iv) Geological events (tsunamis)
As shown in Table 3.14, the background emission level has been assessed as 249 kt CO2e/year on average for the FRL2021-2025 (240 kt CO2/year; 0.011 kt N2O/year; 0.21 kt CH4/year).
Table 3.14 The background emissions estimated for disturbance events:
Managed Forest Land Background level Margin Disturbance provision threshold
t CO2e ha-1 yr-1 0.074 0.037 0.111
kt CO2e yr-1
(average for 2021-2025)
249 125 374
As disturbance events are generally considered to be part of the forest management cycle in the UK, monitoring mechanisms have not yet been established to provide comprehensive, geo-referenced, data on disturbance events. However, a number of data-sets have been accessed which, together with expert judgement, have allowed to establish a background level and margins for Managed Forest Land, which ensure time series consistency over time in all relevant parameters, including minimum area, emission estimation methodologies, coverages of carbon pools and gases, as required by the Annex VI (1)d of the regulation (EU) 2018/841.
The timeframes covered by the individual datasets do not cover the full period 2001-2017 in all cases. Where data are not available for individual disturbance categories in some years, data-filling has used the mean over their individual calibration periods. Assumptions concerning salvage logging (see details under individual disturbance categories, below) has allowed emissions associated with salvage-logging to be excluded from the background emissions.
Emissions resulting from disturbance events (after the exclusion of emissions from salvage-logging) have been estimated on the basis of instantaneous oxidation.
Wildfire: Annual emissions from wildfire on Forest Land are reported explicitly in the UK’s LULUCF GHG inventory. These data have been apportioned to Managed Forest Land and Afforested Land on the basis of the ratio between the two forest categories, weighted by their relative carbon stocks, (it assumes that those stocks are 20% of those of Managed Forest Land on Afforested Land to reflect the younger growth phase). It is assumed that land use change does not occur following wildfire. The IPCC Tier 1 method is used for estimating emissions of CO2 and non-CO2 gases from wildfires (IPCC 2006). Country-specific biomass and Dead Organic Matter

57
densities from the CARBINE model are used for estimating fuel consumption in forest fires and the ‘extra tropical forest’ emission factors in the 2006 Guidelines. In line with the default value in the IPCC 2006 Guidelines for AFOLU it is assumed that 45% of the biomass is consumed in a wildfire in an unfelled temperate forest.
Estimates of the forest area burnt in wildfires 1990-2004 are published in different locations (FAO/ECE 2002; FAO 2005) but all originate from either the Forestry Commission (Great Britain) or the Forest Service (Northern Ireland). There is a gap in the time series 2005-2010 for Great Britain but areas of forest wildfires have been reported annually for Northern Ireland. The gap was filled using the annual average areas burnt 1995-2005. These areas refer only to fire damage in state forests; no information is collected on fire damage in privately owned forests. The proportion of private-owned forest that was burnt each year was assumed to be the same as the percentage of the state forest that was burnt each year.
Assumptions: For the other disturbances, carbon stocks and thus emissions are estimated on the basis of mean carbon stocks in the living biomass for conifers (295 tCO2e/ha) and broadleaves (299 tCO2e/ha), respectively, reported by the National Forest Inventory.
Plant health: Statutory Plant Health Notices (SPHNs) are issued for some regulated pest and disease infestations, requiring felling and, in some cases, imposing movement restrictions on the timber. Data are available for the period 2010-2018 in Forestry Statistics. Restocking is not required following issuance of an SPHN; however, it is strongly encouraged, supported by grant-aid and experience to date indicates that more than 99% of the area has been restocked either by planting or natural regeneration. SPHN area is allocated to Managed Forest Land and Afforested Land based on their relative proportion in the total Forest Areas, with 80% salvage-logging assumed for Managed Forest Land (expert judgement).
Other monitoring and surveillance is used to report on the presence of specific pests and diseases (see http://www.forestry.gov.uk/pestsanddiseases). However, the area affected, and the level of mortality are not reported. Further surveillance is provided through the field survey associated with the National Forest Inventory across approximately 3,000 one hectare sample squares per annum.
Extreme weather – windstorm: The Forestry Commission maintains detailed records of land cover and use across the 250,000 ha of land it manages in England. The area of forest reported as entering the ‘windblown category’ each year between 2000 and 2013, separately for conifer and broadleaf woodland, has been used as the source data for the calibration period. These data have been extrapolated to all UK Managed Forest Land, on a proportion basis.
80% salvage-logging is assumed to have occurred in conifer woodland and 50% in broadleaf woodland, based on experience from the 1987 windstorm.
Remote sensing is being deployed more extensively to monitor woodlands in the UK as part of the National Forest Inventory. If the disturbance provision was enacted to cover a major windstorm event, these data would be used to provide robust
58
coverage, including geo-referencing across public and private woodlands, similar to analysis undertaken for a single windstorm event in 20131.
Extreme weather – drought: Data on forest damage due to drought are not available, and it is assumed that emissions resulting from drought are included in the growth and yield models that underpin the LULUCF GHG inventory. A background level of zero has therefore been set over the calibration period. If a significant drought event occurred during the commitment period requiring that the disturbance provision was enacted, a bespoke report providing robust geo-referenced data would be elaborated.
Geological disturbance: No significant geological disturbances have occurred during the calibration period. Background emissions have therefore been set at zero.
Following the methodology described in annex VI (2) of the (EU) regulation 2018/841, the background level has been estimated iteratively by calculating the average of the reference period (2001-2017), excluding iteratively all years for which abnormal levels of emissions were recorded, that is to say for which the annual emissions are outside twice the standard deviation around the average. The relevant calculations are illustrated in Figure 3.9 and Table 3.15.
As a dynamic area approach was used, the analysis was applied to emissions from natural disturbances per unit area of managed forest land. In this framework, no outlier needed to be discarded.
This analysis was performed on the total emissions from natural disturbances occurring on managed forest land. In this framework, two outliers were discarded (2012 and 2013).
As the dynamic area approach was used for the projection of the NFAP and no specific guidance was provided within the Commission guidance document, the calculated level was then adjusted for the increase in area of managed forest land between the period 2001-2017 used to identify outliers and the period 2021-2025, following the approach recommended in the IPCC KP 2013 supplement for situation where the area change significantly between the reference period and the commitment period (box 2.3.8, page 2.53).
1 Forestry Commission (2014e).Survey of the impact of the 2013 St. Jude’s day storm on woodland in Southern England. https://www.forestresearch.gov.uk/documents/2768/NFI_St-Judes-day-storm-damage-survey-report.pdf

59
Figure 3.9. Calculation of the background level.
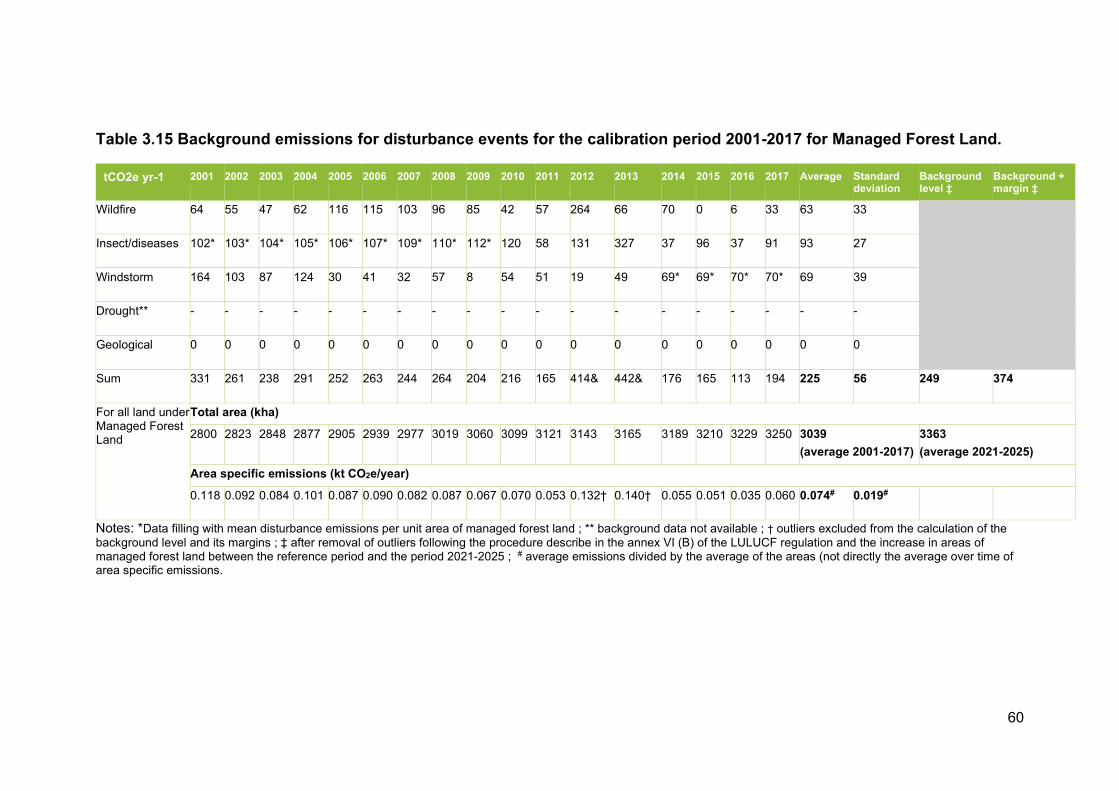
60
Table 3.15 Background emissions for disturbance events for the calibration period 2001-2017 for Managed Forest Land.
tCO2e yr-1 2001 2002 2003 2004 2005 2006 2007 2008 2009 2010 2011 2012 2013 2014 2015 2016 2017 Average Standard deviation
Background level ‡
Background + margin ‡
Wildfire 64 55 47 62 116 115 103 96 85 42 57 264 66 70 0 6 33 63 33
Insect/diseases 102* 103* 104* 105* 106* 107* 109* 110* 112* 120 58 131 327 37 96 37 91 93 27
Windstorm 164 103 87 124 30 41 32 57 8 54 51 19 49 69* 69* 70* 70* 69 39
Drought** - - - - - - - - - - - - - - - - - - -
Geological 0 0 0 0 0 0 0 0 0 0 0 0 0 0 0 0 0 0 0
Sum 331 261 238 291 252 263 244 264 204 216 165 414& 442& 176 165 113 194 225 56 249 374
For all land under Managed Forest Land
Total area (kha)
2800 2823 2848 2877 2905 2939 2977 3019 3060 3099 3121 3143 3165 3189 3210 3229 3250 3039 (average 2001-2017)
3363 (average 2021-2025)
Area specific emissions (kt CO2e/year)
0.118 0.092 0.084 0.101 0.087 0.090 0.082 0.087 0.067 0.070 0.053 0.132† 0.140† 0.055 0.051 0.035 0.060 0.074# 0.019#
Notes: *Data filling with mean disturbance emissions per unit area of managed forest land ; ** background data not available ; † outliers excluded from the calculation of the background level and its margins ; ‡ after removal of outliers following the procedure describe in the annex VI (B) of the LULUCF regulation and the increase in areas of managed forest land between the reference period and the period 2021-2025 ; # average emissions divided by the average of the areas (not directly the average over time of area specific emissions.

61
Modelling of non-CO2 emissions occurring on Managed Forest Land
Non-CO2 emissions from wildfire (reported in the GHG inventory under CRF 4(V)) are included in the Forest Reference Level through the background level of natural disturbances (see section preceding discussion). Non-CO2 emissions from drainage (reported in the inventory under CRF 4(II)) for forest land, without distinction between forest land remaining forest land and land converted to forest land have been included in the Forest Reference Level consistently with the approach used in the inventory (see Table 3.16). As explained in Section A.3.4.6 of the UK NIR, CH4 emissions are not estimated while N2O emissions are estimated using the Tier 1 methodology and the IPCC default emission factors (IPCC, 2006) for drained mineral soils (0.06 kg N2O-N ha-1 yr-1), nutrient-rich organic and organo-mineral soils (0.6 kg N2O-N ha-1 yr-1) and nutrient-poor organic and organo-mineral soils (0.1 kg N2O-N ha-1 yr-1). A split of those emissions between Managed Forest Land and Afforested Land is then estimated using the area of organic and mineral soil in the FRL projections, and then assuming that the share of each sub-strata of drained organic soil (resp. drained mineral soil) is kept constant over the projection from 2018 onward. Direct emissions from N inputs (4(I)), nitrogen mineralisation/immobilisation (4(III)) are currently not assumed to occur on land converted to forest land (i.e. no fertiliser application), and therefore none are included in the Forest Reference Level.

62
Table 3.16 Emissions of N2O from soil drainage in the Forest Reference Level
Area (kha) 2000 2001 2002 2003 2004 2005 2006 2007 2008 2009 2010 2011 2012 2013 2014 2015 2016 2017 2018 2019 2020 2021 2022 2023 2024 2025 Drained organic soils 155 159 163 167 172 177 182 188 193 197 200 203 205 207 209 211 212 214 215 216 218 219 220 221 222 223 Drained organic - Nutrient-rich 34 35 35 36 37 38 39 40 41 42 43 43 44 44 44 45 45 45 45 46 46 46 47 47 47 47
Drained organic - Nutrient-poor 122 125 128 131 135 139 143 147 152 155 158 160 162 163 165 166 167 169 170 171 172 173 174 174 175 176
Drained Mineral Soils 407 410 413 417 420 424 428 433 438 444 449 452 454 457 460 463 466 469 472 475 478 481 483 485 488 490 Drained Organo-mineral Nutrient-rich 4 4 4 4 4 4 4 4 4 4 5 5 5 5 5 5 5 5 5 5 5 5 5 5 5 5
Drained Organo-mineral Nutrient-poor 300 303 305 308 311 314 318 322 326 331 336 339 341 344 347 350 352 354 357 359 361 363 365 367 369 370
N2O (kt) 2000 2001 2002 2003 2004 2005 2006 2007 2008 2009 2010 2011 2012 2013 2014 2015 2016 2017 2018 2019 2020 2021 2022 2023 2024 2025 Drained organic soils 0.05 0.05 0.05 0.05 0.06 0.06 0.06 0.06 0.06 0.06 0.07 0.07 0.07 0.07 0.07 0.07 0.07 0.07 0.07 0.07 0.07 0.07 0.07 0.07 0.07 0.07 Drained organic - Nutrient-rich
0.03 0.03 0.03 0.03 0.04 0.04 0.04 0.04 0.04 0.04 0.04 0.04 0.04 0.04 0.04 0.04 0.04 0.04 0.04 0.04 0.04 0.04 0.04 0.04 0.04 0.04
Drained organic - Nutrient-poor
0.02 0.02 0.02 0.02 0.02 0.02 0.02 0.02 0.02 0.02 0.02 0.03 0.03 0.03 0.03 0.03 0.03 0.03 0.03 0.03 0.03 0.03 0.03 0.03 0.03 0.03
Drained Mineral Soils 0.04 0.04 0.04 0.04 0.04 0.04 0.04 0.04 0.04 0.04 0.04 0.04 0.04 0.04 0.04 0.04 0.04 0.04 0.04 0.04 0.05 0.05 0.05 0.05 0.05 0.05 Drained Organo-mineral Nutrient-rich
0.00 0.00 0.00 0.00 0.00 0.00 0.00 0.00 0.00 0.00 0.00 0.00 0.00 0.00 0.00 0.00 0.00 0.00 0.00 0.00 0.00 0.00 0.00 0.00 0.00 0.00
Drained Organo-mineral Nutrient-poor
0.05 0.05 0.05 0.05 0.05 0.05 0.05 0.05 0.05 0.05 0.05 0.05 0.05 0.05 0.05 0.05 0.06 0.06 0.06 0.06 0.06 0.06 0.06 0.06 0.06 0.06
Total 0.14 0.14 0.14 0.15 0.15 0.15 0.15 0.16 0.16 0.16 0.16 0.17 0.17 0.17 0.17 0.17 0.17 0.17 0.17 0.18 0.18 0.18 0.18 0.18 0.18 0.18
N2O (kt CO2e) 2000 2001 2002 2003 2004 2005 2006 2007 2008 2009 2010 2011 2012 2013 2014 2015 2016 2017 2018 2019 2020 2021 2022 2023 2024 2025 Drained organic soils 15.2 15.6 15.9 16.3 16.8 17.2 17.7 18.2 18.7 19.1 19.4 19.6 19.8 20.0 20.2 20.3 20.5 20.6 20.7 20.8 21.0 21.1 21.2 21.3 21.4 21.5 Drained organic - Nutrient-rich
9.5 9.7 10.0 10.2 10.5 10.7 11.0 11.3 11.6 11.9 12.0 12.1 12.3 12.3 12.4 12.5 12.6 12.7 12.8 12.9 12.9 13.0 13.1 13.1 13.2 13.3
Drained organic - Nutrient-poor
5.7 5.8 6.0 6.1 6.3 6.5 6.7 6.9 7.1 7.3 7.4 7.5 7.6 7.6 7.7 7.8 7.8 7.9 7.9 8.0 8.0 8.1 8.1 8.2 8.2 8.2
Drained Mineral Soils 11.4 11.5 11.6 11.7 11.8 11.9 12.0 12.2 12.3 12.5 12.6 12.7 12.8 12.8 12.9 13.0 13.1 13.2 13.3 13.3 13.4 13.5 13.6 13.6 13.7 13.8 Drained Organo-mineral Nutrient-rich
1.2 1.2 1.2 1.2 1.2 1.2 1.2 1.2 1.2 1.3 1.3 1.3 1.3 1.3 1.3 1.3 1.3 1.3 1.3 1.3 1.3 1.3 1.4 1.4 1.4 1.4
Drained Organo-mineral Nutrient-poor
14.0 14.2 14.3 14.4 14.6 14.7 14.9 15.1 15.3 15.5 15.7 15.9 16.0 16.1 16.3 16.4 16.5 16.6 16.7 16.8 16.9 17.0 17.1 17.2 17.3 17.3
Total 41.9 42.5 43.0 43.7 44.3 45.0 45.8 46.7 47.6 48.4 49.0 49.4 49.9 50.2 50.7 51.0 51.4 51.7 52.0 52.3 52.7 52.9 53.2 53.5 53.7 54.0

63
Chapter 4: Forest Reference Level
4.1: Forest Reference Level and detailed description of the development of the carbon pools
4.1.1 Forest Reference Level and detailed description of the development of the carbon pools for a transition period of 20 years
Table 4.1 gives details of the annualised carbon stock changes estimated to occur in forest carbon pools, according to the FRL projection, for the Reference Period and for the periods 2010-2015 and 2016-2020. This describes the detailed development of the carbon pools contributing to the FRL projection from the Reference Period up to the start of the Compliance Period. The results for the Compliance Period of 2021-2025 are also shown in Table 4.1.
Table 4.1: Detailed description of the development of the carbon pools over time in the run of CARBINE used to define the FRL.
Carbon pool Annualised carbon stock change for period (ktCO2e yr-1)
2000-2009 2010-2015 2016-2020 2021-2025
Above-ground tree carbon -8 599.46 -8 288.65 -8 929.47 -9 361.50
Below-ground tree carbon -2 655.80 -2 620.39 -2 789.09 -2 947.29
Litter -421.63 -384.00 -238.18 -257.83
Deadwood -3 267.94 -3 385.01 -2 779.66 -2 428.66
Organic soil -263.26 -558.60 -695.06 -742.16
Mineral soil -3 135.79 -3 777.67 -4 117.23 -4 320.30
Sum of pools -18 343.88 -19 014.33 -19 548.69 -20 057.73
N2O emissions from drainage
45.95 50.42 52.32 53.47
Natural disturbance background level
249 249 249 249
FRL without HWP -18 048.93 -18 714.91 -19 247.37 -19 755.26
HWP CO2 Emissions -1 950.81 -2 492.05 -1 529.29 -946.29
FRL with HWP -19 999.75 -21 206.96 -20 776.66 -20 701.55

64
• A generally progressively increasing carbon sink in tree biomass, apart fromthe period 2010-2015 when there is a slight decrease
• A progressively increasing carbon stock in soils
• A decreasing sink in the HWP, litter and deadwood pools as a result of thelower level of forest management assumed during the projection period(2010-2025)
4.1.2 Forest Reference Level and detailed description of the development of the carbon pools for a transition period of 30 years
As explained in Section 1.1, within this National Forestry Accounting Plan, the Forest Reference Level has been calculated by assuming that the transition to managed forest land already occurs 20 years after the date of conversion to ensure consistency with emissions and removals reported for forest land remaining forest land in the existing greenhouse gas inventories. The results presented in Table 4.1 above and in later sections in this chapter are consistent with this convention.
Following article 6(2) of the LULUCF Regulation, the UK intends to categorise cropland, grassland, wetland, settlements or other land converted to forest land as making the transition to managed forest land from 30 years after the date of conversion. This will be implemented to satisfy the criteria A.a of annex VI of the LULUCF regulation. It will be realised through a technical correction to the Forest Reference Level.
Table 4.2 gives details of the annualised carbon stock changes estimated to occur in forest carbon pools, according to the FRL projection, for the Reference Period and for the periods 2010-2015 and 2016-2020, when a 30-year transition period is adopted.
The total change in carbon stocks is a net carbon sink, which is projected to remain fairly consistent over the period, increasing in the period 2010-2015, then decreasing slightly in the period 2016-2025. This is the result of:

65
Table 4.2: Detailed description of the development of the carbon pools over time in the run of CARBINE used to define the FRL, based on an alternative transition period of 30 years for land converted to forest land to become managed forest land.
Carbon pool Annualised carbon stock change for period (ktCO2e yr-1)
2000-2009 2010-2015 2016-2020 2021-2025
Above-ground tree carbon -5 395.33 -5 290.65 -6 726.18 -7 662.44
Below-ground tree carbon -1 552.81 -1 590.64 -2 047.54 -2 380.01
Litter -300.77 -243.93 -129.15 -182.15
Deadwood -2 878.36 -2 932.18 -2 418.48 -2 185.94
Organic soil -383.05 -639.43 -734.87 -768.04
Mineral soil -3 488.08 -4 106.42 -4 380.54 -4 578.08
Sum of pools -13 998.39 -14 803.25 -16 436.76 -17 756.66
N2O emissions from drainage
45.95 50.42 52.32 53.47
Natural disturbance background level
249 249 249 249
FRL without HWP -13 703.44 -14 503.83 -16 135.44 -17 454.19
HWP CO2 Emissions -1 810.15 -2 258.40 -1 346.00 -845.26
FRL with HWP -15 513.60 -16 762.23 -17 481.44 -18 299.46
4.2: Consistency between the forest reference level and the latest national inventory report
Figure 4.1 shows the net carbon stock changes of Managed Forest Land in the UK over the period 2000 to 2017 as reported in the UK GHG Inventory for 1990-2017, in comparison to the carbon stock changes estimated for the FRL projection over the same period and projected to 2025. Carbon stock changes in harvested wood products are not included in the results. The carbon stock changes are expressed in units of ktCO2 yr-1, with negative numbers indicating net CO2 removals.
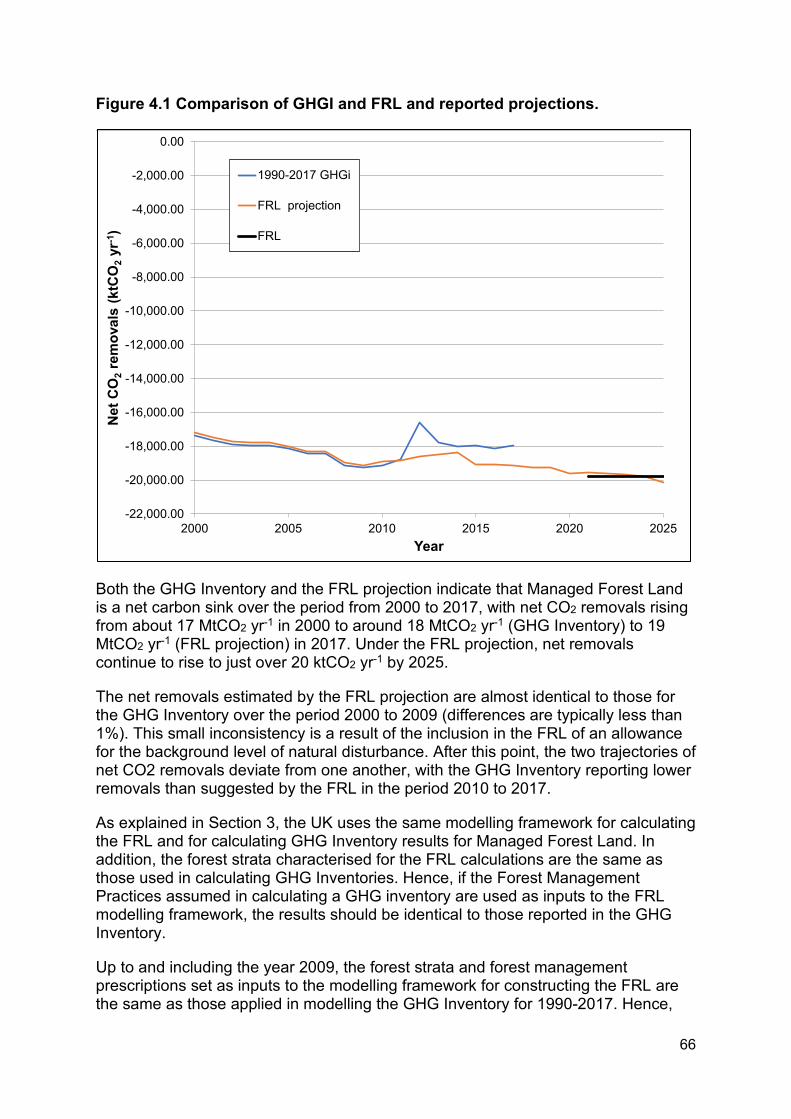
66
Figure 4.1 Comparison of GHGI and FRL and reported projections.
Both the GHG Inventory and the FRL projection indicate that Managed Forest Land is a net carbon sink over the period from 2000 to 2017, with net CO2 removals rising from about 17 MtCO2 yr-1 in 2000 to around 18 MtCO2 yr-1 (GHG Inventory) to 19 MtCO2 yr-1 (FRL projection) in 2017. Under the FRL projection, net removals continue to rise to just over 20 ktCO2 yr-1 by 2025.
The net removals estimated by the FRL projection are almost identical to those for the GHG Inventory over the period 2000 to 2009 (differences are typically less than 1%). This small inconsistency is a result of the inclusion in the FRL of an allowance for the background level of natural disturbance. After this point, the two trajectories of net CO2 removals deviate from one another, with the GHG Inventory reporting lower removals than suggested by the FRL in the period 2010 to 2017.
As explained in Section 3, the UK uses the same modelling framework for calculating the FRL and for calculating GHG Inventory results for Managed Forest Land. In addition, the forest strata characterised for the FRL calculations are the same as those used in calculating GHG Inventories. Hence, if the Forest Management Practices assumed in calculating a GHG inventory are used as inputs to the FRL modelling framework, the results should be identical to those reported in the GHG Inventory.
Up to and including the year 2009, the forest strata and forest management prescriptions set as inputs to the modelling framework for constructing the FRL are the same as those applied in modelling the GHG Inventory for 1990-2017. Hence,
-22,000.00
-20,000.00
-18,000.00
-16,000.00
-14,000.00
-12,000.00
-10,000.00
-8,000.00
-6,000.00
-4,000.00
-2,000.00
0.00
2000 2005 2010 2015 2020 2025
Net
CO
2re
mov
als
(ktC
O2
yr-1
)
Year
1990-2017 GHGi
FRL projection
FRL

67
the estimates reported in the GHG Inventory and those of the FRL are essentially the same. From 2010 onwards, the FRL projection is expected to deviate from the GHG Inventory results because assumptions about management prescriptions in the FRL have been fixed at those representative of the Reference Period, whereas management in the GHG Inventory will continue to evolve. In particular, management prescriptions in the GHG inventory change to match the changes in reported levels of wood harvesting over the period 2010 to 2017. Given that harvesting levels appear to have risen markedly over this period, and that harvesting levels for the FRL projection are lower (see Section 3.2), net CO2 removals in Managed Forest Land would be expected to be higher for the FRL than for the GHG Inventory (as a result of the lower levels of harvesting).
Consistency of FRL projection with Regulation (EU) 525/2013
Regulation (EU) 2018/841 requires demonstration of the consistency of net emissions and removals project by the FRL with the national projections of anthropogenic greenhouse gas emissions reported under Regulation (EU) 525/2013 (also referred to as the “Mechanism for Monitoring and Reporting”, or MMR). Under this Regulation, EU Member States report national projections of anthropogenic greenhouse gas emissions by sources and removals by sinks, taking into consideration any policies and measures adopted at Union level.
Figure 4.2 shows a comparison of the net CO2 removals of Managed Forest Land, as projected from 2000 to 2025 in the UK’s submission to the MMR, and the net CO2 removals reported by the latest (1990-2017) GHG Inventory and the FRL projection. It should be noted that the MMR projection is based on the UK’s GHG Inventory for 1990-2016.
Figure 4.2 Comparison of GHGI and FRL and reported projections.
-30,000.00
-25,000.00
-20,000.00
-15,000.00
-10,000.00
-5,000.00
0.00
2000 2005 2010 2015 2020 2025
Net C
O2
rem
oval
s (k
tCO
2yr
-1)
Year
1990-2017 GHGiFRL projectionFRLMMRMMR corrected
68
In considering the results in Figure 4.2, it is important to bear in mind that the modelling methodology for estimating emissions and removals of Forest Land in the UK for the purposes of GHG Inventory reporting has undergone several significant methodological improvements in recent years. The most important ones of relevance to the results in Figure 4.2 are:
• Improved modelling of soil carbon dynamics
• Closer matching of modelled wood production with reported levels.
These improvements were introduced progressively during the development of the 1990-2015 GHG Inventory, the 1990-2016 GHG Inventory and the 1990-2017 GHG Inventory. As a consequence, the estimated net CO2 removals of Managed Forest Land have changed significantly between these three reported GHG Inventories. As a consequence, the net CO2 removals for Managed Forest Land indicated by the MMR submission (which is based on the 1990-2016 GHG Inventory) are markedly different than those of the 1990-2017 GHG Inventory and the FRL projection. To permit a consistent comparison, a correction was made to the MMR projection using the IPCC overlap method, applied to the results for the MMR projection and the 1990-2017 GHG Inventory for the period 1990 to 2017.
Net CO2 removals of Managed Forest Land for the period 2000 to 2025 based on the corrected MMR projection are very similar to the levels suggested by the FRL projection. Both projections give results that are consistent with the GHG Inventory up to at least 2009 (see earlier discussion of Figure 4.1). From 2011 onwards, the corrected MMR projection gradually deviates from the GHG Inventory results. This is because the modelling of wood production to match reported levels was further improved in the 1990-2017 GHG Inventory, compared to the 1990-2016 GHG Inventory, for which the match between simulated and reported wood production was less accurate.
Consistency of FRL projection with long-term emissions goal
In Figure 4.3, the projections submitted by the UK under the MMR and presented in the previous section have been extended until 2050. This shows that, already in a reference case scenario, the UK forest land (and the UK managed forest land more specifically) are expected to remain a sink until 2050, although of decreasing magnitude if no further measures are implemented.

69
Figure 4.3. Projections of emissions and removals of Managed Forest Land up to 2050 for a reference case scenario.
As will be discussed further in the UK Long Term Strategy due under the (EU) regulation 2018/1999, more ambitious afforestation policies are amongst the options considered by the UK to increase further the long-term forest sink.
In October 2017, the UK Government published its Clean Growth Strategy setting out ambitious policies and proposals, through to 2032, to reduce emissions across the economy and promote clean growth. Through this strategy, the UK government already committed to “design woodland creation incentives that attract more landowners and farmers to plant on marginal land, including through agroforestry and bioenergy production, to help diversify land-based businesses and enhance the farmed environment.”
In response to the special report published in October 2018 by the Intergovernmental Panel on Climate Change (IPCC) on the impacts of global warming of 1.5°C, the UK Government requested advice from the Committee on Climate Change (CCC) on the implications of the Paris Agreement for the UK’s long-term emissions reduction targets, including on setting a net zero target. In May 2019, the CCC recommended that the UK should legislate as soon as possible to reach net-zero greenhouse gas emissions2. The CCC suggested further that a combination of Core and Further Ambition options would cut emissions by 96% from 1990 levels, to 35MtCO2e in 2050. It considered that afforestation of around 30,000 hectares per year (increasing woodland cover from the current 13% of UK land area to 17%), combined with an
2 CCC (2019) Net Zero - The UK's contribution to stopping global warming
https://www.theccc.org.uk/publication/net-zero-the-uks-contribution-to-stopping-global-warming/
-30,000.00
-25,000.00
-20,000.00
-15,000.00
-10,000.00
-5,000.00
0.00
2000 2005 2010 2015 2020 2025 2030 2035 2040 2045 2050
Net C
O2
rem
oval
s (k
tCO
2yr
-1)
Year
1990-2017 GHGiFRL projectionFRLMMRMMR (corrected)

70
increase in active woodland management, could increase the net forestry sink to 22 MtCO2e per year by 2050.
Consistent with this ambition, the UK intends to move to a 30 years transition period for afforestation to ensure the benefits of afforestation in terms of carbon sequestration are appropriately reflected in the UK international accounting.
This will make the determination of the reference level more consistent with the goal of achieving a balance between anthropogenic emissions by sources and removals by sinks of greenhouse gases in the second half of this century (criteria A.(a) of the annex VI of the Regulation (EU) 2018/841).
4.3: Calculated carbon pools and greenhouse gases for the forest reference level
Table 4.3 shows the calculation of the final FRL for the Compliance Period 2021-2025, including other contributions to emissions and removals as well as contributions due to forest carbon pools. Essentially, there are additional values included in the calculation to allow for the UK’s nominated Natural Disturbance Background Level of 249 kt CO2e yr-1 and N2O emissions from the drainage of forest soils.

71
Table 4.3 Calculated carbon pools and greenhouse gases for the Forest Reference Level
Source of contribution to FRL Emissions or removals (+/-) (kt CO2e yr-1)
Above-ground tree carbon -9 361.50
Below-ground tree carbon -2 947.29
Litter -257.83
Deadwood -2 428.66
Organic soil -742.16
Mineral soil -4 320.30
Sum of pools -20 057.73
N2O emissions from drainage 53.47
Natural disturbance background level 249
FRL without HWP -19 755.26
HWP CO2 Emissions -946.29
FRL with HWP -20 701.55
72
References LULUCF Regulation: Regulation (EU) 2018/841 of the European Parliament and of the Council of 30 May 2018 on the inclusion of greenhouse gas emissions and removals from land use, land use change and forestry in the 2030 climate and energy framework, and amending Regulation (EU) No 525/2013 and Decision No 529/2013/EU
EU Commission. July 2018. Guidance on developing and reporting Forest Reference Levels in accordance with Regulation (EU) 2018/841
Climate Change Act. (2008). See http://www.legislation.gov.uk/ukpga/2008/27/contents
HM Government (2017) Clean Growth Strategy, at https://www.gov.uk/government/publications/clean-growth-strategy
HM Government (2018) A Green Future: Our Plan to Improve the Environment, London: Defra, at https://www.gov.uk/government/publications/25-year-environment-plan
Revision of the Environmental Impact Assessment (Forestry) Regulations (2017). England
Forestry and Land Management (Scotland) Act 2018.
Forestry (Environmental Impact Assessment) (Scotland) Regulations 2017.
Scotland (2018) Roots for future growth.
Scotland (2018) Climate Change Plan (third report on policies and proposals)
Welsh Government’s (2018). Woodlands for Wales. fifty-year Strategy
Forestry strategy (2006). Northern Ireland.
Forest Act (2010). Northern Ireland.
HM Government (2017). UK Report to facilitate the calculation of the assigned amount (‘initial reports’) for the second commitment period (2013–2020) of the Kyoto Protocol. Available at https://unfccc.int/files/national_reports/initial_reports_under_the_kyoto_protocol/second_commitment_period_2013-2020/application/zip/gbk-cp2-ir-29aug2017.zip
Balster, N.J., Marshall, J.D., 2000. Decreased needle longevity of fertilized Douglas-fir and grand fir in the northern Rockies. Tree Physiol. 20, 1191–1197. doi:10.1093/treephys/20.17.1191

73
Beets, P.N., Robertson, K.A., Ford-Robertson, J.B., Gordon, J., Maclaren, J.P., 1999. Description and validation of C_change: A model for simulating carbon content in managed Pinus radiata stands. New Zeal. J. For. Sci. 29, 409–427.
Brunner, I., Bakker, M.R., Björk, R.G., Hirano, Y., Lukac, M., Aranda, X., Børja, I., Eldhuset, T.D., Helmisaari, H.S., Jourdan, C., Konôpka, B., López, B.C., Miguel Pérez, C., Persson, H., Ostonen, I., 2013. Fine-root turnover rates of European forests revisited: An analysis of data from sequential coring and ingrowth cores. Plant Soil 362, 357–372. doi:10.1007/s11104-012-1313-5
Forestry Commission (2017) Tree cover outside woodland in Great Britain. National Forest Inventory Report (https://www.forestresearch.gov.uk/documents/2698/FR_Tree_cover_outside_woodland_in_GB_summary_report_2017.pdf).
Cannell, M.G.R. and Dewar, R.C. (1995) The carbon sink provided by plantation forests and their products in Great Britain. Forestry, 68, 35-48.
Cannell, M.G.R., Cruickshank, M.M. and Mobbs, D.C. (1996) Carbon storage and sequestration in the forests of Northern Ireland. Forestry, 69, 155-165.
Dewar, R.C., 1990. A model of carbon storage in forests and forest products. Tree Physiol. 6, 417–28.
Dewar, R.C., 1991. Analytical model of carbon storage in the trees, soils, and wood products of managed forests. Tree Physiol. 8, 239–258.
Forestry Commission (2012) NFI Forecasts methodology overview. Forestry Commission NFI Report. Forestry Commission: Edinburgh.
Forestry Commission (2014a) 50-year forecast of softwood timber availability. Forestry Commission NFI Report. Forestry Commission: Edinburgh.
Forestry Commission (2014b) 50-year forecast of hardwood timber availability. Forestry Commission NFI Report. Forestry Commission: Edinburgh.
Forestry Commission (2014c) Data on forest area by tree species and yield class produced in support of Forestry Commission (2014a) and Forestry Commission (2014b), for example see https://www.forestresearch.gov.uk/documents/5394/FR_NFI_Stocked_Area_By_Age_Class.xlsx. However note that a bespoke analysis of SCDB and NFI data was carried out for the purposes of developing the UK GHG Inventory results for Managed Forest Land.
Forestry Commission (2017) Tree cover outside woodland in Great Britain. National Forest Inventory Report (https://www.forestresearch.gov.uk/documents/2698/FR_Tree_cover_outside_woodland_in_GB_summary_report_2017.pdf).
Godbold, D.L., Fritz, H.-W., Jentschke, G., Meesenburg, H., Rademacher, P., 2003. Root turnover and root necromass accumulation of Norway spruce (Picea abies) are affected by soil acidity. Tree Physiol. 23, 915–921. doi:10.1093/treephys/23.13.915

74
Halsall, L., Gilbert, J. Matthews, R. and Fairgreave, M. (2006) United Kingdom: New Forecast of Softwood Availability. Forestry and British Timber, 35(11), 14-23.
IPCC 2006 Guidelines for National Greenhouse Gas Inventories
Janssens, I.A., Sampson, D.A., Curiel-Yuste, J., Carrara, A., Ceulemans, R., 2002. The carbon cost of fine root turnover in a Scots pine forest. For. Ecol. Manage. 168, 231–240. doi:10.1016/S0378-1127(01)00755-1
Jenkins, T., Mackie, E., Matthews, R., Miller, G., Randle, T., White, M. (2013) FC Woodland Carbon Code: Assessment Protocol. Forestry Commission: Edinburgh.
Konôpka, B., Janssens, I.A., Curiel-Yuste, J., Ceulemans, R., 2006. Fine Root Turnover in a Temperate Scots Pine Forest. Lesn. časopis - For. J. 52, 107–117.
Kurz, W.A., Beukema, S.J., 1996. Estimation of root biomass and dynamics for the carbon budget model of the Canadian forest sector. Can. J. For. Res. 26, 1973–1979. doi:10.1139/x26-223
Kurz, W.A., Dymond, C.C., White, T.M., Stinson, G., Shaw, C.H., Rampley, G.J., Smyth, C., Simpson, B.N., Neilson, E.T., Trofymow, J.A., Metsaranta, J., Apps, M.J., 2009. CBM-CFS3: A model of carbon-dynamics in forestry and land-use change implementing IPCC standards. Ecol. Modell. 220, 480–504. doi:10.1016/j.ecolmodel.2008.10.018
Lavers, G.M. and Moore, G.L. (1983) The strength properties of timber. Building Research Establishment Report CI/Sfb i(J3). Building Research Establishment: Garston.
Marland, G. and Schlamadinger, B. (1995) Biomass fuels and forest management strategies: how do we calculate the greenhouse-gas emissions benefits? Energy, 20, 1131–1140. doi:0360-5442(95)00061-5
Marland, G., and Schlamadinger, B. (1999) The Kyoto Protocol could make a difference for the optimal forest-based CO2 mitigation strategy: some results from GORCAM. Environmental Science and Policy, 2, 111–124.
Matthews, G.A.R. (1993) The Carbon Content of Trees. Forestry Commission technical paper 4. Forestry Commission: Edinburgh.
Matthews, R., Malcolm, H., Buys, G., Henshall, P., Moxely, J., Morris, A., and Mackie, E. (2014c) Changes to the representation of forest land and associated land-use changes in the 1990-2012 UK Greenhouse Gas Inventory. Report to Department of Energy and Climate Change, Contract GA0510, CEH: Edinburgh.
Matthews, R., Mortimer, N., Lesschen, J-P., Lindroos, T., Sokka, L., Morris, A., Henshall, P., Hatto, C., Mwabonje, O., Rix, J., Mackie., E. and Sayce, M. (2015) Carbon impact of biomass consumed in the EU: quantitative assessment. Final project report, project: DG ENER/C1/427. Forest Research: Farnham.
Matthews, R., Sokka, L., Soimakallio, S., Mortimer, N., Rix, J., Schelhaas, M-J., Jenkins, T., Hogan, G., Mackie, E., Morris, A. and Randle, T. (2014) Review of
75
literature on biogenic carbon and life cycle assessment of forest bioenergy. Final Task 1 report, EU DG ENER project ENER/C1/427, ‘Carbon impacts of biomass consumed in the EU’. Forest Research, Farnham.
Matthews, R.W. (1991) Biomass production and carbon storage by British forests, in: Aldhous, J.R. (Ed.), Wood for Energy : The Implications for Harvesting, Utilisation and Marketing : Proceedings - 1991 Discussion Meeting. Institute of Chartered Foresters, Edinburgh, pp. 162–177.
Matthews, R.W. (1994) Towards a methodology for the evaluation of the carbon budget of forests. In: Kanninen, M. (Ed.), Carbon Balance of the World’s Forested Ecosystems: Towards a Global Assessment. Proceedings of a Workshop Held by the Intergovernmental Panel on Climate Change AFOS, Joensuu, Finland, 11-15 May 1992. Painatuskeskus, Helsinki, pp. 105–114.
Matthews, R.W. (1996) The influence of carbon budget methodology on assessments of the impacts of forest management on the carbon balance, in: Apps, M.J., Price, D.T. (Eds.), Forest Ecosystems, Forest Management and the Global Carbon Cycle. Springer-Verlag, Berlin, New York, pp. 233–243.
Matthews, R.W. and Broadmeadow, M.S.J. (2009) The potential of UK forestry to contribute to Government’s emissions reduction commitments. In: Read, D.J., Freer-Smith, P.H., Morison, J.I.L., Hanley, N., West, C.C., Snowdon, P. (Eds.), Combating Climate Change - a Role for UK Forests. An Assessment of the Potential of the UK’s Trees and Woodlands to Mitigate and Adapt to Climate Change. The stationery office, Edinburgh, pp. 139–161. doi:10.1038/nnano.2007.168
Matthews, R.W. and Duckworth, R.R. (2005) BSORT: a Model of Tree and Stand Biomass Development and Production in Great Britain. In: Imbabi, M.S., Mitchell, C.P. (Eds.), Proceedings of World Renewable Energy Congress (WREC 2005), 22-27 May 2005, Aberdeen, UK. Elsevier, Oxford, 404–409.
Matthews, R.W., Henshall, P.A., Duckworth, R.R., Jenkins, T.A.R., Mackie, E.D. and Dick, E.C. (2016b) Forest Yield: a PC-based yield model for forest management in Britain. User manual. Forestry Commission: Edinburgh.
Matthews, R.W., Jenkins, T.A.R., Mackie, E.D. and Dick, E.C. (2016a) Forest Yield: A handbook on forest growth and yield tables for British forestry. Forestry Commission, Edinburgh.
Matthews, R.W., Razauskaite, R., Hogan, G.P., Mackie, E.D., Sayce, M. and Randle, T.J. (2019) The CARBINE model: a technical description. Forest Research report. Forest Research: Farnham, in preparation.
Mohren, G.M.J., Garza-Caligaris, J.F., Masera, O.R., Kanninen, M., Karjalainen, T., Pussinen, A., Nabuurs, G.-J., 1999. CO2FIX for Windows: a dynamic model of the CO2-fixation in forests; Version 1.2.
Mohren, G.M.J., Klein Goldewijk, C.G.M., 1990. CO2FIX: a dynamic model of the CO2-fixation in forest stands : model documentation and listing. Wageningen.
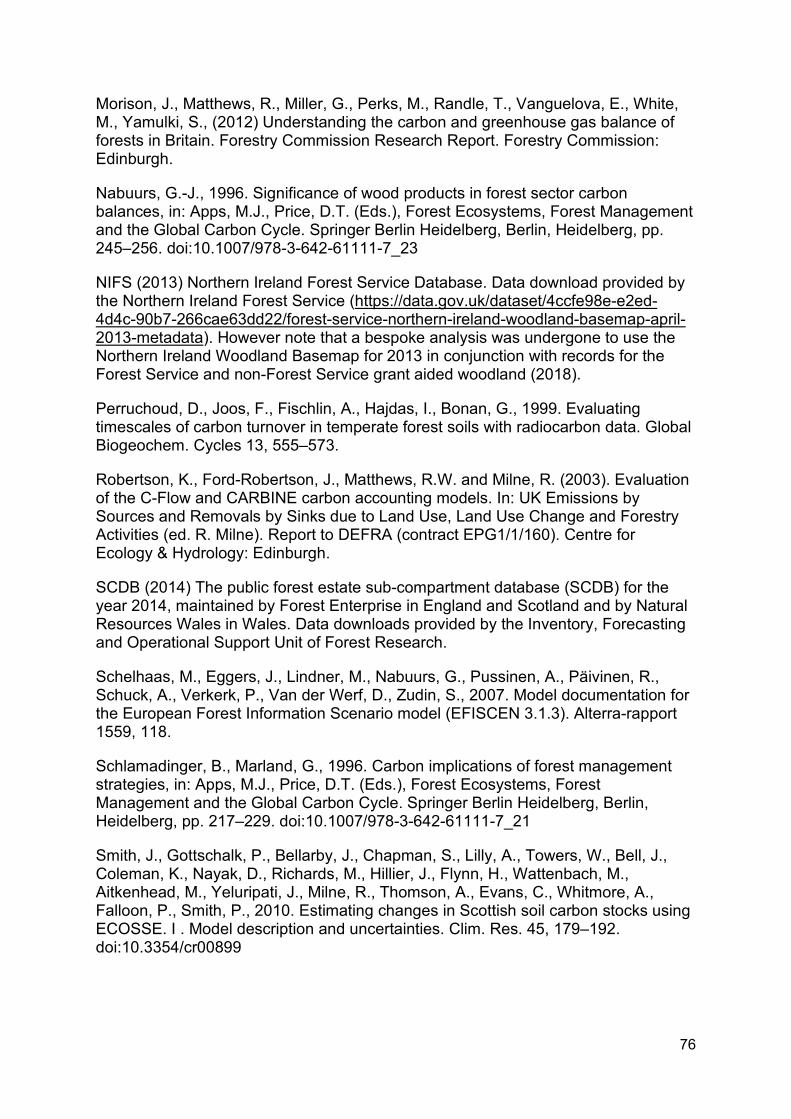
76
Morison, J., Matthews, R., Miller, G., Perks, M., Randle, T., Vanguelova, E., White, M., Yamulki, S., (2012) Understanding the carbon and greenhouse gas balance of forests in Britain. Forestry Commission Research Report. Forestry Commission: Edinburgh.
Nabuurs, G.-J., 1996. Significance of wood products in forest sector carbon balances, in: Apps, M.J., Price, D.T. (Eds.), Forest Ecosystems, Forest Management and the Global Carbon Cycle. Springer Berlin Heidelberg, Berlin, Heidelberg, pp. 245–256. doi:10.1007/978-3-642-61111-7_23
NIFS (2013) Northern Ireland Forest Service Database. Data download provided by the Northern Ireland Forest Service (https://data.gov.uk/dataset/4ccfe98e-e2ed-4d4c-90b7-266cae63dd22/forest-service-northern-ireland-woodland-basemap-april-2013-metadata). However note that a bespoke analysis was undergone to use the Northern Ireland Woodland Basemap for 2013 in conjunction with records for the Forest Service and non-Forest Service grant aided woodland (2018).
Perruchoud, D., Joos, F., Fischlin, A., Hajdas, I., Bonan, G., 1999. Evaluating timescales of carbon turnover in temperate forest soils with radiocarbon data. Global Biogeochem. Cycles 13, 555–573.
Robertson, K., Ford-Robertson, J., Matthews, R.W. and Milne, R. (2003). Evaluation of the C-Flow and CARBINE carbon accounting models. In: UK Emissions by Sources and Removals by Sinks due to Land Use, Land Use Change and Forestry Activities (ed. R. Milne). Report to DEFRA (contract EPG1/1/160). Centre for Ecology & Hydrology: Edinburgh.
SCDB (2014) The public forest estate sub-compartment database (SCDB) for the year 2014, maintained by Forest Enterprise in England and Scotland and by Natural Resources Wales in Wales. Data downloads provided by the Inventory, Forecasting and Operational Support Unit of Forest Research.
Schelhaas, M., Eggers, J., Lindner, M., Nabuurs, G., Pussinen, A., Päivinen, R., Schuck, A., Verkerk, P., Van der Werf, D., Zudin, S., 2007. Model documentation for the European Forest Information Scenario model (EFISCEN 3.1.3). Alterra-rapport 1559, 118.
Schlamadinger, B., Marland, G., 1996. Carbon implications of forest management strategies, in: Apps, M.J., Price, D.T. (Eds.), Forest Ecosystems, Forest Management and the Global Carbon Cycle. Springer Berlin Heidelberg, Berlin, Heidelberg, pp. 217–229. doi:10.1007/978-3-642-61111-7_21
Smith, J., Gottschalk, P., Bellarby, J., Chapman, S., Lilly, A., Towers, W., Bell, J., Coleman, K., Nayak, D., Richards, M., Hillier, J., Flynn, H., Wattenbach, M., Aitkenhead, M., Yeluripati, J., Milne, R., Thomson, A., Evans, C., Whitmore, A., Falloon, P., Smith, P., 2010. Estimating changes in Scottish soil carbon stocks using ECOSSE. I . Model description and uncertainties. Clim. Res. 45, 179–192. doi:10.3354/cr00899

77
Thompson, D.A. and Matthews, R.W. (1989) The storage of carbon in trees and timber. Forestry Commission Research Information Note 160. Forestry Commission: Edinburgh.
Ťupek, B., Mäkipää, R., Heikkinen, J., Peltoniemi, M., Ukonmaanaho, L., Hokkanen, T., Nöjd, P., Nevalainen, S., Lindgren, M., Lehtonen, A., 2015. Foliar turnover rates in Finland — comparing estimates from needle-cohort and litterfall-biomass methods. Boreal Environ. Res. 20, 283–304.
Webb, N., Broomfield, ., Cardenas, L., MacCarthy, J., Murrells, T., Pang, Y., Passant, N., Thistlethwaite, G. and Thomson, A. (2013) UK Greenhouse Gas Inventory, 1990-2011, Annex 3, Section A3.6.1.3. Available at: http://naei.beis.gov.uk/reports/reports?report_id=747

78
Annex 1 Handling of minor species in modelling through association with major UK tree species
Common name Latin name CARBINE species Alder Alnus spp Birch
Armand's pine Pinus armandii Scots pine
Ash Fraxinus excelsior Ash
Aspen Populus tremula Poplar
Atlas cedar Cedrus atlantica Noble fir
Austrian pine Pinus nigra var nigra Corsican pine
Beech Fagus sylvatica Beech
Bhutan pine Pinus wallichiana Scots pine
Big leaf maple Acer macrophyllum Sycamore
Birch Betula spp Birch
Bird cherry Prunus padus Birch
Bishop pine Pinus muricata Lodgepole pine
Black poplar Populus nigra Poplar
Black walnut Juglans nigra Oak
Blackthorn Prunus spinosa Sycamore
Bornmuller's fir Abies bornmuelleriana Noble fir
Box Buxus spp Birch
Calabrian pine Pinus brutia Scots pine
Cedar of Lebanon Cedrus libani Noble fir
Cider gum Eucalyptus gunnii Poplar
Coast redwood Sequoia sempervirens Grand fir
Common alder Alnus gultinosa Birch
Common Lime Tilia europaea Ash
Common walnut Juglans regia Oak
Common whitebeam Sorbus aria Birch
Corsican pine Pinus nigra var maritima Corsican pine
Crab apple Malus sylvestris Sycamore
Crack willow Salix fragilis Birch
Douglas fir Pseudotsuga menziesii Douglas fir
Downy birch Betula pubescens Birch
Downy oak Quercus pubescens Oak
Elm Ulmus spp Beech

79
English elm Ulmus procera Beech
European larch Larix decidua European larch
Field maple Acer campestre Sycamore
Goat willow Salix caprea Birch
Grand fir Abies grandis Grand fir
Greek fir Abies cephalonica Noble fir
Green alder Alnus viridis Birch
Grey alder Alnus incana Birch
Grey poplar Populus canescens Poplar
Grey willow Salix cinerea Birch
Hawthorn Crataegus spp Birch
Hazel Corylus avellana Birch
Holly Ilex spp Sycamore
Holm oak Quercus ilex Oak
Hornbeam Carpinus betulus Beech
Horse Chestnut Aesculus hippocastanum Sycamore
Hungarian oak Quercus frainetto Oak
Hybrid larch Larix x eurolepis Japanese larch
Italian alder Alnus cordata Birch
Japanese cedar Cryptomeria japonica Western red cedar
Japanese larch Larix kaempferi Japanese larch
Juniper Juniperus communis Norway spruce
Korean pine Pinus koreana Scots pine
Large-leaved lime Tilia platyphyllos Ash
Lawsons cypress Chamaecyparis lawsoniana Western red cedar
Lenga Nothofagus pumilio Roble
Leyland cypress Cupressocyparis leylandii Western red cedar
Lime Tilia spp Ash
Loblolly pine Pinus taeda Corsican pine
Lodgepole pine Pinus contorta Lodgepole pine
London plane Platanus x acerifolia Sycamore
Macedonian pine Pinus peuce Corsican pine
Maritime pine Pinus pinaster Lodgepole pine
Mexican white pine Pinus ayacahuite Scots pine
Mixed broadleaves Mixed broadleaf Sycamore
Mixed conifers Mixed coniferales Norway spruce
Mountain pine Pinus uncinata Scots pine
Narrow-leafed ash Fraxinus angustifolia Ash
Noble fir Abies procera Noble fir

80
Nordmann/Caucasian fir Abies nordmanniana Noble fir
Norway maple Acer platanoides Sycamore
Norway spruce Picea abies Norway spruce
Oak Quercus spp Oak
Oriental beech Fagus orientalis Beech
Oriental spruce Picea orientalis Norway spruce
Other birch Betula spp Birch
Other broadleaves Other broadleaf Sycamore
Other broadleaves (non-native)
Other broadleaf Sycamore
Other cedar Cedrus spp Noble fir
Other cherry Prunus spp Birch
Other conifers Other coniferales Norway spruce
Other eucalyptus Eucalyptus spp Poplar
Other firs (abies) Abies spp Noble fir
Other larches Larix spp European larch
Other Nothofagus Nothofagus spp Roble
Other oak Quercus spp Oak
Other pines Pinus spp Scots pine
Other plane Platanus spp Sycamore
Other poplar Populus spp Poplar
Other spruces Picea spp Norway spruce
Other walnut Juglans spp Oak
Other willows Salix spp Birch
Paper bark birch Betula papyrifera Birch
Pedunculate oak Quercus robur Oak
Ponderosa pine Pinus ponderosa Scots pine
Poplar Populus spp Poplar
Pyrenean oak Quercus pyrenaica Oak
Radiata/Monterey pine Pinus radiata Corsican pine
Raoul Nothofagus procera Roble
Red (pacific silver) fir Abies amabilis Grand fir
Red alder Alnus rubra Birch
Red ash Fraxinus pennsylvanica Ash
Red oak Quercus rubra Oak
Roble Nothofagus obliqua Roble
Rowan Sorbus aucuparia Birch
Scots pine Pinus sylvestris Scots pine
Serbian spruce Picea omorika Norway spruce
Sessile oak Quercus petraea Oak

81
Shagbark hickory Carya ovata Oak
Shining gum Eucalyptus nitens Poplar
Silver birch Betula pendula Birch
Silver fir (european) Abies alba Noble fir
Silver maple Acer saccharinum Sycamore
Sitka spruce Picea sitchensis Sitka spruce
Slash pine Pinus ellottii Lodgepole pine
Small-leaved lime Tilia cordata Ash
Smooth-leaved elm Ulmus carpinifolia Beech
Sweet chestnut Castanea sativa Beech
Sycamore Acer pseudoplatanus Sycamore
Tingiringi gum Eucalyptus glaucescens Poplar
Tulip tree/tulip poplar/yellow poplar
Liriodendron tulipifera Beech
Turkey oak Quercus cerris Oak
Wellingtonia Sequoiadendron giganteum Grand fir
Western hemlock Tsuga heterophylla Western hemlock
Western red cedar Thuja plicata Western red cedar
Western white pine Pinus monticola Lodgepole pine
Weymouth pine Pinus strobus Scots pine
White ash/american ash Fraxinus americana Ash
White oak Quercus alba Oak
White poplar Populus alba Poplar
White willow Salix alba Birch
Wild cherry/gean Prunus avium Birch
Wild service tree Sorbus torminalis Birch
Wych elm Ulmus glabra Beech
Yew Taxus baccata Scots pine
Yunnan pine Pinus yunnanensis Scots pine

82
Annex 2 Detailed stratification of UK forest area (not allowing for soil class)
Country Ownership CARBINE tree species Yield class (m3 ha-1 yr-1)
Area (ha)
Common name Latin name Sp. code England Public forest estate Norway spruce Picea abies NS 2 80.52
England Public forest estate Norway spruce Picea abies NS 4 71.15
England Public forest estate Norway spruce Picea abies NS 6 291.89
England Public forest estate Norway spruce Picea abies NS 8 722.66
England Public forest estate Norway spruce Picea abies NS 10 2 297.20
England Public forest estate Norway spruce Picea abies NS 12 1 429.63
England Public forest estate Norway spruce Picea abies NS 14 897.00
England Public forest estate Norway spruce Picea abies NS 16 626.72
England Public forest estate Norway spruce Picea abies NS 18 482.64
England Public forest estate Norway spruce Picea abies NS 20 335.14
England Public forest estate Norway spruce Picea abies NS 22 280.49
England Public forest estate Norway spruce Picea abies NS 24 3.89
England Public forest estate Norway spruce Picea abies NS 30 1.70
England Public forest estate Sitka spruce Picea sitchensis SS 2 92.82
England Public forest estate Sitka spruce Picea sitchensis SS 4 155.03
England Public forest estate Sitka spruce Picea sitchensis SS 6 673.23
England Public forest estate Sitka spruce Picea sitchensis SS 8 1 835.53

83
Country Ownership CARBINE tree species Yield class (m3 ha-1 yr-1)
Area (ha)
Common name Latin name Sp. code England Public forest estate Sitka spruce Picea sitchensis SS 10 3 466.40
England Public forest estate Sitka spruce Picea sitchensis SS 12 17 017.67
England Public forest estate Sitka spruce Picea sitchensis SS 14 9 918.67
England Public forest estate Sitka spruce Picea sitchensis SS 16 5 188.56
England Public forest estate Sitka spruce Picea sitchensis SS 18 3 208.05
England Public forest estate Sitka spruce Picea sitchensis SS 20 1 789.87
England Public forest estate Sitka spruce Picea sitchensis SS 22 1 008.98
England Public forest estate Sitka spruce Picea sitchensis SS 24 912.87
England Public forest estate Sitka spruce Picea sitchensis SS 26 22.41
England Public forest estate Sitka spruce Picea sitchensis SS 28 0.29
England Public forest estate Scots pine Pinus sylvestris SP 2 182.36
England Public forest estate Scots pine Pinus sylvestris SP 4 275.06
England Public forest estate Scots pine Pinus sylvestris SP 6 923.61
England Public forest estate Scots pine Pinus sylvestris SP 8 2 822.78
England Public forest estate Scots pine Pinus sylvestris SP 10 5 084.38
England Public forest estate Scots pine Pinus sylvestris SP 12 4 372.19
England Public forest estate Scots pine Pinus sylvestris SP 14 2 119.67
England Public forest estate Scots pine Pinus sylvestris SP 16 54.27
England Public forest estate Scots pine Pinus sylvestris SP 18 6.57
England Public forest estate Corsican pine Pinus nigra ssp. laricio CP 2 18.95
England Public forest estate Corsican pine Pinus nigra ssp. laricio CP 4 22.41
England Public forest estate Corsican pine Pinus nigra ssp. laricio CP 6 64.52
England Public forest estate Corsican pine Pinus nigra ssp. laricio CP 8 225.20

84
Country Ownership CARBINE tree species Yield class (m3 ha-1 yr-1)
Area (ha)
Common name Latin name Sp. code England Public forest estate Corsican pine Pinus nigra ssp. laricio CP 10 818.19
England Public forest estate Corsican pine Pinus nigra ssp. laricio CP 12 3 476.31
England Public forest estate Corsican pine Pinus nigra ssp. laricio CP 14 10 619.02
England Public forest estate Corsican pine Pinus nigra ssp. laricio CP 16 5 210.28
England Public forest estate Corsican pine Pinus nigra ssp. laricio CP 18 1 210.78
England Public forest estate Corsican pine Pinus nigra ssp. laricio CP 20 787.51
England Public forest estate Corsican pine Pinus nigra ssp. laricio CP 22 0.40
England Public forest estate Corsican pine Pinus nigra ssp. laricio CP 24 0.20
England Public forest estate Lodgepole pine Pinus contorta LP 2 57.80
England Public forest estate Lodgepole pine Pinus contorta LP 4 702.23
England Public forest estate Lodgepole pine Pinus contorta LP 6 1 035.10
England Public forest estate Lodgepole pine Pinus contorta LP 8 1 063.88
England Public forest estate Lodgepole pine Pinus contorta LP 10 366.11
England Public forest estate Lodgepole pine Pinus contorta LP 12 168.10
England Public forest estate Lodgepole pine Pinus contorta LP 14 61.16
England Public forest estate Lodgepole pine Pinus contorta LP 16 5.40
England Public forest estate Lodgepole pine Pinus contorta LP 18 1.93
England Public forest estate Lodgepole pine Pinus contorta LP 20 70.93
England Public forest estate European larch Larix decidua EL 2 9.77
England Public forest estate European larch Larix decidua EL 4 32.28
England Public forest estate European larch Larix decidua EL 6 190.35
England Public forest estate European larch Larix decidua EL 8 361.58
England Public forest estate European larch Larix decidua EL 10 295.35

85
Country Ownership CARBINE tree species Yield class (m3 ha-1 yr-1)
Area (ha)
Common name Latin name Sp. code England Public forest estate European larch Larix decidua EL 12 323.90
England Public forest estate European larch Larix decidua EL 14 5.17
England Public forest estate European larch Larix decidua EL 16 0.35
England Public forest estate European larch Larix decidua EL 18 0.53
England Public forest estate Japanese/hybrid larch Larix kaempferi/L. JL 2 16.80
England Public forest estate Japanese/hybrid larch Larix kaempferi/L. JL 4 111.45
England Public forest estate Japanese/hybrid larch Larix kaempferi/L. JL 6 489.15
England Public forest estate Japanese/hybrid larch Larix kaempferi/L. JL 8 1 302.89
England Public forest estate Japanese/hybrid larch Larix kaempferi/L. JL 10 1 930.57
England Public forest estate Japanese/hybrid larch Larix kaempferi/L. JL 12 1 768.49
England Public forest estate Japanese/hybrid larch Larix kaempferi/L. JL 14 1 648.32
England Public forest estate Japanese/hybrid larch Larix kaempferi/L. JL 16 50.81
England Public forest estate Japanese/hybrid larch Larix kaempferi/L. JL 18 0.98
England Public forest estate Japanese/hybrid larch Larix kaempferi/L. JL 20 1.78
England Public forest estate Douglas fir Pseudotsuga menziesii DF 2 6.05
England Public forest estate Douglas fir Pseudotsuga menziesii DF 4 4.67
England Public forest estate Douglas fir Pseudotsuga menziesii DF 6 11.69
England Public forest estate Douglas fir Pseudotsuga menziesii DF 8 170.74
England Public forest estate Douglas fir Pseudotsuga menziesii DF 10 373.13
England Public forest estate Douglas fir Pseudotsuga menziesii DF 12 1 222.73
England Public forest estate Douglas fir Pseudotsuga menziesii DF 14 1 515.31
England Public forest estate Douglas fir Pseudotsuga menziesii DF 16 1 731.95
England Public forest estate Douglas fir Pseudotsuga menziesii DF 18 1 367.82

86
Country Ownership CARBINE tree species Yield class (m3 ha-1 yr-1)
Area (ha)
Common name Latin name Sp. code England Public forest estate Douglas fir Pseudotsuga menziesii DF 20 1 091.27
England Public forest estate Douglas fir Pseudotsuga menziesii DF 22 786.92
England Public forest estate Douglas fir Pseudotsuga menziesii DF 24 979.15
England Public forest estate Douglas fir Pseudotsuga menziesii DF 26 3.95
England Public forest estate Grand fir Abies grandis GF 2 5.37
England Public forest estate Grand fir Abies grandis GF 4 0.59
England Public forest estate Grand fir Abies grandis GF 6 3.97
England Public forest estate Grand fir Abies grandis GF 8 5.01
England Public forest estate Grand fir Abies grandis GF 10 23.80
England Public forest estate Grand fir Abies grandis GF 12 64.91
England Public forest estate Grand fir Abies grandis GF 14 70.04
England Public forest estate Grand fir Abies grandis GF 16 74.22
England Public forest estate Grand fir Abies grandis GF 18 47.51
England Public forest estate Grand fir Abies grandis GF 20 40.02
England Public forest estate Grand fir Abies grandis GF 22 24.18
England Public forest estate Grand fir Abies grandis GF 24 18.41
England Public forest estate Grand fir Abies grandis GF 26 22.14
England Public forest estate Grand fir Abies grandis GF 28 11.01
England Public forest estate Grand fir Abies grandis GF 30 21.48
England Public forest estate Noble fir Abies procera NF 2 1.94
England Public forest estate Noble fir Abies procera NF 4 0.28
England Public forest estate Noble fir Abies procera NF 6 0.77
England Public forest estate Noble fir Abies procera NF 8 4.16

87
Country Ownership CARBINE tree species Yield class (m3 ha-1 yr-1)
Area (ha)
Common name Latin name Sp. code England Public forest estate Noble fir Abies procera NF 10 6.91
England Public forest estate Noble fir Abies procera NF 12 20.46
England Public forest estate Noble fir Abies procera NF 14 22.18
England Public forest estate Noble fir Abies procera NF 16 17.81
England Public forest estate Noble fir Abies procera NF 18 8.70
England Public forest estate Noble fir Abies procera NF 20 7.61
England Public forest estate Noble fir Abies procera NF 22 13.15
England Public forest estate Western hemlock Tsuga heterophylla WH 2 6.51
England Public forest estate Western hemlock Tsuga heterophylla WH 4 0.51
England Public forest estate Western hemlock Tsuga heterophylla WH 6 2.31
England Public forest estate Western hemlock Tsuga heterophylla WH 8 10.52
England Public forest estate Western hemlock Tsuga heterophylla WH 10 26.70
England Public forest estate Western hemlock Tsuga heterophylla WH 12 156.58
England Public forest estate Western hemlock Tsuga heterophylla WH 14 244.65
England Public forest estate Western hemlock Tsuga heterophylla WH 16 265.48
England Public forest estate Western hemlock Tsuga heterophylla WH 18 267.37
England Public forest estate Western hemlock Tsuga heterophylla WH 20 232.70
England Public forest estate Western hemlock Tsuga heterophylla WH 22 113.22
England Public forest estate Western hemlock Tsuga heterophylla WH 24 89.26
England Public forest estate Western red cedar Thuja plicata RC 2 4.69
England Public forest estate Western red cedar Thuja plicata RC 4 11.53
England Public forest estate Western red cedar Thuja plicata RC 6 8.75
England Public forest estate Western red cedar Thuja plicata RC 8 20.34

88
Country Ownership CARBINE tree species Yield class (m3 ha-1 yr-1)
Area (ha)
Common name Latin name Sp. code England Public forest estate Western red cedar Thuja plicata RC 10 96.85
England Public forest estate Western red cedar Thuja plicata RC 12 235.02
England Public forest estate Western red cedar Thuja plicata RC 14 171.38
England Public forest estate Western red cedar Thuja plicata RC 16 175.52
England Public forest estate Western red cedar Thuja plicata RC 18 130.65
England Public forest estate Western red cedar Thuja plicata RC 20 68.83
England Public forest estate Western red cedar Thuja plicata RC 22 42.67
England Public forest estate Western red cedar Thuja plicata RC 24 42.94
England Public forest estate Oak Quercus spp. OK 2 1 594.20
England Public forest estate Oak Quercus spp. OK 4 6 720.47
England Public forest estate Oak Quercus spp. OK 6 4 464.65
England Public forest estate Oak Quercus spp. OK 8 648.40
England Public forest estate Oak Quercus spp. OK 10 50.99
England Public forest estate Oak Quercus spp. OK 12 2.64
England Public forest estate Oak Quercus spp. OK 14 0.60
England Public forest estate Oak Quercus spp. OK 16 1.64
England Public forest estate Ash Fraxinus excelsior AH 2 147.90
England Public forest estate Ash Fraxinus excelsior AH 4 1 107.68
England Public forest estate Ash Fraxinus excelsior AH 6 848.40
England Public forest estate Ash Fraxinus excelsior AH 8 530.96
England Public forest estate Ash Fraxinus excelsior AH 10 283.06
England Public forest estate Ash Fraxinus excelsior AH 12 176.95
England Public forest estate Ash Fraxinus excelsior AH 14 2.53

89
Country Ownership CARBINE tree species Yield class (m3 ha-1 yr-1)
Area (ha)
Common name Latin name Sp. code England Public forest estate Ash Fraxinus excelsior AH 16 0.78
England Public forest estate Beech Fagus sylvatica BE 2 890.77
England Public forest estate Beech Fagus sylvatica BE 4 1 893.77
England Public forest estate Beech Fagus sylvatica BE 6 4 201.67
England Public forest estate Beech Fagus sylvatica BE 8 3 371.16
England Public forest estate Beech Fagus sylvatica BE 10 1 021.60
England Public forest estate Beech Fagus sylvatica BE 12 10.67
England Public forest estate Beech Fagus sylvatica BE 14 1.25
England Public forest estate Birch Betula spp. BI 2 1 249.47
England Public forest estate Birch Betula spp. BI 4 4 189.35
England Public forest estate Birch Betula spp. BI 6 1 268.72
England Public forest estate Birch Betula spp. BI 8 468.80
England Public forest estate Birch Betula spp. BI 10 198.25
England Public forest estate Birch Betula spp. BI 12 249.49
England Public forest estate Birch Betula spp. BI 14 15.32
England Public forest estate Birch Betula spp. BI 16 1.48
England Public forest estate Birch Betula spp. BI 18 0.45
England Public forest estate Sycamore Acer pseudoplatanus SY 2 2 905.16
England Public forest estate Sycamore Acer pseudoplatanus SY 4 5 561.41
England Public forest estate Sycamore Acer pseudoplatanus SY 6 1 545.12
England Public forest estate Sycamore Acer pseudoplatanus SY 8 535.72
England Public forest estate Sycamore Acer pseudoplatanus SY 10 230.56
England Public forest estate Sycamore Acer pseudoplatanus SY 12 1 272.50

90
Country Ownership CARBINE tree species Yield class (m3 ha-1 yr-1)
Area (ha)
Common name Latin name Sp. code England Public forest estate Sycamore Acer pseudoplatanus SY 14 49.68
England Public forest estate Sycamore Acer pseudoplatanus SY 16 3.45
England Public forest estate Sycamore Acer pseudoplatanus SY 18 1.34
England Public forest estate Sycamore Acer pseudoplatanus SY 20 2.77
England Public forest estate Sycamore Acer pseudoplatanus SY 22 0.50
England Public forest estate Poplar Populus. spp. PO 2 37.82
England Public forest estate Poplar Populus. spp. PO 4 139.70
England Public forest estate Poplar Populus. spp. PO 6 127.22
England Public forest estate Poplar Populus. spp. PO 8 67.42
England Public forest estate Poplar Populus. spp. PO 10 54.84
England Public forest estate Poplar Populus. spp. PO 12 5.51
England Public forest estate Poplar Populus. spp. PO 14 44.23
England Public forest estate Poplar Populus. spp. PO 16 7.39
England Public forest estate Poplar Populus. spp. PO 24 3.06
England Public forest estate Nothofagus Nothofagus spp. NO 2 1.32
England Public forest estate Nothofagus Nothofagus spp. NO 4 0.72
England Public forest estate Nothofagus Nothofagus spp. NO 6 6.92
England Public forest estate Nothofagus Nothofagus spp. NO 8 3.48
England Public forest estate Nothofagus Nothofagus spp. NO 10 18.62
England Public forest estate Nothofagus Nothofagus spp. NO 12 7.24
England Public forest estate Nothofagus Nothofagus spp. NO 14 5.09
England Public forest estate Nothofagus Nothofagus spp. NO 16 0.11
England Public forest estate Nothofagus Nothofagus spp. NO 18 0.28

91
Country Ownership CARBINE tree species Yield class (m3 ha-1 yr-1)
Area (ha)
Common name Latin name Sp. code England Private sector Norway spruce Picea abies NS 6 1 219.43
England Private sector Norway spruce Picea abies NS 8 1 668.29
England Private sector Norway spruce Picea abies NS 10 2 120.27
England Private sector Norway spruce Picea abies NS 12 2 344.20
England Private sector Norway spruce Picea abies NS 14 1 936.25
England Private sector Norway spruce Picea abies NS 16 2 572.57
England Private sector Norway spruce Picea abies NS 18 1 589.90
England Private sector Norway spruce Picea abies NS 20 1 389.41
England Private sector Norway spruce Picea abies NS 22 1 954.33
England Private sector Sitka spruce Picea sitchensis SS 6 1 632.77
England Private sector Sitka spruce Picea sitchensis SS 8 1 646.60
England Private sector Sitka spruce Picea sitchensis SS 10 1 628.28
England Private sector Sitka spruce Picea sitchensis SS 12 4 089.11
England Private sector Sitka spruce Picea sitchensis SS 14 5 720.74
England Private sector Sitka spruce Picea sitchensis SS 16 3 810.55
England Private sector Sitka spruce Picea sitchensis SS 18 2 624.40
England Private sector Sitka spruce Picea sitchensis SS 20 3 905.59
England Private sector Sitka spruce Picea sitchensis SS 22 966.52
England Private sector Sitka spruce Picea sitchensis SS 24 1 387.09
England Private sector Sitka spruce Picea sitchensis SS 26 25.31
England Private sector Sitka spruce Picea sitchensis SS 28 0.45
England Private sector Scots pine Pinus sylvestris SP 4 53 723.48
England Private sector Scots pine Pinus sylvestris SP 6 5 052.93

92
Country Ownership CARBINE tree species Yield class (m3 ha-1 yr-1)
Area (ha)
Common name Latin name Sp. code England Private sector Scots pine Pinus sylvestris SP 8 5 955.73
England Private sector Scots pine Pinus sylvestris SP 10 7 598.39
England Private sector Scots pine Pinus sylvestris SP 12 6 447.39
England Private sector Scots pine Pinus sylvestris SP 14 11 211.09
England Private sector Corsican pine Pinus nigra ssp. laricio CP 6 643.09
England Private sector Corsican pine Pinus nigra ssp. laricio CP 8 1 111.16
England Private sector Corsican pine Pinus nigra ssp. laricio CP 10 2 549.02
England Private sector Corsican pine Pinus nigra ssp. laricio CP 12 1 906.35
England Private sector Corsican pine Pinus nigra ssp. laricio CP 14 2 149.54
England Private sector Corsican pine Pinus nigra ssp. laricio CP 16 1 605.08
England Private sector Corsican pine Pinus nigra ssp. laricio CP 18 751.74
England Private sector Corsican pine Pinus nigra ssp. laricio CP 20 595.06
England Private sector Lodgepole pine Pinus contorta LP 4 458.01
England Private sector Lodgepole pine Pinus contorta LP 6 4 095.11
England Private sector Lodgepole pine Pinus contorta LP 8 2 248.89
England Private sector Lodgepole pine Pinus contorta LP 10 1 272.21
England Private sector Lodgepole pine Pinus contorta LP 12 1 398.52
England Private sector Lodgepole pine Pinus contorta LP 14 172.87
England Private sector Lodgepole pine Pinus contorta LP 16 17.58
England Private sector Lodgepole pine Pinus contorta LP 18 7.09
England Private sector Lodgepole pine Pinus contorta LP 20 94.18
England Private sector European larch Larix decidua EL 2 95.63
England Private sector European larch Larix decidua EL 4 378.18

93
Country Ownership CARBINE tree species Yield class (m3 ha-1 yr-1)
Area (ha)
Common name Latin name Sp. code England Private sector European larch Larix decidua EL 6 968.92
England Private sector European larch Larix decidua EL 8 1 080.41
England Private sector European larch Larix decidua EL 10 675.73
England Private sector European larch Larix decidua EL 12 829.63
England Private sector European larch Larix decidua EL 14 17.98
England Private sector Japanese/hybrid larch Larix kaempferi/L. JL 2 131.81
England Private sector Japanese/hybrid larch Larix kaempferi/L. JL 4 1 298.48
England Private sector Japanese/hybrid larch Larix kaempferi/L. JL 6 2 500.55
England Private sector Japanese/hybrid larch Larix kaempferi/L. JL 8 3 578.99
England Private sector Japanese/hybrid larch Larix kaempferi/L. JL 10 4 262.56
England Private sector Japanese/hybrid larch Larix kaempferi/L. JL 12 4 290.30
England Private sector Japanese/hybrid larch Larix kaempferi/L. JL 14 5 469.80
England Private sector Douglas fir Pseudotsuga menziesii DF 8 2 988.10
England Private sector Douglas fir Pseudotsuga menziesii DF 10 2 625.63
England Private sector Douglas fir Pseudotsuga menziesii DF 12 1 953.35
England Private sector Douglas fir Pseudotsuga menziesii DF 14 1 923.64
England Private sector Douglas fir Pseudotsuga menziesii DF 16 1 379.39
England Private sector Douglas fir Pseudotsuga menziesii DF 18 908.43
England Private sector Douglas fir Pseudotsuga menziesii DF 20 765.43
England Private sector Douglas fir Pseudotsuga menziesii DF 22 309.10
England Private sector Douglas fir Pseudotsuga menziesii DF 24 495.39
England Private sector Douglas fir Pseudotsuga menziesii DF 26 2.00
England Private sector Grand fir Abies grandis GF 8 101.90

94
Country Ownership CARBINE tree species Yield class (m3 ha-1 yr-1)
Area (ha)
Common name Latin name Sp. code England Private sector Grand fir Abies grandis GF 10 137.11
England Private sector Grand fir Abies grandis GF 12 110.57
England Private sector Grand fir Abies grandis GF 14 89.47
England Private sector Grand fir Abies grandis GF 16 59.12
England Private sector Grand fir Abies grandis GF 18 29.66
England Private sector Grand fir Abies grandis GF 20 28.29
England Private sector Grand fir Abies grandis GF 22 9.40
England Private sector Grand fir Abies grandis GF 24 9.34
England Private sector Grand fir Abies grandis GF 26 11.24
England Private sector Grand fir Abies grandis GF 28 5.59
England Private sector Grand fir Abies grandis GF 30 10.90
England Private sector Noble fir Abies procera NF 8 56.88
England Private sector Noble fir Abies procera NF 10 32.55
England Private sector Noble fir Abies procera NF 12 26.68
England Private sector Noble fir Abies procera NF 14 24.93
England Private sector Noble fir Abies procera NF 16 11.86
England Private sector Noble fir Abies procera NF 18 4.51
England Private sector Noble fir Abies procera NF 20 4.78
England Private sector Noble fir Abies procera NF 22 5.07
England Private sector Western hemlock Tsuga heterophylla WH 4 0.34
England Private sector Western hemlock Tsuga heterophylla WH 6 9.17
England Private sector Western hemlock Tsuga heterophylla WH 8 17.69
England Private sector Western hemlock Tsuga heterophylla WH 10 78.14
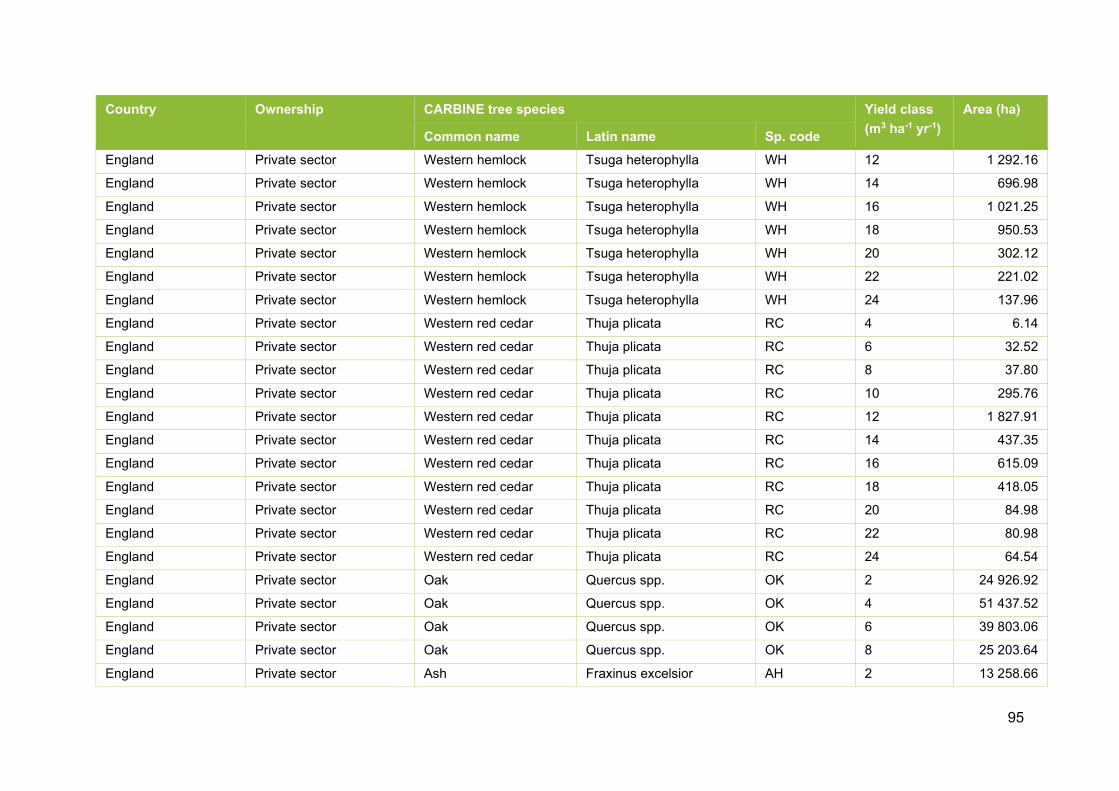
95
Country Ownership CARBINE tree species Yield class (m3 ha-1 yr-1)
Area (ha)
Common name Latin name Sp. code England Private sector Western hemlock Tsuga heterophylla WH 12 1 292.16
England Private sector Western hemlock Tsuga heterophylla WH 14 696.98
England Private sector Western hemlock Tsuga heterophylla WH 16 1 021.25
England Private sector Western hemlock Tsuga heterophylla WH 18 950.53
England Private sector Western hemlock Tsuga heterophylla WH 20 302.12
England Private sector Western hemlock Tsuga heterophylla WH 22 221.02
England Private sector Western hemlock Tsuga heterophylla WH 24 137.96
England Private sector Western red cedar Thuja plicata RC 4 6.14
England Private sector Western red cedar Thuja plicata RC 6 32.52
England Private sector Western red cedar Thuja plicata RC 8 37.80
England Private sector Western red cedar Thuja plicata RC 10 295.76
England Private sector Western red cedar Thuja plicata RC 12 1 827.91
England Private sector Western red cedar Thuja plicata RC 14 437.35
England Private sector Western red cedar Thuja plicata RC 16 615.09
England Private sector Western red cedar Thuja plicata RC 18 418.05
England Private sector Western red cedar Thuja plicata RC 20 84.98
England Private sector Western red cedar Thuja plicata RC 22 80.98
England Private sector Western red cedar Thuja plicata RC 24 64.54
England Private sector Oak Quercus spp. OK 2 24 926.92
England Private sector Oak Quercus spp. OK 4 51 437.52
England Private sector Oak Quercus spp. OK 6 39 803.06
England Private sector Oak Quercus spp. OK 8 25 203.64
England Private sector Ash Fraxinus excelsior AH 2 13 258.66

96
Country Ownership CARBINE tree species Yield class (m3 ha-1 yr-1)
Area (ha)
Common name Latin name Sp. code England Private sector Ash Fraxinus excelsior AH 4 19 206.27
England Private sector Ash Fraxinus excelsior AH 6 18 725.89
England Private sector Ash Fraxinus excelsior AH 8 16 968.30
England Private sector Ash Fraxinus excelsior AH 10 12 058.90
England Private sector Ash Fraxinus excelsior AH 12 23 249.37
England Private sector Beech Fagus sylvatica BE 4 22 832.56
England Private sector Beech Fagus sylvatica BE 6 29 695.75
England Private sector Beech Fagus sylvatica BE 8 21 671.82
England Private sector Beech Fagus sylvatica BE 10 15 367.07
England Private sector Birch Betula spp. BI 2 25 826.94
England Private sector Birch Betula spp. BI 4 26 028.27
England Private sector Birch Betula spp. BI 6 21 885.44
England Private sector Birch Betula spp. BI 8 12 392.88
England Private sector Birch Betula spp. BI 10 6 888.82
England Private sector Birch Betula spp. BI 12 9 215.21
England Private sector Sycamore Acer pseudoplatanus SY 2 373 383.95
England Private sector Sycamore Acer pseudoplatanus SY 4 14 576.79
England Private sector Sycamore Acer pseudoplatanus SY 6 13 901.14
England Private sector Sycamore Acer pseudoplatanus SY 8 9 565.10
England Private sector Sycamore Acer pseudoplatanus SY 10 6 443.98
England Private sector Sycamore Acer pseudoplatanus SY 12 9 594.88
England Private sector Poplar Populus. spp. PO 2 118 591.60
England Private sector Poplar Populus. spp. PO 4 54 213.21

97
Country Ownership CARBINE tree species Yield class (m3 ha-1 yr-1)
Area (ha)
Common name Latin name Sp. code England Private sector Poplar Populus. spp. PO 6 24 261.08
England Private sector Poplar Populus. spp. PO 8 24 499.13
England Private sector Poplar Populus. spp. PO 10 3 092.12
England Private sector Poplar Populus. spp. PO 12 1 049.03
England Private sector Poplar Populus. spp. PO 14 1 057.24
England Private sector Nothofagus Nothofagus spp. NO 2 5 883.95
England Private sector Nothofagus Nothofagus spp. NO 4 401.98
England Private sector Nothofagus Nothofagus spp. NO 6 1 900.39
England Private sector Nothofagus Nothofagus spp. NO 8 1 822.52
England Private sector Nothofagus Nothofagus spp. NO 10 1 499.72
England Private sector Nothofagus Nothofagus spp. NO 12 1 960.09
England Private sector Nothofagus Nothofagus spp. NO 14 175.65
England Private sector Nothofagus Nothofagus spp. NO 18 68.65
Scotland Public forest estate Norway spruce Picea abies NS 2 244.35
Scotland Public forest estate Norway spruce Picea abies NS 4 251.23
Scotland Public forest estate Norway spruce Picea abies NS 6 555.15
Scotland Public forest estate Norway spruce Picea abies NS 8 1 050.93
Scotland Public forest estate Norway spruce Picea abies NS 10 1 681.33
Scotland Public forest estate Norway spruce Picea abies NS 12 2 795.70
Scotland Public forest estate Norway spruce Picea abies NS 14 2 680.04
Scotland Public forest estate Norway spruce Picea abies NS 16 1 560.68
Scotland Public forest estate Norway spruce Picea abies NS 18 697.91
Scotland Public forest estate Norway spruce Picea abies NS 20 279.12

98
Country Ownership CARBINE tree species Yield class (m3 ha-1 yr-1)
Area (ha)
Common name Latin name Sp. code Scotland Public forest estate Norway spruce Picea abies NS 22 107.43
Scotland Public forest estate Norway spruce Picea abies NS 24 6.74
Scotland Public forest estate Norway spruce Picea abies NS 26 0.62
Scotland Public forest estate Sitka spruce Picea sitchensis SS 2 2 169.99
Scotland Public forest estate Sitka spruce Picea sitchensis SS 4 2 797.68
Scotland Public forest estate Sitka spruce Picea sitchensis SS 6 4 604.14
Scotland Public forest estate Sitka spruce Picea sitchensis SS 8 8 908.19
Scotland Public forest estate Sitka spruce Picea sitchensis SS 10 15 335.47
Scotland Public forest estate Sitka spruce Picea sitchensis SS 12 33 638.20
Scotland Public forest estate Sitka spruce Picea sitchensis SS 14 41 891.11
Scotland Public forest estate Sitka spruce Picea sitchensis SS 16 46 786.60
Scotland Public forest estate Sitka spruce Picea sitchensis SS 18 21 701.57
Scotland Public forest estate Sitka spruce Picea sitchensis SS 20 11 153.74
Scotland Public forest estate Sitka spruce Picea sitchensis SS 22 5 562.06
Scotland Public forest estate Sitka spruce Picea sitchensis SS 24 6 179.28
Scotland Public forest estate Sitka spruce Picea sitchensis SS 26 357.22
Scotland Public forest estate Sitka spruce Picea sitchensis SS 28 0.07
Scotland Public forest estate Sitka spruce Picea sitchensis SS 30 0.32
Scotland Public forest estate Scots pine Pinus sylvestris SP 2 2 013.94
Scotland Public forest estate Scots pine Pinus sylvestris SP 4 2 546.58
Scotland Public forest estate Scots pine Pinus sylvestris SP 6 6 971.96
Scotland Public forest estate Scots pine Pinus sylvestris SP 8 14 827.42
Scotland Public forest estate Scots pine Pinus sylvestris SP 10 10 193.65

99
Country Ownership CARBINE tree species Yield class (m3 ha-1 yr-1)
Area (ha)
Common name Latin name Sp. code Scotland Public forest estate Scots pine Pinus sylvestris SP 12 3 294.01
Scotland Public forest estate Scots pine Pinus sylvestris SP 14 678.96
Scotland Public forest estate Scots pine Pinus sylvestris SP 16 44.14
Scotland Public forest estate Scots pine Pinus sylvestris SP 18 1.35
Scotland Public forest estate Corsican pine Pinus nigra ssp. laricio CP 2 1.88
Scotland Public forest estate Corsican pine Pinus nigra ssp. laricio CP 4 42.74
Scotland Public forest estate Corsican pine Pinus nigra ssp. laricio CP 6 306.46
Scotland Public forest estate Corsican pine Pinus nigra ssp. laricio CP 8 368.48
Scotland Public forest estate Corsican pine Pinus nigra ssp. laricio CP 10 328.75
Scotland Public forest estate Corsican pine Pinus nigra ssp. laricio CP 12 220.57
Scotland Public forest estate Corsican pine Pinus nigra ssp. laricio CP 14 32.95
Scotland Public forest estate Corsican pine Pinus nigra ssp. laricio CP 16 1.29
Scotland Public forest estate Corsican pine Pinus nigra ssp. laricio CP 18 2.49
Scotland Public forest estate Lodgepole pine Pinus contorta LP 2 715.84
Scotland Public forest estate Lodgepole pine Pinus contorta LP 4 4 640.04
Scotland Public forest estate Lodgepole pine Pinus contorta LP 6 12 076.31
Scotland Public forest estate Lodgepole pine Pinus contorta LP 8 12 636.77
Scotland Public forest estate Lodgepole pine Pinus contorta LP 10 4 925.37
Scotland Public forest estate Lodgepole pine Pinus contorta LP 12 914.53
Scotland Public forest estate Lodgepole pine Pinus contorta LP 14 246.72
Scotland Public forest estate Lodgepole pine Pinus contorta LP 16 36.11
Scotland Public forest estate Lodgepole pine Pinus contorta LP 20 0.41
Scotland Public forest estate European larch Larix decidua EL 2 75.07

100
Country Ownership CARBINE tree species Yield class (m3 ha-1 yr-1)
Area (ha)
Common name Latin name Sp. code Scotland Public forest estate European larch Larix decidua EL 4 268.07
Scotland Public forest estate European larch Larix decidua EL 6 648.68
Scotland Public forest estate European larch Larix decidua EL 8 848.64
Scotland Public forest estate European larch Larix decidua EL 10 692.82
Scotland Public forest estate European larch Larix decidua EL 12 697.94
Scotland Public forest estate European larch Larix decidua EL 14 63.67
Scotland Public forest estate European larch Larix decidua EL 16 0.17
Scotland Public forest estate European larch Larix decidua EL 18 0.11
Scotland Public forest estate Japanese/hybrid larch Larix kaempferi/L. JL 2 206.45
Scotland Public forest estate Japanese/hybrid larch Larix kaempferi/L. JL 4 1 388.99
Scotland Public forest estate Japanese/hybrid larch Larix kaempferi/L. JL 6 2 629.57
Scotland Public forest estate Japanese/hybrid larch Larix kaempferi/L. JL 8 4 739.09
Scotland Public forest estate Japanese/hybrid larch Larix kaempferi/L. JL 10 5 309.96
Scotland Public forest estate Japanese/hybrid larch Larix kaempferi/L. JL 12 3 931.84
Scotland Public forest estate Japanese/hybrid larch Larix kaempferi/L. JL 14 1 625.04
Scotland Public forest estate Japanese/hybrid larch Larix kaempferi/L. JL 16 157.47
Scotland Public forest estate Japanese/hybrid larch Larix kaempferi/L. JL 18 0.30
Scotland Public forest estate Japanese/hybrid larch Larix kaempferi/L. JL 20 0.48
Scotland Public forest estate Douglas fir Pseudotsuga menziesii DF 2 16.37
Scotland Public forest estate Douglas fir Pseudotsuga menziesii DF 4 10.34
Scotland Public forest estate Douglas fir Pseudotsuga menziesii DF 6 24.13
Scotland Public forest estate Douglas fir Pseudotsuga menziesii DF 8 139.55
Scotland Public forest estate Douglas fir Pseudotsuga menziesii DF 10 452.20

101
Country Ownership CARBINE tree species Yield class (m3 ha-1 yr-1)
Area (ha)
Common name Latin name Sp. code Scotland Public forest estate Douglas fir Pseudotsuga menziesii DF 12 756.76
Scotland Public forest estate Douglas fir Pseudotsuga menziesii DF 14 990.63
Scotland Public forest estate Douglas fir Pseudotsuga menziesii DF 16 1 075.01
Scotland Public forest estate Douglas fir Pseudotsuga menziesii DF 18 600.17
Scotland Public forest estate Douglas fir Pseudotsuga menziesii DF 20 367.47
Scotland Public forest estate Douglas fir Pseudotsuga menziesii DF 22 156.96
Scotland Public forest estate Douglas fir Pseudotsuga menziesii DF 24 148.24
Scotland Public forest estate Douglas fir Pseudotsuga menziesii DF 26 1.25
Scotland Public forest estate Grand fir Abies grandis GF 2 6.83
Scotland Public forest estate Grand fir Abies grandis GF 4 3.53
Scotland Public forest estate Grand fir Abies grandis GF 6 0.19
Scotland Public forest estate Grand fir Abies grandis GF 8 3.05
Scotland Public forest estate Grand fir Abies grandis GF 10 12.41
Scotland Public forest estate Grand fir Abies grandis GF 12 42.24
Scotland Public forest estate Grand fir Abies grandis GF 14 38.04
Scotland Public forest estate Grand fir Abies grandis GF 16 46.87
Scotland Public forest estate Grand fir Abies grandis GF 18 27.55
Scotland Public forest estate Grand fir Abies grandis GF 20 45.37
Scotland Public forest estate Grand fir Abies grandis GF 22 31.72
Scotland Public forest estate Grand fir Abies grandis GF 24 12.96
Scotland Public forest estate Grand fir Abies grandis GF 26 7.56
Scotland Public forest estate Grand fir Abies grandis GF 28 10.19
Scotland Public forest estate Grand fir Abies grandis GF 30 5.69

102
Country Ownership CARBINE tree species Yield class (m3 ha-1 yr-1)
Area (ha)
Common name Latin name Sp. code Scotland Public forest estate Noble fir Abies procera NF 2 22.56
Scotland Public forest estate Noble fir Abies procera NF 4 14.83
Scotland Public forest estate Noble fir Abies procera NF 6 7.74
Scotland Public forest estate Noble fir Abies procera NF 8 31.74
Scotland Public forest estate Noble fir Abies procera NF 10 74.29
Scotland Public forest estate Noble fir Abies procera NF 12 121.96
Scotland Public forest estate Noble fir Abies procera NF 14 125.96
Scotland Public forest estate Noble fir Abies procera NF 16 86.73
Scotland Public forest estate Noble fir Abies procera NF 18 31.10
Scotland Public forest estate Noble fir Abies procera NF 20 22.54
Scotland Public forest estate Noble fir Abies procera NF 22 42.92
Scotland Public forest estate Noble fir Abies procera NF 24 5.29
Scotland Public forest estate Noble fir Abies procera NF 26 0.16
Scotland Public forest estate Noble fir Abies procera NF 28 0.41
Scotland Public forest estate Western hemlock Tsuga heterophylla WH 2 6.23
Scotland Public forest estate Western hemlock Tsuga heterophylla WH 4 2.55
Scotland Public forest estate Western hemlock Tsuga heterophylla WH 6 8.13
Scotland Public forest estate Western hemlock Tsuga heterophylla WH 8 24.54
Scotland Public forest estate Western hemlock Tsuga heterophylla WH 10 27.98
Scotland Public forest estate Western hemlock Tsuga heterophylla WH 12 95.23
Scotland Public forest estate Western hemlock Tsuga heterophylla WH 14 98.05
Scotland Public forest estate Western hemlock Tsuga heterophylla WH 16 70.76
Scotland Public forest estate Western hemlock Tsuga heterophylla WH 18 67.54

103
Country Ownership CARBINE tree species Yield class (m3 ha-1 yr-1)
Area (ha)
Common name Latin name Sp. code Scotland Public forest estate Western hemlock Tsuga heterophylla WH 20 42.29
Scotland Public forest estate Western hemlock Tsuga heterophylla WH 22 23.27
Scotland Public forest estate Western hemlock Tsuga heterophylla WH 24 17.13
Scotland Public forest estate Western hemlock Tsuga heterophylla WH 26 3.64
Scotland Public forest estate Western red cedar Thuja plicata RC 2 3.33
Scotland Public forest estate Western red cedar Thuja plicata RC 4 5.27
Scotland Public forest estate Western red cedar Thuja plicata RC 6 3.72
Scotland Public forest estate Western red cedar Thuja plicata RC 8 13.41
Scotland Public forest estate Western red cedar Thuja plicata RC 10 11.03
Scotland Public forest estate Western red cedar Thuja plicata RC 12 26.60
Scotland Public forest estate Western red cedar Thuja plicata RC 14 19.51
Scotland Public forest estate Western red cedar Thuja plicata RC 16 20.60
Scotland Public forest estate Western red cedar Thuja plicata RC 18 9.53
Scotland Public forest estate Western red cedar Thuja plicata RC 20 6.91
Scotland Public forest estate Western red cedar Thuja plicata RC 22 0.16
Scotland Public forest estate Western red cedar Thuja plicata RC 24 0.87
Scotland Public forest estate Oak Quercus spp. OK 2 1 096.32
Scotland Public forest estate Oak Quercus spp. OK 4 1 168.94
Scotland Public forest estate Oak Quercus spp. OK 6 199.02
Scotland Public forest estate Oak Quercus spp. OK 8 22.10
Scotland Public forest estate Oak Quercus spp. OK 10 6.10
Scotland Public forest estate Oak Quercus spp. OK 12 1.31
Scotland Public forest estate Oak Quercus spp. OK 14 4.19

104
Country Ownership CARBINE tree species Yield class (m3 ha-1 yr-1)
Area (ha)
Common name Latin name Sp. code Scotland Public forest estate Oak Quercus spp. OK 16 2.45
Scotland Public forest estate Ash Fraxinus excelsior AH 2 126.39
Scotland Public forest estate Ash Fraxinus excelsior AH 4 120.58
Scotland Public forest estate Ash Fraxinus excelsior AH 6 98.53
Scotland Public forest estate Ash Fraxinus excelsior AH 8 87.39
Scotland Public forest estate Ash Fraxinus excelsior AH 10 4.55
Scotland Public forest estate Ash Fraxinus excelsior AH 12 2.58
Scotland Public forest estate Ash Fraxinus excelsior AH 16 0.46
Scotland Public forest estate Ash Fraxinus excelsior AH 20 0.83
Scotland Public forest estate Beech Fagus sylvatica BE 2 154.34
Scotland Public forest estate Beech Fagus sylvatica BE 4 194.61
Scotland Public forest estate Beech Fagus sylvatica BE 6 216.75
Scotland Public forest estate Beech Fagus sylvatica BE 8 38.31
Scotland Public forest estate Beech Fagus sylvatica BE 10 5.50
Scotland Public forest estate Beech Fagus sylvatica BE 12 1.45
Scotland Public forest estate Beech Fagus sylvatica BE 14 1.38
Scotland Public forest estate Beech Fagus sylvatica BE 18 0.13
Scotland Public forest estate Birch Betula spp. BI 2 6 092.91
Scotland Public forest estate Birch Betula spp. BI 4 3 696.68
Scotland Public forest estate Birch Betula spp. BI 6 1 370.76
Scotland Public forest estate Birch Betula spp. BI 8 222.23
Scotland Public forest estate Birch Betula spp. BI 10 79.89
Scotland Public forest estate Birch Betula spp. BI 12 42.33

105
Country Ownership CARBINE tree species Yield class (m3 ha-1 yr-1)
Area (ha)
Common name Latin name Sp. code Scotland Public forest estate Birch Betula spp. BI 14 17.17
Scotland Public forest estate Birch Betula spp. BI 16 2.58
Scotland Public forest estate Birch Betula spp. BI 18 0.81
Scotland Public forest estate Birch Betula spp. BI 22 0.09
Scotland Public forest estate Sycamore Acer pseudoplatanus SY 2 7 523.46
Scotland Public forest estate Sycamore Acer pseudoplatanus SY 4 3 256.77
Scotland Public forest estate Sycamore Acer pseudoplatanus SY 6 1 548.72
Scotland Public forest estate Sycamore Acer pseudoplatanus SY 8 176.70
Scotland Public forest estate Sycamore Acer pseudoplatanus SY 10 50.77
Scotland Public forest estate Sycamore Acer pseudoplatanus SY 12 94.36
Scotland Public forest estate Sycamore Acer pseudoplatanus SY 14 41.15
Scotland Public forest estate Sycamore Acer pseudoplatanus SY 16 11.53
Scotland Public forest estate Sycamore Acer pseudoplatanus SY 18 14.60
Scotland Public forest estate Sycamore Acer pseudoplatanus SY 20 1.04
Scotland Public forest estate Sycamore Acer pseudoplatanus SY 24 0.10
Scotland Public forest estate Poplar Populus. spp. PO 2 24.14
Scotland Public forest estate Poplar Populus. spp. PO 4 23.54
Scotland Public forest estate Poplar Populus. spp. PO 6 10.32
Scotland Public forest estate Poplar Populus. spp. PO 8 6.27
Scotland Public forest estate Poplar Populus. spp. PO 10 1.00
Scotland Public forest estate Poplar Populus. spp. PO 12 0.15
Scotland Public forest estate Poplar Populus. spp. PO 14 0.13
Scotland Public forest estate Nothofagus Nothofagus spp. NO 2 1.02

106
Country Ownership CARBINE tree species Yield class (m3 ha-1 yr-1)
Area (ha)
Common name Latin name Sp. code Scotland Public forest estate Nothofagus Nothofagus spp. NO 4 2.69
Scotland Public forest estate Nothofagus Nothofagus spp. NO 6 1.10
Scotland Public forest estate Nothofagus Nothofagus spp. NO 8 0.88
Scotland Public forest estate Nothofagus Nothofagus spp. NO 10 3.73
Scotland Public forest estate Nothofagus Nothofagus spp. NO 12 0.82
Scotland Public forest estate Nothofagus Nothofagus spp. NO 14 1.23
Scotland Public forest estate Nothofagus Nothofagus spp. NO 18 0.06
Scotland Private sector Norway spruce Picea abies NS 6 697.42
Scotland Private sector Norway spruce Picea abies NS 8 841.98
Scotland Private sector Norway spruce Picea abies NS 10 1 465.80
Scotland Private sector Norway spruce Picea abies NS 12 1 983.90
Scotland Private sector Norway spruce Picea abies NS 14 2 145.31
Scotland Private sector Norway spruce Picea abies NS 16 2 637.39
Scotland Private sector Norway spruce Picea abies NS 18 1 633.42
Scotland Private sector Norway spruce Picea abies NS 20 1 114.91
Scotland Private sector Norway spruce Picea abies NS 22 1 658.20
Scotland Private sector Sitka spruce Picea sitchensis SS 6 18 055.56
Scotland Private sector Sitka spruce Picea sitchensis SS 8 18 425.92
Scotland Private sector Sitka spruce Picea sitchensis SS 10 25 210.01
Scotland Private sector Sitka spruce Picea sitchensis SS 12 33 018.28
Scotland Private sector Sitka spruce Picea sitchensis SS 14 42 390.75
Scotland Private sector Sitka spruce Picea sitchensis SS 16 38 227.05
Scotland Private sector Sitka spruce Picea sitchensis SS 18 36 751.30
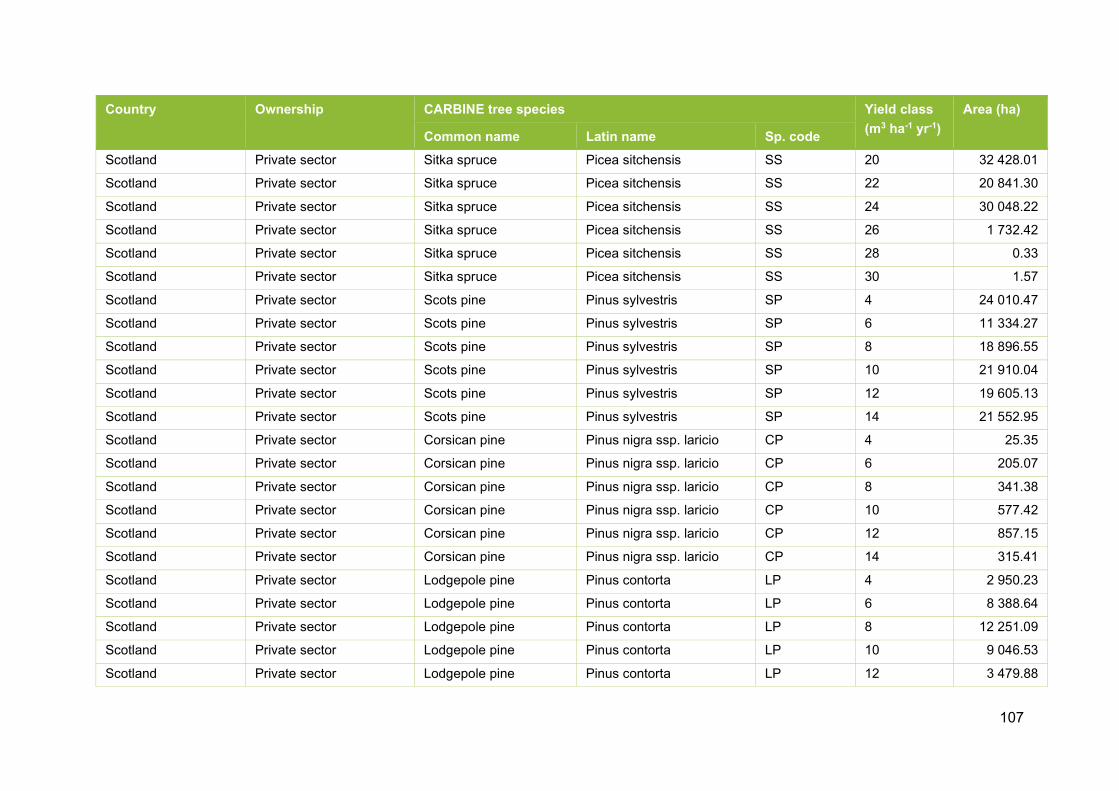
107
Country Ownership CARBINE tree species Yield class (m3 ha-1 yr-1)
Area (ha)
Common name Latin name Sp. code Scotland Private sector Sitka spruce Picea sitchensis SS 20 32 428.01
Scotland Private sector Sitka spruce Picea sitchensis SS 22 20 841.30
Scotland Private sector Sitka spruce Picea sitchensis SS 24 30 048.22
Scotland Private sector Sitka spruce Picea sitchensis SS 26 1 732.42
Scotland Private sector Sitka spruce Picea sitchensis SS 28 0.33
Scotland Private sector Sitka spruce Picea sitchensis SS 30 1.57
Scotland Private sector Scots pine Pinus sylvestris SP 4 24 010.47
Scotland Private sector Scots pine Pinus sylvestris SP 6 11 334.27
Scotland Private sector Scots pine Pinus sylvestris SP 8 18 896.55
Scotland Private sector Scots pine Pinus sylvestris SP 10 21 910.04
Scotland Private sector Scots pine Pinus sylvestris SP 12 19 605.13
Scotland Private sector Scots pine Pinus sylvestris SP 14 21 552.95
Scotland Private sector Corsican pine Pinus nigra ssp. laricio CP 4 25.35
Scotland Private sector Corsican pine Pinus nigra ssp. laricio CP 6 205.07
Scotland Private sector Corsican pine Pinus nigra ssp. laricio CP 8 341.38
Scotland Private sector Corsican pine Pinus nigra ssp. laricio CP 10 577.42
Scotland Private sector Corsican pine Pinus nigra ssp. laricio CP 12 857.15
Scotland Private sector Corsican pine Pinus nigra ssp. laricio CP 14 315.41
Scotland Private sector Lodgepole pine Pinus contorta LP 4 2 950.23
Scotland Private sector Lodgepole pine Pinus contorta LP 6 8 388.64
Scotland Private sector Lodgepole pine Pinus contorta LP 8 12 251.09
Scotland Private sector Lodgepole pine Pinus contorta LP 10 9 046.53
Scotland Private sector Lodgepole pine Pinus contorta LP 12 3 479.88
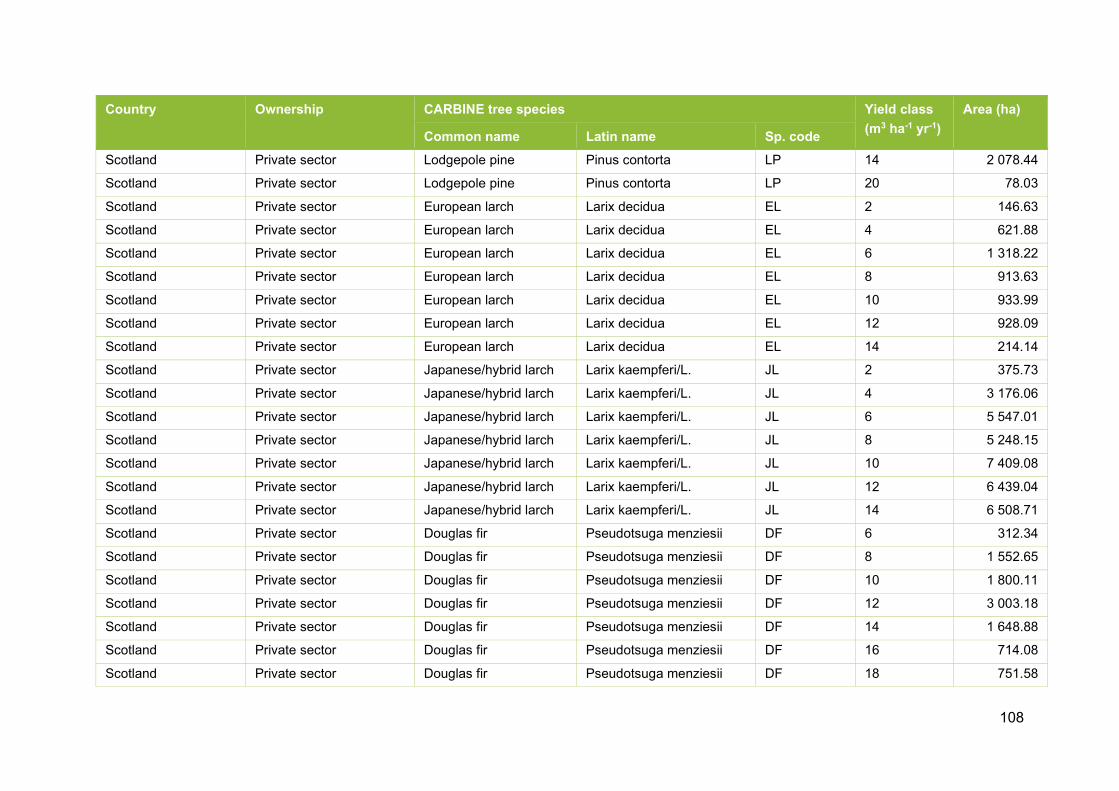
108
Country Ownership CARBINE tree species Yield class (m3 ha-1 yr-1)
Area (ha)
Common name Latin name Sp. code Scotland Private sector Lodgepole pine Pinus contorta LP 14 2 078.44
Scotland Private sector Lodgepole pine Pinus contorta LP 20 78.03
Scotland Private sector European larch Larix decidua EL 2 146.63
Scotland Private sector European larch Larix decidua EL 4 621.88
Scotland Private sector European larch Larix decidua EL 6 1 318.22
Scotland Private sector European larch Larix decidua EL 8 913.63
Scotland Private sector European larch Larix decidua EL 10 933.99
Scotland Private sector European larch Larix decidua EL 12 928.09
Scotland Private sector European larch Larix decidua EL 14 214.14
Scotland Private sector Japanese/hybrid larch Larix kaempferi/L. JL 2 375.73
Scotland Private sector Japanese/hybrid larch Larix kaempferi/L. JL 4 3 176.06
Scotland Private sector Japanese/hybrid larch Larix kaempferi/L. JL 6 5 547.01
Scotland Private sector Japanese/hybrid larch Larix kaempferi/L. JL 8 5 248.15
Scotland Private sector Japanese/hybrid larch Larix kaempferi/L. JL 10 7 409.08
Scotland Private sector Japanese/hybrid larch Larix kaempferi/L. JL 12 6 439.04
Scotland Private sector Japanese/hybrid larch Larix kaempferi/L. JL 14 6 508.71
Scotland Private sector Douglas fir Pseudotsuga menziesii DF 6 312.34
Scotland Private sector Douglas fir Pseudotsuga menziesii DF 8 1 552.65
Scotland Private sector Douglas fir Pseudotsuga menziesii DF 10 1 800.11
Scotland Private sector Douglas fir Pseudotsuga menziesii DF 12 3 003.18
Scotland Private sector Douglas fir Pseudotsuga menziesii DF 14 1 648.88
Scotland Private sector Douglas fir Pseudotsuga menziesii DF 16 714.08
Scotland Private sector Douglas fir Pseudotsuga menziesii DF 18 751.58

109
Country Ownership CARBINE tree species Yield class (m3 ha-1 yr-1)
Area (ha)
Common name Latin name Sp. code Scotland Private sector Douglas fir Pseudotsuga menziesii DF 20 266.37
Scotland Private sector Douglas fir Pseudotsuga menziesii DF 22 718.14
Scotland Private sector Douglas fir Pseudotsuga menziesii DF 24 503.67
Scotland Private sector Douglas fir Pseudotsuga menziesii DF 26 4.24
Scotland Private sector Grand fir Abies grandis GF 6 2.45
Scotland Private sector Grand fir Abies grandis GF 8 30.81
Scotland Private sector Grand fir Abies grandis GF 10 39.05
Scotland Private sector Grand fir Abies grandis GF 12 150.43
Scotland Private sector Grand fir Abies grandis GF 14 67.61
Scotland Private sector Grand fir Abies grandis GF 16 32.66
Scotland Private sector Grand fir Abies grandis GF 18 38.03
Scotland Private sector Grand fir Abies grandis GF 20 33.84
Scotland Private sector Grand fir Abies grandis GF 22 154.39
Scotland Private sector Grand fir Abies grandis GF 24 44.52
Scotland Private sector Grand fir Abies grandis GF 26 25.97
Scotland Private sector Grand fir Abies grandis GF 28 35.00
Scotland Private sector Grand fir Abies grandis GF 30 19.55
Scotland Private sector Noble fir Abies procera NF 6 91.97
Scotland Private sector Noble fir Abies procera NF 8 327.64
Scotland Private sector Noble fir Abies procera NF 10 247.15
Scotland Private sector Noble fir Abies procera NF 12 366.16
Scotland Private sector Noble fir Abies procera NF 14 178.16
Scotland Private sector Noble fir Abies procera NF 16 50.42

110
Country Ownership CARBINE tree species Yield class (m3 ha-1 yr-1)
Area (ha)
Common name Latin name Sp. code Scotland Private sector Noble fir Abies procera NF 18 37.23
Scotland Private sector Noble fir Abies procera NF 20 15.25
Scotland Private sector Noble fir Abies procera NF 22 189.57
Scotland Private sector Noble fir Abies procera NF 24 16.51
Scotland Private sector Noble fir Abies procera NF 26 0.49
Scotland Private sector Noble fir Abies procera NF 28 1.27
Scotland Private sector Western hemlock Tsuga heterophylla WH 6 97.81
Scotland Private sector Western hemlock Tsuga heterophylla WH 8 264.75
Scotland Private sector Western hemlock Tsuga heterophylla WH 10 108.28
Scotland Private sector Western hemlock Tsuga heterophylla WH 12 378.79
Scotland Private sector Western hemlock Tsuga heterophylla WH 14 145.11
Scotland Private sector Western hemlock Tsuga heterophylla WH 16 50.10
Scotland Private sector Western hemlock Tsuga heterophylla WH 18 91.60
Scotland Private sector Western hemlock Tsuga heterophylla WH 20 29.76
Scotland Private sector Western hemlock Tsuga heterophylla WH 22 106.83
Scotland Private sector Western hemlock Tsuga heterophylla WH 24 55.51
Scotland Private sector Western hemlock Tsuga heterophylla WH 26 11.79
Scotland Private sector Western red cedar Thuja plicata RC 6 43.72
Scotland Private sector Western red cedar Thuja plicata RC 8 126.33
Scotland Private sector Western red cedar Thuja plicata RC 10 32.49
Scotland Private sector Western red cedar Thuja plicata RC 12 81.20
Scotland Private sector Western red cedar Thuja plicata RC 14 25.31
Scotland Private sector Western red cedar Thuja plicata RC 16 11.64

111
Country Ownership CARBINE tree species Yield class (m3 ha-1 yr-1)
Area (ha)
Common name Latin name Sp. code Scotland Private sector Western red cedar Thuja plicata RC 18 12.29
Scotland Private sector Western red cedar Thuja plicata RC 20 4.62
Scotland Private sector Western red cedar Thuja plicata RC 22 0.70
Scotland Private sector Western red cedar Thuja plicata RC 24 2.69
Scotland Private sector Oak Quercus spp. OK 2 6 024.02
Scotland Private sector Oak Quercus spp. OK 4 10 337.41
Scotland Private sector Oak Quercus spp. OK 6 5 153.97
Scotland Private sector Oak Quercus spp. OK 8 2 072.06
Scotland Private sector Ash Fraxinus excelsior AH 2 3 857.25
Scotland Private sector Ash Fraxinus excelsior AH 4 3 488.72
Scotland Private sector Ash Fraxinus excelsior AH 6 2 910.22
Scotland Private sector Ash Fraxinus excelsior AH 8 1 720.56
Scotland Private sector Ash Fraxinus excelsior AH 10 1 231.82
Scotland Private sector Ash Fraxinus excelsior AH 12 1 577.88
Scotland Private sector Beech Fagus sylvatica BE 4 3 654.45
Scotland Private sector Beech Fagus sylvatica BE 6 5 076.30
Scotland Private sector Beech Fagus sylvatica BE 8 2 860.50
Scotland Private sector Beech Fagus sylvatica BE 10 2 606.88
Scotland Private sector Birch Betula spp. BI 2 74 753.55
Scotland Private sector Birch Betula spp. BI 4 28 509.93
Scotland Private sector Birch Betula spp. BI 6 13 976.54
Scotland Private sector Birch Betula spp. BI 8 5 749.45
Scotland Private sector Birch Betula spp. BI 10 3 730.03

112
Country Ownership CARBINE tree species Yield class (m3 ha-1 yr-1)
Area (ha)
Common name Latin name Sp. code Scotland Private sector Birch Betula spp. BI 12 1 743.03
Scotland Private sector Sycamore Acer pseudoplatanus SY 2 60 986.35
Scotland Private sector Sycamore Acer pseudoplatanus SY 4 2 794.99
Scotland Private sector Sycamore Acer pseudoplatanus SY 6 4 233.83
Scotland Private sector Sycamore Acer pseudoplatanus SY 8 3 045.11
Scotland Private sector Sycamore Acer pseudoplatanus SY 10 2 484.86
Scotland Private sector Sycamore Acer pseudoplatanus SY 12 2 803.74
Scotland Private sector Poplar Populus. spp. PO 2 26 911.57
Scotland Private sector Poplar Populus. spp. PO 4 13 529.06
Scotland Private sector Poplar Populus. spp. PO 6 6 133.22
Scotland Private sector Poplar Populus. spp. PO 8 3 227.35
Scotland Private sector Poplar Populus. spp. PO 10 412.08
Scotland Private sector Poplar Populus. spp. PO 12 130.24
Scotland Private sector Nothofagus Nothofagus spp. NO 2 900.76
Scotland Private sector Nothofagus Nothofagus spp. NO 4 1 259.79
Scotland Private sector Nothofagus Nothofagus spp. NO 6 594.70
Scotland Private sector Nothofagus Nothofagus spp. NO 8 388.31
Scotland Private sector Nothofagus Nothofagus spp. NO 10 1 750.47
Scotland Private sector Nothofagus Nothofagus spp. NO 12 792.69
Wales Public forest estate Norway spruce Picea abies NS 2 128.38
Wales Public forest estate Norway spruce Picea abies NS 4 65.33
Wales Public forest estate Norway spruce Picea abies NS 6 135.17
Wales Public forest estate Norway spruce Picea abies NS 8 322.73
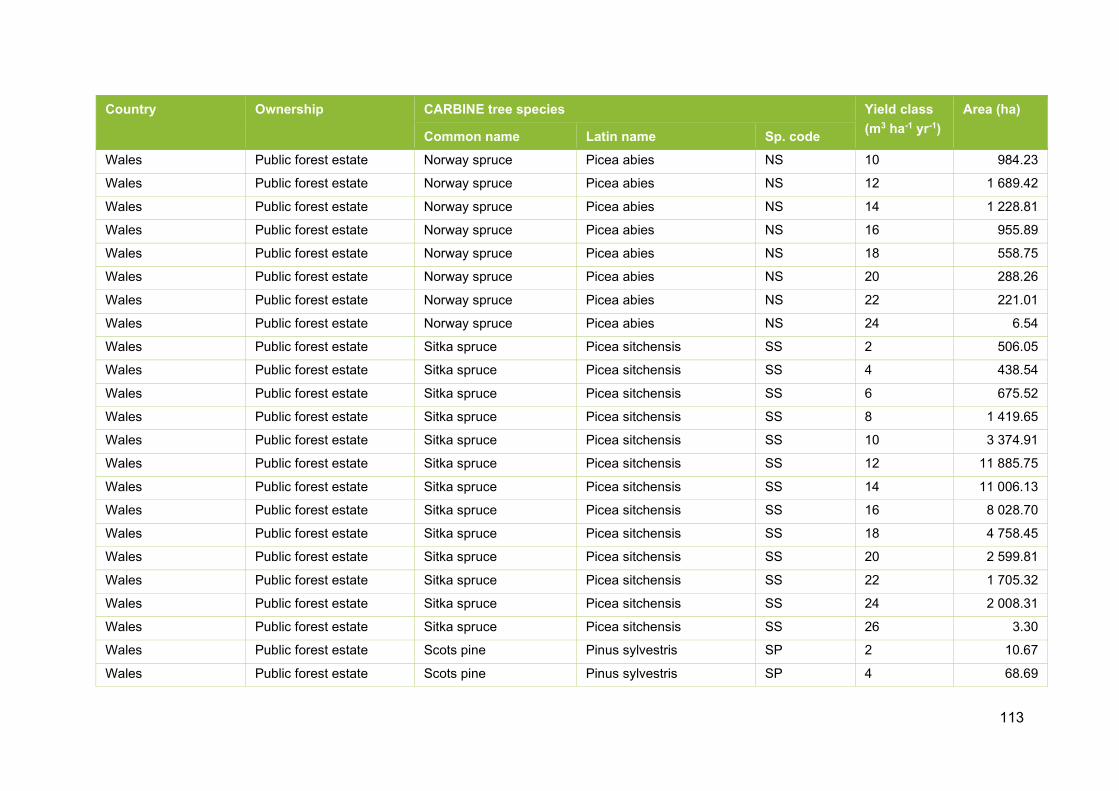
113
Country Ownership CARBINE tree species Yield class (m3 ha-1 yr-1)
Area (ha)
Common name Latin name Sp. code Wales Public forest estate Norway spruce Picea abies NS 10 984.23
Wales Public forest estate Norway spruce Picea abies NS 12 1 689.42
Wales Public forest estate Norway spruce Picea abies NS 14 1 228.81
Wales Public forest estate Norway spruce Picea abies NS 16 955.89
Wales Public forest estate Norway spruce Picea abies NS 18 558.75
Wales Public forest estate Norway spruce Picea abies NS 20 288.26
Wales Public forest estate Norway spruce Picea abies NS 22 221.01
Wales Public forest estate Norway spruce Picea abies NS 24 6.54
Wales Public forest estate Sitka spruce Picea sitchensis SS 2 506.05
Wales Public forest estate Sitka spruce Picea sitchensis SS 4 438.54
Wales Public forest estate Sitka spruce Picea sitchensis SS 6 675.52
Wales Public forest estate Sitka spruce Picea sitchensis SS 8 1 419.65
Wales Public forest estate Sitka spruce Picea sitchensis SS 10 3 374.91
Wales Public forest estate Sitka spruce Picea sitchensis SS 12 11 885.75
Wales Public forest estate Sitka spruce Picea sitchensis SS 14 11 006.13
Wales Public forest estate Sitka spruce Picea sitchensis SS 16 8 028.70
Wales Public forest estate Sitka spruce Picea sitchensis SS 18 4 758.45
Wales Public forest estate Sitka spruce Picea sitchensis SS 20 2 599.81
Wales Public forest estate Sitka spruce Picea sitchensis SS 22 1 705.32
Wales Public forest estate Sitka spruce Picea sitchensis SS 24 2 008.31
Wales Public forest estate Sitka spruce Picea sitchensis SS 26 3.30
Wales Public forest estate Scots pine Pinus sylvestris SP 2 10.67
Wales Public forest estate Scots pine Pinus sylvestris SP 4 68.69
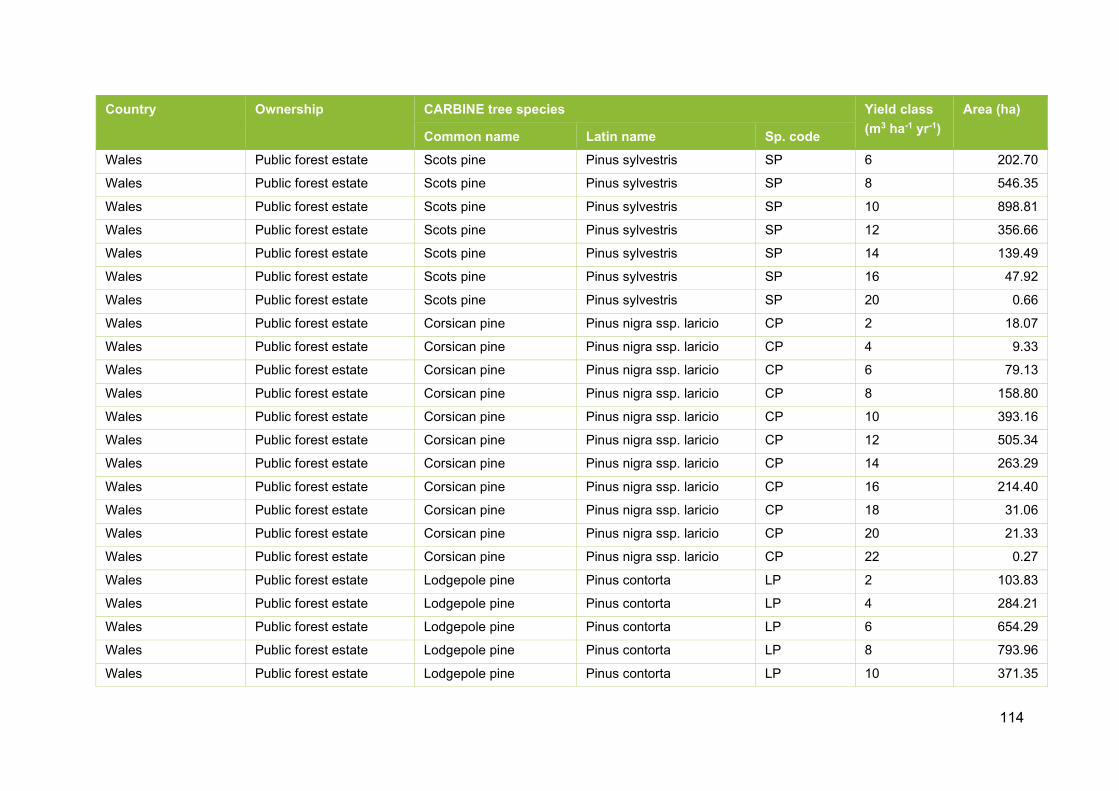
114
Country Ownership CARBINE tree species Yield class (m3 ha-1 yr-1)
Area (ha)
Common name Latin name Sp. code Wales Public forest estate Scots pine Pinus sylvestris SP 6 202.70
Wales Public forest estate Scots pine Pinus sylvestris SP 8 546.35
Wales Public forest estate Scots pine Pinus sylvestris SP 10 898.81
Wales Public forest estate Scots pine Pinus sylvestris SP 12 356.66
Wales Public forest estate Scots pine Pinus sylvestris SP 14 139.49
Wales Public forest estate Scots pine Pinus sylvestris SP 16 47.92
Wales Public forest estate Scots pine Pinus sylvestris SP 20 0.66
Wales Public forest estate Corsican pine Pinus nigra ssp. laricio CP 2 18.07
Wales Public forest estate Corsican pine Pinus nigra ssp. laricio CP 4 9.33
Wales Public forest estate Corsican pine Pinus nigra ssp. laricio CP 6 79.13
Wales Public forest estate Corsican pine Pinus nigra ssp. laricio CP 8 158.80
Wales Public forest estate Corsican pine Pinus nigra ssp. laricio CP 10 393.16
Wales Public forest estate Corsican pine Pinus nigra ssp. laricio CP 12 505.34
Wales Public forest estate Corsican pine Pinus nigra ssp. laricio CP 14 263.29
Wales Public forest estate Corsican pine Pinus nigra ssp. laricio CP 16 214.40
Wales Public forest estate Corsican pine Pinus nigra ssp. laricio CP 18 31.06
Wales Public forest estate Corsican pine Pinus nigra ssp. laricio CP 20 21.33
Wales Public forest estate Corsican pine Pinus nigra ssp. laricio CP 22 0.27
Wales Public forest estate Lodgepole pine Pinus contorta LP 2 103.83
Wales Public forest estate Lodgepole pine Pinus contorta LP 4 284.21
Wales Public forest estate Lodgepole pine Pinus contorta LP 6 654.29
Wales Public forest estate Lodgepole pine Pinus contorta LP 8 793.96
Wales Public forest estate Lodgepole pine Pinus contorta LP 10 371.35
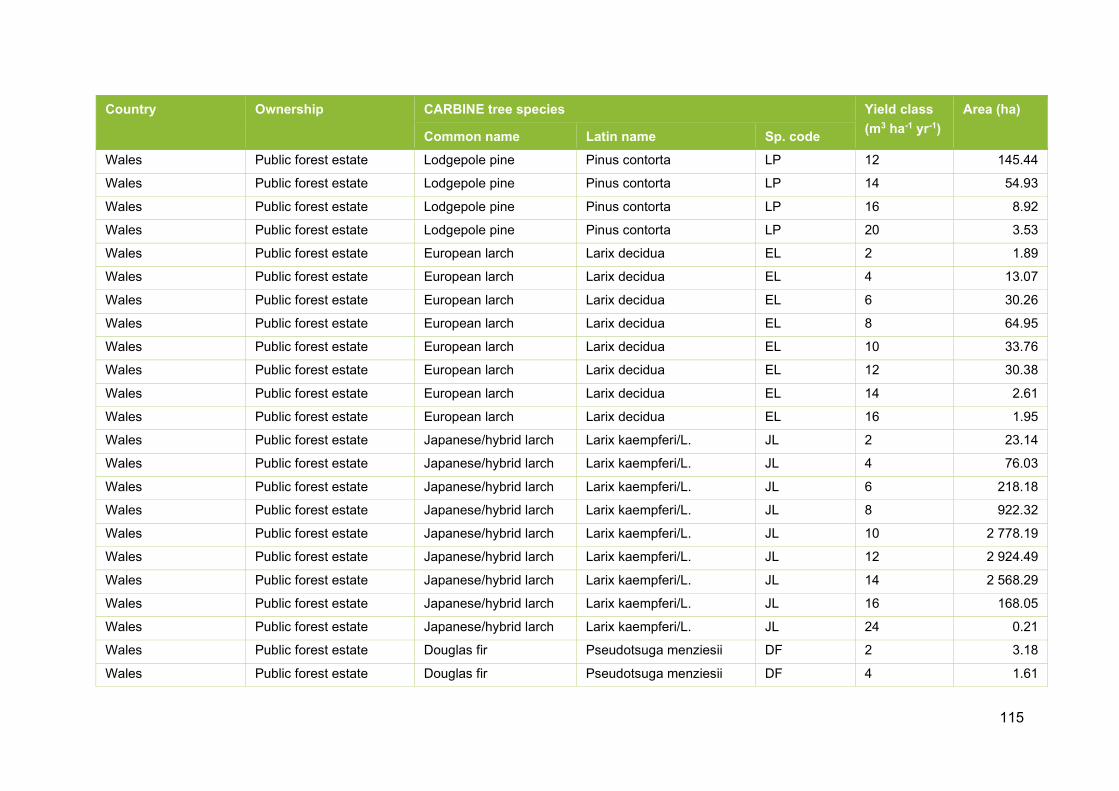
115
Country Ownership CARBINE tree species Yield class (m3 ha-1 yr-1)
Area (ha)
Common name Latin name Sp. code Wales Public forest estate Lodgepole pine Pinus contorta LP 12 145.44
Wales Public forest estate Lodgepole pine Pinus contorta LP 14 54.93
Wales Public forest estate Lodgepole pine Pinus contorta LP 16 8.92
Wales Public forest estate Lodgepole pine Pinus contorta LP 20 3.53
Wales Public forest estate European larch Larix decidua EL 2 1.89
Wales Public forest estate European larch Larix decidua EL 4 13.07
Wales Public forest estate European larch Larix decidua EL 6 30.26
Wales Public forest estate European larch Larix decidua EL 8 64.95
Wales Public forest estate European larch Larix decidua EL 10 33.76
Wales Public forest estate European larch Larix decidua EL 12 30.38
Wales Public forest estate European larch Larix decidua EL 14 2.61
Wales Public forest estate European larch Larix decidua EL 16 1.95
Wales Public forest estate Japanese/hybrid larch Larix kaempferi/L. JL 2 23.14
Wales Public forest estate Japanese/hybrid larch Larix kaempferi/L. JL 4 76.03
Wales Public forest estate Japanese/hybrid larch Larix kaempferi/L. JL 6 218.18
Wales Public forest estate Japanese/hybrid larch Larix kaempferi/L. JL 8 922.32
Wales Public forest estate Japanese/hybrid larch Larix kaempferi/L. JL 10 2 778.19
Wales Public forest estate Japanese/hybrid larch Larix kaempferi/L. JL 12 2 924.49
Wales Public forest estate Japanese/hybrid larch Larix kaempferi/L. JL 14 2 568.29
Wales Public forest estate Japanese/hybrid larch Larix kaempferi/L. JL 16 168.05
Wales Public forest estate Japanese/hybrid larch Larix kaempferi/L. JL 24 0.21
Wales Public forest estate Douglas fir Pseudotsuga menziesii DF 2 3.18
Wales Public forest estate Douglas fir Pseudotsuga menziesii DF 4 1.61
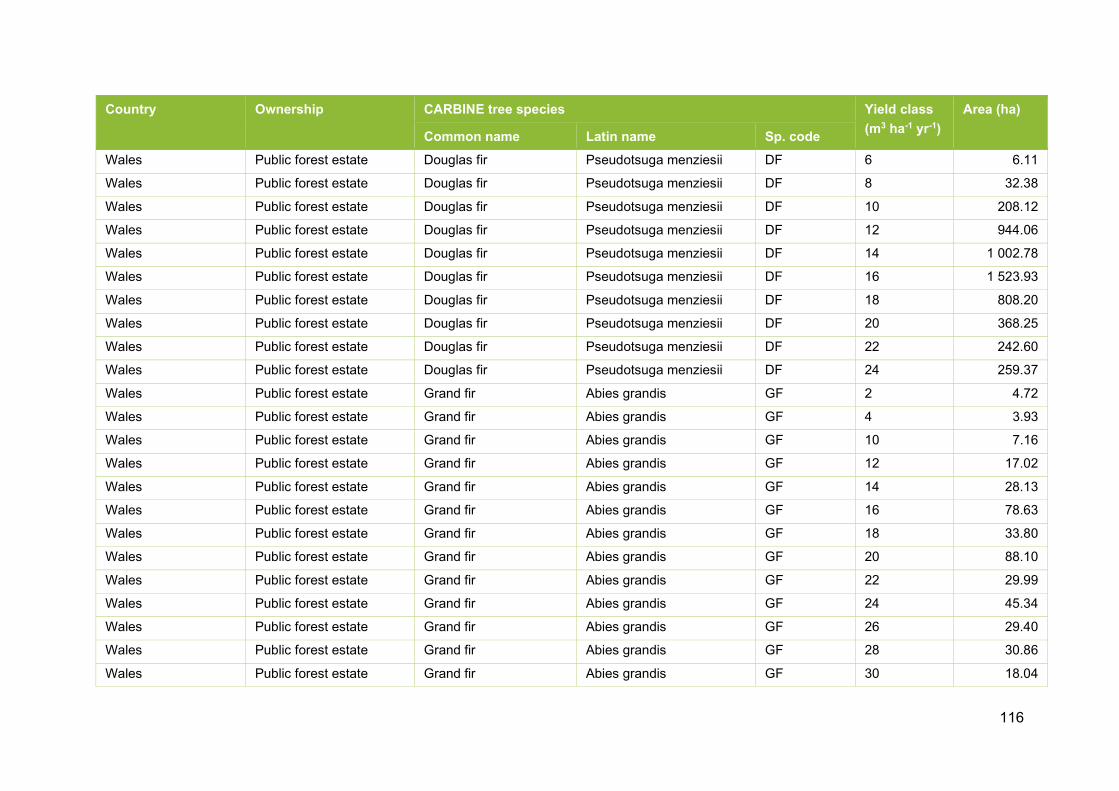
116
Country Ownership CARBINE tree species Yield class (m3 ha-1 yr-1)
Area (ha)
Common name Latin name Sp. code Wales Public forest estate Douglas fir Pseudotsuga menziesii DF 6 6.11
Wales Public forest estate Douglas fir Pseudotsuga menziesii DF 8 32.38
Wales Public forest estate Douglas fir Pseudotsuga menziesii DF 10 208.12
Wales Public forest estate Douglas fir Pseudotsuga menziesii DF 12 944.06
Wales Public forest estate Douglas fir Pseudotsuga menziesii DF 14 1 002.78
Wales Public forest estate Douglas fir Pseudotsuga menziesii DF 16 1 523.93
Wales Public forest estate Douglas fir Pseudotsuga menziesii DF 18 808.20
Wales Public forest estate Douglas fir Pseudotsuga menziesii DF 20 368.25
Wales Public forest estate Douglas fir Pseudotsuga menziesii DF 22 242.60
Wales Public forest estate Douglas fir Pseudotsuga menziesii DF 24 259.37
Wales Public forest estate Grand fir Abies grandis GF 2 4.72
Wales Public forest estate Grand fir Abies grandis GF 4 3.93
Wales Public forest estate Grand fir Abies grandis GF 10 7.16
Wales Public forest estate Grand fir Abies grandis GF 12 17.02
Wales Public forest estate Grand fir Abies grandis GF 14 28.13
Wales Public forest estate Grand fir Abies grandis GF 16 78.63
Wales Public forest estate Grand fir Abies grandis GF 18 33.80
Wales Public forest estate Grand fir Abies grandis GF 20 88.10
Wales Public forest estate Grand fir Abies grandis GF 22 29.99
Wales Public forest estate Grand fir Abies grandis GF 24 45.34
Wales Public forest estate Grand fir Abies grandis GF 26 29.40
Wales Public forest estate Grand fir Abies grandis GF 28 30.86
Wales Public forest estate Grand fir Abies grandis GF 30 18.04

117
Country Ownership CARBINE tree species Yield class (m3 ha-1 yr-1)
Area (ha)
Common name Latin name Sp. code Wales Public forest estate Noble fir Abies procera NF 2 1.55
Wales Public forest estate Noble fir Abies procera NF 4 5.75
Wales Public forest estate Noble fir Abies procera NF 6 19.72
Wales Public forest estate Noble fir Abies procera NF 8 6.15
Wales Public forest estate Noble fir Abies procera NF 10 45.35
Wales Public forest estate Noble fir Abies procera NF 12 82.18
Wales Public forest estate Noble fir Abies procera NF 14 79.36
Wales Public forest estate Noble fir Abies procera NF 16 75.16
Wales Public forest estate Noble fir Abies procera NF 18 34.19
Wales Public forest estate Noble fir Abies procera NF 20 23.30
Wales Public forest estate Noble fir Abies procera NF 22 32.37
Wales Public forest estate Noble fir Abies procera NF 24 0.71
Wales Public forest estate Western hemlock Tsuga heterophylla WH 2 5.25
Wales Public forest estate Western hemlock Tsuga heterophylla WH 4 1.91
Wales Public forest estate Western hemlock Tsuga heterophylla WH 6 6.43
Wales Public forest estate Western hemlock Tsuga heterophylla WH 8 3.98
Wales Public forest estate Western hemlock Tsuga heterophylla WH 10 12.42
Wales Public forest estate Western hemlock Tsuga heterophylla WH 12 50.20
Wales Public forest estate Western hemlock Tsuga heterophylla WH 14 98.08
Wales Public forest estate Western hemlock Tsuga heterophylla WH 16 140.90
Wales Public forest estate Western hemlock Tsuga heterophylla WH 18 166.46
Wales Public forest estate Western hemlock Tsuga heterophylla WH 20 109.57
Wales Public forest estate Western hemlock Tsuga heterophylla WH 22 73.68

118
Country Ownership CARBINE tree species Yield class (m3 ha-1 yr-1)
Area (ha)
Common name Latin name Sp. code Wales Public forest estate Western hemlock Tsuga heterophylla WH 24 82.22
Wales Public forest estate Western hemlock Tsuga heterophylla WH 26 0.21
Wales Public forest estate Western red cedar Thuja plicata RC 2 12.18
Wales Public forest estate Western red cedar Thuja plicata RC 4 2.46
Wales Public forest estate Western red cedar Thuja plicata RC 6 11.06
Wales Public forest estate Western red cedar Thuja plicata RC 8 9.56
Wales Public forest estate Western red cedar Thuja plicata RC 10 53.71
Wales Public forest estate Western red cedar Thuja plicata RC 12 72.51
Wales Public forest estate Western red cedar Thuja plicata RC 14 59.45
Wales Public forest estate Western red cedar Thuja plicata RC 16 77.95
Wales Public forest estate Western red cedar Thuja plicata RC 18 43.05
Wales Public forest estate Western red cedar Thuja plicata RC 20 32.96
Wales Public forest estate Western red cedar Thuja plicata RC 22 17.95
Wales Public forest estate Western red cedar Thuja plicata RC 24 7.99
Wales Public forest estate Oak Quercus spp. OK 2 273.51
Wales Public forest estate Oak Quercus spp. OK 4 662.28
Wales Public forest estate Oak Quercus spp. OK 6 642.99
Wales Public forest estate Oak Quercus spp. OK 8 296.24
Wales Public forest estate Oak Quercus spp. OK 10 30.34
Wales Public forest estate Oak Quercus spp. OK 12 5.45
Wales Public forest estate Oak Quercus spp. OK 14 4.32
Wales Public forest estate Oak Quercus spp. OK 16 0.27
Wales Public forest estate Oak Quercus spp. OK 20 0.61

119
Country Ownership CARBINE tree species Yield class (m3 ha-1 yr-1)
Area (ha)
Common name Latin name Sp. code Wales Public forest estate Ash Fraxinus excelsior AH 2 30.74
Wales Public forest estate Ash Fraxinus excelsior AH 4 128.17
Wales Public forest estate Ash Fraxinus excelsior AH 6 76.60
Wales Public forest estate Ash Fraxinus excelsior AH 8 62.48
Wales Public forest estate Ash Fraxinus excelsior AH 10 19.63
Wales Public forest estate Ash Fraxinus excelsior AH 12 4.11
Wales Public forest estate Ash Fraxinus excelsior AH 14 0.11
Wales Public forest estate Ash Fraxinus excelsior AH 18 2.83
Wales Public forest estate Ash Fraxinus excelsior AH 20 1.99
Wales Public forest estate Beech Fagus sylvatica BE 2 95.79
Wales Public forest estate Beech Fagus sylvatica BE 4 250.68
Wales Public forest estate Beech Fagus sylvatica BE 6 498.47
Wales Public forest estate Beech Fagus sylvatica BE 8 526.73
Wales Public forest estate Beech Fagus sylvatica BE 10 64.18
Wales Public forest estate Beech Fagus sylvatica BE 12 0.45
Wales Public forest estate Beech Fagus sylvatica BE 16 0.87
Wales Public forest estate Birch Betula spp. BI 2 339.22
Wales Public forest estate Birch Betula spp. BI 4 392.22
Wales Public forest estate Birch Betula spp. BI 6 139.42
Wales Public forest estate Birch Betula spp. BI 8 122.70
Wales Public forest estate Birch Betula spp. BI 10 7.04
Wales Public forest estate Birch Betula spp. BI 12 12.78
Wales Public forest estate Birch Betula spp. BI 14 0.51
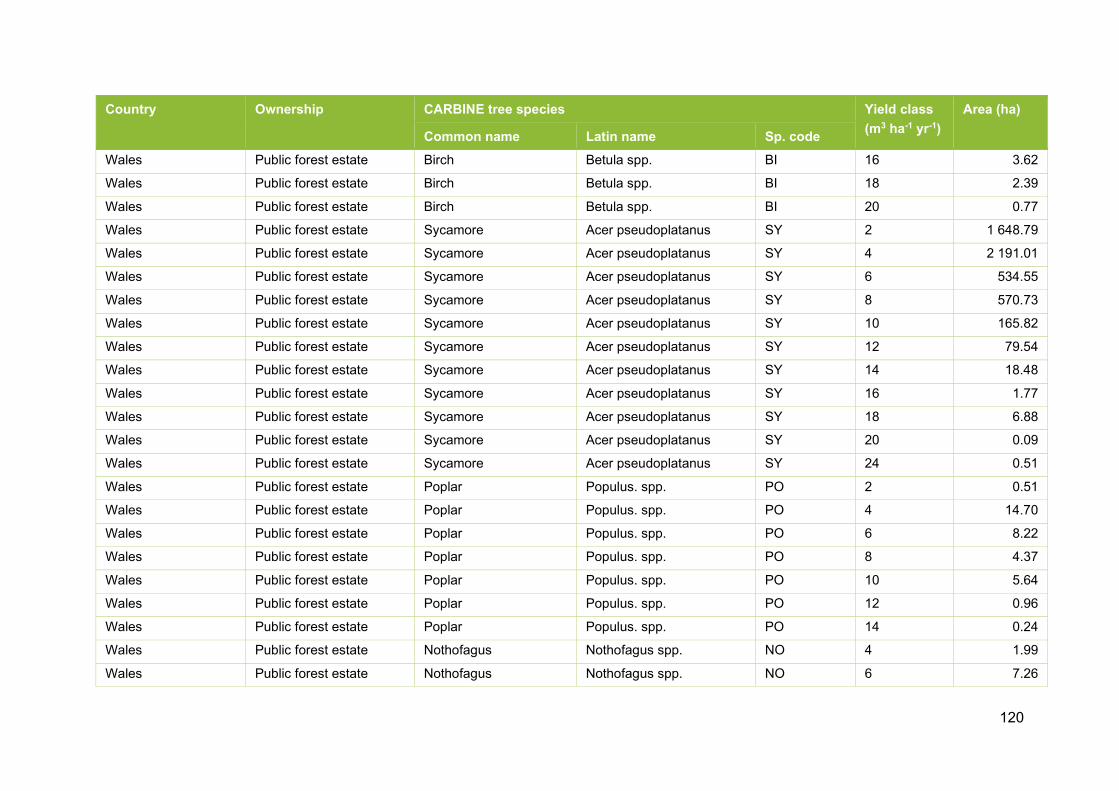
120
Country Ownership CARBINE tree species Yield class (m3 ha-1 yr-1)
Area (ha)
Common name Latin name Sp. code Wales Public forest estate Birch Betula spp. BI 16 3.62
Wales Public forest estate Birch Betula spp. BI 18 2.39
Wales Public forest estate Birch Betula spp. BI 20 0.77
Wales Public forest estate Sycamore Acer pseudoplatanus SY 2 1 648.79
Wales Public forest estate Sycamore Acer pseudoplatanus SY 4 2 191.01
Wales Public forest estate Sycamore Acer pseudoplatanus SY 6 534.55
Wales Public forest estate Sycamore Acer pseudoplatanus SY 8 570.73
Wales Public forest estate Sycamore Acer pseudoplatanus SY 10 165.82
Wales Public forest estate Sycamore Acer pseudoplatanus SY 12 79.54
Wales Public forest estate Sycamore Acer pseudoplatanus SY 14 18.48
Wales Public forest estate Sycamore Acer pseudoplatanus SY 16 1.77
Wales Public forest estate Sycamore Acer pseudoplatanus SY 18 6.88
Wales Public forest estate Sycamore Acer pseudoplatanus SY 20 0.09
Wales Public forest estate Sycamore Acer pseudoplatanus SY 24 0.51
Wales Public forest estate Poplar Populus. spp. PO 2 0.51
Wales Public forest estate Poplar Populus. spp. PO 4 14.70
Wales Public forest estate Poplar Populus. spp. PO 6 8.22
Wales Public forest estate Poplar Populus. spp. PO 8 4.37
Wales Public forest estate Poplar Populus. spp. PO 10 5.64
Wales Public forest estate Poplar Populus. spp. PO 12 0.96
Wales Public forest estate Poplar Populus. spp. PO 14 0.24
Wales Public forest estate Nothofagus Nothofagus spp. NO 4 1.99
Wales Public forest estate Nothofagus Nothofagus spp. NO 6 7.26
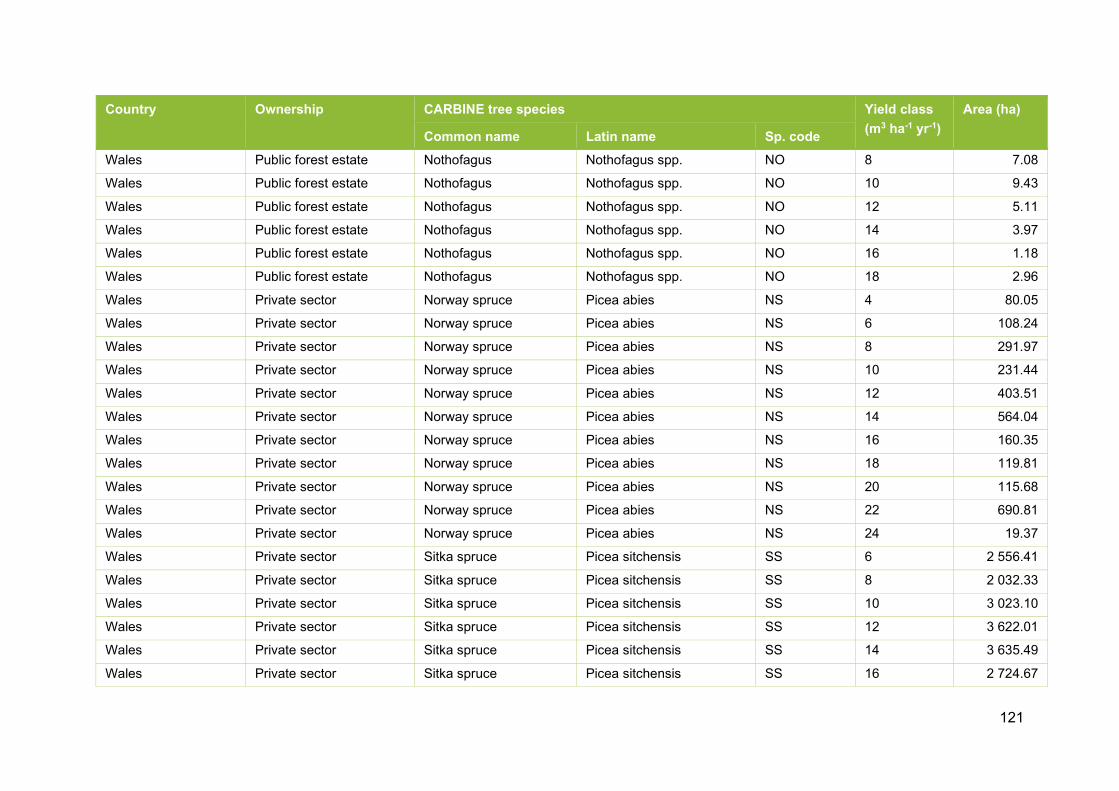
121
Country Ownership CARBINE tree species Yield class (m3 ha-1 yr-1)
Area (ha)
Common name Latin name Sp. code Wales Public forest estate Nothofagus Nothofagus spp. NO 8 7.08
Wales Public forest estate Nothofagus Nothofagus spp. NO 10 9.43
Wales Public forest estate Nothofagus Nothofagus spp. NO 12 5.11
Wales Public forest estate Nothofagus Nothofagus spp. NO 14 3.97
Wales Public forest estate Nothofagus Nothofagus spp. NO 16 1.18
Wales Public forest estate Nothofagus Nothofagus spp. NO 18 2.96
Wales Private sector Norway spruce Picea abies NS 4 80.05
Wales Private sector Norway spruce Picea abies NS 6 108.24
Wales Private sector Norway spruce Picea abies NS 8 291.97
Wales Private sector Norway spruce Picea abies NS 10 231.44
Wales Private sector Norway spruce Picea abies NS 12 403.51
Wales Private sector Norway spruce Picea abies NS 14 564.04
Wales Private sector Norway spruce Picea abies NS 16 160.35
Wales Private sector Norway spruce Picea abies NS 18 119.81
Wales Private sector Norway spruce Picea abies NS 20 115.68
Wales Private sector Norway spruce Picea abies NS 22 690.81
Wales Private sector Norway spruce Picea abies NS 24 19.37
Wales Private sector Sitka spruce Picea sitchensis SS 6 2 556.41
Wales Private sector Sitka spruce Picea sitchensis SS 8 2 032.33
Wales Private sector Sitka spruce Picea sitchensis SS 10 3 023.10
Wales Private sector Sitka spruce Picea sitchensis SS 12 3 622.01
Wales Private sector Sitka spruce Picea sitchensis SS 14 3 635.49
Wales Private sector Sitka spruce Picea sitchensis SS 16 2 724.67

122
Country Ownership CARBINE tree species Yield class (m3 ha-1 yr-1)
Area (ha)
Common name Latin name Sp. code Wales Private sector Sitka spruce Picea sitchensis SS 18 1 979.37
Wales Private sector Sitka spruce Picea sitchensis SS 20 3 437.24
Wales Private sector Sitka spruce Picea sitchensis SS 22 1 636.58
Wales Private sector Sitka spruce Picea sitchensis SS 24 2 994.84
Wales Private sector Sitka spruce Picea sitchensis SS 26 4.95
Wales Private sector Scots pine Pinus sylvestris SP 4 6 551.40
Wales Private sector Scots pine Pinus sylvestris SP 6 156.68
Wales Private sector Scots pine Pinus sylvestris SP 8 498.26
Wales Private sector Scots pine Pinus sylvestris SP 10 196.23
Wales Private sector Scots pine Pinus sylvestris SP 12 98.42
Wales Private sector Scots pine Pinus sylvestris SP 14 64.13
Wales Private sector Scots pine Pinus sylvestris SP 16 6.18
Wales Private sector Scots pine Pinus sylvestris SP 20 0.27
Wales Private sector Corsican pine Pinus nigra ssp. laricio CP 4 13.29
Wales Private sector Corsican pine Pinus nigra ssp. laricio CP 6 66.79
Wales Private sector Corsican pine Pinus nigra ssp. laricio CP 8 161.90
Wales Private sector Corsican pine Pinus nigra ssp. laricio CP 10 110.19
Wales Private sector Corsican pine Pinus nigra ssp. laricio CP 12 173.29
Wales Private sector Corsican pine Pinus nigra ssp. laricio CP 14 152.93
Wales Private sector Corsican pine Pinus nigra ssp. laricio CP 16 44.29
Wales Private sector Corsican pine Pinus nigra ssp. laricio CP 18 7.14
Wales Private sector Corsican pine Pinus nigra ssp. laricio CP 20 9.10
Wales Private sector Corsican pine Pinus nigra ssp. laricio CP 22 0.88

123
Country Ownership CARBINE tree species Yield class (m3 ha-1 yr-1)
Area (ha)
Common name Latin name Sp. code Wales Private sector Lodgepole pine Pinus contorta LP 4 377.08
Wales Private sector Lodgepole pine Pinus contorta LP 6 500.86
Wales Private sector Lodgepole pine Pinus contorta LP 8 732.24
Wales Private sector Lodgepole pine Pinus contorta LP 10 94.76
Wales Private sector Lodgepole pine Pinus contorta LP 12 43.24
Wales Private sector Lodgepole pine Pinus contorta LP 14 28.89
Wales Private sector Lodgepole pine Pinus contorta LP 16 1.68
Wales Private sector Lodgepole pine Pinus contorta LP 20 1.37
Wales Private sector European larch Larix decidua EL 4 64.81
Wales Private sector European larch Larix decidua EL 6 142.42
Wales Private sector European larch Larix decidua EL 8 50.95
Wales Private sector European larch Larix decidua EL 10 12.80
Wales Private sector European larch Larix decidua EL 12 12.37
Wales Private sector European larch Larix decidua EL 14 2.97
Wales Private sector Japanese/hybrid larch Larix kaempferi/L. JL 4 377.55
Wales Private sector Japanese/hybrid larch Larix kaempferi/L. JL 6 1 063.56
Wales Private sector Japanese/hybrid larch Larix kaempferi/L. JL 8 779.37
Wales Private sector Japanese/hybrid larch Larix kaempferi/L. JL 10 1 017.44
Wales Private sector Japanese/hybrid larch Larix kaempferi/L. JL 12 1 157.75
Wales Private sector Japanese/hybrid larch Larix kaempferi/L. JL 14 2 865.71
Wales Private sector Douglas fir Pseudotsuga menziesii DF 4 2.23
Wales Private sector Douglas fir Pseudotsuga menziesii DF 6 3.41
Wales Private sector Douglas fir Pseudotsuga menziesii DF 8 23.60
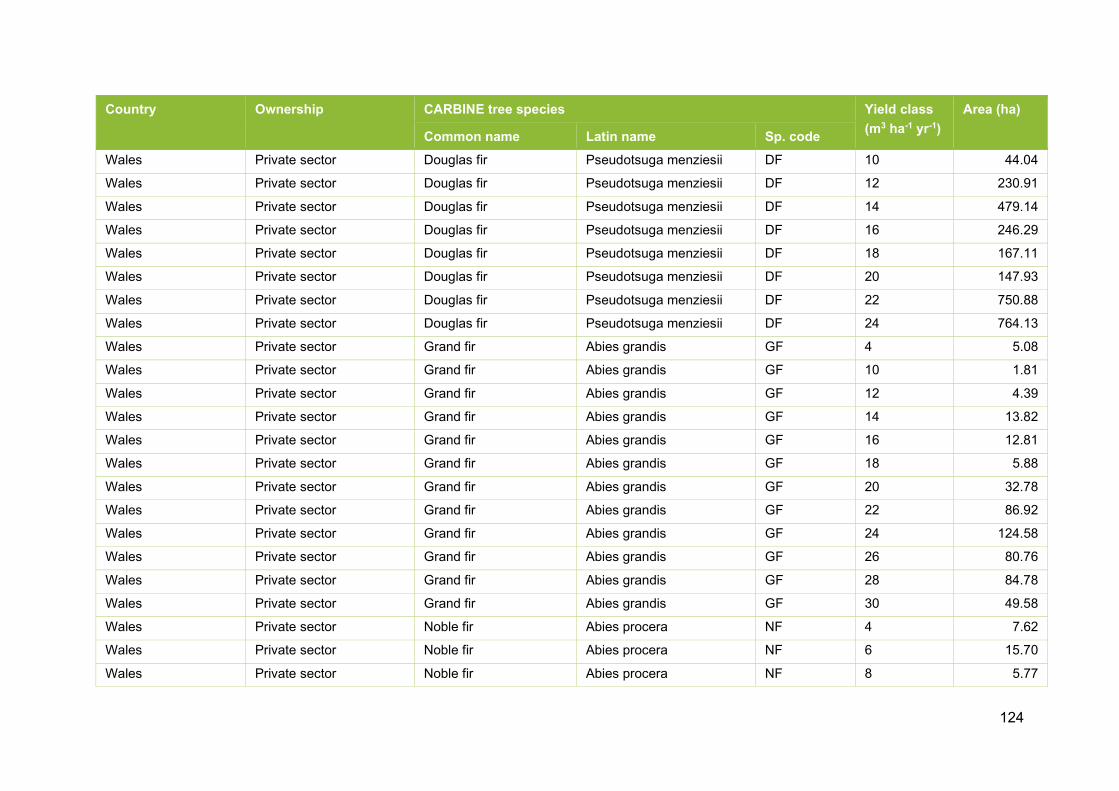
124
Country Ownership CARBINE tree species Yield class (m3 ha-1 yr-1)
Area (ha)
Common name Latin name Sp. code Wales Private sector Douglas fir Pseudotsuga menziesii DF 10 44.04
Wales Private sector Douglas fir Pseudotsuga menziesii DF 12 230.91
Wales Private sector Douglas fir Pseudotsuga menziesii DF 14 479.14
Wales Private sector Douglas fir Pseudotsuga menziesii DF 16 246.29
Wales Private sector Douglas fir Pseudotsuga menziesii DF 18 167.11
Wales Private sector Douglas fir Pseudotsuga menziesii DF 20 147.93
Wales Private sector Douglas fir Pseudotsuga menziesii DF 22 750.88
Wales Private sector Douglas fir Pseudotsuga menziesii DF 24 764.13
Wales Private sector Grand fir Abies grandis GF 4 5.08
Wales Private sector Grand fir Abies grandis GF 10 1.81
Wales Private sector Grand fir Abies grandis GF 12 4.39
Wales Private sector Grand fir Abies grandis GF 14 13.82
Wales Private sector Grand fir Abies grandis GF 16 12.81
Wales Private sector Grand fir Abies grandis GF 18 5.88
Wales Private sector Grand fir Abies grandis GF 20 32.78
Wales Private sector Grand fir Abies grandis GF 22 86.92
Wales Private sector Grand fir Abies grandis GF 24 124.58
Wales Private sector Grand fir Abies grandis GF 26 80.76
Wales Private sector Grand fir Abies grandis GF 28 84.78
Wales Private sector Grand fir Abies grandis GF 30 49.58
Wales Private sector Noble fir Abies procera NF 4 7.62
Wales Private sector Noble fir Abies procera NF 6 15.70
Wales Private sector Noble fir Abies procera NF 8 5.77

125
Country Ownership CARBINE tree species Yield class (m3 ha-1 yr-1)
Area (ha)
Common name Latin name Sp. code Wales Private sector Noble fir Abies procera NF 10 8.92
Wales Private sector Noble fir Abies procera NF 12 18.71
Wales Private sector Noble fir Abies procera NF 14 38.87
Wales Private sector Noble fir Abies procera NF 16 12.00
Wales Private sector Noble fir Abies procera NF 18 7.39
Wales Private sector Noble fir Abies procera NF 20 9.35
Wales Private sector Noble fir Abies procera NF 22 99.92
Wales Private sector Noble fir Abies procera NF 24 2.08
Wales Private sector Western hemlock Tsuga heterophylla WH 4 2.52
Wales Private sector Western hemlock Tsuga heterophylla WH 6 4.40
Wales Private sector Western hemlock Tsuga heterophylla WH 8 3.39
Wales Private sector Western hemlock Tsuga heterophylla WH 10 3.20
Wales Private sector Western hemlock Tsuga heterophylla WH 12 15.13
Wales Private sector Western hemlock Tsuga heterophylla WH 14 47.56
Wales Private sector Western hemlock Tsuga heterophylla WH 16 25.96
Wales Private sector Western hemlock Tsuga heterophylla WH 18 34.48
Wales Private sector Western hemlock Tsuga heterophylla WH 20 42.16
Wales Private sector Western hemlock Tsuga heterophylla WH 22 218.02
Wales Private sector Western hemlock Tsuga heterophylla WH 24 230.67
Wales Private sector Western hemlock Tsuga heterophylla WH 26 0.58
Wales Private sector Western red cedar Thuja plicata RC 4 3.35
Wales Private sector Western red cedar Thuja plicata RC 6 4.27
Wales Private sector Western red cedar Thuja plicata RC 8 6.97
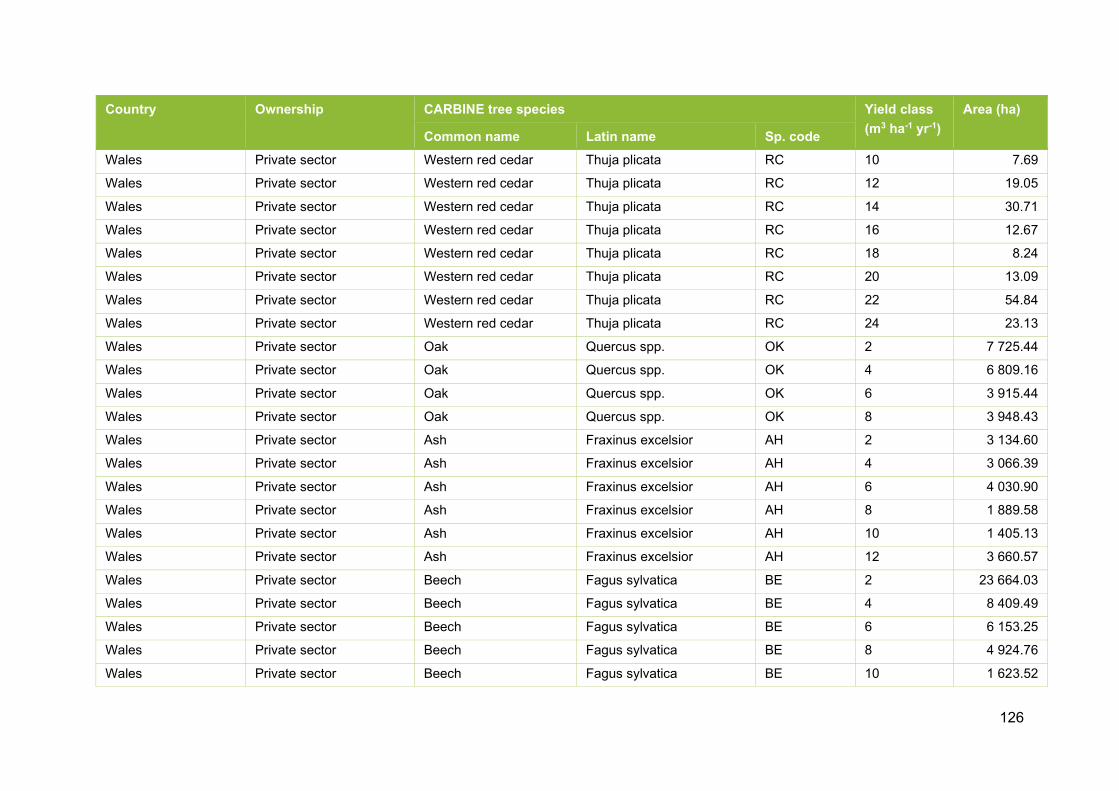
126
Country Ownership CARBINE tree species Yield class (m3 ha-1 yr-1)
Area (ha)
Common name Latin name Sp. code Wales Private sector Western red cedar Thuja plicata RC 10 7.69
Wales Private sector Western red cedar Thuja plicata RC 12 19.05
Wales Private sector Western red cedar Thuja plicata RC 14 30.71
Wales Private sector Western red cedar Thuja plicata RC 16 12.67
Wales Private sector Western red cedar Thuja plicata RC 18 8.24
Wales Private sector Western red cedar Thuja plicata RC 20 13.09
Wales Private sector Western red cedar Thuja plicata RC 22 54.84
Wales Private sector Western red cedar Thuja plicata RC 24 23.13
Wales Private sector Oak Quercus spp. OK 2 7 725.44
Wales Private sector Oak Quercus spp. OK 4 6 809.16
Wales Private sector Oak Quercus spp. OK 6 3 915.44
Wales Private sector Oak Quercus spp. OK 8 3 948.43
Wales Private sector Ash Fraxinus excelsior AH 2 3 134.60
Wales Private sector Ash Fraxinus excelsior AH 4 3 066.39
Wales Private sector Ash Fraxinus excelsior AH 6 4 030.90
Wales Private sector Ash Fraxinus excelsior AH 8 1 889.58
Wales Private sector Ash Fraxinus excelsior AH 10 1 405.13
Wales Private sector Ash Fraxinus excelsior AH 12 3 660.57
Wales Private sector Beech Fagus sylvatica BE 2 23 664.03
Wales Private sector Beech Fagus sylvatica BE 4 8 409.49
Wales Private sector Beech Fagus sylvatica BE 6 6 153.25
Wales Private sector Beech Fagus sylvatica BE 8 4 924.76
Wales Private sector Beech Fagus sylvatica BE 10 1 623.52

127
Country Ownership CARBINE tree species Yield class (m3 ha-1 yr-1)
Area (ha)
Common name Latin name Sp. code Wales Private sector Beech Fagus sylvatica BE 12 34.19
Wales Private sector Birch Betula spp. BI 2 2 175.22
Wales Private sector Birch Betula spp. BI 4 1 273.40
Wales Private sector Birch Betula spp. BI 6 1 299.98
Wales Private sector Birch Betula spp. BI 8 443.56
Wales Private sector Birch Betula spp. BI 10 38.40
Wales Private sector Birch Betula spp. BI 12 227.92
Wales Private sector Sycamore Acer pseudoplatanus SY 2 50 497.35
Wales Private sector Sycamore Acer pseudoplatanus SY 4 5 276.08
Wales Private sector Sycamore Acer pseudoplatanus SY 6 3 973.02
Wales Private sector Sycamore Acer pseudoplatanus SY 8 2 429.77
Wales Private sector Sycamore Acer pseudoplatanus SY 10 1 789.80
Wales Private sector Sycamore Acer pseudoplatanus SY 12 1 541.90
Wales Private sector Poplar Populus. spp. PO 2 826.71
Wales Private sector Poplar Populus. spp. PO 4 597.17
Wales Private sector Poplar Populus. spp. PO 6 92.59
Wales Private sector Poplar Populus. spp. PO 8 37.53
Wales Private sector Poplar Populus. spp. PO 10 200.33
Wales Private sector Poplar Populus. spp. PO 12 67.30
Northern Ireland Public forest estate Norway spruce Picea abies NS 6 2.44
Northern Ireland Public forest estate Norway spruce Picea abies NS 8 2.15
Northern Ireland Public forest estate Norway spruce Picea abies NS 10 5.92
Northern Ireland Public forest estate Norway spruce Picea abies NS 12 92.23

128
Country Ownership CARBINE tree species Yield class (m3 ha-1 yr-1)
Area (ha)
Common name Latin name Sp. code Northern Ireland Public forest estate Norway spruce Picea abies NS 14 231.95
Northern Ireland Public forest estate Norway spruce Picea abies NS 16 1 327.24
Northern Ireland Public forest estate Norway spruce Picea abies NS 18 232.60
Northern Ireland Public forest estate Norway spruce Picea abies NS 20 369.16
Northern Ireland Public forest estate Norway spruce Picea abies NS 22 4.20
Northern Ireland Public forest estate Sitka spruce Picea sitchensis SS 6 19.75
Northern Ireland Public forest estate Sitka spruce Picea sitchensis SS 8 42.98
Northern Ireland Public forest estate Sitka spruce Picea sitchensis SS 10 272.38
Northern Ireland Public forest estate Sitka spruce Picea sitchensis SS 12 4 106.11
Northern Ireland Public forest estate Sitka spruce Picea sitchensis SS 14 6 428.24
Northern Ireland Public forest estate Sitka spruce Picea sitchensis SS 16 17 321.67
Northern Ireland Public forest estate Sitka spruce Picea sitchensis SS 18 5 287.85
Northern Ireland Public forest estate Sitka spruce Picea sitchensis SS 20 2 068.57
Northern Ireland Public forest estate Sitka spruce Picea sitchensis SS 22 86.42
Northern Ireland Public forest estate Scots pine Pinus sylvestris SP 4 12.33
Northern Ireland Public forest estate Scots pine Pinus sylvestris SP 6 45.80
Northern Ireland Public forest estate Scots pine Pinus sylvestris SP 8 246.44
Northern Ireland Public forest estate Scots pine Pinus sylvestris SP 10 156.86
Northern Ireland Public forest estate Scots pine Pinus sylvestris SP 12 626.52
Northern Ireland Public forest estate Scots pine Pinus sylvestris SP 14 70.38
Northern Ireland Public forest estate Corsican pine Pinus nigra ssp. laricio CP 6 0.71
Northern Ireland Public forest estate Corsican pine Pinus nigra ssp. laricio CP 8 4.00
Northern Ireland Public forest estate Corsican pine Pinus nigra ssp. laricio CP 10 4.88

129
Country Ownership CARBINE tree species Yield class (m3 ha-1 yr-1)
Area (ha)
Common name Latin name Sp. code Northern Ireland Public forest estate Corsican pine Pinus nigra ssp. laricio CP 12 100.46
Northern Ireland Public forest estate Corsican pine Pinus nigra ssp. laricio CP 14 0.63
Northern Ireland Public forest estate Corsican pine Pinus nigra ssp. laricio CP 16 84.06
Northern Ireland Public forest estate Corsican pine Pinus nigra ssp. laricio CP 18 1.03
Northern Ireland Public forest estate Lodgepole pine Pinus contorta LP 4 162.07
Northern Ireland Public forest estate Lodgepole pine Pinus contorta LP 6 414.80
Northern Ireland Public forest estate Lodgepole pine Pinus contorta LP 8 2 335.33
Northern Ireland Public forest estate Lodgepole pine Pinus contorta LP 10 776.88
Northern Ireland Public forest estate Lodgepole pine Pinus contorta LP 12 335.30
Northern Ireland Public forest estate Lodgepole pine Pinus contorta LP 14 25.07
Northern Ireland Public forest estate European larch Larix decidua EL 6 13.03
Northern Ireland Public forest estate European larch Larix decidua EL 8 102.54
Northern Ireland Public forest estate European larch Larix decidua EL 10 357.58
Northern Ireland Public forest estate European larch Larix decidua EL 12 38.40
Northern Ireland Public forest estate Japanese/hybrid larch Larix kaempferi/L. JL 4 2.31
Northern Ireland Public forest estate Japanese/hybrid larch Larix kaempferi/L. JL 6 27.26
Northern Ireland Public forest estate Japanese/hybrid larch Larix kaempferi/L. JL 8 170.44
Northern Ireland Public forest estate Japanese/hybrid larch Larix kaempferi/L. JL 10 469.41
Northern Ireland Public forest estate Japanese/hybrid larch Larix kaempferi/L. JL 12 970.10
Northern Ireland Public forest estate Japanese/hybrid larch Larix kaempferi/L. JL 14 314.04
Northern Ireland Public forest estate Douglas fir Pseudotsuga menziesii DF 12 1.22
Northern Ireland Public forest estate Douglas fir Pseudotsuga menziesii DF 14 1.16
Northern Ireland Public forest estate Douglas fir Pseudotsuga menziesii DF 16 25.12

130
Country Ownership CARBINE tree species Yield class (m3 ha-1 yr-1)
Area (ha)
Common name Latin name Sp. code Northern Ireland Public forest estate Douglas fir Pseudotsuga menziesii DF 18 349.51
Northern Ireland Public forest estate Douglas fir Pseudotsuga menziesii DF 20 31.85
Northern Ireland Public forest estate Douglas fir Pseudotsuga menziesii DF 22 39.10
Northern Ireland Public forest estate Grand fir Abies grandis GF 14 3.08
Northern Ireland Public forest estate Noble fir Abies procera NF 10 0.54
Northern Ireland Public forest estate Noble fir Abies procera NF 12 15.17
Northern Ireland Public forest estate Noble fir Abies procera NF 14 92.51
Northern Ireland Public forest estate Noble fir Abies procera NF 16 229.92
Northern Ireland Public forest estate Noble fir Abies procera NF 18 16.19
Northern Ireland Public forest estate Noble fir Abies procera NF 20 3.28
Northern Ireland Public forest estate Western hemlock Tsuga heterophylla WH 12 54.49
Northern Ireland Public forest estate Western hemlock Tsuga heterophylla WH 14 14.64
Northern Ireland Public forest estate Western hemlock Tsuga heterophylla WH 16 11.24
Northern Ireland Public forest estate Western hemlock Tsuga heterophylla WH 18 0.37
Northern Ireland Public forest estate Western red cedar Thuja plicata RC 12 41.18
Northern Ireland Public forest estate Western red cedar Thuja plicata RC 14 5.79
Northern Ireland Public forest estate Western red cedar Thuja plicata RC 16 6.92
Northern Ireland Public forest estate Western red cedar Thuja plicata RC 18 0.16
Northern Ireland Public forest estate Oak Quercus spp. OK 4 144.87
Northern Ireland Public forest estate Oak Quercus spp. OK 6 117.88
Northern Ireland Public forest estate Oak Quercus spp. OK 8 407.33
Northern Ireland Public forest estate Ash Fraxinus excelsior AH 4 120.67
Northern Ireland Public forest estate Ash Fraxinus excelsior AH 6 42.30

131
Country Ownership CARBINE tree species Yield class (m3 ha-1 yr-1)
Area (ha)
Common name Latin name Sp. code Northern Ireland Public forest estate Ash Fraxinus excelsior AH 8 48.20
Northern Ireland Public forest estate Ash Fraxinus excelsior AH 10 1.45
Northern Ireland Public forest estate Ash Fraxinus excelsior AH 12 0.86
Northern Ireland Public forest estate Beech Fagus sylvatica BE 4 7.85
Northern Ireland Public forest estate Beech Fagus sylvatica BE 6 15.23
Northern Ireland Public forest estate Beech Fagus sylvatica BE 8 81.48
Northern Ireland Public forest estate Beech Fagus sylvatica BE 10 35.04
Northern Ireland Public forest estate Birch Betula spp. BI 4 128.96
Northern Ireland Public forest estate Birch Betula spp. BI 6 32.62
Northern Ireland Public forest estate Birch Betula spp. BI 8 41.07
Northern Ireland Public forest estate Birch Betula spp. BI 10 0.31
Northern Ireland Public forest estate Sycamore Acer pseudoplatanus SY 4 99.35
Northern Ireland Public forest estate Sycamore Acer pseudoplatanus SY 6 49.25
Northern Ireland Public forest estate Sycamore Acer pseudoplatanus SY 8 301.47
Northern Ireland Public forest estate Sycamore Acer pseudoplatanus SY 10 5.07
Northern Ireland Public forest estate Sycamore Acer pseudoplatanus SY 12 4.89
Northern Ireland Public forest estate Poplar Populus. spp. PO 4 1.08
Northern Ireland Public forest estate Poplar Populus. spp. PO 6 1.99
Northern Ireland Public forest estate Poplar Populus. spp. PO 8 25.87
Northern Ireland Public forest estate Poplar Populus. spp. PO 10 3.28
Northern Ireland Public forest estate Poplar Populus. spp. PO 14 0.47
Northern Ireland Public forest estate Nothofagus Nothofagus spp. NO 10 2.60
Northern Ireland Private sector Norway spruce Picea abies NS 6 0.46

132
Country Ownership CARBINE tree species Yield class (m3 ha-1 yr-1)
Area (ha)
Common name Latin name Sp. code Northern Ireland Private sector Norway spruce Picea abies NS 8 0.40
Northern Ireland Private sector Norway spruce Picea abies NS 10 1.10
Northern Ireland Private sector Norway spruce Picea abies NS 12 17.20
Northern Ireland Private sector Norway spruce Picea abies NS 14 43.26
Northern Ireland Private sector Norway spruce Picea abies NS 16 247.52
Northern Ireland Private sector Norway spruce Picea abies NS 18 43.38
Northern Ireland Private sector Norway spruce Picea abies NS 20 68.84
Northern Ireland Private sector Norway spruce Picea abies NS 22 0.78
Northern Ireland Private sector Sitka spruce Picea sitchensis SS 6 3.68
Northern Ireland Private sector Sitka spruce Picea sitchensis SS 8 8.01
Northern Ireland Private sector Sitka spruce Picea sitchensis SS 10 50.80
Northern Ireland Private sector Sitka spruce Picea sitchensis SS 12 765.75
Northern Ireland Private sector Sitka spruce Picea sitchensis SS 14 1 198.80
Northern Ireland Private sector Sitka spruce Picea sitchensis SS 16 3 230.31
Northern Ireland Private sector Sitka spruce Picea sitchensis SS 18 986.13
Northern Ireland Private sector Sitka spruce Picea sitchensis SS 20 385.77
Northern Ireland Private sector Sitka spruce Picea sitchensis SS 22 16.12
Northern Ireland Private sector Scots pine Pinus sylvestris SP 4 2.30
Northern Ireland Private sector Scots pine Pinus sylvestris SP 6 8.54
Northern Ireland Private sector Scots pine Pinus sylvestris SP 8 45.96
Northern Ireland Private sector Scots pine Pinus sylvestris SP 10 29.25
Northern Ireland Private sector Scots pine Pinus sylvestris SP 12 116.84
Northern Ireland Private sector Scots pine Pinus sylvestris SP 14 13.13

133
Country Ownership CARBINE tree species Yield class (m3 ha-1 yr-1)
Area (ha)
Common name Latin name Sp. code Northern Ireland Private sector Corsican pine Pinus nigra ssp. laricio CP 6 0.13
Northern Ireland Private sector Corsican pine Pinus nigra ssp. laricio CP 8 0.75
Northern Ireland Private sector Corsican pine Pinus nigra ssp. laricio CP 10 0.91
Northern Ireland Private sector Corsican pine Pinus nigra ssp. laricio CP 12 18.73
Northern Ireland Private sector Corsican pine Pinus nigra ssp. laricio CP 14 0.12
Northern Ireland Private sector Corsican pine Pinus nigra ssp. laricio CP 16 15.68
Northern Ireland Private sector Corsican pine Pinus nigra ssp. laricio CP 18 0.19
Northern Ireland Private sector Lodgepole pine Pinus contorta LP 4 30.22
Northern Ireland Private sector Lodgepole pine Pinus contorta LP 6 77.36
Northern Ireland Private sector Lodgepole pine Pinus contorta LP 8 435.51
Northern Ireland Private sector Lodgepole pine Pinus contorta LP 10 144.88
Northern Ireland Private sector Lodgepole pine Pinus contorta LP 12 62.53
Northern Ireland Private sector Lodgepole pine Pinus contorta LP 14 4.68
Northern Ireland Private sector European larch Larix decidua EL 6 2.43
Northern Ireland Private sector European larch Larix decidua EL 8 19.12
Northern Ireland Private sector European larch Larix decidua EL 10 66.68
Northern Ireland Private sector European larch Larix decidua EL 12 7.16
Northern Ireland Private sector Japanese/hybrid larch Larix kaempferi/L. JL 4 0.43
Northern Ireland Private sector Japanese/hybrid larch Larix kaempferi/L. JL 6 5.08
Northern Ireland Private sector Japanese/hybrid larch Larix kaempferi/L. JL 8 31.79
Northern Ireland Private sector Japanese/hybrid larch Larix kaempferi/L. JL 10 87.54
Northern Ireland Private sector Japanese/hybrid larch Larix kaempferi/L. JL 12 180.91
Northern Ireland Private sector Japanese/hybrid larch Larix kaempferi/L. JL 14 58.57
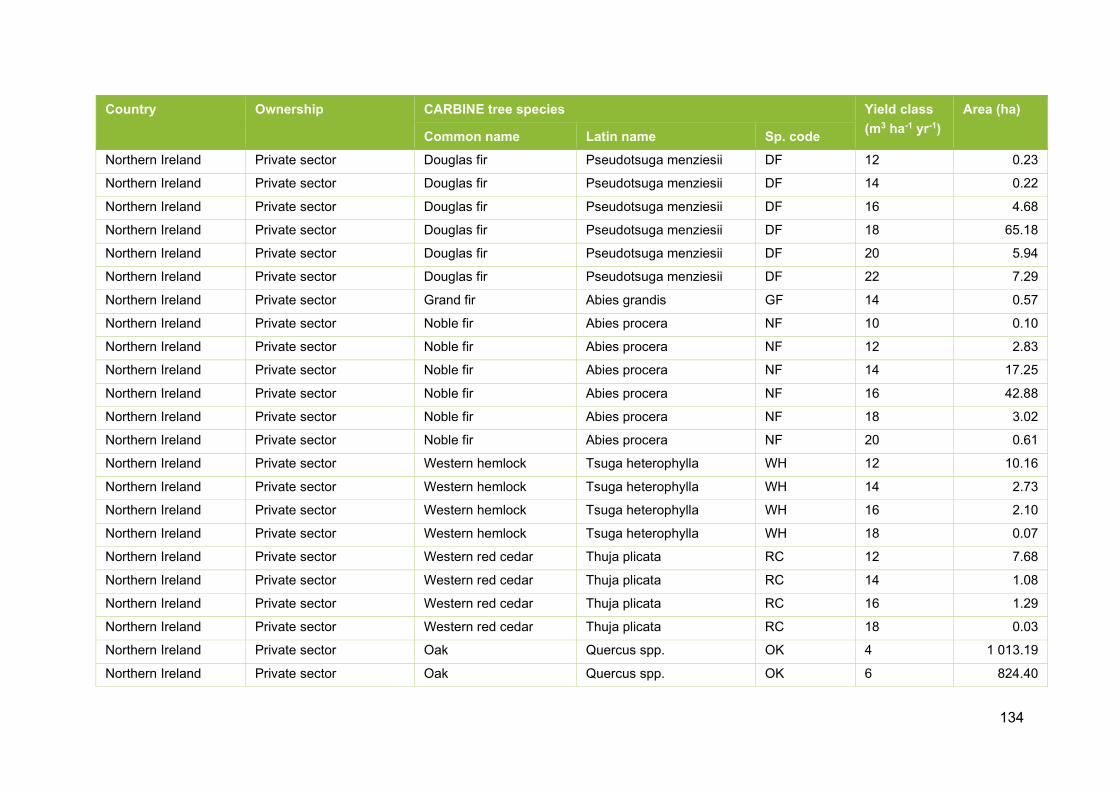
134
Country Ownership CARBINE tree species Yield class (m3 ha-1 yr-1)
Area (ha)
Common name Latin name Sp. code Northern Ireland Private sector Douglas fir Pseudotsuga menziesii DF 12 0.23
Northern Ireland Private sector Douglas fir Pseudotsuga menziesii DF 14 0.22
Northern Ireland Private sector Douglas fir Pseudotsuga menziesii DF 16 4.68
Northern Ireland Private sector Douglas fir Pseudotsuga menziesii DF 18 65.18
Northern Ireland Private sector Douglas fir Pseudotsuga menziesii DF 20 5.94
Northern Ireland Private sector Douglas fir Pseudotsuga menziesii DF 22 7.29
Northern Ireland Private sector Grand fir Abies grandis GF 14 0.57
Northern Ireland Private sector Noble fir Abies procera NF 10 0.10
Northern Ireland Private sector Noble fir Abies procera NF 12 2.83
Northern Ireland Private sector Noble fir Abies procera NF 14 17.25
Northern Ireland Private sector Noble fir Abies procera NF 16 42.88
Northern Ireland Private sector Noble fir Abies procera NF 18 3.02
Northern Ireland Private sector Noble fir Abies procera NF 20 0.61
Northern Ireland Private sector Western hemlock Tsuga heterophylla WH 12 10.16
Northern Ireland Private sector Western hemlock Tsuga heterophylla WH 14 2.73
Northern Ireland Private sector Western hemlock Tsuga heterophylla WH 16 2.10
Northern Ireland Private sector Western hemlock Tsuga heterophylla WH 18 0.07
Northern Ireland Private sector Western red cedar Thuja plicata RC 12 7.68
Northern Ireland Private sector Western red cedar Thuja plicata RC 14 1.08
Northern Ireland Private sector Western red cedar Thuja plicata RC 16 1.29
Northern Ireland Private sector Western red cedar Thuja plicata RC 18 0.03
Northern Ireland Private sector Oak Quercus spp. OK 4 1 013.19
Northern Ireland Private sector Oak Quercus spp. OK 6 824.40

135
Country Ownership CARBINE tree species Yield class (m3 ha-1 yr-1)
Area (ha)
Common name Latin name Sp. code Northern Ireland Private sector Oak Quercus spp. OK 8 2 848.76
Northern Ireland Private sector Ash Fraxinus excelsior AH 4 843.94
Northern Ireland Private sector Ash Fraxinus excelsior AH 6 295.86
Northern Ireland Private sector Ash Fraxinus excelsior AH 8 337.13
Northern Ireland Private sector Ash Fraxinus excelsior AH 10 10.11
Northern Ireland Private sector Ash Fraxinus excelsior AH 12 5.98
Northern Ireland Private sector Beech Fagus sylvatica BE 4 54.94
Northern Ireland Private sector Beech Fagus sylvatica BE 6 106.48
Northern Ireland Private sector Beech Fagus sylvatica BE 8 569.87
Northern Ireland Private sector Beech Fagus sylvatica BE 10 245.05
Northern Ireland Private sector Birch Betula spp. BI 4 901.90
Northern Ireland Private sector Birch Betula spp. BI 6 228.13
Northern Ireland Private sector Birch Betula spp. BI 8 287.25
Northern Ireland Private sector Birch Betula spp. BI 10 2.17
Northern Ireland Private sector Sycamore Acer pseudoplatanus SY 4 694.81
Northern Ireland Private sector Sycamore Acer pseudoplatanus SY 6 344.47
Northern Ireland Private sector Sycamore Acer pseudoplatanus SY 8 2 108.38
Northern Ireland Private sector Sycamore Acer pseudoplatanus SY 10 35.42
Northern Ireland Private sector Sycamore Acer pseudoplatanus SY 12 34.21
Northern Ireland Private sector Poplar Populus. spp. PO 4 7.55
Northern Ireland Private sector Poplar Populus. spp. PO 6 13.95
Northern Ireland Private sector Poplar Populus. spp. PO 8 180.96
Northern Ireland Private sector Poplar Populus. spp. PO 10 22.93

136
Country Ownership CARBINE tree species Yield class (m3 ha-1 yr-1)
Area (ha)
Common name Latin name Sp. code Northern Ireland Private sector Poplar Populus. spp. PO 14 3.28
Northern Ireland Private sector Nothofagus Nothofagus spp. NO 10 18.19
137
Annex 3 Worked examples of detailed calculation of detailed Forest Management Practices
Introduction
The following analysis steps were carried out by referring to standard yield models (Matthews et al., 2016) for combinations of tree species and yield class and for the following management treatments:
• No thinning
• Standard thinning.
An initial tree planting spacing was selected equivalent to that referred to for the tree species in the CARBINE model.
Models involving no thinning
An output file was produced containing a result on each row, for each combination of tree species and yield class.
Each row of results consisted of:
1. Tree species
2. Yield class
3. Age of maximum MAI or the age at which the last full volume thinning is scheduled in the yield model.
4. A value P, where P is defined below.
P is calculated as:
(0.9 / S) x 100
where S = 1 + F1
and F1 = crown expansion factor for the tree species, taken from the CARBINE model.

138
Example (1): Calculations for Sitka spruce, Yield Class 12, no thinning, 1.7 metre initial planting spacing
• Select a yield model consistent with the specification above, i.e. select model for SS, YC12, no thin, 1.7 metre spacing (standard spacing for models for this species), see Figure A3.1.
• Find the age of maximum MAI or the age of the last full volume thinning in the yield model, by reviewing the yield model with thinning for the equivalent combination of Species, Yield Class and initial planting spacing, and setting age of maximum MAI as last age of full MT volume thinning, defined as 70% of the yield class × thinning cycle (usually 5 years, e.g. 0.7 × 12 × 5 = 42 m3 ha-1). For this example the relevant age is 54 years.
Figure A3.1. Example yield table for unthinned Sitka spruce.
The value “P” is calculated as 1 plus the crown expansion factor from the CARBINE model for the tree species. In this example this is 1 + 0.32 = 1.32. P is calculated as (0.9 / 1.32) × 100 = 68.18.
Models involving standard thinning
An output file was produced containing a result on each row, for each combination of tree species and yield class.
Each row of results consisted of:
1. Tree species
2. Yield class
3. Age of first thinning (as represented in the yield model)
4. Age of maximum MAI or last full volume thinning
5. Q1, where Q1 is defined below
Species Yield class Thinning treatment Max MAI age Initial spacing Stand areaSitka spruce 12 No Thinning 54 1.7 1
Age yrs Top ht m Trees /ha Mean dbh cm
BA m²/ha Mean vol m³ Vol m³/ha Percent mortality
MAI vol m³/ha /yr
19 7 3317 10 25 0.02 63 0 3.324 9.6 3087 12 36 0.04 129 0 5.429 12.2 2806 14 46 0.07 210 0 7.334 14.7 2567 16 53 0.12 298 1 8.839 16.9 2271 18 57 0.17 385 3 9.844 19 2009 20 61 0.23 466 4 10.549 20.8 1794 21 63 0.3 536 6 10.954 22.4 1625 23 65 0.37 595 8 1159 23.7 1498 24 67 0.43 645 9 10.964 24.8 1404 25 69 0.49 686 11 10.769 25.7 1330 26 70 0.54 721 12 10.474 26.5 1266 27 71 0.59 752 12 10.179 27.3 1209 28 72 0.65 780 13 9.9
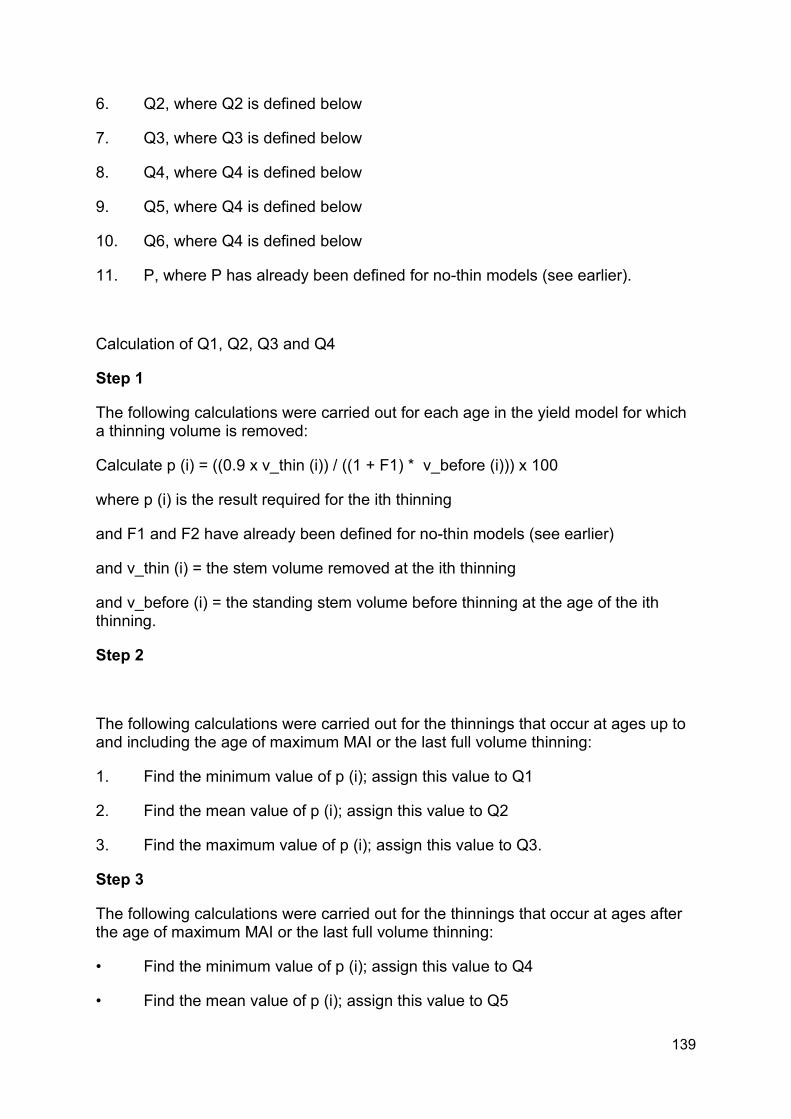
139
6. Q2, where Q2 is defined below
7. Q3, where Q3 is defined below
8. Q4, where Q4 is defined below
9. Q5, where Q4 is defined below
10. Q6, where Q4 is defined below
11. P, where P has already been defined for no-thin models (see earlier).
Calculation of Q1, Q2, Q3 and Q4
Step 1
The following calculations were carried out for each age in the yield model for which a thinning volume is removed:
Calculate p (i) = ((0.9 x v_thin (i)) / ((1 + F1) * v_before (i))) x 100
where p (i) is the result required for the ith thinning
and F1 and F2 have already been defined for no-thin models (see earlier)
and v_thin (i) = the stem volume removed at the ith thinning
and v_before (i) = the standing stem volume before thinning at the age of the ith thinning.
Step 2
The following calculations were carried out for the thinnings that occur at ages up to and including the age of maximum MAI or the last full volume thinning:
1. Find the minimum value of p (i); assign this value to Q1
2. Find the mean value of p (i); assign this value to Q2
3. Find the maximum value of p (i); assign this value to Q3.
Step 3
The following calculations were carried out for the thinnings that occur at ages after the age of maximum MAI or the last full volume thinning:
• Find the minimum value of p (i); assign this value to Q4
• Find the mean value of p (i); assign this value to Q5

140
• Find the maximum value of p (i); assign this value to Q6.
Step 4
This step was only carried out for yield models where initial thinnings occur before the first ‘standard’ thinning (see Example 1 for definition of standard thinning).
Calculate p = ((0.9 x v_thin) / ((1 + F1) * v_before)) x 100
where p is the result required for the (non-standard) initial thinning
and F1 has already been defined for no-thin models (see earlier)
and v_thin = the stem volume removed at the initial thinning
and v_before = the standing stem volume before thinning at the age of the initial thinning.
Report the calculated value separately from other thinnings.
Example (2): Scots pine, Yield Class 8, intermediate thinning, 1.4 metre initial planting spacing.
• Select a yield model consistent with the specification above, i.e. select model for SP, YC8, intermediate thin, 1.4 metre spacing (standard spacing for models for this species), see Figure A3.2.
• For each age in the yield model with a thinning, a value “p” is calculated. For example, for the first thinning in this example, “p” is calculated as:
p = ((0.9 × 28) / (1 + 0.34) × 105.3)) × 100 = 17.9
Figure A3.2. Example yield table for thinned Scots pine.
For this example, the following values of “p” can be calculated for the 9 thinnings prior to age of maximum MAI: 17.9, 14.8, 12.2, 10.2, 8.7, 7.7, 6.9, 6.3, 5.9.
Species Yield class Thinning treatment Initial spacing Stand areaScots pine 8 Intermediate 1.4 11st thin delay 1st thin type 1st thin age 2nd thin age Max MAI age Sub thin type Late thin age Late thin
cycle
0 years INTERMEDIATE 29 years 34 years 79 years INTERMEDIATE N/A N/AMAI
Age yrs Top ht m Trees /ha Mean dbh cm BA m²/ha Mean vol m³ Vol m³/ha Trees /ha Mean dbh cm
BA m²/ha
Mean vol m³
Vol m³/ha
BA m²/ha
Vol m³/ha
Vol m³/ha
/yr
19 6.2 4652 7 19 0.01 34 0 0 0 0 0 19 34 1.824 8.1 4273 9 25 0.01 64 0 0 0 0 0 25 64 2.729 9.9 3819 10 32 0.03 105 1323 10 11 0.02 28 32 105 3.634 11.6 2407 12 27 0.05 127 747 11 7 0.04 28 38 155 4.639 13.2 1660 14 27 0.09 155 402 13 5 0.07 28 45 211 5.444 14.7 1258 17 29 0.15 185 251 15 4 0.11 28 52 269 6.149 16 1007 20 30 0.21 215 172 17 4 0.16 28 58 327 6.754 17.2 836 22 32 0.29 245 124 19 4 0.23 28 63 385 7.159 18.3 712 25 34 0.38 273 93 22 3 0.3 28 68 441 7.564 19.4 618 27 35 0.48 299 72 24 3 0.39 28 73 495 7.769 20.3 546 29 36 0.59 321 57 26 3 0.49 28 78 545 7.974 21.1 489 31 37 0.69 339 42 28 3 0.58 25 81 591 879 21.8 447 33 38 0.79 355 32 30 2 0.67 22 85 631 884 22.4 415 34 38 0.89 368 27 31 2 0.68 19 87 666 7.989 22.9 388 35 38 0.98 379 19 33 2 0.81 16 89 696 7.894 23.3 368 36 38 1.06 390 15 34 1 0.9 13 91 722 7.799 23.7 354 37 39 1.13 399 11 35 1 0.97 10 93 745 7.5
MAIN CROP before thinning Yield from THINNINGS CUMULATIVE PRODUCTION

141
Step 2 involves reviewing the results from Step 1 for the thinnings up to and including the age of maximum MAI to find the following values:
Q1 = minimum value = 5.9
Q2 = mean value = 10 (mean of the 9 qualifying thinning events listed above)
Q3 = maximum value = 17.9 (see equation above).
Step 3 involves repeating the same process as Step 2, but for the thinnings occurring after the defined age of maximum MAI. In this example there are 16 thinnings after the age of maximum MAI. The calculated values of “p” are: 4.9, 4.1, 3.4, 2.8, 2.2, 1.7, 1.3, 1.0, 0.8, 0.6, 0.5, 0.4, 0.3, 0.2, 0.2, 0.1. The results are reviewed to find the following values:
Q4 = minimum value = 0.1
Q5 = mean value = 1.5 (mean of the 16 qualifying thinning events listed above)
Q6 = maximum value = 4.9.
Example (3): Oak, Yield Class 6, intermediate thin, 1.2 metre initial planting spacing.
This example is similar to Example 2 above. However, it includes a non-standard initial (pre-commercial) thinning reported separately from the results of the other steps in the process.
• Select a yield model consistent with the specification above, i.e. select model for OK, YC6, intermediate thinning, 1.2 metre spacing (standard spacing for models for this species), see Figure A3.3.
• For each age in the yield model with a thinning, a value “p” is calculated. For example, for the first thinning in this example, “p” is calculated as:
p = ((0.9 × 21) / (1 + 0.24) × 97.3)) × 100 = 15.7
Figure A3.3. Example yield table for thinned oak.
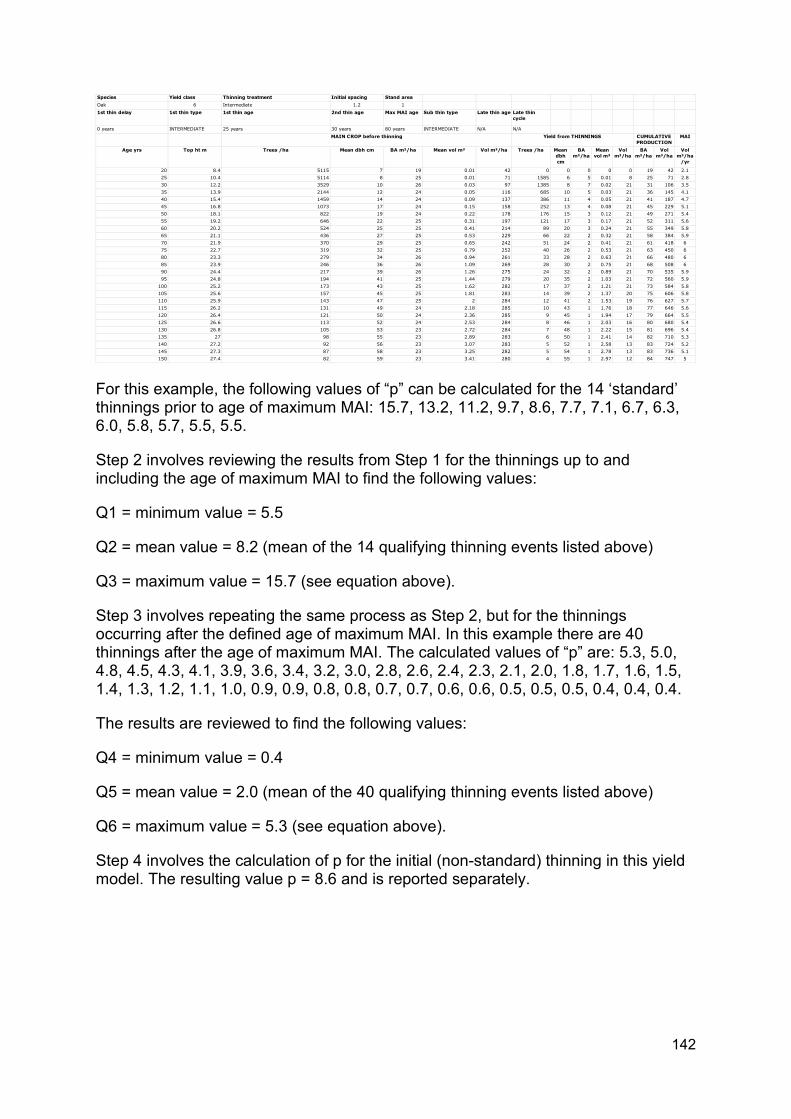
142
For this example, the following values of “p” can be calculated for the 14 ‘standard’ thinnings prior to age of maximum MAI: 15.7, 13.2, 11.2, 9.7, 8.6, 7.7, 7.1, 6.7, 6.3, 6.0, 5.8, 5.7, 5.5, 5.5.
Step 2 involves reviewing the results from Step 1 for the thinnings up to and including the age of maximum MAI to find the following values:
Q1 = minimum value = 5.5
Q2 = mean value = 8.2 (mean of the 14 qualifying thinning events listed above)
Q3 = maximum value = 15.7 (see equation above).
Step 3 involves repeating the same process as Step 2, but for the thinnings occurring after the defined age of maximum MAI. In this example there are 40 thinnings after the age of maximum MAI. The calculated values of “p” are: 5.3, 5.0, 4.8, 4.5, 4.3, 4.1, 3.9, 3.6, 3.4, 3.2, 3.0, 2.8, 2.6, 2.4, 2.3, 2.1, 2.0, 1.8, 1.7, 1.6, 1.5, 1.4, 1.3, 1.2, 1.1, 1.0, 0.9, 0.9, 0.8, 0.8, 0.7, 0.7, 0.6, 0.6, 0.5, 0.5, 0.5, 0.4, 0.4, 0.4.
The results are reviewed to find the following values:
Q4 = minimum value = 0.4
Q5 = mean value = 2.0 (mean of the 40 qualifying thinning events listed above)
Q6 = maximum value = 5.3 (see equation above).
Step 4 involves the calculation of p for the initial (non-standard) thinning in this yield model. The resulting value p = 8.6 and is reported separately.
Species Yield class Thinning treatment Initial spacing Stand areaOak 6 Intermediate 1.2 11st thin delay 1st thin type 1st thin age 2nd thin age Max MAI age Sub thin type Late thin age Late thin
cycle
0 years INTERMEDIATE 25 years 30 years 80 years INTERMEDIATE N/A N/AMAI
Age yrs Top ht m Trees /ha Mean dbh cm BA m²/ha Mean vol m³ Vol m³/ha Trees /ha Mean dbh cm
BA m²/ha
Mean vol m³
Vol m³/ha
BA m²/ha
Vol m³/ha
Vol m³/ha
/yr
20 8.4 5115 7 19 0.01 42 0 0 0 0 0 19 42 2.125 10.4 5114 8 25 0.01 71 1585 6 5 0.01 8 25 71 2.830 12.2 3529 10 26 0.03 97 1385 8 7 0.02 21 31 106 3.535 13.9 2144 12 24 0.05 116 685 10 5 0.03 21 36 145 4.140 15.4 1459 14 24 0.09 137 386 11 4 0.05 21 41 187 4.745 16.8 1073 17 24 0.15 158 252 13 4 0.08 21 45 229 5.150 18.1 822 19 24 0.22 178 176 15 3 0.12 21 49 271 5.455 19.2 646 22 25 0.31 197 121 17 3 0.17 21 52 311 5.660 20.2 524 25 25 0.41 214 89 20 3 0.24 21 55 349 5.865 21.1 436 27 25 0.53 229 66 22 2 0.32 21 58 384 5.970 21.9 370 29 25 0.65 242 51 24 2 0.41 21 61 418 675 22.7 319 32 25 0.79 252 40 26 2 0.53 21 63 450 680 23.3 279 34 26 0.94 261 33 28 2 0.63 21 66 480 685 23.9 246 36 26 1.09 269 28 30 2 0.75 21 68 508 690 24.4 217 39 26 1.26 275 24 32 2 0.89 21 70 535 5.995 24.8 194 41 25 1.44 279 20 35 2 1.03 21 72 560 5.9
100 25.2 173 43 25 1.62 282 17 37 2 1.21 21 73 584 5.8105 25.6 157 45 25 1.81 283 14 39 2 1.37 20 75 606 5.8110 25.9 143 47 25 2 284 12 41 2 1.53 19 76 627 5.7115 26.2 131 49 24 2.18 285 10 43 1 1.76 18 77 646 5.6120 26.4 121 50 24 2.36 285 9 45 1 1.94 17 79 664 5.5125 26.6 113 52 24 2.53 284 8 46 1 2.03 16 80 680 5.4130 26.8 105 53 23 2.72 284 7 48 1 2.22 15 81 696 5.4135 27 98 55 23 2.89 283 6 50 1 2.41 14 82 710 5.3140 27.2 92 56 23 3.07 283 5 52 1 2.58 13 83 724 5.2145 27.3 87 58 23 3.25 282 5 54 1 2.78 13 83 736 5.1150 27.4 82 59 23 3.41 280 4 55 1 2.97 12 84 747 5
MAIN CROP before thinning Yield from THINNINGS CUMULATIVE PRODUCTION
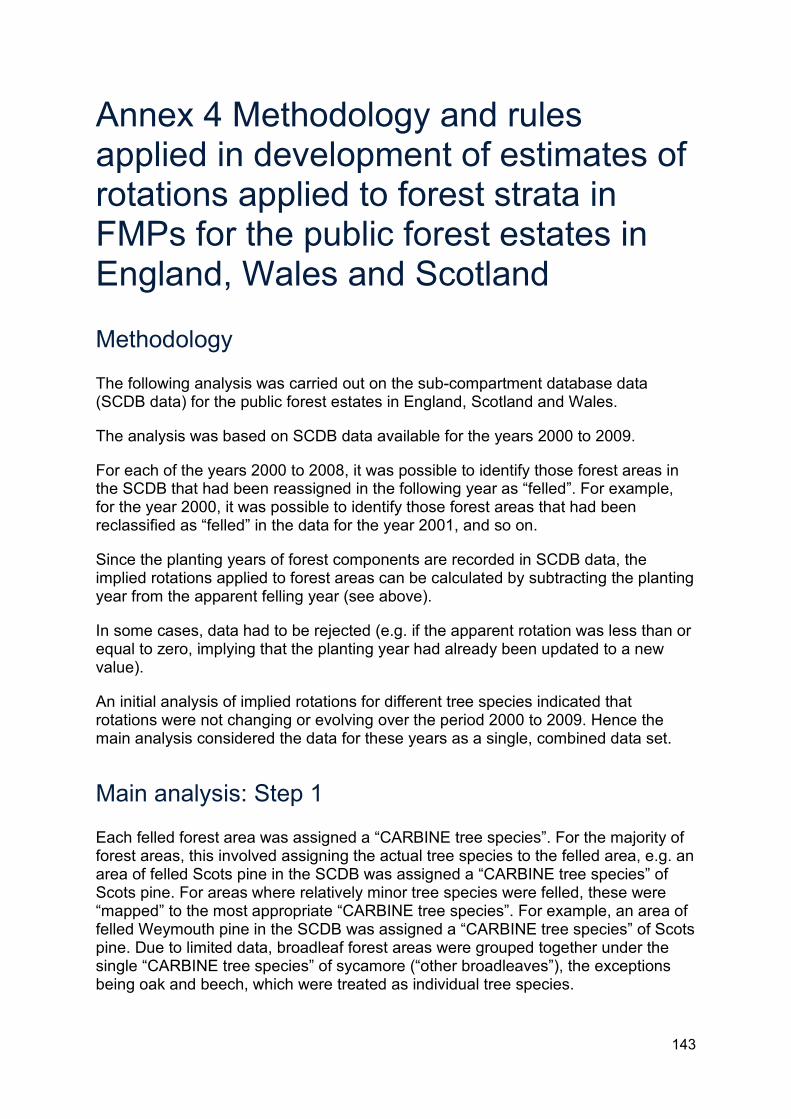
143
Annex 4 Methodology and rules applied in development of estimates of rotations applied to forest strata in FMPs for the public forest estates in England, Wales and Scotland
Methodology
The following analysis was carried out on the sub-compartment database data (SCDB data) for the public forest estates in England, Scotland and Wales.
The analysis was based on SCDB data available for the years 2000 to 2009.
For each of the years 2000 to 2008, it was possible to identify those forest areas in the SCDB that had been reassigned in the following year as “felled”. For example, for the year 2000, it was possible to identify those forest areas that had been reclassified as “felled” in the data for the year 2001, and so on.
Since the planting years of forest components are recorded in SCDB data, the implied rotations applied to forest areas can be calculated by subtracting the planting year from the apparent felling year (see above).
In some cases, data had to be rejected (e.g. if the apparent rotation was less than or equal to zero, implying that the planting year had already been updated to a new value).
An initial analysis of implied rotations for different tree species indicated that rotations were not changing or evolving over the period 2000 to 2009. Hence the main analysis considered the data for these years as a single, combined data set.
Main analysis: Step 1
Each felled forest area was assigned a “CARBINE tree species”. For the majority of forest areas, this involved assigning the actual tree species to the felled area, e.g. an area of felled Scots pine in the SCDB was assigned a “CARBINE tree species” of Scots pine. For areas where relatively minor tree species were felled, these were “mapped” to the most appropriate “CARBINE tree species”. For example, an area of felled Weymouth pine in the SCDB was assigned a “CARBINE tree species” of Scots pine. Due to limited data, broadleaf forest areas were grouped together under the single “CARBINE tree species” of sycamore (“other broadleaves”), the exceptions being oak and beech, which were treated as individual tree species.
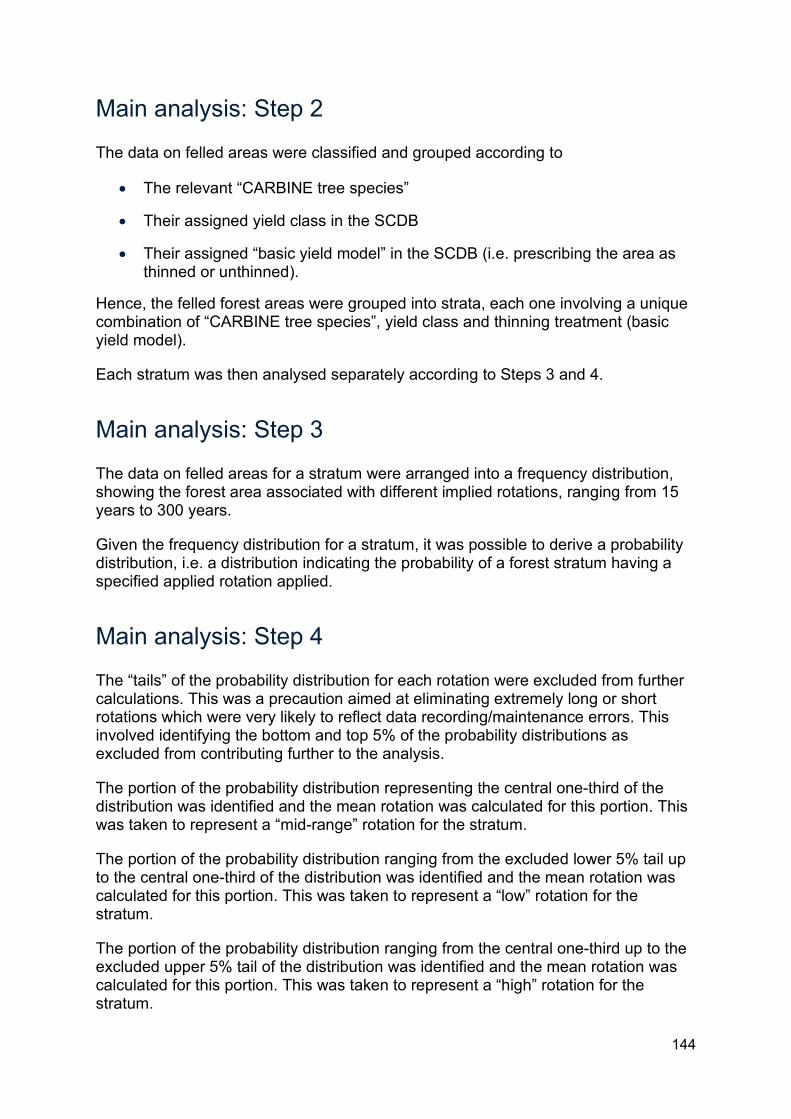
144
Main analysis: Step 2
The data on felled areas were classified and grouped according to
• The relevant “CARBINE tree species”
• Their assigned yield class in the SCDB
• Their assigned “basic yield model” in the SCDB (i.e. prescribing the area as thinned or unthinned).
Hence, the felled forest areas were grouped into strata, each one involving a unique combination of “CARBINE tree species”, yield class and thinning treatment (basic yield model).
Each stratum was then analysed separately according to Steps 3 and 4.
Main analysis: Step 3
The data on felled areas for a stratum were arranged into a frequency distribution, showing the forest area associated with different implied rotations, ranging from 15 years to 300 years.
Given the frequency distribution for a stratum, it was possible to derive a probability distribution, i.e. a distribution indicating the probability of a forest stratum having a specified applied rotation applied.
Main analysis: Step 4
The “tails” of the probability distribution for each rotation were excluded from further calculations. This was a precaution aimed at eliminating extremely long or short rotations which were very likely to reflect data recording/maintenance errors. This involved identifying the bottom and top 5% of the probability distributions as excluded from contributing further to the analysis.
The portion of the probability distribution representing the central one-third of the distribution was identified and the mean rotation was calculated for this portion. This was taken to represent a “mid-range” rotation for the stratum.
The portion of the probability distribution ranging from the excluded lower 5% tail up to the central one-third of the distribution was identified and the mean rotation was calculated for this portion. This was taken to represent a “low” rotation for the stratum.
The portion of the probability distribution ranging from the central one-third up to the excluded upper 5% tail of the distribution was identified and the mean rotation was calculated for this portion. This was taken to represent a “high” rotation for the stratum.

145
In this way, “low”, “mid-range” and “high” rotations were estimated for each stratum, i.e. for each combination of “CARBINE tree species”, basic yield model (“no thinning”, “thinning”) and yield class.
Rules
A set of rules was needed to deal with situations where no data were available for estimating “low”, “mid-range” and “high” rotations for a stratum, or where data were so few that estimation was unreliable.
Rules 1 to 4 below deal with situations that arose in the data sets available for England, Scotland and Wales. Rules covering other possible situations/cases were not needed because they did not occur in the data.
Rule 1
Rule 1 is applied to the results for each yield class, as obtained in each country, for a combination of “CARBINE tree species” and “basic yield model”.
IF:
The total felled forest area available in the data, used for estimating the “low”, mid-range” and “high” rotations for the yield class is less than 10 ha OR There are no data available for the yield class.
THEN:
Do not use the estimates obtained (if any) for the yield class Instead, apply the estimates obtained from the data set formed by combining all yield classes for the “CARBINE tree species” and “basic yield model” (after applying Rules 1 to 3).
Variations to the action under Rule 1 were considered, such as applying the results for another yield class, where these were valid. However, the alternative actions added complexity to the process and it was decided that they were unlikely to result in significant improvements to the estimation of rotations.
Rule 2
Consider the following data sets for each of England, Scotland and Wales:
Data set 1: data for a given combination of a “CARBINE tree species” and a “basic yield model” of “no thinning”, taking data for all yield classes together Data set 2: data for a given combination of a “CARBINE tree species” and a “basic yield model” of “thinning”, taking data for all yield classes together.
IF, in any one country:
Data set 1 (“no thinning”) represents a total felled forest area less than 100 ha AND Data set 2 (“thinning”) represents a total felled forest area less than 100 ha AND

146
Data sets 1 and 2 combined represent a total felled forest area less than 100 ha.
THEN:
Combine data sets 1 and 2 (for the “CARBINE tree species”) and also combine the data sets available for England, Scotland and Wales into a single data set. Use this combined data set to estimate “low”, “mid-range” and “high” rotations for each yield class and assume these apply for the “CARBINE tree species” and both cases of “no thinning” and “thinning”. The above calculations should be carried separately out for each yield class represented in the data, and also for the data set formed by combining all yield classes.
Rule 3
Consider the following data sets for each of England, Scotland and Wales:
Data set 1: data for a given combination of a “CARBINE tree species” and a “basic yield model” of “no thinning”, taking data for all yield classes together Data set 2: data for a given combination of a “CARBINE tree species” and a “basic yield model” of “thinning, taking data for all yield classes together.
IF, in any one country:
Data set 1 (no thinning) represents a total felled forest area less than 100 ha AND Data set 2 (thinning) represents a total felled forest area of at least 100 ha.
THEN:
Do not use data set 1 Use data set 2 (for the “CARBINE tree species” and “thinning”) to estimate “low”, “mid-range” and “high” rotations for each yield class and assume these apply for the “CARBINE tree species” and “no thinning”, as well as for the case involving “thinning”. The above calculations should be carried separately out for each yield class represented in the data, and for the data set formed by combining all yield classes.
Rule 4
IF Rules 2 and 3 do not apply, then this should mean that, in each country:
Data set 1 (no thinning) represents a total felled forest area of at least 100 ha AND Data set 2 (thinning) represents a total felled forest area of at least 100 ha.
THEN:
Use data set 1 to estimate “low”, “mid-range” and “high” rotations for each yield class, for the case of “CARBINE tree species” and “no thinning” Use data set 2 to estimate “low”, “mid-range” and “high” rotations for each yield class, for the case of “CARBINE tree species” and “thinning”. The above calculations should be carried separately out for each yield class represented in the data, and for the data set formed by combining all yield classes.

147
Annex 5 Description of detailed Forest Management Practices (FMPs)
Forest Management Practice involving no harvesting
Forest management practice Silvicultural operations with no final harvesting, no thinning
Index Name of Practice Comments
FMP1 No thinning, no clearcutting
PFE and private sector; all species; all yield classes
Public forest estate (England, Scotland and Wales): Forest Management Practices involving clearcutting with no thinning during the rotation
Note that three rotations are assigned for each FMP. Equal proportions of forest area within a stratum are assigned to each of the 3 rotations.
FMP Silvicultural operations with final harvesting – No thinning Final cutting
Index Name of practice Age (years) % biomass removals
Low Mid-range High FMP2 NSYC2NTE 48 52 59 67
FMP3 NSYC2NTS 43 48 78 67
FMP4 NSYC2NTW 42 51 60 67
FMP5 NSYC4NTE 48 52 59 67
FMP6 NSYC4NTS 45 55 72 67
FMP7 NSYC4NTW 42 51 60 67
FMP8 NSYC6NTE 48 51 55 66
FMP9 NSYC6NTS 45 57 71 66
FMP10 NSYC6NTW 58 81 81 66
FMP11 NSYC8NTE 48 52 60 66
FMP12 NSYC8NTS 40 48 61 66
FMP13 NSYC8NTW 47 63 70 66
FMP14 NSYC10NTE 49 52 58 66

148
FMP Silvicultural operations with final harvesting – No thinning Final cutting
Index Name of practice Age (years) % biomass removals
Low Mid-range High FMP15 NSYC10NTS 42 47 57 66
FMP16 NSYC10NTW 42 57 67 66
FMP17 NSYC12NTE 46 53 62 66
FMP18 NSYC12NTS 42 48 55 66
FMP19 NSYC12NTW 44 51 61 66
FMP20 NSYC14NTE 52 54 57 66
FMP21 NSYC14NTS 43 48 53 66
FMP22 NSYC14NTW 47 51 58 66
FMP23 NSYC16NTE 43 55 66 66
FMP24 NSYC16NTS 40 48 54 66
FMP25 NSYC16NTW 39 47 54 66
FMP26 NSYC18NTE 48 52 59 66
FMP27 NSYC18NTS 42 46 51 66
FMP28 NSYC18NTW 41 47 55 66
FMP29 NSYC20NTE 48 52 59 66
FMP30 NSYC20NTS 35 44 50 66
FMP31 NSYC20NTW 38 41 48 66
FMP32 NSYC22NTE 48 52 59 66
FMP33 NSYC22NTS 42 42 44 66
FMP34 NSYC22NTW 42 51 60 66
FMP35 NSYC24NTE 48 52 59 72
FMP36 NSYC24NTS 42 48 55 72
FMP37 NSYC26NTS 42 48 55 72
FMP38 SSYC2NTE 41 50 61 67
FMP39 SSYC2NTS 37 44 53 67
FMP40 SSYC2NTW 44 49 51 67
FMP41 SSYC4NTE 47 52 59 67
FMP42 SSYC4NTS 42 52 54 67
FMP43 SSYC4NTW 44 55 56 67
FMP44 SSYC6NTE 46 52 59 68
FMP45 SSYC6NTS 38 46 57 68
FMP46 SSYC6NTW 38 45 48 68
FMP47 SSYC8NTE 45 50 55 68
FMP48 SSYC8NTS 35 43 53 68
FMP49 SSYC8NTW 38 42 52 68

149
FMP Silvicultural operations with final harvesting – No thinning Final cutting
Index Name of practice Age (years) % biomass removals
Low Mid-range High FMP50 SSYC10NTE 44 50 54 68
FMP51 SSYC10NTS 36 44 51 68
FMP52 SSYC10NTW 37 45 53 68
FMP53 SSYC12NTE 42 49 54 68
FMP54 SSYC12NTS 34 42 49 68
FMP55 SSYC12NTW 38 45 51 68
FMP56 SSYC14NTE 37 45 52 68
FMP57 SSYC14NTS 33 39 48 68
FMP58 SSYC14NTW 37 44 51 68
FMP59 SSYC16NTE 30 39 48 68
FMP60 SSYC16NTS 32 39 47 68
FMP61 SSYC16NTW 34 42 50 68
FMP62 SSYC18NTE 25 35 44 68
FMP63 SSYC18NTS 31 37 44 68
FMP64 SSYC18NTW 36 43 47 68
FMP65 SSYC20NTE 25 30 34 68
FMP66 SSYC20NTS 31 36 43 68
FMP67 SSYC20NTW 34 39 47 68
FMP68 SSYC22NTE 23 29 45 68
FMP69 SSYC22NTS 30 38 45 68
FMP70 SSYC22NTW 32 39 41 68
FMP71 SSYC24NTE 39 48 54 68
FMP72 SSYC24NTS 32 35 39 68
FMP73 SSYC24NTW 32 40 45 68
FMP74 SSYC26NTE 39 48 54 72
FMP75 SSYC26NTS 30 30 30 72
FMP76 SSYC28NTS 33 40 48 72
FMP77 SSYC30NTS 33 40 48 72
FMP78 SPYC2NTE 45 48 57 67
FMP79 SPYC2NTS 41 45 52 67
FMP80 SPYC2NTW 46 51 55 67
FMP81 SPYC4NTE 45 48 57 67
FMP82 SPYC4NTS 37 50 76 67
FMP83 SPYC4NTW 46 51 55 67
FMP84 SPYC6NTE 45 48 57 67

150
FMP Silvicultural operations with final harvesting – No thinning Final cutting
Index Name of practice Age (years) % biomass removals
Low Mid-range High FMP85 SPYC6NTS 42 48 55 67
FMP86 SPYC6NTW 46 51 55 67
FMP87 SPYC8NTE 43 49 60 67
FMP88 SPYC8NTS 41 45 51 67
FMP89 SPYC8NTW 49 54 64 67
FMP90 SPYC10NTE 44 47 55 67
FMP91 SPYC10NTS 40 45 50 67
FMP92 SPYC10NTW 46 50 52 67
FMP93 SPYC12NTE 46 49 59 67
FMP94 SPYC12NTS 40 44 50 67
FMP95 SPYC12NTW 46 49 52 67
FMP96 SPYC14NTE 43 47 53 67
FMP97 SPYC14NTS 41 45 52 67
FMP98 SPYC14NTW 46 51 55 67
FMP99 SPYC16NTE 46 51 53 73
FMP100 SPYC16NTS 41 45 52 73
FMP101 CPYC2NTE 38 48 64 67
FMP102 CPYC2NTS 46 50 63 67
FMP103 CPYC2NTW 41 46 55 67
FMP104 CPYC4NTS 46 50 63 67
FMP105 CPYC4NTW 41 46 55 67
FMP106 CPYC6NTE 38 48 64 73
FMP107 CPYC6NTS 50 50 54 73
FMP108 CPYC6NTW 41 46 55 73
FMP109 CPYC8NTE 38 48 64 73
FMP110 CPYC8NTS 48 63 65 73
FMP111 CPYC8NTW 45 49 66 73
FMP112 CPYC10NTE 38 48 64 73
FMP113 CPYC10NTS 47 46 46 73
FMP114 CPYC10NTW 40 47 53 73
FMP115 CPYC12NTE 38 41 56 73
FMP116 CPYC12NTS 46 48 48 73
FMP117 CPYC12NTW 39 43 45 73
FMP118 CPYC14NTE 38 58 61 73
FMP119 CPYC14NTS 46 50 63 73

151
FMP Silvicultural operations with final harvesting – No thinning Final cutting
Index Name of practice Age (years) % biomass removals
Low Mid-range High FMP120 CPYC14NTW 43 43 44 73
FMP121 CPYC16NTE 41 49 60 73
FMP122 CPYC16NTW 41 46 55 73
FMP123 CPYC18NTE 38 48 64 73
FMP124 CPYC18NTW 41 46 55 73
FMP125 CPYC20NTW 41 46 55 73
FMP126 CPYC22NTW 41 46 55 72
FMP127 LPYC2NTE 46 48 49 67
FMP128 LPYC2NTS 28 32 42 67
FMP129 LPYC2NTW 36 41 46 67
FMP130 LPYC4NTE 41 47 50 67
FMP131 LPYC4NTS 23 41 47 67
FMP132 LPYC4NTW 38 44 49 67
FMP133 LPYC6NTE 39 44 48 67
FMP134 LPYC6NTS 36 42 47 67
FMP135 LPYC6NTW 41 45 48 67
FMP136 LPYC8NTE 38 40 46 67
FMP137 LPYC8NTS 34 39 44 67
FMP138 LPYC8NTW 38 42 45 67
FMP139 LPYC10NTE 36 40 47 67
FMP140 LPYC10NTS 32 37 42 67
FMP141 LPYC10NTW 37 39 43 67
FMP142 LPYC12NTE 39 45 48 67
FMP143 LPYC12NTS 32 35 40 67
FMP144 LPYC12NTW 33 35 40 67
FMP145 LPYC14NTE 39 45 48 67
FMP146 LPYC14NTS 30 31 34 67
FMP147 LPYC14NTW 33 33 34 67
FMP148 LPYC16NTS 33 39 45 73
FMP149 LPYC16NTW 36 41 46 73
FMP150 ELYC2NTS 45 52 75 80
FMP151 ELYC4NTE 73 76 77 80
FMP152 ELYC4NTS 44 53 71 80
FMP153 ELYC4NTW 50 52 66 80
FMP154 ELYC6NTE 45 70 74 80

152
FMP Silvicultural operations with final harvesting – No thinning Final cutting
Index Name of practice Age (years) % biomass removals
Low Mid-range High FMP155 ELYC6NTS 49 79 84 80
FMP156 ELYC6NTW 50 52 66 80
FMP157 ELYC8NTE 46 57 71 80
FMP158 ELYC8NTS 46 51 62 80
FMP159 ELYC8NTW 50 52 66 80
FMP160 ELYC10NTE 46 56 63 80
FMP161 ELYC10NTS 43 46 52 80
FMP162 ELYC10NTW 50 52 66 80
FMP163 ELYC12NTE 39 42 54 80
FMP164 ELYC12NTS 44 48 61 80
FMP165 ELYC12NTW 50 52 66 80
FMP166 ELYC14NTE 43 57 73 76
FMP167 ELYC14NTS 45 52 75 76
FMP168 ELYC16NTS 45 52 75 73
FMP169 JLYC2NTE 41 49 53 76
FMP170 JLYC2NTS 38 45 52 76
FMP171 JLYC2NTW 38 45 51 76
FMP172 JLYC4NTE 39 47 50 76
FMP173 JLYC4NTS 31 39 46 76
FMP174 JLYC4NTW 42 45 47 76
FMP175 JLYC6NTE 36 49 52 76
FMP176 JLYC6NTS 35 42 49 76
FMP177 JLYC6NTW 32 39 51 76
FMP178 JLYC8NTE 42 46 56 76
FMP179 JLYC8NTS 39 44 49 76
FMP180 JLYC8NTW 36 43 50 76
FMP181 JLYC10NTE 44 47 53 76
FMP182 JLYC10NTS 41 47 50 76
FMP183 JLYC10NTW 39 45 51 76
FMP184 JLYC12NTE 47 50 52 76
FMP185 JLYC12NTS 43 47 51 76
FMP186 JLYC12NTW 40 45 53 76
FMP187 JLYC14NTE 41 49 53 76
FMP188 JLYC14NTS 42 47 49 76
FMP189 JLYC14NTW 39 43 50 76

153
FMP Silvicultural operations with final harvesting – No thinning Final cutting
Index Name of practice Age (years) % biomass removals
Low Mid-range High FMP190 JLYC16NTE 41 49 53 73
FMP191 JLYC16NTS 39 45 50 73
FMP192 JLYC16NTW 38 45 51 73
FMP193 JLYC20NTS 39 45 50 73
FMP194 DFYC2NTE 37 43 51 67
FMP195 DFYC2NTS 38 46 51 67
FMP196 DFYC2NTW 42 47 51 67
FMP197 DFYC6NTS 38 46 51 67
FMP198 DFYC8NTE 37 43 51 71
FMP199 DFYC8NTS 38 43 53 71
FMP200 DFYC8NTW 42 47 51 71
FMP201 DFYC10NTE 43 48 54 71
FMP202 DFYC10NTS 40 49 52 71
FMP203 DFYC10NTW 42 47 51 71
FMP204 DFYC12NTE 39 46 51 71
FMP205 DFYC12NTS 40 47 50 71
FMP206 DFYC12NTW 42 47 51 71
FMP207 DFYC14NTE 35 42 50 71
FMP208 DFYC14NTS 42 45 50 71
FMP209 DFYC14NTW 42 47 52 71
FMP210 DFYC16NTE 36 41 47 71
FMP211 DFYC16NTS 31 37 49 71
FMP212 DFYC16NTW 44 47 57 71
FMP213 DFYC18NTE 35 41 49 71
FMP214 DFYC18NTS 38 46 51 71
FMP215 DFYC18NTW 42 45 48 71
FMP216 DFYC20NTE 35 39 57 71
FMP217 DFYC20NTS 38 46 51 71
FMP218 DFYC20NTW 45 47 49 71
FMP219 DFYC22NTE 34 41 45 71
FMP220 DFYC22NTS 38 46 51 71
FMP221 DFYC22NTW 42 47 51 71
FMP222 DFYC24NTE 39 45 49 71
FMP223 DFYC24NTS 38 46 51 71
FMP224 DFYC24NTW 42 47 51 71

154
FMP Silvicultural operations with final harvesting – No thinning Final cutting
Index Name of practice Age (years) % biomass removals
Low Mid-range High FMP225 DFYC26NTS 38 46 51 72
FMP226 GFYC2NTSW 35 42 47 67
FMP227 GFYC4NTSW 35 42 47 67
FMP228 GFYC8NTS 35 42 47 68
FMP229 GFYC10NTS 35 42 47 68
FMP230 GFYC12NTE 40 43 48 72
FMP231 GFYC12NTSW 35 42 47 72
FMP232 GFYC14NTE 31 38 47 72
FMP233 GFYC14NTSW 40 43 48 72
FMP234 GFYC16NTE 37 43 49 72
FMP235 GFYC16NTSW 31 38 47 72
FMP236 GFYC18NTE 38 44 47 72
FMP237 GFYC18NTSW 37 43 49 72
FMP238 GFYC20NTE 37 42 46 72
FMP239 GFYC20NTSW 38 44 47 72
FMP240 GFYC22NTE 35 41 43 72
FMP241 GFYC22NTSW 37 42 46 72
FMP242 GFYC24NTE 35 42 47 72
FMP243 GFYC24NTSW 35 41 43 72
FMP244 GFYC26NTE 33 35 36 72
FMP245 GFYC26NTSW 35 42 47 72
FMP246 GFYC28NTE 35 42 47 72
FMP247 GFYC28NTSW 33 35 36 72
FMP248 GFYC30NTSW 35 42 47 72
FMP249 NFYC2NTS 37 43 48 67
FMP250 NFYC4NTSW 37 43 48 67
FMP251 NFYC6NTSW 37 43 48 68
FMP252 NFYC8NTSW 37 43 48 68
FMP253 NFYC10NTESW 35 39 45 70
FMP254 NFYC12NTESW 35 40 45 70
FMP255 NFYC14NTESW 36 42 48 70
FMP256 NFYC16NTESW 39 44 49 70
FMP257 NFYC18NTSW 38 42 46 70
FMP258 NFYC20NTSW 37 45 48 70
FMP259 NFYC22NTESW 38 42 47 70

155
FMP Silvicultural operations with final harvesting – No thinning Final cutting
Index Name of practice Age (years) % biomass removals
Low Mid-range High FMP260 NFYC24NTSW 37 43 48 72
FMP261 NFYC26NTS 37 43 48 72
FMP262 NFYC28NTS 37 43 48 72
FMP263 WHYC2NTSW 38 43 49 67
FMP264 WHYC4NTS 38 43 49 67
FMP265 WHYC6NTSW 38 43 49 68
FMP266 WHYC8NTESW 38 43 49 68
FMP267 WHYC10NTESW 43 51 61 68
FMP268 WHYC12NTESW 41 46 52 76
FMP269 WHYC14NTESW 40 45 50 76
FMP270 WHYC16NTESW 39 43 49 76
FMP271 WHYC18NTESW 37 43 48 76
FMP272 WHYC20NTESW 36 40 45 76
FMP273 WHYC22NTESW 37 41 48 76
FMP274 WHYC24NTSW 36 41 49 76
FMP275 WHYC26NTS 38 43 49 72
FMP276 RCYC2NTSW 43 43 44 67
FMP277 RCYC4NTS 38 44 54 67
FMP278 RCYC6NTS 38 44 54 68
FMP279 RCYC8NTESW 38 44 54 68
FMP280 RCYC10NTESW 46 52 64 68
FMP281 RCYC12NTESW 44 52 58 67
FMP282 RCYC14NTESW 39 47 57 67
FMP283 RCYC16NTESW 38 40 44 67
FMP284 RCYC18NTESW 36 45 54 67
FMP285 RCYC20NTESW 35 38 45 67
FMP286 RCYC22NTESW 36 42 49 67
FMP287 RCYC24NTES 36 38 43 67
FMP288 RCYC24NTW 36 38 43 67

156
Public forest estate (England, Scotland and Wales): Forest Management Practices involving clearcutting with thinning during the rotation
Note that three rotations are assigned for each FMP. Equal proportions of forest area within a stratum are assigned to each of the 3 rotations.
Forest management practice
Silvicultural operations with final harvesting – Thinning
Index Name of practice
Initial thinning Main thinnings Late-rotation thinnings Final cutting
Age (yrs)
% biomass removals
Age of first (yrs)
No. (5 yr cycle)
% biomass removals
Age of first (yrs)
No. (5 yr cycle)
% biomass removals
Age (years)
% biomass removals
ID Name IT
Age
IT
%BR
MT
Age
MT
cyc.
MT
%BR
LRT
Age
LRT
Cyc.
LRT
%BR
FC
Age
FC
%BR

157
ID Name IT Age
IT %BR
MT Age
MT cyc
MT % BR LRT Age
LRT cyc
LRT % BR FC Age (years) FC % BR min mid max min mid max low mid high
FMP289 NSYC2THE - 0 40 9 4.7 8.0 14 85 8 0.3 1.8 4.2 42 50 60 67
FMP290 NSYC2THS - 0 40 9 4.7 8.0 14 85 8 0.3 1.8 4.2 46 57 68 67
FMP291 NSYC2THW - 0 40 9 4.7 8.0 14 85 8 0.3 1.8 4.2 42 53 64 67
FMP292 NSYC4THE - 0 40 9 4.7 8.0 14 85 8 0.3 1.8 4.2 42 50 60 67
FMP293 NSYC4THS - 0 40 9 4.7 8.0 14 85 8 0.3 1.8 4.2 51 61 75 67
FMP294 NSYC4THW - 0 40 9 4.7 8.0 14 85 8 0.3 1.8 4.2 44 51 60 67
FMP295 NSYC6THE - 0 35 7 6.1 10 16 70 34 0.1 1.1 5.2 49 58 63 66
FMP296 NSYC6THS - 0 35 7 6.1 10 16 70 34 0.1 1.1 5.2 50 58 70 66
FMP297 NSYC6THW - 0 35 7 6.1 10 16 70 34 0.1 1.1 5.2 45 49 59 66
FMP298 NSYC8THE - 0 31 8 5.9 10 17 71 45 0.4 1.4 4.5 43 52 63 66
FMP299 NSYC8THS - 0 31 8 5.9 10 17 71 45 0.4 1.4 4.5 47 56 65 66

158
ID Name IT Age
IT %BR
MT Age
MT cyc
MT % BR LRT Age
LRT cyc
LRT % BR FC Age (years) FC % BR min mid max min mid max low mid high
FMP300 NSYC8THW - 0 31 8 5.9 10 17 71 45 0.4 1.4 4.5 50 59 67 66
FMP301 NSYC10THE - 0 28 8 6.3 11 20 68 46 0.3 1.4 5.1 44 50 57 66
FMP302 NSYC10THS - 0 28 8 6.3 11 20 68 46 0.3 1.4 5.1 46 53 63 66
FMP303 NSYC10THW - 0 28 8 6.3 11 20 68 46 0.3 1.4 5.1 48 58 66 66
FMP304 NSYC12THE - 0 26 8 6.6 12 22 66 46 0.8 1.8 5.6 42 54 61 66
FMP305 NSYC12THS - 0 26 8 6.6 12 22 66 46 0.8 1.8 5.6 45 51 58 66
FMP306 NSYC12THW - 0 26 8 6.6 12 22 66 46 0.8 1.8 5.6 46 52 61 66
FMP307 NSYC14THE - 0 24 9 6.5 12 24 69 45 0.5 1.6 5.0 40 51 57 66
FMP308 NSYC14THS - 0 24 9 6.5 12 24 69 45 0.5 1.6 5.0 44 50 56 66
FMP309 NSYC14THW - 0 24 9 6.5 12 24 69 45 0.5 1.6 5.0 48 53 59 66
FMP310 NSYC16THE - 0 23 8 7.1 13 25 63 47 0.2 1.4 6.1 37 45 54 66
FMP311 NSYC16THS - 0 23 8 7.1 13 25 63 47 0.2 1.4 6.1 42 49 56 66

159
ID Name IT Age
IT %BR
MT Age
MT cyc
MT % BR LRT Age
LRT cyc
LRT % BR FC Age (years) FC % BR min mid max min mid max low mid high
FMP312 NSYC16THW - 0 23 8 7.1 13 25 63 47 0.2 1.4 6.1 41 50 55 66
FMP313 NSYC18THE - 0 22 8 7.3 13 26 62 47 0.2 1.4 6.3 37 41 48 66
FMP314 NSYC18THS - 0 22 8 7.3 13 26 62 47 0.2 1.4 6.3 40 49 54 66
FMP315 NSYC18THW - 0 22 8 7.3 13 26 62 47 0.2 1.4 6.3 42 47 54 66
FMP316 NSYC20THE - 0 21 8 7.5 14 28 61 47 0.1 1.3 6.6 36 39 45 66
FMP317 NSYC20THS - 0 21 8 7.5 14 28 61 47 0.1 1.3 6.6 40 49 54 66
FMP318 NSYC20THW - 0 21 8 7.5 14 28 61 47 0.1 1.3 6.6 37 43 47 66
FMP319 NSYC22THE - 0 20 8 7.8 15 30 60 44 0.1 1.2 6.8 30 38 42 66
FMP320 NSYC22THS - 0 20 8 7.8 15 30 60 44 0.1 1.2 6.8 46 53 55 66
FMP321 NSYC22THW - 0 20 8 7.8 15 30 60 44 0.1 1.2 6.8 37 44 50 66
FMP322 NSYC24THE - 0 21 5 10 16 27 46 28 0.1 1.5 7.2 42 50 60 72
FMP323 NSYC24THW - 0 21 5 10 16 27 46 28 0.1 1.5 7.2 44 51 60 72

160
ID Name IT Age
IT %BR
MT Age
MT cyc
MT % BR LRT Age
LRT cyc
LRT % BR FC Age (years) FC % BR min mid max min mid max low mid high
FMP324 NSYC30THE - 0 21 5 10 16 27 46 28 0.1 1.5 7.2 42 50 60 72
FMP325 SSYC2THE - 0 40 9 4.7 8.0 14 85 8 0.3 1.8 4.2 51 56 73 67
FMP326 SSYC2THS - 0 40 9 4.7 8.0 14 85 8 0.3 1.8 4.2 40 47 55 67
FMP327 SSYC2THW - 0 40 9 4.7 8.0 14 85 8 0.3 1.8 4.2 35 43 55 67
FMP328 SSYC4THE - 0 40 9 4.7 8.0 14 85 8 0.3 1.8 4.2 54 60 60 67
FMP329 SSYC4THS - 0 40 9 4.7 8.0 14 85 8 0.3 1.8 4.2 41 50 53 67
FMP330 SSYC4THW - 0 40 9 4.7 8.0 14 85 8 0.3 1.8 4.2 31 35 46 67
FMP331 SSYC6THE - 0 33 5 6.7 10 14 58 46 0.3 1.4 5.6 48 52 61 68
FMP332 SSYC6THS - 0 33 5 6.7 10 14 58 46 0.3 1.4 5.6 39 51 59 68
FMP333 SSYC6THW - 0 33 5 6.7 10 14 58 46 0.3 1.4 5.6 40 45 60 68
FMP334 SSYC8THE - 0 29 6 6.9 11 17 59 47 0.5 1.5 5.1 41 50 56 68
FMP335 SSYC8THS - 0 29 6 6.9 11 17 59 47 0.5 1.5 5.1 37 48 59 68

161
ID Name IT Age
IT %BR
MT Age
MT cyc
MT % BR LRT Age
LRT cyc
LRT % BR FC Age (years) FC % BR min mid max min mid max low mid high
FMP336 SSYC8THW - 0 29 6 6.9 11 17 59 47 0.5 1.5 5.1 40 48 56 68
FMP337 SSYC10THE - 0 26 6 7.5 12 20 56 47 0.2 1.2 5.7 43 50 58 68
FMP338 SSYC10THS - 0 26 6 7.5 12 20 56 47 0.2 1.2 5.7 41 51 57 68
FMP339 SSYC10THW - 0 26 6 7.5 12 20 56 47 0.2 1.2 5.7 39 47 55 68
FMP340 SSYC12THE - 0 24 6 8.0 13 22 54 44 0.1 1.2 6.2 42 50 58 68
FMP341 SSYC12THS - 0 24 6 8.0 13 22 54 44 0.1 1.2 6.2 37 48 55 68
FMP342 SSYC12THW - 0 24 6 8.0 13 22 54 44 0.1 1.2 6.2 39 47 54 68
FMP343 SSYC14THE - 0 22 6 8.5 15 25 52 38 0.1 1.3 6.7 37 49 55 68
FMP344 SSYC14THS - 0 22 6 8.5 15 25 52 38 0.1 1.3 6.7 36 46 53 68
FMP345 SSYC14THW - 0 22 6 8.5 15 25 52 38 0.1 1.3 6.7 38 44 52 68
FMP346 SSYC16THE - 0 21 6 8.7 15 26 51 41 0.1 1.3 6.8 34 40 52 68
FMP347 SSYC16THS - 0 21 6 8.7 15 26 51 41 0.1 1.3 6.8 35 43 51 68

162
ID Name IT Age
IT %BR
MT Age
MT cyc
MT % BR LRT Age
LRT cyc
LRT % BR FC Age (years) FC % BR min mid max min mid max low mid high
FMP348 SSYC16THW - 0 21 6 8.7 15 26 51 41 0.1 1.3 6.8 38 45 53 68
FMP349 SSYC18THE - 0 20 5 10 17 26 45 42 0.1 1.5 8.8 32 37 48 68
FMP350 SSYC18THS - 0 20 5 10 17 26 45 42 0.1 1.5 8.8 32 38 47 68
FMP351 SSYC18THW - 0 20 5 10 17 26 45 42 0.1 1.5 8.8 34 40 48 68
FMP352 SSYC20THE - 0 19 6 9.2 16 27 49 40 0.1 1.3 7.1 30 33 41 68
FMP353 SSYC20THS - 0 19 6 9.2 16 27 49 40 0.1 1.3 7.1 31 35 44 68
FMP354 SSYC20THW - 0 19 6 9.2 16 27 49 40 0.1 1.3 7.1 33 39 45 68
FMP355 SSYC22THE - 0 18 6 9.5 16 28 48 39 0.1 1.4 7.3 30 33 37 68
FMP356 SSYC22THS - 0 18 6 9.5 16 28 48 39 0.1 1.4 7.3 30 35 42 68
FMP357 SSYC22THW - 0 18 6 9.5 16 28 48 39 0.1 1.4 7.3 30 37 46 68
FMP358 SSYC24THE - 0 18 5 10 17 26 43 44 0.1 1.4 8.6 32 37 42 68
FMP359 SSYC24THS - 0 18 5 10 17 26 43 44 0.1 1.4 8.6 27 34 42 68

163
ID Name IT Age
IT %BR
MT Age
MT cyc
MT % BR LRT Age
LRT cyc
LRT % BR FC Age (years) FC % BR min mid max min mid max low mid high
FMP360 SSYC24THW - 0 18 5 10 17 26 43 44 0.1 1.4 8.6 31 35 39 68
FMP361 SSYC26THE - 0 20 5 10 18 30 45 32 0.1 1.4 7.6 36 47 56 72
FMP362 SSYC26THS - 0 20 5 10 18 30 45 32 0.1 1.4 7.6 22 31 36 72
FMP363 SSYC26THW - 0 20 5 10 18 30 45 32 0.1 1.4 7.6 37 44 52 72
FMP364 SSYC28THE - 0 20 4 12 19 29 40 35 0.1 1.6 10.2 36 47 56 72
FMP365 SSYC28THS - 0 20 4 12 19 29 40 35 0.1 1.6 10.2 34 43 52 72
FMP366 SSYC30THS - 0 19 5 11 19 32 44 38 0.1 1.4 8.0 34 43 52 72
FMP367 SPYC2THE - 0 40 9 4.7 8.0 14 85 8 0.3 1.8 4.2 52 52 53 67
FMP368 SPYC2THS - 0 40 9 4.7 8.0 14 85 8 0.3 1.8 4.2 45 51 61 67
FMP369 SPYC2THW - 0 40 9 4.7 8.0 14 85 8 0.3 1.8 4.2 47 52 63 67
FMP370 SPYC4THE - 0 40 9 4.7 8.0 14 85 8 0.3 1.8 4.2 48 61 73 67
FMP371 SPYC4THS - 0 40 9 4.7 8.0 14 85 8 0.3 1.8 4.2 48 60 73 67

164
ID Name IT Age
IT %BR
MT Age
MT cyc
MT % BR LRT Age
LRT cyc
LRT % BR FC Age (years) FC % BR min mid max min mid max low mid high
FMP372 SPYC4THW - 0 40 9 4.7 8.0 14 85 8 0.3 1.8 4.2 52 54 68 67
FMP373 SPYC6THE - 0 33 10 5.1 8.7 16 83 12 0.2 1.4 3.9 57 68 75 67
FMP374 SPYC6THS - 0 33 10 5.1 8.7 16 83 12 0.2 1.4 3.9 45 53 65 67
FMP375 SPYC6THW - 0 33 10 5.1 8.7 16 83 12 0.2 1.4 3.9 59 63 66 67
FMP376 SPYC8THE - 0 29 9 5.9 10 18 74 16 0.1 1.5 4.9 49 66 75 67
FMP377 SPYC8THS - 0 29 9 5.9 10 18 74 16 0.1 1.5 4.9 44 52 63 67
FMP378 SPYC8THW - 0 29 9 5.9 10 18 74 16 0.1 1.5 4.9 46 51 60 67
FMP379 SPYC10THE - 0 25 8 6.9 12 21 65 20 0.1 1.8 6.1 52 65 74 67
FMP380 SPYC10THS - 0 25 8 6.9 12 21 65 20 0.1 1.8 6.1 44 50 58 67
FMP381 SPYC10THW - 0 25 8 6.9 12 21 65 20 0.1 1.8 6.1 46 51 61 67
FMP382 SPYC12THE - 0 23 8 7.2 12 21 63 25 0.1 1.6 6.1 48 58 70 67
FMP383 SPYC12THS - 0 23 8 7.2 12 21 63 25 0.1 1.6 6.1 47 50 54 67

165
ID Name IT Age
IT %BR
MT Age
MT cyc
MT % BR LRT Age
LRT cyc
LRT % BR FC Age (years) FC % BR min mid max min mid max low mid high
FMP384 SPYC12THW - 0 23 8 7.2 12 21 63 25 0.1 1.6 6.1 44 51 55 67
FMP385 SPYC14THE - 0 21 7 8.4 14 23 56 28 0.1 1.8 7.3 43 49 59 67
FMP386 SPYC14THS - 0 21 7 8.4 14 23 56 28 0.1 1.8 7.3 47 49 52 67
FMP387 SPYC14THW - 0 21 7 8.4 14 23 56 28 0.1 1.8 7.3 47 52 63 67
FMP388 SPYC16THE - 0 20 5 11 16 23 45 50 1.2 2.3 9.5 44 53 58 73
FMP389 SPYC16THS - 0 20 5 11 16 23 45 50 1.2 2.3 9.5 45 51 61 73
FMP390 SPYC16THW - 0 20 5 11 16 23 45 50 1.2 2.3 9.5 47 52 63 73
FMP391 SPYC18THE - 0 19 6 10 16 25 49 49 1.4 2.3 8.1 48 61 73 73
FMP392 SPYC18THS - 0 19 6 10 16 25 49 49 1.4 2.3 8.1 45 51 61 73
FMP393 SPYC20THW - 0 18 6 11 17 27 48 50 1.1 2.2 8.2 47 52 63 73
FMP394 CPYC2THE - 0 40 9 4.7 8.0 14 85 8 0.3 1.8 4.2 52 55 57 67
FMP395 CPYC2THS - 0 40 9 4.7 8.0 14 85 8 0.3 1.8 4.2 46 50 63 67

166
ID Name IT Age
IT %BR
MT Age
MT cyc
MT % BR LRT Age
LRT cyc
LRT % BR FC Age (years) FC % BR min mid max min mid max low mid high
FMP396 CPYC4THE - 0 40 9 4.7 8.0 14 85 8 0.3 1.8 4.2 43 52 61 67
FMP397 CPYC4THS - 0 40 9 4.7 8.0 14 85 8 0.3 1.8 4.2 46 50 63 67
FMP398 CPYC4THW - 0 40 9 4.7 8.0 14 85 8 0.3 1.8 4.2 41 46 55 67
FMP399 CPYC6THE - 0 33 6 6.6 8.8 12 63 47 0.5 1.7 5.3 43 52 61 73
FMP400 CPYC6THS - 0 33 6 6.6 8.8 12 63 47 0.5 1.7 5.3 50 50 54 73
FMP401 CPYC6THW - 0 33 6 6.6 8.8 12 63 47 0.5 1.7 5.3 41 46 55 73
FMP402 CPYC8THE - 0 28 6 7.6 10 15 58 48 0.7 1.8 6.1 45 55 61 73
FMP403 CPYC8THS - 0 28 6 7.6 10 15 58 48 0.7 1.8 6.1 48 63 65 73
FMP404 CPYC8THW - 0 28 6 7.6 10 15 58 48 0.7 1.8 6.1 41 46 55 73
FMP405 CPYC10THE - 0 25 6 8.3 12 17 55 48 0.8 2.0 6.8 43 55 64 73
FMP406 CPYC10THS - 0 25 6 8.3 12 17 55 48 0.8 2.0 6.8 47 46 46 73
FMP407 CPYC10THW - 0 25 6 8.3 12 17 55 48 0.8 2.0 6.8 45 49 66 73

167
ID Name IT Age
IT %BR
MT Age
MT cyc
MT % BR LRT Age
LRT cyc
LRT % BR FC Age (years) FC % BR min mid max min mid max low mid high
FMP408 CPYC12THE - 0 23 6 8.8 13 19 53 49 0.8 2.0 7.1 45 52 61 73
FMP409 CPYC12THS - 0 23 6 8.8 13 19 53 49 0.8 2.0 7.1 46 48 48 73
FMP410 CPYC12THW - 0 23 6 8.8 13 19 53 49 0.8 2.0 7.1 40 47 53 73
FMP411 CPYC14THE - 0 21 6 9.5 14 22 51 49 1.8 2.5 7.8 44 52 63 73
FMP412 CPYC14THS - 0 21 6 9.5 14 22 51 49 1.8 2.5 7.8 46 50 63 73
FMP413 CPYC14THW - 0 21 6 9.5 14 22 51 49 1.8 2.5 7.8 39 43 45 73
FMP414 CPYC16THE - 0 20 5 11 16 23 45 50 1.2 2.3 9.5 44 51 59 73
FMP415 CPYC16THW - 0 20 5 11 16 23 45 50 1.2 2.3 9.5 43 43 44 73
FMP416 CPYC18THE - 0 19 6 10 16 25 49 49 1.4 2.3 8.1 34 46 56 73
FMP417 CPYC18THW - 0 19 6 10 16 25 49 49 1.4 2.3 8.1 41 46 55 73
FMP418 CPYC20THE - 0 18 6 11 17 27 48 50 1.1 2.2 8.2 34 39 46 73
FMP419 CPYC20THW - 0 18 6 11 17 27 48 50 1.1 2.2 8.2 41 46 55 73

168
ID Name IT Age
IT %BR
MT Age
MT cyc
MT % BR LRT Age
LRT cyc
LRT % BR FC Age (years) FC % BR min mid max min mid max low mid high
FMP420 CPYC22THE - 0 21 5 10 17 28 46 28 0.1 1.5 7.4 43 52 61 72
FMP421 CPYC22THW - 0 21 5 10 17 28 46 28 0.1 1.5 7.4 41 46 55 72
FMP422 LPYC2THE - 0 40 5 5.4 6.5 7.9 65 46 1.1 1.8 4.9 33 33 36 67
FMP423 LPYC2THS - 0 40 5 5.4 6.5 7.9 65 46 1.1 1.8 4.9 37 38 45 67
FMP424 LPYC2THW - 0 40 5 5.4 6.5 7.9 65 46 1.1 1.8 4.9 36 43 49 67
FMP425 LPYC4THE - 0 40 5 5.4 6.5 7.9 65 46 1.1 1.8 4.9 39 48 65 67
FMP426 LPYC4THS - 0 40 5 5.4 6.5 7.9 65 46 1.1 1.8 4.9 42 48 57 67
FMP427 LPYC4THW - 0 40 5 5.4 6.5 7.9 65 46 1.1 1.8 4.9 32 42 49 67
FMP428 LPYC6THE - 0 31 7 6.0 7.9 11 66 46 1.6 2.3 4.8 38 40 47 67
FMP429 LPYC6THS - 0 31 7 6.0 7.9 11 66 46 1.6 2.3 4.8 41 45 51 67
FMP430 LPYC6THW - 0 31 7 6.0 7.9 11 66 46 1.6 2.3 4.8 42 45 49 67
FMP431 LPYC8THE - 0 26 7 6.8 10 14 61 47 1.8 2.6 5.6 36 40 45 67

169
ID Name IT Age
IT %BR
MT Age
MT cyc
MT % BR LRT Age
LRT cyc
LRT % BR FC Age (years) FC % BR min mid max min mid max low mid high
FMP432 LPYC8THS - 0 26 7 6.8 10 14 61 47 1.8 2.6 5.6 35 40 46 67
FMP433 LPYC8THW - 0 26 7 6.8 10 14 61 47 1.8 2.6 5.6 39 45 50 67
FMP434 LPYC10THE - 0 23 7 7.4 11 17 58 48 2.4 3.0 6.2 33 37 44 67
FMP435 LPYC10THS - 0 23 7 7.4 11 17 58 48 2.4 3.0 6.2 34 36 44 67
FMP436 LPYC10THW - 0 23 7 7.4 11 17 58 48 2.4 3.0 6.2 35 38 42 67
FMP437 LPYC12THE - 0 21 7 7.9 12 19 56 48 2.2 2.9 6.6 31 40 49 67
FMP438 LPYC12THS - 0 21 7 7.9 12 19 56 48 2.2 2.9 6.6 30 36 44 67
FMP439 LPYC12THW - 0 21 7 7.9 12 19 56 48 2.2 2.9 6.6 34 35 38 67
FMP440 LPYC14THE - 0 19 7 8.4 13 23 54 48 1.2 2.5 7.0 35 40 47 67
FMP441 LPYC14THS - 0 19 7 8.4 13 23 54 48 1.2 2.5 7.0 35 41 48 67
FMP442 LPYC14THW - 0 19 7 8.4 13 23 54 48 1.2 2.5 7.0 32 32 33 67
FMP443 LPYC16THE - 0 20 5 11 16 23 45 50 1.2 2.3 9.5 35 40 47 73

170
ID Name IT Age
IT %BR
MT Age
MT cyc
MT % BR LRT Age
LRT cyc
LRT % BR FC Age (years) FC % BR min mid max min mid max low mid high
FMP444 LPYC16THS - 0 20 5 11 16 23 45 50 1.2 2.3 9.5 35 41 48 73
FMP445 LPYC16THW - 0 20 5 11 16 23 45 50 1.2 2.3 9.5 36 43 49 73
FMP446 LPYC18THE - 0 19 6 10 16 25 49 49 1.4 2.3 8.1 35 40 47 73
FMP447 LPYC20THE - 0 18 6 11 17 27 48 50 1.1 2.2 8.2 35 40 47 73
FMP448 LPYC20THS - 0 18 6 11 17 27 48 50 1.1 2.2 8.2 35 41 48 73
FMP449 ELYC2THE - 0 32 5 7.5 10 14 57 11 0.4 2.2 5.9 43 57 73 80
FMP450 ELYC2THS - 0 32 5 7.5 10 14 57 11 0.4 2.2 5.9 43 52 63 80
FMP451 ELYC2THW - 0 32 5 7.5 10 14 57 11 0.4 2.2 5.9 58 66 78 80
FMP452 ELYC4THE - 0 32 5 7.5 10 14 57 11 0.4 2.2 5.9 73 76 77 80
FMP453 ELYC4THS - 0 32 5 7.5 10 14 57 11 0.4 2.2 5.9 43 52 63 80
FMP454 ELYC4THW - 0 32 5 7.5 10 14 57 11 0.4 2.2 5.9 58 66 78 80
FMP455 ELYC6THE - 0 26 5 9.1 13 18 51 16 0.3 2.4 7.9 45 70 74 80

171
ID Name IT Age
IT %BR
MT Age
MT cyc
MT % BR LRT Age
LRT cyc
LRT % BR FC Age (years) FC % BR min mid max min mid max low mid high
FMP456 ELYC6THS - 0 26 5 9.1 13 18 51 16 0.3 2.4 7.9 44 51 66 80
FMP457 ELYC6THW - 0 26 5 9.1 13 18 51 16 0.3 2.4 7.9 75 77 77 80
FMP458 ELYC8THE - 0 22 6 9.6 14 22 52 20 0.3 2.1 7.1 46 57 71 80
FMP459 ELYC8THS - 0 22 6 9.6 14 22 52 20 0.3 2.1 7.1 42 53 65 80
FMP460 ELYC8THW - 0 22 6 9.6 14 22 52 20 0.3 2.1 7.1 58 66 78 80
FMP461 ELYC10THE - 0 20 5 11 16 24 45 27 0.2 2.3 9.2 46 56 63 80
FMP462 ELYC10THS - 0 20 5 11 16 24 45 27 0.2 2.3 9.2 46 50 57 80
FMP463 ELYC10THW - 0 20 5 11 16 24 45 27 0.2 2.3 9.2 58 66 78 80
FMP464 ELYC12THE - 0 18 5 12 18 26 43 34 0.2 2.2 9.9 39 42 54 80
FMP465 ELYC12THS - 0 18 5 12 18 26 43 34 0.2 2.2 9.9 43 52 63 80
FMP466 ELYC12THW - 0 18 5 12 18 26 43 34 0.2 2.2 9.9 58 66 78 80
FMP467 ELYC14THE - 0 14 6 12 20 34 44 46 4.7 10 76 43 57 73 76

172
ID Name IT Age
IT %BR
MT Age
MT cyc
MT % BR LRT Age
LRT cyc
LRT % BR FC Age (years) FC % BR min mid max min mid max low mid high
FMP468 ELYC14THS - 0 14 6 12 20 34 44 46 4.7 10 76 43 52 63 76
FMP469 ELYC14THW - 0 14 6 12 20 34 44 46 4.7 10 76 58 66 78 76
FMP470 ELYC16THE - 0 20 5 11 16 23 45 50 1.2 2.3 9.5 43 57 73 73
FMP471 ELYC16THW - 0 20 5 11 16 23 45 50 1.2 2.3 9.5 58 66 78 73
FMP472 ELYC18THE - 0 19 6 10 16 25 49 49 1.4 2.3 8.1 43 57 73 73
FMP473 JLYC2THE - 0 26 5 8.5 12 18 51 49 1.6 1.9 6.2 43 48 53 76
FMP474 JLYC2THS - 0 26 5 8.5 12 18 51 49 1.6 1.9 6.2 39 47 52 76
FMP475 JLYC2THW - 0 26 5 8.5 12 18 51 49 1.6 1.9 6.2 42 47 53 76
FMP476 JLYC4THE - 0 26 5 8.5 12 18 51 49 1.6 1.9 6.2 42 45 46 76
FMP477 JLYC4THS - 0 26 5 8.5 12 18 51 49 1.6 1.9 6.2 34 44 49 76
FMP478 JLYC4THW - 0 26 5 8.5 12 18 51 49 1.6 1.9 6.2 42 47 53 76
FMP479 JLYC6THE - 0 22 5 9.7 14 21 47 50 2.7 3.6 7.9 41 48 55 76

173
ID Name IT Age
IT %BR
MT Age
MT cyc
MT % BR LRT Age
LRT cyc
LRT % BR FC Age (years) FC % BR min mid max min mid max low mid high
FMP480 JLYC6THS - 0 22 5 9.7 14 21 47 50 2.7 3.6 7.9 39 47 52 76
FMP481 JLYC6THW - 0 22 5 9.7 14 21 47 50 2.7 3.6 7.9 35 43 53 76
FMP482 JLYC8THE - 0 19 6 10 15 25 49 49 3.3 4.5 8.6 45 49 54 76
FMP483 JLYC8THS - 0 19 6 10 15 25 49 49 3.3 4.5 8.6 42 48 52 76
FMP484 JLYC8THW - 0 19 6 10 15 25 49 49 3.3 4.5 8.6 40 47 54 76
FMP485 JLYC10THE - 0 17 5 12 18 28 42 45 4.2 10 76 45 49 55 76
FMP486 JLYC10THS - 0 17 5 12 18 28 42 45 4.2 10 76 42 48 51 76
FMP487 JLYC10THW - 0 17 5 12 18 28 42 45 4.2 10 76 46 50 56 76
FMP488 JLYC12THE - 0 15 5 13 20 33 40 42 4.6 10 76 38 45 50 76
FMP489 JLYC12THS - 0 15 5 13 20 33 40 42 4.6 10 76 44 48 52 76
FMP490 JLYC12THW - 0 15 5 13 20 33 40 42 4.6 10 76 40 45 50 76
FMP491 JLYC14THE - 0 14 6 12 20 34 44 46 4.7 10 76 42 48 53 76

174
ID Name IT Age
IT %BR
MT Age
MT cyc
MT % BR LRT Age
LRT cyc
LRT % BR FC Age (years) FC % BR min mid max min mid max low mid high
FMP492 JLYC14THS - 0 14 6 12 20 34 44 46 4.7 10 76 40 48 51 76
FMP493 JLYC14THW - 0 14 6 12 20 34 44 46 4.7 10 76 41 46 50 76
FMP494 JLYC16THE - 0 20 5 11 16 23 45 50 1.2 2.3 9.5 43 48 53 73
FMP495 JLYC16THS - 0 20 5 11 16 23 45 50 1.2 2.3 9.5 41 48 52 73
FMP496 JLYC16THW - 0 20 5 11 16 23 45 50 1.2 2.3 9.5 43 44 49 73
FMP497 JLYC18THE - 0 19 6 10 16 25 49 49 1.4 2.3 8.1 43 48 53 73
FMP498 JLYC20THE - 0 18 6 11 17 27 48 50 1.1 2.2 8.2 43 48 53 73
FMP499 JLYC24THW - 0 21 5 10 16 27 46 28 0.1 1.5 7.2 42 47 53 72
FMP500 DFYC2THE - 0 40 9 4.7 8.0 14 85 8 0.3 1.8 4.2 37 43 51 67
FMP501 DFYC2THS - 0 40 9 4.7 8.0 14 85 8 0.3 1.8 4.2 41 48 53 67
FMP502 DFYC2THW - 0 40 9 4.7 8.0 14 85 8 0.3 1.8 4.2 40 47 53 67
FMP503 DFYC4THE - 0 40 9 4.7 8.0 14 85 8 0.3 1.8 4.2 37 43 51 67

175
ID Name IT Age
IT %BR
MT Age
MT cyc
MT % BR LRT Age
LRT cyc
LRT % BR FC Age (years) FC % BR min mid max min mid max low mid high
FMP504 DFYC4THS - 0 40 9 4.7 8.0 14 85 8 0.3 1.8 4.2 41 48 53 67
FMP505 DFYC4THW - 0 40 9 4.7 8.0 14 85 8 0.3 1.8 4.2 40 47 53 67
FMP506 DFYC6THS - 0 33 10 5.1 8.7 16 83 12 0.2 1.4 3.9 41 48 53 67
FMP507 DFYC6THW - 0 33 10 5.1 8.7 16 83 12 0.2 1.4 3.9 40 47 53 67
FMP508 DFYC8THE - 0 28 7 6.8 11 18 63 47 0.4 1.5 5.3 37 43 51 71
FMP509 DFYC8THS - 0 28 7 6.8 11 18 63 47 0.4 1.5 5.3 44 50 51 71
FMP510 DFYC8THW - 0 28 7 6.8 11 18 63 47 0.4 1.5 5.3 40 47 53 71
FMP511 DFYC10THE - 0 25 6 8.0 12 20 55 48 1.0 2.1 7.1 43 48 54 71
FMP512 DFYC10THS - 0 25 6 8.0 12 20 55 48 1.0 2.1 7.1 42 49 54 71
FMP513 DFYC10THW - 0 25 6 8.0 12 20 55 48 1.0 2.1 7.1 46 59 62 71
FMP514 DFYC12THE - 0 23 7 7.9 12 21 58 48 0.4 1.6 6.0 39 46 51 71
FMP515 DFYC12THS - 0 23 7 7.9 12 21 58 48 0.4 1.6 6.0 42 47 53 71

176
ID Name IT Age
IT %BR
MT Age
MT cyc
MT % BR LRT Age
LRT cyc
LRT % BR FC Age (years) FC % BR min mid max min mid max low mid high
FMP516 DFYC12THW - 0 23 7 7.9 12 21 58 48 0.4 1.6 6.0 37 49 54 71
FMP517 DFYC14THE - 0 21 6 9.1 15 24 51 49 0.6 1.9 8.0 35 42 50 71
FMP518 DFYC14THS - 0 21 6 9.1 15 24 51 49 0.6 1.9 8.0 43 48 52 71
FMP519 DFYC14THW - 0 21 6 9.1 15 24 51 49 0.6 1.9 8.0 44 48 51 71
FMP520 DFYC16THE - 0 19 7 9.0 15 28 54 48 0.3 1.6 6.9 36 41 47 71
FMP521 DFYC16THS - 0 19 7 9.0 15 28 54 48 0.3 1.6 6.9 38 45 51 71
FMP522 DFYC16THW - 0 19 7 9.0 15 28 54 48 0.3 1.6 6.9 39 44 49 71
FMP523 DFYC18THE - 0 18 7 9.3 16 30 53 49 0.4 1.7 7.0 35 41 49 71
FMP524 DFYC18THS - 0 18 7 9.3 16 30 53 49 0.4 1.7 7.0 42 48 63 71
FMP525 DFYC18THW - 0 18 7 9.3 16 30 53 49 0.4 1.7 7.0 36 42 50 71
FMP526 DFYC20THE - 0 17 7 9.6 17 32 52 49 0.3 1.6 7.2 35 39 57 71
FMP527 DFYC20THS - 0 17 7 9.6 17 32 52 49 0.3 1.6 7.2 41 48 53 71

177
ID Name IT Age
IT %BR
MT Age
MT cyc
MT % BR LRT Age
LRT cyc
LRT % BR FC Age (years) FC % BR min mid max min mid max low mid high
FMP528 DFYC20THW - 0 17 7 9.6 17 32 52 49 0.3 1.6 7.2 37 51 53 71
FMP529 DFYC22THE - 0 17 6 10 18 30 47 50 0.5 1.9 8.8 34 41 45 71
FMP530 DFYC22THS - 0 17 6 10 18 30 47 50 0.5 1.9 8.8 41 48 53 71
FMP531 DFYC22THW - 0 17 6 10 18 30 47 50 0.5 1.9 8.8 40 46 63 71
FMP532 DFYC24THE - 0 16 6 11 19 34 46 50 1.0 2.3 9.2 39 45 49 71
FMP533 DFYC24THS - 0 16 6 11 19 34 46 50 1.0 2.3 9.2 44 47 46 71
FMP534 DFYC24THW - 0 16 6 11 19 34 46 50 1.0 2.3 9.2 40 47 53 71
FMP535 DFYC26THE - 0 20 5 10 18 30 45 32 0.1 1.4 7.6 37 43 51 72
FMP536 GFYC2THESW - 0 40 9 4.7 8.0 14 85 8 0.3 1.8 4.2 35 42 47 67
FMP537 GFYC4THSW - 0 40 9 4.7 8.0 14 85 8 0.3 1.8 4.2 35 42 47 67
FMP538 GFYC6THE - 0 33 5 6.7 10 14 58 46 0.3 1.4 5.6 35 42 47 68
FMP539 GFYC8THE - 0 29 6 6.9 11 17 59 47 0.5 1.5 5.1 35 42 47 68
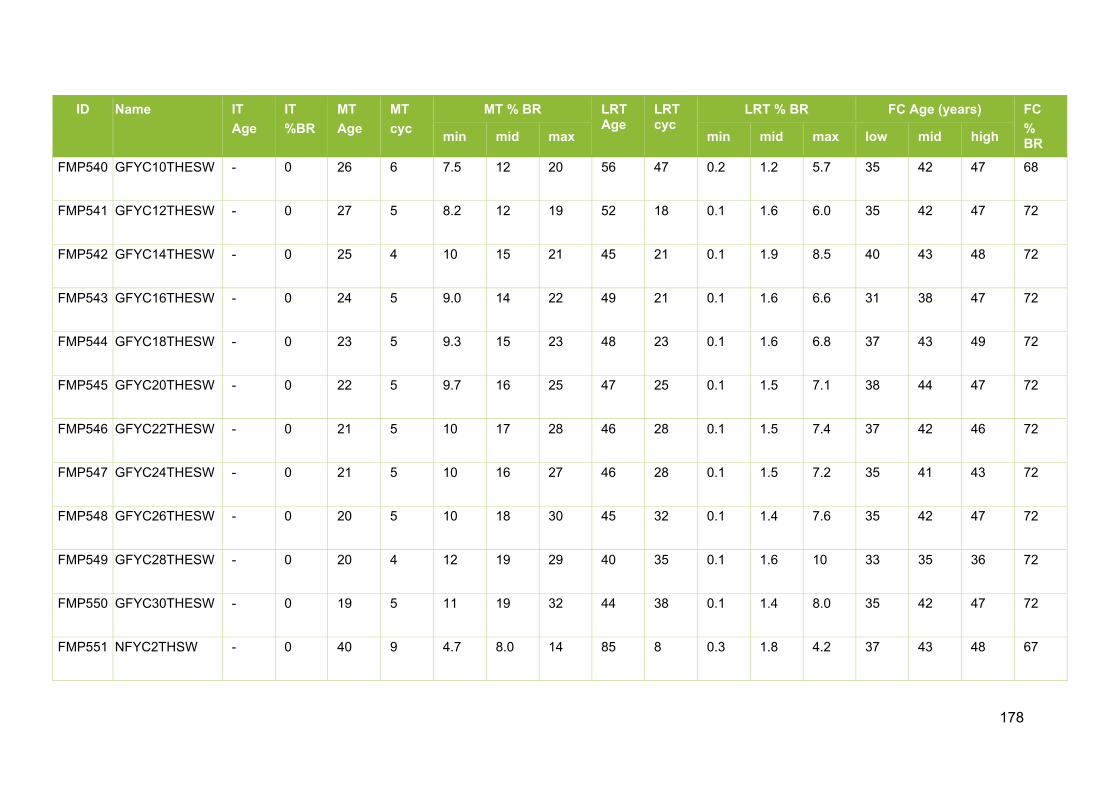
178
ID Name IT Age
IT %BR
MT Age
MT cyc
MT % BR LRT Age
LRT cyc
LRT % BR FC Age (years) FC % BR min mid max min mid max low mid high
FMP540 GFYC10THESW - 0 26 6 7.5 12 20 56 47 0.2 1.2 5.7 35 42 47 68
FMP541 GFYC12THESW - 0 27 5 8.2 12 19 52 18 0.1 1.6 6.0 35 42 47 72
FMP542 GFYC14THESW - 0 25 4 10 15 21 45 21 0.1 1.9 8.5 40 43 48 72
FMP543 GFYC16THESW - 0 24 5 9.0 14 22 49 21 0.1 1.6 6.6 31 38 47 72
FMP544 GFYC18THESW - 0 23 5 9.3 15 23 48 23 0.1 1.6 6.8 37 43 49 72
FMP545 GFYC20THESW - 0 22 5 9.7 16 25 47 25 0.1 1.5 7.1 38 44 47 72
FMP546 GFYC22THESW - 0 21 5 10 17 28 46 28 0.1 1.5 7.4 37 42 46 72
FMP547 GFYC24THESW - 0 21 5 10 16 27 46 28 0.1 1.5 7.2 35 41 43 72
FMP548 GFYC26THESW - 0 20 5 10 18 30 45 32 0.1 1.4 7.6 35 42 47 72
FMP549 GFYC28THESW - 0 20 4 12 19 29 40 35 0.1 1.6 10 33 35 36 72
FMP550 GFYC30THESW - 0 19 5 11 19 32 44 38 0.1 1.4 8.0 35 42 47 72
FMP551 NFYC2THSW - 0 40 9 4.7 8.0 14 85 8 0.3 1.8 4.2 37 43 48 67

179
ID Name IT Age
IT %BR
MT Age
MT cyc
MT % BR LRT Age
LRT cyc
LRT % BR FC Age (years) FC % BR min mid max min mid max low mid high
FMP552 NFYC4THSW - 0 40 9 4.7 8.0 14 85 8 0.3 1.8 4.2 37 43 48 67
FMP553 NFYC6THSW - 0 33 5 6.7 10 14 58 46 0.3 1.4 5.6 37 43 48 68
FMP554 NFYC8THESW - 0 29 6 6.9 11 17 59 47 0.5 1.5 5.1 37 43 48 68
FMP555 NFYC10THESW - 0 34 7 5.9 8.0 12 69 45 0.8 1.8 4.7 35 39 45 70
FMP556 NFYC12THESW - 0 31 7 6.3 8.9 13 66 46 1.8 2.4 4.8 35 40 45 70
FMP557 NFYC14THESW - 0 29 7 6.7 10 15 64 46 1.9 2.5 5.4 36 42 48 70
FMP558 NFYC16THESW - 0 27 7 7.1 10 16 62 47 1.8 2.6 5.7 39 44 49 70
FMP559 NFYC18THESW - 0 25 7 7.5 11 18 60 47 2.5 3.0 6.1 38 42 46 70
FMP560 NFYC20THESW - 0 23 7 8.0 13 21 58 48 2.6 3.2 6.8 37 45 48 70
FMP561 NFYC22THESW - 0 22 7 8.2 13 22 57 48 1.9 2.9 7.0 38 42 47 70
FMP562 NFYC24THSW - 0 21 5 10 16 27 46 28 0.1 1.5 7.2 37 43 48 72
FMP563 WHYC2THESW - 0 40 9 4.7 8.0 14 85 8 0.3 1.8 4.2 38 43 49 67
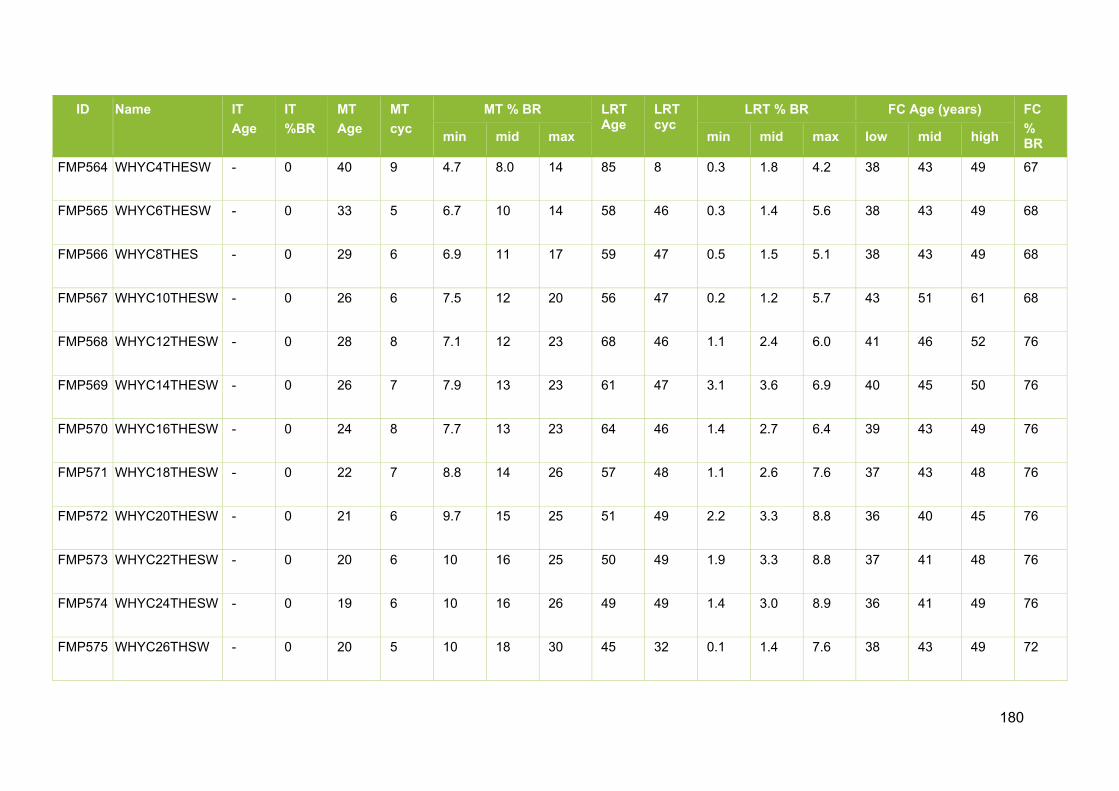
180
ID Name IT Age
IT %BR
MT Age
MT cyc
MT % BR LRT Age
LRT cyc
LRT % BR FC Age (years) FC % BR min mid max min mid max low mid high
FMP564 WHYC4THESW - 0 40 9 4.7 8.0 14 85 8 0.3 1.8 4.2 38 43 49 67
FMP565 WHYC6THESW - 0 33 5 6.7 10 14 58 46 0.3 1.4 5.6 38 43 49 68
FMP566 WHYC8THES - 0 29 6 6.9 11 17 59 47 0.5 1.5 5.1 38 43 49 68
FMP567 WHYC10THESW - 0 26 6 7.5 12 20 56 47 0.2 1.2 5.7 43 51 61 68
FMP568 WHYC12THESW - 0 28 8 7.1 12 23 68 46 1.1 2.4 6.0 41 46 52 76
FMP569 WHYC14THESW - 0 26 7 7.9 13 23 61 47 3.1 3.6 6.9 40 45 50 76
FMP570 WHYC16THESW - 0 24 8 7.7 13 23 64 46 1.4 2.7 6.4 39 43 49 76
FMP571 WHYC18THESW - 0 22 7 8.8 14 26 57 48 1.1 2.6 7.6 37 43 48 76
FMP572 WHYC20THESW - 0 21 6 9.7 15 25 51 49 2.2 3.3 8.8 36 40 45 76
FMP573 WHYC22THESW - 0 20 6 10 16 25 50 49 1.9 3.3 8.8 37 41 48 76
FMP574 WHYC24THESW - 0 19 6 10 16 26 49 49 1.4 3.0 8.9 36 41 49 76
FMP575 WHYC26THSW - 0 20 5 10 18 30 45 32 0.1 1.4 7.6 38 43 49 72

181
ID Name IT Age
IT %BR
MT Age
MT cyc
MT % BR LRT Age
LRT cyc
LRT % BR FC Age (years) FC % BR min mid max min mid max low mid high
FMP576 RCYC2THEW - 0 40 9 4.7 8.0 14 85 8 0.3 1.8 4.2 43 43 44 67
FMP577 RCYC4THEW - 0 40 9 4.7 8.0 14 85 8 0.3 1.8 4.2 38 44 54 67
FMP578 RCYC6THESW - 0 33 5 6.7 10 14 58 46 0.3 1.4 5.6 38 44 54 68
FMP579 RCYC8THESW - 0 29 6 6.9 11 17 59 47 0.5 1.5 5.1 38 44 54 68
FMP580 RCYC10THESW - 0 26 6 7.5 12 20 56 47 0.2 1.2 5.7 46 52 64 68
FMP581 RCYC12THESW - 0 30 7 6.4 9.5 15 65 46 1.1 1.9 4.8 44 52 58 67
FMP582 RCYC14THESW - 0 28 7 6.7 10 16 63 47 0.4 1.5 5.4 39 47 57 67
FMP583 RCYC16THESW - 0 26 7 7.1 11 18 61 47 0.6 1.8 5.9 38 40 44 67
FMP584 RCYC18THESW - 0 24 7 7.6 12 20 59 47 0.7 2.0 6.1 36 45 54 67
FMP585 RCYC20THESW - 0 23 7 7.8 12 21 58 48 0.7 2.0 6.2 35 38 45 67
FMP586 RCYC22THESW - 0 22 6 8.7 13 22 52 49 1.1 2.3 7.5 36 42 49 67
FMP587 RCYC24THESW - 0 21 6 9.0 14 23 51 49 1.0 2.3 7.6 36 38 43 67

182
Public forest estate (England, Scotland and Wales): Forest Management Practices involving “continuous cover”, i.e. continuous thinning and forest regeneration without clearcutting
Forest management practice Silvicultural operations without final harvesting
Index Name of practice % biomass removals
Min Mean Max FMP588 NSYC2CCESW 3.2 9.6 62
FMP589 NSYC4CCESW 3.2 9.6 62
FMP590 NSYC6CCESW 4.5 8.9 27
FMP591 NSYC8CCESW 4.8 8.7 19
FMP592 NSYC10CCESW 5.2 9.2 18
FMP593 NSYC12CCESW 5.4 9.3 15
FMP594 NSYC14CCESW 5.7 9.9 17
FMP595 NSYC16CCESW 5.9 10 16
FMP596 NSYC18CCESW 6.2 10 15
FMP597 NSYC20CCESW 3.5 11 16
FMP598 NSYC22CCESW 3.7 11 16
FMP599 NSYC24CCESW 0.4 11 15
FMP600 NSYC26CCS 7.6 12 12
FMP601 NSYC30CCE 7.8 12 15
FMP602 SSYC2CCESW 4.3 9.8 55
FMP603 SSYC4CCESW 4.3 9.8 55
FMP604 SSYC6CCESW 5.3 9.4 18
FMP605 SSYC8CCESW 5.8 10 16
FMP606 SSYC10CCESW 6.3 10 15
FMP607 SSYC12CCESW 6.7 11 17
FMP608 SSYC14CCESW 7.1 11 15
FMP609 SSYC16CCESW 1.7 12 16
FMP610 SSYC18CCESW 5.4 12 14
FMP611 SSYC20CCESW 8.0 12 14
FMP612 SSYC22CCESW 5.7 12 15
FMP613 SSYC24CCESW 8.4 12 13
FMP614 SSYC26CCES 7.8 12 13
FMP615 SSYC28CCE 7.9 12 13
FMP616 SPYC2CCESW 3.2 9.8 63

183
Forest management practice Silvicultural operations without final harvesting
Index Name of practice % biomass removals
Min Mean Max FMP617 SPYC4CCESW 3.2 9.8 63
FMP618 SPYC6CCESW 4.8 9.1 20
FMP619 SPYC8CCESW 5.3 9.3 15
FMP620 SPYC10CCESW 5.7 9.8 13
FMP621 SPYC12CCESW 0.5 10 17
FMP622 SPYC14CCESW 2.9 10 15
FMP623 SPYC16CCESW 7.4 11 12
FMP624 SPYC18CCES 4.0 11 15
FMP625 SPYC20CCW 7.9 12 13
FMP626 CPYC2CCESW 3.5 11 68
FMP627 CPYC4CCESW 3.5 11 68
FMP628 CPYC6CCESW 5.7 9.4 16
FMP629 CPYC8CCESW 6.4 9.8 13
FMP630 CPYC10CCESW 6.9 10 12
FMP631 CPYC12CCESW 7.4 11 14
FMP632 CPYC14CCESW 1.0 11 15
FMP633 CPYC16CCESW 8.1 12 13
FMP634 CPYC18CCESW 4.4 12 17
FMP635 CPYC20CCEW 8.6 13 14
FMP636 CPYC22CCEW 3.4 13 16
FMP637 CPYC24CCE 0.4 13 17
FMP638 LPYC2CCSW 4.2 7.5 22
FMP639 LPYC4CCESW 4.2 7.5 22
FMP640 LPYC6CCESW 1.4 8.1 15
FMP641 LPYC8CCESW 5.3 8.6 12
FMP642 LPYC10CCESW 6.2 9.1 12
FMP643 LPYC12CCESW 6.7 9.6 11
FMP644 LPYC14CCESW 5.7 10 14
FMP645 LPYC16CCEW 7.4 11 12
FMP646 LPYC18CCE 4.0 11 15
FMP647 LPYC20CCEW 7.9 12 13
FMP648 ELYC2CCESW 4.2 11 18
FMP649 ELYC4CCESW 4.2 11 18
FMP650 ELYC6CCESW 7.7 11 14
FMP651 ELYC8CCESW 4.3 12 16
FMP652 ELYC10CCESW 9.2 13 13
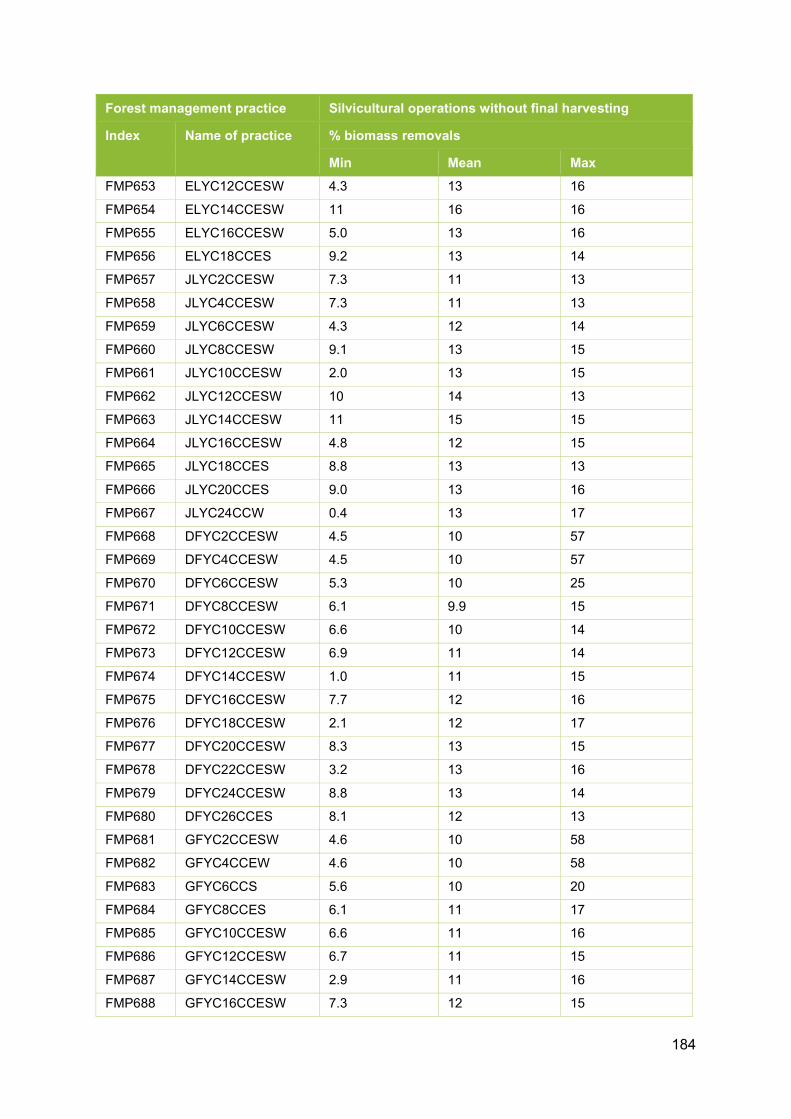
184
Forest management practice Silvicultural operations without final harvesting
Index Name of practice % biomass removals
Min Mean Max FMP653 ELYC12CCESW 4.3 13 16
FMP654 ELYC14CCESW 11 16 16
FMP655 ELYC16CCESW 5.0 13 16
FMP656 ELYC18CCES 9.2 13 14
FMP657 JLYC2CCESW 7.3 11 13
FMP658 JLYC4CCESW 7.3 11 13
FMP659 JLYC6CCESW 4.3 12 14
FMP660 JLYC8CCESW 9.1 13 15
FMP661 JLYC10CCESW 2.0 13 15
FMP662 JLYC12CCESW 10 14 13
FMP663 JLYC14CCESW 11 15 15
FMP664 JLYC16CCESW 4.8 12 15
FMP665 JLYC18CCES 8.8 13 13
FMP666 JLYC20CCES 9.0 13 16
FMP667 JLYC24CCW 0.4 13 17
FMP668 DFYC2CCESW 4.5 10 57
FMP669 DFYC4CCESW 4.5 10 57
FMP670 DFYC6CCESW 5.3 10 25
FMP671 DFYC8CCESW 6.1 9.9 15
FMP672 DFYC10CCESW 6.6 10 14
FMP673 DFYC12CCESW 6.9 11 14
FMP674 DFYC14CCESW 1.0 11 15
FMP675 DFYC16CCESW 7.7 12 16
FMP676 DFYC18CCESW 2.1 12 17
FMP677 DFYC20CCESW 8.3 13 15
FMP678 DFYC22CCESW 3.2 13 16
FMP679 DFYC24CCESW 8.8 13 14
FMP680 DFYC26CCES 8.1 12 13
FMP681 GFYC2CCESW 4.6 10 58
FMP682 GFYC4CCEW 4.6 10 58
FMP683 GFYC6CCS 5.6 10 20
FMP684 GFYC8CCES 6.1 11 17
FMP685 GFYC10CCESW 6.6 11 16
FMP686 GFYC12CCESW 6.7 11 15
FMP687 GFYC14CCESW 2.9 11 16
FMP688 GFYC16CCESW 7.3 12 15

185
Forest management practice Silvicultural operations without final harvesting
Index Name of practice % biomass removals
Min Mean Max FMP689 GFYC18CCESW 7.5 12 16
FMP690 GFYC20CCESW 6.5 12 16
FMP691 GFYC22CCESW 3.4 12 16
FMP692 GFYC24CCESW 0.4 12 16
FMP693 GFYC26CCESW 8.2 13 13
FMP694 GFYC28CCESW 8.3 13 13
FMP695 GFYC30CCEW 8.5 13 16
FMP696 NFYC2CCESW 3.4 10 66
FMP697 NFYC4CCESW 3.4 10 66
FMP698 NFYC6CCES 5.5 9.7 19
FMP699 NFYC8CCESW 6.0 10 17
FMP700 NFYC10CCES 5.0 8.2 16
FMP701 NFYC12CCESW 5.4 8.5 15
FMP702 NFYC14CCESW 5.6 8.8 14
FMP703 NFYC16CCESW 5.9 9.1 13
FMP704 NFYC18CCESW 4.4 9.6 14
FMP705 NFYC20CCESW 6.5 10 14
FMP706 NFYC22CCESW 6.6 10 14
FMP707 NFYC24CCSW 0.4 12 16
FMP708 WHYC2CCESW 3.7 11 71
FMP709 WHYC4CCES 3.7 11 71
FMP710 WHYC6CCESW 5.9 10 21
FMP711 WHYC8CCESW 6.5 11 18
FMP712 WHYC10CCESW 7.0 12 17
FMP713 WHYC12CCESW 5.6 9.7 20
FMP714 WHYC14CCESW 2.8 10 18
FMP715 WHYC16CCESW 6.4 10 18
FMP716 WHYC18CCESW 6.0 11 17
FMP717 WHYC20CCESW 7.3 11 14
FMP718 WHYC22CCEW 4.9 11 14
FMP719 WHYC24CCEW 3.4 12 17
FMP720 WHYC26CCW 8.7 13 14
FMP721 RCYC2CCESW 5.5 8.9 6.9
FMP722 RCYC4CCESW 5.5 8.9 6.9
FMP723 RCYC6CCESW 5.5 8.9 6.9
FMP724 RCYC8CCESW 5.5 8.9 16
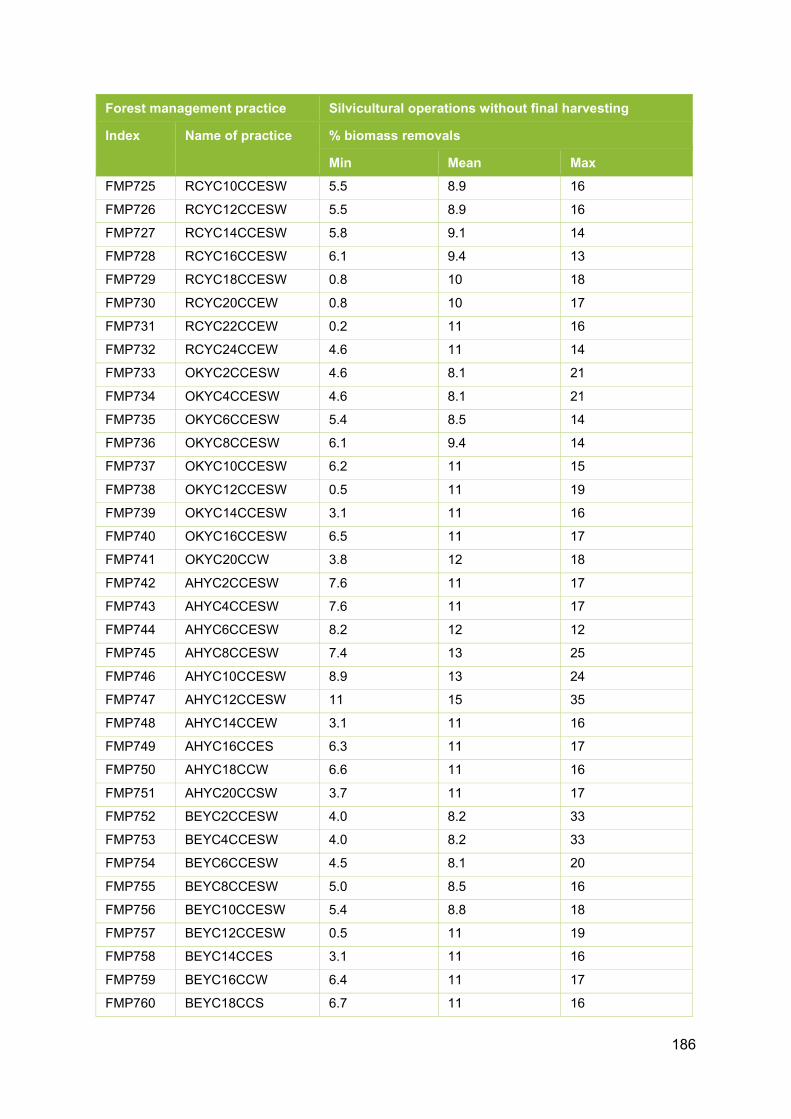
186
Forest management practice Silvicultural operations without final harvesting
Index Name of practice % biomass removals
Min Mean Max FMP725 RCYC10CCESW 5.5 8.9 16
FMP726 RCYC12CCESW 5.5 8.9 16
FMP727 RCYC14CCESW 5.8 9.1 14
FMP728 RCYC16CCESW 6.1 9.4 13
FMP729 RCYC18CCESW 0.8 10 18
FMP730 RCYC20CCEW 0.8 10 17
FMP731 RCYC22CCEW 0.2 11 16
FMP732 RCYC24CCEW 4.6 11 14
FMP733 OKYC2CCESW 4.6 8.1 21
FMP734 OKYC4CCESW 4.6 8.1 21
FMP735 OKYC6CCESW 5.4 8.5 14
FMP736 OKYC8CCESW 6.1 9.4 14
FMP737 OKYC10CCESW 6.2 11 15
FMP738 OKYC12CCESW 0.5 11 19
FMP739 OKYC14CCESW 3.1 11 16
FMP740 OKYC16CCESW 6.5 11 17
FMP741 OKYC20CCW 3.8 12 18
FMP742 AHYC2CCESW 7.6 11 17
FMP743 AHYC4CCESW 7.6 11 17
FMP744 AHYC6CCESW 8.2 12 12
FMP745 AHYC8CCESW 7.4 13 25
FMP746 AHYC10CCESW 8.9 13 24
FMP747 AHYC12CCESW 11 15 35
FMP748 AHYC14CCEW 3.1 11 16
FMP749 AHYC16CCES 6.3 11 17
FMP750 AHYC18CCW 6.6 11 16
FMP751 AHYC20CCSW 3.7 11 17
FMP752 BEYC2CCESW 4.0 8.2 33
FMP753 BEYC4CCESW 4.0 8.2 33
FMP754 BEYC6CCESW 4.5 8.1 20
FMP755 BEYC8CCESW 5.0 8.5 16
FMP756 BEYC10CCESW 5.4 8.8 18
FMP757 BEYC12CCESW 0.5 11 19
FMP758 BEYC14CCES 3.1 11 16
FMP759 BEYC16CCW 6.4 11 17
FMP760 BEYC18CCS 6.7 11 16

187
Forest management practice Silvicultural operations without final harvesting
Index Name of practice % biomass removals
Min Mean Max FMP761 BIYC2CCESW 7.6 11 17
FMP762 BIYC4CCESW 7.6 11 17
FMP763 BIYC6CCESW 8.2 12 12
FMP764 BIYC8CCESW 7.4 13 25
FMP765 BIYC10CCESW 8.9 13 24
FMP766 BIYC12CCESW 11 15 35
FMP767 BIYC14CCESW 3.1 11 16
FMP768 BIYC16CCESW 6.3 11 17
FMP769 BIYC18CCESW 6.6 11 16
FMP770 BIYC20CCW 3.7 11 17
FMP771 BIYC22CCS 3.9 12 17
FMP772 SYYC2CCESW 7.3 11 17
FMP773 SYYC4CCESW 7.3 11 17
FMP774 SYYC6CCESW 7.9 12 12
FMP775 SYYC8CCESW 7.1 12 24
FMP776 SYYC10CCESW 8.6 12 23
FMP777 SYYC12CCESW 10 14 34
FMP778 SYYC14CCESW 2.9 11 15
FMP779 SYYC16CCESW 6.1 10 16
FMP780 SYYC18CCESW 6.4 11 15
FMP781 SYYC20CCESW 3.6 11 17
FMP782 SYYC22CCE 3.8 11 16
FMP783 SYYC24CCSW 0.4 12 16
FMP784 POYC2CCESW 7.1 10 16
FMP785 POYC4CCESW 7.1 10 16
FMP786 POYC6CCESW 7.7 12 11
FMP787 POYC8CCESW 6.9 12 23
FMP788 POYC10CCESW 8.4 12 23
FMP789 POYC12CCESW 9.9 14 33
FMP790 POYC14CCESW 7.1 11 16
FMP791 POYC16CCE 6.1 9.6 17
FMP792 POYC24CCE 0.4 11 15
FMP793 NOYC2CCES 7.5 11 17
FMP794 NOYC4CCESW 7.5 11 17
FMP795 NOYC6CCESW 8.1 12 12
FMP796 NOYC8CCESW 7.3 12 24
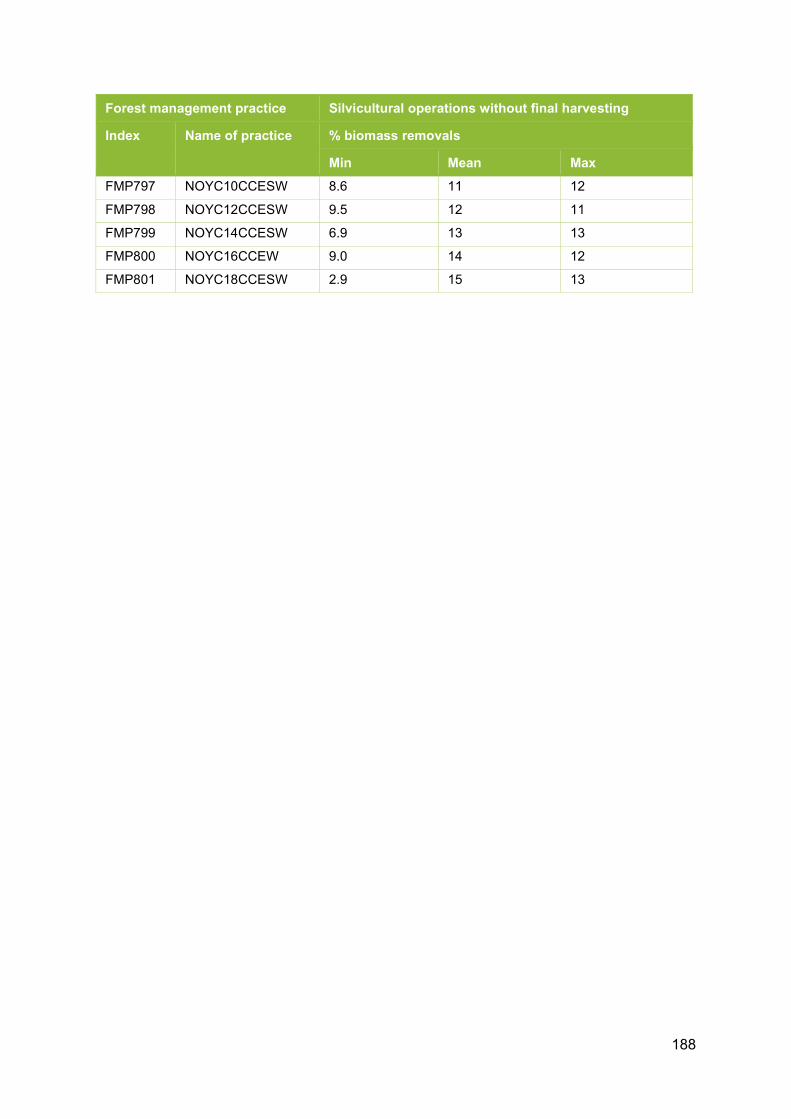
188
Forest management practice Silvicultural operations without final harvesting
Index Name of practice % biomass removals
Min Mean Max FMP797 NOYC10CCESW 8.6 11 12
FMP798 NOYC12CCESW 9.5 12 11
FMP799 NOYC14CCESW 6.9 13 13
FMP800 NOYC16CCEW 9.0 14 12
FMP801 NOYC18CCESW 2.9 15 13

189
Private forest estate (England, Scotland and Wales): Forest Management Practices involving clearcutting with no thinning during the rotation
Note that up to four rotations are assigned for each FMP. Proportions of forest area within a stratum are assigned to each of the rotations.
Forest management practice Silvicultural operations with final harvesting – No thinning
Index Name of practice Final cutting
Rotation 1 Rotation 2 Rotation 3 Rotation 4 % biomass removals Age
(years) % Age
(years) % Age
(years) % Age
(years) %
FMP802 NSYC4NTW 60 100% - - - - - - 67
FMP803 NSYC6NTE 64 100% - - - - - - 66
FMP804 NSYC6NTS 57 100% - - - - - - 66
FMP805 NSYC6NTW 60 100% - - - - - - 66
FMP806 NSYC8NTE 60 100% - - - - - - 66
FMP807 NSYC8NTS 53 100% - - - - - - 66
FMP808 NSYC8NTW 56 100% - - - - - - 66
FMP809 NSYC10NTE 63 100% - - - - - - 66
FMP810 NSYC10NTS 50 100% - - - - - - 66
FMP811 NSYC12NTE 58 100% - - - - - - 66
FMP812 NSYC12NTS 46 100% - - - - - - 66
FMP813 NSYC14NTE 49 100% - - - - - - 66
FMP814 NSYC14NTS 44 100% - - - - - - 66
FMP815 NSYC16NTE 47 100% - - - - - - 66

190
Forest management practice Silvicultural operations with final harvesting – No thinning
Index Name of practice Final cutting
Rotation 1 Rotation 2 Rotation 3 Rotation 4 % biomass removals Age
(years) % Age
(years) % Age
(years) % Age
(years) %
FMP816 NSYC16NTS 41 100% - - - - - - 66
FMP817 NSYC18NTE 45 100% - - - - - - 66
FMP818 NSYC18NTS 40 100% - - - - - - 66
FMP819 NSYC20NTE 42 100% - - - - - - 66
FMP820 NSYC20NTS 39 100% - - - - - - 66
FMP821 NSYC22NTE 40 100% - - - - - - 66
FMP822 NSYC22NTS 39 100% - - - - - - 66
FMP823 SSYC6NTE 41 25% 46 50% 51 25% - - 68
FMP824 SSYC6NTS 50 25% 55 25% 60 25% 65 25% 68
FMP825 SSYC6NTW 47 25% 52 25% 57 25% 62 25% 68
FMP826 SSYC8NTE 41 25% 46 50% 51 25% - - 68
FMP827 SSYC8NTS 46 25% 51 25% 56 25% 61 25% 68
FMP828 SSYC8NTW 45 25% 50 25% 55 25% 60 25% 68
FMP829 SSYC10NTE 48 25% 53 50% 58 25% - - 68
FMP830 SSYC10NTSW 43 25% 48 25% 53 25% 58 25% 68
FMP831 SSYC12NTE 45 25% 50 50% 55 25% - - 68
FMP832 SSYC12NTS 40 25% 45 25% 50 25% 55 25% 68
FMP833 SSYC12NTW 41 25% 47 25% 51 25% 57 25% 68
FMP834 SSYC14NTE 40 25% 45 50% 50 25% - - 68
FMP835 SSYC14NTS 36 25% 41 25% 46 25% 51 25% 68

191
Forest management practice Silvicultural operations with final harvesting – No thinning
Index Name of practice Final cutting
Rotation 1 Rotation 2 Rotation 3 Rotation 4 % biomass removals Age
(years) % Age
(years) % Age
(years) % Age
(years) %
FMP836 SSYC14NTW 39 25% 44 25% 49 25% 54 25% 68
FMP837 SSYC16NTE 39 25% 44 50% 49 25% - - 68
FMP838 SSYC16NTS 33 25% 38 25% 43 25% 48 25% 68
FMP839 SSYC16NTW 37 25% 42 25% 47 25% 52 25% 68
FMP840 SSYC18NTE 39 25% 44 50% 49 25% - - 68
FMP841 SSYC18NTS 30 25% 35 25% 40 25% 45 25% 68
FMP842 SSYC18NTW 34 25% 39 25% 44 25% 49 25% 68
FMP843 SSYC20NTE 40 25% 45 50% 50 25% - - 68
FMP844 SSYC20NTS 29 25% 34 25% 39 25% 44 25% 68
FMP845 SSYC20NTW 33 25% 38 25% 43 25% 48 25% 68
FMP846 SSYC22NTE 34 25% 39 50% 44 25% - - 68
FMP847 SSYC22NTS 28 25% 33 25% 38 25% 43 25% 68
FMP848 SSYC22NTW 32 25% 37 25% 42 25% 47 25% 68
FMP849 SSYC24NTE 40 25% 45 50% 50 25% - - 68
FMP850 SSYC24NTSW 29 25% 34 25% 39 25% 44 25% 68
FMP851 SSYC26NTE 40 25% 45 50% 50 25% - - 72
FMP852 SSYC26NTSW 29 25% 34 25% 39 25% 44 25% 72
FMP853 SSYC28NTE 40 25% 45 50% 50 25% - - 72
FMP854 SSYC28NTS 29 25% 34 25% 39 25% 44 25% 72
FMP855 SSYC30NTS 29 25% 34 25% 39 25% 44 25% 72

192
Forest management practice Silvicultural operations with final harvesting – No thinning
Index Name of practice Final cutting
Rotation 1 Rotation 2 Rotation 3 Rotation 4 % biomass removals Age
(years) % Age
(years) % Age
(years) % Age
(years) %
FMP856 SPYC4NTE 78 50% 98 50% - - - - 67
FMP857 SPYC4NTS 82 25% 87 25% 92 25% 97 25% 67
FMP858 SPYC4NTW 80 100% - - - - - - 67
FMP859 SPYC6NTE 68 50% 88 50% - - - - 67
FMP860 SPYC6NTS 77 25% 82 25% 87 25% 92 25% 67
FMP861 SPYC6NTW 74 100% - - - - - - 67
FMP862 SPYC8NTE 58 50% 78 50% - - - - 67
FMP863 SPYC8NTS 67 25% 72 25% 77 25% 82 25% 67
FMP864 SPYC8NTW 70 100% - - - - - - 67
FMP865 SPYC10NTE 57 50% 77 50% - - - - 67
FMP866 SPYC10NTS 59 25% 64 25% 69 25% 74 25% 67
FMP867 SPYC10NTW 66 100% - - - - - - 67
FMP868 SPYC12NTE 51 50% 71 50% 67
FMP869 SPYC12NTS 59 25% 64 25% 69 25% 74 25% 67
FMP870 SPYC12NTW 64 100% - - - - - - 67
FMP871 SPYC14NTE 48 50% 68 50% - - - - 67
FMP872 SPYC14NTS 55 25% 60 25% 65 25% 70 25% 67
FMP873 SPYC14NTW 62 100% - - - - - - 67
FMP874 SPYC16NTW 62 100% - - - - - - 73
FMP875 SPYC20NTW 62 100% - - - - - - 73

193
Forest management practice Silvicultural operations with final harvesting – No thinning
Index Name of practice Final cutting
Rotation 1 Rotation 2 Rotation 3 Rotation 4 % biomass removals Age
(years) % Age
(years) % Age
(years) % Age
(years) %
FMP876 CPYC4NTS 67 100% - - - - - - 67
FMP877 CPYC6NTS 67 100% - - - - - - 73
FMP878 CPYC8NTS 67 100% - - - - - - 73
FMP879 CPYC10NTS 67 100% - - - - - - 73
FMP880 CPYC12NTS 67 100% - - - - - - 73
FMP881 CPYC14NTS 67 100% - - - - - - 73
FMP882 LPYC4NTE 44 100% - - - - - - 67
FMP883 LPYC4NTS 56 100% - - - - - - 67
FMP884 LPYC4NTW 45 100% - - - - - - 67
FMP885 LPYC6NTE 35 100% - - - - - - 67
FMP886 LPYC6NTS 52 100% - - - - - - 67
FMP887 LPYC6NTW 45 100% - - - - - - 67
FMP888 LPYC8NTE 34 100% - - - - - - 67
FMP889 LPYC8NTS 51 100% - - - - - - 67
FMP890 LPYC8NTW 45 100% - - - - - - 67
FMP891 LPYC10NTE 34 100% - - - - - - 67
FMP892 LPYC10NTS 48 100% - - - - - - 67
FMP893 LPYC10NTW 45 100% - - - - - - 67
FMP894 LPYC12NTE 36 100% - - - - - - 67
FMP895 LPYC12NTS 47 100% - - - - - - 67

194
Forest management practice Silvicultural operations with final harvesting – No thinning
Index Name of practice Final cutting
Rotation 1 Rotation 2 Rotation 3 Rotation 4 % biomass removals Age
(years) % Age
(years) % Age
(years) % Age
(years) %
FMP896 LPYC12NTW 45 100% - - - - - - 67
FMP897 LPYC14NTE 36 100% - - - - - - 67
FMP898 LPYC14NTSW 45 100% - - - - - - 67
FMP899 LPYC16NTE 29 100% - - - - - - 73
FMP900 LPYC16NTW 45 100% - - - - - - 73
FMP901 LPYC18NTE 29 100% - - - - - - 73
FMP902 LPYC20NTE 29 100% - - - - - - 73
FMP903 LPYC20NTSW 45 100% - - - - - - 73
FMP904 ELYC2NTE 40 100% - - - - - - 80
FMP905 ELYC2NTS 79 100% - - - - - - 80
FMP906 ELYC4NTE 55 100% - - - - - - 80
FMP907 ELYC4NTS 79 100% - - - - - - 80
FMP908 ELYC4NTW 52 100% - - - - - - 80
FMP909 ELYC6NTE 57 100% - - - - - - 80
FMP910 ELYC6NTS 71 100% - - - - - - 80
FMP911 ELYC6NTW 50 100% - - - - - - 80
FMP912 ELYC8NTE 56 100% - - - - - - 80
FMP913 ELYC8NTS 68 100% - - - - - - 80
FMP914 ELYC8NTW 47 100% - - - - - - 80
FMP915 ELYC10NTE 55 100% - - - - - - 80

195
Forest management practice Silvicultural operations with final harvesting – No thinning
Index Name of practice Final cutting
Rotation 1 Rotation 2 Rotation 3 Rotation 4 % biomass removals Age
(years) % Age
(years) % Age
(years) % Age
(years) %
FMP916 ELYC10NTS 68 100% - - - - - - 80
FMP917 ELYC10NTW 42 100% - - - - - - 80
FMP918 ELYC12NTE 52 100% - - - - - - 80
FMP919 ELYC12NTS 64 100% - - - - - - 80
FMP920 ELYC12NTW 38 100% - - - - - - 80
FMP921 ELYC14NTE 61 100% - - - - - - 76
FMP922 ELYC14NTS 64 100% - - - - - - 76
FMP923 ELYC14NTW 38 100% - - - - - - 76
FMP924 JLYC2NTE 54 50% 59 25% 64 25% - - 76
FMP925 JLYC2NTS 64 75% 84 25% - - - - 76
FMP926 JLYC4NTE 54 50% 59 25% 64 25% - - 76
FMP927 JLYC4NTS 64 75% 84 25% - - - - 76
FMP928 JLYC4NTW 57 100% - - - - - - 76
FMP929 JLYC6NTE 48 50% 53 25% 58 25% - - 76
FMP930 JLYC6NTS 58 75% 78 25% - - - - 76
FMP931 JLYC6NTW 51 100% - - - - - - 76
FMP932 JLYC8NTE 42 50% 47 25% 52 25% - - 76
FMP933 JLYC8NTS 53 75% 73 25% - - - - 76
FMP934 JLYC8NTW 45 100% - - - - - - 76
FMP935 JLYC10NTE 53 50% 58 25% 63 25% - - 76
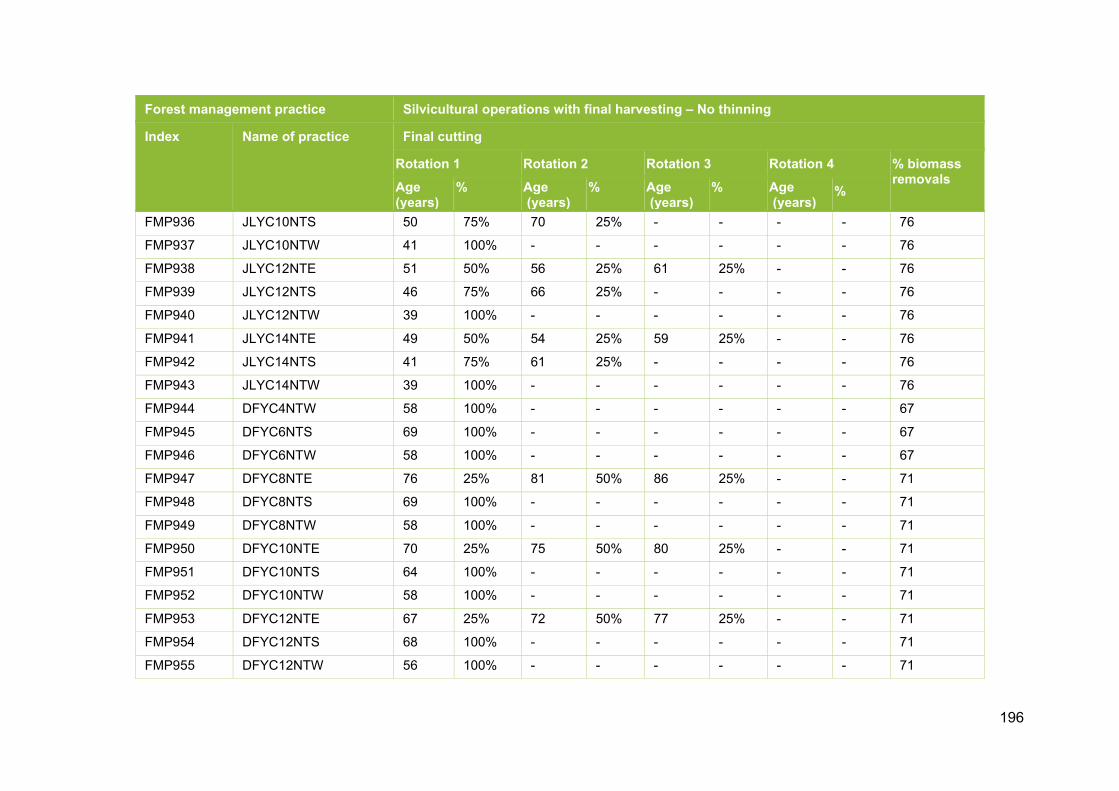
196
Forest management practice Silvicultural operations with final harvesting – No thinning
Index Name of practice Final cutting
Rotation 1 Rotation 2 Rotation 3 Rotation 4 % biomass removals Age
(years) % Age
(years) % Age
(years) % Age
(years) %
FMP936 JLYC10NTS 50 75% 70 25% - - - - 76
FMP937 JLYC10NTW 41 100% - - - - - - 76
FMP938 JLYC12NTE 51 50% 56 25% 61 25% - - 76
FMP939 JLYC12NTS 46 75% 66 25% - - - - 76
FMP940 JLYC12NTW 39 100% - - - - - - 76
FMP941 JLYC14NTE 49 50% 54 25% 59 25% - - 76
FMP942 JLYC14NTS 41 75% 61 25% - - - - 76
FMP943 JLYC14NTW 39 100% - - - - - - 76
FMP944 DFYC4NTW 58 100% - - - - - - 67
FMP945 DFYC6NTS 69 100% - - - - - - 67
FMP946 DFYC6NTW 58 100% - - - - - - 67
FMP947 DFYC8NTE 76 25% 81 50% 86 25% - - 71
FMP948 DFYC8NTS 69 100% - - - - - - 71
FMP949 DFYC8NTW 58 100% - - - - - - 71
FMP950 DFYC10NTE 70 25% 75 50% 80 25% - - 71
FMP951 DFYC10NTS 64 100% - - - - - - 71
FMP952 DFYC10NTW 58 100% - - - - - - 71
FMP953 DFYC12NTE 67 25% 72 50% 77 25% - - 71
FMP954 DFYC12NTS 68 100% - - - - - - 71
FMP955 DFYC12NTW 56 100% - - - - - - 71

197
Forest management practice Silvicultural operations with final harvesting – No thinning
Index Name of practice Final cutting
Rotation 1 Rotation 2 Rotation 3 Rotation 4 % biomass removals Age
(years) % Age
(years) % Age
(years) % Age
(years) %
FMP956 DFYC14NTE 66 25% 71 50% 76 25% - - 71
FMP957 DFYC14NTS 70 100% - - - - - - 71
FMP958 DFYC14NTW 55 100% - - - - - - 71
FMP959 DFYC16NTE 63 25% 68 50% 73 25% - - 71
FMP960 DFYC16NTS 58 100% - - - - - - 71
FMP961 DFYC16NTW 62 100% - - - - - - 71
FMP962 DFYC18NTE 62 25% 67 50% 72 25% - - 71
FMP963 DFYC18NTS 56 100% - - - - - - 71
FMP964 DFYC20NTE 60 25% 65 50% 70 25% - - 71
FMP965 DFYC20NTS 54 100% - - - - - - 71
FMP966 DFYC22NTE 57 25% 62 50% 67 25% - - 71
FMP967 DFYC22NTS 54 100% - - - - - - 71
FMP968 DFYC24NTE 56 25% 61 50% 66 25% - - 71
FMP969 DFYC24NTS 51 100% - - - - - - 71
FMP970 DFYC26NTE 56 25% 61 50% 66 25% - - 72
FMP971 DFYC26NTS 51 100% - - - - - - 72
FMP972 GFYC4NTW 66 100% - - - - - - 67
FMP973 GFYC6NTS 53 100% - - - - - - 67
FMP974 GFYC8NTE 51 100% - - - - - - 68
FMP975 GFYC8NTS 53 100% - - - - - - 68

198
Forest management practice Silvicultural operations with final harvesting – No thinning
Index Name of practice Final cutting
Rotation 1 Rotation 2 Rotation 3 Rotation 4 % biomass removals Age
(years) % Age
(years) % Age
(years) % Age
(years) %
FMP976 GFYC10NTE 45 100% - - - - - - 68
FMP977 GFYC10NTS 53 100% - - - - - - 68
FMP978 GFYC10NTW 59 100% - - - - - - 68
FMP979 GFYC12NTE 42 100% - - - - - - 72
FMP980 GFYC12NTS 53 100% - - - - - - 72
FMP981 GFYC12NTW 57 100% - - - - - - 72
FMP982 GFYC14NTE 41 100% - - - - - - 72
FMP983 GFYC14NTSW 55 100% - - - - - - 72
FMP984 GFYC16NTE 41 100% - - - - - - 72
FMP985 GFYC16NTS 55 100% - - - - - - 72
FMP986 GFYC16NTW 53 100% - - - - - - 72
FMP987 GFYC18NTE 39 100% - - - - - - 72
FMP988 GFYC18NTS 55 100% - - - - - - 72
FMP989 GFYC18NTW 50 100% - - - - - - 72
FMP990 GFYC20NTE 35 100% - - - - - - 72
FMP991 GFYC20NTS 55 100% - - - - - - 72
FMP992 GFYC20NTW 48 100% - - - - - - 72
FMP993 GFYC22NTE 34 100% - - - - - - 72
FMP994 GFYC22NTS 55 100% - - - - - - 72
FMP995 GFYC22NTW 48 100% - - - - - - 72

199
Forest management practice Silvicultural operations with final harvesting – No thinning
Index Name of practice Final cutting
Rotation 1 Rotation 2 Rotation 3 Rotation 4 % biomass removals Age
(years) % Age
(years) % Age
(years) % Age
(years) %
FMP996 GFYC24NTE 34 100% - - - - - - 72
FMP997 GFYC24NTS 55 100% - - - - - - 72
FMP998 GFYC24NTW 48 100% - - - - - - 72
FMP999 GFYC26NTE 34 100% - - - - - - 72
FMP1000 GFYC26NTS 55 100% - - - - - - 72
FMP1001 GFYC26NTW 48 100% - - - - - - 72
FMP1002 GFYC28NTE 34 100% - - - - - - 72
FMP1003 GFYC28NTS 55 100% - - - - - - 72
FMP1004 GFYC28NTW 48 100% - - - - - - 72
FMP1005 GFYC30NTE 34 100% - - - - - - 72
FMP1006 GFYC30NTS 55 100% - - - - - - 72
FMP1007 GFYC30NTW 48 100% - - - - - - 72
FMP1008 NFYC4NTW 66 100% - - - - - - 67
FMP1009 NFYC6NTS 53 100% - - - - - - 68
FMP1010 NFYC6NTW 66 100% - - - - - - 68
FMP1011 NFYC8NTE 51 100% - - - - - - 68
FMP1012 NFYC8NTS 53 100% - - - - - - 68
FMP1013 NFYC8NTW 62 100% - - - - - - 68
FMP1014 NFYC10NTE 45 100% - - - - - - 70
FMP1015 NFYC10NTS 53 100% - - - - - - 70

200
Forest management practice Silvicultural operations with final harvesting – No thinning
Index Name of practice Final cutting
Rotation 1 Rotation 2 Rotation 3 Rotation 4 % biomass removals Age
(years) % Age
(years) % Age
(years) % Age
(years) %
FMP1016 NFYC10NTW 59 100% - - - - - - 70
FMP1017 NFYC12NTE 42 100% - - - - - - 70
FMP1018 NFYC12NTS 53 100% - - - - - - 70
FMP1019 NFYC12NTW 57 100% - - - - - - 70
FMP1020 NFYC14NTE 41 100% - - - - - - 70
FMP1021 NFYC14NTSW 55 100% - - - - - - 70
FMP1022 NFYC16NTE 41 100% - - - - - - 70
FMP1023 NFYC16NTS 55 100% - - - - - - 70
FMP1024 NFYC16NTW 53 100% - - - - - - 70
FMP1025 NFYC18NTE 39 100% - - - - - - 70
FMP1026 NFYC18NTS 55 100% - - - - - - 70
FMP1027 NFYC18NTW 50 100% - - - - - - 70
FMP1028 NFYC20NTE 35 100% - - - - - - 70
FMP1029 NFYC20NTS 55 100% - - - - - - 70
FMP1030 NFYC20NTW 48 100% - - - - - - 70
FMP1031 NFYC22NTE 34 100% - - - - - - 70
FMP1032 NFYC22NTS 55 100% - - - - - - 70
FMP1033 NFYC22NTW 48 100% - - - - - - 70
FMP1034 NFYC24NTS 55 100% - - - - - - 72
FMP1035 NFYC24NTW 48 100% - - - - - - 72

201
Forest management practice Silvicultural operations with final harvesting – No thinning
Index Name of practice Final cutting
Rotation 1 Rotation 2 Rotation 3 Rotation 4 % biomass removals Age
(years) % Age
(years) % Age
(years) % Age
(years) %
FMP1036 NFYC26NTS 55 100% - - - - - - 72
FMP1037 NFYC28NTS 55 100% - - - - - - 72
FMP1038 WHYC4NTE 55 100% - - - - - - 67
FMP1039 WHYC4NTW 66 100% - - - - - - 67
FMP1040 WHYC6NTE 57 100% - - - - - - 68
FMP1041 WHYC6NTS 53 100% - - - - - - 68
FMP1042 WHYC6NTW 66 100% - - - - - - 68
FMP1043 WHYC8NTE 51 100% - - - - - - 68
FMP1044 WHYC8NTS 53 100% - - - - - - 68
FMP1045 WHYC8NTW 62 100% - - - - - - 68
FMP1046 WHYC10NTE 45 100% - - - - - - 68
FMP1047 WHYC10NTS 53 100% - - - - - - 68
FMP1048 WHYC10NTW 59 100% - - - - - - 68
FMP1049 WHYC12NTE 42 100% - - - - - - 76
FMP1050 WHYC12NTS 53 100% - - - - - - 76
FMP1051 WHYC12NTW 57 100% - - - - - - 76
FMP1052 WHYC14NTE 41 100% - - - - - - 76
FMP1053 WHYC14NTSW 55 100% - - - - - - 76
FMP1054 WHYC16NTE 41 100% - - - - - - 76
FMP1055 WHYC16NTS 55 100% - - - - - - 76
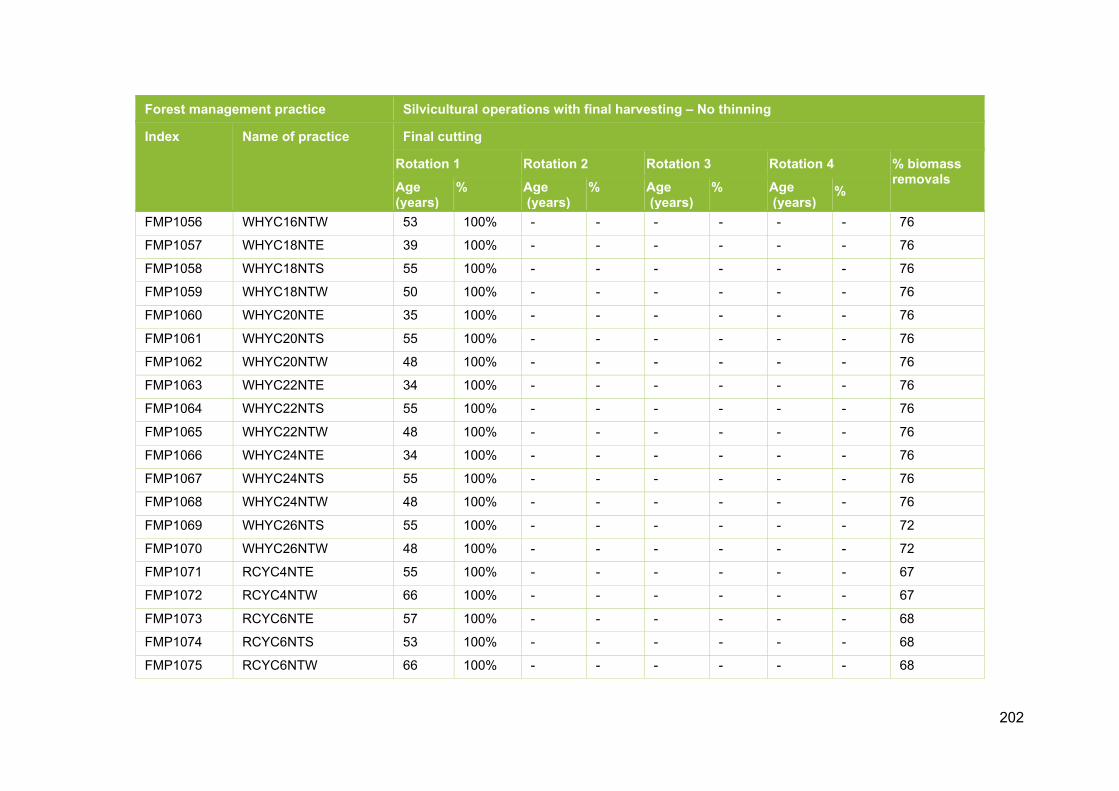
202
Forest management practice Silvicultural operations with final harvesting – No thinning
Index Name of practice Final cutting
Rotation 1 Rotation 2 Rotation 3 Rotation 4 % biomass removals Age
(years) % Age
(years) % Age
(years) % Age
(years) %
FMP1056 WHYC16NTW 53 100% - - - - - - 76
FMP1057 WHYC18NTE 39 100% - - - - - - 76
FMP1058 WHYC18NTS 55 100% - - - - - - 76
FMP1059 WHYC18NTW 50 100% - - - - - - 76
FMP1060 WHYC20NTE 35 100% - - - - - - 76
FMP1061 WHYC20NTS 55 100% - - - - - - 76
FMP1062 WHYC20NTW 48 100% - - - - - - 76
FMP1063 WHYC22NTE 34 100% - - - - - - 76
FMP1064 WHYC22NTS 55 100% - - - - - - 76
FMP1065 WHYC22NTW 48 100% - - - - - - 76
FMP1066 WHYC24NTE 34 100% - - - - - - 76
FMP1067 WHYC24NTS 55 100% - - - - - - 76
FMP1068 WHYC24NTW 48 100% - - - - - - 76
FMP1069 WHYC26NTS 55 100% - - - - - - 72
FMP1070 WHYC26NTW 48 100% - - - - - - 72
FMP1071 RCYC4NTE 55 100% - - - - - - 67
FMP1072 RCYC4NTW 66 100% - - - - - - 67
FMP1073 RCYC6NTE 57 100% - - - - - - 68
FMP1074 RCYC6NTS 53 100% - - - - - - 68
FMP1075 RCYC6NTW 66 100% - - - - - - 68

203
Forest management practice Silvicultural operations with final harvesting – No thinning
Index Name of practice Final cutting
Rotation 1 Rotation 2 Rotation 3 Rotation 4 % biomass removals Age
(years) % Age
(years) % Age
(years) % Age
(years) %
FMP1076 RCYC8NTE 51 100% - - - - - - 68
FMP1077 RCYC8NTS 53 100% - - - - - - 68
FMP1078 RCYC8NTW 62 100% - - - - - - 68
FMP1079 RCYC10NTE 45 100% - - - - - - 68
FMP1080 RCYC10NTS 53 100% - - - - - - 68
FMP1081 RCYC10NTW 59 100% - - - - - - 68
FMP1082 RCYC12NTE 42 100% - - - - - - 67
FMP1083 RCYC12NTS 53 100% - - - - - - 67
FMP1084 RCYC12NTW 57 100% - - - - - - 67
FMP1085 RCYC14NTE 41 100% - - - - - - 67
FMP1086 RCYC14NTSW 55 100% - - - - - - 67
FMP1087 RCYC16NTE 41 100% - - - - - - 67
FMP1088 RCYC16NTS 55 100% - - - - - - 67
FMP1089 RCYC16NTW 53 100% - - - - - - 67
FMP1090 RCYC18NTE 39 100% - - - - - - 67
FMP1091 RCYC18NTS 55 100% - - - - - - 67
FMP1092 RCYC18NTW 50 100% - - - - - - 67
FMP1093 RCYC20NTE 35 100% - - - - - - 67
FMP1094 RCYC20NTS 55 100% - - - - - - 67
FMP1095 RCYC20NTW 48 100% - - - - - - 67

204
Forest management practice Silvicultural operations with final harvesting – No thinning
Index Name of practice Final cutting
Rotation 1 Rotation 2 Rotation 3 Rotation 4 % biomass removals Age
(years) % Age
(years) % Age
(years) % Age
(years) %
FMP1096 RCYC22NTE 34 100% - - - - - - 67
FMP1097 RCYC22NTS 55 100% - - - - - - 67
FMP1098 RCYC22NTW 48 100% - - - - - - 67
FMP1099 RCYC24NTE 34 100% - - - - - - 67
FMP1100 RCYC24NTS 55 100% - - - - - - 67
FMP1101 RCYC24NTW 48 100% - - - - - - 67

205
Private forest estate (England, Scotland and Wales): Forest Management Practices involving clearcutting with thinning during the rotation
Note that up to four rotations are assigned for each FMP. Proportions of forest area within a stratum are assigned to each of the rotations.
FMP Silvicultural operations with final harvesting - Thinning
Index Name of
practice
Initial thinning Main thinnings Late-rotation thinnings Final cutting
Age (yrs)
% biomass removals
Age of
first (yrs)
No. (5 yr
cycle)
% biomass removals Age of
first (yrs)
No. (5 yr
cycle)
% biomass removals
Rotation 1 Rotation 2 Rotation 3 Rotation 4 % biomass removals
Min. Mean Max. Min. Mean Max. Age (yrs)
Percentage
Age (yrs)
Percentage
Age (yrs)
Percentage
Age (yrs)
Percentage
ID Name IT Ag
IT %
MT Ag
MT c.
MT %m
MT %𝑚𝑚�
MT %M
LR Ag
LR c.
LR m
LR 𝑚𝑚�
LR M
Rot1 Ag
Rot1 %
Rot2 Ag
Rot2 %
Rot3 Ag
Rot3 %
Rot4 Ag
Rot4 %
FC %BR

206
ID Name IT Ag
IT %
MT Ag
MT c.
MT%m
MT%𝒎𝒎�
MT%M
LR Ag
LR c.
LR m
LR 𝒎𝒎�
LR M
Rot1 Ag
Rot1 %
Rot2 Ag
Rot2 %
Rot3 Ag
Rot3 %
Rot4 Ag
Rot4 %
FC %BR
FMP1102 NSYC4THW - 0 40 9 4.7 8.0 14 85 8 0.3 1.8 4.2 69 100% - - - - - - 67
FMP1103 NSYC6THE - 0 35 7 6.1 10 16 70 34 0.1 1.1 5.2 66 100% - - - - - - 66
FMP1104 NSYC6THS - 0 35 7 6.1 10 16 70 34 0.1 1.1 5.2 60 100% - - - - - - 66
FMP1105 NSYC6THW - 0 35 7 6.1 10 16 70 34 0.1 1.1 5.2 69 100% - - - - - - 66
FMP1106 NSYC8THE - 0 31 8 5.9 10 17 71 45 0.4 1.4 4.5 42 100% - - - - - - 66
FMP1107 NSYC8THS - 0 31 8 5.9 10 17 71 45 0.4 1.4 4.5 57 100% - - - - - - 66
FMP1108 NSYC8THW - 0 31 8 5.9 10 17 71 45 0.4 1.4 4.5 65 100% - - - - - - 66
FMP1109 NSYC10THE - 0 28 8 6.3 11 20 68 46 0.3 1.4 5.1 46 100% - - - - - - 66
FMP1110 NSYC10THS - 0 28 8 6.3 11 20 68 46 0.3 1.4 5.1 57 100% - - - - - - 66
FMP1111 NSYC10THW - 0 28 8 6.3 11 20 68 46 0.3 1.4 5.1 60 100% - - - - - - 66
FMP1112 NSYC12THE - 0 26 8 6.6 12 22 66 46 0.8 1.8 5.6 41 100% - - - - - - 66
FMP1113 NSYC12THS - 0 26 8 6.6 12 22 66 46 0.8 1.8 5.6 52 100% - - - - - - 66
FMP1114 NSYC12THW - 0 26 8 6.6 12 22 66 46 0.8 1.8 5.6 55 100% - - - - - - 66
FMP1115 NSYC14THE - 0 24 9 6.5 12 24 69 45 0.5 1.6 5.0 44 100% - - - - - - 66
FMP1116 NSYC14THS - 0 24 9 6.5 12 24 69 45 0.5 1.6 5.0 47 100% - - - - - - 66
FMP1117 NSYC14THW - 0 24 9 6.5 12 24 69 45 0.5 1.6 5.0 50 100% - - - - - - 66
FMP1118 NSYC16THE - 0 23 8 7.1 13 25 63 47 0.2 1.4 6.1 40 100% - - - - - - 66
FMP1119 NSYC16THS - 0 23 8 7.1 13 25 63 47 0.2 1.4 6.1 45 100% - - - - - - 66
FMP1120 NSYC16THW - 0 23 8 7.1 13 25 63 47 0.2 1.4 6.1 47 100% - - - - - - 66
FMP1121 NSYC18THE - 0 22 8 7.3 13 26 62 47 0.2 1.4 6.3 40 100% - - - - - - 66
FMP1122 NSYC18THS - 0 22 8 7.3 13 26 62 47 0.2 1.4 6.3 44 100% - - - - - - 66
FMP1123 NSYC18THW - 0 22 8 7.3 13 26 62 47 0.2 1.4 6.3 45 100% - - - - - - 66
FMP1124 NSYC20THE - 0 21 8 7.5 14 28 61 47 0.1 1.3 6.6 32 100% - - - - - - 66

207
ID Name IT Ag
IT %
MT Ag
MT c.
MT%m
MT%𝒎𝒎�
MT%M
LR Ag
LR c.
LR m
LR 𝒎𝒎�
LR M
Rot1 Ag
Rot1 %
Rot2 Ag
Rot2 %
Rot3 Ag
Rot3 %
Rot4 Ag
Rot4 %
FC %BR
FMP1125 NSYC20THSW - 0 21 8 7.5 14 28 61 47 0.1 1.3 6.6 43 100% - - - - - - 66
FMP1126 NSYC22THESW - 0 20 8 7.8 15 30 60 44 0.1 1.2 6.8 43 100% - - - - - - 66
FMP1127 NSYC24THW - 0 21 5 10 16 27 46 28 0.1 1.5 7.2 43 100% - - - - - - 72
FMP1128 SSYC6THE - 0 33 5 6.7 10 14 58 46 0.3 1.4 5.6 56 25% 61 50% 66 25% - - 68
FMP1129 SSYC6THS - 0 33 5 6.7 10 14 58 46 0.3 1.4 5.6 53 25% 58 25% 63 25% 68 25% 68
FMP1130 SSYC8THE - 0 29 6 6.9 11 17 59 47 0.5 1.5 5.1 54 25% 59 50% 64 25% - - 68
FMP1131 SSYC8THS - 0 29 6 6.9 11 17 59 47 0.5 1.5 5.1 49 25% 54 25% 59 25% 64 25% 68
FMP1132 SSYC10THE - 0 26 6 7.5 12 20 56 47 0.2 1.2 5.7 50 25% 55 50% 60 25% - - 68
FMP1133 SSYC10THS - 0 26 6 7.5 12 20 56 47 0.2 1.2 5.7 49 25% 54 25% 59 25% 64 25% 68
FMP1134 SSYC12THE - 0 24 6 8.0 13 22 54 44 0.1 1.2 6.2 49 25% 54 50% 59 25% - - 68
FMP1135 SSYC12THS - 0 24 6 8.0 13 22 54 44 0.1 1.2 6.2 45 25% 50 25% 55 25% 60 25% 68
FMP1136 SSYC12THW - 0 24 6 8.0 13 22 54 44 0.1 1.2 6.2 46 25% 51 25% 56 25% 61 25% 68
FMP1137 SSYC14THE - 0 22 6 8.5 15 25 52 38 0.1 1.3 6.7 45 25% 50 50% 55 25% - - 68
FMP1138 SSYC14THS - 0 22 6 8.5 15 25 52 38 0.1 1.3 6.7 40 25% 45 25% 50 25% 55 25% 68
FMP1139 SSYC14THW - 0 22 6 8.5 15 25 52 38 0.1 1.3 6.7 43 25% 48 25% 53 25% 58 25% 68
FMP1140 SSYC16THE - 0 21 6 8.7 15 26 51 41 0.1 1.3 6.8 43 25% 48 50% 53 25% - - 68
FMP1141 SSYC16THS - 0 21 6 8.7 15 26 51 41 0.1 1.3 6.8 37 25% 42 25% 47 25% 52 25% 68
FMP1142 SSYC16THW - 0 21 6 8.7 15 26 51 41 0.1 1.3 6.8 41 25% 46 25% 51 25% 56 25% 68
FMP1143 SSYC18THE - 0 20 5 10 17 26 45 42 0.1 1.5 8.8 42 25% 47 50% 52 25% - - 68
FMP1144 SSYC18THS - 0 20 5 10 17 26 45 42 0.1 1.5 8.8 34 25% 39 25% 44 25% 49 25% 68
FMP1145 SSYC18THW - 0 20 5 10 17 26 45 42 0.1 1.5 8.8 39 25% 44 25% 49 25% 54 25% 68
FMP1146 SSYC20THE - 0 19 6 9.2 16 27 49 40 0.1 1.3 7.1 41 25% 46 50% 51 25% 68
FMP1147 SSYC20THS - 0 19 6 9.2 16 27 49 40 0.1 1.3 7.1 33 25% 38 25% 43 25% 48 25% 68

208
ID Name IT Ag
IT %
MT Ag
MT c.
MT%m
MT%𝒎𝒎�
MT%M
LR Ag
LR c.
LR m
LR 𝒎𝒎�
LR M
Rot1 Ag
Rot1 %
Rot2 Ag
Rot2 %
Rot3 Ag
Rot3 %
Rot4 Ag
Rot4 %
FC %BR
FMP1148 SSYC20THW - 0 19 6 9.2 16 27 49 40 0.1 1.3 7.1 37 25% 42 25% 47 25% 52 25% 68
FMP1149 SSYC22THE - 0 18 6 9.5 16 28 48 39 0.1 1.4 7.3 38 25% 43 50% 48 25% - - 68
FMP1150 SSYC22THS - 0 18 6 9.5 16 28 48 39 0.1 1.4 7.3 33 25% 38 25% 43 25% 48 25% 68
FMP1151 SSYC22THW - 0 18 6 9.5 16 28 48 39 0.1 1.4 7.3 35 25% 40 25% 45 25% 50 25% 68
FMP1152 SSYC24THE - 0 18 5 10 17 26 43 44 0.1 1.4 8.6 40 25% 45 50% 50 25% - - 68
FMP1153 SSYC24THS - 0 18 5 10 17 26 43 44 0.1 1.4 8.6 33 25% 38 25% 43 25% 48 25% 68
FMP1154 SSYC24THW - 0 18 5 10 17 26 43 44 0.1 1.4 8.6 34 25% 39 25% 44 25% 49 25% 68
FMP1155 SSYC26THE - 0 20 5 10 18 30 45 32 0.1 1.4 7.6 40 25% 45 50% 50 25% - - 72
FMP1156 SSYC26THS - 0 20 5 10 18 30 45 32 0.1 1.4 7.6 33 25% 38 25% 43 25% 48 25% 72
FMP1157 SSYC26THW - 0 20 5 10 18 30 45 32 0.1 1.4 7.6 34 25% 39 25% 44 25% 49 25% 72
FMP1158 SSYC28THE - 0 20 4 12 19 29 40 35 0.1 1.6 10.2 40 25% 45 50% 50 25% - - 72
FMP1159 SSYC28THS - 0 20 4 12 19 29 40 35 0.1 1.6 10.2 33 25% 38 25% 43 25% 48 25% 72
FMP1160 SSYC30THS - 0 19 5 11 19 32 44 38 0.1 1.4 8.0 33 25% 38 25% 43 25% 48 25% 72
FMP1161 SPYC4THE - 0 40 9 4.7 8.0 14 85 8 0.3 1.8 4.2 74 50% 94 50% - - - - 67
FMP1162 SPYC4THS - 0 40 9 4.7 8.0 14 85 8 0.3 1.8 4.2 83 25% 88 25% 93 25% 98 25% 67
FMP1163 SPYC4THW - 0 40 9 4.7 8.0 14 85 8 0.3 1.8 4.2 83 100% - - - - - - 67
FMP1164 SPYC6THE - 0 33 10 5.1 8.7 16 83 12 0.2 1.4 3.9 70 50% 90 50% - - - - 67
FMP1165 SPYC6THS - 0 33 10 5.1 8.7 16 83 12 0.2 1.4 3.9 80 25% 85 25% 90 25% 95 25% 67
FMP1166 SPYC6THW - 0 33 10 5.1 8.7 16 83 12 0.2 1.4 3.9 80 100% - - - - - - 67
FMP1167 SPYC8THE - 0 29 9 5.9 10 18 74 16 0.1 1.5 4.9 65 50% 86 50% - - - - 67
FMP1168 SPYC8THS - 0 29 9 5.9 10 18 74 16 0.1 1.5 4.9 75 25% 80 25% 85 25% 90 25% 67
FMP1169 SPYC8THW - 0 29 9 5.9 10 18 74 16 0.1 1.5 4.9 75 100% - - - - - - 67
FMP1170 SPYC10THE - 0 25 8 6.9 12 21 65 20 0.1 1.8 6.1 60 50% 80 50% - - - - 67

209
ID Name IT Ag
IT %
MT Ag
MT c.
MT%m
MT%𝒎𝒎�
MT%M
LR Ag
LR c.
LR m
LR 𝒎𝒎�
LR M
Rot1 Ag
Rot1 %
Rot2 Ag
Rot2 %
Rot3 Ag
Rot3 %
Rot4 Ag
Rot4 %
FC %BR
FMP1171 SPYC10THS - 0 25 8 6.9 12 21 65 20 0.1 1.8 6.1 69 25% 74 25% 79 25% 84 25% 67
FMP1172 SPYC10THW - 0 25 8 6.9 12 21 65 20 0.1 1.8 6.1 69 100% - - - - - - 67
FMP1173 SPYC12THE - 0 23 8 7.2 12 21 63 25 0.1 1.6 6.1 55 50% 75 50% - - - - 67
FMP1174 SPYC12THS - 0 23 8 7.2 12 21 63 25 0.1 1.6 6.1 64 25% 69 25% 74 25% 79 25% 67
FMP1175 SPYC12THW - 0 23 8 7.2 12 21 63 25 0.1 1.6 6.1 64 100% - - - - - - 67
FMP1176 SPYC14THE - 0 21 7 8.4 14 23 56 28 0.1 1.8 7.3 50 50% 70 50% - - - - 67
FMP1177 SPYC14THS - 0 21 7 8.4 14 23 56 28 0.1 1.8 7.3 58 25% 63 25% 68 25% 73 25% 67
FMP1178 SPYC14THW - 0 21 7 8.4 14 23 56 28 0.1 1.8 7.3 59 100% - - - - - - 67
FMP1179 SPYC16THW - 0 20 5 11 16 23 45 50 1.2 2.3 9.5 59 100% - - - - - - 73
FMP1180 SPYC20THW - 0 18 6 11 17 27 48 50 1.1 2.2 8.2 59 100% - - - - - - 73
FMP1181 CPYC4THS - 0 40 9 4.7 8.0 14 85 8 0.3 1.8 4.2 62 100% - - - - - - 67
FMP1182 CPYC4THW - 0 40 9 4.7 8.0 14 85 8 0.3 1.8 4.2 69 100% - - - - - - 67
FMP1183 CPYC6THE - 0 33 6 6.6 8.8 12 63 47 0.5 1.7 5.3 70 100% - - - - - - 73
FMP1184 CPYC6THS - 0 33 6 6.6 8.8 12 63 47 0.5 1.7 5.3 62 100% - - - - - - 73
FMP1185 CPYC6THW - 0 33 6 6.6 8.8 12 63 47 0.5 1.7 5.3 69 100% - - - - - - 73
FMP1186 CPYC8THE - 0 28 6 7.6 10 15 58 48 0.7 1.8 6.1 69 100% - - - - - - 73
FMP1187 CPYC8THS - 0 28 6 7.6 10 15 58 48 0.7 1.8 6.1 62 100% - - - - - - 73
FMP1188 CPYC8THW - 0 28 6 7.6 10 15 58 48 0.7 1.8 6.1 68 100% - - - - - - 73
FMP1189 CPYC10THE - 0 25 6 8.3 12 17 55 48 0.8 2.0 6.8 66 100% - - - - - - 73
FMP1190 CPYC10THS - 0 25 6 8.3 12 17 55 48 0.8 2.0 6.8 62 100% - - - - - - 73
FMP1191 CPYC10THW - 0 25 6 8.3 12 17 55 48 0.8 2.0 6.8 65 100% - - - - - - 73
FMP1192 CPYC12THE - 0 23 6 8.8 13 19 53 49 0.8 2.0 7.1 63 100% - - - - - - 73
FMP1193 CPYC12THS - 0 23 6 8.8 13 19 53 49 0.8 2.0 7.1 62 100% - - - - - - 73

210
ID Name IT Ag
IT %
MT Ag
MT c.
MT%m
MT%𝒎𝒎�
MT%M
LR Ag
LR c.
LR m
LR 𝒎𝒎�
LR M
Rot1 Ag
Rot1 %
Rot2 Ag
Rot2 %
Rot3 Ag
Rot3 %
Rot4 Ag
Rot4 %
FC %BR
FMP1194 CPYC12THW - 0 23 6 8.8 13 19 53 49 0.8 2.0 7.1 61 100% - - - - - - 73
FMP1195 CPYC14THE - 0 21 6 9.5 14 22 51 49 1.8 2.5 7.8 60 100% - - - - - - 73
FMP1196 CPYC14THS - 0 21 6 9.5 14 22 51 49 1.8 2.5 7.8 62 100% - - - - - - 73
FMP1197 CPYC14THW - 0 21 6 9.5 14 22 51 49 1.8 2.5 7.8 58 100% - - - - - - 73
FMP1198 CPYC16THE - 0 20 5 11 16 23 45 50 1.2 2.3 9.5 56 100% - - - - - - 73
FMP1199 CPYC16THW - 0 20 5 11 16 23 45 50 1.2 2.3 9.5 54 100% - - - - - - 73
FMP1200 CPYC18THE - 0 19 6 10 16 25 49 49 1.4 2.3 8.1 53 100% - - - - - - 73
FMP1201 CPYC18THW - 0 19 6 10 16 25 49 49 1.4 2.3 8.1 51 100% - - - - - - 73
FMP1202 CPYC20THE - 0 18 6 11 17 27 48 50 1.1 2.2 8.2 52 100% - - - - - - 73
FMP1203 CPYC20THW - 0 18 6 11 17 27 48 50 1.1 2.2 8.2 50 100% - - - - - - 73
FMP1204 CPYC22THW - 0 21 5 10 17 28 46 28 0.1 1.5 7.4 50 100% - - - - - - 72
FMP1205 LPYC4THE - 0 40 5 5.4 6.5 7.9 65 46 1.1 1.8 4.9 56 100% - - - - - - 67
FMP1206 LPYC4THS - 0 40 5 5.4 6.5 7.9 65 46 1.1 1.8 4.9 61 100% - - - - - - 67
FMP1207 LPYC4THW - 0 40 5 5.4 6.5 7.9 65 46 1.1 1.8 4.9 45 100% - - - - - - 67
FMP1208 LPYC6THE - 0 31 7 6.0 7.9 11 66 46 1.6 2.3 4.8 55 100% - - - - - - 67
FMP1209 LPYC6THS - 0 31 7 6.0 7.9 11 66 46 1.6 2.3 4.8 57 100% - - - - - - 67
FMP1210 LPYC6THW - 0 31 7 6.0 7.9 11 66 46 1.6 2.3 4.8 45 100% - - - - - - 67
FMP1211 LPYC8THE - 0 26 7 6.8 10 14 61 47 1.8 2.6 5.6 52 100% - - - - - - 67
FMP1212 LPYC8THS - 0 26 7 6.8 10 14 61 47 1.8 2.6 5.6 57 100% - - - - - - 67
FMP1213 LPYC8THW - 0 26 7 6.8 10 14 61 47 1.8 2.6 5.6 45 100% - - - - - - 67
FMP1214 LPYC10THE - 0 23 7 7.4 11 17 58 48 2.4 3.0 6.2 47 100% - - - - - - 67
FMP1215 LPYC10THS - 0 23 7 7.4 11 17 58 48 2.4 3.0 6.2 54 100% - - - - - - 67
FMP1216 LPYC10THW - 0 23 7 7.4 11 17 58 48 2.4 3.0 6.2 45 100% - - - - - - 67

211
ID Name IT Ag
IT %
MT Ag
MT c.
MT%m
MT%𝒎𝒎�
MT%M
LR Ag
LR c.
LR m
LR 𝒎𝒎�
LR M
Rot1 Ag
Rot1 %
Rot2 Ag
Rot2 %
Rot3 Ag
Rot3 %
Rot4 Ag
Rot4 %
FC %BR
FMP1217 LPYC12THE - 0 21 7 7.9 12 19 56 48 2.2 2.9 6.6 39 100% - - - - - - 67
FMP1218 LPYC12THS - 0 21 7 7.9 12 19 56 48 2.2 2.9 6.6 49 100% - - - - - - 67
FMP1219 LPYC12THW - 0 21 7 7.9 12 19 56 48 2.2 2.9 6.6 45 100% - - - - - - 67
FMP1220 LPYC14THE - 0 19 7 8.4 13 23 54 48 1.2 2.5 7.0 29 100% - - - - - - 67
FMP1221 LPYC14THSW - 0 19 7 8.4 13 23 54 48 1.2 2.5 7.0 45 100% - - - - - - 67
FMP1222 LPYC16THE - 0 20 5 11 16 23 45 50 1.2 2.3 9.5 29 100% - - - - - - 73
FMP1223 LPYC16THW - 0 20 5 11 16 23 45 50 1.2 2.3 9.5 45 100% - - - - - - 73
FMP1224 LPYC18THE - 0 19 6 10 16 25 49 49 1.4 2.3 8.1 29 100% - - - - - - 73
FMP1225 LPYC20THE - 0 18 6 11 17 27 48 50 1.1 2.2 8.2 29 100% - - - - - - 73
FMP1226 LPYC20THSW - 0 18 6 11 17 27 48 50 1.1 2.2 8.2 45 100% - - - - - - 73
FMP1227 ELYC2THE - 0 32 5 7.5 10 14 57 11 0.4 2.2 5.9 60 100% - - - - - - 80
FMP1228 ELYC2THS - 0 32 5 7.5 10 14 57 11 0.4 2.2 5.9 84 100% - - - - - - 80
FMP1229 ELYC4THE - 0 32 5 7.5 10 14 57 11 0.4 2.2 5.9 68 100% - - - - - - 80
FMP1230 ELYC4THS - 0 32 5 7.5 10 14 57 11 0.4 2.2 5.9 84 100% - - - - - - 80
FMP1231 ELYC4THW - 0 32 5 7.5 10 14 57 11 0.4 2.2 5.9 57 100% - - - - - - 80
FMP1232 ELYC6THE - 0 26 5 9.1 13 18 51 16 0.3 2.4 7.9 69 100% - - - - - - 80
FMP1233 ELYC6THS - 0 26 5 9.1 13 18 51 16 0.3 2.4 7.9 78 100% - - - - - - 80
FMP1234 ELYC6THW - 0 26 5 9.1 13 18 51 16 0.3 2.4 7.9 55 100% - - - - - - 80
FMP1235 ELYC8THE - 0 22 6 9.6 14 22 52 20 0.3 2.1 7.1 67 100% - - - - - - 80
FMP1236 ELYC8THS - 0 22 6 9.6 14 22 52 20 0.3 2.1 7.1 78 100% - - - - - - 80
FMP1237 ELYC8THW - 0 22 6 9.6 14 22 52 20 0.3 2.1 7.1 52 100% - - - - - - 80
FMP1238 ELYC10THE - 0 20 5 11 16 24 45 27 0.2 2.3 9.2 64 100% - - - - - - 80
FMP1239 ELYC10THS - 0 20 5 11 16 24 45 27 0.2 2.3 9.2 73 100% - - - - - - 80

212
ID Name IT Ag
IT %
MT Ag
MT c.
MT%m
MT%𝒎𝒎�
MT%M
LR Ag
LR c.
LR m
LR 𝒎𝒎�
LR M
Rot1 Ag
Rot1 %
Rot2 Ag
Rot2 %
Rot3 Ag
Rot3 %
Rot4 Ag
Rot4 %
FC %BR
FMP1240 ELYC10THW - 0 20 5 11 16 24 45 27 0.2 2.3 9.2 47 100% - - - - - - 80
FMP1241 ELYC12THE - 0 18 5 12 18 26 43 34 0.2 2.2 9.9 61 100% - - - - - - 80
FMP1242 ELYC12THS - 0 18 5 12 18 26 43 34 0.2 2.2 9.9 69 100% - - - - - - 80
FMP1243 ELYC12THW - 0 18 5 12 18 26 43 34 0.2 2.2 9.9 43 100% - - - - - - 80
FMP1244 ELYC14THE - 0 14 6 12 20 34 44 46 4.7 10 76 66 100% - - - - - - 76
FMP1245 ELYC14THS - 0 14 6 12 20 34 44 46 4.7 10 76 69 100% - - - - - - 76
FMP1246 ELYC14THW - 0 14 6 12 20 34 44 46 4.7 10 76 43 100% - - - - - - 76
FMP1247 JLYC2THE - 0 26 5 8.5 12 18 51 49 1.6 1.9 6.2 59 25% 64 50% 69 25% - - 76
FMP1248 JLYC2THS - 0 26 5 8.5 12 18 51 49 1.6 1.9 6.2 68 75% 88 25% - - - - 76
FMP1249 JLYC4THE - 0 26 5 8.5 12 18 51 49 1.6 1.9 6.2 59 25% 64 50% 69 25% - - 76
FMP1250 JLYC4THS - 0 26 5 8.5 12 18 51 49 1.6 1.9 6.2 68 75% 88 25% - - - - 76
FMP1251 JLYC4THW - 0 26 5 8.5 12 18 51 49 1.6 1.9 6.2 57 100% - - - - - - 76
FMP1252 JLYC6THE - 0 22 5 9.7 14 21 47 50 2.7 3.6 7.9 58 25% 63 50% 68 25% - - 76
FMP1253 JLYC6THS - 0 22 5 9.7 14 21 47 50 2.7 3.6 7.9 63 75% 83 25% - - - - 76
FMP1254 JLYC6THW - 0 22 5 9.7 14 21 47 50 2.7 3.6 7.9 56 100% - - - - - - 76
FMP1255 JLYC8THE - 0 19 6 10 15 25 49 49 3.3 4.5 8.6 56 25% 61 50% 66 25% - - 76
FMP1256 JLYC8THS - 0 19 6 10 15 25 49 49 3.3 4.5 8.6 61 75% 81 25% - - - - 76
FMP1257 JLYC8THW - 0 19 6 10 15 25 49 49 3.3 4.5 8.6 54 100% - - - - - - 76
FMP1258 JLYC10THE - 0 17 5 12 18 28 42 45 4.2 10 76 59 25% 64 50% 69 25% - - 76
FMP1259 JLYC10THS - 0 17 5 12 18 28 42 45 4.2 10 76 58 75% 78 25% - - - - 76
FMP1260 JLYC10THW - 0 17 5 12 18 28 42 45 4.2 10 76 50 100% - - - - - - 76
FMP1261 JLYC12THE - 0 15 5 13 20 33 40 42 4.6 10 76 53 25% 58 50% 63 25% - - 76
FMP1262 JLYC12THS - 0 15 5 13 20 33 40 42 4.6 10 76 52 75% 72 25% - - - - 76

213
ID Name IT Ag
IT %
MT Ag
MT c.
MT%m
MT%𝒎𝒎�
MT%M
LR Ag
LR c.
LR m
LR 𝒎𝒎�
LR M
Rot1 Ag
Rot1 %
Rot2 Ag
Rot2 %
Rot3 Ag
Rot3 %
Rot4 Ag
Rot4 %
FC %BR
FMP1263 JLYC12THW - 0 15 5 13 20 33 40 42 4.6 10 76 46 100% - - - - - - 76
FMP1264 JLYC14THE - 0 14 6 12 20 34 44 46 4.7 10 76 48 25% 53 50% 58 25% - - 76
FMP1265 JLYC14THS - 0 14 6 12 20 34 44 46 4.7 10 76 43 75% 63 25% - - - - 76
FMP1266 JLYC14THW - 0 14 6 12 20 34 44 46 4.7 10 76 43 100% - - - - - - 76
FMP1267 DFYC4THW - 0 40 9 4.7 8.0 14 85 8 0.3 1.8 4.2 64 100% - - - - - - 67
FMP1268 DFYC6THS - 0 33 10 5.1 8.7 16 83 12 0.2 1.4 3.9 74 100% - - - - - - 67
FMP1269 DFYC6THW - 0 33 10 5.1 8.7 16 83 12 0.2 1.4 3.9 64 100% - - - - - - 67
FMP1270 DFYC8THE - 0 28 7 6.8 11 18 63 47 0.4 1.5 5.3 81 25% 86 50% 91 25% - - 71
FMP1271 DFYC8THS - 0 28 7 6.8 11 18 63 47 0.4 1.5 5.3 74 100% - - - - - - 71
FMP1272 DFYC8THW - 0 28 7 6.8 11 18 63 47 0.4 1.5 5.3 64 100% - - - - - - 71
FMP1273 DFYC10THE - 0 25 6 8.0 12 20 55 48 1.0 2.1 7.1 76 25% 81 50% 86 25% - - 71
FMP1274 DFYC10THS - 0 25 6 8.0 12 20 55 48 1.0 2.1 7.1 70 100% - - - - - - 71
FMP1275 DFYC10THW - 0 25 6 8.0 12 20 55 48 1.0 2.1 7.1 64 100% - - - - - - 71
FMP1276 DFYC12THE - 0 23 7 7.9 12 21 58 48 0.4 1.6 6.0 71 25% 76 50% 81 25% - - 71
FMP1277 DFYC12THS - 0 23 7 7.9 12 21 58 48 0.4 1.6 6.0 69 100% - - - - - - 71
FMP1278 DFYC12THW - 0 23 7 7.9 12 21 58 48 0.4 1.6 6.0 60 100% - - - - - - 71
FMP1279 DFYC14THE - 0 21 6 9.1 15 24 51 49 0.6 1.9 8.0 66 25% 71 50% 76 25% - - 71
FMP1280 DFYC14THS - 0 21 6 9.1 15 24 51 49 0.6 1.9 8.0 67 100% - - - - - - 71
FMP1281 DFYC14THW - 0 21 6 9.1 15 24 51 49 0.6 1.9 8.0 55 100% - - - - - - 71
FMP1282 DFYC16THE - 0 19 7 9.0 15 28 54 48 0.3 1.6 6.9 64 25% 69 50% 74 25% - - 71
FMP1283 DFYC16THS - 0 19 7 9.0 15 28 54 48 0.3 1.6 6.9 59 100% - - - - - - 71
FMP1284 DFYC16THW - 0 19 7 9.0 15 28 54 48 0.3 1.6 6.9 63 100% - - - - - - 71
FMP1285 DFYC18THE - 0 18 7 9.3 16 30 53 49 0.4 1.7 7.0 63 25% 68 50% 73 25% - - 71

214
ID Name IT Ag
IT %
MT Ag
MT c.
MT%m
MT%𝒎𝒎�
MT%M
LR Ag
LR c.
LR m
LR 𝒎𝒎�
LR M
Rot1 Ag
Rot1 %
Rot2 Ag
Rot2 %
Rot3 Ag
Rot3 %
Rot4 Ag
Rot4 %
FC %BR
FMP1286 DFYC18THS - 0 18 7 9.3 16 30 53 49 0.4 1.7 7.0 57 100% - - - - - - 71
FMP1287 DFYC18THW - 0 18 7 9.3 16 30 53 49 0.4 1.7 7.0 62 100% - - - - - - 71
FMP1288 DFYC20THE - 0 17 7 9.6 17 32 52 49 0.3 1.6 7.2 62 25% 67 50% 72 25% - - 71
FMP1289 DFYC20THS - 0 17 7 9.6 17 32 52 49 0.3 1.6 7.2 56 100% - - - - - - 71
FMP1290 DFYC20THW - 0 17 7 9.6 17 32 52 49 0.3 1.6 7.2 61 100% - - - - - - 71
FMP1291 DFYC22THE - 0 17 6 10 18 30 47 50 0.5 1.9 8.8 61 25% 66 50% 71 25% - - 71
FMP1292 DFYC22THS - 0 17 6 10 18 30 47 50 0.5 1.9 8.8 56 100% - - - - - - 71
FMP1293 DFYC22THW - 0 17 6 10 18 30 47 50 0.5 1.9 8.8 61 100% - - - - - - 71
FMP1294 DFYC24THE - 0 16 6 11 19 34 46 50 1.0 2.3 9.2 61 25% 66 50% 71 25% - - 71
FMP1295 DFYC24THS - 0 16 6 11 19 34 46 50 1.0 2.3 9.2 56 100% - - - - - - 71
FMP1296 DFYC24THW - 0 16 6 11 19 34 46 50 1.0 2.3 9.2 61 100% - - - - - - 71
FMP1297 DFYC26THE - 0 20 5 10 18 30 45 32 0.1 1.4 7.6 61 25% 66 50% 71 25% - - 72
FMP1298 DFYC26THS - 0 20 5 10 18 30 45 32 0.1 1.4 7.6 56 100% - - - - - - 72
FMP1299 GFYC4THW - 0 40 9 4.7 8.0 14 85 8 0.3 1.8 4.2 75 100% - - - - - - 67
FMP1300 GFYC6THS - 0 33 5 6.7 10 14 58 46 0.3 1.4 5.6 60 100% - - - - - - 68
FMP1301 GFYC8THE - 0 29 6 6.9 11 17 59 47 0.5 1.5 5.1 59 100% - - - - - - 68
FMP1302 GFYC8THS - 0 29 6 6.9 11 17 59 47 0.5 1.5 5.1 60 100% - - - - - - 68
FMP1303 GFYC10THE - 0 26 6 7.5 12 20 56 47 0.2 1.2 5.7 54 100% - - - - - - 68
FMP1304 GFYC10THS - 0 26 6 7.5 12 20 56 47 0.2 1.2 5.7 60 100% - - - - - - 68
FMP1305 GFYC10THW - 0 26 6 7.5 12 20 56 47 0.2 1.2 5.7 66 100% - - - - - - 68
FMP1306 GFYC12THE - 0 27 5 8.2 12 19 52 18 0.1 1.6 6.0 49 100% - - - - - - 72
FMP1307 GFYC12THS - 0 27 5 8.2 12 19 52 18 0.1 1.6 6.0 60 100% - - - - - - 72
FMP1308 GFYC12THW - 0 27 5 8.2 12 19 52 18 0.1 1.6 6.0 61 100% - - - - - - 72
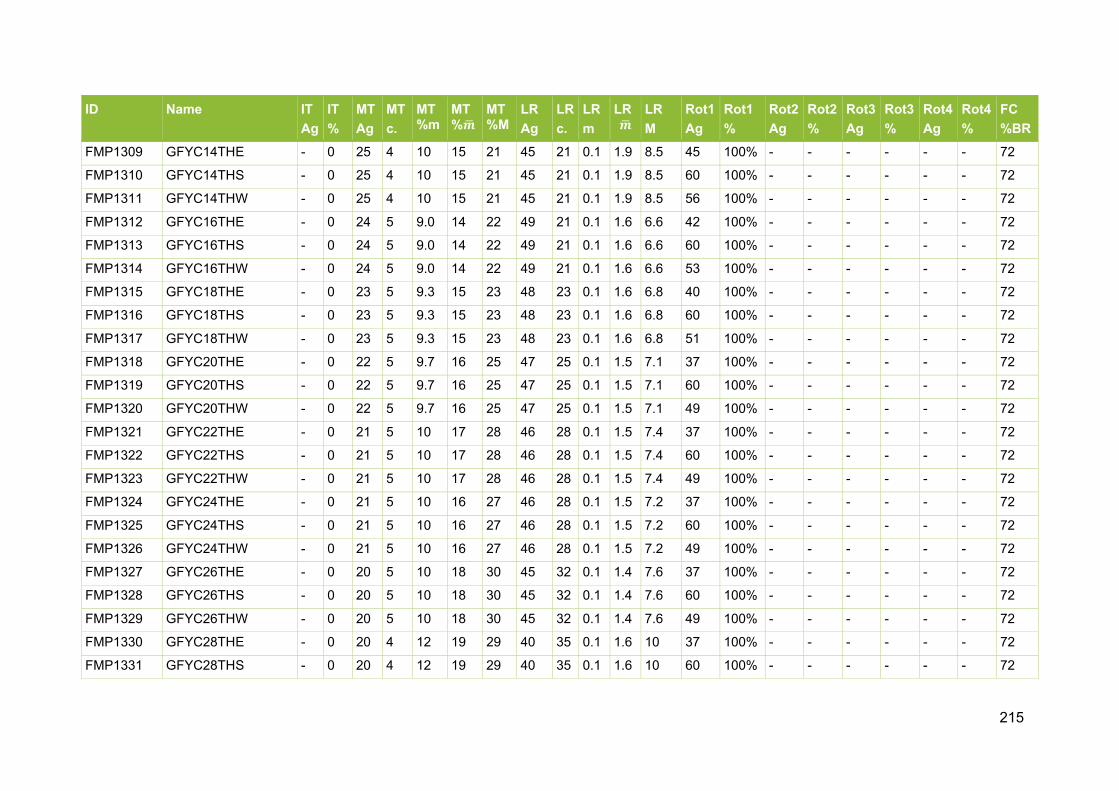
215
ID Name IT Ag
IT %
MT Ag
MT c.
MT%m
MT%𝒎𝒎�
MT%M
LR Ag
LR c.
LR m
LR 𝒎𝒎�
LR M
Rot1 Ag
Rot1 %
Rot2 Ag
Rot2 %
Rot3 Ag
Rot3 %
Rot4 Ag
Rot4 %
FC %BR
FMP1309 GFYC14THE - 0 25 4 10 15 21 45 21 0.1 1.9 8.5 45 100% - - - - - - 72
FMP1310 GFYC14THS - 0 25 4 10 15 21 45 21 0.1 1.9 8.5 60 100% - - - - - - 72
FMP1311 GFYC14THW - 0 25 4 10 15 21 45 21 0.1 1.9 8.5 56 100% - - - - - - 72
FMP1312 GFYC16THE - 0 24 5 9.0 14 22 49 21 0.1 1.6 6.6 42 100% - - - - - - 72
FMP1313 GFYC16THS - 0 24 5 9.0 14 22 49 21 0.1 1.6 6.6 60 100% - - - - - - 72
FMP1314 GFYC16THW - 0 24 5 9.0 14 22 49 21 0.1 1.6 6.6 53 100% - - - - - - 72
FMP1315 GFYC18THE - 0 23 5 9.3 15 23 48 23 0.1 1.6 6.8 40 100% - - - - - - 72
FMP1316 GFYC18THS - 0 23 5 9.3 15 23 48 23 0.1 1.6 6.8 60 100% - - - - - - 72
FMP1317 GFYC18THW - 0 23 5 9.3 15 23 48 23 0.1 1.6 6.8 51 100% - - - - - - 72
FMP1318 GFYC20THE - 0 22 5 9.7 16 25 47 25 0.1 1.5 7.1 37 100% - - - - - - 72
FMP1319 GFYC20THS - 0 22 5 9.7 16 25 47 25 0.1 1.5 7.1 60 100% - - - - - - 72
FMP1320 GFYC20THW - 0 22 5 9.7 16 25 47 25 0.1 1.5 7.1 49 100% - - - - - - 72
FMP1321 GFYC22THE - 0 21 5 10 17 28 46 28 0.1 1.5 7.4 37 100% - - - - - - 72
FMP1322 GFYC22THS - 0 21 5 10 17 28 46 28 0.1 1.5 7.4 60 100% - - - - - - 72
FMP1323 GFYC22THW - 0 21 5 10 17 28 46 28 0.1 1.5 7.4 49 100% - - - - - - 72
FMP1324 GFYC24THE - 0 21 5 10 16 27 46 28 0.1 1.5 7.2 37 100% - - - - - - 72
FMP1325 GFYC24THS - 0 21 5 10 16 27 46 28 0.1 1.5 7.2 60 100% - - - - - - 72
FMP1326 GFYC24THW - 0 21 5 10 16 27 46 28 0.1 1.5 7.2 49 100% - - - - - - 72
FMP1327 GFYC26THE - 0 20 5 10 18 30 45 32 0.1 1.4 7.6 37 100% - - - - - - 72
FMP1328 GFYC26THS - 0 20 5 10 18 30 45 32 0.1 1.4 7.6 60 100% - - - - - - 72
FMP1329 GFYC26THW - 0 20 5 10 18 30 45 32 0.1 1.4 7.6 49 100% - - - - - - 72
FMP1330 GFYC28THE - 0 20 4 12 19 29 40 35 0.1 1.6 10 37 100% - - - - - - 72
FMP1331 GFYC28THS - 0 20 4 12 19 29 40 35 0.1 1.6 10 60 100% - - - - - - 72

216
ID Name IT Ag
IT %
MT Ag
MT c.
MT%m
MT%𝒎𝒎�
MT%M
LR Ag
LR c.
LR m
LR 𝒎𝒎�
LR M
Rot1 Ag
Rot1 %
Rot2 Ag
Rot2 %
Rot3 Ag
Rot3 %
Rot4 Ag
Rot4 %
FC %BR
FMP1332 GFYC28THW - 0 20 4 12 19 29 40 35 0.1 1.6 10 49 100% - - - - - - 72
FMP1333 GFYC30THE - 0 19 5 11 19 32 44 38 0.1 1.4 8.0 37 100% - - - - - - 72
FMP1334 GFYC30THS - 0 19 5 11 19 32 44 38 0.1 1.4 8.0 60 100% - - - - - - 72
FMP1335 GFYC30THW - 0 19 5 11 19 32 44 38 0.1 1.4 8.0 49 100% - - - - - - 72
FMP1336 NFYC4THW - 0 40 9 4.7 8.0 14 85 8 0.3 1.8 4.2 75 100% - - - - - - 67
FMP1337 NFYC6THS - 0 33 5 6.7 10 14 58 46 0.3 1.4 5.6 60 100% - - - - - - 68
FMP1338 NFYC6THW - 0 33 5 6.7 10 14 58 46 0.3 1.4 5.6 75 100% - - - - - - 68
FMP1339 NFYC8THE - 0 29 6 6.9 11 17 59 47 0.5 1.5 5.1 59 100% - - - - - - 68
FMP1340 NFYC8THS - 0 29 6 6.9 11 17 59 47 0.5 1.5 5.1 60 100% - - - - - - 68
FMP1341 NFYC8THW - 0 29 6 6.9 11 17 59 47 0.5 1.5 5.1 71 100% - - - - - - 68
FMP1342 NFYC10THE - 0 34 7 5.9 8.0 12 69 45 0.8 1.8 4.7 54 100% - - - - - - 70
FMP1343 NFYC10THS - 0 34 7 5.9 8.0 12 69 45 0.8 1.8 4.7 60 100% - - - - - - 70
FMP1344 NFYC10THW - 0 34 7 5.9 8.0 12 69 45 0.8 1.8 4.7 66 100% - - - - - - 70
FMP1345 NFYC12THE - 0 31 7 6.3 8.9 13 66 46 1.8 2.4 4.8 49 100% - - - - - - 70
FMP1346 NFYC12THS - 0 31 7 6.3 8.9 13 66 46 1.8 2.4 4.8 60 100% - - - - - - 70
FMP1347 NFYC12THW - 0 31 7 6.3 8.9 13 66 46 1.8 2.4 4.8 61 100% - - - - - - 70
FMP1348 NFYC14THE - 0 29 7 6.7 10 15 64 46 1.9 2.5 5.4 45 100% - - - - - - 70
FMP1349 NFYC14THS - 0 29 7 6.7 10 15 64 46 1.9 2.5 5.4 60 100% - - - - - - 70
FMP1350 NFYC14THW - 0 29 7 6.7 10 15 64 46 1.9 2.5 5.4 56 100% - - - - - - 70
FMP1351 NFYC16THE - 0 27 7 7.1 10 16 62 47 1.8 2.6 5.7 42 100% - - - - - - 70
FMP1352 NFYC16THS - 0 27 7 7.1 10 16 62 47 1.8 2.6 5.7 60 100% - - - - - - 70
FMP1353 NFYC16THW - 0 27 7 7.1 10 16 62 47 1.8 2.6 5.7 53 100% - - - - - - 70
FMP1354 NFYC18THE - 0 25 7 7.5 11 18 60 47 2.5 3.0 6.1 40 100% - - - - - - 70

217
ID Name IT Ag
IT %
MT Ag
MT c.
MT%m
MT%𝒎𝒎�
MT%M
LR Ag
LR c.
LR m
LR 𝒎𝒎�
LR M
Rot1 Ag
Rot1 %
Rot2 Ag
Rot2 %
Rot3 Ag
Rot3 %
Rot4 Ag
Rot4 %
FC %BR
FMP1355 NFYC18THS - 0 25 7 7.5 11 18 60 47 2.5 3.0 6.1 60 100% - - - - - - 70
FMP1356 NFYC18THW - 0 25 7 7.5 11 18 60 47 2.5 3.0 6.1 51 100% - - - - - - 70
FMP1357 NFYC20THE - 0 23 7 8.0 13 21 58 48 2.6 3.2 6.8 37 100% - - - - - - 70
FMP1358 NFYC20THS - 0 23 7 8.0 13 21 58 48 2.6 3.2 6.8 60 100% - - - - - - 70
FMP1359 NFYC20THW - 0 23 7 8.0 13 21 58 48 2.6 3.2 6.8 49 100% - - - - - - 70
FMP1360 NFYC22THE - 0 22 7 8.2 13 22 57 48 1.9 2.9 7.0 37 100% - - - - - - 70
FMP1361 NFYC22THS - 0 22 7 8.2 13 22 57 48 1.9 2.9 7.0 60 100% - - - - - - 70
FMP1362 NFYC22THW - 0 22 7 8.2 13 22 57 48 1.9 2.9 7.0 49 100% - - - - - - 70
FMP1363 NFYC24THS - 0 21 5 10 16 27 46 28 0.1 1.5 7.2 60 100% - - - - - - 72
FMP1364 NFYC24THW - 0 21 5 10 16 27 46 28 0.1 1.5 7.2 49 100% - - - - - - 72
FMP1365 NFYC26THS - 0 20 5 10 18 30 45 32 0.1 1.4 7.6 60 100% - - - - - - 72
FMP1366 NFYC28THS - 0 20 4 12 19 29 40 35 0.1 1.6 10 60 100% - - - - - - 72
FMP1367 WHYC4THE - 0 40 9 4.7 8.0 14 85 8 0.3 1.8 4.2 59 100% - - - - - - 67
FMP1368 WHYC4THW - 0 40 9 4.7 8.0 14 85 8 0.3 1.8 4.2 75 100% - - - - - - 67
FMP1369 WHYC6THE - 0 33 5 6.7 10 14 58 46 0.3 1.4 5.6 61 100% - - - - - - 68
FMP1370 WHYC6THS - 0 33 5 6.7 10 14 58 46 0.3 1.4 5.6 60 100% - - - - - - 68
FMP1371 WHYC6THW - 0 33 5 6.7 10 14 58 46 0.3 1.4 5.6 75 100% - - - - - - 68
FMP1372 WHYC8THE - 0 29 6 6.9 11 17 59 47 0.5 1.5 5.1 59 100% - - - - - - 68
FMP1373 WHYC8THS - 0 29 6 6.9 11 17 59 47 0.5 1.5 5.1 60 100% - - - - - - 68
FMP1374 WHYC8THW - 0 29 6 6.9 11 17 59 47 0.5 1.5 5.1 71 100% - - - - - - 68
FMP1375 WHYC10THE - 0 26 6 7.5 12 20 56 47 0.2 1.2 5.7 54 100% - - - - - - 68
FMP1376 WHYC10THS - 0 26 6 7.5 12 20 56 47 0.2 1.2 5.7 60 100% - - - - - - 68
FMP1377 WHYC10THW - 0 26 6 7.5 12 20 56 47 0.2 1.2 5.7 66 100% - - - - - - 68

218
ID Name IT Ag
IT %
MT Ag
MT c.
MT%m
MT%𝒎𝒎�
MT%M
LR Ag
LR c.
LR m
LR 𝒎𝒎�
LR M
Rot1 Ag
Rot1 %
Rot2 Ag
Rot2 %
Rot3 Ag
Rot3 %
Rot4 Ag
Rot4 %
FC %BR
FMP1378 WHYC12THE - 0 28 8 7.1 12 23 68 46 1.1 2.4 6.0 49 100% - - - - - - 76
FMP1379 WHYC12THS - 0 28 8 7.1 12 23 68 46 1.1 2.4 6.0 60 100% - - - - - - 76
FMP1380 WHYC12THW - 0 28 8 7.1 12 23 68 46 1.1 2.4 6.0 61 100% - - - - - - 76
FMP1381 WHYC14THE - 0 26 7 7.9 13 23 61 47 3.1 3.6 6.9 45 100% - - - - - - 76
FMP1382 WHYC14THS - 0 26 7 7.9 13 23 61 47 3.1 3.6 6.9 60 100% - - - - - - 76
FMP1383 WHYC14THW - 0 26 7 7.9 13 23 61 47 3.1 3.6 6.9 56 100% - - - - - - 76
FMP1384 WHYC16THE - 0 24 8 7.7 13 23 64 46 1.4 2.7 6.4 42 100% - - - - - - 76
FMP1385 WHYC16THS - 0 24 8 7.7 13 23 64 46 1.4 2.7 6.4 60 100% - - - - - - 76
FMP1386 WHYC16THW - 0 24 8 7.7 13 23 64 46 1.4 2.7 6.4 53 100% - - - - - - 76
FMP1387 WHYC18THE - 0 22 7 8.8 14 26 57 48 1.1 2.6 7.6 40 100% - - - - - - 76
FMP1388 WHYC18THS - 0 22 7 8.8 14 26 57 48 1.1 2.6 7.6 60 100% - - - - - - 76
FMP1389 WHYC18THW - 0 22 7 8.8 14 26 57 48 1.1 2.6 7.6 51 100% - - - - - - 76
FMP1390 WHYC20THE - 0 21 6 9.7 15 25 51 49 2.2 3.3 8.8 37 100% - - - - - - 76
FMP1391 WHYC20THS - 0 21 6 9.7 15 25 51 49 2.2 3.3 - 60 100% - - - - - - 76
FMP1392 WHYC20THW - 0 21 6 9.7 15 25 51 49 2.2 3.3 - 49 100% - - - - - - 76
FMP1393 WHYC22THE - 0 20 6 10 16 25 50 49 1.9 3.3 - 37 100% - - - - - - 76
FMP1394 WHYC22THS - 0 20 6 10 16 25 50 49 1.9 3.3 - 60 100% - - - - - - 76
FMP1395 WHYC22THW - 0 20 6 10 16 25 50 49 1.9 3.3 - 49 100% - - - - - - 76
FMP1396 WHYC24THE - 0 19 6 10 16 26 49 49 1.4 3.0 - 37 100% - - - - - - 76
FMP1397 WHYC24THS - 0 19 6 10 16 26 49 49 1.4 3.0 - 60 100% - - - - - - 76
FMP1398 WHYC24THW - 0 19 6 10 16 26 49 49 1.4 3.0 - 49 100% - - - - - - 76
FMP1399 WHYC26THS - 0 20 5 10 18 30 45 32 0.1 1.4 7.6 60 100% - - - - - - 72
FMP1400 WHYC26THW - 0 20 5 10 18 30 45 32 0.1 1.4 7.6 49 100% - - - - - - 72
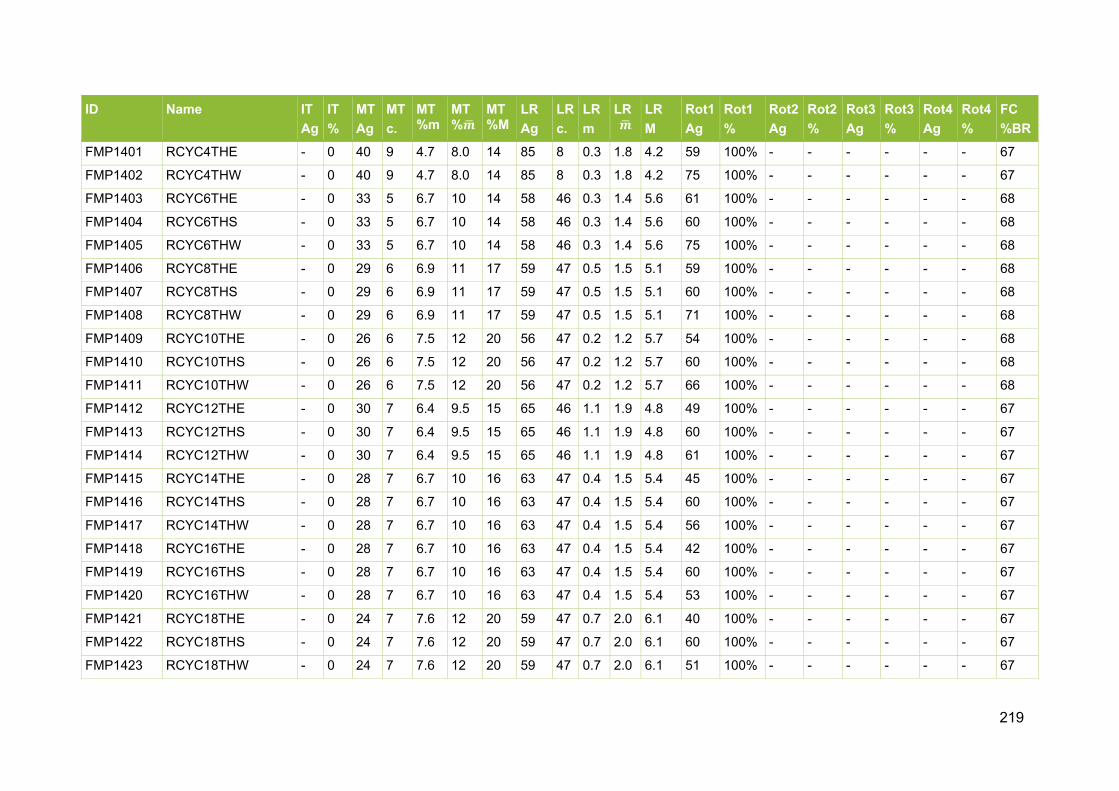
219
ID Name IT Ag
IT %
MT Ag
MT c.
MT%m
MT%𝒎𝒎�
MT%M
LR Ag
LR c.
LR m
LR 𝒎𝒎�
LR M
Rot1 Ag
Rot1 %
Rot2 Ag
Rot2 %
Rot3 Ag
Rot3 %
Rot4 Ag
Rot4 %
FC %BR
FMP1401 RCYC4THE - 0 40 9 4.7 8.0 14 85 8 0.3 1.8 4.2 59 100% - - - - - - 67
FMP1402 RCYC4THW - 0 40 9 4.7 8.0 14 85 8 0.3 1.8 4.2 75 100% - - - - - - 67
FMP1403 RCYC6THE - 0 33 5 6.7 10 14 58 46 0.3 1.4 5.6 61 100% - - - - - - 68
FMP1404 RCYC6THS - 0 33 5 6.7 10 14 58 46 0.3 1.4 5.6 60 100% - - - - - - 68
FMP1405 RCYC6THW - 0 33 5 6.7 10 14 58 46 0.3 1.4 5.6 75 100% - - - - - - 68
FMP1406 RCYC8THE - 0 29 6 6.9 11 17 59 47 0.5 1.5 5.1 59 100% - - - - - - 68
FMP1407 RCYC8THS - 0 29 6 6.9 11 17 59 47 0.5 1.5 5.1 60 100% - - - - - - 68
FMP1408 RCYC8THW - 0 29 6 6.9 11 17 59 47 0.5 1.5 5.1 71 100% - - - - - - 68
FMP1409 RCYC10THE - 0 26 6 7.5 12 20 56 47 0.2 1.2 5.7 54 100% - - - - - - 68
FMP1410 RCYC10THS - 0 26 6 7.5 12 20 56 47 0.2 1.2 5.7 60 100% - - - - - - 68
FMP1411 RCYC10THW - 0 26 6 7.5 12 20 56 47 0.2 1.2 5.7 66 100% - - - - - - 68
FMP1412 RCYC12THE - 0 30 7 6.4 9.5 15 65 46 1.1 1.9 4.8 49 100% - - - - - - 67
FMP1413 RCYC12THS - 0 30 7 6.4 9.5 15 65 46 1.1 1.9 4.8 60 100% - - - - - - 67
FMP1414 RCYC12THW - 0 30 7 6.4 9.5 15 65 46 1.1 1.9 4.8 61 100% - - - - - - 67
FMP1415 RCYC14THE - 0 28 7 6.7 10 16 63 47 0.4 1.5 5.4 45 100% - - - - - - 67
FMP1416 RCYC14THS - 0 28 7 6.7 10 16 63 47 0.4 1.5 5.4 60 100% - - - - - - 67
FMP1417 RCYC14THW - 0 28 7 6.7 10 16 63 47 0.4 1.5 5.4 56 100% - - - - - - 67
FMP1418 RCYC16THE - 0 28 7 6.7 10 16 63 47 0.4 1.5 5.4 42 100% - - - - - - 67
FMP1419 RCYC16THS - 0 28 7 6.7 10 16 63 47 0.4 1.5 5.4 60 100% - - - - - - 67
FMP1420 RCYC16THW - 0 28 7 6.7 10 16 63 47 0.4 1.5 5.4 53 100% - - - - - - 67
FMP1421 RCYC18THE - 0 24 7 7.6 12 20 59 47 0.7 2.0 6.1 40 100% - - - - - - 67
FMP1422 RCYC18THS - 0 24 7 7.6 12 20 59 47 0.7 2.0 6.1 60 100% - - - - - - 67
FMP1423 RCYC18THW - 0 24 7 7.6 12 20 59 47 0.7 2.0 6.1 51 100% - - - - - - 67

220
ID Name IT Ag
IT %
MT Ag
MT c.
MT%m
MT%𝒎𝒎�
MT%M
LR Ag
LR c.
LR m
LR 𝒎𝒎�
LR M
Rot1 Ag
Rot1 %
Rot2 Ag
Rot2 %
Rot3 Ag
Rot3 %
Rot4 Ag
Rot4 %
FC %BR
FMP1424 RCYC20THE - 0 23 7 7.8 12 21 58 48 0.7 2.0 6.2 37 100% - - - - - - 67
FMP1425 RCYC20THS - 0 23 7 7.8 12 21 58 48 0.7 2.0 6.2 60 100% - - - - - - 67
FMP1426 RCYC20THW - 0 23 7 7.8 12 21 58 48 0.7 2.0 6.2 49 100% - - - - - - 67
FMP1427 RCYC22THE - 0 22 6 8.7 13 22 52 49 1.1 2.3 7.5 37 100% - - - - - - 67
FMP1428 RCYC22THS - 0 22 6 8.7 13 22 52 49 1.1 2.3 7.5 60 100% - - - - - - 67
FMP1429 RCYC22THW - 0 22 6 8.7 13 22 52 49 1.1 2.3 7.5 49 100% - - - - - - 67
FMP1430 RCYC24THE - 0 21 6 9.0 14 23 51 49 1.0 2.3 7.6 37 100% - - - - - - 67
FMP1431 RCYC24THS - 0 21 6 9.0 14 23 51 49 1.0 2.3 7.6 60 100% - - - - - - 67
FMP1432 RCYC24THW - 0 21 6 9.0 14 23 51 49 1.0 2.3 7.6 49 100% - - - - - - 67
FMP1433 OKYC2THESW 35 12 40 14 4.7 6.5 11 110 22 0.3 1.9 4.4 140 50% 160 50% - - - - 73
FMP1434 OKYC4THESW 35 12 40 14 4.7 6.5 11 110 22 0.3 1.9 4.4 120 33% 140 34% 160 33% - - 73
FMP1435 OKYC6THESW 25 9 30 14 5.5 8.2 16 100 39 0.4 2.1 5.3 100 33% 120 34% 140 33% - - 73
FMP1436 OKYC8THESW 20 6 25 14 6.2 10 20 95 40 2.4 3.6 6.1 100 50% 120 50% - - - - 73
FMP1437 AHYC2THESW 20 12 25 5 8.0 11 18 50 11 0.5 2.3 6.0 65 50% 80 50% - - - - 68
FMP1438 AHYC4THESW 20 12 25 5 8.0 11 18 50 11 0.5 2.3 6.0 65 50% 80 50% - - - - 68
FMP1439 AHYC6THESW - 0 20 5 9.4 15 25 45 19 0.3 2.0 7.6 50 33% 65 34% 80 33% - - 68
FMP1440 AHYC8THESW 15 28 20 5 10 15 24 45 28 0.2 1.6 7.3 50 33% 65 34% 80 33% - - 68
FMP1441 AHYC10THESW 15 33 20 5 10 15 23 45 37 0.2 1.4 6.8 50 33% 65 34% 71 33% - - 68
FMP1442 AHYC12THESW 10 24 15 5 12 20 34 40 48 0.2 1.5 10 50 50% 65 50% - - - - 68
FMP1443 BEYC2THW 35 13 40 14 4.4 7.4 15 110 37 2.7 3.1 4.0 120 50% 140 50% - - - - 71
FMP1444 BEYC4THESW 35 13 40 14 4.4 7.4 15 110 37 2.7 3.1 4.0 120 50% 140 50% - - - - 71
FMP1445 BEYC6THESW 30 11 35 12 5.1 8.4 15 95 40 2.7 3.1 4.7 95 33% 120 34% 140 33% - - 71
FMP1446 BEYC8THESW 25 6.6 30 11 5.7 9.5 17 85 42 2.8 3.3 5.4 95 33% 120 34% 140 33% - - 71

221
ID Name IT Ag
IT %
MT Ag
MT c.
MT%m
MT%𝒎𝒎�
MT%M
LR Ag
LR c.
LR m
LR 𝒎𝒎�
LR M
Rot1 Ag
Rot1 %
Rot2 Ag
Rot2 %
Rot3 Ag
Rot3 %
Rot4 Ag
Rot4 %
FC %BR
FMP1447 BEYC10THESW 25 17 30 10 6.2 10 17 80 43 3.1 3.7 5.8 95 50% 115 50% - - - - 71
FMP1448 BEYC12THW - 0 23 8 7.2 12 21 63 25 0.1 1.6 6.1 95 50% 115 50% - - - - 67
FMP1449 BIYC2THESW 20 12 25 5 8.0 11 18 50 11 0.5 2.3 6.0 65 50% 75 50% - - - - 68
FMP1450 BIYC4THESW 20 12 25 5 8.0 11 18 50 11 0.5 2.3 6.0 65 50% 75 50% - - - - 68
FMP1451 BIYC6THESW - 0 20 5 9.4 15 25 45 19 0.3 2.0 7.6 60 50% 75 50% - - - - 68
FMP1452 BIYC8THESW 15 28 20 5 10 15 24 45 28 0.2 1.6 7.3 60 50% 70 50% - - - - 68
FMP1453 BIYC10THESW 15 33 20 5 10 15 23 45 37 0.2 1.4 6.8 50 50% 65 50% - - - - 68
FMP1454 BIYC12THESW 10 24 15 5 12 20 34 40 48 0.2 1.5 10 50 50% 65 50% - - - - 68
FMP1455 SYYC2THESW 20 12 25 5 8.0 11 18 50 11 0.5 2.3 6.0 65 50% 75 50% - - - - 68
FMP1456 SYYC4THESW 20 12 25 5 8.0 11 18 50 11 0.5 2.3 6.0 65 50% 75 50% - - - - 68
FMP1457 SYYC6THESW - 0 20 5 9.4 15 25 45 19 0.3 2.0 7.6 60 50% 75 50% - - - - 68
FMP1458 SYYC8THESW 15 28 20 5 10 15 24 45 28 0.2 1.6 7.3 60 50% 70 50% - - - - 68
FMP1459 SYYC10THESW 15 33 20 5 10 15 23 45 37 0.2 1.4 6.8 50 50% 65 50% - - - - 68
FMP1460 SYYC12THESW 10 24 15 5 12 20 34 40 48 0.2 1.5 10 50 50% 65 50% - - - - 68
FMP1461 POYC2THESW 20 12 25 5 7.8 11 17 50 11 0.5 2.2 5.9 50 50% 60 50% - - - - 67
FMP1462 POYC4THESW 20 12 25 5 7.8 11 17 50 11 0.5 2.2 5.9 40 50% 50 50% - - - - 67
FMP1463 POYC6THESW - 0 20 5 9.2 15 25 45 19 0.3 1.9 7.4 40 50% 50 50% - - - - 67
FMP1464 POYC8THESW 15 27 20 5 9.7 15 23 45 28 0.2 1.6 7.1 35 50% 45 50% - - - - 67
FMP1465 POYC10THESW 15 33 20 5 10 15 23 45 37 0.2 1.4 6.7 35 50% 45 50% - - - - 67
FMP1466 POYC12THESW 10 24 15 5 12 20 33 40 48 0.2 1.5 10 35 50% 45 50% - - - - 67
FMP1467 POYC14THE - 0 21 7 8.4 14 23 56 28 0.1 1.8 7.3 35 50% 45 50% - - - - 67
FMP1468 NOYC2THES 20 12 25 5 8.0 11 18 50 11 0.5 2.3 6.0 50 50% 60 50% - - - - 68
FMP1469 NOYC4THES 20 12 25 5 8.0 11 18 50 11 0.5 2.3 6.0 50 50% 60 50% - - - - 68
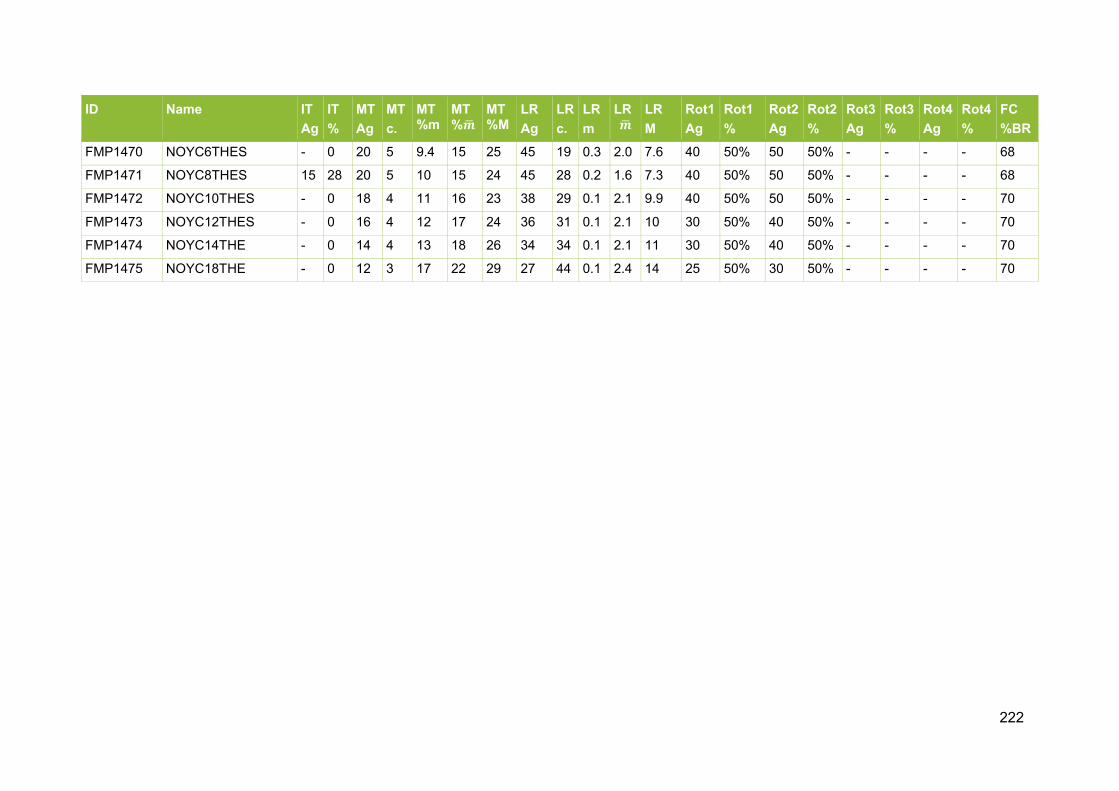
222
ID Name IT Ag
IT %
MT Ag
MT c.
MT%m
MT%𝒎𝒎�
MT%M
LR Ag
LR c.
LR m
LR 𝒎𝒎�
LR M
Rot1 Ag
Rot1 %
Rot2 Ag
Rot2 %
Rot3 Ag
Rot3 %
Rot4 Ag
Rot4 %
FC %BR
FMP1470 NOYC6THES - 0 20 5 9.4 15 25 45 19 0.3 2.0 7.6 40 50% 50 50% - - - - 68
FMP1471 NOYC8THES 15 28 20 5 10 15 24 45 28 0.2 1.6 7.3 40 50% 50 50% - - - - 68
FMP1472 NOYC10THES - 0 18 4 11 16 23 38 29 0.1 2.1 9.9 40 50% 50 50% - - - - 70
FMP1473 NOYC12THES - 0 16 4 12 17 24 36 31 0.1 2.1 10 30 50% 40 50% - - - - 70
FMP1474 NOYC14THE - 0 14 4 13 18 26 34 34 0.1 2.1 11 30 50% 40 50% - - - - 70
FMP1475 NOYC18THE - 0 12 3 17 22 29 27 44 0.1 2.4 14 25 50% 30 50% - - - - 70
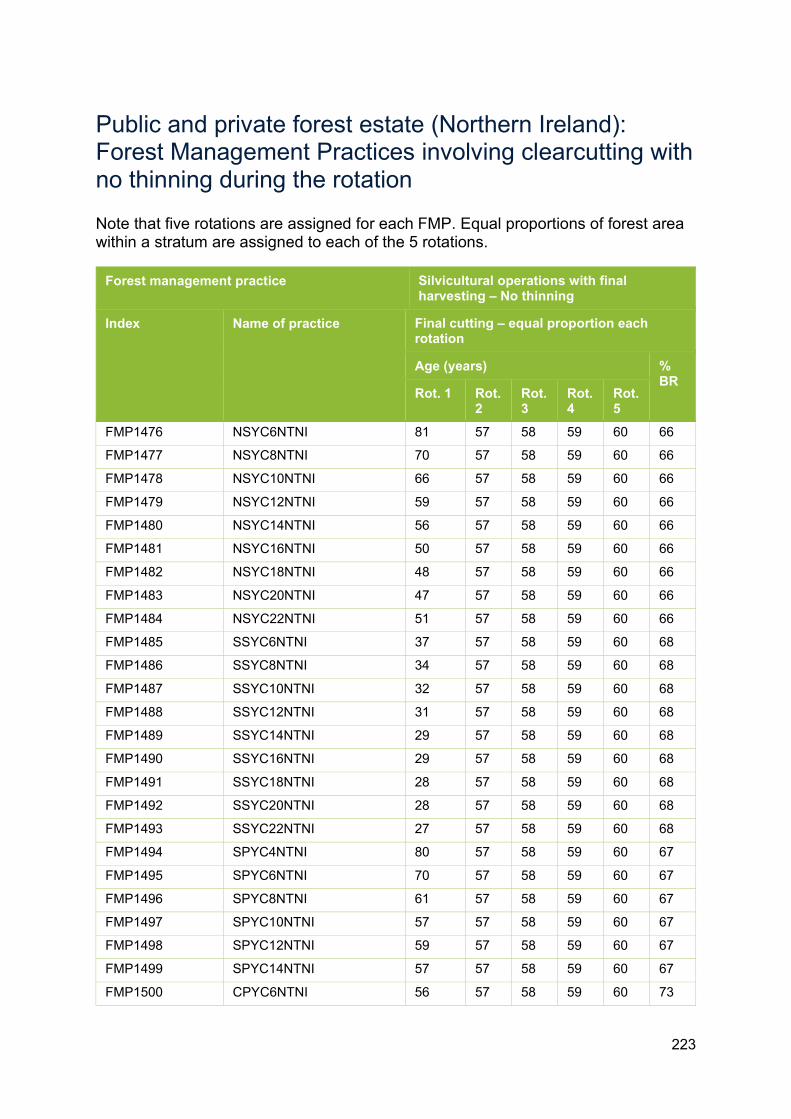
223
Public and private forest estate (Northern Ireland): Forest Management Practices involving clearcutting with no thinning during the rotation
Note that five rotations are assigned for each FMP. Equal proportions of forest area within a stratum are assigned to each of the 5 rotations.
Forest management practice Silvicultural operations with final harvesting – No thinning
Index Name of practice Final cutting – equal proportion each rotation
Age (years) % BR
Rot. 1 Rot. 2
Rot. 3
Rot. 4
Rot. 5
FMP1476 NSYC6NTNI 81 57 58 59 60 66
FMP1477 NSYC8NTNI 70 57 58 59 60 66
FMP1478 NSYC10NTNI 66 57 58 59 60 66
FMP1479 NSYC12NTNI 59 57 58 59 60 66
FMP1480 NSYC14NTNI 56 57 58 59 60 66
FMP1481 NSYC16NTNI 50 57 58 59 60 66
FMP1482 NSYC18NTNI 48 57 58 59 60 66
FMP1483 NSYC20NTNI 47 57 58 59 60 66
FMP1484 NSYC22NTNI 51 57 58 59 60 66
FMP1485 SSYC6NTNI 37 57 58 59 60 68
FMP1486 SSYC8NTNI 34 57 58 59 60 68
FMP1487 SSYC10NTNI 32 57 58 59 60 68
FMP1488 SSYC12NTNI 31 57 58 59 60 68
FMP1489 SSYC14NTNI 29 57 58 59 60 68
FMP1490 SSYC16NTNI 29 57 58 59 60 68
FMP1491 SSYC18NTNI 28 57 58 59 60 68
FMP1492 SSYC20NTNI 28 57 58 59 60 68
FMP1493 SSYC22NTNI 27 57 58 59 60 68
FMP1494 SPYC4NTNI 80 57 58 59 60 67
FMP1495 SPYC6NTNI 70 57 58 59 60 67
FMP1496 SPYC8NTNI 61 57 58 59 60 67
FMP1497 SPYC10NTNI 57 57 58 59 60 67
FMP1498 SPYC12NTNI 59 57 58 59 60 67
FMP1499 SPYC14NTNI 57 57 58 59 60 67
FMP1500 CPYC6NTNI 56 57 58 59 60 73

224
Forest management practice Silvicultural operations with final harvesting – No thinning
Index Name of practice Final cutting – equal proportion each rotation
Age (years) % BR
Rot. 1 Rot. 2
Rot. 3
Rot. 4
Rot. 5
FMP1501 CPYC8NTNI 50 57 58 59 60 73
FMP1502 CPYC10NTNI 47 57 58 59 60 73
FMP1503 CPYC12NTNI 44 57 58 59 60 73
FMP1504 CPYC14NTNI 37 57 58 59 60 73
FMP1505 CPYC16NTNI 36 57 58 59 60 73
FMP1506 CPYC18NTNI 35 57 58 59 60 73
FMP1507 LPYC4NTNI 79 57 58 59 60 67
FMP1508 LPYC6NTNI 59 57 58 59 60 67
FMP1509 LPYC8NTNI 48 57 58 59 60 67
FMP1510 LPYC10NTNI 40 57 58 59 60 67
FMP1511 LPYC12NTNI 37 57 58 59 60 67
FMP1512 LPYC14NTNI 35 57 58 59 60 67
FMP1513 ELYC6NTNI 46 57 58 59 60 80
FMP1514 ELYC8NTNI 42 57 58 59 60 80
FMP1515 ELYC10NTNI 40 57 58 59 60 80
FMP1516 ELYC12NTNI 38 57 58 59 60 80
FMP1517 JLYC4NTNI 41 57 58 59 60 76
FMP1518 JLYC6NTNI 32 57 58 59 60 76
FMP1519 JLYC8NTNI 29 57 58 59 60 76
FMP1520 JLYC10NTNI 27 57 58 59 60 76
FMP1521 JLYC12NTNI 25 57 58 59 60 76
FMP1522 JLYC14NTNI 24 57 58 59 60 76
FMP1523 DFYC12NTNI 43 57 58 59 60 71
FMP1524 DFYC14NTNI 41 57 58 59 60 71
FMP1525 DFYC16NTNI 34 57 58 59 60 71
FMP1526 DFYC18NTNI 33 57 58 59 60 71
FMP1527 DFYC20NTNI 32 57 58 59 60 71
FMP1528 DFYC22NTNI 32 57 58 59 60 71
FMP1529 GFYC14NTNI 45 57 58 59 60 72
FMP1530 NFYC10NTNI 64 57 58 59 60 70
FMP1531 NFYC12NTNI 66 57 58 59 60 70
FMP1532 NFYC14NTNI 59 57 58 59 60 70
FMP1533 NFYC16NTNI 57 57 58 59 60 70

225
Forest management practice Silvicultural operations with final harvesting – No thinning
Index Name of practice Final cutting – equal proportion each rotation
Age (years) % BR
Rot. 1 Rot. 2
Rot. 3
Rot. 4
Rot. 5
FMP1534 NFYC18NTNI 60 57 58 59 60 70
FMP1535 NFYC20NTNI 58 57 58 59 60 70
FMP1536 WHYC12NTNI 73 57 58 59 60 76
FMP1537 WHYC14NTNI 61 57 58 59 60 76
FMP1538 WHYC16NTNI 54 57 58 59 60 76
FMP1539 WHYC18NTNI 52 57 58 59 60 76
FMP1540 RCYC12NTNI 60 57 58 59 60 67
FMP1541 RCYC14NTNI 58 57 58 59 60 67
FMP1542 RCYC16NTNI 56 57 58 59 60 67
FMP1543 RCYC18NTNI 54 57 58 59 60 67
FMP1544 OKYC4NTNI 90 - - - - 73
FMP1545 OKYC6NTNI 80 - - - - 73
FMP1546 OKYC8NTNI 70 - - - - 73
FMP1547 AHYC4NTNI 50 - - - - 68
FMP1548 AHYC6NTNI 45 - - - - 68
FMP1549 AHYC8NTNI 45 - - - - 68
FMP1550 AHYC10NTNI 40 - - - - 68
FMP1551 AHYC12NTNI 40 - - - - 68
FMP1552 BEYC4NTNI 105 - - - - 71
FMP1553 BEYC6NTNI 95 - - - - 71
FMP1554 BEYC8NTNI 85 - - - - 71
FMP1555 BEYC10NTNI 80 - - - - 71
FMP1556 BIYC4NTNI 50 - - - - 68
FMP1557 BIYC6NTNI 45 - - - - 68
FMP1558 BIYC8NTNI 45 - - - - 68
FMP1559 BIYC10NTNI 40 - - - - 68
FMP1560 SYYC4NTNI 50 - - - - 68
FMP1561 SYYC6NTNI 45 - - - - 68
FMP1562 SYYC8NTNI 45 - - - - 68
FMP1563 SYYC10NTNI 40 - - - - 68
FMP1564 SYYC12NTNI 40 - - - - 68
FMP1565 POYC4NTNI 39 - - - - 67
FMP1566 POYC6NTNI 36 - - - - 67

226
Forest management practice Silvicultural operations with final harvesting – No thinning
Index Name of practice Final cutting – equal proportion each rotation
Age (years) % BR
Rot. 1 Rot. 2
Rot. 3
Rot. 4
Rot. 5
FMP1567 POYC8NTNI 39 - - - - 67
FMP1568 POYC10NTNI 37 - - - - 67
FMP1569 POYC14NTNI 39 - - - - 67
FMP1570 NOYC10NTNI 43 - - - - 70

227
Public and private forest estate (Northern Ireland): Forest Management Practices involving clearcutting with thinning during the rotation
Note that up to five rotations are assigned for each FMP. Equal proportions of forest area within a stratum are assigned to each of the (up to 5) rotations.
Forest management practice
Silvicultural operations with final harvesting – Thinning
Index Name of
practice
Initial thinning Main thinnings Late-rotation thinnings Final cutting - Equal proportion each rotation
Age (years)
% biomass removals
Age of first
(years)
Number of
(5 year cycles)
% biomass removals Age of first
(years)
Number of
(5 year cycles)
% biomass removals Age (years) % biomass removals Min. Mea
n Max. Min. Mea
n Max. Rotation
1 Rotation 2
Rotation 3
Rotation 4
Rotation 5
ID Name IT Ag
IT %
MT Ag
MT c.
MT%m
MT%𝑚𝑚�
MT%M
LR Ag
LR c.
LR m
LR 𝑚𝑚�
LR M
FC Rot1
FC Rot2
FC Rot3
FC Rot4
FC Rot5
FC %

228
ID Name IT Ag
IT %
MT Ag
MT c.
MT %m
MT %𝒎𝒎�
MT %M
LR Ag
LR c.
LR %m
LR %𝒎𝒎�
LR %M
FC Rot1
FC Rot2
FC Rot3
FC Rot4
FC Rot5
FC %
FMP1571 NSYC6THNI - 0 35 7 6.1 10 16 70 34 0.1 1.1 5.2 86 57 58 59 60 66
FMP1572 NSYC8THNI - 0 31 8 5.9 10 17 71 45 0.4 1.4 4.5 75 57 58 59 60 66
FMP1573 NSYC10THNI - 0 28 8 6.3 11 20 68 46 0.3 1.4 5.1 71 57 58 59 60 66
FMP1574 NSYC12THNI - 0 26 8 6.6 12 22 66 46 0.8 1.8 5.6 69 57 58 59 60 66
FMP1575 NSYC14THNI - 0 24 9 6.5 12 24 69 45 0.5 1.6 5.0 61 57 58 59 60 66
FMP1576 NSYC16THNI - 0 23 8 7.1 13 25 63 47 0.2 1.4 6.1 60 57 58 59 60 66
FMP1577 NSYC18THNI - 0 22 8 7.3 13 26 62 47 0.2 1.4 6.3 58 57 58 59 60 66
FMP1578 NSYC20THNI - 0 21 8 7.5 14 28 61 47 0.1 1.3 6.6 57 57 58 59 60 66
FMP1579 NSYC22THNI - 0 20 8 7.8 15 30 60 44 0.1 1.2 6.8 56 57 58 59 60 66
FMP1580 SSYC6THNI - 0 33 5 6.7 10 14 58 46 0.3 1.4 5.6 60 57 58 59 60 68
FMP1581 SSYC8THNI - 0 29 6 6.9 11 17 59 47 0.5 1.5 5.1 55 57 58 59 60 68
FMP1582 SSYC10THNI - 0 26 6 7.5 12 20 56 47 0.2 1.2 5.7 52 57 58 59 60 68
FMP1583 SSYC12THNI - 0 24 6 8.0 13 22 54 44 0.1 1.2 6.2 50 57 58 59 60 68
FMP1584 SSYC14THNI - 0 22 6 8.5 15 25 52 38 0.1 1.3 6.7 48 57 58 59 60 68
FMP1585 SSYC16THNI - 0 21 6 8.7 15 26 51 41 0.1 1.3 6.8 47 57 58 59 60 68
FMP1586 SSYC18THNI - 0 20 5 10 17 26 45 42 0.1 1.5 8.8 46 57 58 59 60 68
FMP1587 SSYC20THNI - 0 19 6 9.2 16 27 49 40 0.1 1.3 7.1 40 57 58 59 60 68
FMP1588 SSYC22THNI - 0 18 6 9.5 16 28 48 39 0.1 1.4 7.3 39 57 58 59 60 68
FMP1589 SPYC4THNI - 0 40 9 4.7 8.0 14 85 8 0.3 1.8 4.2 85 57 58 59 60 67
FMP1590 SPYC6THNI - 0 33 10 5.1 8.7 16 83 12 0.2 1.4 3.9 75 57 58 59 60 67
FMP1591 SPYC8THNI - 0 29 9 5.9 10 18 74 16 0.1 1.5 4.9 66 57 58 59 60 67
FMP1592 SPYC10THNI - 0 25 8 6.9 12 21 65 20 0.1 1.8 6.1 62 57 58 59 60 67
FMP1593 SPYC12THNI - 0 23 8 7.2 12 21 63 25 0.1 1.6 6.1 59 57 58 59 60 67
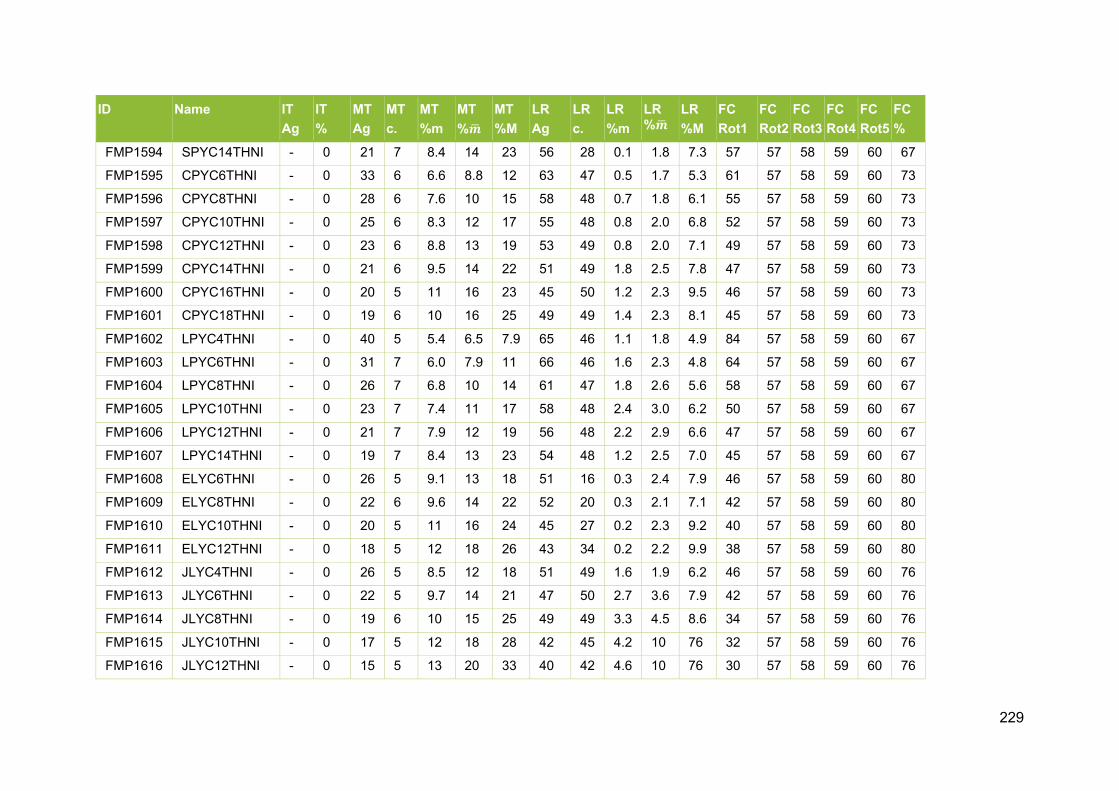
229
ID Name IT Ag
IT %
MT Ag
MT c.
MT %m
MT %𝒎𝒎�
MT %M
LR Ag
LR c.
LR %m
LR %𝒎𝒎�
LR %M
FC Rot1
FC Rot2
FC Rot3
FC Rot4
FC Rot5
FC %
FMP1594 SPYC14THNI - 0 21 7 8.4 14 23 56 28 0.1 1.8 7.3 57 57 58 59 60 67
FMP1595 CPYC6THNI - 0 33 6 6.6 8.8 12 63 47 0.5 1.7 5.3 61 57 58 59 60 73
FMP1596 CPYC8THNI - 0 28 6 7.6 10 15 58 48 0.7 1.8 6.1 55 57 58 59 60 73
FMP1597 CPYC10THNI - 0 25 6 8.3 12 17 55 48 0.8 2.0 6.8 52 57 58 59 60 73
FMP1598 CPYC12THNI - 0 23 6 8.8 13 19 53 49 0.8 2.0 7.1 49 57 58 59 60 73
FMP1599 CPYC14THNI - 0 21 6 9.5 14 22 51 49 1.8 2.5 7.8 47 57 58 59 60 73
FMP1600 CPYC16THNI - 0 20 5 11 16 23 45 50 1.2 2.3 9.5 46 57 58 59 60 73
FMP1601 CPYC18THNI - 0 19 6 10 16 25 49 49 1.4 2.3 8.1 45 57 58 59 60 73
FMP1602 LPYC4THNI - 0 40 5 5.4 6.5 7.9 65 46 1.1 1.8 4.9 84 57 58 59 60 67
FMP1603 LPYC6THNI - 0 31 7 6.0 7.9 11 66 46 1.6 2.3 4.8 64 57 58 59 60 67
FMP1604 LPYC8THNI - 0 26 7 6.8 10 14 61 47 1.8 2.6 5.6 58 57 58 59 60 67
FMP1605 LPYC10THNI - 0 23 7 7.4 11 17 58 48 2.4 3.0 6.2 50 57 58 59 60 67
FMP1606 LPYC12THNI - 0 21 7 7.9 12 19 56 48 2.2 2.9 6.6 47 57 58 59 60 67
FMP1607 LPYC14THNI - 0 19 7 8.4 13 23 54 48 1.2 2.5 7.0 45 57 58 59 60 67
FMP1608 ELYC6THNI - 0 26 5 9.1 13 18 51 16 0.3 2.4 7.9 46 57 58 59 60 80
FMP1609 ELYC8THNI - 0 22 6 9.6 14 22 52 20 0.3 2.1 7.1 42 57 58 59 60 80
FMP1610 ELYC10THNI - 0 20 5 11 16 24 45 27 0.2 2.3 9.2 40 57 58 59 60 80
FMP1611 ELYC12THNI - 0 18 5 12 18 26 43 34 0.2 2.2 9.9 38 57 58 59 60 80
FMP1612 JLYC4THNI - 0 26 5 8.5 12 18 51 49 1.6 1.9 6.2 46 57 58 59 60 76
FMP1613 JLYC6THNI - 0 22 5 9.7 14 21 47 50 2.7 3.6 7.9 42 57 58 59 60 76
FMP1614 JLYC8THNI - 0 19 6 10 15 25 49 49 3.3 4.5 8.6 34 57 58 59 60 76
FMP1615 JLYC10THNI - 0 17 5 12 18 28 42 45 4.2 10 76 32 57 58 59 60 76
FMP1616 JLYC12THNI - 0 15 5 13 20 33 40 42 4.6 10 76 30 57 58 59 60 76

230
ID Name IT Ag
IT %
MT Ag
MT c.
MT %m
MT %𝒎𝒎�
MT %M
LR Ag
LR c.
LR %m
LR %𝒎𝒎�
LR %M
FC Rot1
FC Rot2
FC Rot3
FC Rot4
FC Rot5
FC %
FMP1617 JLYC14THNI - 0 14 6 12 20 34 44 46 4.7 10 76 29 57 58 59 60 76
FMP1618 DFYC12THNI - 0 23 7 7.9 12 21 58 48 0.4 1.6 6.0 48 57 58 59 60 71
FMP1619 DFYC14THNI - 0 21 6 9.1 15 24 51 49 0.6 1.9 8.0 46 57 58 59 60 71
FMP1620 DFYC16THNI - 0 19 7 9.0 15 28 54 48 0.3 1.6 6.9 44 57 58 59 60 71
FMP1621 DFYC18THNI - 0 18 7 9.3 16 30 53 49 0.4 1.7 7.0 43 57 58 59 60 71
FMP1622 DFYC20THNI - 0 17 7 9.6 17 32 52 49 0.3 1.6 7.2 42 57 58 59 60 71
FMP1623 DFYC22THNI - 0 17 6 10 18 30 47 50 0.5 1.9 8.8 42 57 58 59 60 71
FMP1624 GFYC14THNI - 0 25 4 10 15 21 45 21 0.1 1.9 8.5 45 57 58 59 60 72
FMP1625 NFYC10THNI - 0 34 7 5.9 8.0 12 69 45 0.8 1.8 4.7 64 57 58 59 60 70
FMP1626 NFYC12THNI - 0 31 7 6.3 8.9 13 66 46 1.8 2.4 4.8 66 57 58 59 60 70
FMP1627 NFYC14THNI - 0 29 7 6.7 10 15 64 46 1.9 2.5 5.4 59 57 58 59 60 70
FMP1628 NFYC16THNI - 0 27 7 7.1 10 16 62 47 1.8 2.6 5.7 57 57 58 59 60 70
FMP1629 NFYC18THNI - 0 25 7 7.5 11 18 60 47 2.5 3.0 6.1 60 57 58 59 60 70
FMP1630 NFYC20THNI - 0 23 7 8.0 13 21 58 48 2.6 3.2 6.8 58 57 58 59 60 70
FMP1631 WHYC12THNI - 0 28 8 7.1 12 23 68 46 1.1 2.4 6.0 73 57 58 59 60 76
FMP1632 WHYC14THNI - 0 26 7 7.9 13 23 61 47 3.1 3.6 6.9 61 57 58 59 60 76
FMP1633 WHYC16THNI - 0 24 8 7.7 13 23 64 46 1.4 2.7 6.4 54 57 58 59 60 76
FMP1634 WHYC18THNI - 0 22 7 8.8 14 26 57 48 1.1 2.6 7.6 52 57 58 59 60 76
FMP1635 RCYC12THNI - 0 30 7 6.4 9.5 15 65 46 1.1 1.9 4.8 60 57 58 59 60 67
FMP1636 RCYC14THNI - 0 28 7 6.7 10 16 63 47 0.4 1.5 5.4 58 57 58 59 60 67
FMP1637 RCYC16THNI - 0 26 7 7.1 11 18 61 47 0.6 1.8 5.9 56 57 58 59 60 67
FMP1638 RCYC18THNI - 0 24 7 7.6 12 20 59 47 0.7 2.0 6.1 54 57 58 59 60 67
FMP1639 OKYC4THNI 35 12 40 14 4.7 6.5 11 110 22 0.3 1.9 4.4 50 - - - - 73

231
ID Name IT Ag
IT %
MT Ag
MT c.
MT %m
MT %𝒎𝒎�
MT %M
LR Ag
LR c.
LR %m
LR %𝒎𝒎�
LR %M
FC Rot1
FC Rot2
FC Rot3
FC Rot4
FC Rot5
FC %
FMP1640 OKYC6THNI 25 9 30 14 5.5 8.2 16 100 39 0.4 2.1 5.3 80 - - - - 73
FMP1641 OKYC8THNI 20 6 25 14 6.2 10 20 95 40 2.4 3.6 6.1 70 - - - - 73
FMP1642 AHYC4THNI 20 12 25 5 8.0 11 18 50 11 0.5 2.3 6.0 50 - - - - 68
FMP1643 AHYC6THNI - 0 20 5 9.4 15 25 45 19 0.3 2.0 7.6 45 - - - - 68
FMP1644 AHYC8THNI 15 28 20 5 10 15 24 45 28 0.2 1.6 7.3 45 - - - - 68
FMP1645 AHYC10THNI 15 33 20 5 10 15 23 45 37 0.2 1.4 6.8 40 - - - - 68
FMP1646 AHYC12THNI 10 24 15 5 12 20 34 40 48 0.2 1.5 10 40 - - - - 68
FMP1647 BEYC4THNI 35 13 40 14 4.4 7.4 15 110 37 2.7 3.1 4.0 105 - - - - 71
FMP1648 BEYC6THNI 30 11 35 12 5.1 8.4 15 95 40 2.7 3.1 4.7 95 - - - - 71
FMP1649 BEYC8THNI 25 6.6 30 11 5.7 9.5 17 85 42 2.8 3.3 5.4 85 - - - - 71
FMP1650 BEYC10THNI 25 17 30 10 6.2 10 17 80 43 3.1 3.7 5.8 80 - - - - 71
FMP1651 BIYC4THNI 20 12 25 5 8.0 11 18 50 11 0.5 2.3 6.0 50 - - - - 68
FMP1652 BIYC6THNI - 0 20 5 9.4 15 25 45 19 0.3 2.0 7.6 45 - - - - 68
FMP1653 BIYC8THNI 15 28 20 5 10 15 24 45 28 0.2 1.6 7.3 45 - - - - 68
FMP1654 BIYC10THNI 15 33 20 5 10 15 23 45 37 0.2 1.4 6.8 40 - - - - 68
FMP1655 SYYC4THNI 20 12 25 5 8.0 11 18 50 11 0.5 2.3 6.0 50 - - - - 68
FMP1656 SYYC6THNI - 0 20 5 9.4 15 25 45 19 0.3 2.0 7.6 45 - - - - 68
FMP1657 SYYC8THNI 15 28 20 5 10 15 24 45 28 0.2 1.6 7.3 45 - - - - 68
FMP1658 SYYC10THNI 15 33 20 5 10 15 23 45 37 0.2 1.4 6.8 40 - - - - 68
FMP1659 SYYC14THNI - 0 21 7 8.4 14 23 56 28 0.1 1.8 7.3 40 - - - - 67
FMP1660 POYC4THNI 20 12 25 5 7.8 11 17 50 11 0.5 2.2 5.9 94 - - - - 67
FMP1661 POYC6THNI - 0 20 5 9.2 15 25 45 19 0.3 1.9 7.4 74 - - - - 67
FMP1662 POYC8THNI 15 27 20 5 9.7 15 23 45 28 0.2 1.6 7.1 68 - - - - 67
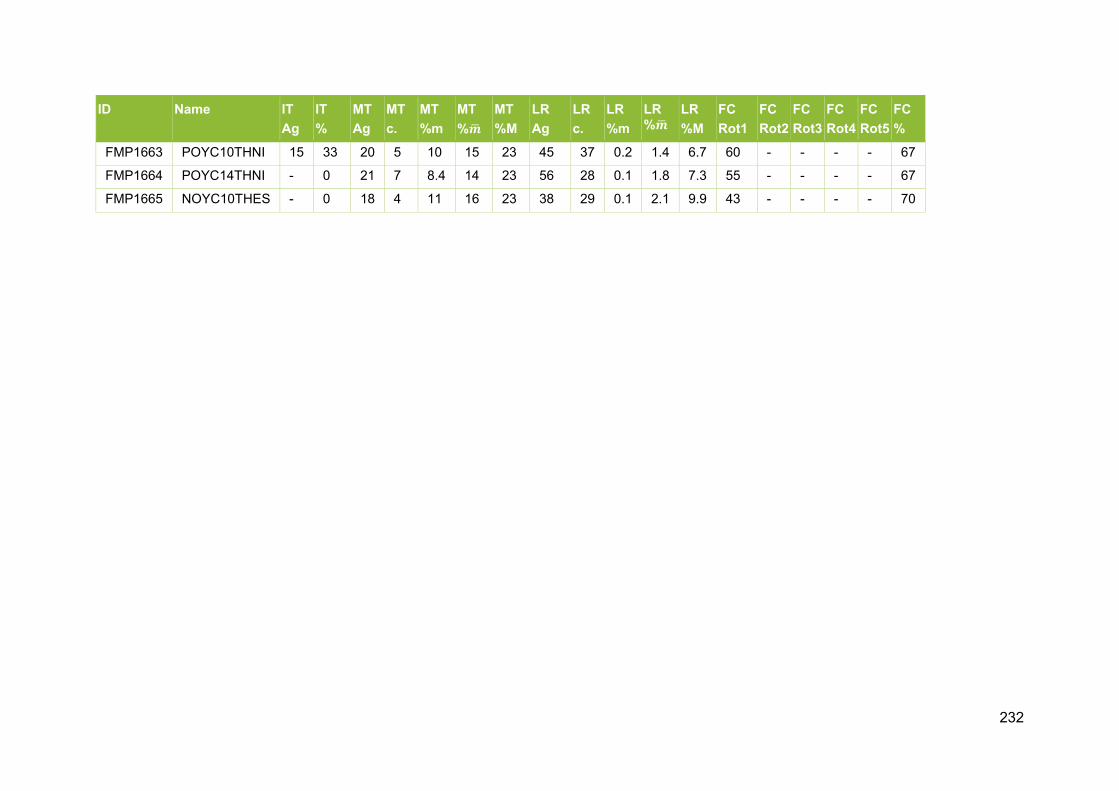
232
ID Name IT Ag
IT %
MT Ag
MT c.
MT %m
MT %𝒎𝒎�
MT %M
LR Ag
LR c.
LR %m
LR %𝒎𝒎�
LR %M
FC Rot1
FC Rot2
FC Rot3
FC Rot4
FC Rot5
FC %
FMP1663 POYC10THNI 15 33 20 5 10 15 23 45 37 0.2 1.4 6.7 60 - - - - 67
FMP1664 POYC14THNI - 0 21 7 8.4 14 23 56 28 0.1 1.8 7.3 55 - - - - 67
FMP1665 NOYC10THES - 0 18 4 11 16 23 38 29 0.1 2.1 9.9 43 - - - - 70
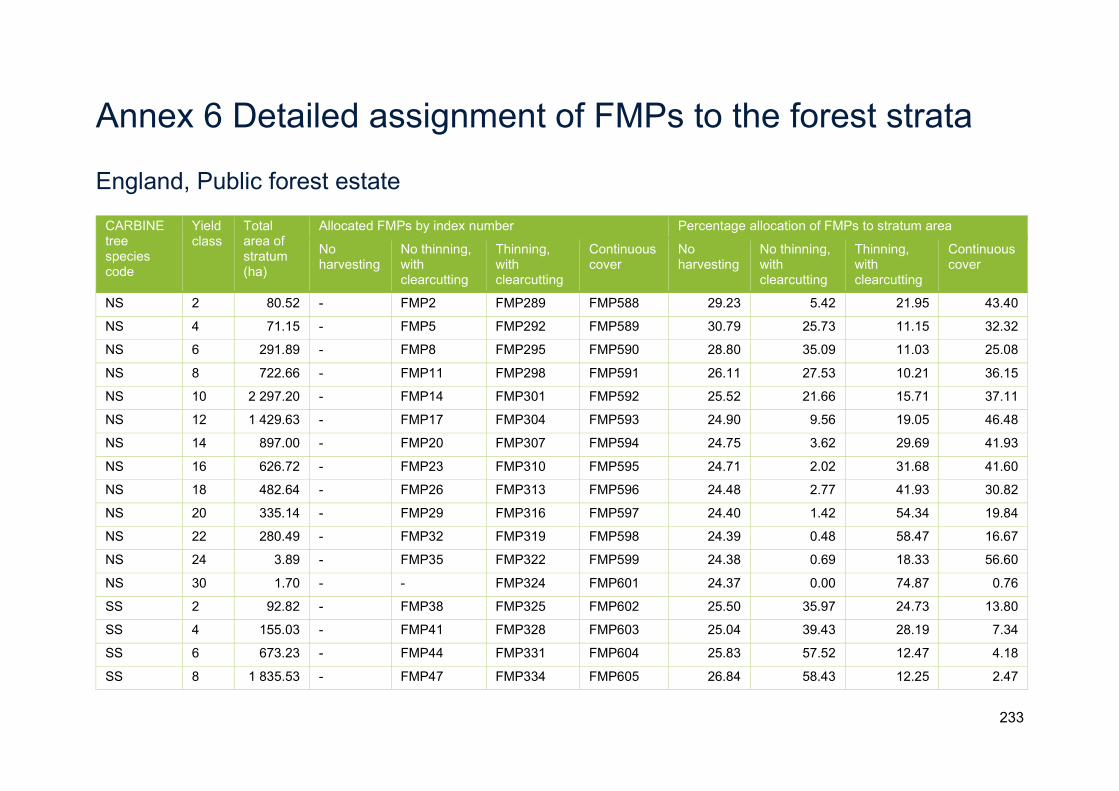
233
Annex 6 Detailed assignment of FMPs to the forest strata
England, Public forest estate
CARBINE tree species code
Yield class
Total area of stratum (ha)
Allocated FMPs by index number Percentage allocation of FMPs to stratum area
No harvesting
No thinning, with clearcutting
Thinning, with clearcutting
Continuous cover
No harvesting
No thinning, with clearcutting
Thinning, with clearcutting
Continuous cover
NS 2 80.52 - FMP2 FMP289 FMP588 29.23 5.42 21.95 43.40
NS 4 71.15 - FMP5 FMP292 FMP589 30.79 25.73 11.15 32.32
NS 6 291.89 - FMP8 FMP295 FMP590 28.80 35.09 11.03 25.08
NS 8 722.66 - FMP11 FMP298 FMP591 26.11 27.53 10.21 36.15
NS 10 2 297.20 - FMP14 FMP301 FMP592 25.52 21.66 15.71 37.11
NS 12 1 429.63 - FMP17 FMP304 FMP593 24.90 9.56 19.05 46.48
NS 14 897.00 - FMP20 FMP307 FMP594 24.75 3.62 29.69 41.93
NS 16 626.72 - FMP23 FMP310 FMP595 24.71 2.02 31.68 41.60
NS 18 482.64 - FMP26 FMP313 FMP596 24.48 2.77 41.93 30.82
NS 20 335.14 - FMP29 FMP316 FMP597 24.40 1.42 54.34 19.84
NS 22 280.49 - FMP32 FMP319 FMP598 24.39 0.48 58.47 16.67
NS 24 3.89 - FMP35 FMP322 FMP599 24.38 0.69 18.33 56.60
NS 30 1.70 - - FMP324 FMP601 24.37 0.00 74.87 0.76
SS 2 92.82 - FMP38 FMP325 FMP602 25.50 35.97 24.73 13.80
SS 4 155.03 - FMP41 FMP328 FMP603 25.04 39.43 28.19 7.34
SS 6 673.23 - FMP44 FMP331 FMP604 25.83 57.52 12.47 4.18
SS 8 1 835.53 - FMP47 FMP334 FMP605 26.84 58.43 12.25 2.47

234
CARBINE tree species code
Yield class
Total area of stratum (ha)
Allocated FMPs by index number Percentage allocation of FMPs to stratum area
No harvesting
No thinning, with clearcutting
Thinning, with clearcutting
Continuous cover
No harvesting
No thinning, with clearcutting
Thinning, with clearcutting
Continuous cover
SS 10 3 466.40 - FMP50 FMP337 FMP606 25.23 55.57 14.11 5.09
SS 12 17 017.67
- FMP53 FMP340 FMP607 25.04 47.03 18.23 9.70
SS 14 9 918.67 - FMP56 FMP343 FMP608 25.10 40.78 25.65 8.47
SS 16 5 188.56 - FMP59 FMP346 FMP609 25.41 36.08 30.96 7.55
SS 18 3 208.05 - FMP62 FMP349 FMP610 24.96 32.01 31.12 11.92
SS 20 1 789.87 - FMP65 FMP352 FMP611 25.40 27.98 36.52 10.09
SS 22 1 008.98 - FMP68 FMP355 FMP612 25.19 28.16 35.75 10.89
SS 24 912.87 - FMP71 FMP358 FMP613 24.62 14.51 49.04 11.83
SS 26 22.41 - FMP74 FMP361 FMP614 24.58 4.99 64.71 5.72
SS 28 0.29 - - FMP364 FMP615 24.37 0.00 0.76 74.87
SP 2 182.36 - FMP78 FMP367 FMP616 31.59 2.84 17.66 47.91
SP 4 275.06 - FMP81 FMP370 FMP617 27.85 10.44 30.97 30.74
SP 6 923.61 - FMP84 FMP373 FMP618 26.67 14.21 36.03 23.09
SP 8 2 822.78 - FMP87 FMP376 FMP619 25.47 7.62 39.51 27.40
SP 10 5 084.38 - FMP90 FMP379 FMP620 24.74 3.60 34.54 37.11
SP 12 4 372.19 - FMP93 FMP382 FMP621 24.62 1.93 35.73 37.72
SP 14 2 119.67 - FMP96 FMP385 FMP622 24.52 1.40 41.08 33.00
SP 16 54.27 - FMP99 FMP388 FMP623 25.04 3.80 51.65 19.51
SP 18 6.57 - - FMP391 FMP624 24.37 0.00 42.08 33.55
CP 2 18.95 - FMP101 FMP394 FMP626 24.38 0.19 61.79 13.64
CP 4 22.41 - - FMP396 FMP627 24.37 0.00 61.39 14.24

235
CARBINE tree species code
Yield class
Total area of stratum (ha)
Allocated FMPs by index number Percentage allocation of FMPs to stratum area
No harvesting
No thinning, with clearcutting
Thinning, with clearcutting
Continuous cover
No harvesting
No thinning, with clearcutting
Thinning, with clearcutting
Continuous cover
CP 6 64.52 - FMP106 FMP399 FMP628 25.94 11.71 39.69 22.66
CP 8 225.20 - FMP109 FMP402 FMP629 24.52 2.63 43.75 29.10
CP 10 818.19 - FMP112 FMP405 FMP630 25.00 1.06 51.85 22.09
CP 12 3 476.31 - FMP115 FMP408 FMP631 24.42 0.60 51.17 23.81
CP 14 10 619.02
- FMP118 FMP411 FMP632 24.38 0.19 59.59 15.84
CP 16 5 210.28 - FMP121 FMP414 FMP633 24.38 0.20 59.64 15.78
CP 18 1 210.78 - FMP123 FMP416 FMP634 24.39 0.25 54.77 20.58
CP 20 787.51 - - FMP418 FMP635 24.37 0.00 58.65 16.98
CP 22 0.40 - - FMP420 FMP636 24.37 0.00 73.38 2.25
CP 24 0.20 - - - FMP637 24.37 0.00 0.00 75.63
LP 2 57.80 - FMP127 FMP422 - 26.13 45.00 28.86 0.00
LP 4 702.23 - FMP130 FMP425 FMP639 27.19 54.63 13.99 4.19
LP 6 1 035.10 - FMP133 FMP428 FMP640 25.58 47.30 24.19 2.93
LP 8 1 063.88 - FMP136 FMP431 FMP641 25.44 35.61 33.17 5.78
LP 10 366.11 - FMP139 FMP434 FMP642 26.37 24.22 38.62 10.79
LP 12 168.10 - FMP142 FMP437 FMP643 24.71 14.62 44.68 15.99
LP 14 61.16 - FMP145 FMP440 FMP644 31.04 14.51 39.73 14.72
LP 16 5.40 - - FMP443 FMP645 24.37 0.00 55.41 20.22
LP 18 1.93 - - FMP446 FMP646 24.37 0.00 73.03 2.60
LP 20 70.93 - - FMP447 FMP647 24.37 0.00 48.36 27.27
EL 2 9.77 - - FMP449 FMP648 24.37 0.00 0.03 75.60

236
CARBINE tree species code
Yield class
Total area of stratum (ha)
Allocated FMPs by index number Percentage allocation of FMPs to stratum area
No harvesting
No thinning, with clearcutting
Thinning, with clearcutting
Continuous cover
No harvesting
No thinning, with clearcutting
Thinning, with clearcutting
Continuous cover
EL 4 32.28 - FMP151 FMP452 FMP649 27.62 12.03 33.09 27.25
EL 6 190.35 - FMP154 FMP455 FMP650 26.38 1.41 28.67 43.54
EL 8 361.58 - FMP157 FMP458 FMP651 26.35 2.54 30.03 41.07
EL 10 295.35 - FMP160 FMP461 FMP652 24.51 1.46 26.69 47.34
EL 12 323.90 - FMP163 FMP464 FMP653 24.39 3.15 39.30 33.16
EL 14 5.17 - FMP166 FMP467 FMP654 25.43 1.07 49.07 24.44
EL 16 0.35 - - FMP470 FMP655 24.37 0.00 17.10 58.52
EL 18 0.53 - - FMP472 FMP656 24.37 0.00 74.87 0.76
JL 2 16.80 - FMP169 FMP473 FMP657 27.93 6.49 60.60 4.98
JL 4 111.45 - FMP172 FMP476 FMP658 27.04 34.58 21.63 16.75
JL 6 489.15 - FMP175 FMP479 FMP659 26.48 14.41 44.40 14.70
JL 8 1 302.89 - FMP178 FMP482 FMP660 24.71 7.47 38.59 29.22
JL 10 1 930.57 - FMP181 FMP485 FMP661 24.84 6.46 35.44 33.25
JL 12 1 768.49 - FMP184 FMP488 FMP662 24.64 6.91 37.30 31.15
JL 14 1 648.32 - FMP187 FMP491 FMP663 24.64 4.70 47.12 23.54
JL 16 50.81 - FMP190 FMP494 FMP664 24.41 7.68 52.76 15.15
JL 18 0.98 - - FMP497 FMP665 24.37 0.00 31.36 44.27
JL 20 1.78 - - FMP498 FMP666 24.37 0.00 73.62 2.01
DF 2 6.05 - FMP194 FMP500 FMP668 26.82 6.39 10.91 55.89
DF 4 4.67 - - FMP503 FMP669 24.37 0.00 3.68 71.94
DF 6 11.69 - - - FMP670 24.37 0.00 0.00 75.63
DF 8 170.74 - FMP198 FMP508 FMP671 24.79 5.39 14.20 55.61

237
CARBINE tree species code
Yield class
Total area of stratum (ha)
Allocated FMPs by index number Percentage allocation of FMPs to stratum area
No harvesting
No thinning, with clearcutting
Thinning, with clearcutting
Continuous cover
No harvesting
No thinning, with clearcutting
Thinning, with clearcutting
Continuous cover
DF 10 373.13 - FMP201 FMP511 FMP672 24.47 0.86 23.67 51.01
DF 12 1 222.73 - FMP204 FMP514 FMP673 24.41 0.55 26.01 49.02
DF 14 1 515.31 - FMP207 FMP517 FMP674 24.46 1.10 25.94 48.49
DF 16 1 731.95 - FMP210 FMP520 FMP675 24.41 0.86 33.23 41.50
DF 18 1 367.82 - FMP213 FMP523 FMP676 24.44 1.16 42.59 31.81
DF 20 1 091.27 - FMP216 FMP526 FMP677 24.40 0.71 40.88 34.01
DF 22 786.92 - FMP219 FMP529 FMP678 24.44 1.21 51.96 22.38
DF 24 979.15 - FMP222 FMP532 FMP679 24.67 0.91 54.71 19.70
DF 26 3.95 - - FMP535 FMP680 24.37 0.00 28.91 46.72
GF 2 5.37 - - FMP536 FMP681 24.37 0.00 2.12 73.51
GF 4 0.59 - - - FMP682 24.37 0.00 0.00 75.63
GF 6 3.97 - - FMP538 - 92.44 0.00 7.56 0.00
GF 8 5.01 - - FMP539 FMP684 24.37 0.00 0.56 75.06
GF 10 23.80 - - FMP540 FMP685 24.37 0.00 34.72 40.91
GF 12 64.91 - FMP230 FMP541 FMP686 24.41 6.32 22.85 46.42
GF 14 70.04 - FMP232 FMP542 FMP687 24.38 3.18 27.67 44.77
GF 16 74.22 - FMP234 FMP543 FMP688 24.55 0.40 23.79 51.26
GF 18 47.51 - FMP236 FMP544 FMP689 25.72 1.56 31.06 41.65
GF 20 40.02 - FMP238 FMP545 FMP690 24.49 4.35 22.57 48.59
GF 22 24.18 - FMP240 FMP546 FMP691 24.37 0.98 43.49 31.15
GF 24 18.41 - FMP242 FMP547 FMP692 24.37 10.23 35.57 29.83
GF 26 22.14 - FMP244 FMP548 FMP693 24.37 2.48 37.62 35.53

238
CARBINE tree species code
Yield class
Total area of stratum (ha)
Allocated FMPs by index number Percentage allocation of FMPs to stratum area
No harvesting
No thinning, with clearcutting
Thinning, with clearcutting
Continuous cover
No harvesting
No thinning, with clearcutting
Thinning, with clearcutting
Continuous cover
GF 28 11.01 - FMP246 FMP549 FMP694 24.37 3.04 51.05 21.53
GF 30 21.48 - - FMP550 FMP695 24.37 0.00 44.24 31.38
NF 2 1.94 - - - FMP696 24.37 0.00 0.00 75.63
NF 4 0.28 - - - FMP697 24.37 0.00 0.00 75.63
NF 6 0.77 - - - FMP698 24.37 0.00 0.00 75.63
NF 8 4.16 - - FMP554 FMP699 24.37 0.00 75.57 0.06
NF 10 6.91 - FMP253 FMP555 FMP700 24.55 0.81 23.77 50.87
NF 12 20.46 - FMP254 FMP556 FMP701 26.89 11.52 17.31 44.29
NF 14 22.18 - FMP255 FMP557 FMP702 24.75 4.46 32.83 37.96
NF 16 17.81 - FMP256 FMP558 FMP703 24.37 1.12 55.95 18.55
NF 18 8.70 - - FMP559 FMP704 24.37 0.00 21.01 54.62
NF 20 7.61 - - FMP560 FMP705 24.37 0.00 30.59 45.04
NF 22 13.15 - FMP259 FMP561 FMP706 24.37 3.92 49.39 22.32
WH 2 6.51 - - FMP563 FMP708 24.37 0.00 19.32 56.31
WH 4 0.51 - - FMP564 FMP709 24.37 0.00 36.85 38.77
WH 6 2.31 - - FMP565 FMP710 24.38 0.00 26.16 49.46
WH 8 10.52 - FMP266 FMP566 FMP711 28.14 4.96 7.47 59.42
WH 10 26.70 - FMP267 FMP567 FMP712 24.53 10.55 13.86 51.07
WH 12 156.58 - FMP268 FMP568 FMP713 25.58 5.44 33.24 35.74
WH 14 244.65 - FMP269 FMP569 FMP714 25.02 1.94 40.73 32.31
WH 16 265.48 - FMP270 FMP570 FMP715 24.59 2.52 33.62 39.28
WH 18 267.37 - FMP271 FMP571 FMP716 24.45 2.39 45.49 27.68

239
CARBINE tree species code
Yield class
Total area of stratum (ha)
Allocated FMPs by index number Percentage allocation of FMPs to stratum area
No harvesting
No thinning, with clearcutting
Thinning, with clearcutting
Continuous cover
No harvesting
No thinning, with clearcutting
Thinning, with clearcutting
Continuous cover
WH 20 232.70 - FMP272 FMP572 FMP717 24.72 2.71 42.11 30.46
WH 22 113.22 - FMP273 FMP573 FMP718 24.46 1.17 43.02 31.36
WH 24 89.26 - - FMP574 FMP719 24.37 0.00 53.12 22.51
RC 2 4.69 - - FMP576 FMP721 24.38 0.00 1.37 74.26
RC 4 11.53 - - FMP577 FMP722 24.37 0.00 32.94 42.69
RC 6 8.75 - - FMP578 FMP723 24.37 0.00 6.84 68.79
RC 8 20.34 - FMP279 FMP579 FMP724 25.27 0.01 18.61 56.11
RC 10 96.85 - FMP280 FMP580 FMP725 24.68 0.14 16.49 58.69
RC 12 235.02 - FMP281 FMP581 FMP726 27.97 2.61 19.91 49.50
RC 14 171.38 - FMP282 FMP582 FMP727 24.41 1.12 20.20 54.26
RC 16 175.52 - FMP283 FMP583 FMP728 24.69 2.24 22.26 50.81
RC 18 130.65 - FMP284 FMP584 FMP729 24.37 1.59 21.73 52.30
RC 20 68.83 - FMP285 FMP585 FMP730 24.37 2.61 42.85 30.17
RC 22 42.67 - FMP286 FMP586 FMP731 24.37 4.73 51.24 19.66
RC 24 42.94 - FMP287 FMP587 FMP732 24.37 0.11 69.04 6.48
OK 2 1 594.20 FMP1 - - FMP733 33.79 0.00 0.00 66.21
OK 4 6 720.47 FMP1 - - FMP734 34.14 0.00 0.00 65.86
OK 6 4 464.65 FMP1 - - FMP735 33.57 0.00 0.00 66.43
OK 8 648.40 FMP1 - - FMP736 33.65 0.00 0.00 66.35
OK 10 50.99 FMP1 - - FMP737 33.26 0.00 0.00 66.74
OK 12 2.64 FMP1 - - FMP738 33.26 0.00 0.00 66.74
OK 14 0.60 FMP1 - - FMP739 54.03 0.00 0.00 45.97

240
CARBINE tree species code
Yield class
Total area of stratum (ha)
Allocated FMPs by index number Percentage allocation of FMPs to stratum area
No harvesting
No thinning, with clearcutting
Thinning, with clearcutting
Continuous cover
No harvesting
No thinning, with clearcutting
Thinning, with clearcutting
Continuous cover
OK 16 1.64 FMP1 - - FMP740 33.26 0.00 0.00 66.74
AH 2 147.90 FMP1 - - FMP742 35.37 0.00 0.00 64.63
AH 4 1 107.68 FMP1 - - FMP743 35.28 0.00 0.00 64.72
AH 6 848.40 FMP1 - - FMP744 34.63 0.00 0.00 65.37
AH 8 530.96 FMP1 - - FMP745 37.02 0.00 0.00 62.98
AH 10 283.06 FMP1 - - FMP746 38.94 0.00 0.00 61.06
AH 12 176.95 FMP1 - - FMP747 38.89 0.00 0.00 61.11
AH 14 2.53 FMP1 - - FMP748 42.91 0.00 0.00 57.09
AH 16 0.78 FMP1 - - FMP749 34.47 0.00 0.00 65.53
BE 2 890.77 FMP1 - - FMP752 34.19 0.00 0.00 65.81
BE 4 1 893.77 FMP1 - - FMP753 34.00 0.00 0.00 66.00
BE 6 4 201.67 FMP1 - - FMP754 33.65 0.00 0.00 66.35
BE 8 3 371.16 FMP1 - - FMP755 33.56 0.00 0.00 66.44
BE 10 1 021.60 FMP1 - - FMP756 33.31 0.00 0.00 66.69
BE 12 10.67 FMP1 - - FMP757 33.26 0.00 0.00 66.74
BE 14 1.25 FMP1 - - FMP758 61.39 0.00 0.00 38.61
BI 2 1 249.47 FMP1 - - FMP761 35.37 0.00 0.00 64.63
BI 4 4 189.35 FMP1 - - FMP762 35.28 0.00 0.00 64.72
BI 6 1 268.72 FMP1 - - FMP763 34.63 0.00 0.00 65.37
BI 8 468.80 FMP1 - - FMP764 37.02 0.00 0.00 62.98
BI 10 198.25 FMP1 - - FMP765 38.94 0.00 0.00 61.06
BI 12 249.49 FMP1 - - FMP766 38.89 0.00 0.00 61.11

241
CARBINE tree species code
Yield class
Total area of stratum (ha)
Allocated FMPs by index number Percentage allocation of FMPs to stratum area
No harvesting
No thinning, with clearcutting
Thinning, with clearcutting
Continuous cover
No harvesting
No thinning, with clearcutting
Thinning, with clearcutting
Continuous cover
BI 14 15.32 FMP1 - - FMP767 42.91 0.00 0.00 57.09
BI 16 1.48 FMP1 - - FMP768 34.47 0.00 0.00 65.53
BI 18 0.45 FMP1 - - FMP769 71.82 0.00 0.00 28.18
SY 2 2 905.16 FMP1 - - FMP772 35.37 0.00 0.00 64.63
SY 4 5 561.41 FMP1 - - FMP773 35.28 0.00 0.00 64.72
SY 6 1 545.12 FMP1 - - FMP774 34.63 0.00 0.00 65.37
SY 8 535.72 FMP1 - - FMP775 37.02 0.00 0.00 62.98
SY 10 230.56 FMP1 - - FMP776 38.94 0.00 0.00 61.06
SY 12 1 272.50 FMP1 - - FMP777 38.89 0.00 0.00 61.11
SY 14 49.68 FMP1 - - FMP778 42.91 0.00 0.00 57.09
SY 16 3.45 FMP1 - - FMP779 34.47 0.00 0.00 65.53
SY 18 1.34 FMP1 - - FMP780 71.82 0.00 0.00 28.18
SY 20 2.77 FMP1 - - FMP781 47.72 0.00 0.00 52.28
SY 22 0.50 FMP1 - - FMP782 33.26 0.00 0.00 66.74
PO 2 37.82 FMP1 - - FMP784 35.37 0.00 0.00 64.63
PO 4 139.70 FMP1 - - FMP785 35.28 0.00 0.00 64.72
PO 6 127.22 FMP1 - - FMP786 34.63 0.00 0.00 65.37
PO 8 67.42 FMP1 - - FMP787 37.02 0.00 0.00 62.98
PO 10 54.84 FMP1 - - FMP788 38.94 0.00 0.00 61.06
PO 12 5.51 FMP1 - - FMP789 38.89 0.00 0.00 61.11
PO 14 44.23 FMP1 - - FMP790 42.91 0.00 0.00 57.09
PO 16 7.39 FMP1 - - FMP791 34.47 0.00 0.00 65.53
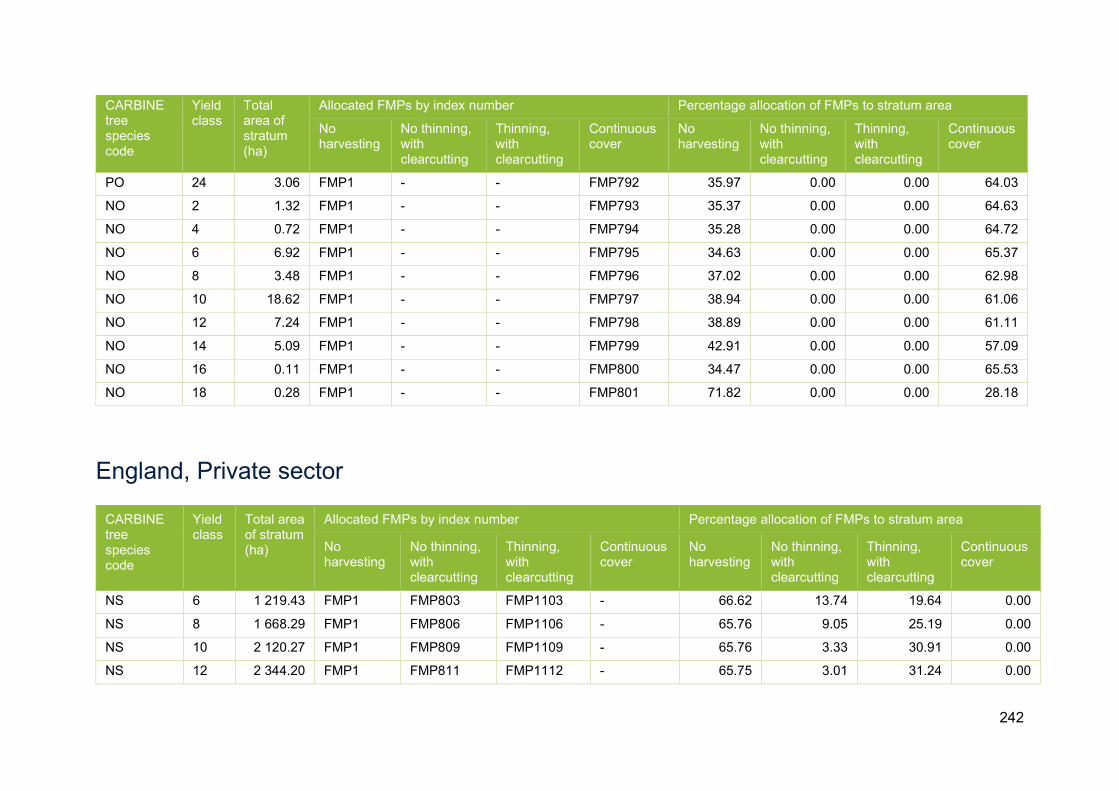
242
CARBINE tree species code
Yield class
Total area of stratum (ha)
Allocated FMPs by index number Percentage allocation of FMPs to stratum area
No harvesting
No thinning, with clearcutting
Thinning, with clearcutting
Continuous cover
No harvesting
No thinning, with clearcutting
Thinning, with clearcutting
Continuous cover
PO 24 3.06 FMP1 - - FMP792 35.97 0.00 0.00 64.03
NO 2 1.32 FMP1 - - FMP793 35.37 0.00 0.00 64.63
NO 4 0.72 FMP1 - - FMP794 35.28 0.00 0.00 64.72
NO 6 6.92 FMP1 - - FMP795 34.63 0.00 0.00 65.37
NO 8 3.48 FMP1 - - FMP796 37.02 0.00 0.00 62.98
NO 10 18.62 FMP1 - - FMP797 38.94 0.00 0.00 61.06
NO 12 7.24 FMP1 - - FMP798 38.89 0.00 0.00 61.11
NO 14 5.09 FMP1 - - FMP799 42.91 0.00 0.00 57.09
NO 16 0.11 FMP1 - - FMP800 34.47 0.00 0.00 65.53
NO 18 0.28 FMP1 - - FMP801 71.82 0.00 0.00 28.18
England, Private sector
CARBINE tree species code
Yield class
Total area of stratum (ha)
Allocated FMPs by index number Percentage allocation of FMPs to stratum area
No harvesting
No thinning, with clearcutting
Thinning, with clearcutting
Continuous cover
No harvesting
No thinning, with clearcutting
Thinning, with clearcutting
Continuous cover
NS 6 1 219.43 FMP1 FMP803 FMP1103 - 66.62 13.74 19.64 0.00
NS 8 1 668.29 FMP1 FMP806 FMP1106 - 65.76 9.05 25.19 0.00
NS 10 2 120.27 FMP1 FMP809 FMP1109 - 65.76 3.33 30.91 0.00
NS 12 2 344.20 FMP1 FMP811 FMP1112 - 65.75 3.01 31.24 0.00
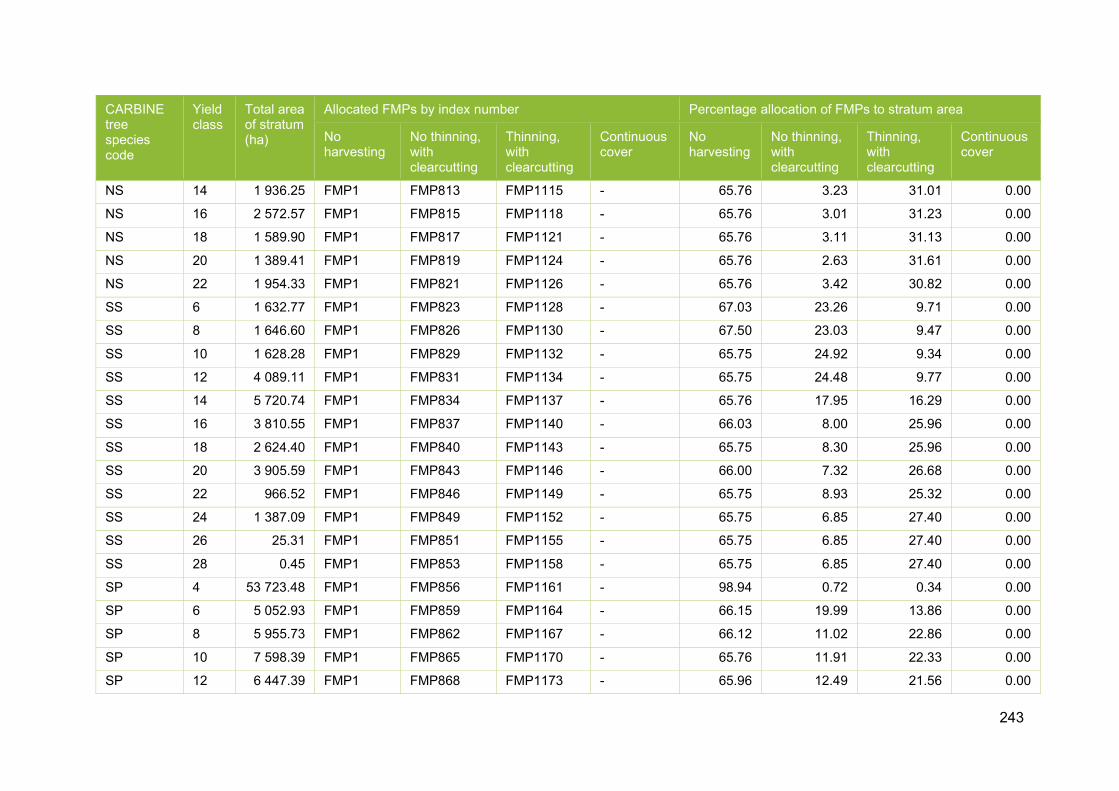
243
CARBINE tree species code
Yield class
Total area of stratum (ha)
Allocated FMPs by index number Percentage allocation of FMPs to stratum area
No harvesting
No thinning, with clearcutting
Thinning, with clearcutting
Continuous cover
No harvesting
No thinning, with clearcutting
Thinning, with clearcutting
Continuous cover
NS 14 1 936.25 FMP1 FMP813 FMP1115 - 65.76 3.23 31.01 0.00
NS 16 2 572.57 FMP1 FMP815 FMP1118 - 65.76 3.01 31.23 0.00
NS 18 1 589.90 FMP1 FMP817 FMP1121 - 65.76 3.11 31.13 0.00
NS 20 1 389.41 FMP1 FMP819 FMP1124 - 65.76 2.63 31.61 0.00
NS 22 1 954.33 FMP1 FMP821 FMP1126 - 65.76 3.42 30.82 0.00
SS 6 1 632.77 FMP1 FMP823 FMP1128 - 67.03 23.26 9.71 0.00
SS 8 1 646.60 FMP1 FMP826 FMP1130 - 67.50 23.03 9.47 0.00
SS 10 1 628.28 FMP1 FMP829 FMP1132 - 65.75 24.92 9.34 0.00
SS 12 4 089.11 FMP1 FMP831 FMP1134 - 65.75 24.48 9.77 0.00
SS 14 5 720.74 FMP1 FMP834 FMP1137 - 65.76 17.95 16.29 0.00
SS 16 3 810.55 FMP1 FMP837 FMP1140 - 66.03 8.00 25.96 0.00
SS 18 2 624.40 FMP1 FMP840 FMP1143 - 65.75 8.30 25.96 0.00
SS 20 3 905.59 FMP1 FMP843 FMP1146 - 66.00 7.32 26.68 0.00
SS 22 966.52 FMP1 FMP846 FMP1149 - 65.75 8.93 25.32 0.00
SS 24 1 387.09 FMP1 FMP849 FMP1152 - 65.75 6.85 27.40 0.00
SS 26 25.31 FMP1 FMP851 FMP1155 - 65.75 6.85 27.40 0.00
SS 28 0.45 FMP1 FMP853 FMP1158 - 65.75 6.85 27.40 0.00
SP 4 53 723.48 FMP1 FMP856 FMP1161 - 98.94 0.72 0.34 0.00
SP 6 5 052.93 FMP1 FMP859 FMP1164 - 66.15 19.99 13.86 0.00
SP 8 5 955.73 FMP1 FMP862 FMP1167 - 66.12 11.02 22.86 0.00
SP 10 7 598.39 FMP1 FMP865 FMP1170 - 65.76 11.91 22.33 0.00
SP 12 6 447.39 FMP1 FMP868 FMP1173 - 65.96 12.49 21.56 0.00

244
CARBINE tree species code
Yield class
Total area of stratum (ha)
Allocated FMPs by index number Percentage allocation of FMPs to stratum area
No harvesting
No thinning, with clearcutting
Thinning, with clearcutting
Continuous cover
No harvesting
No thinning, with clearcutting
Thinning, with clearcutting
Continuous cover
SP 14 11 211.09 FMP1 FMP871 FMP1176 - 65.76 29.34 4.90 0.00
CP 6 643.09 FMP1 - FMP1183 - 65.74 0.00 34.26 0.00
CP 8 1 111.16 FMP1 - FMP1186 - 70.28 0.00 29.72 0.00
CP 10 2 549.02 FMP1 - FMP1189 - 67.30 0.00 32.70 0.00
CP 12 1 906.35 FMP1 - FMP1192 - 65.74 0.00 34.26 0.00
CP 14 2 149.54 FMP1 - FMP1195 - 65.75 0.00 34.25 0.00
CP 16 1 605.08 FMP1 - FMP1198 - 65.89 0.00 34.11 0.00
CP 18 751.74 FMP1 - FMP1200 - 65.75 0.00 34.25 0.00
CP 20 595.06 FMP1 - FMP1202 - 65.76 0.00 34.24 0.00
LP 4 458.01 FMP1 FMP882 FMP1205 - 75.01 12.64 12.35 0.00
LP 6 4 095.11 FMP1 FMP885 FMP1208 - 73.66 13.44 12.90 0.00
LP 8 2 248.89 FMP1 FMP888 FMP1211 - 69.56 15.77 14.67 0.00
LP 10 1 272.21 FMP1 FMP891 FMP1214 - 71.17 15.34 13.49 0.00
LP 12 1 398.52 FMP1 FMP894 FMP1217 - 67.99 19.72 12.28 0.00
LP 14 172.87 FMP1 FMP897 FMP1220 - 66.36 23.36 10.28 0.00
LP 16 17.58 FMP1 FMP899 FMP1222 - 66.40 16.80 16.80 0.00
LP 18 7.09 FMP1 FMP901 FMP1224 - 66.54 16.73 16.73 0.00
LP 20 94.18 FMP1 FMP902 FMP1225 - 74.37 12.81 12.81 0.00
EL 2 95.63 FMP1 FMP904 FMP1227 - 65.74 13.70 20.55 0.00
EL 4 378.18 FMP1 FMP906 FMP1229 - 65.74 13.70 20.55 0.00
EL 6 968.92 FMP1 FMP909 FMP1232 - 65.74 13.70 20.55 0.00
EL 8 1 080.41 FMP1 FMP912 FMP1235 - 65.75 13.70 20.55 0.00
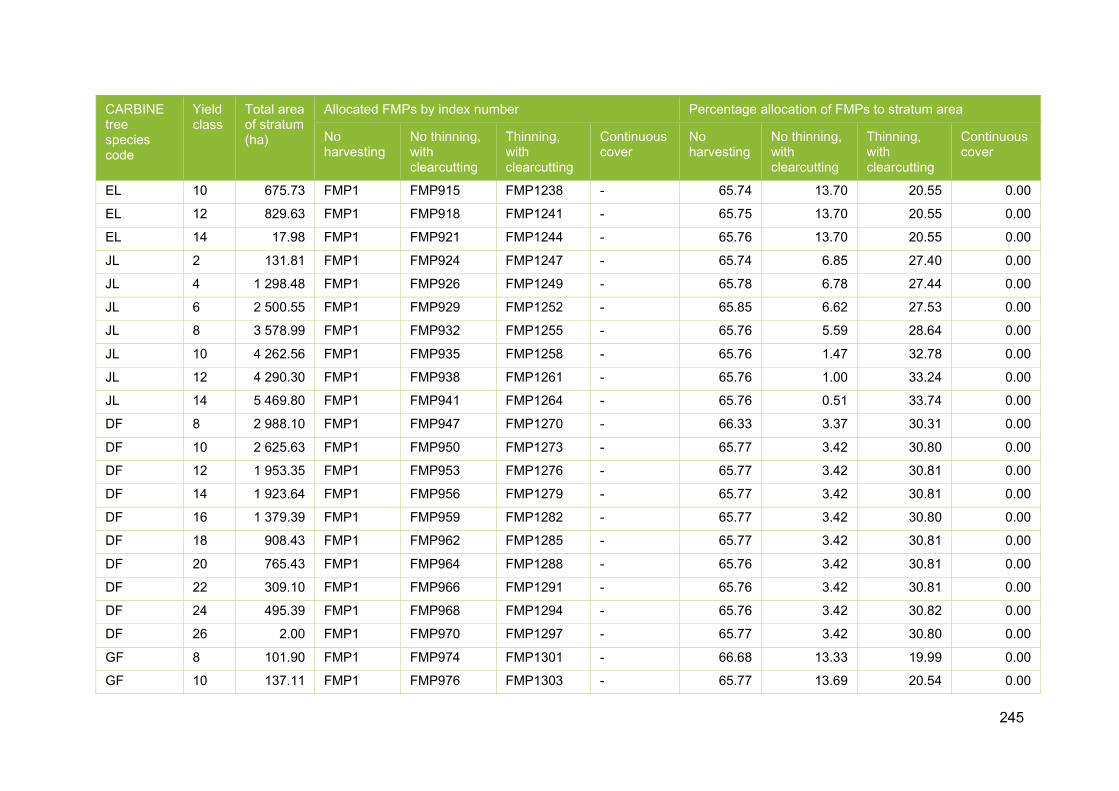
245
CARBINE tree species code
Yield class
Total area of stratum (ha)
Allocated FMPs by index number Percentage allocation of FMPs to stratum area
No harvesting
No thinning, with clearcutting
Thinning, with clearcutting
Continuous cover
No harvesting
No thinning, with clearcutting
Thinning, with clearcutting
Continuous cover
EL 10 675.73 FMP1 FMP915 FMP1238 - 65.74 13.70 20.55 0.00
EL 12 829.63 FMP1 FMP918 FMP1241 - 65.75 13.70 20.55 0.00
EL 14 17.98 FMP1 FMP921 FMP1244 - 65.76 13.70 20.55 0.00
JL 2 131.81 FMP1 FMP924 FMP1247 - 65.74 6.85 27.40 0.00
JL 4 1 298.48 FMP1 FMP926 FMP1249 - 65.78 6.78 27.44 0.00
JL 6 2 500.55 FMP1 FMP929 FMP1252 - 65.85 6.62 27.53 0.00
JL 8 3 578.99 FMP1 FMP932 FMP1255 - 65.76 5.59 28.64 0.00
JL 10 4 262.56 FMP1 FMP935 FMP1258 - 65.76 1.47 32.78 0.00
JL 12 4 290.30 FMP1 FMP938 FMP1261 - 65.76 1.00 33.24 0.00
JL 14 5 469.80 FMP1 FMP941 FMP1264 - 65.76 0.51 33.74 0.00
DF 8 2 988.10 FMP1 FMP947 FMP1270 - 66.33 3.37 30.31 0.00
DF 10 2 625.63 FMP1 FMP950 FMP1273 - 65.77 3.42 30.80 0.00
DF 12 1 953.35 FMP1 FMP953 FMP1276 - 65.77 3.42 30.81 0.00
DF 14 1 923.64 FMP1 FMP956 FMP1279 - 65.77 3.42 30.81 0.00
DF 16 1 379.39 FMP1 FMP959 FMP1282 - 65.77 3.42 30.80 0.00
DF 18 908.43 FMP1 FMP962 FMP1285 - 65.77 3.42 30.81 0.00
DF 20 765.43 FMP1 FMP964 FMP1288 - 65.76 3.42 30.81 0.00
DF 22 309.10 FMP1 FMP966 FMP1291 - 65.76 3.42 30.81 0.00
DF 24 495.39 FMP1 FMP968 FMP1294 - 65.76 3.42 30.82 0.00
DF 26 2.00 FMP1 FMP970 FMP1297 - 65.77 3.42 30.80 0.00
GF 8 101.90 FMP1 FMP974 FMP1301 - 66.68 13.33 19.99 0.00
GF 10 137.11 FMP1 FMP976 FMP1303 - 65.77 13.69 20.54 0.00

246
CARBINE tree species code
Yield class
Total area of stratum (ha)
Allocated FMPs by index number Percentage allocation of FMPs to stratum area
No harvesting
No thinning, with clearcutting
Thinning, with clearcutting
Continuous cover
No harvesting
No thinning, with clearcutting
Thinning, with clearcutting
Continuous cover
GF 12 110.57 FMP1 FMP979 FMP1306 - 69.68 12.13 18.19 0.00
GF 14 89.47 FMP1 FMP982 FMP1309 - 65.78 13.69 20.53 0.00
GF 16 59.12 FMP1 FMP984 FMP1312 - 65.78 13.69 20.53 0.00
GF 18 29.66 FMP1 FMP987 FMP1315 - 65.77 13.69 20.54 0.00
GF 20 28.29 FMP1 FMP990 FMP1318 - 65.76 13.69 20.54 0.00
GF 22 9.40 FMP1 FMP993 FMP1321 - 65.77 13.69 20.54 0.00
GF 24 9.34 FMP1 FMP996 FMP1324 - 65.76 13.70 20.54 0.00
GF 26 11.24 FMP1 FMP999 FMP1327 - 65.78 13.69 20.53 0.00
GF 28 5.59 FMP1 FMP1002 FMP1330 - 65.77 13.69 20.54 0.00
GF 30 10.90 FMP1 FMP1005 FMP1333 - 65.77 13.69 20.54 0.00
NF 8 56.88 FMP1 FMP1011 FMP1339 - 67.05 13.18 19.77 0.00
NF 10 32.55 FMP1 FMP1014 FMP1342 - 66.27 13.49 20.24 0.00
NF 12 26.68 FMP1 FMP1017 FMP1345 - 65.76 13.69 20.54 0.00
NF 14 24.93 FMP1 FMP1020 FMP1348 - 65.77 13.69 20.54 0.00
NF 16 11.86 FMP1 FMP1022 FMP1351 - 65.89 13.64 20.47 0.00
NF 18 4.51 FMP1 FMP1025 FMP1354 - 65.77 13.69 20.54 0.00
NF 20 4.78 FMP1 FMP1028 FMP1357 - 70.93 11.63 17.44 0.00
NF 22 5.07 FMP1 FMP1031 FMP1360 - 65.77 13.69 20.54 0.00
WH 4 0.34 FMP1 FMP1038 FMP1367 - 75.17 9.93 14.90 0.00
WH 6 9.17 FMP1 FMP1040 FMP1369 - 73.32 10.67 16.01 0.00
WH 8 17.69 FMP1 FMP1043 FMP1372 - 66.75 13.30 19.95 0.00
WH 10 78.14 FMP1 FMP1046 FMP1375 - 70.37 11.85 17.78 0.00

247
CARBINE tree species code
Yield class
Total area of stratum (ha)
Allocated FMPs by index number Percentage allocation of FMPs to stratum area
No harvesting
No thinning, with clearcutting
Thinning, with clearcutting
Continuous cover
No harvesting
No thinning, with clearcutting
Thinning, with clearcutting
Continuous cover
WH 12 1 292.16 FMP1 FMP1049 FMP1378 - 66.87 13.25 19.88 0.00
WH 14 696.98 FMP1 FMP1052 FMP1381 - 66.24 13.50 20.25 0.00
WH 16 1 021.25 FMP1 FMP1054 FMP1384 - 66.63 13.35 20.02 0.00
WH 18 950.53 FMP1 FMP1047 FMP1387 - 66.07 13.57 20.36 0.00
WH 20 302.12 FMP1 FMP1060 FMP1390 - 72.35 11.06 16.59 0.00
WH 22 221.02 FMP1 FMP1063 FMP1393 - 66.26 13.50 20.24 0.00
WH 24 137.96 FMP1 FMP1066 FMP1396 - 66.26 13.49 20.24 0.00
RC 4 6.14 FMP1 FMP1071 FMP1401 - 69.82 12.07 18.11 0.00
RC 6 32.52 FMP1 FMP1073 FMP1403 - 72.07 11.17 16.76 0.00
RC 8 37.80 FMP1 FMP1076 FMP1406 - 68.84 12.46 18.70 0.00
RC 10 295.76 FMP1 FMP1079 FMP1409 - 70.18 11.93 17.89 0.00
RC 12 1 827.91 FMP1 FMP1082 FMP1412 - 66.78 13.29 19.93 0.00
RC 14 437.35 FMP1 FMP1085 FMP1415 - 66.10 13.56 20.34 0.00
RC 16 615.09 FMP1 FMP1087 FMP1418 - 66.36 13.46 20.18 0.00
RC 18 418.05 FMP1 FMP1090 FMP1421 - 65.89 13.64 20.46 0.00
RC 20 84.98 FMP1 FMP1093 FMP1424 - 65.80 13.68 20.52 0.00
RC 22 80.98 FMP1 FMP1096 FMP1427 - 65.89 13.64 20.46 0.00
RC 24 64.54 FMP1 FMP1099 FMP1430 - 66.00 13.60 20.40 0.00
OK 2 24 926.92 FMP1 - FMP1433 - 89.35 0.00 10.65 0.00
OK 4 51 437.52 FMP1 - FMP1434 - 89.35 0.00 10.65 0.00
OK 6 39 803.06 FMP1 - FMP1435 - 89.35 0.00 10.65 0.00
OK 8 25 203.64 FMP1 - FMP1436 - 89.35 0.00 10.65 0.00

248
CARBINE tree species code
Yield class
Total area of stratum (ha)
Allocated FMPs by index number Percentage allocation of FMPs to stratum area
No harvesting
No thinning, with clearcutting
Thinning, with clearcutting
Continuous cover
No harvesting
No thinning, with clearcutting
Thinning, with clearcutting
Continuous cover
AH 2 13 258.66 FMP1 - FMP1437 - 89.35 0.00 10.65 0.00
AH 4 19 206.27 FMP1 - FMP1438 - 89.35 0.00 10.65 0.00
AH 6 18 725.89 FMP1 - FMP1439 - 89.35 0.00 10.65 0.00
AH 8 16 968.30 FMP1 - FMP1440 - 89.35 0.00 10.65 0.00
AH 10 12 058.90 FMP1 - FMP1441 - 89.35 0.00 10.65 0.00
AH 12 23 249.37 FMP1 - FMP1442 - 89.35 0.00 10.65 0.00
BE 4 22 832.56 FMP1 - FMP1444 - 89.35 0.00 10.65 0.00
BE 6 29 695.75 FMP1 - FMP1445 - 89.35 0.00 10.65 0.00
BE 8 21 671.82 FMP1 - FMP1446 - 89.35 0.00 10.65 0.00
BE 10 15 367.07 FMP1 - FMP1447 - 89.35 0.00 10.65 0.00
BI 2 25 826.94 FMP1 - FMP1449 - 89.35 0.00 10.65 0.00
BI 4 26 028.27 FMP1 - FMP1450 - 89.35 0.00 10.65 0.00
BI 6 21 885.44 FMP1 - FMP1451 - 89.35 0.00 10.65 0.00
BI 8 12 392.88 FMP1 - FMP1452 - 89.35 0.00 10.65 0.00
BI 10 6 888.82 FMP1 - FMP1453 - 89.35 0.00 10.65 0.00
BI 12 9 215.21 FMP1 - FMP1454 - 89.35 0.00 10.65 0.00
SY 2 373 383.95
FMP1 - FMP1455 - 99.70 0.00 0.30 0.00
SY 4 14 576.79 FMP1 - FMP1456 - 89.35 0.00 10.65 0.00
SY 6 13 901.14 FMP1 - FMP1457 - 89.35 0.00 10.65 0.00
SY 8 9 565.10 FMP1 - FMP1458 - 89.35 0.00 10.65 0.00
SY 10 6 443.98 FMP1 - FMP1459 - 89.35 0.00 10.65 0.00
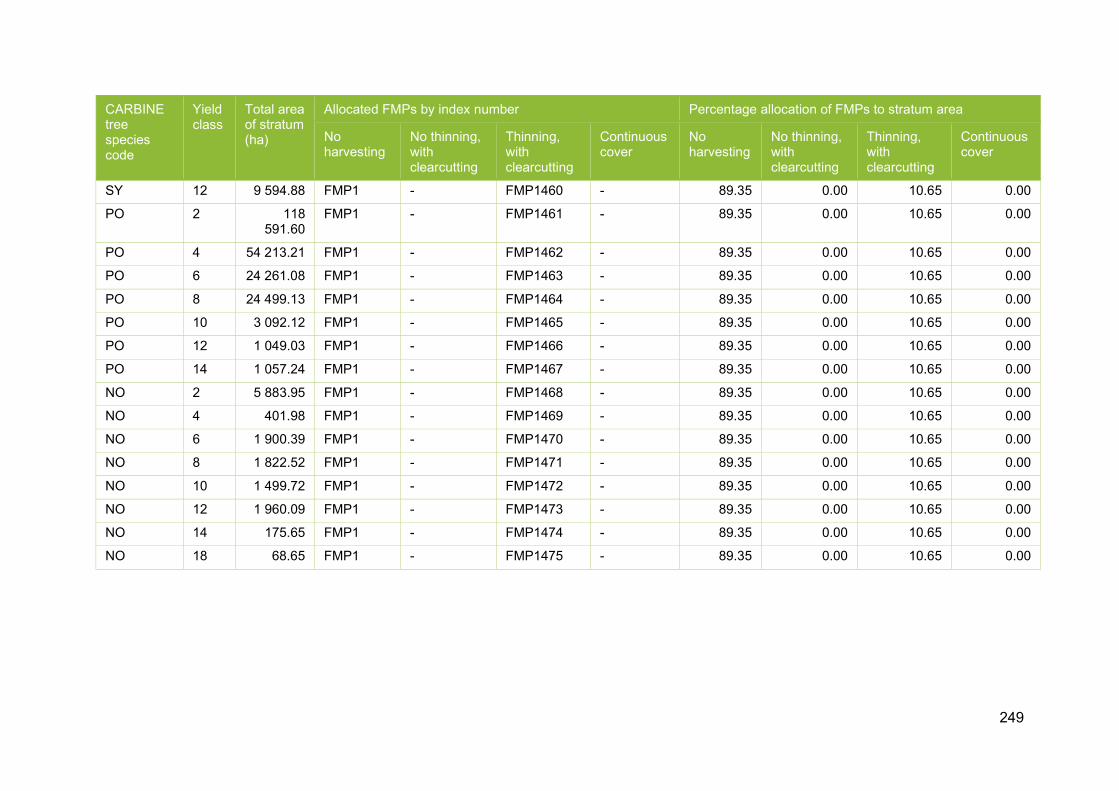
249
CARBINE tree species code
Yield class
Total area of stratum (ha)
Allocated FMPs by index number Percentage allocation of FMPs to stratum area
No harvesting
No thinning, with clearcutting
Thinning, with clearcutting
Continuous cover
No harvesting
No thinning, with clearcutting
Thinning, with clearcutting
Continuous cover
SY 12 9 594.88 FMP1 - FMP1460 - 89.35 0.00 10.65 0.00
PO 2 118 591.60
FMP1 - FMP1461 - 89.35 0.00 10.65 0.00
PO 4 54 213.21 FMP1 - FMP1462 - 89.35 0.00 10.65 0.00
PO 6 24 261.08 FMP1 - FMP1463 - 89.35 0.00 10.65 0.00
PO 8 24 499.13 FMP1 - FMP1464 - 89.35 0.00 10.65 0.00
PO 10 3 092.12 FMP1 - FMP1465 - 89.35 0.00 10.65 0.00
PO 12 1 049.03 FMP1 - FMP1466 - 89.35 0.00 10.65 0.00
PO 14 1 057.24 FMP1 - FMP1467 - 89.35 0.00 10.65 0.00
NO 2 5 883.95 FMP1 - FMP1468 - 89.35 0.00 10.65 0.00
NO 4 401.98 FMP1 - FMP1469 - 89.35 0.00 10.65 0.00
NO 6 1 900.39 FMP1 - FMP1470 - 89.35 0.00 10.65 0.00
NO 8 1 822.52 FMP1 - FMP1471 - 89.35 0.00 10.65 0.00
NO 10 1 499.72 FMP1 - FMP1472 - 89.35 0.00 10.65 0.00
NO 12 1 960.09 FMP1 - FMP1473 - 89.35 0.00 10.65 0.00
NO 14 175.65 FMP1 - FMP1474 - 89.35 0.00 10.65 0.00
NO 18 68.65 FMP1 - FMP1475 - 89.35 0.00 10.65 0.00
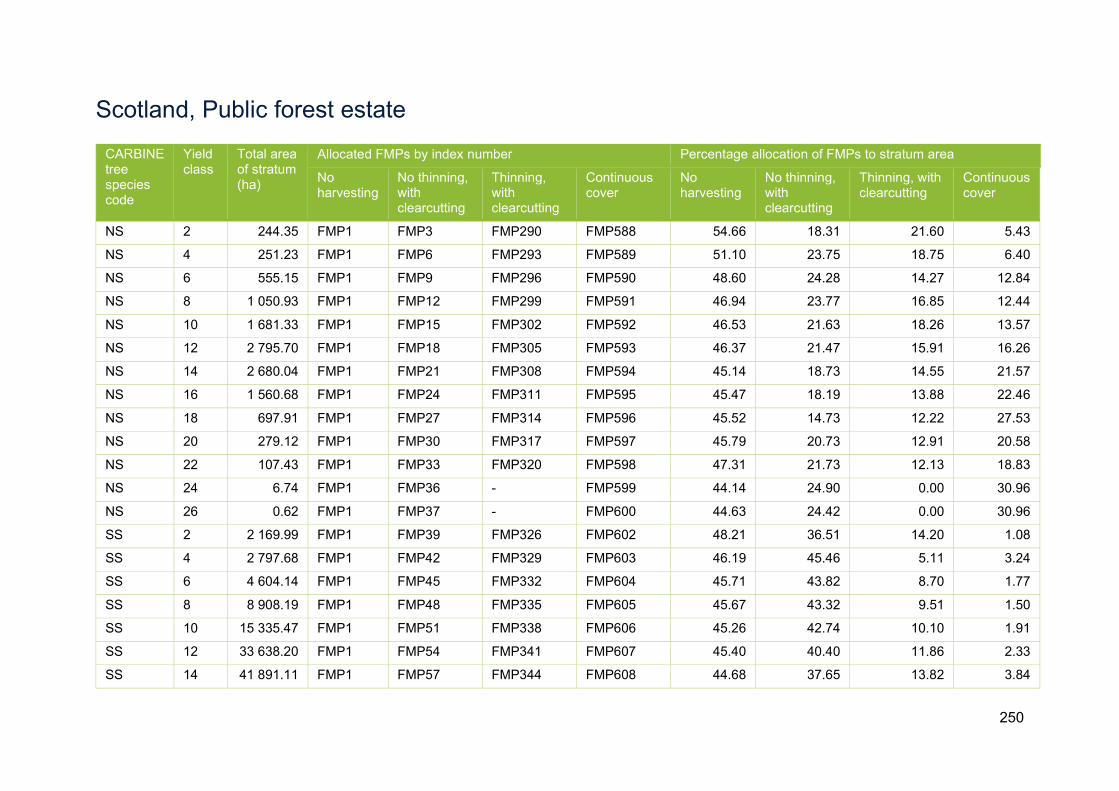
250
Scotland, Public forest estate
CARBINE tree species code
Yield class
Total area of stratum (ha)
Allocated FMPs by index number Percentage allocation of FMPs to stratum area
No harvesting
No thinning, with clearcutting
Thinning, with clearcutting
Continuous cover
No harvesting
No thinning, with clearcutting
Thinning, with clearcutting
Continuous cover
NS 2 244.35 FMP1 FMP3 FMP290 FMP588 54.66 18.31 21.60 5.43
NS 4 251.23 FMP1 FMP6 FMP293 FMP589 51.10 23.75 18.75 6.40
NS 6 555.15 FMP1 FMP9 FMP296 FMP590 48.60 24.28 14.27 12.84
NS 8 1 050.93 FMP1 FMP12 FMP299 FMP591 46.94 23.77 16.85 12.44
NS 10 1 681.33 FMP1 FMP15 FMP302 FMP592 46.53 21.63 18.26 13.57
NS 12 2 795.70 FMP1 FMP18 FMP305 FMP593 46.37 21.47 15.91 16.26
NS 14 2 680.04 FMP1 FMP21 FMP308 FMP594 45.14 18.73 14.55 21.57
NS 16 1 560.68 FMP1 FMP24 FMP311 FMP595 45.47 18.19 13.88 22.46
NS 18 697.91 FMP1 FMP27 FMP314 FMP596 45.52 14.73 12.22 27.53
NS 20 279.12 FMP1 FMP30 FMP317 FMP597 45.79 20.73 12.91 20.58
NS 22 107.43 FMP1 FMP33 FMP320 FMP598 47.31 21.73 12.13 18.83
NS 24 6.74 FMP1 FMP36 - FMP599 44.14 24.90 0.00 30.96
NS 26 0.62 FMP1 FMP37 - FMP600 44.63 24.42 0.00 30.96
SS 2 2 169.99 FMP1 FMP39 FMP326 FMP602 48.21 36.51 14.20 1.08
SS 4 2 797.68 FMP1 FMP42 FMP329 FMP603 46.19 45.46 5.11 3.24
SS 6 4 604.14 FMP1 FMP45 FMP332 FMP604 45.71 43.82 8.70 1.77
SS 8 8 908.19 FMP1 FMP48 FMP335 FMP605 45.67 43.32 9.51 1.50
SS 10 15 335.47 FMP1 FMP51 FMP338 FMP606 45.26 42.74 10.10 1.91
SS 12 33 638.20 FMP1 FMP54 FMP341 FMP607 45.40 40.40 11.86 2.33
SS 14 41 891.11 FMP1 FMP57 FMP344 FMP608 44.68 37.65 13.82 3.84
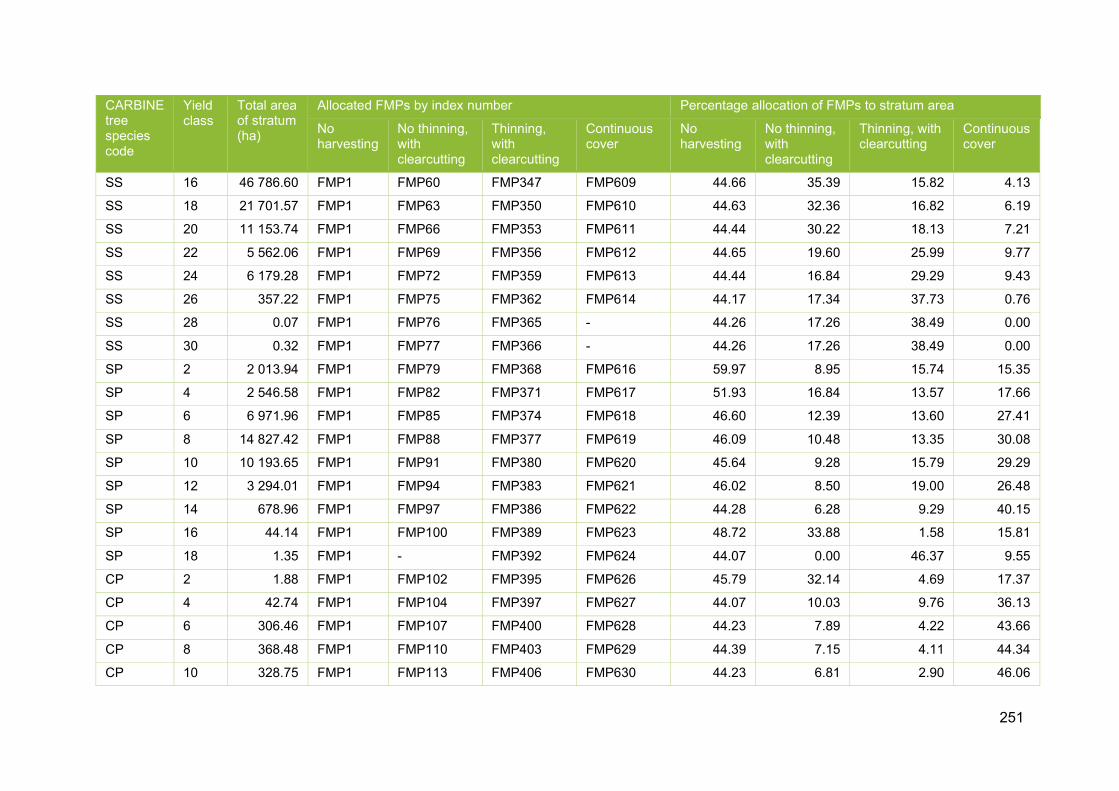
251
CARBINE tree species code
Yield class
Total area of stratum (ha)
Allocated FMPs by index number Percentage allocation of FMPs to stratum area
No harvesting
No thinning, with clearcutting
Thinning, with clearcutting
Continuous cover
No harvesting
No thinning, with clearcutting
Thinning, with clearcutting
Continuous cover
SS 16 46 786.60 FMP1 FMP60 FMP347 FMP609 44.66 35.39 15.82 4.13
SS 18 21 701.57 FMP1 FMP63 FMP350 FMP610 44.63 32.36 16.82 6.19
SS 20 11 153.74 FMP1 FMP66 FMP353 FMP611 44.44 30.22 18.13 7.21
SS 22 5 562.06 FMP1 FMP69 FMP356 FMP612 44.65 19.60 25.99 9.77
SS 24 6 179.28 FMP1 FMP72 FMP359 FMP613 44.44 16.84 29.29 9.43
SS 26 357.22 FMP1 FMP75 FMP362 FMP614 44.17 17.34 37.73 0.76
SS 28 0.07 FMP1 FMP76 FMP365 - 44.26 17.26 38.49 0.00
SS 30 0.32 FMP1 FMP77 FMP366 - 44.26 17.26 38.49 0.00
SP 2 2 013.94 FMP1 FMP79 FMP368 FMP616 59.97 8.95 15.74 15.35
SP 4 2 546.58 FMP1 FMP82 FMP371 FMP617 51.93 16.84 13.57 17.66
SP 6 6 971.96 FMP1 FMP85 FMP374 FMP618 46.60 12.39 13.60 27.41
SP 8 14 827.42 FMP1 FMP88 FMP377 FMP619 46.09 10.48 13.35 30.08
SP 10 10 193.65 FMP1 FMP91 FMP380 FMP620 45.64 9.28 15.79 29.29
SP 12 3 294.01 FMP1 FMP94 FMP383 FMP621 46.02 8.50 19.00 26.48
SP 14 678.96 FMP1 FMP97 FMP386 FMP622 44.28 6.28 9.29 40.15
SP 16 44.14 FMP1 FMP100 FMP389 FMP623 48.72 33.88 1.58 15.81
SP 18 1.35 FMP1 - FMP392 FMP624 44.07 0.00 46.37 9.55
CP 2 1.88 FMP1 FMP102 FMP395 FMP626 45.79 32.14 4.69 17.37
CP 4 42.74 FMP1 FMP104 FMP397 FMP627 44.07 10.03 9.76 36.13
CP 6 306.46 FMP1 FMP107 FMP400 FMP628 44.23 7.89 4.22 43.66
CP 8 368.48 FMP1 FMP110 FMP403 FMP629 44.39 7.15 4.11 44.34
CP 10 328.75 FMP1 FMP113 FMP406 FMP630 44.23 6.81 2.90 46.06
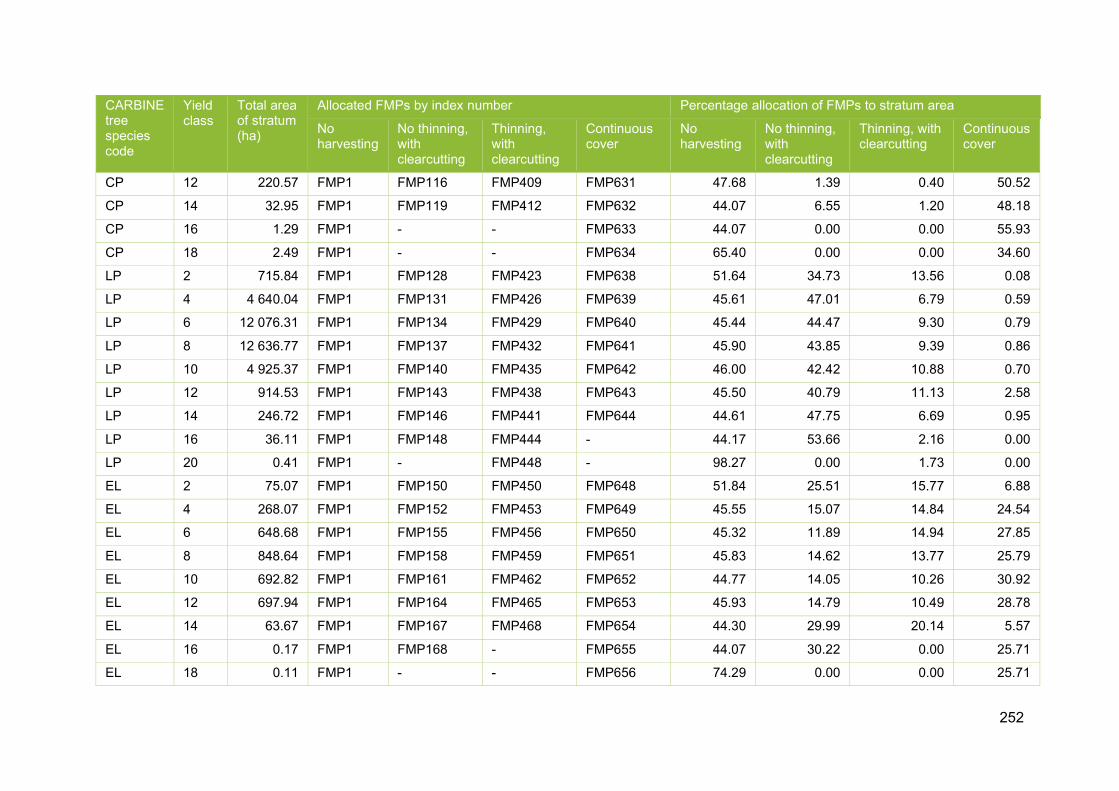
252
CARBINE tree species code
Yield class
Total area of stratum (ha)
Allocated FMPs by index number Percentage allocation of FMPs to stratum area
No harvesting
No thinning, with clearcutting
Thinning, with clearcutting
Continuous cover
No harvesting
No thinning, with clearcutting
Thinning, with clearcutting
Continuous cover
CP 12 220.57 FMP1 FMP116 FMP409 FMP631 47.68 1.39 0.40 50.52
CP 14 32.95 FMP1 FMP119 FMP412 FMP632 44.07 6.55 1.20 48.18
CP 16 1.29 FMP1 - - FMP633 44.07 0.00 0.00 55.93
CP 18 2.49 FMP1 - - FMP634 65.40 0.00 0.00 34.60
LP 2 715.84 FMP1 FMP128 FMP423 FMP638 51.64 34.73 13.56 0.08
LP 4 4 640.04 FMP1 FMP131 FMP426 FMP639 45.61 47.01 6.79 0.59
LP 6 12 076.31 FMP1 FMP134 FMP429 FMP640 45.44 44.47 9.30 0.79
LP 8 12 636.77 FMP1 FMP137 FMP432 FMP641 45.90 43.85 9.39 0.86
LP 10 4 925.37 FMP1 FMP140 FMP435 FMP642 46.00 42.42 10.88 0.70
LP 12 914.53 FMP1 FMP143 FMP438 FMP643 45.50 40.79 11.13 2.58
LP 14 246.72 FMP1 FMP146 FMP441 FMP644 44.61 47.75 6.69 0.95
LP 16 36.11 FMP1 FMP148 FMP444 - 44.17 53.66 2.16 0.00
LP 20 0.41 FMP1 - FMP448 - 98.27 0.00 1.73 0.00
EL 2 75.07 FMP1 FMP150 FMP450 FMP648 51.84 25.51 15.77 6.88
EL 4 268.07 FMP1 FMP152 FMP453 FMP649 45.55 15.07 14.84 24.54
EL 6 648.68 FMP1 FMP155 FMP456 FMP650 45.32 11.89 14.94 27.85
EL 8 848.64 FMP1 FMP158 FMP459 FMP651 45.83 14.62 13.77 25.79
EL 10 692.82 FMP1 FMP161 FMP462 FMP652 44.77 14.05 10.26 30.92
EL 12 697.94 FMP1 FMP164 FMP465 FMP653 45.93 14.79 10.49 28.78
EL 14 63.67 FMP1 FMP167 FMP468 FMP654 44.30 29.99 20.14 5.57
EL 16 0.17 FMP1 FMP168 - FMP655 44.07 30.22 0.00 25.71
EL 18 0.11 FMP1 - - FMP656 74.29 0.00 0.00 25.71

253
CARBINE tree species code
Yield class
Total area of stratum (ha)
Allocated FMPs by index number Percentage allocation of FMPs to stratum area
No harvesting
No thinning, with clearcutting
Thinning, with clearcutting
Continuous cover
No harvesting
No thinning, with clearcutting
Thinning, with clearcutting
Continuous cover
JL 2 206.45 FMP1 FMP170 FMP474 FMP657 49.57 35.97 6.55 7.91
JL 4 1 388.99 FMP1 FMP173 FMP477 FMP658 46.00 34.47 11.88 7.66
JL 6 2 629.57 FMP1 FMP176 FMP480 FMP659 44.99 28.64 15.61 10.76
JL 8 4 739.09 FMP1 FMP179 FMP483 FMP660 45.08 24.17 16.45 14.29
JL 10 5 309.96 FMP1 FMP182 FMP486 FMP661 45.18 22.01 17.30 15.50
JL 12 3 931.84 FMP1 FMP185 FMP489 FMP662 45.26 24.48 14.45 15.80
JL 14 1 625.04 FMP1 FMP188 FMP492 FMP663 44.88 25.13 15.80 14.19
JL 16 157.47 FMP1 FMP191 FMP495 FMP664 44.56 11.88 39.60 3.96
JL 18 0.30 FMP1 - - FMP665 44.07 0.00 0.00 55.93
JL 20 0.48 FMP1 FMP193 - FMP666 44.07 48.94 0.00 6.99
DF 2 16.37 FMP1 FMP195 FMP501 FMP668 52.34 6.51 16.01 25.15
DF 4 10.34 FMP1 - FMP504 FMP669 44.07 0.00 1.24 54.69
DF 6 24.13 FMP1 FMP197 FMP506 FMP670 45.63 36.65 1.29 16.42
DF 8 139.55 FMP1 FMP199 FMP509 FMP671 44.79 14.19 16.84 24.18
DF 10 452.20 FMP1 FMP202 FMP512 FMP672 44.68 14.06 20.49 20.77
DF 12 756.76 FMP1 FMP205 FMP515 FMP673 44.84 16.66 19.76 18.74
DF 14 990.63 FMP1 FMP208 FMP518 FMP674 44.62 13.57 16.06 25.75
DF 16 1 075.01 FMP1 FMP211 FMP521 FMP675 44.39 10.54 15.69 29.38
DF 18 600.17 FMP1 FMP214 FMP524 FMP676 44.51 8.65 22.17 24.67
DF 20 367.47 FMP1 FMP217 FMP527 FMP677 44.68 13.25 19.19 22.88
DF 22 156.96 FMP1 FMP220 FMP530 FMP678 44.34 13.36 19.98 22.32
DF 24 148.24 FMP1 FMP223 FMP533 FMP679 44.08 19.44 10.70 25.78

254
CARBINE tree species code
Yield class
Total area of stratum (ha)
Allocated FMPs by index number Percentage allocation of FMPs to stratum area
No harvesting
No thinning, with clearcutting
Thinning, with clearcutting
Continuous cover
No harvesting
No thinning, with clearcutting
Thinning, with clearcutting
Continuous cover
DF 26 1.25 FMP1 FMP225 - FMP680 44.07 15.39 0.00 40.54
GF 2 6.83 FMP1 FMP226 FMP536 FMP681 57.59 26.35 8.94 7.12
GF 4 3.53 FMP1 FMP227 FMP537 - 44.07 16.70 39.23 0.00
GF 6 0.19 FMP1 - - FMP683 44.07 0.00 0.00 55.93
GF 8 3.05 FMP1 FMP228 - FMP684 45.18 14.35 0.00 40.47
GF 10 12.41 FMP1 FMP229 FMP540 FMP685 45.60 27.71 12.20 14.48
GF 12 42.24 FMP1 FMP231 FMP541 FMP686 51.08 17.02 14.79 17.12
GF 14 38.04 FMP1 FMP233 FMP542 FMP687 46.86 21.70 12.46 18.99
GF 16 46.87 FMP1 FMP235 FMP543 FMP688 44.72 14.23 24.25 16.81
GF 18 27.55 FMP1 FMP237 FMP544 FMP689 45.75 16.23 8.85 29.16
GF 20 45.37 FMP1 FMP239 FMP545 FMP690 44.35 15.37 21.67 18.61
GF 22 31.72 FMP1 FMP241 FMP546 FMP691 44.87 7.53 9.63 37.97
GF 24 12.96 FMP1 FMP243 FMP547 FMP692 44.07 5.45 12.30 38.17
GF 26 7.56 FMP1 FMP245 FMP548 FMP693 46.49 2.76 21.32 29.44
GF 28 10.19 FMP1 FMP247 FMP549 FMP694 44.10 0.55 0.44 54.91
GF 30 5.69 FMP1 FMP248 FMP550 - 44.24 0.41 55.35 0.00
NF 2 22.56 FMP1 FMP249 FMP551 FMP696 46.04 19.00 13.82 21.13
NF 4 14.83 FMP1 FMP250 FMP552 FMP697 46.26 21.85 0.03 31.87
NF 6 7.74 FMP1 FMP251 FMP553 FMP698 46.77 39.04 9.34 4.85
NF 8 31.74 FMP1 FMP252 FMP554 FMP699 49.81 38.58 2.53 9.08
NF 10 74.29 FMP1 FMP253 FMP555 FMP700 46.96 36.17 14.59 2.28
NF 12 121.96 FMP1 FMP254 FMP556 FMP701 46.78 33.25 14.24 5.73

255
CARBINE tree species code
Yield class
Total area of stratum (ha)
Allocated FMPs by index number Percentage allocation of FMPs to stratum area
No harvesting
No thinning, with clearcutting
Thinning, with clearcutting
Continuous cover
No harvesting
No thinning, with clearcutting
Thinning, with clearcutting
Continuous cover
NF 14 125.96 FMP1 FMP255 FMP557 FMP702 44.59 34.00 14.80 6.61
NF 16 86.73 FMP1 FMP256 FMP558 FMP703 45.38 25.11 20.18 9.33
NF 18 31.10 FMP1 FMP257 FMP559 FMP704 45.91 24.49 6.72 22.87
NF 20 22.54 FMP1 FMP258 FMP560 FMP705 47.36 32.22 6.89 13.53
NF 22 42.92 FMP1 FMP259 FMP561 FMP706 44.64 23.40 9.96 22.00
NF 24 5.29 FMP1 FMP260 FMP562 FMP707 45.44 9.75 4.57 40.23
NF 26 0.16 FMP1 FMP261 - - 44.63 55.37 0.00 0.00
NF 28 0.41 FMP1 FMP262 - - 44.63 55.37 0.00 0.00
WH 2 6.23 FMP1 FMP263 FMP563 FMP708 45.11 18.70 0.90 35.29
WH 4 2.55 FMP1 FMP264 FMP564 FMP709 61.88 15.90 0.55 21.67
WH 6 8.13 FMP1 FMP265 FMP565 FMP710 51.24 4.83 1.09 42.85
WH 8 24.54 FMP1 FMP266 FMP566 FMP711 45.48 16.48 0.94 37.09
WH 10 27.98 FMP1 FMP267 FMP567 FMP712 51.67 19.97 14.48 13.87
WH 12 95.23 FMP1 FMP268 FMP568 FMP713 46.84 24.76 13.82 14.58
WH 14 98.05 FMP1 FMP269 FMP569 FMP714 46.63 26.31 11.84 15.22
WH 16 70.76 FMP1 FMP270 FMP570 FMP715 44.99 27.50 8.54 18.96
WH 18 67.54 FMP1 FMP271 FMP571 FMP716 44.75 34.39 14.96 5.89
WH 20 42.29 FMP1 FMP272 FMP572 FMP717 44.19 29.01 11.49 15.32
WH 22 23.27 FMP1 FMP273 FMP573 - 48.96 24.51 26.53 0.00
WH 24 17.13 FMP1 FMP274 FMP574 - 46.65 31.90 21.45 0.00
WH 26 3.64 FMP1 FMP275 FMP575 - 61.86 36.34 1.81 0.00
RC 2 3.33 FMP1 FMP276 - FMP721 49.72 24.33 0.00 25.95

256
CARBINE tree species code
Yield class
Total area of stratum (ha)
Allocated FMPs by index number Percentage allocation of FMPs to stratum area
No harvesting
No thinning, with clearcutting
Thinning, with clearcutting
Continuous cover
No harvesting
No thinning, with clearcutting
Thinning, with clearcutting
Continuous cover
RC 4 5.27 FMP1 FMP277 - FMP722 44.89 8.61 0.00 46.50
RC 6 3.72 FMP1 FMP278 FMP578 FMP723 44.17 10.70 15.47 29.67
RC 8 13.41 FMP1 FMP279 FMP579 FMP724 48.95 9.40 38.88 2.77
RC 10 11.03 FMP1 FMP280 FMP580 FMP725 45.88 16.96 27.21 9.95
RC 12 26.60 FMP1 FMP281 FMP581 FMP726 45.18 13.80 11.94 29.08
RC 14 19.51 FMP1 FMP282 FMP582 FMP727 45.23 29.31 3.93 21.54
RC 16 20.60 FMP1 FMP283 FMP583 FMP728 45.25 29.10 17.62 8.03
RC 18 9.53 FMP1 FMP284 FMP584 FMP729 46.88 35.90 3.53 13.68
RC 20 6.91 FMP1 FMP285 FMP585 - 44.07 50.80 5.12 0.00
RC 22 0.16 FMP1 FMP286 FMP586 - 44.38 50.98 4.63 0.00
RC 24 0.87 FMP1 FMP287 FMP587 - 44.87 6.40 48.73 0.00
OK 2 1 096.32 FMP1 - - FMP733 97.37 0.00 0.00 2.63
OK 4 1 168.94 FMP1 - - FMP734 97.47 0.00 0.00 2.53
OK 6 199.02 FMP1 - - FMP735 97.41 0.00 0.00 2.59
OK 8 22.10 FMP1 - - FMP736 96.70 0.00 0.00 3.30
OK 10 6.10 FMP1 - - FMP737 96.83 0.00 0.00 3.17
OK 12 1.31 FMP1 - - FMP738 98.07 0.00 0.00 1.93
OK 14 4.19 FMP1 - - FMP739 98.55 0.00 0.00 1.45
OK 16 2.45 FMP1 - - FMP740 96.70 0.00 0.00 3.30
AH 2 126.39 FMP1 - - FMP742 97.62 0.00 0.00 2.38
AH 4 120.58 FMP1 - - FMP743 97.75 0.00 0.00 2.25
AH 6 98.53 FMP1 - - FMP744 97.45 0.00 0.00 2.55

257
CARBINE tree species code
Yield class
Total area of stratum (ha)
Allocated FMPs by index number Percentage allocation of FMPs to stratum area
No harvesting
No thinning, with clearcutting
Thinning, with clearcutting
Continuous cover
No harvesting
No thinning, with clearcutting
Thinning, with clearcutting
Continuous cover
AH 8 87.39 FMP1 - - FMP745 98.03 0.00 0.00 1.97
AH 10 4.55 FMP1 - - FMP746 98.18 0.00 0.00 1.82
AH 12 2.58 FMP1 - - FMP747 98.15 0.00 0.00 1.85
AH 16 0.46 FMP1 - - FMP749 97.51 0.00 0.00 2.49
AH 20 0.83 FMP1 - - FMP751 97.17 0.00 0.00 2.83
BE 2 154.34 FMP1 - - FMP752 96.92 0.00 0.00 3.08
BE 4 194.61 FMP1 - - FMP753 97.63 0.00 0.00 2.37
BE 6 216.75 FMP1 - - FMP754 97.61 0.00 0.00 2.39
BE 8 38.31 FMP1 - - FMP755 96.80 0.00 0.00 3.20
BE 10 5.50 FMP1 - - FMP756 97.10 0.00 0.00 2.90
BE 12 1.45 FMP1 - - FMP757 96.70 0.00 0.00 3.30
BE 14 1.38 FMP1 - - FMP758 96.70 0.00 0.00 3.30
BE 18 0.13 FMP1 - - FMP760 96.70 0.00 0.00 3.30
BI 2 6 092.91 FMP1 - - FMP761 97.62 0.00 0.00 2.38
BI 4 3 696.68 FMP1 - - FMP762 97.75 0.00 0.00 2.25
BI 6 1 370.76 FMP1 - - FMP763 97.45 0.00 0.00 2.55
BI 8 222.23 FMP1 - - FMP764 98.03 0.00 0.00 1.97
BI 10 79.89 FMP1 - - FMP765 98.18 0.00 0.00 1.82
BI 12 42.33 FMP1 - - FMP766 98.15 0.00 0.00 1.85
BI 14 17.17 FMP1 - - FMP767 98.43 0.00 0.00 1.57
BI 16 2.58 FMP1 - - FMP768 97.51 0.00 0.00 2.49
BI 18 0.81 FMP1 - - FMP769 97.36 0.00 0.00 2.64

258
CARBINE tree species code
Yield class
Total area of stratum (ha)
Allocated FMPs by index number Percentage allocation of FMPs to stratum area
No harvesting
No thinning, with clearcutting
Thinning, with clearcutting
Continuous cover
No harvesting
No thinning, with clearcutting
Thinning, with clearcutting
Continuous cover
BI 22 0.09 FMP1 - - FMP771 97.17 0.00 0.00 2.83
SY 2 7 523.46 FMP1 - - FMP772 97.62 0.00 0.00 2.38
SY 4 3 256.77 FMP1 - - FMP773 97.75 0.00 0.00 2.25
SY 6 1 548.72 FMP1 - - FMP774 97.45 0.00 0.00 2.55
SY 8 176.70 FMP1 - - FMP775 98.03 0.00 0.00 1.97
SY 10 50.77 FMP1 - - FMP776 98.18 0.00 0.00 1.82
SY 12 94.36 FMP1 - - FMP777 98.15 0.00 0.00 1.85
SY 14 41.15 FMP1 - - FMP778 98.43 0.00 0.00 1.57
SY 16 11.53 FMP1 - - FMP779 97.51 0.00 0.00 2.49
SY 18 14.60 FMP1 - - FMP780 97.36 0.00 0.00 2.64
SY 20 1.04 FMP1 - - FMP781 97.17 0.00 0.00 2.83
SY 24 0.10 FMP1 - - FMP783 97.17 0.00 0.00 2.83
PO 2 24.14 FMP1 - - FMP784 97.62 0.00 0.00 2.38
PO 4 23.54 FMP1 - - FMP785 97.75 0.00 0.00 2.25
PO 6 10.32 FMP1 - - FMP786 97.45 0.00 0.00 2.55
PO 8 6.27 FMP1 - - FMP787 98.03 0.00 0.00 1.97
PO 10 1.00 FMP1 - - FMP788 98.18 0.00 0.00 1.82
PO 12 0.15 FMP1 - - FMP789 98.15 0.00 0.00 1.85
PO 14 0.13 FMP1 - - FMP790 98.43 0.00 0.00 1.57
NO 2 1.02 FMP1 - - FMP793 97.62 0.00 0.00 2.38
NO 4 2.69 FMP1 - - FMP794 97.75 0.00 0.00 2.25
NO 6 1.10 FMP1 - - FMP795 97.45 0.00 0.00 2.55
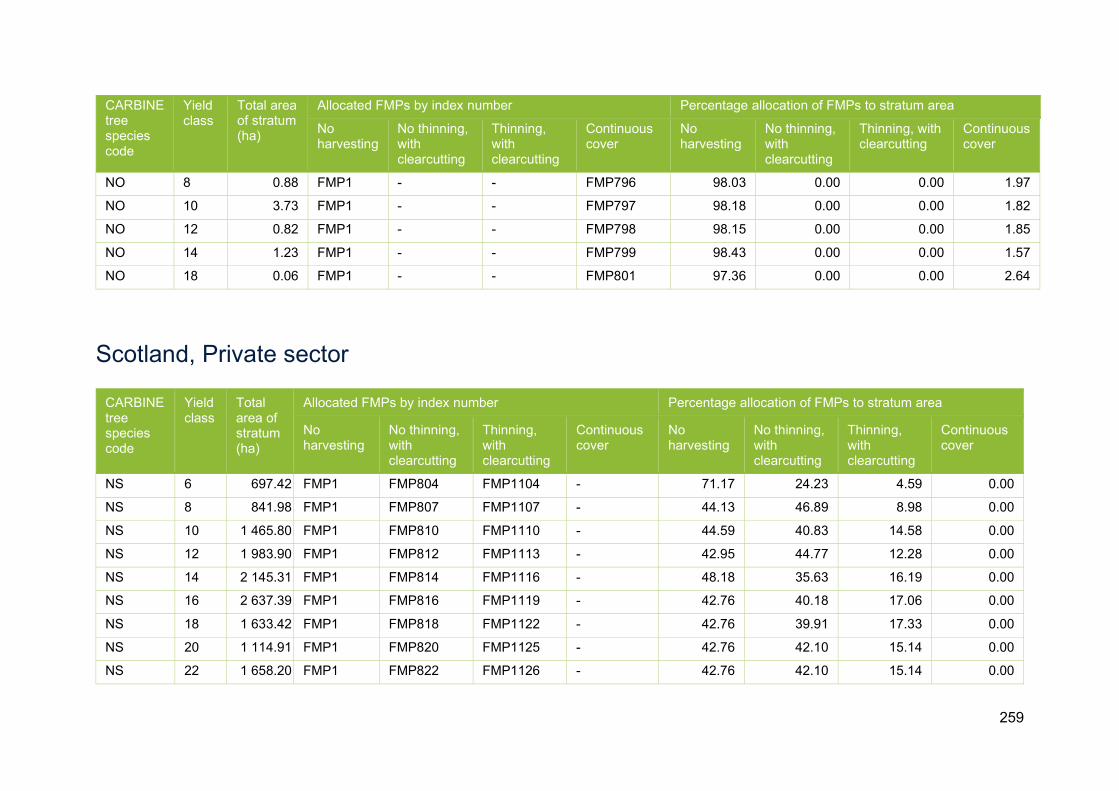
259
CARBINE tree species code
Yield class
Total area of stratum (ha)
Allocated FMPs by index number Percentage allocation of FMPs to stratum area
No harvesting
No thinning, with clearcutting
Thinning, with clearcutting
Continuous cover
No harvesting
No thinning, with clearcutting
Thinning, with clearcutting
Continuous cover
NO 8 0.88 FMP1 - - FMP796 98.03 0.00 0.00 1.97
NO 10 3.73 FMP1 - - FMP797 98.18 0.00 0.00 1.82
NO 12 0.82 FMP1 - - FMP798 98.15 0.00 0.00 1.85
NO 14 1.23 FMP1 - - FMP799 98.43 0.00 0.00 1.57
NO 18 0.06 FMP1 - - FMP801 97.36 0.00 0.00 2.64
Scotland, Private sector
CARBINE tree species code
Yield class
Total area of stratum (ha)
Allocated FMPs by index number Percentage allocation of FMPs to stratum area
No harvesting
No thinning, with clearcutting
Thinning, with clearcutting
Continuous cover
No harvesting
No thinning, with clearcutting
Thinning, with clearcutting
Continuous cover
NS 6 697.42 FMP1 FMP804 FMP1104 - 71.17 24.23 4.59 0.00
NS 8 841.98 FMP1 FMP807 FMP1107 - 44.13 46.89 8.98 0.00
NS 10 1 465.80 FMP1 FMP810 FMP1110 - 44.59 40.83 14.58 0.00
NS 12 1 983.90 FMP1 FMP812 FMP1113 - 42.95 44.77 12.28 0.00
NS 14 2 145.31 FMP1 FMP814 FMP1116 - 48.18 35.63 16.19 0.00
NS 16 2 637.39 FMP1 FMP816 FMP1119 - 42.76 40.18 17.06 0.00
NS 18 1 633.42 FMP1 FMP818 FMP1122 - 42.76 39.91 17.33 0.00
NS 20 1 114.91 FMP1 FMP820 FMP1125 - 42.76 42.10 15.14 0.00
NS 22 1 658.20 FMP1 FMP822 FMP1126 - 42.76 42.10 15.14 0.00

260
CARBINE tree species code
Yield class
Total area of stratum (ha)
Allocated FMPs by index number Percentage allocation of FMPs to stratum area
No harvesting
No thinning, with clearcutting
Thinning, with clearcutting
Continuous cover
No harvesting
No thinning, with clearcutting
Thinning, with clearcutting
Continuous cover
SS 6 18 055.56 FMP1 FMP824 FMP1129 - 44.16 50.48 5.36 0.00
SS 8 18 425.92 FMP1 FMP827 FMP1131 - 43.05 51.58 5.36 0.00
SS 10 25 210.01 FMP1 FMP830 FMP1133 - 43.88 49.42 6.70 0.00
SS 12 33 018.28 FMP1 FMP832 FMP1135 - 42.89 48.21 8.90 0.00
SS 14 42 390.75 FMP1 FMP835 FMP1138 - 42.98 47.08 9.94 0.00
SS 16 38 227.05 FMP1 FMP838 FMP1141 - 42.84 47.09 10.07 0.00
SS 18 36 751.30 FMP1 FMP841 FMP1144 - 42.88 45.90 11.21 0.00
SS 20 32 428.01 FMP1 FMP844 FMP1147 - 43.40 47.15 9.45 0.00
SS 22 20 841.30 FMP1 FMP847 FMP1150 - 42.82 49.54 7.64 0.00
SS 24 30 048.22 FMP1 FMP850 FMP1153 - 42.86 47.48 9.66 0.00
SS 26 1 732.42 FMP1 FMP852 FMP1156 - 42.82 47.51 9.67 0.00
SS 28 0.33 FMP1 FMP854 FMP1159 - 42.82 47.52 9.67 0.00
SS 30 1.57 FMP1 FMP855 FMP1160 - 42.82 47.51 9.67 0.00
SP 4 24 010.47 FMP1 FMP857 FMP1162 - 77.10 15.51 7.39 0.00
SP 6 11 334.27 FMP1 FMP860 FMP1165 - 52.86 27.84 19.30 0.00
SP 8 18 896.55 FMP1 FMP863 FMP1168 - 47.58 17.05 35.37 0.00
SP 10 21 910.04 FMP1 FMP866 FMP1171 - 44.93 19.16 35.92 0.00
SP 12 19 605.13 FMP1 FMP869 FMP1174 - 44.25 20.45 35.30 0.00
SP 14 21 552.95 FMP1 FMP872 FMP1177 - 43.44 48.46 8.10 0.00
CP 4 25.35 FMP1 FMP877 FMP1181 - 42.76 24.98 32.26 0.00
CP 6 205.07 FMP1 FMP878 FMP1184 - 43.08 24.84 32.08 0.00
CP 8 341.38 FMP1 FMP879 FMP1187 - 42.79 24.97 32.24 0.00

261
CARBINE tree species code
Yield class
Total area of stratum (ha)
Allocated FMPs by index number Percentage allocation of FMPs to stratum area
No harvesting
No thinning, with clearcutting
Thinning, with clearcutting
Continuous cover
No harvesting
No thinning, with clearcutting
Thinning, with clearcutting
Continuous cover
CP 10 577.42 FMP1 FMP880 FMP1190 - 42.76 24.98 32.26 0.00
CP 12 857.15 FMP1 FMP881 FMP1193 - 42.76 24.98 32.26 0.00
CP 14 315.41 FMP1 FMP877 FMP1196 - 42.76 24.98 32.26 0.00
LP 4 2 950.23 FMP1 FMP883 FMP1206 - 42.76 51.52 5.72 0.00
LP 6 8 388.64 FMP1 FMP886 FMP1209 - 43.26 49.83 6.91 0.00
LP 8 12 251.09 FMP1 FMP889 FMP1212 - 42.85 50.04 7.11 0.00
LP 10 9 046.53 FMP1 FMP892 FMP1215 - 43.07 50.34 6.59 0.00
LP 12 3 479.88 FMP1 FMP895 FMP1218 - 42.76 51.75 5.49 0.00
LP 14 2 078.44 FMP1 FMP898 FMP1221 - 42.76 55.34 1.90 0.00
LP 20 78.03 FMP1 FMP903 FMP1226 - 42.76 55.34 1.90 0.00
EL 2 146.63 FMP1 FMP905 FMP1228 - 42.76 17.17 40.07 0.00
EL 4 621.88 FMP1 FMP907 FMP1230 - 47.18 15.85 36.97 0.00
EL 6 1 318.22 FMP1 FMP910 FMP1233 - 44.93 35.13 19.94 0.00
EL 8 913.63 FMP1 FMP913 FMP1236 - 42.83 34.98 22.19 0.00
EL 10 933.99 FMP1 FMP916 FMP1239 - 43.46 16.96 39.58 0.00
EL 12 928.09 FMP1 FMP919 FMP1242 - 44.26 16.72 39.02 0.00
EL 14 214.14 FMP1 FMP922 FMP1245 - 49.11 15.27 35.62 0.00
JL 2 375.73 FMP1 FMP925 FMP1248 - 42.86 44.26 12.88 0.00
JL 4 3 176.06 FMP1 FMP927 FMP1250 - 50.64 38.23 11.13 0.00
JL 6 5 547.01 FMP1 FMP930 FMP1253 - 47.16 39.77 13.08 0.00
JL 8 5 248.15 FMP1 FMP933 FMP1256 - 43.27 43.62 13.11 0.00
JL 10 7 409.08 FMP1 FMP936 FMP1259 - 43.58 44.81 11.61 0.00
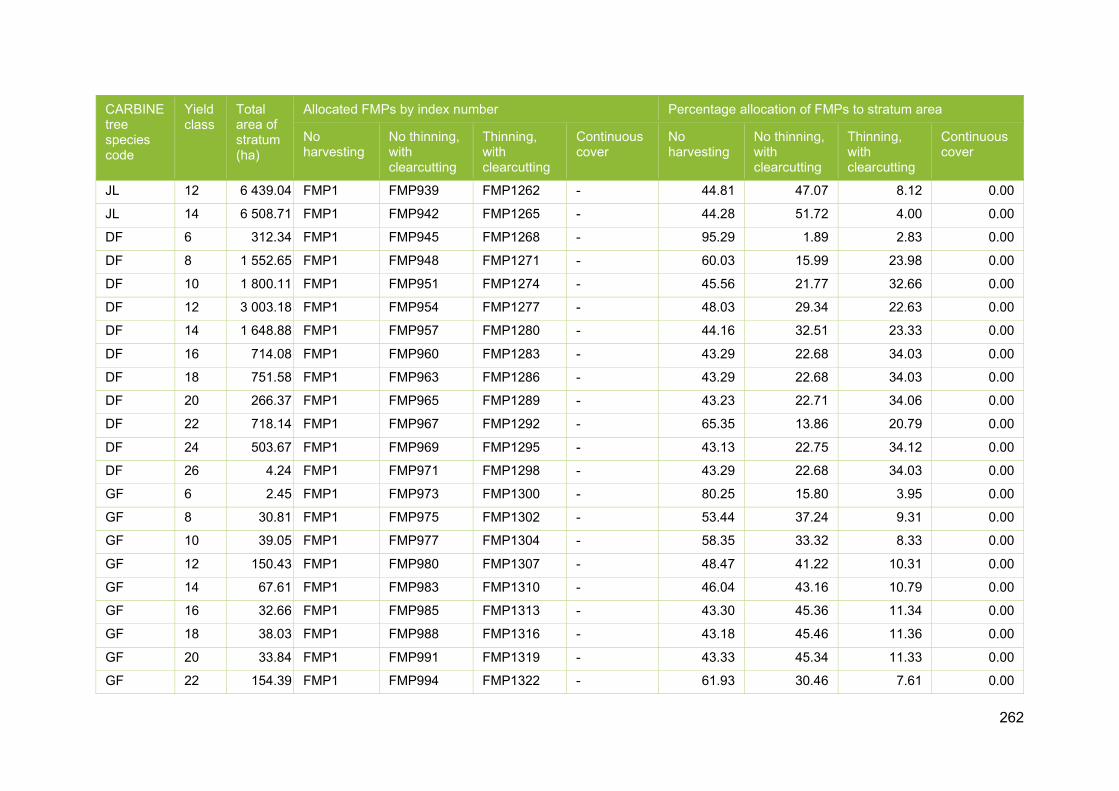
262
CARBINE tree species code
Yield class
Total area of stratum (ha)
Allocated FMPs by index number Percentage allocation of FMPs to stratum area
No harvesting
No thinning, with clearcutting
Thinning, with clearcutting
Continuous cover
No harvesting
No thinning, with clearcutting
Thinning, with clearcutting
Continuous cover
JL 12 6 439.04 FMP1 FMP939 FMP1262 - 44.81 47.07 8.12 0.00
JL 14 6 508.71 FMP1 FMP942 FMP1265 - 44.28 51.72 4.00 0.00
DF 6 312.34 FMP1 FMP945 FMP1268 - 95.29 1.89 2.83 0.00
DF 8 1 552.65 FMP1 FMP948 FMP1271 - 60.03 15.99 23.98 0.00
DF 10 1 800.11 FMP1 FMP951 FMP1274 - 45.56 21.77 32.66 0.00
DF 12 3 003.18 FMP1 FMP954 FMP1277 - 48.03 29.34 22.63 0.00
DF 14 1 648.88 FMP1 FMP957 FMP1280 - 44.16 32.51 23.33 0.00
DF 16 714.08 FMP1 FMP960 FMP1283 - 43.29 22.68 34.03 0.00
DF 18 751.58 FMP1 FMP963 FMP1286 - 43.29 22.68 34.03 0.00
DF 20 266.37 FMP1 FMP965 FMP1289 - 43.23 22.71 34.06 0.00
DF 22 718.14 FMP1 FMP967 FMP1292 - 65.35 13.86 20.79 0.00
DF 24 503.67 FMP1 FMP969 FMP1295 - 43.13 22.75 34.12 0.00
DF 26 4.24 FMP1 FMP971 FMP1298 - 43.29 22.68 34.03 0.00
GF 6 2.45 FMP1 FMP973 FMP1300 - 80.25 15.80 3.95 0.00
GF 8 30.81 FMP1 FMP975 FMP1302 - 53.44 37.24 9.31 0.00
GF 10 39.05 FMP1 FMP977 FMP1304 - 58.35 33.32 8.33 0.00
GF 12 150.43 FMP1 FMP980 FMP1307 - 48.47 41.22 10.31 0.00
GF 14 67.61 FMP1 FMP983 FMP1310 - 46.04 43.16 10.79 0.00
GF 16 32.66 FMP1 FMP985 FMP1313 - 43.30 45.36 11.34 0.00
GF 18 38.03 FMP1 FMP988 FMP1316 - 43.18 45.46 11.36 0.00
GF 20 33.84 FMP1 FMP991 FMP1319 - 43.33 45.34 11.33 0.00
GF 22 154.39 FMP1 FMP994 FMP1322 - 61.93 30.46 7.61 0.00
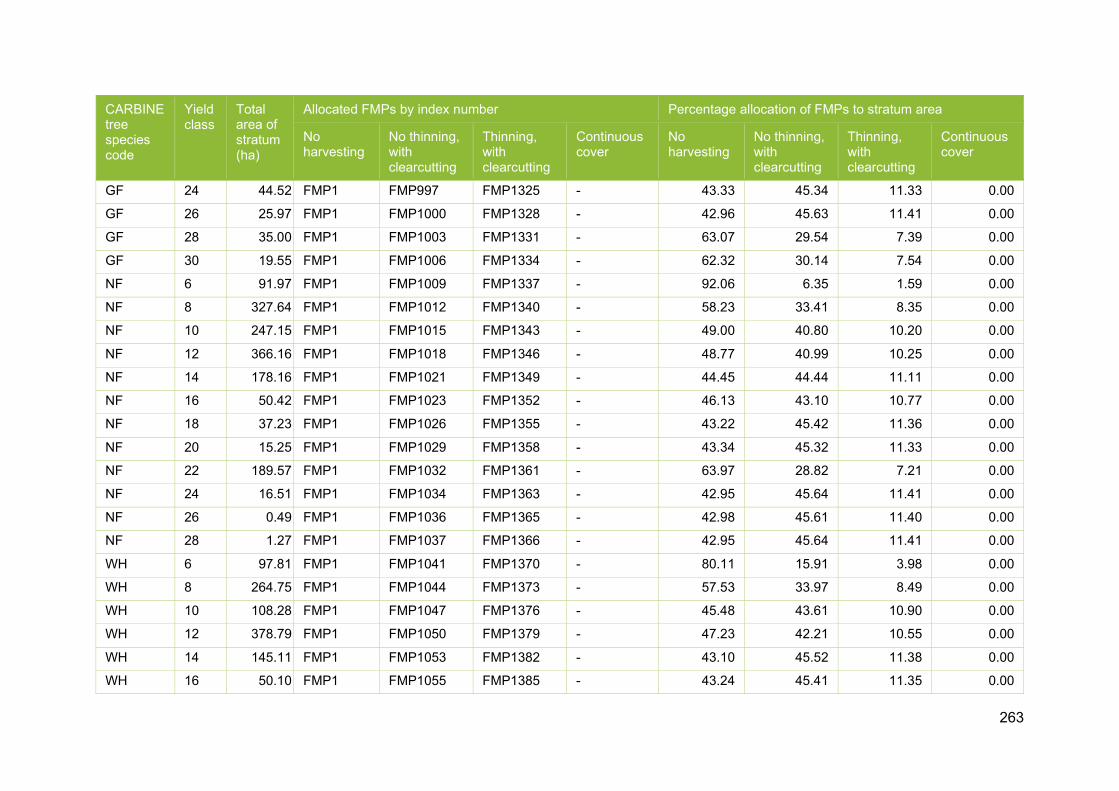
263
CARBINE tree species code
Yield class
Total area of stratum (ha)
Allocated FMPs by index number Percentage allocation of FMPs to stratum area
No harvesting
No thinning, with clearcutting
Thinning, with clearcutting
Continuous cover
No harvesting
No thinning, with clearcutting
Thinning, with clearcutting
Continuous cover
GF 24 44.52 FMP1 FMP997 FMP1325 - 43.33 45.34 11.33 0.00
GF 26 25.97 FMP1 FMP1000 FMP1328 - 42.96 45.63 11.41 0.00
GF 28 35.00 FMP1 FMP1003 FMP1331 - 63.07 29.54 7.39 0.00
GF 30 19.55 FMP1 FMP1006 FMP1334 - 62.32 30.14 7.54 0.00
NF 6 91.97 FMP1 FMP1009 FMP1337 - 92.06 6.35 1.59 0.00
NF 8 327.64 FMP1 FMP1012 FMP1340 - 58.23 33.41 8.35 0.00
NF 10 247.15 FMP1 FMP1015 FMP1343 - 49.00 40.80 10.20 0.00
NF 12 366.16 FMP1 FMP1018 FMP1346 - 48.77 40.99 10.25 0.00
NF 14 178.16 FMP1 FMP1021 FMP1349 - 44.45 44.44 11.11 0.00
NF 16 50.42 FMP1 FMP1023 FMP1352 - 46.13 43.10 10.77 0.00
NF 18 37.23 FMP1 FMP1026 FMP1355 - 43.22 45.42 11.36 0.00
NF 20 15.25 FMP1 FMP1029 FMP1358 - 43.34 45.32 11.33 0.00
NF 22 189.57 FMP1 FMP1032 FMP1361 - 63.97 28.82 7.21 0.00
NF 24 16.51 FMP1 FMP1034 FMP1363 - 42.95 45.64 11.41 0.00
NF 26 0.49 FMP1 FMP1036 FMP1365 - 42.98 45.61 11.40 0.00
NF 28 1.27 FMP1 FMP1037 FMP1366 - 42.95 45.64 11.41 0.00
WH 6 97.81 FMP1 FMP1041 FMP1370 - 80.11 15.91 3.98 0.00
WH 8 264.75 FMP1 FMP1044 FMP1373 - 57.53 33.97 8.49 0.00
WH 10 108.28 FMP1 FMP1047 FMP1376 - 45.48 43.61 10.90 0.00
WH 12 378.79 FMP1 FMP1050 FMP1379 - 47.23 42.21 10.55 0.00
WH 14 145.11 FMP1 FMP1053 FMP1382 - 43.10 45.52 11.38 0.00
WH 16 50.10 FMP1 FMP1055 FMP1385 - 43.24 45.41 11.35 0.00

264
CARBINE tree species code
Yield class
Total area of stratum (ha)
Allocated FMPs by index number Percentage allocation of FMPs to stratum area
No harvesting
No thinning, with clearcutting
Thinning, with clearcutting
Continuous cover
No harvesting
No thinning, with clearcutting
Thinning, with clearcutting
Continuous cover
WH 18 91.60 FMP1 FMP1058 FMP1388 - 43.21 45.43 11.36 0.00
WH 20 29.76 FMP1 FMP1061 FMP1391 - 43.24 45.41 11.35 0.00
WH 22 106.83 FMP1 FMP1064 FMP1394 - 64.70 28.24 7.06 0.00
WH 24 55.51 FMP1 FMP1067 FMP1397 - 65.11 27.91 6.98 0.00
WH 26 11.79 FMP1 FMP1069 FMP1399 - 62.98 29.62 7.40 0.00
RC 6 43.72 FMP1 FMP1074 FMP1404 - 87.00 10.40 2.60 0.00
RC 8 126.33 FMP1 FMP1077 FMP1407 - 59.59 32.33 8.08 0.00
RC 10 32.49 FMP1 FMP1080 FMP1410 - 45.55 43.56 10.89 0.00
RC 12 81.20 FMP1 FMP1083 FMP1413 - 48.50 41.20 10.30 0.00
RC 14 25.31 FMP1 FMP1086 FMP1416 - 44.67 44.26 11.07 0.00
RC 16 11.64 FMP1 FMP1088 FMP1419 - 43.06 45.55 11.39 0.00
RC 18 12.29 FMP1 FMP1091 FMP1422 - 43.14 45.49 11.37 0.00
RC 20 4.62 FMP1 FMP1094 FMP1425 - 43.14 45.49 11.37 0.00
RC 22 0.70 FMP1 FMP1097 FMP1428 - 62.43 30.05 7.51 0.00
RC 24 2.69 FMP1 FMP1100 FMP1431 - 51.02 39.18 9.80 0.00
OK 2 6 024.02 FMP1 - FMP1433 - 92.08 0.00 7.92 0.00
OK 4 10 337.41 FMP1 - FMP1434 - 92.08 0.00 7.92 0.00
OK 6 5 153.97 FMP1 - FMP1435 - 92.91 0.00 7.09 0.00
OK 8 2 072.06 FMP1 - FMP1436 - 89.42 0.00 10.58 0.00
AH 2 3 857.25 FMP1 - FMP1437 - 92.08 0.00 7.92 0.00
AH 4 3 488.72 FMP1 - FMP1438 - 92.08 0.00 7.92 0.00
AH 6 2 910.22 FMP1 - FMP1439 - 92.15 0.00 7.85 0.00

265
CARBINE tree species code
Yield class
Total area of stratum (ha)
Allocated FMPs by index number Percentage allocation of FMPs to stratum area
No harvesting
No thinning, with clearcutting
Thinning, with clearcutting
Continuous cover
No harvesting
No thinning, with clearcutting
Thinning, with clearcutting
Continuous cover
AH 8 1 720.56 FMP1 - FMP1440 - 92.15 0.00 7.85 0.00
AH 10 1 231.82 FMP1 - FMP1441 - 92.08 0.00 7.92 0.00
AH 12 1 577.88 FMP1 - FMP1442 - 92.08 0.00 7.92 0.00
BE 4 3 654.45 FMP1 - FMP1444 - 92.08 0.00 7.92 0.00
BE 6 5 076.30 FMP1 - FMP1445 - 92.61 0.00 7.39 0.00
BE 8 2 860.50 FMP1 - FMP1446 - 92.08 0.00 7.92 0.00
BE 10 2 606.88 FMP1 - FMP1447 - 92.32 0.00 7.68 0.00
BI 2 74 753.55 FMP1 - FMP1449 - 92.08 0.00 7.92 0.00
BI 4 28 509.93 FMP1 - FMP1450 - 92.08 0.00 7.92 0.00
BI 6 13 976.54 FMP1 - FMP1451 - 92.08 0.00 7.92 0.00
BI 8 5 749.45 FMP1 - FMP1452 - 92.08 0.00 7.92 0.00
BI 10 3 730.03 FMP1 - FMP1453 - 92.08 0.00 7.92 0.00
BI 12 1 743.03 FMP1 - FMP1454 - 92.08 0.00 7.92 0.00
SY 2 60 986.35 FMP1 - FMP1455 - 99.32 0.00 0.68 0.00
SY 4 2 794.99 FMP1 - FMP1456 - 92.08 0.00 7.92 0.00
SY 6 4 233.83 FMP1 - FMP1457 - 93.81 0.00 6.19 0.00
SY 8 3 045.11 FMP1 - FMP1458 - 92.15 0.00 7.85 0.00
SY 10 2 484.86 FMP1 - FMP1459 - 92.18 0.00 7.82 0.00
SY 12 2 803.74 FMP1 - FMP1460 - 92.08 0.00 7.92 0.00
PO 2 26 911.57 FMP1 - FMP1461 - 92.08 0.00 7.92 0.00
PO 4 13 529.06 FMP1 - FMP1462 - 92.08 0.00 7.92 0.00
PO 6 6 133.22 FMP1 - FMP1463 - 92.08 0.00 7.92 0.00
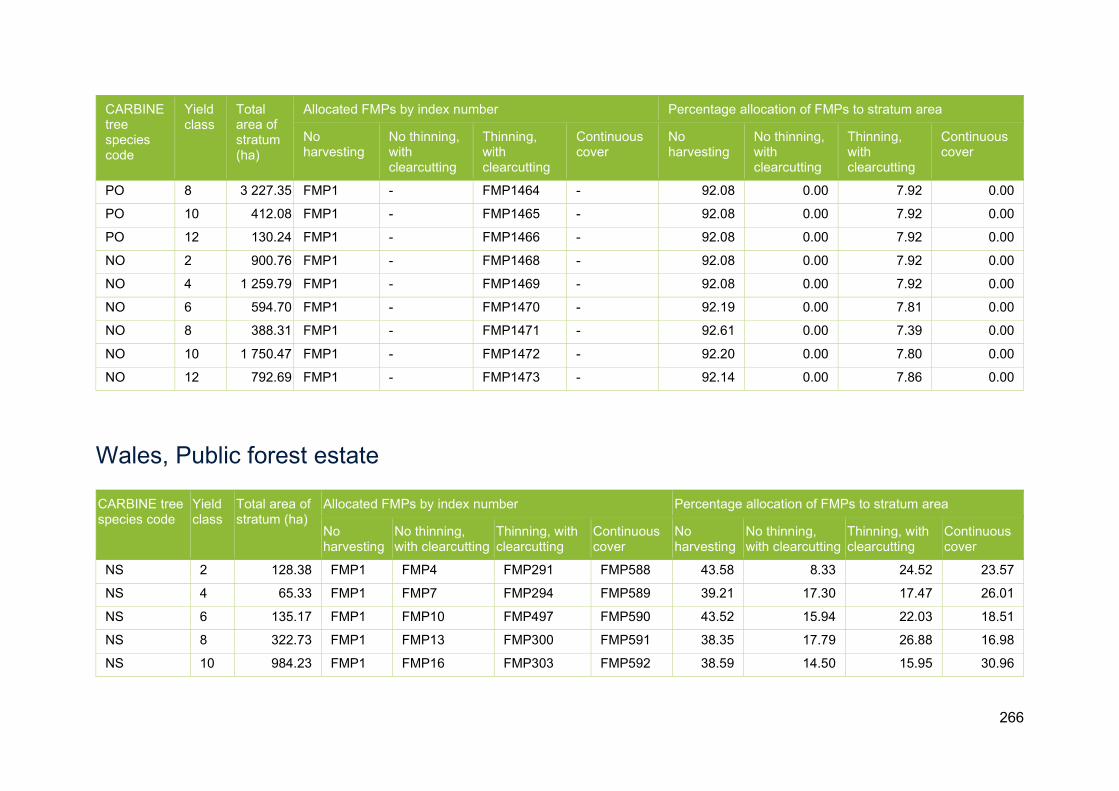
266
CARBINE tree species code
Yield class
Total area of stratum (ha)
Allocated FMPs by index number Percentage allocation of FMPs to stratum area
No harvesting
No thinning, with clearcutting
Thinning, with clearcutting
Continuous cover
No harvesting
No thinning, with clearcutting
Thinning, with clearcutting
Continuous cover
PO 8 3 227.35 FMP1 - FMP1464 - 92.08 0.00 7.92 0.00
PO 10 412.08 FMP1 - FMP1465 - 92.08 0.00 7.92 0.00
PO 12 130.24 FMP1 - FMP1466 - 92.08 0.00 7.92 0.00
NO 2 900.76 FMP1 - FMP1468 - 92.08 0.00 7.92 0.00
NO 4 1 259.79 FMP1 - FMP1469 - 92.08 0.00 7.92 0.00
NO 6 594.70 FMP1 - FMP1470 - 92.19 0.00 7.81 0.00
NO 8 388.31 FMP1 - FMP1471 - 92.61 0.00 7.39 0.00
NO 10 1 750.47 FMP1 - FMP1472 - 92.20 0.00 7.80 0.00
NO 12 792.69 FMP1 - FMP1473 - 92.14 0.00 7.86 0.00
Wales, Public forest estate
CARBINE tree species code
Yield class
Total area of stratum (ha)
Allocated FMPs by index number Percentage allocation of FMPs to stratum area
No harvesting
No thinning, with clearcutting
Thinning, with clearcutting
Continuous cover
No harvesting
No thinning, with clearcutting
Thinning, with clearcutting
Continuous cover
NS 2 128.38 FMP1 FMP4 FMP291 FMP588 43.58 8.33 24.52 23.57
NS 4 65.33 FMP1 FMP7 FMP294 FMP589 39.21 17.30 17.47 26.01
NS 6 135.17 FMP1 FMP10 FMP497 FMP590 43.52 15.94 22.03 18.51
NS 8 322.73 FMP1 FMP13 FMP300 FMP591 38.35 17.79 26.88 16.98
NS 10 984.23 FMP1 FMP16 FMP303 FMP592 38.59 14.50 15.95 30.96
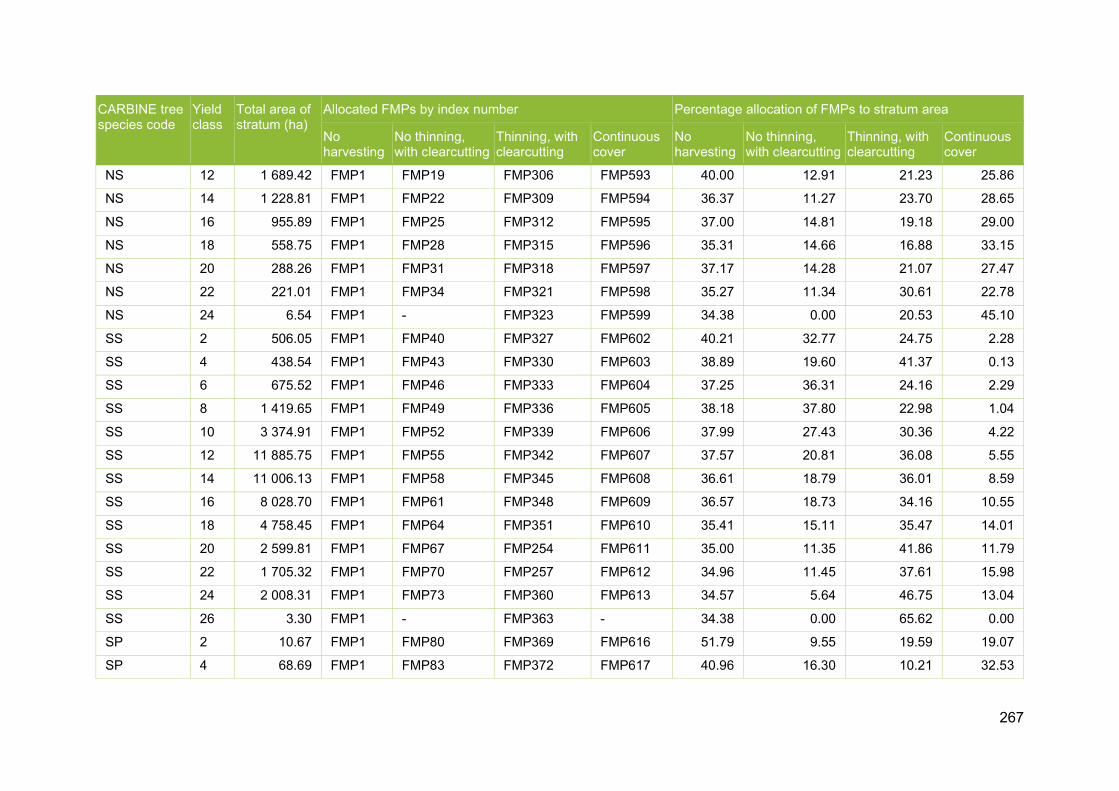
267
CARBINE tree species code
Yield class
Total area of stratum (ha)
Allocated FMPs by index number Percentage allocation of FMPs to stratum area
No harvesting
No thinning, with clearcutting
Thinning, with clearcutting
Continuous cover
No harvesting
No thinning, with clearcutting
Thinning, with clearcutting
Continuous cover
NS 12 1 689.42 FMP1 FMP19 FMP306 FMP593 40.00 12.91 21.23 25.86
NS 14 1 228.81 FMP1 FMP22 FMP309 FMP594 36.37 11.27 23.70 28.65
NS 16 955.89 FMP1 FMP25 FMP312 FMP595 37.00 14.81 19.18 29.00
NS 18 558.75 FMP1 FMP28 FMP315 FMP596 35.31 14.66 16.88 33.15
NS 20 288.26 FMP1 FMP31 FMP318 FMP597 37.17 14.28 21.07 27.47
NS 22 221.01 FMP1 FMP34 FMP321 FMP598 35.27 11.34 30.61 22.78
NS 24 6.54 FMP1 - FMP323 FMP599 34.38 0.00 20.53 45.10
SS 2 506.05 FMP1 FMP40 FMP327 FMP602 40.21 32.77 24.75 2.28
SS 4 438.54 FMP1 FMP43 FMP330 FMP603 38.89 19.60 41.37 0.13
SS 6 675.52 FMP1 FMP46 FMP333 FMP604 37.25 36.31 24.16 2.29
SS 8 1 419.65 FMP1 FMP49 FMP336 FMP605 38.18 37.80 22.98 1.04
SS 10 3 374.91 FMP1 FMP52 FMP339 FMP606 37.99 27.43 30.36 4.22
SS 12 11 885.75 FMP1 FMP55 FMP342 FMP607 37.57 20.81 36.08 5.55
SS 14 11 006.13 FMP1 FMP58 FMP345 FMP608 36.61 18.79 36.01 8.59
SS 16 8 028.70 FMP1 FMP61 FMP348 FMP609 36.57 18.73 34.16 10.55
SS 18 4 758.45 FMP1 FMP64 FMP351 FMP610 35.41 15.11 35.47 14.01
SS 20 2 599.81 FMP1 FMP67 FMP254 FMP611 35.00 11.35 41.86 11.79
SS 22 1 705.32 FMP1 FMP70 FMP257 FMP612 34.96 11.45 37.61 15.98
SS 24 2 008.31 FMP1 FMP73 FMP360 FMP613 34.57 5.64 46.75 13.04
SS 26 3.30 FMP1 - FMP363 - 34.38 0.00 65.62 0.00
SP 2 10.67 FMP1 FMP80 FMP369 FMP616 51.79 9.55 19.59 19.07
SP 4 68.69 FMP1 FMP83 FMP372 FMP617 40.96 16.30 10.21 32.53

268
CARBINE tree species code
Yield class
Total area of stratum (ha)
Allocated FMPs by index number Percentage allocation of FMPs to stratum area
No harvesting
No thinning, with clearcutting
Thinning, with clearcutting
Continuous cover
No harvesting
No thinning, with clearcutting
Thinning, with clearcutting
Continuous cover
SP 6 202.70 FMP1 FMP86 FMP375 FMP618 40.39 17.07 19.76 22.78
SP 8 546.35 FMP1 FMP89 FMP378 FMP619 38.23 17.64 12.31 31.81
SP 10 898.81 FMP1 FMP92 FMP381 FMP620 39.70 17.36 11.83 31.12
SP 12 356.66 FMP1 FMP95 FMP384 FMP621 42.65 16.27 5.68 35.40
SP 14 139.49 FMP1 FMP98 FMP387 FMP622 36.44 14.31 16.39 32.85
SP 16 47.92 FMP1 - FMP390 FMP623 34.38 0.00 6.42 59.20
SP 20 0.66 FMP1 - FMP393 FMP625 34.38 0.00 0.02 65.60
CP 2 18.07 FMP1 FMP103 - FMP626 37.25 5.35 0.00 57.40
CP 4 9.33 FMP1 FMP105 FMP398 FMP627 58.86 27.91 0.00 13.23
CP 6 79.13 FMP1 FMP108 FMP401 FMP628 34.96 12.16 26.72 26.16
CP 8 158.80 FMP1 FMP111 FMP404 FMP629 35.93 10.53 5.19 48.34
CP 10 393.16 FMP1 FMP114 FMP407 FMP630 34.94 7.76 10.00 47.29
CP 12 505.34 FMP1 FMP117 FMP410 FMP631 35.37 5.66 9.36 49.61
CP 14 263.29 FMP1 FMP120 FMP413 FMP632 35.62 11.12 11.59 41.68
CP 16 214.40 FMP1 FMP122 FMP415 FMP633 36.02 16.34 5.51 42.13
CP 18 31.06 FMP1 FMP124 FMP417 FMP634 34.52 15.28 14.17 36.03
CP 20 21.33 FMP1 FMP125 FMP419 FMP635 34.65 27.23 19.33 18.79
CP 22 0.27 FMP1 FMP126 FMP421 FMP636 34.65 27.23 19.33 18.79
LP 2 103.83 FMP1 FMP129 FMP424 FMP638 37.72 18.46 39.35 4.47
LP 4 284.21 FMP1 FMP132 FMP427 FMP639 39.12 27.52 31.64 1.73
LP 6 654.29 FMP1 FMP135 FMP430 FMP640 37.56 35.97 23.13 3.33
LP 8 793.96 FMP1 FMP138 FMP433 FMP641 39.29 35.36 19.88 5.47

269
CARBINE tree species code
Yield class
Total area of stratum (ha)
Allocated FMPs by index number Percentage allocation of FMPs to stratum area
No harvesting
No thinning, with clearcutting
Thinning, with clearcutting
Continuous cover
No harvesting
No thinning, with clearcutting
Thinning, with clearcutting
Continuous cover
LP 10 371.35 FMP1 FMP141 FMP436 FMP642 38.02 35.04 19.54 7.39
LP 12 145.44 FMP1 FMP144 FMP439 FMP643 39.28 41.80 16.25 2.67
LP 14 54.93 FMP1 FMP147 FMP442 FMP644 37.79 41.35 14.61 6.25
LP 16 8.92 FMP1 FMP149 FMP445 FMP645 67.93 0.15 22.35 9.57
LP 20 3.53 FMP1 - - FMP647 34.38 0.00 0.00 65.62
EL 2 1.89 FMP1 - FMP451 FMP648 34.38 0.00 47.77 17.85
EL 4 13.07 FMP1 FMP153 FMP454 FMP649 35.92 26.15 0.00 37.93
EL 6 30.26 FMP1 FMP156 FMP457 FMP650 48.37 5.82 6.84 38.96
EL 8 64.95 FMP1 FMP159 FMP460 FMP651 35.76 5.76 10.99 47.49
EL 10 33.76 FMP1 FMP162 FMP463 FMP652 39.45 5.25 2.20 53.10
EL 12 30.38 FMP1 FMP165 FMP466 FMP653 34.84 3.00 12.17 49.98
EL 14 2.61 FMP1 - FMP469 FMP654 34.38 0.00 8.93 56.70
EL 16 1.95 FMP1 - FMP471 FMP655 34.38 0.00 12.85 52.77
JL 2 23.14 FMP1 FMP171 FMP475 FMP657 39.78 37.04 15.41 7.77
JL 4 76.03 FMP1 FMP174 FMP478 FMP658 43.75 33.41 11.84 11.00
JL 6 218.18 FMP1 FMP177 FMP481 FMP659 37.75 21.60 19.19 21.45
JL 8 922.32 FMP1 FMP180 FMP484 FMP660 36.92 16.11 18.44 28.53
JL 10 2 778.19 FMP1 FMP183 FMP487 FMP661 36.55 11.23 18.53 33.69
JL 12 2 924.49 FMP1 FMP186 FMP490 FMP662 36.55 12.64 15.71 35.10
JL 14 2 568.29 FMP1 FMP189 FMP493 FMP663 36.12 12.23 13.28 38.38
JL 16 168.05 FMP1 FMP192 FMP496 FMP664 35.06 4.05 29.67 31.22
JL 24 0.21 FMP1 - FMP499 FMP667 34.42 0.00 28.74 36.85

270
CARBINE tree species code
Yield class
Total area of stratum (ha)
Allocated FMPs by index number Percentage allocation of FMPs to stratum area
No harvesting
No thinning, with clearcutting
Thinning, with clearcutting
Continuous cover
No harvesting
No thinning, with clearcutting
Thinning, with clearcutting
Continuous cover
DF 2 3.18 FMP1 FMP196 FMP502 FMP668 34.39 5.33 2.85 57.43
DF 4 1.61 FMP1 - FMP505 FMP669 34.38 0.00 3.11 62.52
DF 6 6.11 FMP1 - FMP507 FMP670 34.38 0.00 29.77 35.85
DF 8 32.38 FMP1 FMP200 FMP510 FMP671 45.83 0.44 24.38 29.36
DF 10 208.12 FMP1 FMP203 FMP513 FMP672 37.67 9.91 19.49 32.93
DF 12 944.06 FMP1 FMP206 FMP516 FMP673 35.42 6.64 11.81 46.14
DF 14 1 002.78 FMP1 FMP209 FMP519 FMP674 37.30 6.70 11.61 44.39
DF 16 1 523.93 FMP1 FMP212 FMP522 FMP675 35.95 6.48 16.89 40.69
DF 18 808.20 FMP1 FMP215 FMP525 FMP676 35.10 5.84 17.90 41.16
DF 20 368.25 FMP1 FMP218 FMP528 FMP677 34.99 6.13 9.00 49.88
DF 22 242.60 FMP1 FMP221 FMP531 FMP678 35.01 5.66 31.76 27.58
DF 24 259.37 FMP1 FMP224 FMP534 FMP679 34.58 2.04 8.99 54.39
GF 2 4.72 FMP1 FMP226 FMP536 FMP681 34.38 39.37 14.80 11.45
GF 4 3.93 FMP1 FMP227 FMP537 FMP682 95.46 3.18 0.76 0.59
GF 10 7.16 FMP1 - FMP540 FMP685 34.38 0.00 64.81 0.82
GF 12 17.02 FMP1 FMP231 FMP541 FMP686 38.72 3.32 22.13 35.83
GF 14 28.13 FMP1 FMP233 FMP542 FMP687 36.05 6.58 13.76 43.62
GF 16 78.63 FMP1 FMP235 FMP543 FMP688 34.49 3.30 32.35 29.87
GF 18 33.80 FMP1 FMP237 FMP544 FMP689 37.97 17.28 20.92 23.83
GF 20 88.10 FMP1 FMP239 FMP545 FMP690 36.32 6.48 21.79 35.40
GF 22 29.99 FMP1 FMP241 FMP546 FMP691 34.45 12.27 34.84 18.44
GF 24 45.34 FMP1 FMP243 FMP547 FMP692 34.68 6.84 30.04 28.44
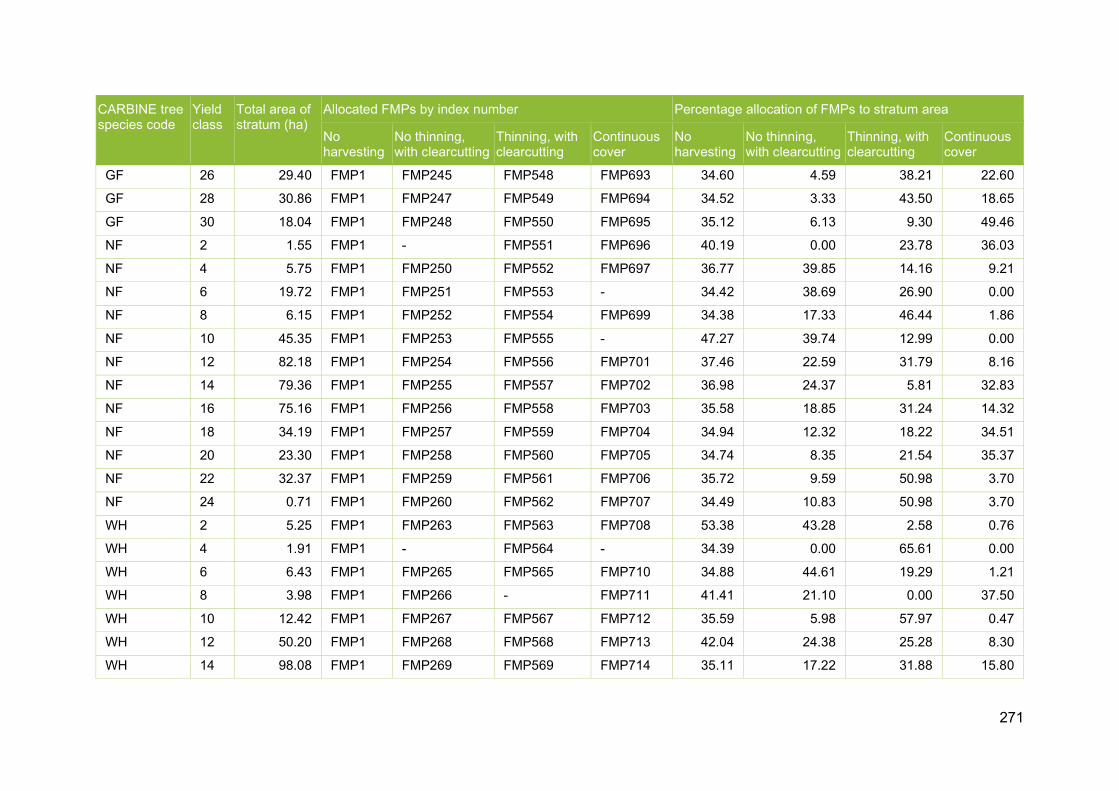
271
CARBINE tree species code
Yield class
Total area of stratum (ha)
Allocated FMPs by index number Percentage allocation of FMPs to stratum area
No harvesting
No thinning, with clearcutting
Thinning, with clearcutting
Continuous cover
No harvesting
No thinning, with clearcutting
Thinning, with clearcutting
Continuous cover
GF 26 29.40 FMP1 FMP245 FMP548 FMP693 34.60 4.59 38.21 22.60
GF 28 30.86 FMP1 FMP247 FMP549 FMP694 34.52 3.33 43.50 18.65
GF 30 18.04 FMP1 FMP248 FMP550 FMP695 35.12 6.13 9.30 49.46
NF 2 1.55 FMP1 - FMP551 FMP696 40.19 0.00 23.78 36.03
NF 4 5.75 FMP1 FMP250 FMP552 FMP697 36.77 39.85 14.16 9.21
NF 6 19.72 FMP1 FMP251 FMP553 - 34.42 38.69 26.90 0.00
NF 8 6.15 FMP1 FMP252 FMP554 FMP699 34.38 17.33 46.44 1.86
NF 10 45.35 FMP1 FMP253 FMP555 - 47.27 39.74 12.99 0.00
NF 12 82.18 FMP1 FMP254 FMP556 FMP701 37.46 22.59 31.79 8.16
NF 14 79.36 FMP1 FMP255 FMP557 FMP702 36.98 24.37 5.81 32.83
NF 16 75.16 FMP1 FMP256 FMP558 FMP703 35.58 18.85 31.24 14.32
NF 18 34.19 FMP1 FMP257 FMP559 FMP704 34.94 12.32 18.22 34.51
NF 20 23.30 FMP1 FMP258 FMP560 FMP705 34.74 8.35 21.54 35.37
NF 22 32.37 FMP1 FMP259 FMP561 FMP706 35.72 9.59 50.98 3.70
NF 24 0.71 FMP1 FMP260 FMP562 FMP707 34.49 10.83 50.98 3.70
WH 2 5.25 FMP1 FMP263 FMP563 FMP708 53.38 43.28 2.58 0.76
WH 4 1.91 FMP1 - FMP564 - 34.39 0.00 65.61 0.00
WH 6 6.43 FMP1 FMP265 FMP565 FMP710 34.88 44.61 19.29 1.21
WH 8 3.98 FMP1 FMP266 - FMP711 41.41 21.10 0.00 37.50
WH 10 12.42 FMP1 FMP267 FMP567 FMP712 35.59 5.98 57.97 0.47
WH 12 50.20 FMP1 FMP268 FMP568 FMP713 42.04 24.38 25.28 8.30
WH 14 98.08 FMP1 FMP269 FMP569 FMP714 35.11 17.22 31.88 15.80

272
CARBINE tree species code
Yield class
Total area of stratum (ha)
Allocated FMPs by index number Percentage allocation of FMPs to stratum area
No harvesting
No thinning, with clearcutting
Thinning, with clearcutting
Continuous cover
No harvesting
No thinning, with clearcutting
Thinning, with clearcutting
Continuous cover
WH 16 140.90 FMP1 FMP270 FMP570 FMP715 35.40 18.32 27.46 18.82
WH 18 166.46 FMP1 FMP271 FMP571 FMP716 35.44 14.98 39.26 10.32
WH 20 109.57 FMP1 FMP272 FMP572 FMP717 34.65 14.94 31.95 18.46
WH 22 73.68 FMP1 FMP273 FMP573 FMP718 36.41 19.23 28.06 16.31
WH 24 82.22 FMP1 FMP274 FMP574 FMP719 34.53 14.27 42.19 9.01
WH 26 0.21 FMP1 - FMP575 FMP720 34.38 0.00 63.46 2.16
RC 2 12.18 FMP1 FMP276 FMP576 FMP721 34.38 26.41 38.84 0.37
RC 4 2.46 FMP1 - FMP577 FMP722 34.38 0.00 21.72 43.90
RC 6 11.06 FMP1 - FMP578 FMP723 34.38 0.00 21.72 43.90
RC 8 9.56 FMP1 FMP279 FMP579 FMP724 34.79 11.55 17.76 35.90
RC 10 53.71 FMP1 FMP280 FMP580 FMP725 34.49 21.39 30.39 13.73
RC 12 72.51 FMP1 FMP281 FMP581 FMP726 42.38 15.70 21.82 20.09
RC 14 59.45 FMP1 FMP282 FMP582 FMP727 36.91 26.24 20.29 16.56
RC 16 77.95 FMP1 FMP283 FMP583 FMP728 36.25 15.13 25.05 23.57
RC 18 43.05 FMP1 FMP284 FMP584 FMP729 38.12 11.46 17.34 33.07
RC 20 32.96 FMP1 FMP285 FMP585 FMP730 34.68 10.27 28.68 26.38
RC 22 17.95 FMP1 FMP286 FMP586 FMP731 36.89 12.90 7.04 43.17
RC 24 7.99 FMP1 FMP288 FMP587 FMP732 35.01 19.05 6.44 39.49
OK 2 273.51 FMP1 - - FMP733 66.87 0.00 0.00 33.13
OK 4 662.28 FMP1 - - FMP734 59.63 0.00 0.00 40.37
OK 6 642.99 FMP1 - - FMP735 58.36 0.00 0.00 41.64
OK 8 296.24 FMP1 - - FMP736 63.33 0.00 0.00 36.67

273
CARBINE tree species code
Yield class
Total area of stratum (ha)
Allocated FMPs by index number Percentage allocation of FMPs to stratum area
No harvesting
No thinning, with clearcutting
Thinning, with clearcutting
Continuous cover
No harvesting
No thinning, with clearcutting
Thinning, with clearcutting
Continuous cover
OK 10 30.34 FMP1 - - FMP737 55.39 0.00 0.00 44.61
OK 12 5.45 FMP1 - - FMP738 80.54 0.00 0.00 19.46
OK 14 4.32 FMP1 - - FMP739 80.54 0.00 0.00 19.46
OK 16 0.27 FMP1 - - FMP740 80.54 0.00 0.00 19.46
OK 20 0.61 FMP1 - - FMP741 80.54 0.00 0.00 19.46
AH 2 30.74 FMP1 - - FMP742 60.80 0.00 0.00 39.20
AH 4 128.17 FMP1 - - FMP743 59.98 0.00 0.00 40.02
AH 6 76.60 FMP1 - - FMP744 64.31 0.00 0.00 35.69
AH 8 62.48 FMP1 - - FMP745 62.75 0.00 0.00 37.25
AH 10 19.63 FMP1 - - FMP746 61.20 0.00 0.00 38.80
AH 12 4.11 FMP1 - - FMP747 64.55 0.00 0.00 35.45
AH 14 0.11 FMP1 - - FMP748 61.44 0.00 0.00 38.56
AH 18 2.83 FMP1 - - FMP750 68.22 0.00 0.00 31.78
AH 20 1.99 FMP1 - - FMP751 55.39 0.00 0.00 44.61
BE 2 95.79 FMP1 - - FMP752 61.35 0.00 0.00 38.65
BE 4 250.68 FMP1 - - FMP753 60.99 0.00 0.00 39.01
BE 6 498.47 FMP1 - - FMP754 64.80 0.00 0.00 35.20
BE 8 526.73 FMP1 - - FMP755 61.23 0.00 0.00 38.77
BE 10 64.18 FMP1 - - FMP756 60.89 0.00 0.00 39.11
BE 12 0.45 FMP1 - - FMP757 55.39 0.00 0.00 44.61
BE 16 0.87 FMP1 - - FMP759 55.39 0.00 0.00 44.61
BI 2 339.22 FMP1 - - FMP761 60.80 0.00 0.00 39.20
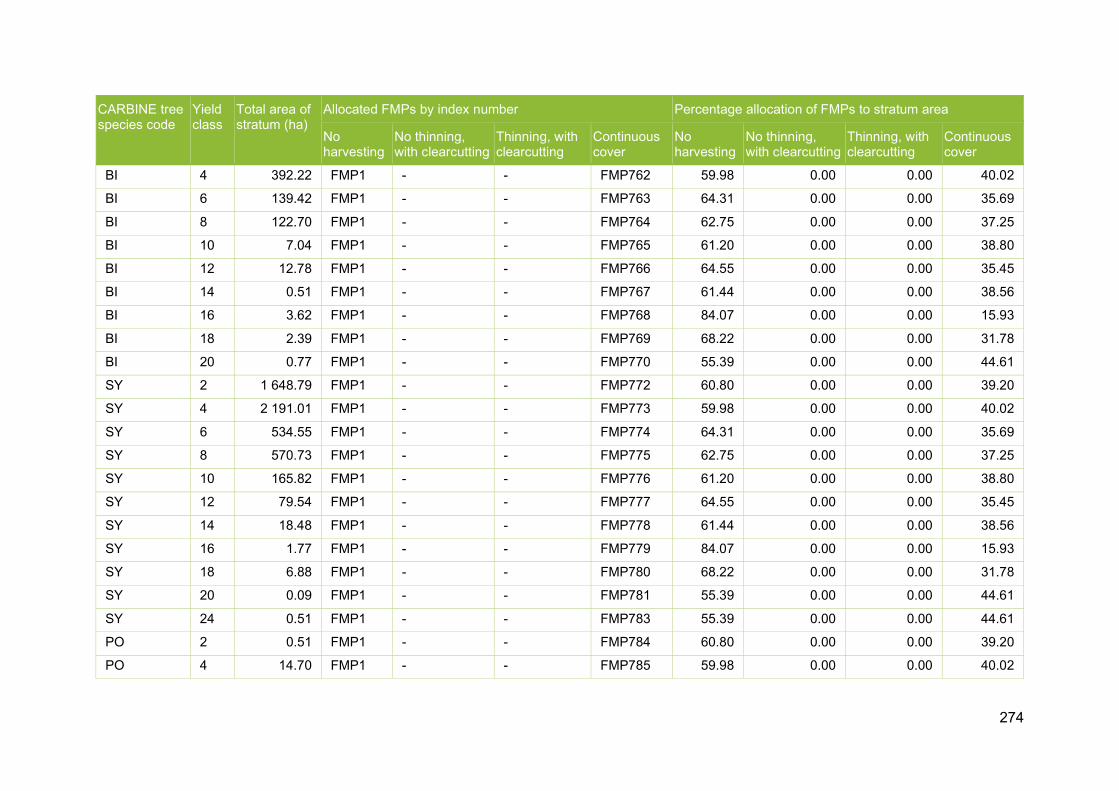
274
CARBINE tree species code
Yield class
Total area of stratum (ha)
Allocated FMPs by index number Percentage allocation of FMPs to stratum area
No harvesting
No thinning, with clearcutting
Thinning, with clearcutting
Continuous cover
No harvesting
No thinning, with clearcutting
Thinning, with clearcutting
Continuous cover
BI 4 392.22 FMP1 - - FMP762 59.98 0.00 0.00 40.02
BI 6 139.42 FMP1 - - FMP763 64.31 0.00 0.00 35.69
BI 8 122.70 FMP1 - - FMP764 62.75 0.00 0.00 37.25
BI 10 7.04 FMP1 - - FMP765 61.20 0.00 0.00 38.80
BI 12 12.78 FMP1 - - FMP766 64.55 0.00 0.00 35.45
BI 14 0.51 FMP1 - - FMP767 61.44 0.00 0.00 38.56
BI 16 3.62 FMP1 - - FMP768 84.07 0.00 0.00 15.93
BI 18 2.39 FMP1 - - FMP769 68.22 0.00 0.00 31.78
BI 20 0.77 FMP1 - - FMP770 55.39 0.00 0.00 44.61
SY 2 1 648.79 FMP1 - - FMP772 60.80 0.00 0.00 39.20
SY 4 2 191.01 FMP1 - - FMP773 59.98 0.00 0.00 40.02
SY 6 534.55 FMP1 - - FMP774 64.31 0.00 0.00 35.69
SY 8 570.73 FMP1 - - FMP775 62.75 0.00 0.00 37.25
SY 10 165.82 FMP1 - - FMP776 61.20 0.00 0.00 38.80
SY 12 79.54 FMP1 - - FMP777 64.55 0.00 0.00 35.45
SY 14 18.48 FMP1 - - FMP778 61.44 0.00 0.00 38.56
SY 16 1.77 FMP1 - - FMP779 84.07 0.00 0.00 15.93
SY 18 6.88 FMP1 - - FMP780 68.22 0.00 0.00 31.78
SY 20 0.09 FMP1 - - FMP781 55.39 0.00 0.00 44.61
SY 24 0.51 FMP1 - - FMP783 55.39 0.00 0.00 44.61
PO 2 0.51 FMP1 - - FMP784 60.80 0.00 0.00 39.20
PO 4 14.70 FMP1 - - FMP785 59.98 0.00 0.00 40.02

275
CARBINE tree species code
Yield class
Total area of stratum (ha)
Allocated FMPs by index number Percentage allocation of FMPs to stratum area
No harvesting
No thinning, with clearcutting
Thinning, with clearcutting
Continuous cover
No harvesting
No thinning, with clearcutting
Thinning, with clearcutting
Continuous cover
PO 6 8.22 FMP1 - - FMP786 64.31 0.00 0.00 35.69
PO 8 4.37 FMP1 - - FMP787 62.75 0.00 0.00 37.25
PO 10 5.64 FMP1 - - FMP788 61.20 0.00 0.00 38.80
PO 12 0.96 FMP1 - - FMP789 64.55 0.00 0.00 35.45
PO 14 0.24 FMP1 - - FMP790 61.44 0.00 0.00 38.56
NO 4 1.99 FMP1 - - FMP794 59.98 0.00 0.00 40.02
NO 6 7.26 FMP1 - - FMP795 64.31 0.00 0.00 35.69
NO 8 7.08 FMP1 - - FMP796 62.75 0.00 0.00 37.25
NO 10 9.43 FMP1 - - FMP797 61.20 0.00 0.00 38.80
NO 12 5.11 FMP1 - - FMP798 64.55 0.00 0.00 35.45
NO 14 3.97 FMP1 - - FMP799 61.44 0.00 0.00 38.56
NO 16 1.18 FMP1 - - FMP800 84.07 0.00 0.00 15.93
NO 18 2.96 FMP1 - - FMP801 68.22 0.00 0.00 31.78
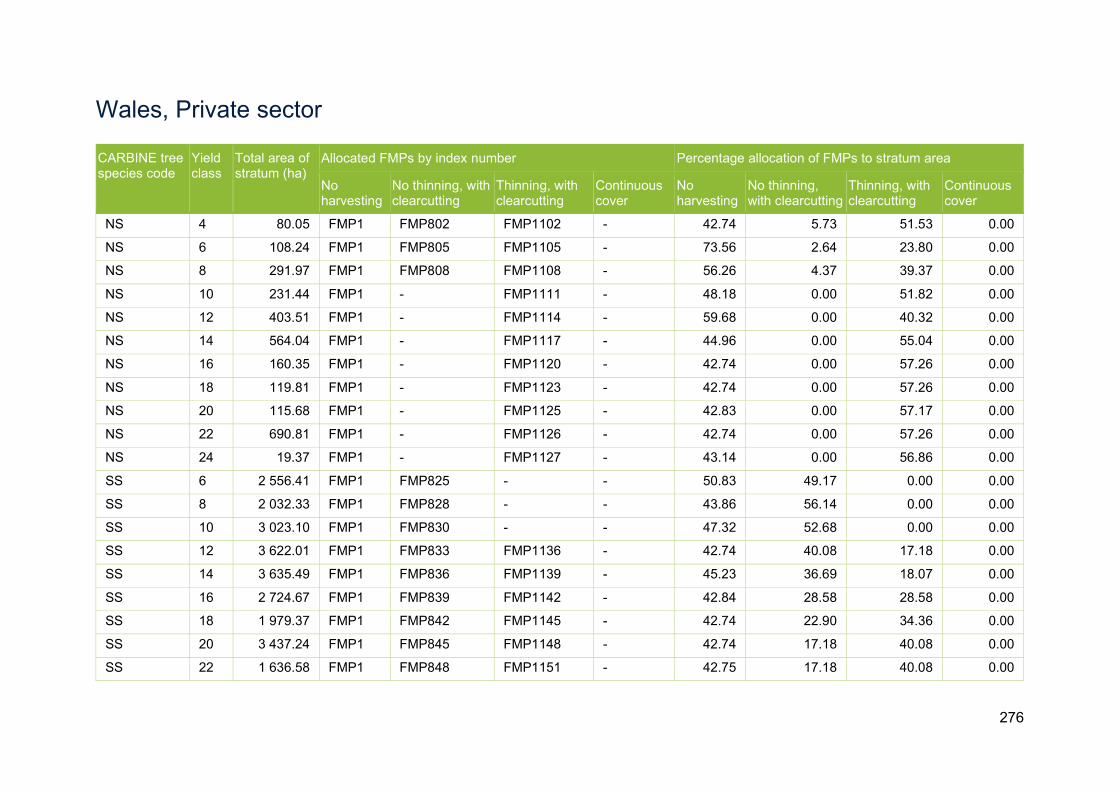
276
Wales, Private sector
CARBINE tree species code
Yield class
Total area of stratum (ha)
Allocated FMPs by index number Percentage allocation of FMPs to stratum area
No harvesting
No thinning, with clearcutting
Thinning, with clearcutting
Continuous cover
No harvesting
No thinning, with clearcutting
Thinning, with clearcutting
Continuous cover
NS 4 80.05 FMP1 FMP802 FMP1102 - 42.74 5.73 51.53 0.00
NS 6 108.24 FMP1 FMP805 FMP1105 - 73.56 2.64 23.80 0.00
NS 8 291.97 FMP1 FMP808 FMP1108 - 56.26 4.37 39.37 0.00
NS 10 231.44 FMP1 - FMP1111 - 48.18 0.00 51.82 0.00
NS 12 403.51 FMP1 - FMP1114 - 59.68 0.00 40.32 0.00
NS 14 564.04 FMP1 - FMP1117 - 44.96 0.00 55.04 0.00
NS 16 160.35 FMP1 - FMP1120 - 42.74 0.00 57.26 0.00
NS 18 119.81 FMP1 - FMP1123 - 42.74 0.00 57.26 0.00
NS 20 115.68 FMP1 - FMP1125 - 42.83 0.00 57.17 0.00
NS 22 690.81 FMP1 - FMP1126 - 42.74 0.00 57.26 0.00
NS 24 19.37 FMP1 - FMP1127 - 43.14 0.00 56.86 0.00
SS 6 2 556.41 FMP1 FMP825 - - 50.83 49.17 0.00 0.00
SS 8 2 032.33 FMP1 FMP828 - - 43.86 56.14 0.00 0.00
SS 10 3 023.10 FMP1 FMP830 - - 47.32 52.68 0.00 0.00
SS 12 3 622.01 FMP1 FMP833 FMP1136 - 42.74 40.08 17.18 0.00
SS 14 3 635.49 FMP1 FMP836 FMP1139 - 45.23 36.69 18.07 0.00
SS 16 2 724.67 FMP1 FMP839 FMP1142 - 42.84 28.58 28.58 0.00
SS 18 1 979.37 FMP1 FMP842 FMP1145 - 42.74 22.90 34.36 0.00
SS 20 3 437.24 FMP1 FMP845 FMP1148 - 42.74 17.18 40.08 0.00
SS 22 1 636.58 FMP1 FMP848 FMP1151 - 42.75 17.18 40.08 0.00

277
CARBINE tree species code
Yield class
Total area of stratum (ha)
Allocated FMPs by index number Percentage allocation of FMPs to stratum area
No harvesting
No thinning, with clearcutting
Thinning, with clearcutting
Continuous cover
No harvesting
No thinning, with clearcutting
Thinning, with clearcutting
Continuous cover
SS 24 2 994.84 FMP1 FMP850 FMP1154 - 42.74 17.18 40.08 0.00
SS 26 4.95 FMP1 FMP852 FMP1157 - 42.74 17.18 40.08 0.00
SP 4 6 551.40 FMP1 FMP858 FMP1163 - 99.41 0.09 0.50 0.00
SP 6 156.68 FMP1 FMP861 FMP1166 - 73.19 4.02 22.79 0.00
SP 8 498.26 FMP1 FMP864 FMP1169 - 57.55 6.37 36.09 0.00
SP 10 196.23 FMP1 FMP867 FMP1172 - 48.31 7.75 43.94 0.00
SP 12 98.42 FMP1 FMP870 FMP1175 - 60.07 5.99 33.94 0.00
SP 14 64.13 FMP1 FMP873 FMP1178 - 45.00 8.25 46.75 0.00
SP 16 6.18 FMP1 FMP874 FMP1179 - 78.74 3.19 18.07 0.00
SP 20 0.27 FMP1 FMP875 FMP1180 - 83.45 2.48 14.07 0.00
CP 4 13.29 FMP1 - FMP1182 - 42.74 0.00 57.26 0.00
CP 6 66.79 FMP1 - FMP1185 - 73.89 0.00 26.11 0.00
CP 8 161.90 FMP1 - FMP1188 - 56.04 0.00 43.96 0.00
CP 10 110.19 FMP1 - FMP1191 - 48.19 0.00 51.81 0.00
CP 12 173.29 FMP1 - FMP1194 - 62.62 0.00 37.38 0.00
CP 14 152.93 FMP1 - FMP1197 - 44.90 0.00 55.10 0.00
CP 16 44.29 FMP1 - FMP1199 - 42.74 0.00 57.26 0.00
CP 18 7.14 FMP1 - FMP1201 - 42.74 0.00 57.26 0.00
CP 20 9.10 FMP1 - FMP1203 - 42.85 0.00 57.15 0.00
CP 22 0.88 FMP1 - FMP1204 - 42.74 0.00 57.26 0.00
LP 4 377.08 FMP1 FMP884 FMP1207 - 42.74 45.81 11.45 0.00
LP 6 500.86 FMP1 FMP887 FMP1210 - 76.79 18.57 4.64 0.00

278
CARBINE tree species code
Yield class
Total area of stratum (ha)
Allocated FMPs by index number Percentage allocation of FMPs to stratum area
No harvesting
No thinning, with clearcutting
Thinning, with clearcutting
Continuous cover
No harvesting
No thinning, with clearcutting
Thinning, with clearcutting
Continuous cover
LP 8 732.24 FMP1 FMP890 FMP1213 - 61.66 30.67 7.67 0.00
LP 10 94.76 FMP1 FMP893 FMP1216 - 58.03 33.57 8.39 0.00
LP 12 43.24 FMP1 FMP896 FMP1219 - 65.22 27.83 6.96 0.00
LP 14 28.89 FMP1 FMP898 FMP1221 - 46.59 42.72 10.68 0.00
LP 16 1.68 FMP1 FMP900 FMP1223 - 42.74 45.81 11.45 0.00
LP 20 1.37 FMP1 FMP903 FMP1226 - 42.84 45.73 11.43 0.00
EL 4 64.81 FMP1 FMP908 FMP1231 - 42.74 11.45 45.81 0.00
EL 6 142.42 FMP1 FMP911 FMP1234 - 46.74 10.65 42.61 0.00
EL 8 50.95 FMP1 FMP914 FMP1237 - 42.74 11.45 45.81 0.00
EL 10 12.80 FMP1 FMP917 FMP1240 - 42.74 11.45 45.81 0.00
EL 12 12.37 FMP1 FMP920 FMP1243 - 49.27 10.15 40.58 0.00
EL 14 2.97 FMP1 FMP923 FMP1246 - 51.28 9.74 38.98 0.00
JL 4 377.55 FMP1 FMP928 FMP1251 - 49.17 10.17 40.66 0.00
JL 6 1 063.56 FMP1 FMP931 FMP1254 - 60.18 7.96 31.86 0.00
JL 8 779.37 FMP1 FMP934 FMP1257 - 46.12 10.78 43.10 0.00
JL 10 1 017.44 FMP1 FMP937 FMP1260 - 55.24 8.95 35.81 0.00
JL 12 1 157.75 FMP1 FMP940 FMP1263 - 48.78 10.24 40.97 0.00
JL 14 2 865.71 FMP1 FMP943 FMP1266 - 50.13 9.97 39.89 0.00
DF 4 2.23 FMP1 FMP944 FMP1267 - 42.74 11.45 45.81 0.00
DF 6 3.41 FMP1 FMP946 FMP1269 - 71.16 5.77 23.07 0.00
DF 8 23.60 FMP1 FMP949 FMP1272 - 53.95 9.21 36.84 0.00
DF 10 44.04 FMP1 FMP952 FMP1275 - 48.62 10.28 41.10 0.00
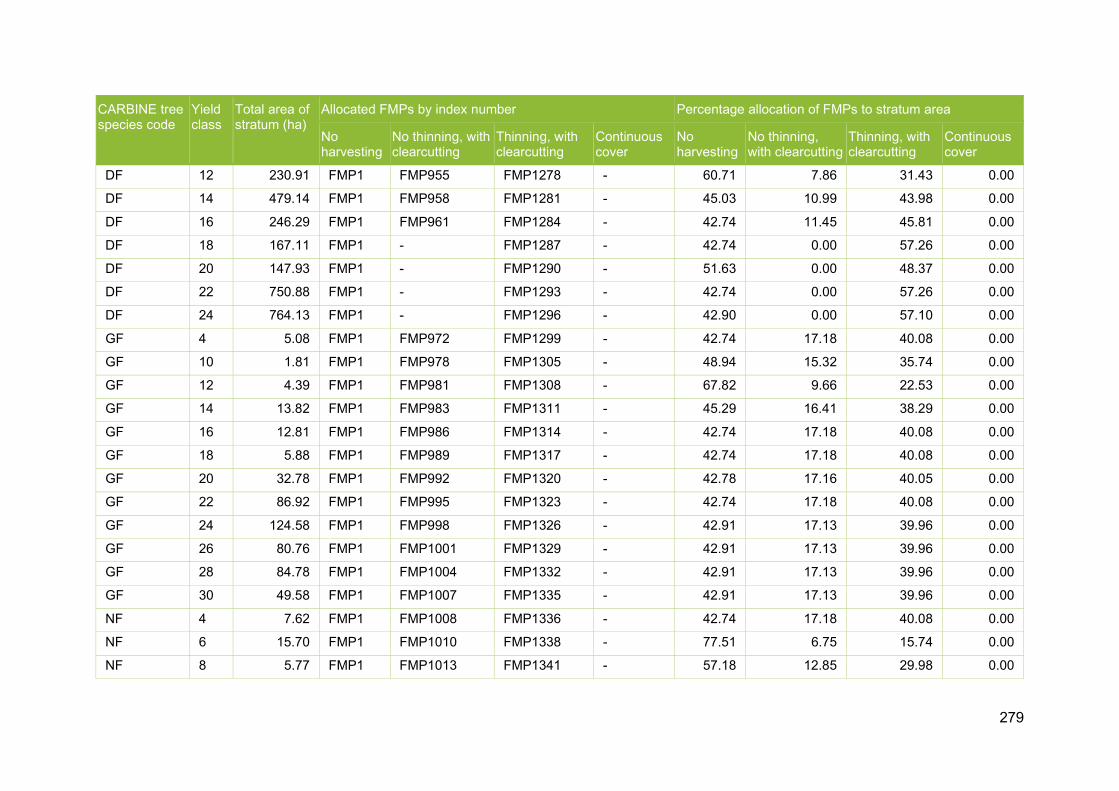
279
CARBINE tree species code
Yield class
Total area of stratum (ha)
Allocated FMPs by index number Percentage allocation of FMPs to stratum area
No harvesting
No thinning, with clearcutting
Thinning, with clearcutting
Continuous cover
No harvesting
No thinning, with clearcutting
Thinning, with clearcutting
Continuous cover
DF 12 230.91 FMP1 FMP955 FMP1278 - 60.71 7.86 31.43 0.00
DF 14 479.14 FMP1 FMP958 FMP1281 - 45.03 10.99 43.98 0.00
DF 16 246.29 FMP1 FMP961 FMP1284 - 42.74 11.45 45.81 0.00
DF 18 167.11 FMP1 - FMP1287 - 42.74 0.00 57.26 0.00
DF 20 147.93 FMP1 - FMP1290 - 51.63 0.00 48.37 0.00
DF 22 750.88 FMP1 - FMP1293 - 42.74 0.00 57.26 0.00
DF 24 764.13 FMP1 - FMP1296 - 42.90 0.00 57.10 0.00
GF 4 5.08 FMP1 FMP972 FMP1299 - 42.74 17.18 40.08 0.00
GF 10 1.81 FMP1 FMP978 FMP1305 - 48.94 15.32 35.74 0.00
GF 12 4.39 FMP1 FMP981 FMP1308 - 67.82 9.66 22.53 0.00
GF 14 13.82 FMP1 FMP983 FMP1311 - 45.29 16.41 38.29 0.00
GF 16 12.81 FMP1 FMP986 FMP1314 - 42.74 17.18 40.08 0.00
GF 18 5.88 FMP1 FMP989 FMP1317 - 42.74 17.18 40.08 0.00
GF 20 32.78 FMP1 FMP992 FMP1320 - 42.78 17.16 40.05 0.00
GF 22 86.92 FMP1 FMP995 FMP1323 - 42.74 17.18 40.08 0.00
GF 24 124.58 FMP1 FMP998 FMP1326 - 42.91 17.13 39.96 0.00
GF 26 80.76 FMP1 FMP1001 FMP1329 - 42.91 17.13 39.96 0.00
GF 28 84.78 FMP1 FMP1004 FMP1332 - 42.91 17.13 39.96 0.00
GF 30 49.58 FMP1 FMP1007 FMP1335 - 42.91 17.13 39.96 0.00
NF 4 7.62 FMP1 FMP1008 FMP1336 - 42.74 17.18 40.08 0.00
NF 6 15.70 FMP1 FMP1010 FMP1338 - 77.51 6.75 15.74 0.00
NF 8 5.77 FMP1 FMP1013 FMP1341 - 57.18 12.85 29.98 0.00

280
CARBINE tree species code
Yield class
Total area of stratum (ha)
Allocated FMPs by index number Percentage allocation of FMPs to stratum area
No harvesting
No thinning, with clearcutting
Thinning, with clearcutting
Continuous cover
No harvesting
No thinning, with clearcutting
Thinning, with clearcutting
Continuous cover
NF 10 8.92 FMP1 FMP1016 FMP1344 - 61.88 11.44 26.68 0.00
NF 12 18.71 FMP1 FMP1019 FMP1347 - 65.27 10.42 24.31 0.00
NF 14 38.87 FMP1 FMP1021 FMP1350 - 45.04 16.49 38.47 0.00
NF 16 12.00 FMP1 FMP1024 FMP1353 - 42.74 17.18 40.08 0.00
NF 18 7.39 FMP1 FMP1027 FMP1356 - 42.74 17.18 40.08 0.00
NF 20 9.35 FMP1 FMP1030 FMP1359 - 42.81 17.16 40.04 0.00
NF 22 99.92 FMP1 FMP1033 FMP1362 - 42.74 17.18 40.08 0.00
NF 24 2.08 FMP1 FMP1035 FMP1364 - 42.90 17.13 39.97 0.00
WH 4 2.52 FMP1 FMP1039 FMP1368 - 72.25 8.33 19.43 0.00
WH 6 4.40 FMP1 FMP1042 FMP1371 - 87.52 3.74 8.73 0.00
WH 8 3.39 FMP1 FMP1045 FMP1374 - 46.22 16.13 37.64 0.00
WH 10 3.20 FMP1 FMP1048 FMP1377 - 55.62 13.31 31.07 0.00
WH 12 15.13 FMP1 FMP1051 FMP1380 - 63.75 10.88 25.38 0.00
WH 14 47.56 FMP1 FMP1053 FMP1383 - 45.11 16.47 38.42 0.00
WH 16 25.96 FMP1 FMP1036 FMP1386 - 42.74 17.18 40.08 0.00
WH 18 34.48 FMP1 FMP1059 FMP1389 - 42.74 17.18 40.08 0.00
WH 20 42.16 FMP1 FMP1062 FMP1392 - 42.84 17.15 40.01 0.00
WH 22 218.02 FMP1 FMP1065 FMP1395 - 42.74 17.18 40.08 0.00
WH 24 230.67 FMP1 FMP1068 FMP198 - 42.91 17.13 39.96 0.00
WH 26 0.58 FMP1 FMP1070 FMP1400 - 42.91 17.13 39.96 0.00
RC 4 3.35 FMP1 FMP1072 FMP1402 - 42.74 17.18 40.08 0.00
RC 6 4.27 FMP1 FMP1075 FMP1405 - 72.73 8.18 19.09 0.00

281
CARBINE tree species code
Yield class
Total area of stratum (ha)
Allocated FMPs by index number Percentage allocation of FMPs to stratum area
No harvesting
No thinning, with clearcutting
Thinning, with clearcutting
Continuous cover
No harvesting
No thinning, with clearcutting
Thinning, with clearcutting
Continuous cover
RC 8 6.97 FMP1 FMP1078 FMP1408 - 54.22 13.74 32.05 0.00
RC 10 7.69 FMP1 FMP1081 FMP1411 - 48.28 15.52 36.20 0.00
RC 12 19.05 FMP1 FMP1084 FMP1414 - 59.31 12.21 28.48 0.00
RC 14 30.71 FMP1 FMP1086 FMP1417 - 45.08 16.48 38.44 0.00
RC 16 12.67 FMP1 FMP1089 FMP1420 - 42.74 17.18 40.08 0.00
RC 18 8.24 FMP1 FMP1092 FMP1423 - 42.74 17.18 40.08 0.00
RC 20 13.09 FMP1 FMP1095 FMP1426 - 42.84 17.15 40.01 0.00
RC 22 54.84 FMP1 FMP1098 FMP1429 - 42.74 17.18 40.08 0.00
RC 24 23.13 FMP1 FMP1101 FMP1432 - 42.90 17.13 39.97 0.00
OK 2 7 725.44 FMP1 - FMP1433 - 95.10 0.00 4.90 0.00
OK 4 6 809.16 FMP1 - FMP1434 - 95.10 0.00 4.90 0.00
OK 6 3 915.44 FMP1 - FMP1435 - 95.10 0.00 4.90 0.00
OK 8 3 948.43 FMP1 - FMP1436 - 95.10 0.00 4.90 0.00
AH 2 3 134.60 FMP1 - FMP1437 - 95.10 0.00 4.90 0.00
AH 4 3 066.39 FMP1 - FMP1438 - 95.10 0.00 4.90 0.00
AH 6 4 030.90 FMP1 - FMP1439 - 95.10 0.00 4.90 0.00
AH 8 1 889.58 FMP1 - FMP1440 - 95.10 0.00 4.90 0.00
AH 10 1 405.13 FMP1 - FMP1441 - 95.10 0.00 4.90 0.00
AH 12 3 660.57 FMP1 - FMP1442 - 95.10 0.00 4.90 0.00
BE 2 23 664.03 FMP1 - FMP1443 - 95.10 0.00 4.90 0.00
BE 4 8 409.49 FMP1 - FMP1444 - 95.10 0.00 4.90 0.00
BE 6 6 153.25 FMP1 - FMP1445 - 95.10 0.00 4.90 0.00

282
CARBINE tree species code
Yield class
Total area of stratum (ha)
Allocated FMPs by index number Percentage allocation of FMPs to stratum area
No harvesting
No thinning, with clearcutting
Thinning, with clearcutting
Continuous cover
No harvesting
No thinning, with clearcutting
Thinning, with clearcutting
Continuous cover
BE 8 4 924.76 FMP1 - FMP1446 - 95.10 0.00 4.90 0.00
BE 10 1 623.52 FMP1 - FMP1447 - 95.10 0.00 4.90 0.00
BE 12 34.19 FMP1 - FMP1448 - 95.10 0.00 4.90 0.00
BI 2 2 175.22 FMP1 - FMP1449 - 95.10 0.00 4.90 0.00
BI 4 1 273.40 FMP1 - FMP1450 - 95.10 0.00 4.90 0.00
BI 6 1 299.98 FMP1 - FMP1451 - 95.10 0.00 4.90 0.00
BI 8 443.56 FMP1 - FMP1452 - 95.10 0.00 4.90 0.00
BI 10 38.40 FMP1 - FMP1453 - 95.10 0.00 4.90 0.00
BI 12 227.92 FMP1 - FMP1454 - 95.10 0.00 4.90 0.00
SY 2 50 497.35 FMP1 - FMP1455 - 99.33 0.00 0.67 0.00
SY 4 5 276.08 FMP1 - FMP1456 - 95.10 0.00 4.90 0.00
SY 6 3 973.02 FMP1 - FMP1457 - 95.10 0.00 4.90 0.00
SY 8 2 429.77 FMP1 - FMP1458 - 95.10 0.00 4.90 0.00
SY 10 1 789.80 FMP1 - FMP1459 - 95.10 0.00 4.90 0.00
SY 12 1 541.90 FMP1 - FMP1460 - 95.10 0.00 4.90 0.00
PO 2 826.71 FMP1 - FMP1461 - 95.10 0.00 4.90 0.00
PO 4 597.17 FMP1 - FMP1462 - 95.10 0.00 4.90 0.00
PO 6 92.59 FMP1 - FMP1463 - 95.10 0.00 4.90 0.00
PO 8 37.53 FMP1 - FMP1464 - 95.10 0.00 4.90 0.00
PO 10 200.33 FMP1 - FMP1465 - 95.10 0.00 4.90 0.00
PO 12 67.30 FMP1 - FMP1466 - 95.10 0.00 4.90 0.00

283
Northern Ireland, Public forest estate
CARBINE tree species code
Yield class
Total area of stratum (ha)
Allocated FMPs by index number Percentage allocation of FMPs to stratum area
No harvesting
No thinning, with clearcutting
Thinning, with clearcutting
Continuous cover
No harvesting
No thinning, with clearcutting
Thinning, with clearcutting
Continuous cover
NS 6 2.44 FMP1 FMP1476 FMP1571 - 30.01 48.93 21.06 0.00
NS 8 2.15 FMP1 FMP1477 FMP1572 - 30.01 48.93 21.06 0.00
NS 10 5.92 FMP1 FMP1478 FMP1573 - 30.00 48.92 21.07 0.00
NS 12 92.23 FMP1 FMP1479 FMP1574 - 30.00 48.92 21.08 0.00
NS 14 231.95 FMP1 FMP1480 FMP1575 - 30.00 48.92 21.08 0.00
NS 16 1 327.24 FMP1 FMP1481 FMP1576 - 30.00 48.92 21.08 0.00
NS 18 232.60 FMP1 FMP1482 FMP1577 - 30.00 48.92 21.08 0.00
NS 20 369.16 FMP1 FMP1483 FMP1578 - 30.00 48.92 21.08 0.00
NS 22 4.20 FMP1 FMP1484 FMP1579 - 30.01 48.93 21.07 0.00
SS 6 19.75 FMP1 FMP1485 FMP1580 - 30.00 48.92 21.08 0.00
SS 8 42.98 FMP1 FMP1486 FMP1581 - 30.00 48.92 21.08 0.00
SS 10 272.38 FMP1 FMP1487 FMP1582 - 30.00 48.92 21.08 0.00
SS 12 4 106.11 FMP1 FMP1488 FMP1583 - 30.00 48.92 21.08 0.00
SS 14 6 428.24 FMP1 FMP1489 FMP1584 - 30.00 48.92 21.08 0.00
SS 16 17 321.67 FMP1 FMP1490 FMP1585 - 30.00 48.92 21.08 0.00
SS 18 5 287.85 FMP1 FMP1491 FMP1586 - 30.00 48.92 21.08 0.00
SS 20 2 068.57 FMP1 FMP1492 FMP1587 - 30.00 48.92 21.08 0.00
SS 22 86.42 FMP1 FMP1493 FMP1588 - 30.00 48.92 21.08 0.00
SP 4 12.33 FMP1 FMP1494 FMP1589 - 30.00 48.92 21.08 0.00
SP 6 45.80 FMP1 FMP1495 FMP1590 - 30.00 48.92 21.08 0.00
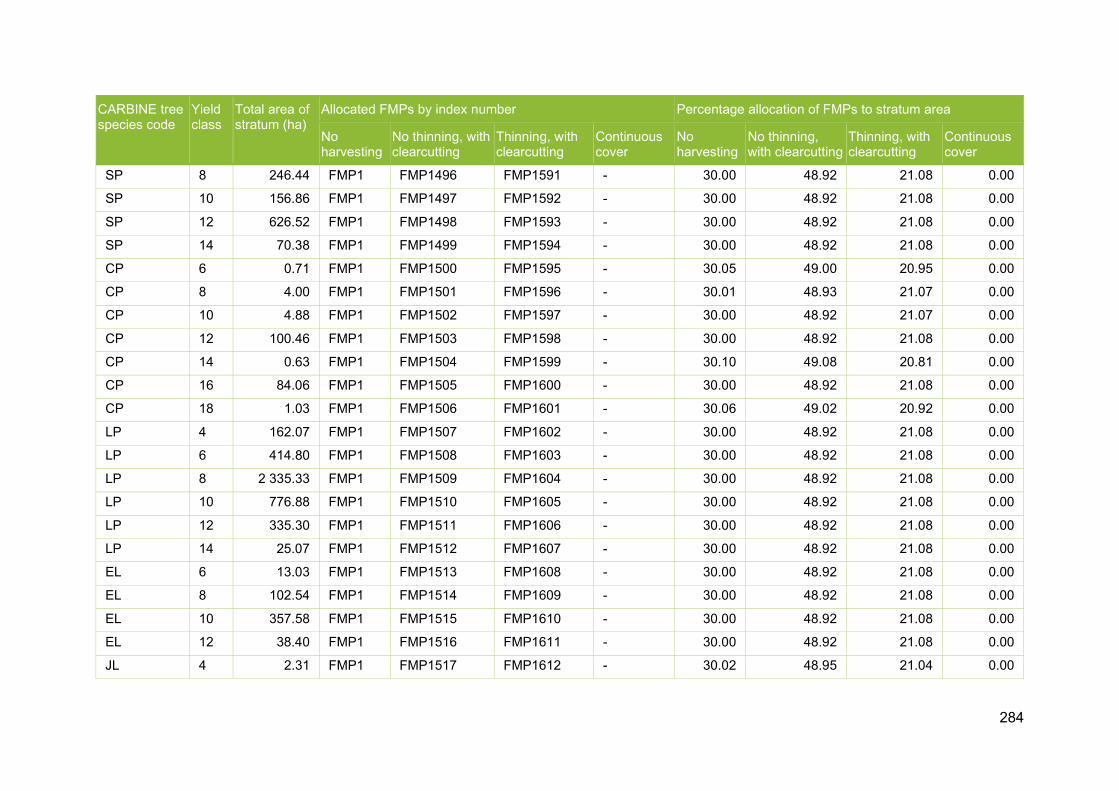
284
CARBINE tree species code
Yield class
Total area of stratum (ha)
Allocated FMPs by index number Percentage allocation of FMPs to stratum area
No harvesting
No thinning, with clearcutting
Thinning, with clearcutting
Continuous cover
No harvesting
No thinning, with clearcutting
Thinning, with clearcutting
Continuous cover
SP 8 246.44 FMP1 FMP1496 FMP1591 - 30.00 48.92 21.08 0.00
SP 10 156.86 FMP1 FMP1497 FMP1592 - 30.00 48.92 21.08 0.00
SP 12 626.52 FMP1 FMP1498 FMP1593 - 30.00 48.92 21.08 0.00
SP 14 70.38 FMP1 FMP1499 FMP1594 - 30.00 48.92 21.08 0.00
CP 6 0.71 FMP1 FMP1500 FMP1595 - 30.05 49.00 20.95 0.00
CP 8 4.00 FMP1 FMP1501 FMP1596 - 30.01 48.93 21.07 0.00
CP 10 4.88 FMP1 FMP1502 FMP1597 - 30.00 48.92 21.07 0.00
CP 12 100.46 FMP1 FMP1503 FMP1598 - 30.00 48.92 21.08 0.00
CP 14 0.63 FMP1 FMP1504 FMP1599 - 30.10 49.08 20.81 0.00
CP 16 84.06 FMP1 FMP1505 FMP1600 - 30.00 48.92 21.08 0.00
CP 18 1.03 FMP1 FMP1506 FMP1601 - 30.06 49.02 20.92 0.00
LP 4 162.07 FMP1 FMP1507 FMP1602 - 30.00 48.92 21.08 0.00
LP 6 414.80 FMP1 FMP1508 FMP1603 - 30.00 48.92 21.08 0.00
LP 8 2 335.33 FMP1 FMP1509 FMP1604 - 30.00 48.92 21.08 0.00
LP 10 776.88 FMP1 FMP1510 FMP1605 - 30.00 48.92 21.08 0.00
LP 12 335.30 FMP1 FMP1511 FMP1606 - 30.00 48.92 21.08 0.00
LP 14 25.07 FMP1 FMP1512 FMP1607 - 30.00 48.92 21.08 0.00
EL 6 13.03 FMP1 FMP1513 FMP1608 - 30.00 48.92 21.08 0.00
EL 8 102.54 FMP1 FMP1514 FMP1609 - 30.00 48.92 21.08 0.00
EL 10 357.58 FMP1 FMP1515 FMP1610 - 30.00 48.92 21.08 0.00
EL 12 38.40 FMP1 FMP1516 FMP1611 - 30.00 48.92 21.08 0.00
JL 4 2.31 FMP1 FMP1517 FMP1612 - 30.02 48.95 21.04 0.00

285
CARBINE tree species code
Yield class
Total area of stratum (ha)
Allocated FMPs by index number Percentage allocation of FMPs to stratum area
No harvesting
No thinning, with clearcutting
Thinning, with clearcutting
Continuous cover
No harvesting
No thinning, with clearcutting
Thinning, with clearcutting
Continuous cover
JL 6 27.26 FMP1 FMP1518 FMP1613 - 30.00 48.92 21.08 0.00
JL 8 170.44 FMP1 FMP1519 FMP1614 - 30.00 48.92 21.08 0.00
JL 10 469.41 FMP1 FMP1520 FMP1615 - 30.00 48.92 21.08 0.00
JL 12 970.10 FMP1 FMP1521 FMP1616 - 30.00 48.92 21.08 0.00
JL 14 314.04 FMP1 FMP1522 FMP1617 - 30.00 48.92 21.08 0.00
DF 12 1.22 FMP1 FMP1523 FMP1618 - 30.05 49.00 20.95 0.00
DF 14 1.16 FMP1 FMP1524 FMP1619 - 30.06 49.02 20.92 0.00
DF 16 25.12 FMP1 FMP1525 FMP1620 - 30.00 48.92 21.08 0.00
DF 18 349.51 FMP1 FMP1526 FMP1621 - 30.00 48.92 21.08 0.00
DF 20 31.85 FMP1 FMP1527 FMP1622 - 30.00 48.92 21.08 0.00
DF 22 39.10 FMP1 FMP1528 FMP1623 - 30.00 48.92 21.08 0.00
GF 14 3.08 FMP1 FMP1529 FMP1624 - 30.02 48.94 21.04 0.00
NF 10 0.54 FMP1 FMP1530 FMP1625 - 30.04 48.99 20.97 0.00
NF 12 15.17 FMP1 FMP1531 FMP1626 - 30.00 48.92 21.08 0.00
NF 14 92.51 FMP1 FMP1532 FMP1627 - 30.00 48.92 21.08 0.00
NF 16 229.92 FMP1 FMP1533 FMP1628 - 30.00 48.92 21.08 0.00
NF 18 16.19 FMP1 FMP1534 FMP1629 - 30.00 48.92 21.08 0.00
NF 20 3.28 FMP1 FMP1535 FMP1630 - 30.01 48.93 21.06 0.00
WH 12 54.49 FMP1 FMP1536 FMP1631 - 30.00 48.92 21.08 0.00
WH 14 14.64 FMP1 FMP1537 FMP1632 - 30.00 48.92 21.08 0.00
WH 16 11.24 FMP1 FMP1538 FMP1633 - 30.00 48.92 21.08 0.00
WH 18 0.37 FMP1 FMP1539 FMP1634 - 30.14 49.14 20.73 0.00

286
CARBINE tree species code
Yield class
Total area of stratum (ha)
Allocated FMPs by index number Percentage allocation of FMPs to stratum area
No harvesting
No thinning, with clearcutting
Thinning, with clearcutting
Continuous cover
No harvesting
No thinning, with clearcutting
Thinning, with clearcutting
Continuous cover
RC 12 41.18 FMP1 FMP1540 FMP1635 - 30.00 48.92 21.08 0.00
RC 14 5.79 FMP1 FMP1541 FMP1636 - 30.00 48.92 21.07 0.00
RC 16 6.92 FMP1 FMP1542 FMP1637 - 30.00 48.92 21.08 0.00
RC 18 0.16 FMP1 FMP1543 FMP1638 - 30.37 49.51 20.12 0.00
OK 4 144.87 FMP1 FMP1544 FMP1639 - 90.00 5.19 4.81 0.00
OK 6 117.88 FMP1 FMP1545 FMP1640 - 90.00 5.19 4.81 0.00
OK 8 407.33 FMP1 FMP1546 FMP1641 - 90.00 5.19 4.81 0.00
AH 4 120.67 FMP1 FMP1547 FMP1642 - 90.00 5.19 4.81 0.00
AH 6 42.30 FMP1 FMP1548 FMP1643 - 90.00 5.19 4.81 0.00
AH 8 48.20 FMP1 FMP1549 FMP1644 - 90.00 5.19 4.81 0.00
AH 10 1.45 FMP1 FMP1550 FMP1645 - 90.00 5.19 4.81 0.00
AH 12 0.86 FMP1 FMP1551 FMP1646 - 90.00 5.19 4.81 0.00
BE 4 7.85 FMP1 FMP1552 FMP1647 - 90.00 5.19 4.81 0.00
BE 6 15.23 FMP1 FMP1553 FMP1648 - 90.00 5.19 4.81 0.00
BE 8 81.48 FMP1 FMP1554 FMP1649 - 90.00 5.19 4.81 0.00
BE 10 35.04 FMP1 FMP1555 FMP1650 - 90.00 5.19 4.81 0.00
BI 4 128.96 FMP1 FMP1556 FMP1651 - 90.00 5.19 4.81 0.00
BI 6 32.62 FMP1 FMP1557 FMP1652 - 90.00 5.19 4.81 0.00
BI 8 41.07 FMP1 FMP1558 FMP1653 - 90.00 5.19 4.81 0.00
BI 10 0.31 FMP1 FMP1559 FMP1654 - 90.00 5.19 4.81 0.00
SY 4 99.35 FMP1 FMP1560 FMP1655 - 90.00 5.19 4.81 0.00
SY 6 49.25 FMP1 FMP1561 FMP1656 - 90.00 5.19 4.81 0.00

287
CARBINE tree species code
Yield class
Total area of stratum (ha)
Allocated FMPs by index number Percentage allocation of FMPs to stratum area
No harvesting
No thinning, with clearcutting
Thinning, with clearcutting
Continuous cover
No harvesting
No thinning, with clearcutting
Thinning, with clearcutting
Continuous cover
SY 8 301.47 FMP1 FMP1562 FMP1657 - 90.00 5.19 4.81 0.00
SY 10 5.07 FMP1 FMP1563 FMP1658 - 90.00 5.19 4.81 0.00
SY 12 4.89 FMP1 FMP1564 FMP1659 - 90.00 5.19 4.81 0.00
PO 4 1.08 FMP1 FMP1565 FMP1660 - 90.00 5.19 4.81 0.00
PO 6 1.99 FMP1 FMP1566 FMP1661 - 90.00 5.19 4.81 0.00
PO 8 25.87 FMP1 FMP1567 FMP1662 - 90.00 5.19 4.81 0.00
PO 10 3.28 FMP1 FMP1568 FMP1663 - 90.00 5.19 4.81 0.00
PO 14 0.47 FMP1 FMP1569 FMP1664 - 90.00 5.19 4.81 0.00
NO 10 2.60 FMP1 FMP1570 FMP1665 - 90.00 5.19 4.81 0.00
Northern Ireland, Private sector
CARBINE tree species code
Yield class
Total area of stratum (ha)
Allocated FMPs by index number Percentage allocation of FMPs to stratum area
No harvesting
No thinning, with clearcutting
Thinning, with clearcutting
Continuous cover
No harvesting
No thinning, with clearcutting
Thinning, with clearcutting
Continuous cover
NS 6 0.46 FMP1 FMP1476 FMP1571 - 30.01 48.93 21.06 0.00
NS 8 0.40 FMP1 FMP1477 FMP1572 - 30.01 48.93 21.06 0.00
NS 10 1.10 FMP1 FMP1478 FMP1573 - 30.00 48.92 21.07 0.00
NS 12 17.20 FMP1 FMP1479 FMP1574 - 30.00 48.92 21.08 0.00
NS 14 43.26 FMP1 FMP1480 FMP1575 - 30.00 48.92 21.08 0.00

288
CARBINE tree species code
Yield class
Total area of stratum (ha)
Allocated FMPs by index number Percentage allocation of FMPs to stratum area
No harvesting
No thinning, with clearcutting
Thinning, with clearcutting
Continuous cover
No harvesting
No thinning, with clearcutting
Thinning, with clearcutting
Continuous cover
NS 16 247.52 FMP1 FMP1481 FMP1576 - 30.00 48.92 21.08 0.00
NS 18 43.38 FMP1 FMP1482 FMP1577 - 30.00 48.92 21.08 0.00
NS 20 68.84 FMP1 FMP1483 FMP1578 - 30.00 48.92 21.08 0.00
NS 22 0.78 FMP1 FMP1484 FMP1579 - 30.01 48.93 21.07 0.00
SS 6 3.68 FMP1 FMP1485 FMP1580 - 30.00 48.92 21.08 0.00
SS 8 8.01 FMP1 FMP1486 FMP1581 - 30.00 48.92 21.08 0.00
SS 10 50.80 FMP1 FMP1487 FMP1582 - 30.00 48.92 21.08 0.00
SS 12 765.75 FMP1 FMP1488 FMP1583 - 30.00 48.92 21.08 0.00
SS 14 1 198.80 FMP1 FMP1489 FMP1584 - 30.00 48.92 21.08 0.00
SS 16 3 230.31 FMP1 FMP1490 FMP1585 - 30.00 48.92 21.08 0.00
SS 18 986.13 FMP1 FMP1491 FMP1586 - 30.00 48.92 21.08 0.00
SS 20 385.77 FMP1 FMP1492 FMP1587 - 30.00 48.92 21.08 0.00
SS 22 16.12 FMP1 FMP1493 FMP1588 - 30.00 48.92 21.08 0.00
SP 4 2.30 FMP1 FMP1494 FMP1589 - 30.00 48.92 21.08 0.00
SP 6 8.54 FMP1 FMP1495 FMP1590 - 30.00 48.92 21.08 0.00
SP 8 45.96 FMP1 FMP1496 FMP1591 - 30.00 48.92 21.08 0.00
SP 10 29.25 FMP1 FMP1497 FMP1592 - 30.00 48.92 21.08 0.00
SP 12 116.84 FMP1 FMP1498 FMP1593 - 30.00 48.92 21.08 0.00
SP 14 13.13 FMP1 FMP1499 FMP1594 - 30.00 48.92 21.08 0.00
CP 6 0.13 FMP1 FMP1500 FMP1595 - 30.05 49.00 20.95 0.00
CP 8 0.75 FMP1 FMP1501 FMP1596 - 30.01 48.93 21.07 0.00
CP 10 0.91 FMP1 FMP1502 FMP1597 - 30.00 48.92 21.07 0.00

289
CARBINE tree species code
Yield class
Total area of stratum (ha)
Allocated FMPs by index number Percentage allocation of FMPs to stratum area
No harvesting
No thinning, with clearcutting
Thinning, with clearcutting
Continuous cover
No harvesting
No thinning, with clearcutting
Thinning, with clearcutting
Continuous cover
CP 12 18.73 FMP1 FMP1503 FMP1598 - 30.00 48.92 21.08 0.00
CP 14 0.12 FMP1 FMP1504 FMP1599 - 30.10 49.08 20.81 0.00
CP 16 15.68 FMP1 FMP1505 FMP1600 - 30.00 48.92 21.08 0.00
CP 18 0.19 FMP1 FMP1506 FMP1601 - 30.06 49.02 20.92 0.00
LP 4 30.22 FMP1 FMP1507 FMP1602 - 30.00 48.92 21.08 0.00
LP 6 77.36 FMP1 FMP1508 FMP1603 - 30.00 48.92 21.08 0.00
LP 8 435.51 FMP1 FMP1509 FMP1604 - 30.00 48.92 21.08 0.00
LP 10 144.88 FMP1 FMP1510 FMP1605 - 30.00 48.92 21.08 0.00
LP 12 62.53 FMP1 FMP1511 FMP1606 - 30.00 48.92 21.08 0.00
LP 14 4.68 FMP1 FMP1512 FMP1607 - 30.00 48.92 21.08 0.00
EL 6 2.43 FMP1 FMP1513 FMP1608 - 30.00 48.92 21.08 0.00
EL 8 19.12 FMP1 FMP1514 FMP1609 - 30.00 48.92 21.08 0.00
EL 10 66.68 FMP1 FMP1515 FMP1610 - 30.00 48.92 21.08 0.00
EL 12 7.16 FMP1 FMP1516 FMP1611 - 30.00 48.92 21.08 0.00
JL 4 0.43 FMP1 FMP1517 FMP1612 - 30.02 48.95 21.04 0.00
JL 6 5.08 FMP1 FMP1518 FMP1613 - 30.00 48.92 21.08 0.00
JL 8 31.79 FMP1 FMP1519 FMP1614 - 30.00 48.92 21.08 0.00
JL 10 87.54 FMP1 FMP1520 FMP1615 - 30.00 48.92 21.08 0.00
JL 12 180.91 FMP1 FMP1521 FMP1616 - 30.00 48.92 21.08 0.00
JL 14 58.57 FMP1 FMP1522 FMP1617 - 30.00 48.92 21.08 0.00
DF 12 0.23 FMP1 FMP1523 FMP1618 - 30.05 49.00 20.95 0.00
DF 14 0.22 FMP1 FMP1524 FMP1619 - 30.06 49.02 20.92 0.00

290
CARBINE tree species code
Yield class
Total area of stratum (ha)
Allocated FMPs by index number Percentage allocation of FMPs to stratum area
No harvesting
No thinning, with clearcutting
Thinning, with clearcutting
Continuous cover
No harvesting
No thinning, with clearcutting
Thinning, with clearcutting
Continuous cover
DF 16 4.68 FMP1 FMP1525 FMP1620 - 30.00 48.92 21.08 0.00
DF 18 65.18 FMP1 FMP1526 FMP1621 - 30.00 48.92 21.08 0.00
DF 20 5.94 FMP1 FMP1527 FMP1622 - 30.00 48.92 21.08 0.00
DF 22 7.29 FMP1 FMP1528 FMP1623 - 30.00 48.92 21.08 0.00
GF 14 0.57 FMP1 FMP1529 FMP1624 - 30.02 48.94 21.04 0.00
NF 10 0.10 FMP1 FMP1530 FMP1625 - 30.04 48.99 20.97 0.00
NF 12 2.83 FMP1 FMP1531 FMP1626 - 30.00 48.92 21.08 0.00
NF 14 17.25 FMP1 FMP1532 FMP1627 - 30.00 48.92 21.08 0.00
NF 16 42.88 FMP1 FMP1533 FMP1628 - 30.00 48.92 21.08 0.00
NF 18 3.02 FMP1 FMP1534 FMP1629 - 30.00 48.92 21.08 0.00
NF 20 0.61 FMP1 FMP1535 FMP1630 - 30.01 48.93 21.06 0.00
WH 12 10.16 FMP1 FMP1536 FMP1631 - 30.00 48.92 21.08 0.00
WH 14 2.73 FMP1 FMP1537 FMP1632 - 30.00 48.92 21.08 0.00
WH 16 2.10 FMP1 FMP1538 FMP1633 - 30.00 48.92 21.08 0.00
WH 18 0.07 FMP1 FMP1539 FMP1634 - 30.14 49.14 20.73 0.00
RC 12 7.68 FMP1 FMP1540 FMP1635 - 30.00 48.92 21.08 0.00
RC 14 1.08 FMP1 FMP1541 FMP1636 - 30.00 48.92 21.07 0.00
RC 16 1.29 FMP1 FMP1542 FMP1637 - 30.00 48.92 21.08 0.00
RC 18 0.03 FMP1 FMP1543 FMP1638 - 30.37 49.51 20.12 0.00
OK 4 1 013.19 FMP1 FMP1544 FMP1639 - 90.00 5.19 4.81 0.00
OK 6 824.40 FMP1 FMP1545 FMP1640 - 90.00 5.19 4.81 0.00
OK 8 2 848.76 FMP1 FMP1546 FMP1641 - 90.00 5.19 4.81 0.00

291
CARBINE tree species code
Yield class
Total area of stratum (ha)
Allocated FMPs by index number Percentage allocation of FMPs to stratum area
No harvesting
No thinning, with clearcutting
Thinning, with clearcutting
Continuous cover
No harvesting
No thinning, with clearcutting
Thinning, with clearcutting
Continuous cover
AH 4 843.94 FMP1 FMP1547 FMP1642 - 90.00 5.19 4.81 0.00
AH 6 295.86 FMP1 FMP1548 FMP1643 - 90.00 5.19 4.81 0.00
AH 8 337.13 FMP1 FMP1549 FMP1644 - 90.00 5.19 4.81 0.00
AH 10 10.11 FMP1 FMP1550 FMP1645 - 90.00 5.19 4.81 0.00
AH 12 5.98 FMP1 FMP1551 FMP1646 - 90.00 5.19 4.81 0.00
BE 4 54.94 FMP1 FMP1552 FMP1647 - 90.00 5.19 4.81 0.00
BE 6 106.48 FMP1 FMP1553 FMP1648 - 90.00 5.19 4.81 0.00
BE 8 569.87 FMP1 FMP1554 FMP1649 - 90.00 5.19 4.81 0.00
BE 10 245.05 FMP1 FMP1555 FMP1650 - 90.00 5.19 4.81 0.00
BI 4 901.90 FMP1 FMP1556 FMP1651 - 90.00 5.19 4.81 0.00
BI 6 228.13 FMP1 FMP1557 FMP1652 - 90.00 5.19 4.81 0.00
BI 8 287.25 FMP1 FMP1558 FMP1653 - 90.00 5.19 4.81 0.00
BI 10 2.17 FMP1 FMP1559 FMP1654 - 90.00 5.19 4.81 0.00
SY 4 694.81 FMP1 FMP1560 FMP1655 - 90.00 5.19 4.81 0.00
SY 6 344.47 FMP1 FMP1561 FMP1656 - 90.00 5.19 4.81 0.00
SY 8 2 108.38 FMP1 FMP1562 FMP1657 - 90.00 5.19 4.81 0.00
SY 10 35.42 FMP1 FMP1563 FMP1658 - 90.00 5.19 4.81 0.00
SY 12 34.21 FMP1 FMP1564 FMP1659 - 90.00 5.19 4.81 0.00
PO 4 7.55 FMP1 FMP1565 FMP1660 - 90.00 5.19 4.81 0.00
PO 6 13.95 FMP1 FMP1566 FMP1661 - 90.00 5.19 4.81 0.00
PO 8 180.96 FMP1 FMP1567 FMP1662 - 90.00 5.19 4.81 0.00
PO 10 22.93 FMP1 FMP1568 FMP1663 - 90.00 5.19 4.81 0.00

292
CARBINE tree species code
Yield class
Total area of stratum (ha)
Allocated FMPs by index number Percentage allocation of FMPs to stratum area
No harvesting
No thinning, with clearcutting
Thinning, with clearcutting
Continuous cover
No harvesting
No thinning, with clearcutting
Thinning, with clearcutting
Continuous cover
PO 14 3.28 FMP1 FMP1569 FMP1664 - 90.00 5.19 4.81 0.00
NO 10 18.19 FMP1 FMP1570 FMP1665 - 90.00 5.19 4.81 0.00
293
Annex 7 Content of the explanatory note on the final UK National Forest Accounting Plan As required under Article 8 of the Land Use, Land Use Change and Forestry Regulation (841/2018), the UK submitted a draft National Forest Accounting Plan (NFAP) in December 2018. This was reviewed by the EU Land Use Land Use Change and Forestry Expert Group in April 2019 and a Compilation of the Synthesis Reports providing the Expert Group’s conclusions for each member state was published in May 2019. The European Commission then published recommendations to member states on their NFAPs in Staff Working Paper 213 (SWD) in June 2019.
The purpose of this annex is to describe how the conclusions of the Expert Group and the recommendations of the European Commission were addressed in the final UK National Forestry Accounting Plan provided to the European Commission in December 2019. Information is also provided on where to find relevant changes or additional information in the final NFAP, in response to each issue raised.
Technical recommendations in the European Commission SWD
The recommendations of the European Commission in the SWD have been reviewed and responses are given in Tables A7.1 and A7.2, with details of the action taken and where to find relevant information in the final NFAP.
Conclusions of the LULUCF Expert Group
The conclusions of the LULUCF Expert Group have also been reviewed. The points raised by the Expert Group have been covered in the responses to the SWD in Tables 1 and 2. For transparency, Table A7.3 is provided to help identify where to find the relevant information.
Other issues
In the final UK NFAP, the Forest Reference Level has been calculated by assuming that the transition to managed forest land occurs 20 years after the date of conversion from non-forest land use to ensure consistency with emissions and removals reported for forest land remaining forest land in the existing greenhouse gas inventories. In the draft NFAP a transition period of 30 years was used. Following article 6(2) of the LULUCF Regulation, the UK intends to categorise cropland, grassland, wetland, settlements or other land converted to forest land as making the transition to managed forest land from 30 years

294
after the date of conversion. It will be realised through a future technical correction to the Forest Reference Level. Information relevant to this point has been provided in Section 4.1 and Table 4.2 (pages 60 and 61).
References
UK National Forestry Accounting Plan (2018) https://www.gov.uk/government/publications/uk-national-forestry-accounting-plan-2021-to-2025
LULUCF Expert Group (2019) Compilation of Synthesis Reports, Technical Assessment of National Forest Accounting Plans as requested by the LULUCF Regulation 7 May 2019, https://ec.europa.eu/transparency/regexpert/index.cfm?do=groupDetail.groupMeetingDoc&docid=30965
European Commission (2019) Commission Staff Working Document, Assessment of the National Forestry Accounting Plans, European Commission, Brussels, Belgium, 18 June 2019. https://ec.europa.eu/energy/sites/ener/files/documents/staff_working_documet_en_212.pdf
Regulation (EU) 2018/841 of the European Parliament and of the Council on the inclusion of greenhouse gas emissions and removals from land use, land use change and forestry in the 2030 climate and energy framework, and amending Regulation (EU) No 525/2013 and Decision No 529/2013/EU. https://eur-lex.europa.eu/legal-content/EN/TXT/?uri=uriserv:OJ.L_.2018.156.01.0001.01.ENG

Table A7.1 Responses to recommendations in the SWD from the European Commission and action taken (Annex IV criteria, Section A)
Response Annex IV criteria (Section A principles)
SWD: recommendation from the Commission
Action taken Where to find relevant content in revised NFAP
1 (a) the reference level shall be consistent with the goal of achieving a balance between anthropogenic emissions by sources and removals by sinks of greenhouse gases in the second half of this century, including enhancing the potential removals by ageing forest stocks that may otherwise show progressively declining sinks
Demonstrate how the goal of achieving a balance between anthropogenic emissions and removals will be achieved in the second half of the century. Provide qualitative and quantitative information until at least 2050 consistent with the long-term strategy required under Regulation (EU) 2018/1999.
Additional information has been provided, showing the development of CO2 removals on Managed Forest Land from 2000 to 2050 under a “business as usual” scenario, noting that Managed Forest Land is consistently a net sink over this period.
Section 4.2, sub-section entitled, “Consistency of FRL projection with long-term emissions goal”, including new Figure 4.3 (pages 66 to 68).
2 (e) a constant ratio between solid and energy use of forest biomass as documented in the period from 2000 to 2009 shall be assumed
Provide a ratio between solid (HWP) and energy use of forest biomass as documented in the period from 2000 to 2009 used for the estimation of the forest reference level and demonstrate it remains constant throughout the projection.
It is confirmed that a constant ratio between solid (HWP) and energy use of forest biomass as documented in the period from 2000 to 2009 was used for the estimation of the forest reference level. Relevant additional supporting information and discussion is now provided in the NFAP
Section 3.3, sub-section entitled “Allocation of harvested wood to product types (energy and solid wood)”, including new Tables 3.12 and 3.13 (pages 49 to 52).
3 (g) the reference level shall be consistent with the national projections of anthropogenic greenhouse gas emissions by sources and removals by sinks reported under Regulation (EU) No 525/2013
Demonstrate the consistency with the national projections of anthropogenic greenhouse gas emissions reported under Regulation (EU) No 525/2013. Provide explanations for possible differences between national projections and the proposed FRL.
The methodology for constructing the FRL has been revised and improved to ensure better consistency between the FRL projection and national projections of anthropogenic greenhouse gas emissions reported under Regulation (EU) No 525/2013. Remaining differences between the projections are
Section 4.2, sub-section entitled, “Consistency of FRL projection with Regulation (EU) 525/2013”, including new Figure 4.2 (pages 65 and 66).

Response Annex IV criteria (Section A principles)
SWD: recommendation from the Commission
Action taken Where to find relevant content in revised NFAP
due to improvements made to modelling methodologies applied in producing GHG Inventories, as explained in an updated and expanded discussion.
4 (h) the reference level shall be consistent with greenhouse gas inventories and relevant historical data and shall be based on transparent, complete, consistent, comparable and accurate information. In particular, the model used to construct the reference level shall be able to reproduce historical data from the National Greenhouse Gas Inventory
Estimate the FRL based on the area under forest management as indicated in Annex IV, Part B (e) i. Use the conversion period for Land converted to forest land (Afforested Land) consistent with the latest national GHG inventory.
The calculation of the FRL projection has been updated to ensure that forest areas referred to are consistent with the National GHG Inventory and that a transition period of 20 years has been used for the conversion of “Afforested land” to Managed Forest Land. Relevant discussion, tables and figures have been updated.
Section 3.1, Box 3.2 and associated discussion (pages 20 and 21). Section 3.2.1, including Table 3.2 (total areas of forest strata, pages 21 to 23). Section 3.2.2, sub-section entitled, “Projected forest area”, including revised (corrected) Table 3.10 and corrected and expanded Table 3.11 (pages 38 to 40).
5 (h) the reference level shall be consistent with greenhouse gas inventories and relevant historical data and shall be based on transparent, complete, consistent, comparable and accurate information. In particular, the model used to construct the reference level shall be able to reproduce historical data from the National Greenhouse Gas Inventory
Explain the difference of approximately 2 Mt CO2 between the national GHG inventory and FRL for the reference period (Figure 4.1 in the NFAP).
Figure 4.1, which was not consistent with Table 4.1 has been corrected.
Section 4.2, includes a revised Figure 4.1 (pages 63 to 65).

Response Annex IV criteria (Section A principles)
SWD: recommendation from the Commission
Action taken Where to find relevant content in revised NFAP
6 (h) the reference level shall be consistent with greenhouse gas inventories and relevant historical data and shall be based on transparent, complete, consistent, comparable and accurate information. In particular, the model used to construct the reference level shall be able to reproduce historical data from the National Greenhouse Gas Inventory
Demonstrate possible impacts of the different age-class structures used in the FRL and national GHG inventory in the reference period and on the trends during the years 2010-2016.
The calculation of the FRL projection has been updated to ensure that age class distributions of forest areas in the FRL projection are consistent with the National GHG Inventory up to the end of the Reference Period (2009).
Section 3.1, Box 3.2 and associated discussion (pages 20 and 21). Section 3.2.2, sub-section entitled, “Projected forest area”, including revised Figures 3.3 and 3.4 (pages 38 to 40).

Table A7.2 Responses to recommendations in the SWD from the European Commission and action taken (Annex IV criteria, Section B)
Response Annex IV criteria (Section B elements)
SWD: recommendation from the Commission
Action taken Where to find relevant content in revised NFAP
7 b) identification of the carbon pools and greenhouse gases which have been included in the forest reference level, reasons for omitting a carbon pool from the forest reference level determination, and demonstration of the consistency between the carbon pools included in the forest reference level
Provide missing information on non-CO2 emissions from drained organic soils for the FRL, which are reported in GHG inventory.
Relevant information has been added to the NFAP giving details of estimated non-CO2 emissions from drained organic and mineral soils, along with discussion of calculation methods.
Section 3.3, sub-section entitled, “Modelling of non-CO2 emissions occurring on Managed Forest Land”, including Table 3.16 (pages 59 to 60). Section 4.1, including amended Table 4.1 (page 61 to 62). Section 4.3, including amended Table 4.3 (page 68 to 69).
8 c) a description of approaches, methods and models, including quantitative information, used in the determination of the forest reference level, consistent with the most recently submitted national inventory report, and a description of documentary information on sustainable forest management practices and intensity as well as of adopted national policies;
c) Provide more detailed information on the calculation of the background level for natural disturbances, consistent with Regulation (EU) 2018/841.
More detailed information describing the calculation of the background level for natural disturbances has been included.
Section 3.3, sub-section entitled, “Natural Disturbances”, including Tables 3.14 and 3.15 and Figure 3.9 (pages 53 to 58).
9 e) a description of how each of the following elements were considered in the determination of the forest reference level: i) the area under forest management
Provide the area under forest management consistent with Table 4.A (“Forest land remaining Forest land”) from the latest national GHG inventory using the year preceding the
The calculation of the FRL projection has been updated to ensure that forest areas referred to are consistent with the 2019 National GHG Inventory submission
Section 3.1, Box 3.2 and associated discussion (pages 20 and 21). Section 3.2.1, including Table 3.2 (total areas of forest strata, pages 21 to 23). Section 3.2.2, sub-section entitled, “Projected forest area”, including revised (corrected)
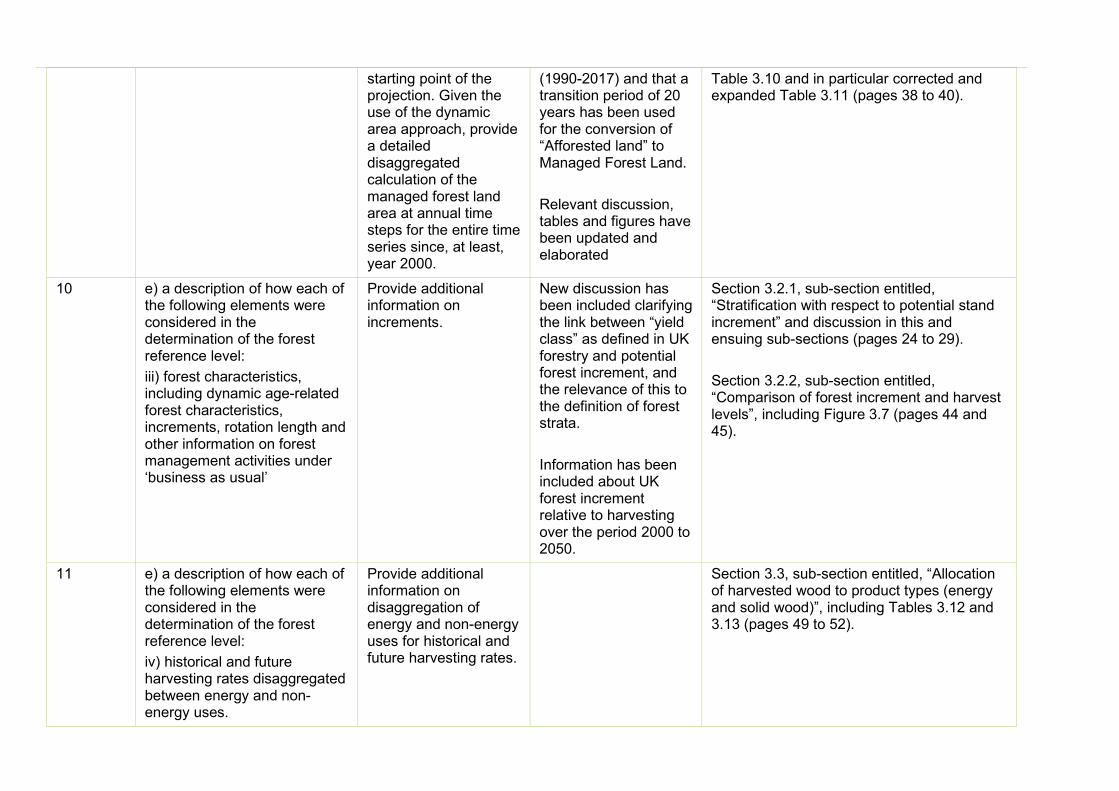
starting point of the projection. Given the use of the dynamic area approach, provide a detailed disaggregated calculation of the managed forest land area at annual time steps for the entire time series since, at least, year 2000.
(1990-2017) and that a transition period of 20 years has been used for the conversion of “Afforested land” to Managed Forest Land. Relevant discussion, tables and figures have been updated and elaborated
Table 3.10 and in particular corrected and expanded Table 3.11 (pages 38 to 40).
10 e) a description of how each of the following elements were considered in the determination of the forest reference level: iii) forest characteristics, including dynamic age-related forest characteristics, increments, rotation length and other information on forest management activities under ‘business as usual’
Provide additional information on increments.
New discussion has been included clarifying the link between “yield class” as defined in UK forestry and potential forest increment, and the relevance of this to the definition of forest strata. Information has been included about UK forest increment relative to harvesting over the period 2000 to 2050.
Section 3.2.1, sub-section entitled, “Stratification with respect to potential stand increment” and discussion in this and ensuing sub-sections (pages 24 to 29). Section 3.2.2, sub-section entitled, “Comparison of forest increment and harvest levels”, including Figure 3.7 (pages 44 and 45).
11 e) a description of how each of the following elements were considered in the determination of the forest reference level: iv) historical and future harvesting rates disaggregated between energy and non-energy uses.
Provide additional information on disaggregation of energy and non-energy uses for historical and future harvesting rates.
Section 3.3, sub-section entitled, “Allocation of harvested wood to product types (energy and solid wood)”, including Tables 3.12 and 3.13 (pages 49 to 52).
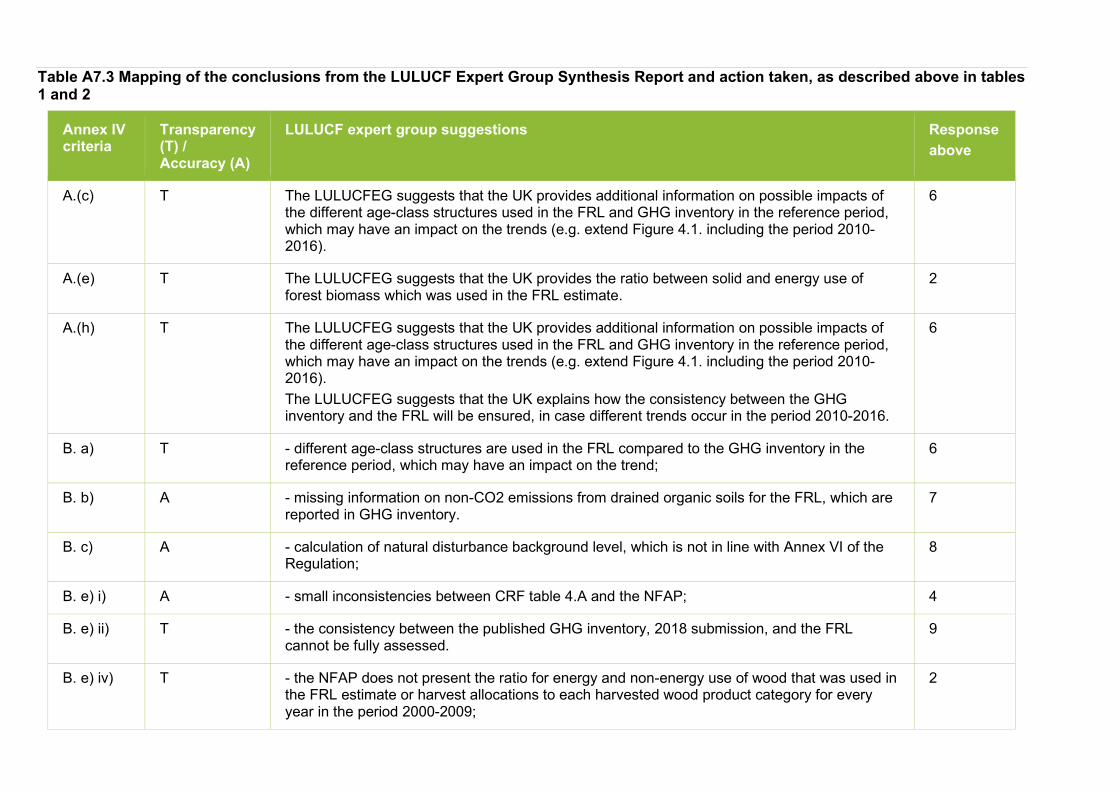
Table A7.3 Mapping of the conclusions from the LULUCF Expert Group Synthesis Report and action taken, as described above in tables 1 and 2
Annex IV criteria
Transparency (T) /Accuracy (A)
LULUCF expert group suggestions Response above
A.(c) T The LULUCFEG suggests that the UK provides additional information on possible impacts of the different age-class structures used in the FRL and GHG inventory in the reference period, which may have an impact on the trends (e.g. extend Figure 4.1. including the period 2010-2016).
6
A.(e) T The LULUCFEG suggests that the UK provides the ratio between solid and energy use of forest biomass which was used in the FRL estimate.
2
A.(h) T The LULUCFEG suggests that the UK provides additional information on possible impacts of the different age-class structures used in the FRL and GHG inventory in the reference period, which may have an impact on the trends (e.g. extend Figure 4.1. including the period 2010-2016). The LULUCFEG suggests that the UK explains how the consistency between the GHG inventory and the FRL will be ensured, in case different trends occur in the period 2010-2016.
6
B. a) T - different age-class structures are used in the FRL compared to the GHG inventory in thereference period, which may have an impact on the trend;
6
B. b) A - missing information on non-CO2 emissions from drained organic soils for the FRL, which arereported in GHG inventory.
7
B. c) A - calculation of natural disturbance background level, which is not in line with Annex VI of theRegulation;
8
B. e) i) A - small inconsistencies between CRF table 4.A and the NFAP; 4
B. e) ii) T - the consistency between the published GHG inventory, 2018 submission, and the FRLcannot be fully assessed.
9
B. e) iv) T - the NFAP does not present the ratio for energy and non-energy use of wood that was used inthe FRL estimate or harvest allocations to each harvested wood product category for everyyear in the period 2000-2009;
2

© Crown copyright 2020
This publication is licensed under the terms of the Open Government Licence v3.0 except where otherwise stated. To view this licence, visit nationalarchives.gov.uk/doc/open-government-licence/version/3 or write to the Information Policy Team, The National Archives, Kew, London TW9 4DU, or email: [email protected] we have identified any third party copyright information you will need to obtain permission from the copyright holders concerned.
This publication available from www.gov.uk/beis
Contact us if you have any enquiries about this publication, including requests for alternative formats, at:
Department for Business, Energy and Industrial Strategy 1 Victoria Street London SW1H 0ET Tel: 020 7215 5000
Email: [email protected]