uk oil and gas reserves and resources · boe. on the basis of current production ... to 9.2 billion...
TRANSCRIPT

UK Oil and Gas Reserves and ResourcesAs at end 2016

Contents
1. Executive summary 3
2. UK Reserves and resources 4
3. Oil and gas reserves and contingent resources
progression 6
4. Detailed breakout of oil and gas resources 12
5. Prospective resources 19
6. Unconventional resources 21
Appendices
A. Data sources 23
B. Reserves and resources – OGA classification and
comparison of OGA vs SPE PRMS 24
C. Methodology for generating the estimates of
prospective resources 26
UK Oil and Gas Reserves and Resources as at end 20163
1. Executive summary
The Oil and Gas Authority (OGA) estimate forremaining UK recoverable petroleum reserves and resources is in the range 10 to 20 billion barrels of oil equivalent (boe).
The key findings of this report include:
• The UK has significant remaining petroleum reserves. The OGA’s estimate for proven and probable (2P) UK reserves is 5.7 billion boe. On the basis of current production forecasts1, this could sustain production from the UKCS for another 20 years or more
• Replacement of proven and probable reserves remains a concern. In 2016 approximately 600 million boe were produced however only 80 million boe of contingent resources were matured to reserves. This indicates a reserve replacement ratio of 13% resulting in an underlying decline of the proved resources
• The UK contingent resource level is significant with estimates of discovered undeveloped resources of 7.4 billion boe. Much of this resource is in mature developed areas and under consideration for development
• The maturation of contingent resources presents significant opportunity for the continued development of the UK’s petroleum resources. This will require substantial investment in new field developments and incremental projects. To achieve a reserves replacement of 25% over the next five years at an average unit development cost of £12 per boe will require some £9 billion of investment
• Exploration success in 2016 delivered a 210 million boe addition to the contingent resources. A key part of the exploration stewardship process is for industry and OGA to work to stimulate interest and activity to de-risk leads to enable more drillable prospects to be identified and drilled
• The OGA’s estimate of prospective (i.e. undiscovered) resources is 6.0 billion boe, with a range from 1.9 billion boe (lower estimate) to 9.2 billion boe (upper estimate). The estimate of prospective (undiscovered) resources is founded on the geological attributes associated with approximately 3000 identified leads and prospects
1 https://www.ogauthority.co.uk/data-centre/data-downloads-and-publications/production-projections/

UK Oil and Gas Reserves and Resources as at end 20164
2. UK Reserves and Resources
The OGA estimate for remaining UK recoverable petroleum reserves and resources is in the range 10 to 20 billion boe. A total of some 43.5 billion boe has been produced to date from the UK and UK Continental Shelf (UKCS).
The OGA’s current central estimates as at the end of 2016 are summarised in Table 1 below (estimates as at the end of 2015 are in parentheses).
Table 1 – Oil and gas reserves and resources central estimates as at end 2016 in billion boe
Ranges for these estimates are set out in sections 4 and 5.
Overall oil and gas reserves as at the end of 2016 showed a reduction compared to end 2015. This is a result of production of 0.6 billion boe in 2016 exceeding additions to the reserves base as a result of field development plan (FDP) approvals and reserves adjustments for producing fields.
The OGA’s central estimate of contingent resources in proposed new developments is 1.9 billion boe with 3.2 billion boe in “other discoveries”. This represents a significant resource potential, similar to the end 2015 total. Within the total there has been a movement of 0.4 billion boe from the “other discoveries” category to the proposed new developments category.
Data for contingent resources in producing fields were collected for the first time in 2016. This is a significant additional resource category identified through the 2016 Stewardship Survey that was not previously reported.
The OGA’s central estimate of prospective (undiscovered) resources is 6.0 billion boe, with a range from 1.9 billion boe (lower estimate) to 9.2 billion boe (upper estimate). These estimates are unchanged from those as at the end of 2015. Taking account of this range of possibilities for prospective resources, together with the range of discovered reserves and contingent resources shown in section 4, our current best estimate of remaining recoverable hydrocarbon resources from the UKCS is in the range 10 to 20 billion boe.
Reserves 2P
Reserves 5.7 (6.3)
Contingent resources 2C
Producing fields 2.3 (-)
Proposed new developments 1.9 (1.4)
Other discoveries 3.2 (3.6)
Prospective resources Central
Prospective resources 6.0 (6.0)
Note: The classification of reserves and resources is explained in Appendix B.

UK Oil and Gas Reserves and Resources as at end 20165
Note
Definitions of these terms, and how the OGA categorisation compares to the Society of Petroleum Engineers (SPE) Petroleum Resources Management System (PRMS), are set out in Appendix 2. Reserves and resources for developed fields and fields where development projects are under discussion were compiled from data provided by operators – these data have not been audited by the OGA.
Proven, probable and possible reserves and resources for a large number of individual fields and discoveries have been aggregated to provide the totals shown. Note that figures for prospective (i.e. not yet discovered or “yet-to-find”) resources are naturally subject to a higher degree of uncertainty than those for discovered resources. There will also be varying degrees of uncertainty in how much of the contingent resources will ultimately be developed.
Summing the overall estimates of the three categories of resources (reserves, contingent resources and prospective resources) does not imply any particular levels of probability that those volumes will ultimately be produced.
UK Oil and Gas Reserves and Resources as at end 20166
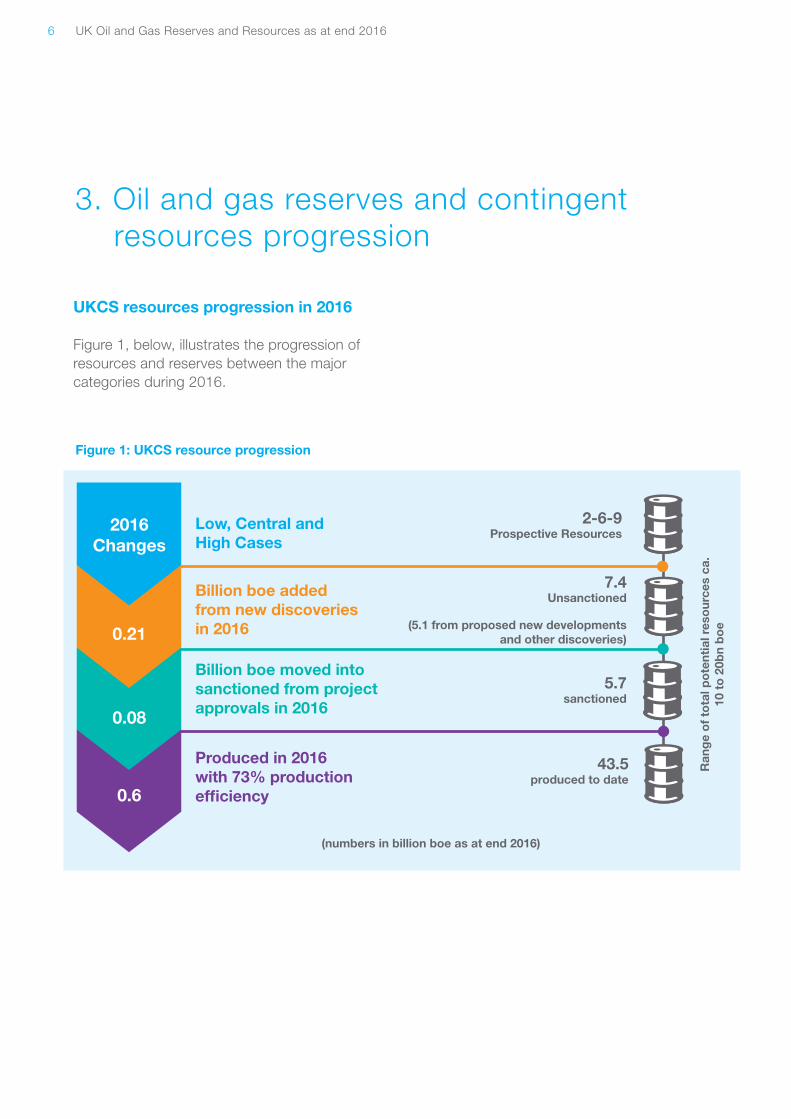
2-6-9Prospective Resources
7.4Unsanctioned
(5.1 from proposed new developments and other discoveries)
5.7sanctioned
43.5produced to date
UKCS resources progression in 2016
Figure 1, below, illustrates the progression of resources and reserves between the major categories during 2016.
3. Oil and gas reserves and contingent resources progression
Figure 1: UKCS resource progression
2016Changes
0.21
0.08
0.6
Low, Central and High Cases
Billion boe added from new discoveries in 2016
Billion boe moved into sanctioned from project approvals in 2016
Produced in 2016 with 73% production efficiency
Ran
ge
of
tota
l po
tent
ial r
eso
urce
s ca
. 10
to
20b
n b
oe
(numbers in billion boe as at end 2016)

UK Oil and Gas Reserves and Resources as at end 20167
Reserves
FDPs consented to in 2016 (two new field developments and seven FDP addenda for incremental projects) resulted in 80 million barrels of oil equivalent movement from contingent resources to reserves. There were though larger negative adjustments to the reserves estimates for producing fields.
Figure 2: 2P reserve changes from end 2015 to end 2016
bill
ion
bo
e
7.0
6.0
5.0
4.0
3.0
2.0
1.0
0.0end 2015 2016
productionadditions adjustments end 2016
2P Reserve changes from end 2015 to end 2016

UK Oil and Gas Reserves and Resources as at end 20168
8.0
7.0
6.0
5.0
4.0
3.0
2.0
1.0
0.0
Contingent resources
There were a number of changes within the contingent resources categories, as a result of:
• Four new discoveries from exploration successes in 2016 adding 210 million boe to the contingent resource base
• Data for contingent resources in producing fields being collected for the first time in 2016. This is a significant additional resource identified through the UKCS Asset Stewardship Survey that was not previously reported. These volumes represent
operators’ views of potential resources within current fields, such as future infield drilling and areas of the field not currently developed. These volumes will require further work before they can be considered to be commercial
• There have been some minor movements within the contingent resources category not represented in Figure 3, below. 371 million boe has moved from contingent resources in “other discoveries” to the “proposed new developments“ category as a result of projects being proposed for seven discoveries
Figure 3: 2C resource changes from end 2015 to end 2016
bill
ion
bo
e
end 2015 Moves to reserves
Exploration Producing fields
end 2016
2C Reserve changes from end 2015 to end 2016

UK Oil and Gas Reserves and Resources as at end 20169
3.1 Production and reserves replacement trends
Figure 4 below shows how production and the central estimate of reserves have changed in the last five years.
Figure 4: 2P reserves and production 2012 to 2016
10
9
8
7
6
5
4
3
2
1
0
Res
erve
s (b
illio
n b
oe)
2012 2013 2014 2015 2016
UKCS 2P Reserves and production vs time 2012 - 2016
Year2P Reserves Annual Production assumes 5800 scf/boe

UK Oil and Gas Reserves and Resources as at end 201610
Reserves replacement ratio
This provides an indication of how current production levels are being replenished through the maturation of contingent resources and exploration discoveries into reserves.
The trends over a period of years are a relevant indicator to what extent the current reserve base is being replenished.
Whilst the contingent resource base is significant at 7.4 billion boe, there remains a significant opportunity to develop known accumulations.
The underlying reserves replacement ratio in 2016 was 13%. 80 million boe of reserves were added as a result of two Field Development Plans and
seven Field Development Plan addenda consents. This compares to production of around 600 million boe in 2016.
The negative reserves replacement ratio in 2015 was a result of the OGA re-categorising certain types of project from reserves to contingent resources. Prior to 2015, the Department of Energy and Climate Change (DECC) and its predecessors included in the reserves category projects that had not yet been sanctioned but were expected to be sanctioned in the near future. This is permitted under the SPE PRMS, however the OGA now only includes projects in the Reserves category where the project has been sanctioned by the participants and the OGA has issued a Development and Production Consent.
Figure 5: Oil and gas 2P reserves replacement
150%
100%
50%
0%
-50%
-100%
-150%
-200%
Oil & Gas 2P Reserves Replacement
2012
2013
2014
2015
2016
Res
erve
s R
epla
cem
ent

UK Oil and Gas Reserves and Resources as at end 201611
Long term historic trend plots
The plots below show how overall estimated ultimate recovery (EUR) grew during the 1970s, 80s and 90s. However EUR is now static as a result of low reserves replacement and recent reserves downgrades due to the fall in oil price.
Figure 6: Oil production and reserves v time (to end 2016)
Figure 7: Gas production and reserves v time (to end 2016)
Oil
(bill
ion
bar
rels
of
oil
equi
vale
nt)
Gas
(bill
ion
bar
rels
of
oil
equi
vale
nt)
40
35
30
25
20
15
10
5
0
1979
1980
1981
1982
1983
1984
1985
1986
1987
1988
1989
1990
1991
1992
1993
1994
1995
1996
1997
1998
1999
2000
2001
2002
2003
2004
2005
2006
2007
2008
2009
2010
2011
2012
201
3
2014
2015
2016
Oil Production and Reserves v Time to end 2016
Gas Production and Reserves v Time to end 2016
1979
1980
1981
1982
1983
1984
1985
1986
1987
1988
1989
1990
1991
1992
1993
1994
1995
1996
1997
1998
1999
2000
2001
2002
2003
2004
2005
2006
2007
2008
2009
2010
2011
2012
201
3
2014
2015
2016
25
20
15
10
5
0
Cumulative Production Proven and Probable Reserves Possible Reserves Contingent Resources (Central Est.)

UK Oil and Gas Reserves and Resources as at end 201612
The following tables indicate the spilt of petroleum liquids and gas reserves and resources. UK remaining reserves and contingent resources are predominantly oil (two thirds) rather than gas (one third).
4. Detailed breakout of oil and gas reserves and resources
Reserves 1P 2P 3P
Reserves 3.6 (3.9) 5.7 (6.3) 7.5 (8.2)
Contingent resources 1C 2C 3C
Producing fields 0.3 (-) 2.3 (-) 2.5 (-)
Proposed new developments 0.9 (0.6) 1.9 (1.4) 3.0 (2.6)
Other discoveries 1.4 (1.5) 3.2 (3.6) 6.0 (7.2)
Total contingent resources 2.6 (2.1) 7.4 (5.0) 11.5 (9.8)
Prospective resources Lower Central Upper
Prospective resources 1.9 (1.9) 6.0 (6.0) 9.2 (9.2)
Table 2 – Oil and gas reserves and resources as at end 2016 (2015) in billion boe
Note: The classification of reserves and resources is explained in Appendix B.
Oil 1P 2P 3P
Oil reserves 2.5 (2.6) 3.8 (4.2) 5.2 (5.5)
Oil contingent resources 1C 2C 3C
Producing fields 0.2 ( ) 1.6 ( ) 1.7 ( )
Proposed new developments 0.6 (0.5) 1.4 (1.0) 2.3 (2.0)
Other discoveries 0.8 (0.8) 2.0 (2.3) 4.0 (5.0)
Total contingent resources 1.6 (1.3) 5.0 (3.3) 8.0 (7.0)
Table 3 Oil reserves and resources as at end 2016 (2015) in billion boe

UK Oil and Gas Reserves and Resources as at end 201613
Taking account of the ranges of possibilities for discovered reserves, contingent resources and prospective resources shown in table 2 above, our current best estimate of remaining recoverable hydrocarbon resources from the UKCS is in the range 10 to 20 billion boe.
To obtain a lower estimate for a range for the total potential for the UKCS, we consider the central estimates for reserves (5.7 billion boe 2P), contingent resources in proposed new developments (1.9 billion boe 2C), and the lower estimates of contingent resources in other discoveries on licensed acreage (1.0 billion boe) and prospective resources (1.9 billion boe) to obtain ca. 10 billion boe. To obtain a central estimate for a range for the total potential for the UKCS, we consider the central estimates of reserves and contingent resources in proposed new developments together with the central
estimates of contingent resources on licenced acreage (2.2 billion boe) and prospective resources (6.0 billion boe) to obtain ca. 15 billion boe. A higher estimate of 20 billion boe is considered reasonable given the upside potential reflected in possible reserves, contingent resources in producing fields and contingent resources on other discoveries currently on unlicensed acreage.
There are many uncertainties surrounding any such estimates of the total potential for the UKCS, particularly on the extent to which prospective hydrocarbon resources not yet discovered will in the event be produced. Summing the overall estimates of the various categories of resources (Reserves, Contingent Resources, and Prospective Resources) does not imply any particular levels of probability that those volumes will ultimately be produced.
Gas 1P 2P 3P
Gas reserves 1.1 (1.3) 1.8 (2.0) 2.3 (2.7)
Contingent resources 1C 2C 3C
Producing fields 0.1 (-) 0.7 ( ) 0.8 ( )
Proposed new developments 0.3 (0.2) 0.5 (0.4) 0.7 (0.5)
Other discoveries 0.6 (0.6) 1.3 (1.3) 2.1 (2.2)
Total contingent resources 1.0 (0.8) 2.5 (1.7) 3.6 (2.7)
Table 4 Gas reserves and resources as at end 2016 (2015) in billion boe
Due to rounding, subtotals may not exactly equal the sum or difference of the values entered elsewhere in the table
(note – data for contingent resources in producing fields were not collected prior to 2016).

UK Oil and Gas Reserves and Resources as at end 201614
Gas reserves distribution by type
Figure 8 indicates how UKCS gas reserves and contingent resources in proposed new developments are distributed between dry gas fields, gas from condensate fields and associated gas from oil fields.
The largest contribution to future production is expected to come from gas condensate fields.
The contingent resources in proposed new developments are smaller than the developed reserves base. There is a significant inventory of gas contingent resources (not shown in figure 8 or tables 5 and 6) in producing fields and in other discoveries where development plans are not currently under discussion – further work will be required to mature these gas contingent resources to contribute to the future reserves base.
Figure 8: Distribution of UKCS gas reserves and resources (central case)
Distribution of UKCS Gas Reserves and Resources (Central Case)
7000
6000
5000
4000
3000
2000
1000
0Dry Gas Southern Basic Dry Gas Other Areas Gas Condensate fields Associated gas from oil fields
Gas
Res
erve
s an
d R
eso
urce
s (b
cf)
2P Reserves 2C Resources

UK Oil and Gas Reserves and Resources as at end 201615
Tables 5 and 6 indicate the ranges associated with gas reserves (table 5) and contingent resources in proposed new developments (table 6).
Fields in production or under development 1Pbcf
2Pbcf
3Pbcf
Gas reserves from dry gas fields
Southern basin 2130 (2507) 3239 (3708) 4353 (4944)
Other areas 402 (530) 602 (742) 769 (954)
Gas reserves from gas condensate fields 2806 (3390) 5372 (5827) 6760 (7946)
Gas reserves from associated gas from oil fields 882 (918) 1292 (1483) 1725 (1907)
Fields where proposed development plans are under discussion
1Cbcf
2Cbcf
3Cbcf
Gas resources from dry gas fields
Southern basin 539 (94) 767 (292) 1020 (452)
Other areas 20 (15) 35 (25) 125 (37)
Gas resources from gas condensate fields 225 (172) 1048 (674) 1198 (974)
Gas reserves from associated gas from oil fields 184 (644) 354 (1193) 476 (1678)
Table 5
Table 6
*Ranges are shown in the above table (all figures in bcf, end 2015 values in brackets)

UK Oil and Gas Reserves and Resources as at end 201616
Figure 9: Oil reserve and resource movements by area (central case 2P/2C)
Petroleum resource distribution by geographic area
Figures 9 and 10 show the distribution of UK oil and gas reserves and resources by area, shown below. Significant potential remains in the UKCS, predominantly in the Central North Sea (CNS), Southern North Sea (SNS) and West of Shetland (WoS). Indicatively, most oil reserves are within the CNS and WoS areas with significant gas potential in the CNS.
Oil
Res
erve
s an
d R
eso
urce
s (m
illio
n b
oe)
Oil Reserves and Resource Movements by area (Central Case 2P/2C)
end 2015 end 2015 end 2015 end 2015end 2016 end 2016 end 2016 end 2016
4500
4000
3500
3000
2500
2000
1500
1000
500
0
Reserves Resources in producing fields
Resources in proposed new developments
Resources in other discoveries
IS SNS CNS NNS WOS

UK Oil and Gas Reserves and Resources as at end 201617
Figure 10: Gas reserves and resources movements by area (central case 2P/2C)
Gas
Res
erve
s an
d R
eso
urce
s (b
cf)
Gas Reserves and Resource Movements by area (Central Case 2P/2C)
end 2015 end 2015 end 2015 end 2015end 2016 end 2016 end 2016 end 2016
Reserves Resources in producing fields
Resources in proposed new developments
Resources in other discoveries
IS SNS CNS NNS WOS
2000
4000
6000
8000
10000
12000
0

UK Oil and Gas Reserves and Resources as at end 201618
Figure 11: Contingent resources (2C) on licensed and unlicensed acreage
0
0.50
1.00
1.50
2.00
2.50
Contingent resources (2C) on licensed and unlicensed acreage
IS SNS CNS NNS WOS
2C licensed 2C unlicensed
Co
ntin
gen
t R
eso
urce
s (b
illio
n b
oe)
A significant resource potential remains in unlicensed acreage. A breakdown of contingent resources by area and licensed/unlicensed acreage is shown in Figure 11 below. This shows that approximately one third of the contingent resources in other discoveries (1 billion boe from a total of 3.2 billion boe) was on unlicensed acreage at the end of 2016. This acreage has been made available in the 30th Offshore Licensing Round.

UK Oil and Gas Reserves and Resources as at end 201619
The OGA’s estimate of prospective resources (i.e. those volumes associated with accumulations that have not yet been discovered) remains 6.0 billion boe, with a range from 1.9 billion boe (lower estimate) to 9.2 billion boe (upper estimate). These estimates have been derived from a database of over 3,000 mapped prospects and leads.
The prospects and leads used to generate the estimates of prospective resources include many with high geological risk. The lower estimate of 1.9 billion boe is obtained by considering only those prospects and leads currently estimated to have a geological chance of success of greater than 20%. This is an estimate of what could be expected to be recoverable based on recent drilling activity.
The central estimate of 6.0 billion barrels of oil equivalent is obtained by considering prospects
and leads with a geological chance of success of greater than 10%. This is considered a reasonable estimate based on current knowledge.
The upper estimate of 9.2 billion boe is obtained by considering all prospects and leads with a geological chance of success of greater than 5%. This is considered possible with a de-risking of prospects that might arise from a better understanding of the basins or better technology.
Figure 12 demonstrates how the estimates of prospective resources vary according to the level of geological risk chosen as a cut off. As the geological chance of success cut off increases, the prospect inventory decreases leading to a lower risked outcome for a given geological chance of success.
5. Prospective resources
6
5
4
3
2
1
00 5 10 15 20 25 30
12
11
10
9
8
7
Oil and Gas Prospective Resources shown at different levels of geological risk
bill
ion
bo
e
Geological Chance of Success cut off (%)
Figure 12

UK Oil and Gas Reserves and Resources as at end 201620
The methodology for generating the estimates of prospective resources is set out in more detail in appendix C.
Estimates of prospective resources must be treated with caution. They provide only a broad indication of the ultimate remaining potential. The limits of the ranges given should not be regarded as minima or maxima. The mid-range figures do not imply that these volumes are the most likely to be discovered.
A major review of the methodology and estimates for prospective resources is underway and will be delivered by Q4 2018 per the OGA’s corporate plan. The review will centre around :1. Calibration of prospective resource predictions
to actual performance, 2. Review of the lead and prospect inventory, and 3. A more complete estimate of unmapped
potential.

UK Oil and Gas Reserves and Resources as at end 201621
Preliminary estimates of in place resources for unconventional gas and oil (shale oil and gas and coal bed methane) are available on the Onshore Reports section of the OGA web site.https://www.ogauthority.co.uk/exploration-production/onshore/
The shale gas and shale oil estimates are “in-place” figures and so represent the gas and oil that is believed to be present, not the amounts that might be possible to extract. The proportion of the shale gas and oil that it may be possible to extract is unknown at present as it depends on the economic, geological and societal factors and licence to operate that will prevail at each operation. It will not be possible to make meaningful estimates of shale gas or shale oil reserves until there is much more data available on actual production experience from a number of UK wells.
6. Unconventional resources

UK Oil and Gas Reserves and Resources as at end 201622
APPENDICES
UK Oil and Gas Reserves and Resources as at end 201623
The data for both developed fields and development projects under discussion were compiled from data provided by operators via the OGA’s annual UKCS Stewardship Survey. The survey also collected data on contingent resources in producing fields – these data were not previously collected.
The survey covered:• 326 producing fields • 22 projects where an FDP had been
approved but production had not yet started• 31 other projects where FDPs were under
discussion as at the end of 2016
Data for unsanctioned discoveries where no development project is under discussion (referred to as potential additional resources in previous Department of Energy and Climate Change reports), were not collected via the UKCS Stewardship Survey.
OGA in-house data used for the UK Continental Shelf Unsanctioned Discoveries Information Pack2 were updated to reflect the status as at end 2016 (taking into account activity in the second half of 2016). These contingent resources have been split between those on licensed acreage (202 discoveries as at end 2016) and those on unlicensed acreage (154 discoveries as at end 2016).
Estimates for prospective resources were generated from a database of over 3,000 mapped leads and prospects across the UKCS. This database was compiled from Licence Round application documents and submissions to DECC/BERR as part of the Fallow Block review process3. Leads and prospects identified by DECC and BGS regional studies are also included.
The methodology for deriving estimates for prospective resources is set out in appendix C.
Conversion factors:
The approach used to calculate barrels of oil equivalent is based upon the following (approximate) conversion factors:
1 tonne of crude oil = 7.5 barrels of oil equivalent1 cubic metre of gas = 35.31 cubic feet of gas1 cubic foot of gas = 1/5800 barrels of oil equivalent
Appendix A. Data sources
2 https://www.ogauthority.co.uk/media/2960/420297-small-pools-22.pdf
3 https://www.gov.uk/guidance/oil-and-gas-fallow-blocks-and-discoveries#what-is-the-fallow-process

UK Oil and Gas Reserves and Resources as at end 201624
The OGA has sought to adjust its definitions and are now more closely aligned with those recommended by the Petroleum Resources Management System (PRMS) of the Society of Petroleum Engineers (SPE). The full definitions associated with this classification system can be found in SPE PRMS 2005 (updated 2011)4.
The OGA therefore now classifies reserves and resources into the following main categories: reserves, contingent resources and prospective resources, with further sub classes aligned with SPE PRMS as laid out in Figure 13.
Appendix B. Comparison of OGA terminology with SPE PRMS
Figure 13: Sub-classes based on project maturity
RESERVES
PRODUCTION
CONTINGENTRESOURCES
PROSPECTIVERESOURCES
TOTA
L P
ETR
OLE
UM
INIT
IALL
Y IN
PLA
CE
(PIIP
)
DIS
CO
VE
RE
D P
IIP
On Production
Approved for Development
Justified for Development
Development Pending
Development Unclarifiedor On Hold
Developmentnot Viable
Prospect
Lead
Play
SU
B-C
OM
ME
RC
IAL
CO
MM
ER
CIA
L
Reserves
ContingentResources
Fields in productionor under
development
Contingent Resources in producing fields
Proposed new developments
Other Discoveries
ProspectiveResources
Prospects and Leads
Lower(1P)
Central(2P)
Central(2C
Upper(3P)
Upper(3C)
Lower(1C)
Lower Central Upper
OGA in house
OGA in house
Data Source
UK
Ste
war
dshi
p su
rvey
Incr
easi
ng C
hanc
e of
Com
mer
cial
ity
Range of Uncertainty
Source - SPE 2011
UN
DIS
CO
VE
RE
D P
IIP
UNRECOVERABLE
UNRECOVERABLE
4 http://www.spe.org/industry/docs/PRMS_Guidelines_Nov2011.pdf

UK Oil and Gas Reserves and Resources as at end 201625
Reserves
These are discovered, remaining volumes that are recoverable and commercial. They can be proven, probable or possible, depending on confidence level.
In the UKCS Stewardship Survey, operators were asked to provide reserves data in accordance with the following definitions for fields in production or under development (in accordance with previous DECC/DTI guidance)
• Proven (1P): Reserves that, on the available evidence, are virtually certain to be technically and commercially producible, i.e. have a better than 90% chance of being produced
• Probable (2P): Reserves that are not yet proven, but which are estimated to have a better than 50% chance of being technically and commercially producible
• Possible (3P): Reserves that at present cannot be regarded as probable, but which are estimated to have a significant – but less than 50% – chance of being technically and commercially producible
Contingent resources
Contingent resources are those quantities of petroleum estimated to be potentially recoverable from known accumulations, but the applied project(s) are not yet considered mature enough for commercial development.
In the UKCS Stewardship Survey, operators were asked to provide information on contingent resources in future planned developments: • In producing fields (including incremental
projects)• Where development plans are under
discussion that have not been approved
Contingent resources in other discoveries:
• The OGA made an assessment of contingent resources in other discoveries based on in-house information compiled from a variety of sources
Prospective resources
Undiscovered potentially recoverable resources in mapped leads and prospects that have not yet been drilled.
UK Oil and Gas Reserves and Resources as at end 201626
The methodology for estimating prospective resources is based on a database of over 3,000 mapped leads and prospects across the UKCS.
In areas where detailed mapping had been carried out, mapped prospects and leads were analysed by standard statistical techniques to obtain a full range of estimates of resources in each basin, considering both geological chance of success and uncertainty in the size of the prospect or lead.
Geological risk was assigned by play and also to each individual lead and for each geological basin, the risk factors were calibrated to drilling results.
Note: In the West of Scotland area there was insufficient mapping of leads and prospects so an estimate was made based on knowledge of the geology of the area.
An indication of the ranges and geographical location for the prospective resources by UK/UKCS geographical area are given in Table 7. Very small leads and prospects have been excluded from the analysis, as have the highest risked leads and prospects (see footnotes 3 and 4 to the table).
Appendix C Methodology for generating the estimates of prospective resources

UK Oil and Gas Reserves and Resources as at end 201627
Area Oil (billion barrels) Gas (billion scf)
Lower Mid Upper Lower Mid Upper
Northern North Sea, (59oN-62oN)(6)
0.53 0.84 1.27 671 1165 2190
Central North Sea, (56oN-59oN)(6)
2.29 3.05 4.05 5968 8652 12678
Southern North Sea, Irish Sea and Celtic Basin
0 0 0.23 3214 4167 5474
West of Shetland 0.47 1.07 2.03 2472 4662 7699
West of Scotland 0 0.50 2.00 494 1483 6004
Land 0.05 0.16 0.32 71 247 848
Other areas of the UKCS 0 0.02 0.18 0 35 424
Total oil (billion barrels), gas (tcf) 3.3 5.6 10.1 12.9 20.4 35.3
Table 7
Estimates of Prospective Recoverable Resources on the UKCS(1) by Geological Area at a > 5% geological chance of success
Notes (1) Includes onshore and offshore assessments.(2) All entries are rounded to the nearest one million tonnes of oil or to one billion cubic metres of gas. (3) Every offshore lead or prospect included in the detailed analysis on which this table is based was estimated to contain resources of at least 1.33 million tonnes
(10 million barrels) or 0.57 billion cubic metres (20 billion cubic feet) of gas. For prospects in West of Shetland the minimum size is at least 4 million tonnes of oil (30 million barrels) or 5.7 billion cubic metres of gas (200 billion cubic feet). For prospects in East Midlands Basin onshore the minimum size is 0.67 million tonnes (5 million barrels)
(4) The figures in the table have the highest risk prospects removed (< 1 in 20 geological Chance of Success). (5) The conversion factors used are 7.5 barrels/tonne for oil and 35.31 bcf/bcm for gas.(6) In these areas, gas is associated with oil and condensate.(7) Area where detailed studies are limited or not carried out
The figures quoted in the table lie at or better than the 5% geological chance of success cut off, and correspond to the upper estimate described in section 5 and figure 12. While it is unlikely that many leads with such high levels of risk will be drilled in the immediate future, a key part of the exploration Stewardship process is for industry and OGA to work continually to de-risk leads. Commercially recoverable reserves will strongly depend on whether leads are sufficiently de-risked to drillable levels.
Estimates of prospective resources must be treated with caution. They provide only a broad indication of the ultimate remaining potential. The limits of the ranges given should not be regarded as minima or maxima. The mid-range figures do not imply that these volumes are the most likely to be discovered.

Oil and Gas Authority is a limited company registered in England and Wales with registered number 09666504 and
VAT registered number 249433979. Our registered office is at 21 Bloomsbury Street, London, United Kingdom, WC1B 3HF
Copyright © Oil and Gas Authority 2017