uk veterinary antibiotic resistance and sales surveillance ... · 8 antibiotic usage antibiotic...
TRANSCRIPT
UK Veterinary Antibiotic
Resistance and Sales
Surveillance Report
UK-VARSS 2018 Published October 2019
© Crown copyright 2019
You may re-use this information (excluding logos) free of charge in any format or medium, under
the terms of the Open Government Licence v.3. To view this licence visit
www.nationalarchives.gov.uk/doc/open-government-licence/version/3/ or email
This publication is available at www.gov.uk/government/collections/veterinary-antimicrobial-
resistance-and-sales-surveillance.
Suggested citation: UK-VARSS (2019). UK Veterinary Antibiotic Resistance and Sales
Surveillance Report (UK-VARSS 2018). New Haw, Addlestone: Veterinary Medicines Directorate.
Any enquiries or correspondence regarding this publication should be sent to us at:
Editor in Chief
Professor S. Peter Borriello
Veterinary Medicines Directorate
Woodham Lane
New Haw, Addlestone
Surrey, KT15 3LS
www.gov.uk/government/organisations/veterinary-medicines-directorate
Authors
Veterinary Medicines Directorate
▪ Dr Marian Bos
▪ Dr Fraser Broadfoot MRCVS
▪ Dr Kitty Healey
▪ Ms Alexandra Pickering
▪ Dr Ana Vidal
Animal and Plant Health Agency (Chapters 3 and 4)
▪ Dr Muna Anjum
▪ Dr Nick Duggett
▪ Dr Francesca Martelli
▪ Dr Chris Teale MRCVS
Acknowledgements
This report is issued by the Veterinary Medicines Directorate (VMD). The veterinary antibiotic
resistance and sales data monitoring programme is commissioned and funded by the VMD. Data
for the sales section are produced by the VMD. Data for the antibiotic resistance section are
produced and collated by the Animal and Plant Health Agency, Angela Lahuerta-Marin (Agri-Food
Biosciences Institute) and Geoff Foster (SRUC Veterinary Services). We are grateful to the
following parties for collecting and sharing usage data with the VMD: Agriculture and Horticulture
Development Board Pork (pigs), British Egg Industry Council (laying hens), British Poultry Council
(meat poultry), Game Farmers’ Association (gamebirds), British Trout Association (trout), Scottish
Salmon Producers’ Association (salmon) and Cattle Health and Welfare Group (cattle). We would
like to thank Zoe Davies, Sannah Malik and Elizabeth Marier of the VMD for their support and
contribution to the design, editing and production of this report.
Published on 29 October 2019
Contents
Foreword ....................................................................................................................................... 5
Highlights ...................................................................................................................................... 7
Introduction ................................................................................................................................. 11
CHAPTER 1 Sales of Veterinary Antibiotics ............................................................................. 12
1.1 Summary ................................................................................................................ 13
1.2 Introduction ............................................................................................................ 13
1.3 Results and discussion ........................................................................................... 13
Total sales of antibiotics for veterinary use in the UK ............................................. 13
Sales of antibiotics for food-producing animal species (mg/kg) .............................. 14
Total sales of antibiotics by administration route (tonnes) ...................................... 15
Total sales of antibiotics by animal species ............................................................ 17
Sales of antibiotics by antibiotic class ..................................................................... 18
1.3.6 Sales of antibiotics for dogs and cats ..................................................................... 22
EU harmonised outcome indicators for antibiotic use ............................................. 25
1.4 Methods ................................................................................................................. 26
CHAPTER 2 Usage of Veterinary Antibiotics by Animal Species ............................................ 27
2.1 Summary ................................................................................................................ 28
2.2 Introduction ............................................................................................................ 28
2.3 Results ................................................................................................................... 29
2.3.1 Pigs ........................................................................................................................ 29
2.3.2 Meat poultry ........................................................................................................... 31
2.3.3 Laying hens ............................................................................................................ 33
2.3.4 Gamebirds ............................................................................................................. 35
2.3.5 Cattle ..................................................................................................................... 36
2.3.6 Aquaculture ............................................................................................................ 41
2.4 Methods ................................................................................................................. 43
CHAPTER 3 EU Harmonised Monitoring of Antibiotic Resistance .......................................... 45
3.1 Summary ................................................................................................................ 46
3.2 Methods ................................................................................................................. 47
3.2.1 Sample collection ................................................................................................... 47
3.2.2 Antibiotic susceptibility testing (AST) ...................................................................... 47
3.2.3 Interpretation of results ........................................................................................... 48
3.3 Results ................................................................................................................... 48
3.3.1 Escherichia coli ...................................................................................................... 48
3.3.2 ESBL-, AmpC- and/or carbapenemase-producing E. coli ....................................... 50
3.3.3 Salmonella spp. ...................................................................................................... 51
3.3.4 Campylobacter jejuni .............................................................................................. 55
3.3.5 EU harmonised AMR outcome indicators ............................................................... 56
CHAPTER 4 Clinical Surveillance of Antibiotic Resistance ..................................................... 58
4.1 Summary ................................................................................................................ 59
4.2 Methods ................................................................................................................. 60
4.2.1 Sample sources ..................................................................................................... 60
4.2.2 Susceptibility testing methodology.......................................................................... 60
4.3 Results and discussion ........................................................................................... 61
4.3.1 Mastitis pathogens ................................................................................................. 61
4.3.2 Respiratory pathogens ........................................................................................... 65
4.3.3 Other animal pathogens ......................................................................................... 68
4.3.4 Zoonotic pathogens ................................................................................................ 69
4.3.5 Escherichia coli ...................................................................................................... 72
4.3.6 Salmonella spp. ...................................................................................................... 78
References .................................................................................................................................. 86
Annexes ....................................................................................................................................... 88
Annex A: List of figures ............................................................................................................. 88
Annex B: List of tables .............................................................................................................. 91
Annex C: Data background and limitations ................................................................................ 93
Annex D: Sources for reporting of sales data ............................................................................ 97
Annex E: Glossary of terms ....................................................................................................... 98
Annex F: Contributors ............................................................................................................. 101
5
Foreword
This year, 2019, started with three important publications, the UK’s five-
year National Action Plan on AMR 2019–241, the UK’s 20-year Vision for
AMR2 and the UK One Health Joint report on antibiotic use and antibiotic
resistance, 2013–173; and it’s with great pleasure that I introduce the first
UK-VARSS report since these publications. Once again, there have been
further reductions in UK veterinary antibiotics sales and use. A 53%
reduction in sales of antibiotics for food-producing animals over the last
four years, coupled with a 68% reduction in sales of highest priority
critically important antibiotics in the same period, is a remarkable
achievement.
A sales data reporting error affecting the 2016 and 2017 reporting years emerged after the
publication of last year’s report. The data in the present report, including all the historical trend
data, have been updated and the corrected data show that the reductions in antibiotic sales in
2016 and 2017 were markedly greater than originally reported. We have worked closely with the
company concerned to satisfy ourselves that the source of this error has been resolved, and we
are taking this opportunity to engage all the companies who report sales data to us to review our
processes to ensure they are robust.
Year-on-year reductions are continuing although less dramatically between 2018 and 2017,
reflecting that reductions are both smaller and harder to achieve as use becomes low. We are now
the lowest user of antibiotics amongst EU countries with significant livestock farming and the 5th
lowest user overall4.
Sales are a proxy for use, and the measure used for EU reporting4. However, in the UK we are
moving increasingly towards securing usage data. UK farming sectors have been further
developing systems for, and reporting on, antibiotic usage. Reporting coverage stands at around
90% of the population or greater for many sectors, with pigs and trout increasing their coverage
since last year. These levels are excellent. Cattle still have a way to go before we can be confident
that their usage data are representative and we don’t yet have usage data for sheep to publish, but
these sectors are working towards comprehensive antibiotic usage reporting.
As we emphasise in our UK five-year National Action Plan and 20-year Vision, action on AMR is
for everyone. I welcome the formation of the Targets Task Force 2, the farming and veterinary
group chaired by the Responsible Use of Medicines in Agriculture Alliance, which will once again
develop and publish expected reductions for antibiotic use in animals. The original Task Force has
a strong track record of high ambition and an ability to deliver, and I very much look forward to
seeing next year their ambitions.
Another important recent initiative involves retailers, manufacturers, processors and food service
companies, a diverse but core group of stakeholders who, last year, voluntarily established the
1 https://www.gov.uk/government/publications/uk-5-year-action-plan-for-antimicrobial-resistance-2019-to-2024 2 https://www.gov.uk/government/publications/uk-20-year-vision-for-antimicrobial-resistance 3 https://www.gov.uk/government/publications/uk-one-health-report-antibiotic-use-and-antibiotic-resistance-in-animals-and-humans 4 https://www.ema.europa.eu/en/veterinary-regulatory/overview/antimicrobial-resistance/european-surveillance-veterinary-antimicrobial-consumption-esvac
6
Food Industry Initiative on Antimicrobials. This builds on retailers publishing antibiotic use on their
supplier farms5. The group’s vision is to promote and support responsible antimicrobial use and
action on AMR. Cooperation and collaboration on AMR as a pre-competitive issue is essential, and
the support of this group to existing stakeholder initiatives could, if done in alignment with them,
ensure the sustainability of the progress being made.
The primary purpose of reducing antibiotic consumption and improving antibiotic stewardship is to
reduce antibiotic resistance. This year, the level of antibiotic resistance measured in the indicator
bacteria E. coli from poultry examined at slaughter shows further reductions to resistance and
represents a marked downward trend. Also, most of the key veterinary pathogens remain
susceptible to authorised veterinary antibiotics, including those that have been authorised for many
years.
We continue to review the scope and methods of the surveillance we undertake. The intent for next
year is to undertake more detailed analysis of susceptibility of a range of animal pathogens, to
further refine the companion animals’ antibiotic sales data, and to work with public health and food
safety colleagues to develop more integrated surveillance. We will also do more to support
countries developing surveillance capability, primarily through the recent establishment in the UK
of an FAO Reference Centre for AMR.
More also needs to be done to bear down on illegal sales of antibiotics. We now have agreements
in place with major internet market-place platform providers to combat illegal on-line sale and
capability to block and rapidly remove illegal listings.
More also now needs to be done on improving prevention of infection risks. This will primarily be
through improved biosecurity and increased vaccine uptake. We will next year report on vaccine
uptake measures.
Professor S. Peter Borriello
Chief Executive Officer
5 Asda: http://s7d2.scene7.com/is/content/asdagroceries/Asda.com/7.%20Sites/Environment/ASDA-Antibiotics-report-2018_V7.pdf Lidl: https://corporate.lidl.co.uk/sustainability/animal-welfare/antibiotics M&S: https://corporate.marksandspencer.com/documents/plan-a-our-approach/antibiotic-graph-v8-quote-version-alt.pdf Tesco: https://www.tescoplc.com/sustainability/downloads/animal-welfare-policy-group/antibiotics/ Waitrose: https://www.waitrose.com/home/inspiration/about_waitrose/the_waitrose_way/ waitrose_animal_welfarecommitments.html Co-op also collect data, but the results are currently not available on their website.
7
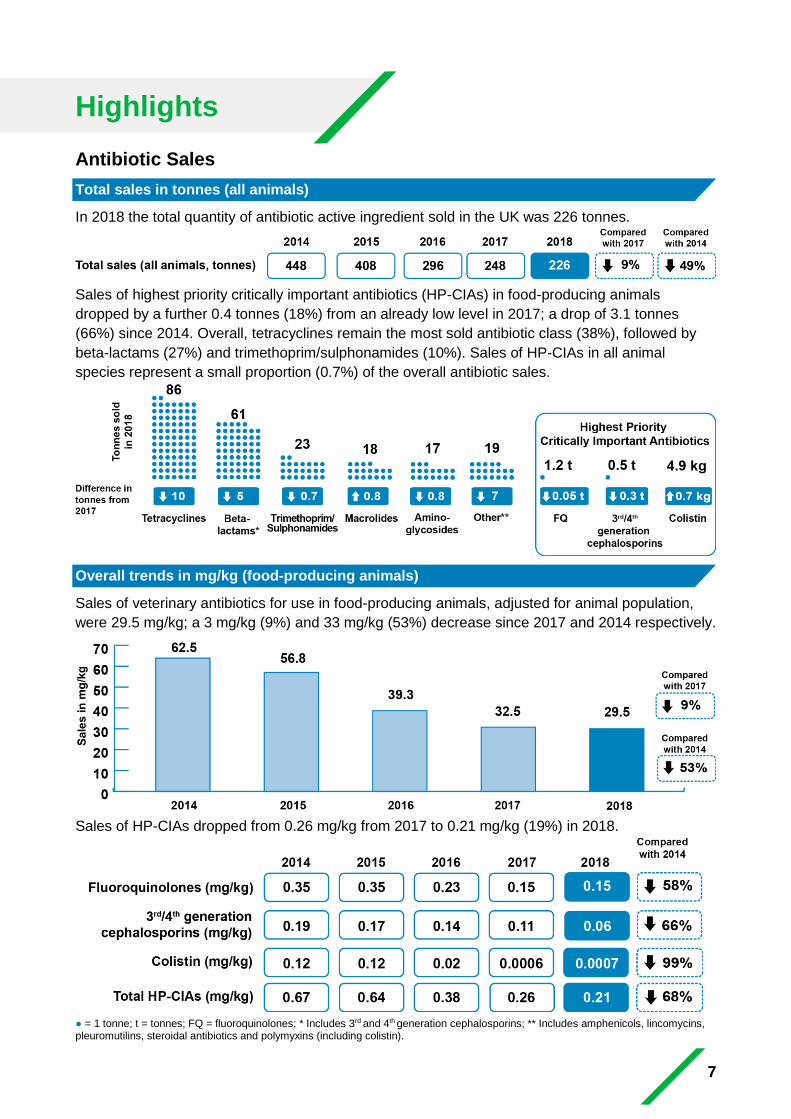
Highlights
Antibiotic Sales
Total sales in tonnes (all animals)
In 2018 the total quantity of antibiotic active ingredient sold in the UK was 226 tonnes.
Sales of highest priority critically important antibiotics (HP-CIAs) in food-producing animals
dropped by a further 0.4 tonnes (18%) from an already low level in 2017; a drop of 3.1 tonnes
(66%) since 2014. Overall, tetracyclines remain the most sold antibiotic class (38%), followed by
beta-lactams (27%) and trimethoprim/sulphonamides (10%). Sales of HP-CIAs in all animal
species represent a small proportion (0.7%) of the overall antibiotic sales.
Overall trends in mg/kg (food-producing animals)
Sales of veterinary antibiotics for use in food-producing animals, adjusted for animal population,
were 29.5 mg/kg; a 3 mg/kg (9%) and 33 mg/kg (53%) decrease since 2017 and 2014 respectively.
Sales of HP-CIAs dropped from 0.26 mg/kg from 2017 to 0.21 mg/kg (19%) in 2018.
● = 1 tonne; t = tonnes; FQ = fluoroquinolones; * Includes 3rd and 4th
generation cephalosporins; ** Includes amphenicols, lincomycins, pleuromutilins, steroidal antibiotics and polymyxins (including colistin).
8
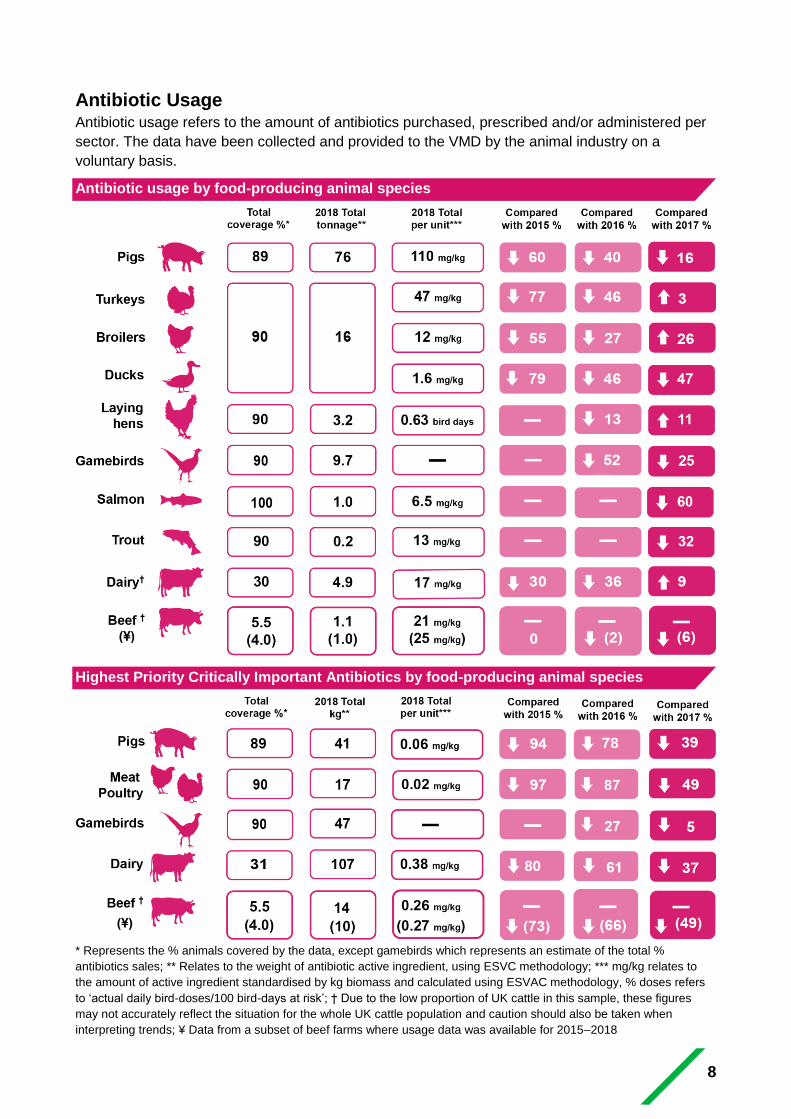
Antibiotic Usage Antibiotic usage refers to the amount of antibiotics purchased, prescribed and/or administered per
sector. The data have been collected and provided to the VMD by the animal industry on a
voluntary basis.
Antibiotic usage by food-producing animal species
Highest Priority Critically Important Antibiotics by food-producing animal species
* Represents the % animals covered by the data, except gamebirds which represents an estimate of the total %
antibiotics sales; ** Relates to the weight of antibiotic active ingredient, using ESVC methodology; *** mg/kg relates to
the amount of active ingredient standardised by kg biomass and calculated using ESVAC methodology, % doses refers
to ‘actual daily bird-doses/100 bird-days at risk’; † Due to the low proportion of UK cattle in this sample, these figures
may not accurately reflect the situation for the whole UK cattle population and caution should also be taken when
interpreting trends; ¥ Data from a subset of beef farms where usage data was available for 2015–2018
9
Antibiotic Resistance in Zoonotic and Commensal Bacteria from
Healthy Animals at Slaughter
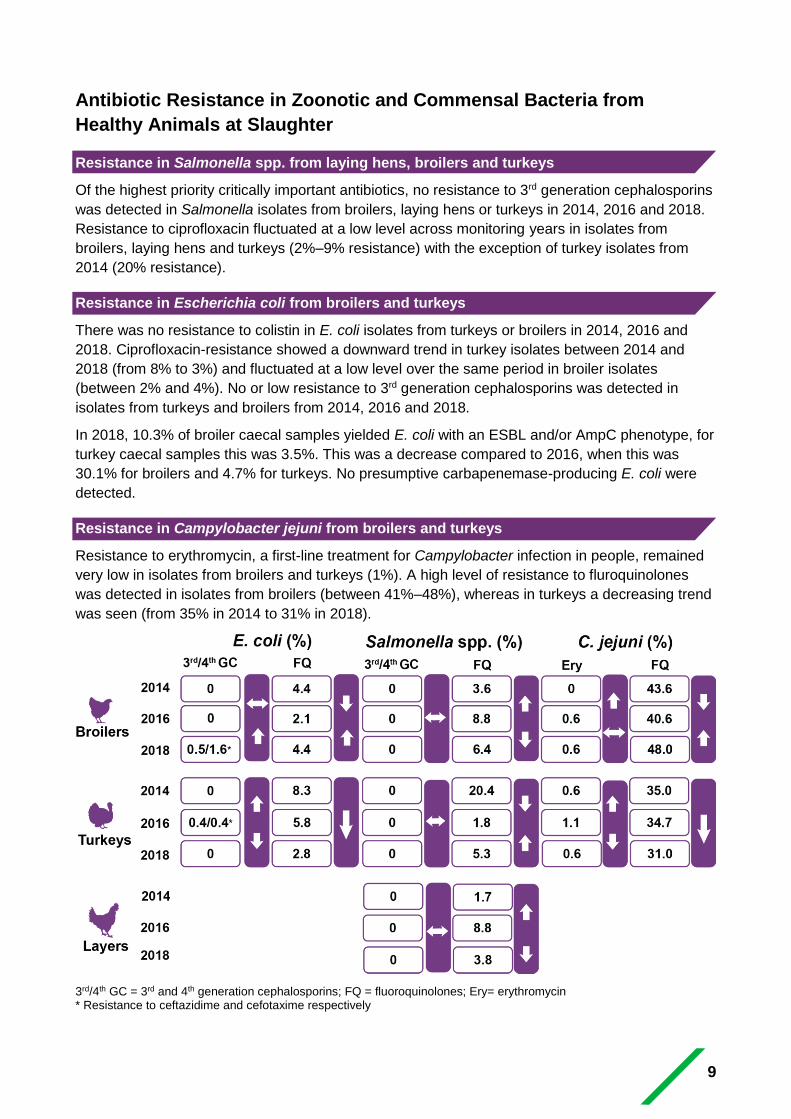
Resistance in Salmonella spp. from laying hens, broilers and turkeys
Of the highest priority critically important antibiotics, no resistance to 3rd generation cephalosporins
was detected in Salmonella isolates from broilers, laying hens or turkeys in 2014, 2016 and 2018.
Resistance to ciprofloxacin fluctuated at a low level across monitoring years in isolates from
broilers, laying hens and turkeys (2%–9% resistance) with the exception of turkey isolates from
2014 (20% resistance).
Resistance in Escherichia coli from broilers and turkeys
There was no resistance to colistin in E. coli isolates from turkeys or broilers in 2014, 2016 and
2018. Ciprofloxacin-resistance showed a downward trend in turkey isolates between 2014 and
2018 (from 8% to 3%) and fluctuated at a low level over the same period in broiler isolates
(between 2% and 4%). No or low resistance to 3rd generation cephalosporins was detected in
isolates from turkeys and broilers from 2014, 2016 and 2018.
In 2018, 10.3% of broiler caecal samples yielded E. coli with an ESBL and/or AmpC phenotype, for
turkey caecal samples this was 3.5%. This was a decrease compared to 2016, when this was
30.1% for broilers and 4.7% for turkeys. No presumptive carbapenemase-producing E. coli were
detected.
Resistance in Campylobacter jejuni from broilers and turkeys
Resistance to erythromycin, a first-line treatment for Campylobacter infection in people, remained
very low in isolates from broilers and turkeys (1%). A high level of resistance to fluroquinolones
was detected in isolates from broilers (between 41%–48%), whereas in turkeys a decreasing trend
was seen (from 35% in 2014 to 31% in 2018).
3rd/4th GC = 3rd and 4th generation cephalosporins; FQ = fluoroquinolones; Ery= erythromycin * Resistance to ceftazidime and cefotaxime respectively
10
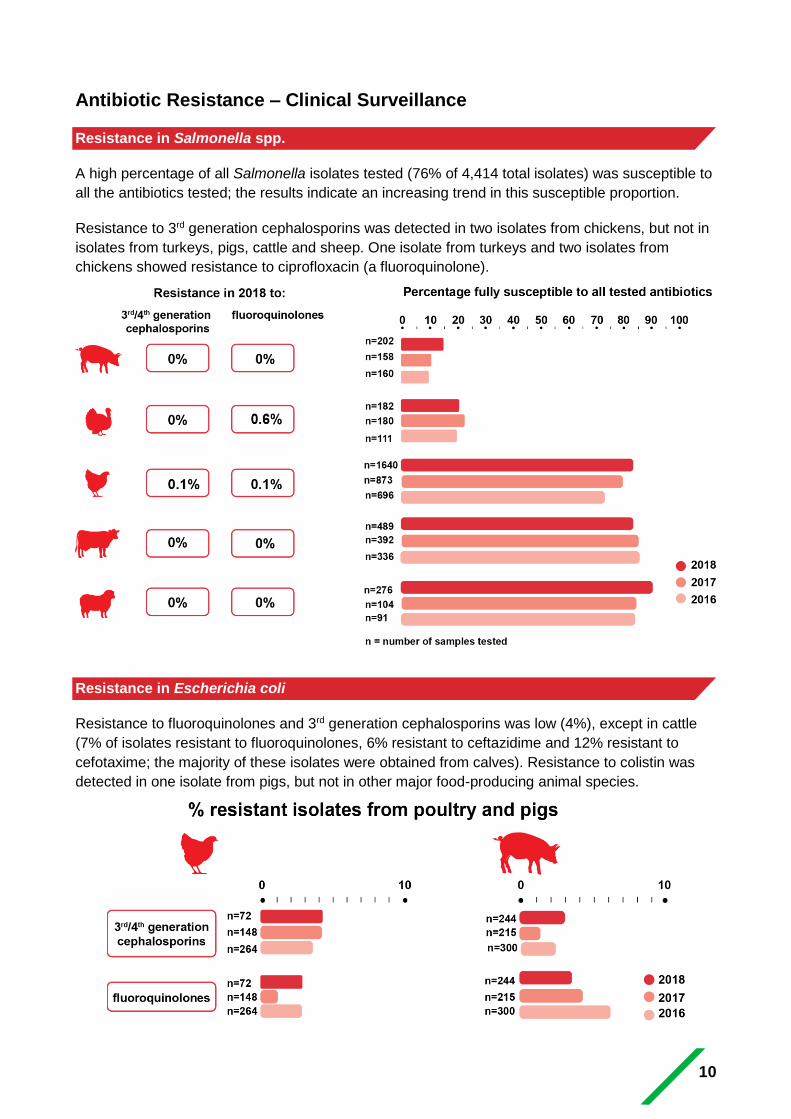
Antibiotic Resistance – Clinical Surveillance
Resistance in Salmonella spp.
A high percentage of all Salmonella isolates tested (76% of 4,414 total isolates) was susceptible to
all the antibiotics tested; the results indicate an increasing trend in this susceptible proportion.
Resistance to 3rd generation cephalosporins was detected in two isolates from chickens, but not in
isolates from turkeys, pigs, cattle and sheep. One isolate from turkeys and two isolates from
chickens showed resistance to ciprofloxacin (a fluoroquinolone).
Resistance in Escherichia coli
Resistance to fluoroquinolones and 3rd generation cephalosporins was low (4%), except in cattle
(7% of isolates resistant to fluoroquinolones, 6% resistant to ceftazidime and 12% resistant to
cefotaxime; the majority of these isolates were obtained from calves). Resistance to colistin was
detected in one isolate from pigs, but not in other major food-producing animal species.
11
Introduction
The first report on sales figures for antibiotic veterinary medicinal products, collated and published
by the Veterinary Medicines Directorate (VMD), covered 1993–1998. The figures were provided
voluntarily by the veterinary pharmaceutical companies marketing these products. From 2005,
sales data were collected as a statutory requirement (Veterinary Medicines Regulations) and in
2013 the first Veterinary Antibiotic Resistance and Sales Surveillance (VARSS) report of the United
Kingdom was published. Since then, the UK-VARSS reports present combined data on veterinary
antibiotic sales and antibiotic resistance in bacteria from food-producing animals in the UK.
Furthermore, the UK-VARSS reports have increasingly included data on usage by animal
production sector, which are, on a voluntary basis, provided to the VMD by these sectors.
The antibiotic sales data from 2005 to 2018 are presented in CHAPTER 1 and are based on sales
of antibiotic veterinary medicinal products authorised for use in animals in the UK. Sales data are
generally used as an estimate for antibiotic usage. However, as many antibiotics are authorised for
use in multiple species, it is not possible to determine how much is used by each animal species.
The VMD is working in partnership with livestock sectors to develop, facilitate and coordinate
antibiotic usage data collection systems; these data are presented in CHAPTER 2.
The VMD collates data from government laboratories on antibiotic resistance in bacteria obtained
from food-producing animals, which are collected under the framework of two surveillance
schemes. The surveillance activities focus on the occurrence of antibiotic resistance in pathogens
that cause infections in animals, zoonotic bacteria, and indicator bacteria such as Escherichia coli.
Zoonotic bacteria are covered in the surveillance because they can develop resistance in the
animal reservoir, which may subsequently compromise treatment outcome when causing human
infection. E. coli are included due to their ubiquitous nature in animals, food and humans and their
ability to readily develop or transfer antibiotic resistance between these reservoirs. Results from
the European Union harmonised antibiotic resistance monitoring scheme are presented in
CHAPTER 3. Results from the scanning surveillance are presented in CHAPTER 4.
Details on methodology and results not presented in the report are included in the supplementary
material. The supplementary material and previous UK-VARSS reports are available to download
at https://www.gov.uk/government/collections/veterinary-antimicrobial-resistance-and-sales-
surveillance.
CHAPTER 1 Sales of Veterinary Antibiotics
13
Chapter 1 Antibiotic Sales
1.1 Summary
In 2018, the total quantity of antibiotic active ingredient sold in the UK was 226.2 tonnes, a
21.9 tonne (9%) reduction since 2017. Between 2014 and 2018, there was a 221.7 tonne (49%)
reduction. In 2018, sales of veterinary antibiotics, adjusted for animal population, were 29.5 mg/kg,
a 3.0 mg/kg (9%) decrease from 2017 and 33.0 mg/kg (53%) decrease from 2014. The year 2014
is referred to in this report as the baseline year as it represents the first full year of the UK Five
Year Antimicrobial Resistance Strategy 2013 to 2018 (Department of Health and Social Care and
Department for Environment Food & Rural Affairs, 2013).
Tetracyclines remain the most sold class of antibiotics (38% of total sales) and beta-lactams the
second (27% of total sales). Since 2017, notable reductions were observed for tetracyclines and
macrolides, decreasing by 9.8 tonnes (10%) and 6.7 tonnes (29%), respectively. Excluding tablets,
oral products accounted for the majority of antibiotics sold (71%).
Highest Priority Critically Important Antibiotics for human medicine (HP-CIAs) continue to represent
a small proportion of total antibiotics sold (0.7% in 2018) and have reduced to 1.6 tonnes; a
reduction of 0.4 tonnes (18%) since 2017 and 3.1 tonnes (66%) since 2014.
1.2 Introduction
Pharmaceutical companies have reported the quantity of authorised veterinary antibiotics sold
throughout the UK to the VMD since 1993; this has been a statutory requirement since 2005 (see
section S1.1 in the supplementary material for further details). The data reported in this chapter do
not take into account wastage, imports or exports of veterinary antibiotics, but they serve as the
best currently available approximation of the quantity of antibiotics administered to all animal
species within the UK (further details on data limitations can be found in Annex C).
Note that, for ease of reading, the data have been rounded to one decimal place. However, the
percentage changes have been calculated using the exact number.
1.3 Results and discussion
Total sales of antibiotics for veterinary use in the UK
Sales data analysed using the ESVAC methodology are available from 2005; the ESVAC project
was launched in September 2009 and the first report published aggregated sales data for the years
2005–2009. Prior to these years, data (covering 1993–2005) were analysed using the UK-VARSS
methodology, further details of which can be found in section S1.1.
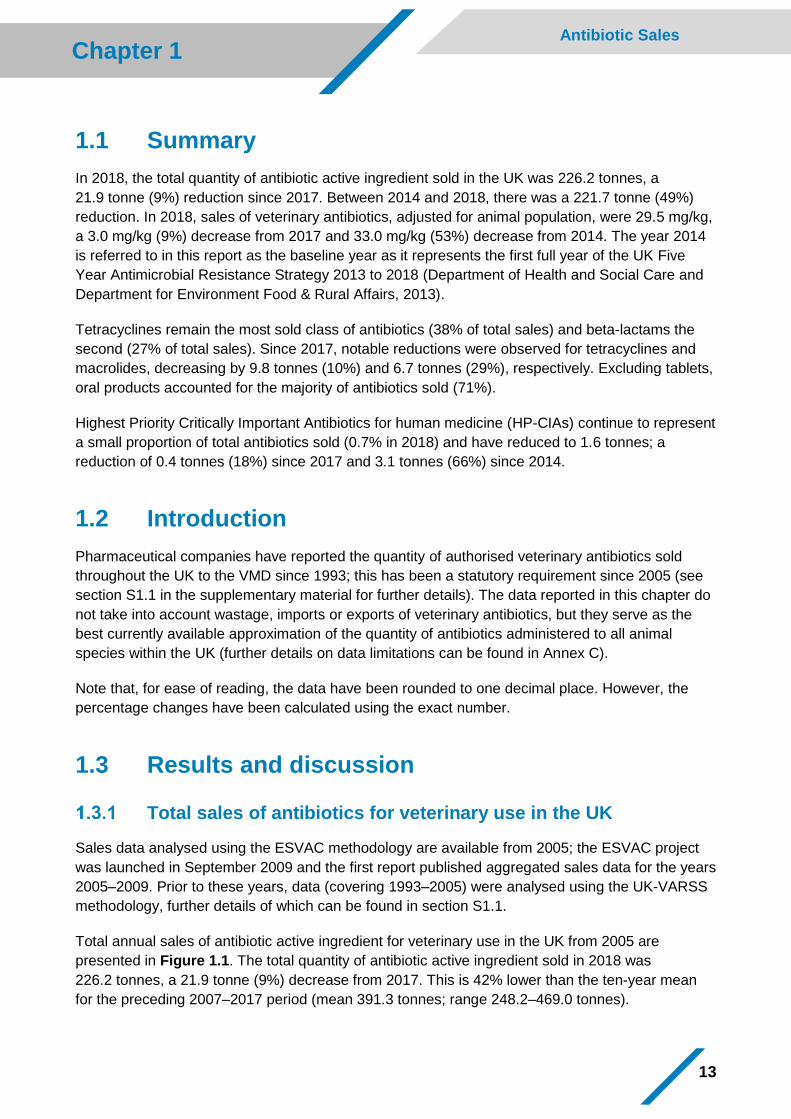
Total annual sales of antibiotic active ingredient for veterinary use in the UK from 2005 are
presented in Figure 1.1. The total quantity of antibiotic active ingredient sold in 2018 was
226.2 tonnes, a 21.9 tonne (9%) decrease from 2017. This is 42% lower than the ten-year mean
for the preceding 2007–2017 period (mean 391.3 tonnes; range 248.2–469.0 tonnes).
14
Chapter 1 Antibiotic Sales
Figure 1.1: Total quantity of antibiotic active ingredient (tonnes) sold in the UK per year using
ESVAC methodology; 2005–2018
Sales of antibiotics for food-producing animal species (mg/kg)
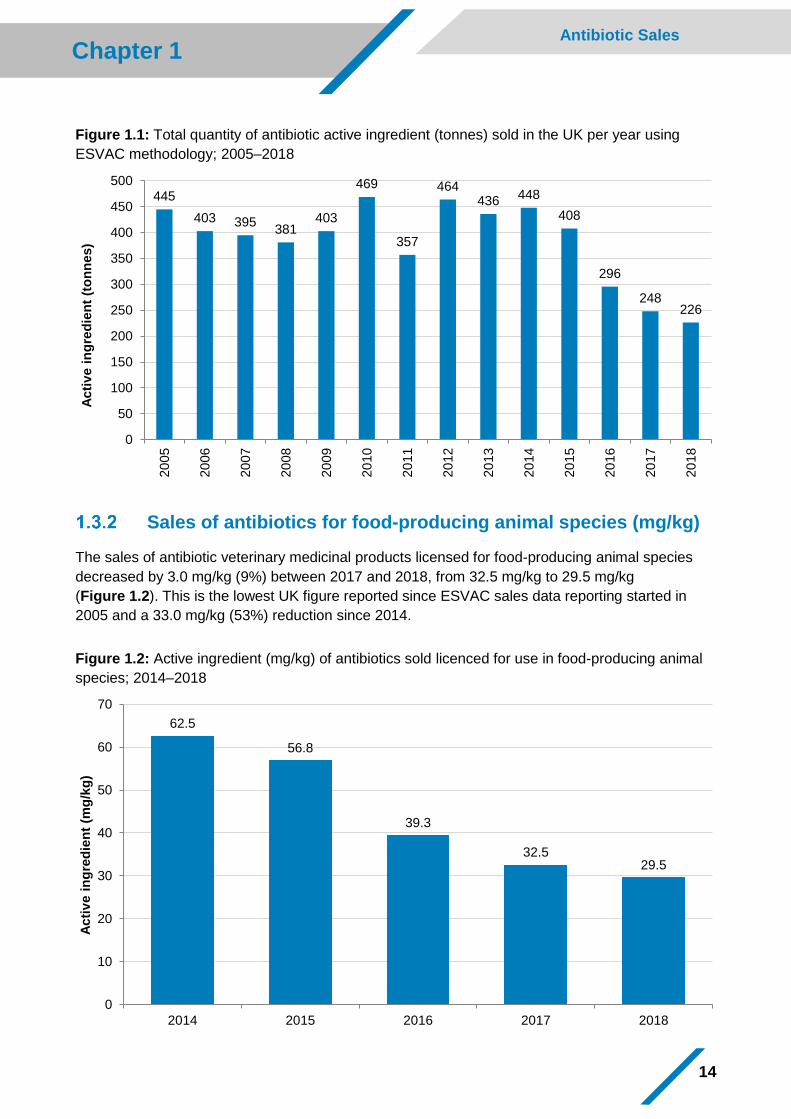
The sales of antibiotic veterinary medicinal products licensed for food-producing animal species
decreased by 3.0 mg/kg (9%) between 2017 and 2018, from 32.5 mg/kg to 29.5 mg/kg
(Figure 1.2). This is the lowest UK figure reported since ESVAC sales data reporting started in
2005 and a 33.0 mg/kg (53%) reduction since 2014.
Figure 1.2: Active ingredient (mg/kg) of antibiotics sold licenced for use in food-producing animal
species; 2014–2018
445
403 395381
403
469
357
464436
448
408
296
248226
0
50
100
150
200
250
300
350
400
450
500
20
05
20
06
20
07
20
08
20
09
20
10
20
11
20
12
20
13
20
14
20
15
20
16
20
17
20
18
Acti
ve i
ng
red
ien
t (t
on
nes)
62.5
56.8
39.3
32.529.5
0
10
20
30
40
50
60
70
2014 2015 2016 2017 2018
Acti
ve i
ng
red
ien
t (m
g/k
g)
15
Chapter 1 Antibiotic Sales
Total sales of antibiotics by administration route (tonnes)
1.3.3.1 By administration route for all animal species
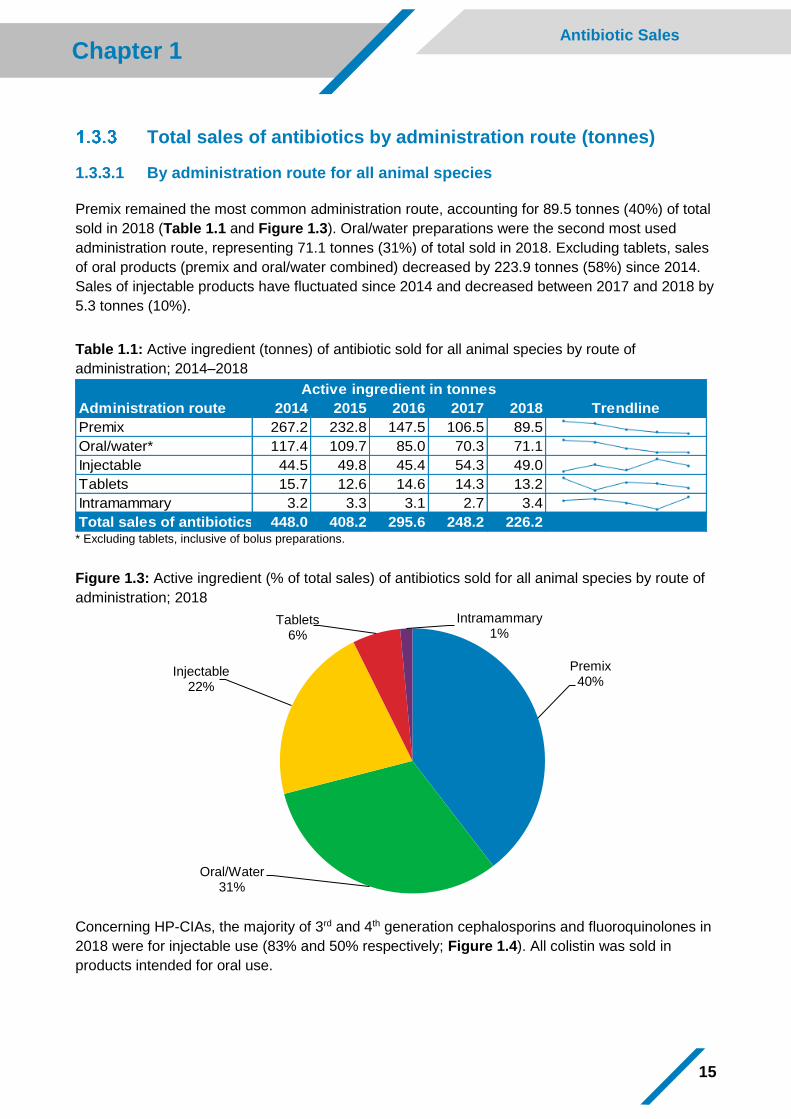
Premix remained the most common administration route, accounting for 89.5 tonnes (40%) of total
sold in 2018 (Table 1.1 and Figure 1.3). Oral/water preparations were the second most used
administration route, representing 71.1 tonnes (31%) of total sold in 2018. Excluding tablets, sales
of oral products (premix and oral/water combined) decreased by 223.9 tonnes (58%) since 2014.
Sales of injectable products have fluctuated since 2014 and decreased between 2017 and 2018 by
5.3 tonnes (10%).
Table 1.1: Active ingredient (tonnes) of antibiotic sold for all animal species by route of
administration; 2014–2018
Administration route 2014 2015 2016 2017 2018
Premix 267.2 232.8 147.5 106.5 89.5
Oral/water* 117.4 109.7 85.0 70.3 71.1
Injectable 44.5 49.8 45.4 54.3 49.0
Tablets 15.7 12.6 14.6 14.3 13.2
Intramammary 3.2 3.3 3.1 2.7 3.4
Total sales of antibiotics 448.0 408.2 295.6 248.2 226.2
Active ingredient in tonnes
Trendline
* Excluding tablets, inclusive of bolus preparations.
Figure 1.3: Active ingredient (% of total sales) of antibiotics sold for all animal species by route of
administration; 2018
Concerning HP-CIAs, the majority of 3rd and 4th generation cephalosporins and fluoroquinolones in
2018 were for injectable use (83% and 50% respectively; Figure 1.4). All colistin was sold in
products intended for oral use.
Premix40%
Oral/Water31%
Injectable22%
Tablets6%
Intramammary1%
16
Chapter 1 Antibiotic Sales
Figure 1.4: Distribution of sales (tonnes) of HP-CIAs for all animal species by the major
administration routes (injectables (), oral/water (), intramammaries (), tablets ()):
(a) 3rd and 4th generation cephalosporins and (b) fluoroquinolones; 2018
(a) (b)
1.3.3.2 Intramammary antibiotic products
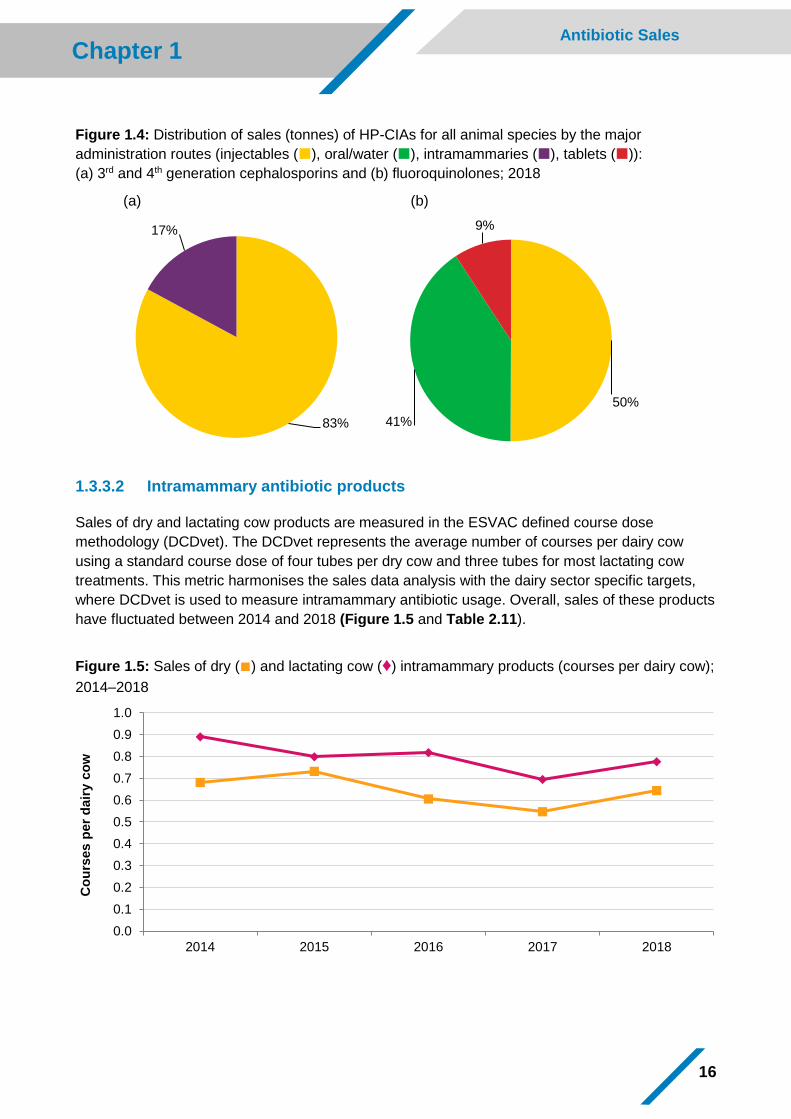
Sales of dry and lactating cow products are measured in the ESVAC defined course dose
methodology (DCDvet). The DCDvet represents the average number of courses per dairy cow
using a standard course dose of four tubes per dry cow and three tubes for most lactating cow
treatments. This metric harmonises the sales data analysis with the dairy sector specific targets,
where DCDvet is used to measure intramammary antibiotic usage. Overall, sales of these products
have fluctuated between 2014 and 2018 (Figure 1.5 and Table 2.11).
Figure 1.5: Sales of dry (■) and lactating cow (♦) intramammary products (courses per dairy cow);
2014–2018
0.0
0.1
0.2
0.3
0.4
0.5
0.6
0.7
0.8
0.9
1.0
2014 2015 2016 2017 2018
Co
urs
es p
er
dair
y c
ow
83%
17%
50%
41%
9%
17
Chapter 1 Antibiotic Sales
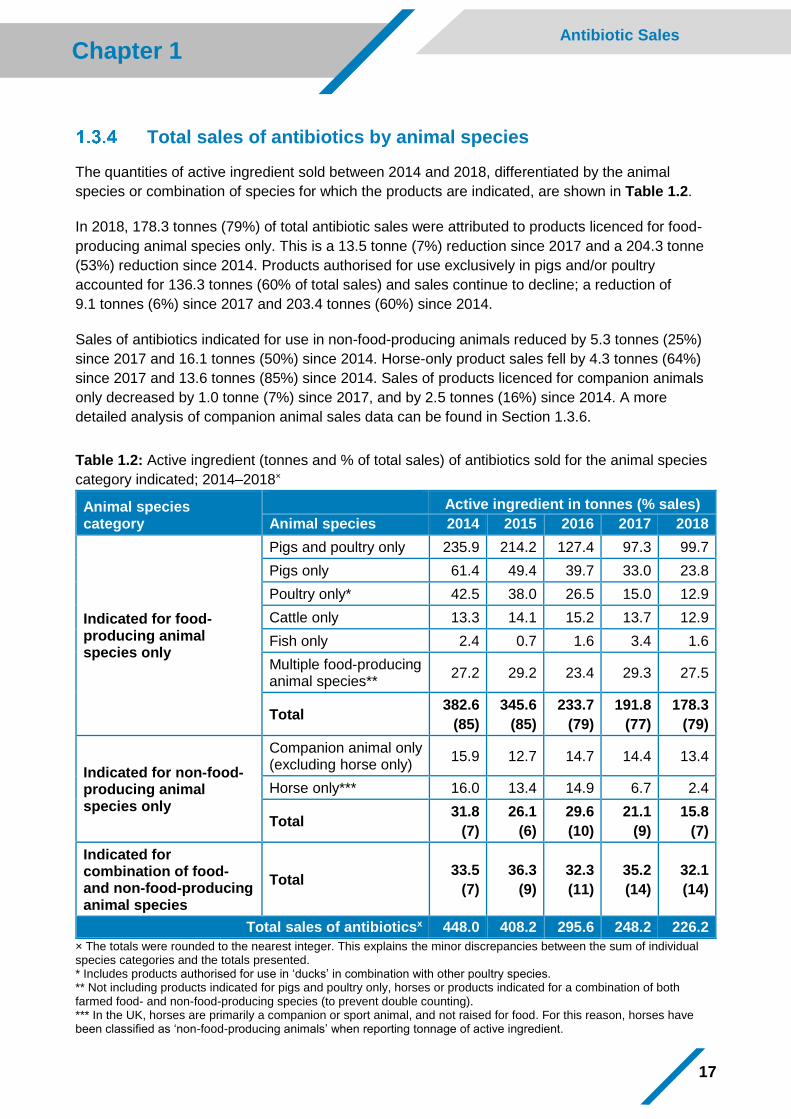
Total sales of antibiotics by animal species
The quantities of active ingredient sold between 2014 and 2018, differentiated by the animal
species or combination of species for which the products are indicated, are shown in Table 1.2.
In 2018, 178.3 tonnes (79%) of total antibiotic sales were attributed to products licenced for food-
producing animal species only. This is a 13.5 tonne (7%) reduction since 2017 and a 204.3 tonne
(53%) reduction since 2014. Products authorised for use exclusively in pigs and/or poultry
accounted for 136.3 tonnes (60% of total sales) and sales continue to decline; a reduction of
9.1 tonnes (6%) since 2017 and 203.4 tonnes (60%) since 2014.
Sales of antibiotics indicated for use in non-food-producing animals reduced by 5.3 tonnes (25%)
since 2017 and 16.1 tonnes (50%) since 2014. Horse-only product sales fell by 4.3 tonnes (64%)
since 2017 and 13.6 tonnes (85%) since 2014. Sales of products licenced for companion animals
only decreased by 1.0 tonne (7%) since 2017, and by 2.5 tonnes (16%) since 2014. A more
detailed analysis of companion animal sales data can be found in Section 1.3.6.
Table 1.2: Active ingredient (tonnes and % of total sales) of antibiotics sold for the animal species
category indicated; 2014–2018×
Animal species category
Active ingredient in tonnes (% sales)
Animal species 2014 2015 2016 2017 2018
Indicated for food-producing animal species only
Pigs and poultry only 235.9 214.2 127.4 97.3 99.7
Pigs only 61.4 49.4 39.7 33.0 23.8
Poultry only* 42.5 38.0 26.5 15.0 12.9
Cattle only 13.3 14.1 15.2 13.7 12.9
Fish only 2.4 0.7 1.6 3.4 1.6
Multiple food-producing animal species**
27.2 29.2 23.4 29.3 27.5
Total 382.6
(85)
345.6
(85)
233.7
(79)
191.8
(77)
178.3
(79)
Indicated for non-food-producing animal species only
Companion animal only (excluding horse only)
15.9 12.7 14.7 14.4 13.4
Horse only*** 16.0 13.4 14.9 6.7 2.4
Total 31.8
(7)
26.1
(6)
29.6
(10)
21.1
(9)
15.8
(7)
Indicated for combination of food- and non-food-producing animal species
Total 33.5
(7)
36.3
(9)
32.3
(11)
35.2
(14)
32.1
(14)
Total sales of antibioticsx 448.0 408.2 295.6 248.2 226.2
× The totals were rounded to the nearest integer. This explains the minor discrepancies between the sum of individual species categories and the totals presented. * Includes products authorised for use in ‘ducks’ in combination with other poultry species. ** Not including products indicated for pigs and poultry only, horses or products indicated for a combination of both farmed food- and non-food-producing species (to prevent double counting). *** In the UK, horses are primarily a companion or sport animal, and not raised for food. For this reason, horses have been classified as ‘non-food-producing animals’ when reporting tonnage of active ingredient.
18
Chapter 1 Antibiotic Sales
Sales of products licenced for use in both food- and non-food-producing animal species have
fluctuated slightly since 2014 and reduced by 3.1 tonnes (9%) between 2017 and 2018.
Where antibiotic usage data are available per species or sector and represent a high proportion of
the industry (e.g. pigs, meat poultry, laying hens, gamebirds, trout and salmon, see CHAPTER 2),
these can be extrapolated and compared with the antibiotic sales of products authorised for those
species. This analysis shows that these figures are comparable and follow the same trend.
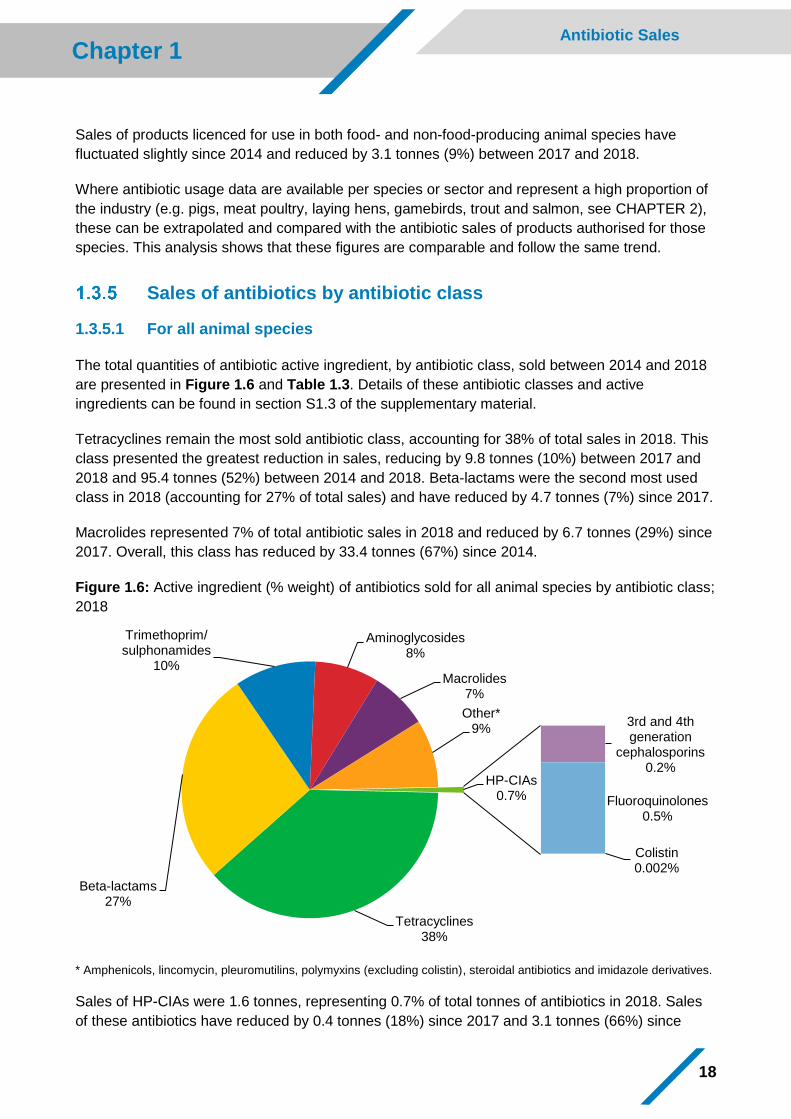
Sales of antibiotics by antibiotic class
1.3.5.1 For all animal species
The total quantities of antibiotic active ingredient, by antibiotic class, sold between 2014 and 2018
are presented in Figure 1.6 and Table 1.3. Details of these antibiotic classes and active
ingredients can be found in section S1.3 of the supplementary material.
Tetracyclines remain the most sold antibiotic class, accounting for 38% of total sales in 2018. This
class presented the greatest reduction in sales, reducing by 9.8 tonnes (10%) between 2017 and
2018 and 95.4 tonnes (52%) between 2014 and 2018. Beta-lactams were the second most used
class in 2018 (accounting for 27% of total sales) and have reduced by 4.7 tonnes (7%) since 2017.
Macrolides represented 7% of total antibiotic sales in 2018 and reduced by 6.7 tonnes (29%) since
2017. Overall, this class has reduced by 33.4 tonnes (67%) since 2014.
Figure 1.6: Active ingredient (% weight) of antibiotics sold for all animal species by antibiotic class;
2018
* Amphenicols, lincomycin, pleuromutilins, polymyxins (excluding colistin), steroidal antibiotics and imidazole derivatives.
Sales of HP-CIAs were 1.6 tonnes, representing 0.7% of total tonnes of antibiotics in 2018. Sales
of these antibiotics have reduced by 0.4 tonnes (18%) since 2017 and 3.1 tonnes (66%) since
Tetracyclines38%
Beta-lactams27%
Trimethoprim/ sulphonamides
10%
Aminoglycosides8%
Macrolides7%
Other*9%
3rd and 4th generation
cephalosporins0.2%
Fluoroquinolones0.5%
Colistin0.002%
HP-CIAs0.7%
19
Chapter 1 Antibiotic Sales
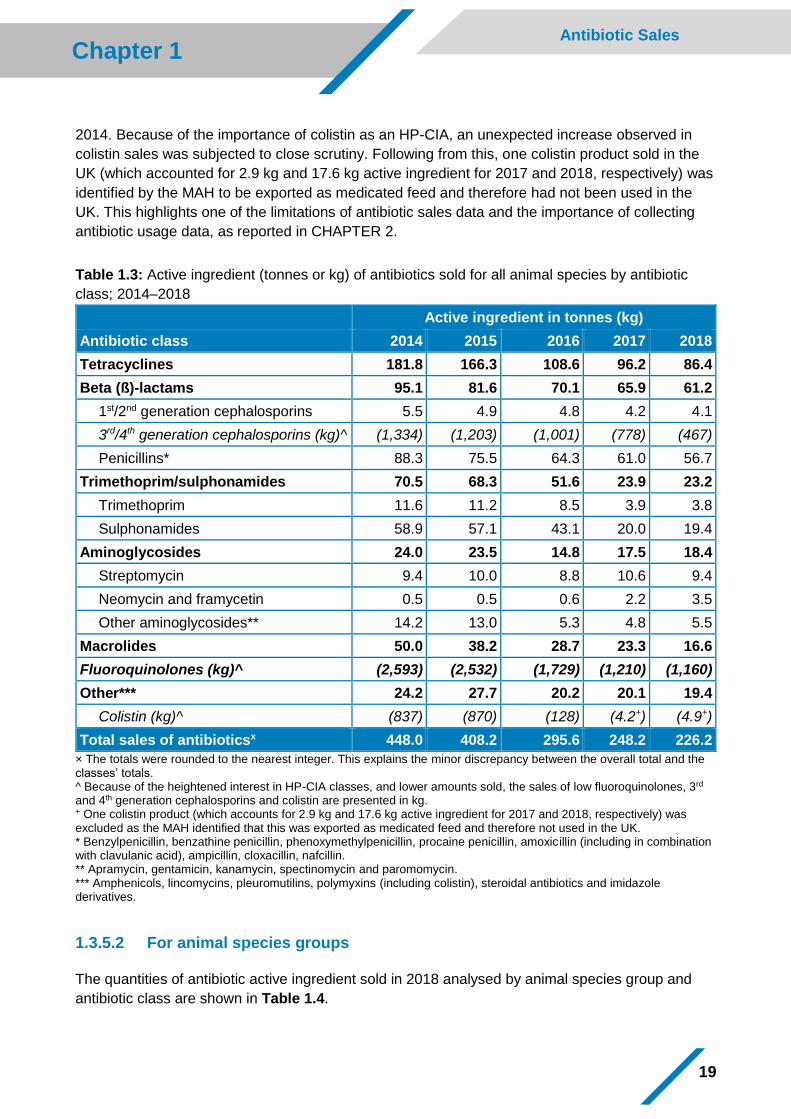
2014. Because of the importance of colistin as an HP-CIA, an unexpected increase observed in
colistin sales was subjected to close scrutiny. Following from this, one colistin product sold in the
UK (which accounted for 2.9 kg and 17.6 kg active ingredient for 2017 and 2018, respectively) was
identified by the MAH to be exported as medicated feed and therefore had not been used in the
UK. This highlights one of the limitations of antibiotic sales data and the importance of collecting
antibiotic usage data, as reported in CHAPTER 2.
Table 1.3: Active ingredient (tonnes or kg) of antibiotics sold for all animal species by antibiotic
class; 2014–2018
Active ingredient in tonnes (kg)
Antibiotic class 2014 2015 2016 2017 2018
Tetracyclines 181.8 166.3 108.6 96.2 86.4
Beta (ß)-lactams 95.1 81.6 70.1 65.9 61.2
1st/2nd generation cephalosporins 5.5 4.9 4.8 4.2 4.1
3rd/4th generation cephalosporins (kg)^ (1,334) (1,203) (1,001) (778) (467)
Penicillins* 88.3 75.5 64.3 61.0 56.7
Trimethoprim/sulphonamides 70.5 68.3 51.6 23.9 23.2
Trimethoprim 11.6 11.2 8.5 3.9 3.8
Sulphonamides 58.9 57.1 43.1 20.0 19.4
Aminoglycosides 24.0 23.5 14.8 17.5 18.4
Streptomycin 9.4 10.0 8.8 10.6 9.4
Neomycin and framycetin 0.5 0.5 0.6 2.2 3.5
Other aminoglycosides** 14.2 13.0 5.3 4.8 5.5
Macrolides 50.0 38.2 28.7 23.3 16.6
Fluoroquinolones (kg)^ (2,593) (2,532) (1,729) (1,210) (1,160)
Other*** 24.2 27.7 20.2 20.1 19.4
Colistin (kg)^ (837) (870) (128) (4.2+) (4.9+)
Total sales of antibioticsx 448.0 408.2 295.6 248.2 226.2
× The totals were rounded to the nearest integer. This explains the minor discrepancy between the overall total and the classes’ totals. ^ Because of the heightened interest in HP-CIA classes, and lower amounts sold, the sales of low fluoroquinolones, 3rd and 4th generation cephalosporins and colistin are presented in kg. + One colistin product (which accounts for 2.9 kg and 17.6 kg active ingredient for 2017 and 2018, respectively) was excluded as the MAH identified that this was exported as medicated feed and therefore not used in the UK. * Benzylpenicillin, benzathine penicillin, phenoxymethylpenicillin, procaine penicillin, amoxicillin (including in combination with clavulanic acid), ampicillin, cloxacillin, nafcillin. ** Apramycin, gentamicin, kanamycin, spectinomycin and paromomycin. *** Amphenicols, lincomycins, pleuromutilins, polymyxins (including colistin), steroidal antibiotics and imidazole derivatives.
1.3.5.2 For animal species groups
The quantities of antibiotic active ingredient sold in 2018 analysed by animal species group and
antibiotic class are shown in Table 1.4.
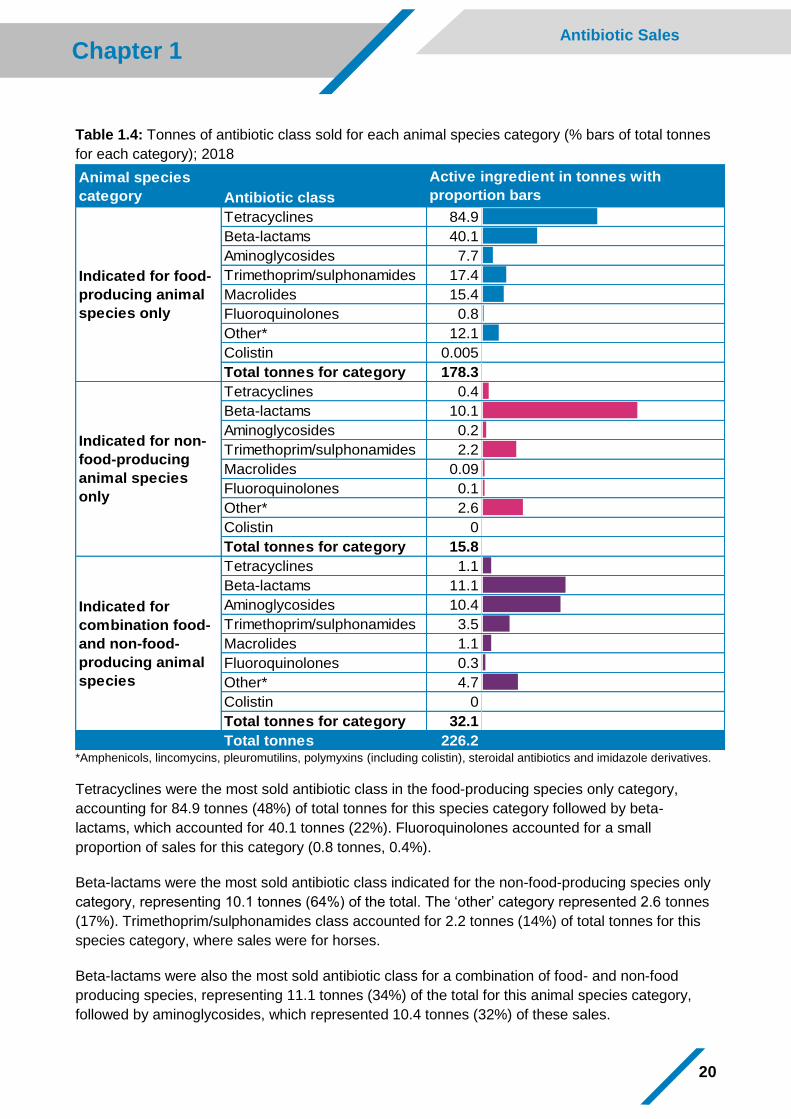
20
Chapter 1 Antibiotic Sales
Table 1.4: Tonnes of antibiotic class sold for each animal species category (% bars of total tonnes
for each category); 2018
Animal species
category Antibiotic class
Tetracyclines 84.9 84.9
Beta-lactams 40.1 40.1
Aminoglycosides 7.7 7.7
Trimethoprim/sulphonamides 17.4 17.4
Macrolides 15.4 15.4
Fluoroquinolones 0.8 0.8
Other* 12.1 12.1
Colistin 0.005 0.023
Total tonnes for category 178.3 178.3
Tetracyclines 0.4 0.4
Beta-lactams 10.1 10.1
Aminoglycosides 0.2 0.2
Trimethoprim/sulphonamides 2.2 2.2
Macrolides 0.09 0.09
Fluoroquinolones 0.1 0.1
Other* 2.6 2.6
Colistin 0
Total tonnes for category 15.8 15.8
Tetracyclines 1.1 1.1
Beta-lactams 11.1 11.1
Aminoglycosides 10.4 10.4
Trimethoprim/sulphonamides 3.5 3.5
Macrolides 1.1 1.1
Fluoroquinolones 0.3 0.3
Other* 4.7 4.7
Colistin 0
Total tonnes for category 32.1 32.1
Total tonnes 226.2
Indicated for food-
producing animal
species only
Indicated for non-
food-producing
animal species
only
Indicated for
combination food-
and non-food-
producing animal
species
Active ingredient in tonnes with
proportion bars
*Amphenicols, lincomycins, pleuromutilins, polymyxins (including colistin), steroidal antibiotics and imidazole derivatives.
Tetracyclines were the most sold antibiotic class in the food-producing species only category,
accounting for 84.9 tonnes (48%) of total tonnes for this species category followed by beta-
lactams, which accounted for 40.1 tonnes (22%). Fluoroquinolones accounted for a small
proportion of sales for this category (0.8 tonnes, 0.4%).
Beta-lactams were the most sold antibiotic class indicated for the non-food-producing species only
category, representing 10.1 tonnes (64%) of the total. The ‘other’ category represented 2.6 tonnes
(17%). Trimethoprim/sulphonamides class accounted for 2.2 tonnes (14%) of total tonnes for this
species category, where sales were for horses.
Beta-lactams were also the most sold antibiotic class for a combination of food- and non-food
producing species, representing 11.1 tonnes (34%) of the total for this animal species category,
followed by aminoglycosides, which represented 10.4 tonnes (32%) of these sales.
21
Chapter 1 Antibiotic Sales
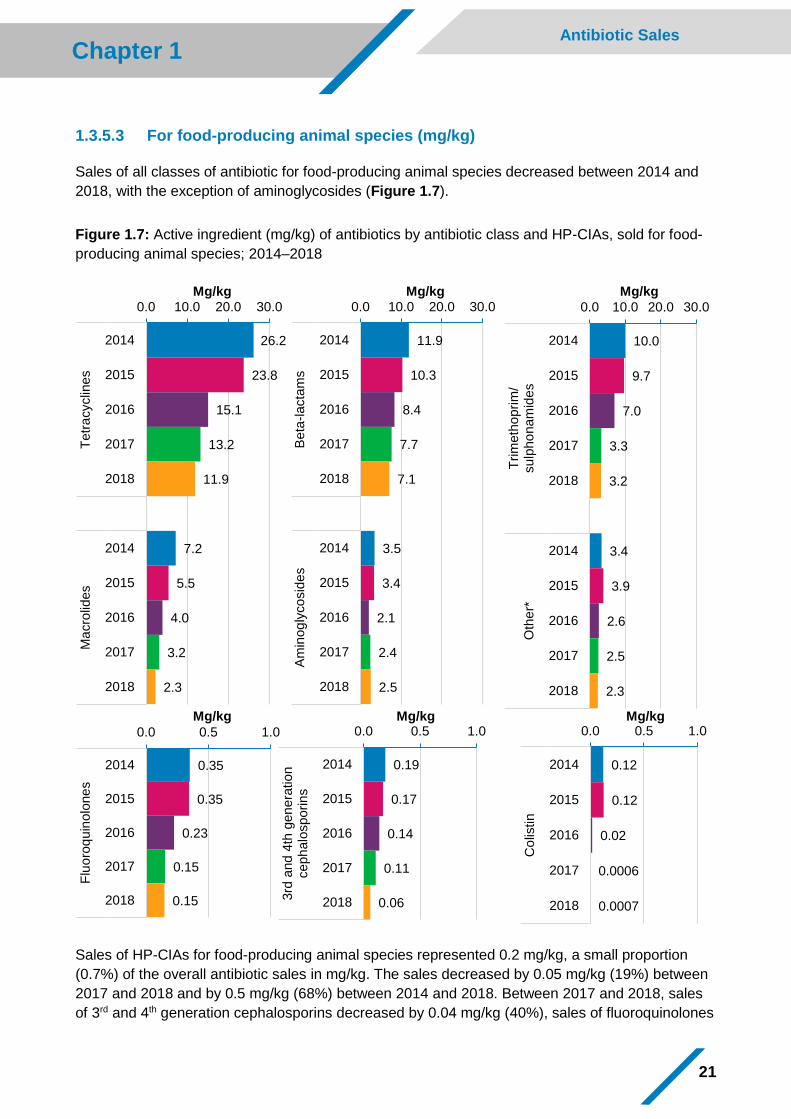
1.3.5.3 For food-producing animal species (mg/kg)
Sales of all classes of antibiotic for food-producing animal species decreased between 2014 and
2018, with the exception of aminoglycosides (Figure 1.7).
Figure 1.7: Active ingredient (mg/kg) of antibiotics by antibiotic class and HP-CIAs, sold for food-
producing animal species; 2014–2018
Sales of HP-CIAs for food-producing animal species represented 0.2 mg/kg, a small proportion
(0.7%) of the overall antibiotic sales in mg/kg. The sales decreased by 0.05 mg/kg (19%) between
2017 and 2018 and by 0.5 mg/kg (68%) between 2014 and 2018. Between 2017 and 2018, sales
of 3rd and 4th generation cephalosporins decreased by 0.04 mg/kg (40%), sales of fluoroquinolones
0.35
0.35
0.23
0.15
0.15
0.0 0.5 1.0
2014
2015
2016
2017
2018
Flu
oro
quin
olo
ne
s
Mg/kg
0.19
0.17
0.14
0.11
0.06
0.0 0.5 1.0
2014
2015
2016
2017
2018
3rd
and
4th
gen
era
tion
ceph
alo
sporin
s
Mg/kg
26.2
23.8
15.1
13.2
11.9
7.2
5.5
4.0
3.2
2.3
0.0 10.0 20.0 30.0
2014
2015
2016
2017
2018
2014
2015
2016
2017
2018
Tetr
acyclin
es
Ma
cro
lides
Mg/kg
11.9
10.3
8.4
7.7
7.1
3.5
3.4
2.1
2.4
2.5
0.0 10.0 20.0 30.0
2014
2015
2016
2017
2018
2014
2015
2016
2017
2018
Beta
-lacta
ms
Am
inog
lyco
sid
es
Mg/kg
10.0
9.7
7.0
3.3
3.2
3.4
3.9
2.6
2.5
2.3
0.0 10.0 20.0 30.0
2014
2015
2016
2017
2018
2014
2015
2016
2017
2018
Trim
eth
oprim
/sulp
ho
nam
ide
sO
the
r*
Mg/kg
0.12
0.12
0.02
0.0006
0.0007
0.0 0.5 1.0
2014
2015
2016
2017
2018
Co
listin
Mg/kg
22
Chapter 1 Antibiotic Sales
decreased by 0.007 mg/kg (5%) and sales of colistin experienced a small increase from
0.0006 mg/kg to 0.0007 mg/kg.
1.3.6 Sales of antibiotics for dogs and cats
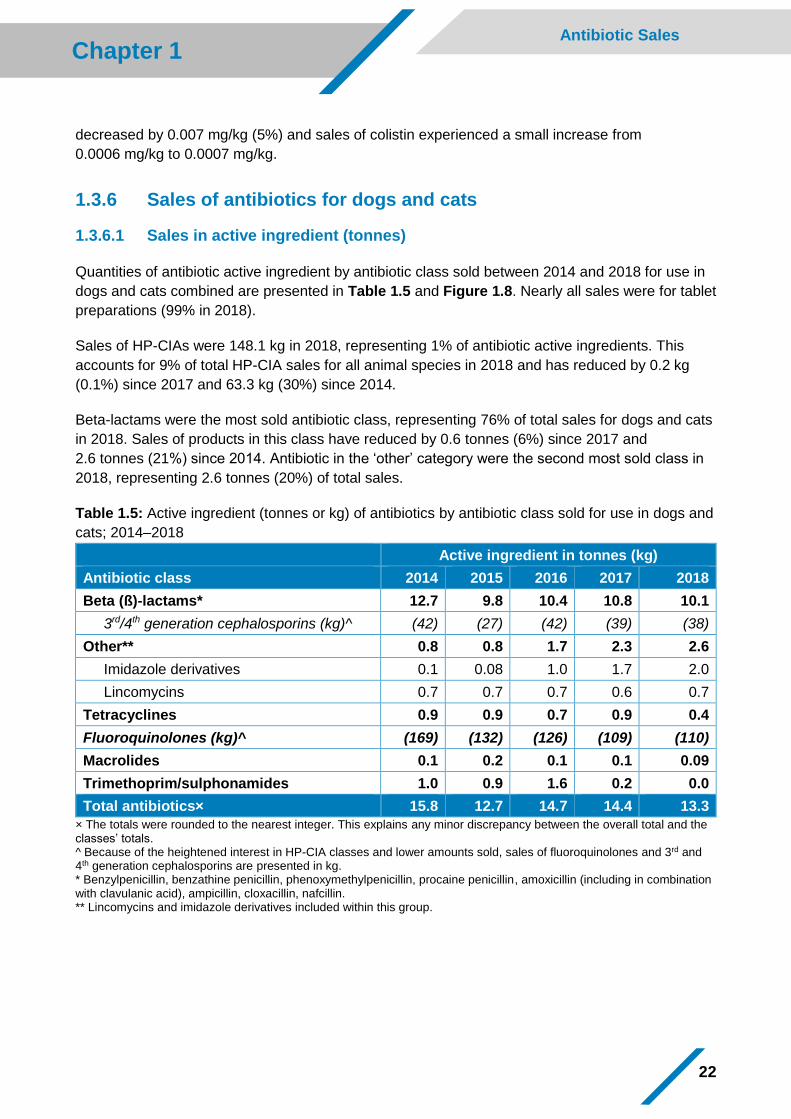
1.3.6.1 Sales in active ingredient (tonnes)
Quantities of antibiotic active ingredient by antibiotic class sold between 2014 and 2018 for use in
dogs and cats combined are presented in Table 1.5 and Figure 1.8. Nearly all sales were for tablet
preparations (99% in 2018).
Sales of HP-CIAs were 148.1 kg in 2018, representing 1% of antibiotic active ingredients. This
accounts for 9% of total HP-CIA sales for all animal species in 2018 and has reduced by 0.2 kg
(0.1%) since 2017 and 63.3 kg (30%) since 2014.
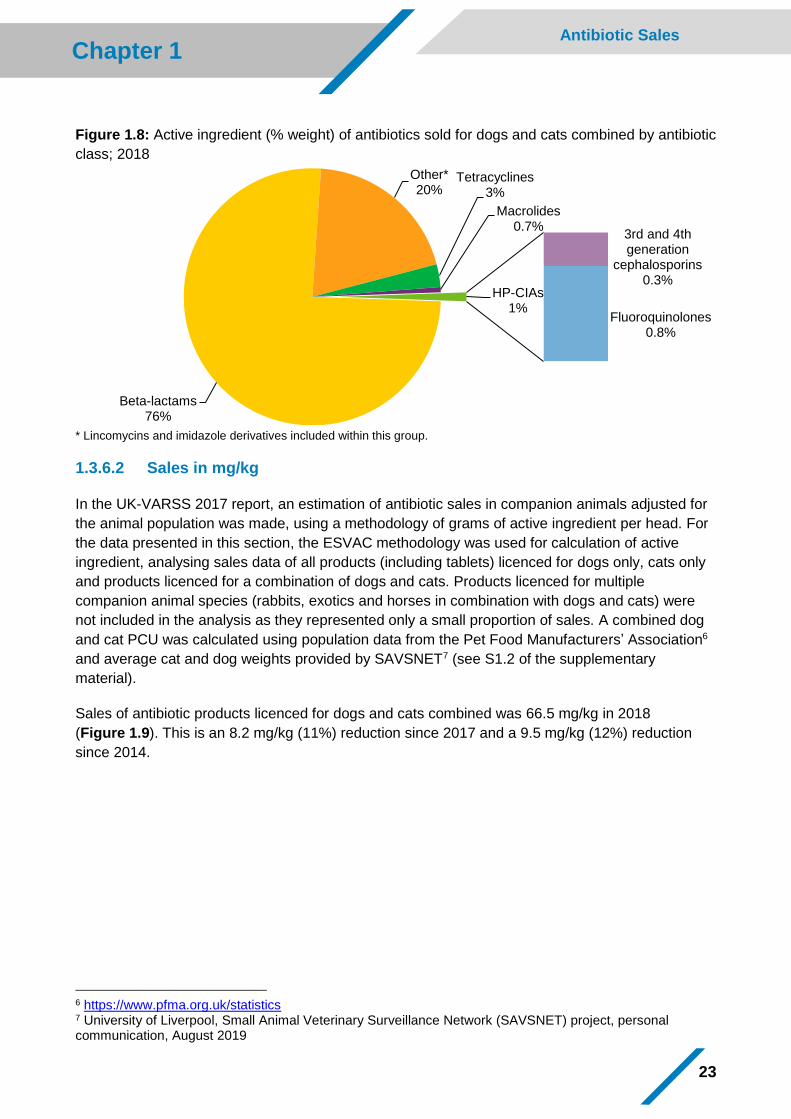
Beta-lactams were the most sold antibiotic class, representing 76% of total sales for dogs and cats
in 2018. Sales of products in this class have reduced by 0.6 tonnes (6%) since 2017 and
2.6 tonnes (21%) since 2014. Antibiotic in the ‘other’ category were the second most sold class in
2018, representing 2.6 tonnes (20%) of total sales.
Table 1.5: Active ingredient (tonnes or kg) of antibiotics by antibiotic class sold for use in dogs and
cats; 2014–2018
Active ingredient in tonnes (kg)
Antibiotic class 2014 2015 2016 2017 2018
Beta (ß)-lactams* 12.7 9.8 10.4 10.8 10.1
3rd/4th generation cephalosporins (kg)^ (42) (27) (42) (39) (38)
Other** 0.8 0.8 1.7 2.3 2.6
Imidazole derivatives 0.1 0.08 1.0 1.7 2.0
Lincomycins 0.7 0.7 0.7 0.6 0.7
Tetracyclines 0.9 0.9 0.7 0.9 0.4
Fluoroquinolones (kg)^ (169) (132) (126) (109) (110)
Macrolides 0.1 0.2 0.1 0.1 0.09
Trimethoprim/sulphonamides 1.0 0.9 1.6 0.2 0.0
Total antibiotics× 15.8 12.7 14.7 14.4 13.3
× The totals were rounded to the nearest integer. This explains any minor discrepancy between the overall total and the classes’ totals. ^ Because of the heightened interest in HP-CIA classes and lower amounts sold, sales of fluoroquinolones and 3rd and 4th generation cephalosporins are presented in kg. * Benzylpenicillin, benzathine penicillin, phenoxymethylpenicillin, procaine penicillin, amoxicillin (including in combination with clavulanic acid), ampicillin, cloxacillin, nafcillin. ** Lincomycins and imidazole derivatives included within this group.
23
Chapter 1 Antibiotic Sales
Figure 1.8: Active ingredient (% weight) of antibiotics sold for dogs and cats combined by antibiotic
class; 2018
* Lincomycins and imidazole derivatives included within this group.
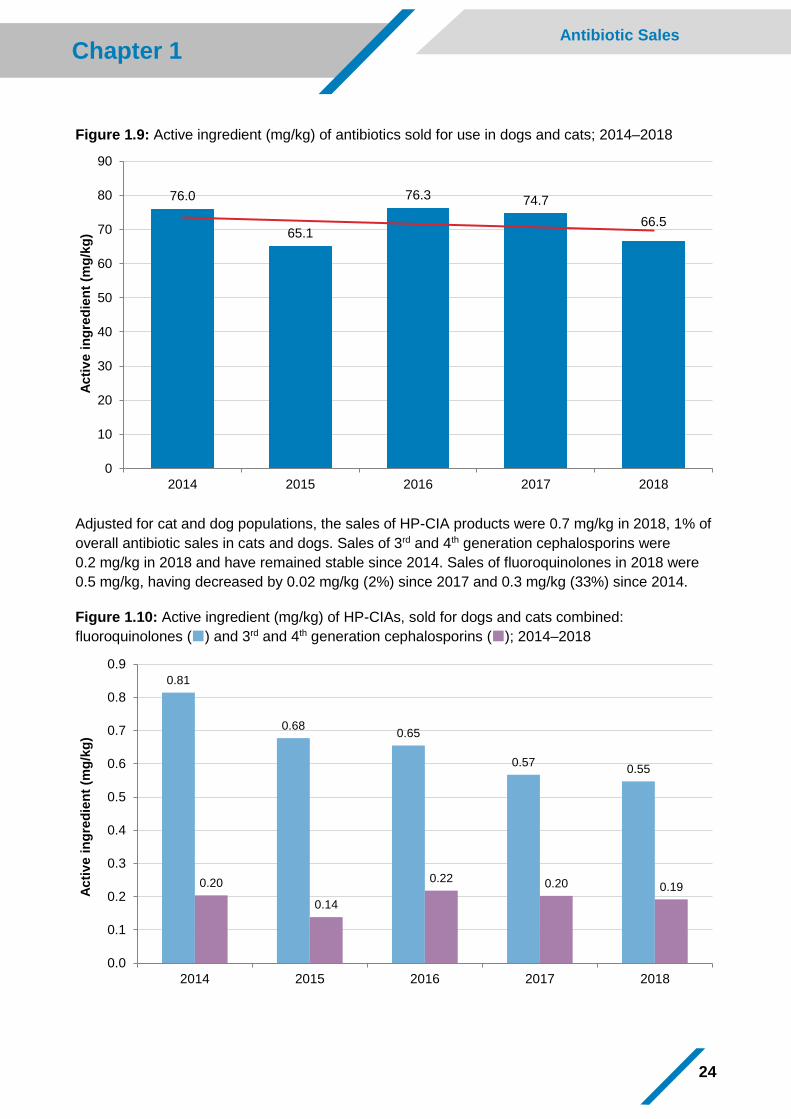
1.3.6.2 Sales in mg/kg
In the UK-VARSS 2017 report, an estimation of antibiotic sales in companion animals adjusted for
the animal population was made, using a methodology of grams of active ingredient per head. For
the data presented in this section, the ESVAC methodology was used for calculation of active
ingredient, analysing sales data of all products (including tablets) licenced for dogs only, cats only
and products licenced for a combination of dogs and cats. Products licenced for multiple
companion animal species (rabbits, exotics and horses in combination with dogs and cats) were
not included in the analysis as they represented only a small proportion of sales. A combined dog
and cat PCU was calculated using population data from the Pet Food Manufacturers’ Association6
and average cat and dog weights provided by SAVSNET7 (see S1.2 of the supplementary
material).
Sales of antibiotic products licenced for dogs and cats combined was 66.5 mg/kg in 2018
(Figure 1.9). This is an 8.2 mg/kg (11%) reduction since 2017 and a 9.5 mg/kg (12%) reduction
since 2014.
6 https://www.pfma.org.uk/statistics 7 University of Liverpool, Small Animal Veterinary Surveillance Network (SAVSNET) project, personal communication, August 2019
Beta-lactams76%
Other*20%
Tetracyclines3%
Macrolides0.7%
3rd and 4th generation
cephalosporins 0.3%
Fluoroquinolones 0.8%
HP-CIAs1%
24
Chapter 1 Antibiotic Sales
Figure 1.9: Active ingredient (mg/kg) of antibiotics sold for use in dogs and cats; 2014–2018
Adjusted for cat and dog populations, the sales of HP-CIA products were 0.7 mg/kg in 2018, 1% of
overall antibiotic sales in cats and dogs. Sales of 3rd and 4th generation cephalosporins were
0.2 mg/kg in 2018 and have remained stable since 2014. Sales of fluoroquinolones in 2018 were
0.5 mg/kg, having decreased by 0.02 mg/kg (2%) since 2017 and 0.3 mg/kg (33%) since 2014.
Figure 1.10: Active ingredient (mg/kg) of HP-CIAs, sold for dogs and cats combined:
fluoroquinolones () and 3rd and 4th generation cephalosporins (); 2014–2018
76.0
65.1
76.3 74.7
66.5
0
10
20
30
40
50
60
70
80
90
2014 2015 2016 2017 2018
Acti
ve i
ng
red
ien
t (m
g/k
g)
0.81
0.680.65
0.570.55
0.20
0.14
0.22 0.20 0.19
0.0
0.1
0.2
0.3
0.4
0.5
0.6
0.7
0.8
0.9
2014 2015 2016 2017 2018
Acti
ve i
ng
red
ien
t (m
g/k
g)
25
Chapter 1 Antibiotic Sales
It should be noted that the combined dog/cat mg/kg metric may not correlate with the number of
antibiotic courses administered. In particular, long-acting products and those administered to cats
will tend to be under-represented as, in general, less active ingredient is administered per course
when compared with short-acting products and those administered to dogs.
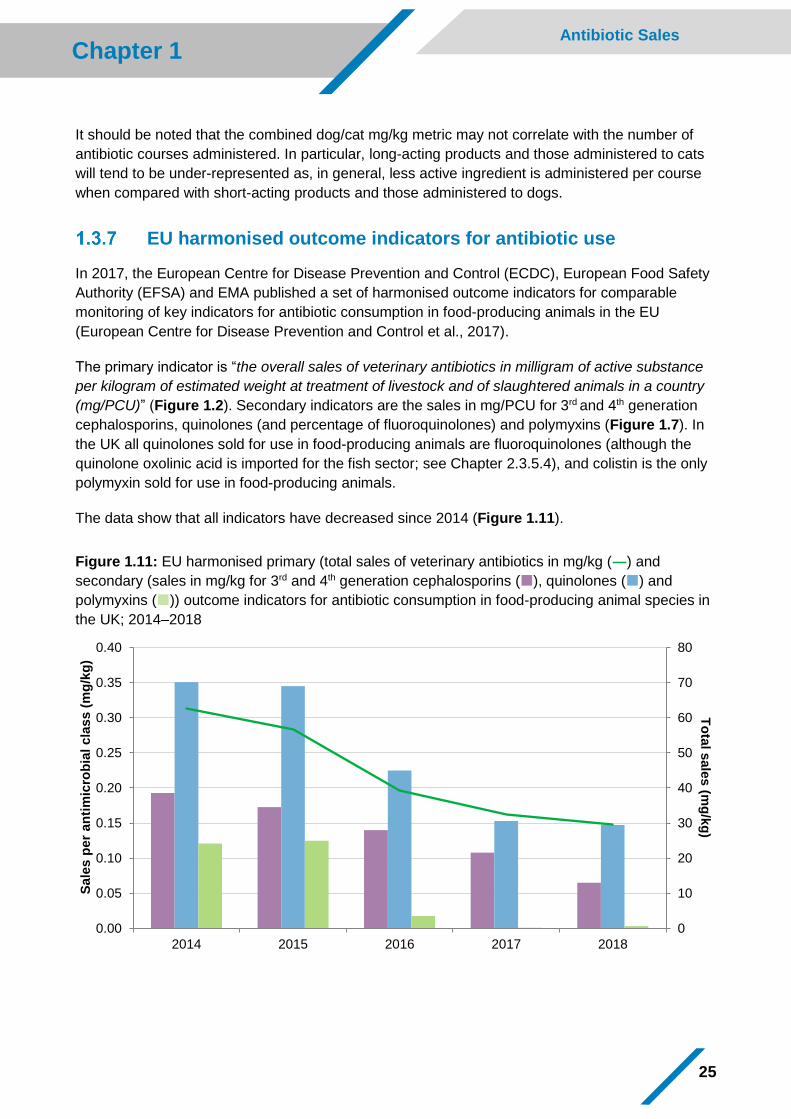
EU harmonised outcome indicators for antibiotic use
In 2017, the European Centre for Disease Prevention and Control (ECDC), European Food Safety
Authority (EFSA) and EMA published a set of harmonised outcome indicators for comparable
monitoring of key indicators for antibiotic consumption in food-producing animals in the EU
(European Centre for Disease Prevention and Control et al., 2017).
The primary indicator is “the overall sales of veterinary antibiotics in milligram of active substance
per kilogram of estimated weight at treatment of livestock and of slaughtered animals in a country
(mg/PCU)” (Figure 1.2). Secondary indicators are the sales in mg/PCU for 3rd and 4th generation
cephalosporins, quinolones (and percentage of fluoroquinolones) and polymyxins (Figure 1.7). In
the UK all quinolones sold for use in food-producing animals are fluoroquinolones (although the
quinolone oxolinic acid is imported for the fish sector; see Chapter 2.3.5.4), and colistin is the only
polymyxin sold for use in food-producing animals.
The data show that all indicators have decreased since 2014 (Figure 1.11).
Figure 1.11: EU harmonised primary (total sales of veterinary antibiotics in mg/kg (―) and
secondary (sales in mg/kg for 3rd and 4th generation cephalosporins (), quinolones () and
polymyxins ()) outcome indicators for antibiotic consumption in food-producing animal species in
the UK; 2014–2018
0
10
20
30
40
50
60
70
80
0.00
0.05
0.10
0.15
0.20
0.25
0.30
0.35
0.40
2014 2015 2016 2017 2018
To
tal s
ale
s (m
g/k
g)
Sale
s p
er
an
tim
icro
bia
l cla
ss (
mg
/kg
)
26
Chapter 1 Antibiotic Sales
1.4 Methods Data collection and validation
Pharmaceutical companies supplied annual sales of all authorised veterinary antibiotics to the VMD in
accordance with the Veterinary Medicines Regulations8. Upon receipt, data were collated and validated.
Product data entries were compared to those submitted in previous years. If there are large discrepancies
between data provided in successive years, data validity is investigated and queried with the pharmaceutical
company. Sales data contained in returned Periodic Safety Update Reports (PSURs) for antibiotic veterinary
medicinal products were also compared to the sales data returned by the pharmaceutical companies, and
any discrepancies investigated (further details can be found in Annex D).
Tonnes of active ingredient
The weight of antibiotic active ingredient sold is a measurement obtained by multiplying the quantitative
composition of active ingredient for each product, taken from the Summary of Product Characteristics (SPC),
by the number of units sold as reported by the pharmaceutical companies. For some active ingredients that
are either prodrugs or expressed in International Units (IU), a conversion factor is applied. These conversion
factors are recommended by the European Medicines Agency (EMA) in the framework of the European
Surveillance of Veterinary Antimicrobial Consumption (ESVAC) project (European Medicines Agency, 2018).
Since UK-VARSS 2015 (published in 2016), sales data have been reported using ESVAC methodology.
Further details on historical methodology for the calculation of quantity of active ingredient (as well as
mg/PCU, see below) can be found in section S1.1 of the supplementary material. Note that data presented in
mg/kg for food-producing animals (which equals mg/PCU) do not include tablets, as, in line with the ESVAC
methodology, these are assumed to be exclusively administered to companion animals.
The data reported here are presented according to the ATCvet Classification System for veterinary medicinal
products shown in Table S1.1.2 of the supplementary material (World Health Organization, 2018). Sales of
dermatological preparations and preparations for sensory organs (described as ‘other’ route of administration
in this and previous UK-VARSS reports) are not included in calculations. Sales of these products have
remained stable and account for no more than 3 tonnes of active ingredient (Table S1.1.3 of the
supplementary material).
Population Correction Unit
Trends in sales of antibiotics over time are determined by taking into consideration variations in the size and
number of the animal population. To achieve this, sales data were analysed using the Population Correction
Unit (PCU), a theoretical unit of measure formulated by the EMA and adopted by the countries participating
in the ESVAC project to standardise sales against an animal population denominator. Using the PCU, overall
sales of products authorised for use in food-producing animal species can be presented as mg/PCU.
The mg/PCU can be considered as the average quantity of active ingredient sold per kilogram bodyweight of
food-producing animal in the UK based on an estimated weight at the point of treatment and enables year-
on-year comparisons to be made. Further details on these calculations are presented in section S1.2 of the
supplementary material and full technical details on PCU methodology can be found in the 2011 ESVAC
report (European Medicines Agency, 2011). Within the sales section of this UK-VARSS report, all
references to mg/kg for food-producing animals equate to mg/PCU.
Corrections for historical data
During the 2018 data collection, it was brought to the VMD’s attention that sales data for several products
were over-reported by one pharmaceutical company in 2016 and 2017. This UK-VARSS 2018 report
contains the corrected data and analyses for these years. Sales data within reports for two years prior to this
one should no longer be referenced.
8 http://www.legislation.gov.uk/uksi/2013/2033/contents/made
CHAPTER 2 Usage of Veterinary Antibiotics by Animal Species
28
Chapter 2 Antibiotic usage
2.1 Summary
The report highlights reductions in total antibiotic usage (when comparing 2017 and 2018) within:
▪ The pig sector, which have reduced usage by a further 21 mg/kg (16%);
▪ The duck sector, which have reduced usage by a further 1.5 mg/kg (47%);
▪ The salmon sector, which have reduced usage by 9.6 mg/kg (60%);
▪ The trout sector, which have reduced usage by 6.2 mg/kg (32%);
▪ The gamebird sector, which have reduced usage by a further 3.3 tonnes (25%).
Increases were seen for the following sectors:
▪ The broiler sector, which increased usage by 2.5 mg/kg (26%);
▪ The laying hen sector, which increased usage by 0.06 % doses (11%);
▪ The turkey sector, which increased usage by 1.5 mg/kg (3%).
However, total usage in 2018 was still 27%, 14% and 46% lower than the figures reported in 2016
for broilers, laying hens and turkeys, respectively.
In addition, no HP-CIAs were used in the laying hen, salmon and trout sectors, and further
reductions in the use of HP-CIAs were reported in the pig, gamebird, meat poultry, dairy and beef
sectors.
2.2 Introduction
Many antibiotics are authorised for use in multiple animal species, so it is not possible to determine
from sales data how much is used per species. The VMD is working in partnership with food-
producing animal sectors to develop, facilitate and coordinate antibiotic usage data collection
systems.
Antibiotic usage refers to the amount of antibiotics purchased, prescribed and/or administered.
Capturing antibiotic usage data by animal species provides a baseline against which trends and
the impact of interventions, such as those designed to reduce antibiotic use, can be measured.
The data can also be used to investigate better any correlation between changing antibiotic use
and antibiotic resistance. Data collection systems will also enable benchmarking, enabling farmers
to compare themselves with their peers and encouraging veterinarians and farmers to identify and
share good practice.
This chapter describes the progress achieved so far, with updates from the food-producing animal
sectors. Note that, for ease of reading, the data have been rounded to the nearest integer, other
than for percentages, which have been calculated using the exact number. Methodology is outlined
in section 2.4.
29
Chapter 2 Antibiotic usage
2.3 Results
2.3.1 Pigs
2.3.1.1 Antibiotics usage data
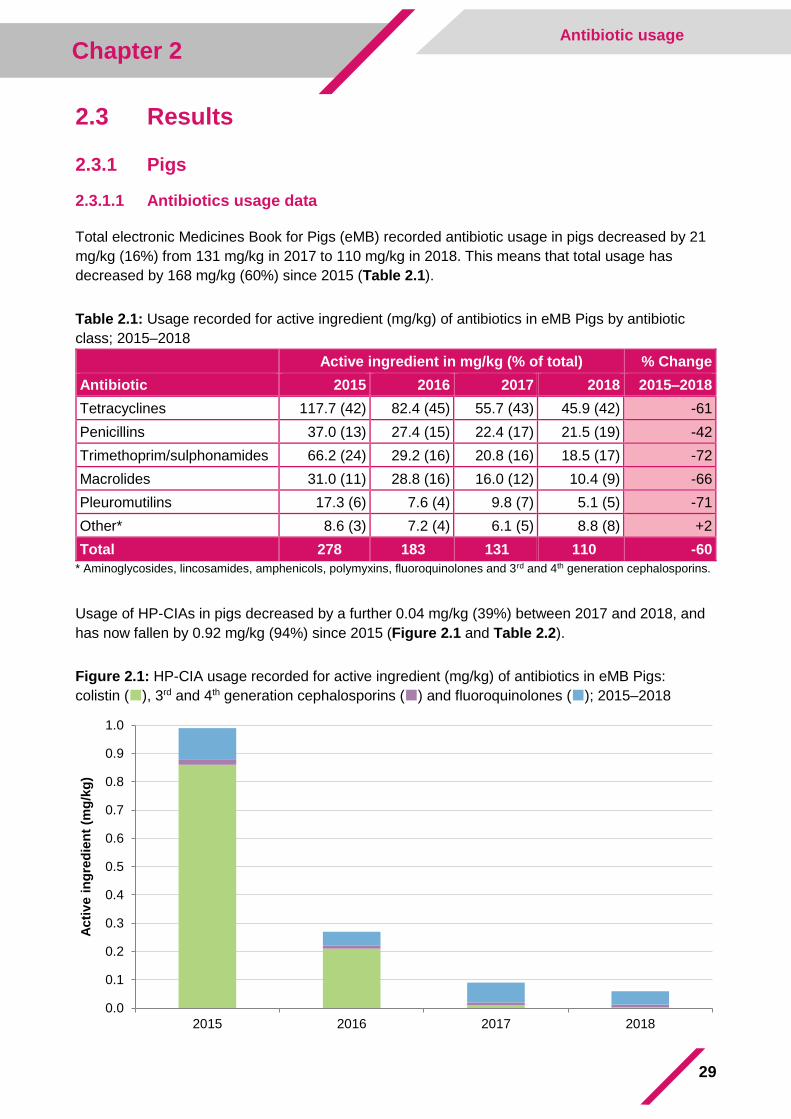
Total electronic Medicines Book for Pigs (eMB) recorded antibiotic usage in pigs decreased by 21
mg/kg (16%) from 131 mg/kg in 2017 to 110 mg/kg in 2018. This means that total usage has
decreased by 168 mg/kg (60%) since 2015 (Table 2.1).
Table 2.1: Usage recorded for active ingredient (mg/kg) of antibiotics in eMB Pigs by antibiotic
class; 2015–2018
Active ingredient in mg/kg (% of total) % Change
Antibiotic 2015 2016 2017 2018 2015–2018
Tetracyclines 117.7 (42) 82.4 (45) 55.7 (43) 45.9 (42) -61
Penicillins 37.0 (13) 27.4 (15) 22.4 (17) 21.5 (19) -42
Trimethoprim/sulphonamides 66.2 (24) 29.2 (16) 20.8 (16) 18.5 (17) -72
Macrolides 31.0 (11) 28.8 (16) 16.0 (12) 10.4 (9) -66
Pleuromutilins 17.3 (6) 7.6 (4) 9.8 (7) 5.1 (5) -71
Other* 8.6 (3) 7.2 (4) 6.1 (5) 8.8 (8) +2
Total 278 183 131 110 -60
* Aminoglycosides, lincosamides, amphenicols, polymyxins, fluoroquinolones and 3rd and 4th generation cephalosporins.
Usage of HP-CIAs in pigs decreased by a further 0.04 mg/kg (39%) between 2017 and 2018, and
has now fallen by 0.92 mg/kg (94%) since 2015 (Figure 2.1 and Table 2.2).
Figure 2.1: HP-CIA usage recorded for active ingredient (mg/kg) of antibiotics in eMB Pigs:
colistin (), 3rd and 4th generation cephalosporins () and fluoroquinolones (); 2015–2018
0.0
0.1
0.2
0.3
0.4
0.5
0.6
0.7
0.8
0.9
1.0
2015 2016 2017 2018
Acti
ve i
ng
red
ien
t (m
g/k
g)
30
Chapter 2 Antibiotic usage
Table 2.2: HP-CIA usage (active ingredient of antibiotics, mg/kg) recorded in eMB Pigs; 2015–18
Active ingredient in mg/kg % Change
Antibiotic 2015 2016 2017 2018 2015–2018
Fluoroquinolones 0.11 0.05 0.07 0.05 -55
3rd/4th generation cephalosporins 0.02 0.01 0.01 0.01 -54
Colistin 0.86 0.21 0.01 0.004 -99.6
Total 0.98 0.27 0.10 0.06 -94
Tetracyclines represented 42% of antibiotic used, with penicillins, trimethoprim/sulphonamides and
macrolides representing a further 45% (Figure 2.2). Due to lack of availability of the authorised
product, 1.8 and 4.5 tonnes of oral trimethoprim-sulphonamide for pigs was imported under the
Special Import Scheme in 2017 and 2018, respectively. This is not included in the sales data in
CHAPTER 1.
In-feed is still the most common route of administration, although relative use has decreased from
78% in 2017 to 72% in 2018. Correspondingly, in-water now accounts for 24% active ingredient
used (compared with 19% in 2017) and injectables 4% (compared with 3% last year) (data not
shown).
Figure 2.2: Antibiotic active ingredients by class (%) reported in eMB Pigs; 2018
* Aminoglycosides, lincosamides, amphenicols, polymyxins, fluoroquinolones and 3rd and 4th generation cephalosporins.
Tetracyclines42%
Penicillins19%
Trimethoprim/ sulphonamides
17%
Macrolides9%
Pleuromutilins5%
Other*8%
31
Chapter 2 Antibiotic usage
2.3.1.2 Statement from Pig Health and Welfare Council (PHWC) Antimicrobial
Usage Subgroup
“The further reductions in both total antibiotic use and the use of HP-CIAs by the pig sector is
testament to the great efforts and commitment of pig producers and their veterinarians to champion
responsible antibiotic use. Factors contributing to this success include improved industry
biosecurity and the new benchmarking tool within the eMB which allows producers to benchmark
their antibiotic usage against other producers with similar production systems. This has enabled
producers to understand their own patterns of antibiotic use and, alongside their veterinarians,
make informed decisions around animal treatments. The sector is now well on the way to achieving
the challenging target set by the pig sector of reaching 99 mg/kg by 2020. As we approach this
target, it is important that producers continue to work with their veterinarians to ensure further
reductions don’t compromise animal health or welfare.”
2.3.2 Meat poultry
2.3.2.1 Antibiotic usage data
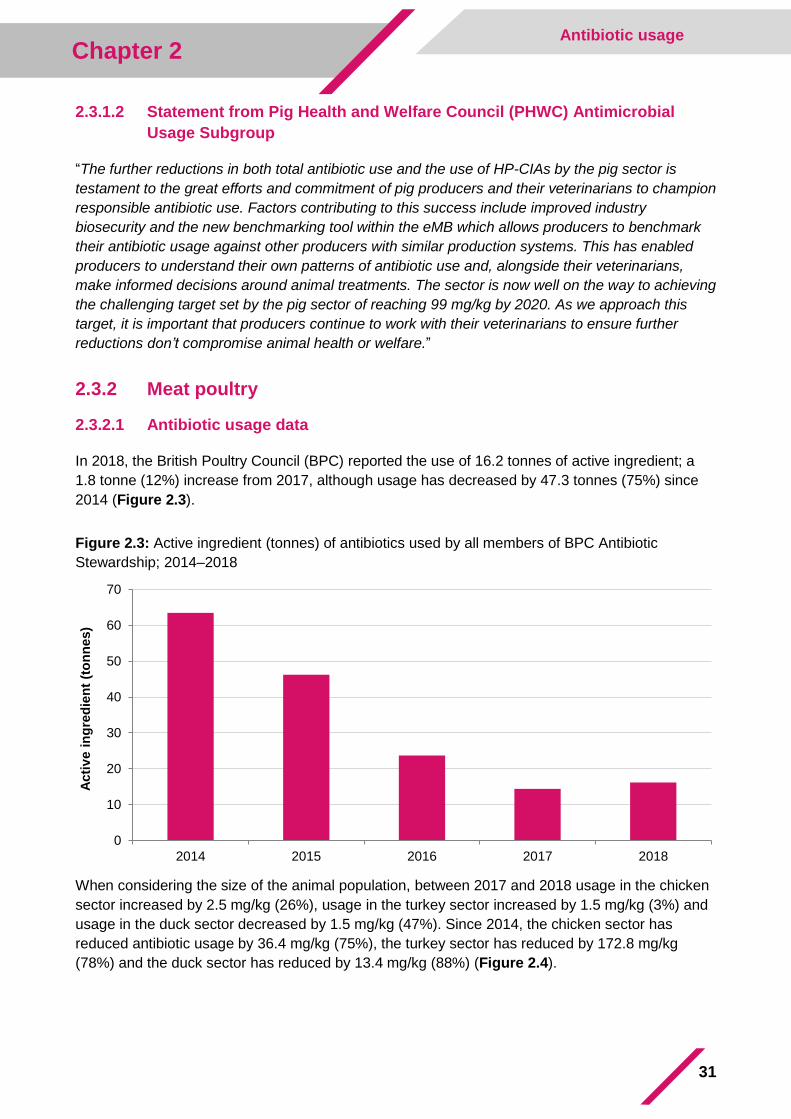
In 2018, the British Poultry Council (BPC) reported the use of 16.2 tonnes of active ingredient; a
1.8 tonne (12%) increase from 2017, although usage has decreased by 47.3 tonnes (75%) since
2014 (Figure 2.3).
Figure 2.3: Active ingredient (tonnes) of antibiotics used by all members of BPC Antibiotic
Stewardship; 2014–2018
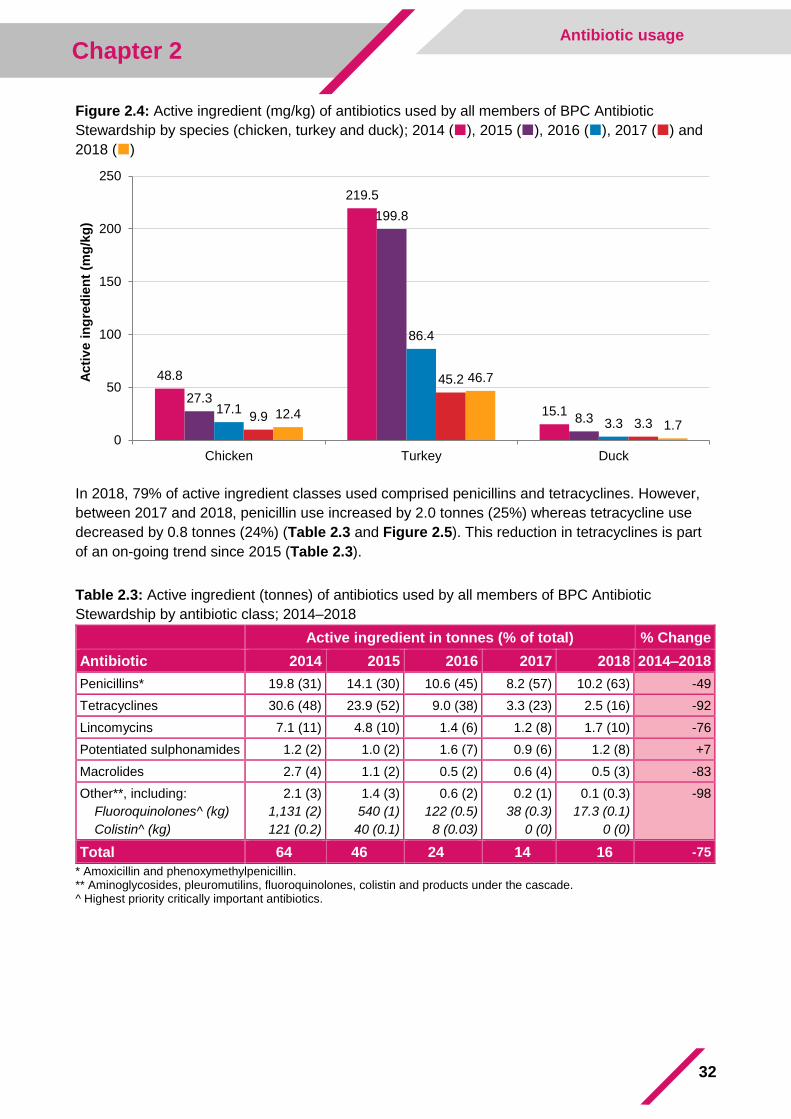
When considering the size of the animal population, between 2017 and 2018 usage in the chicken
sector increased by 2.5 mg/kg (26%), usage in the turkey sector increased by 1.5 mg/kg (3%) and
usage in the duck sector decreased by 1.5 mg/kg (47%). Since 2014, the chicken sector has
reduced antibiotic usage by 36.4 mg/kg (75%), the turkey sector has reduced by 172.8 mg/kg
(78%) and the duck sector has reduced by 13.4 mg/kg (88%) (Figure 2.4).
0
10
20
30
40
50
60
70
2014 2015 2016 2017 2018
Acti
ve i
ng
red
ien
t (t
on
nes)
32
Chapter 2 Antibiotic usage
Figure 2.4: Active ingredient (mg/kg) of antibiotics used by all members of BPC Antibiotic
Stewardship by species (chicken, turkey and duck); 2014 (), 2015 (), 2016 (), 2017 () and
2018 ()
In 2018, 79% of active ingredient classes used comprised penicillins and tetracyclines. However,
between 2017 and 2018, penicillin use increased by 2.0 tonnes (25%) whereas tetracycline use
decreased by 0.8 tonnes (24%) (Table 2.3 and Figure 2.5). This reduction in tetracyclines is part
of an on-going trend since 2015 (Table 2.3).
Table 2.3: Active ingredient (tonnes) of antibiotics used by all members of BPC Antibiotic
Stewardship by antibiotic class; 2014–2018
Active ingredient in tonnes (% of total) % Change
Antibiotic 2014 2015 2016 2017 2018 2014–2018
Penicillins* 19.8 (31) 14.1 (30) 10.6 (45) 8.2 (57) 10.2 (63) -49
Tetracyclines 30.6 (48) 23.9 (52) 9.0 (38) 3.3 (23) 2.5 (16) -92
Lincomycins 7.1 (11) 4.8 (10) 1.4 (6) 1.2 (8) 1.7 (10) -76
Potentiated sulphonamides 1.2 (2) 1.0 (2) 1.6 (7) 0.9 (6) 1.2 (8) +7
Macrolides 2.7 (4) 1.1 (2) 0.5 (2) 0.6 (4) 0.5 (3) -83
Other**, including:
Fluoroquinolones^ (kg)
Colistin^ (kg)
2.1 (3)
1,131 (2)
121 (0.2)
1.4 (3)
540 (1)
40 (0.1)
0.6 (2)
122 (0.5)
8 (0.03)
0.2 (1)
38 (0.3)
0 (0)
0.1 (0.3)
17.3 (0.1)
0 (0)
-98
Total 64 46 24 14 16 -75
* Amoxicillin and phenoxymethylpenicillin. ** Aminoglycosides, pleuromutilins, fluoroquinolones, colistin and products under the cascade. ^ Highest priority critically important antibiotics.
48.8
219.5
15.127.3
199.8
8.317.1
86.4
3.39.9
45.2
3.312.4
46.7
1.70
50
100
150
200
250
Chicken Turkey Duck
Acti
ve i
ng
red
ien
t (m
g/k
g)
33
Chapter 2 Antibiotic usage
Figure 2.5: Antibiotic active ingredient by class (%) used by members of BPC Antibiotic
Stewardship; 2018
* Aminoglycosides, pleuromutilins, fluoroquinolones and products under the cascade.
Colistin and 3rd and 4th generation cephalosporins were once again not used by the meat poultry
sectors in 2018. Fluoroquinolones were not used by the duck sector and only used in very small
quantities by the broiler sector (325 g active ingredient). Between 2017 and 2018, the turkey sector
reduced the use of fluoroquinolones by 0.18 mg/kg (46%) to 0.2 mg/kg, which is a reduction of 7.3
mg/kg (97%) since 2014. Overall, the poultry meat sector used 0.016 mg/kg HP-CIAs in 2018, a
49% drop between 2017 and 2018 and a 99% drop since 2014.
2.3.2.2 Statement from British Poultry Council
“BPC Antibiotic Stewardship’s four pillars of data collection, rapid on-farm diagnostics, sharing best
practice and understanding patterns of resistance are delivering excellence in bird health and
welfare. The poultry meat sector continues to monitor and review on-farm management practices
and promote responsible antibiotic use throughout the supply chain. The latest data from 2018
show slight increases in antibiotic usage for the chicken and turkey sectors, although the levels are
still 27% below those seen in 2016 for chickens and 46% below 2016 levels for turkeys. BPC
Antibiotic Stewardship has carried out a farm-level review into reasons for antibiotic treatment in
2018 and found that there was an increase in seasonal bacterial infections requiring treatment to
maintain bird health and welfare. The duck sector reduced usage by a further 47% in 2018 to
1.7 mg/kg and members of the BPC Antibiotic Stewardship are below the government endorsed
RUMA species specific targets of 25 mg/PCU for chicken and 50 mg/PCU for turkey.”
2.3.3 Laying hens
2.3.3.1 Antibiotic usage data
A total of 3.2 tonnes of antibiotic active ingredient were used by the laying hen industry in 2018.
This represents 0.63 actual bird days treated/100 bird days at risk, an 11% increase from 2017 but
13% lower than the figure reported in 2016 (Table 2.4).
Penicillins63%
Tetracyclines16%
Lincomycin10%
Potentiated sulphonamides
8%
Macrolides3%
Other*0.3%
34
Chapter 2 Antibiotic usage
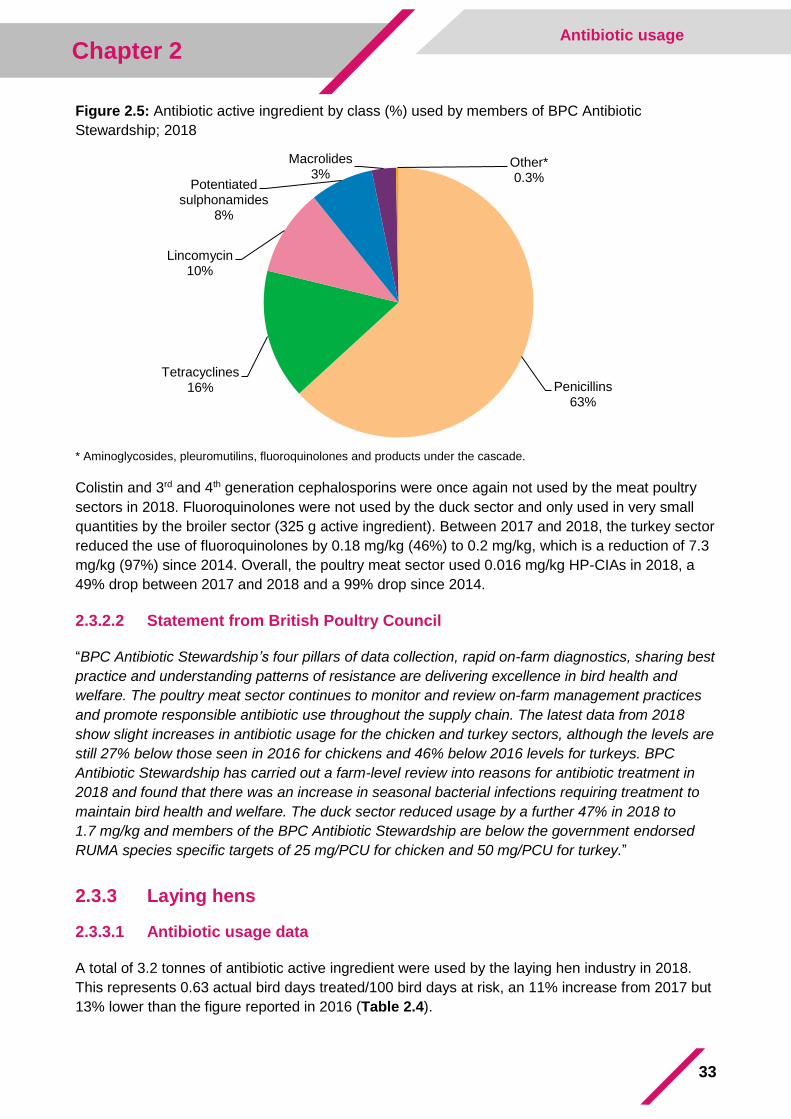
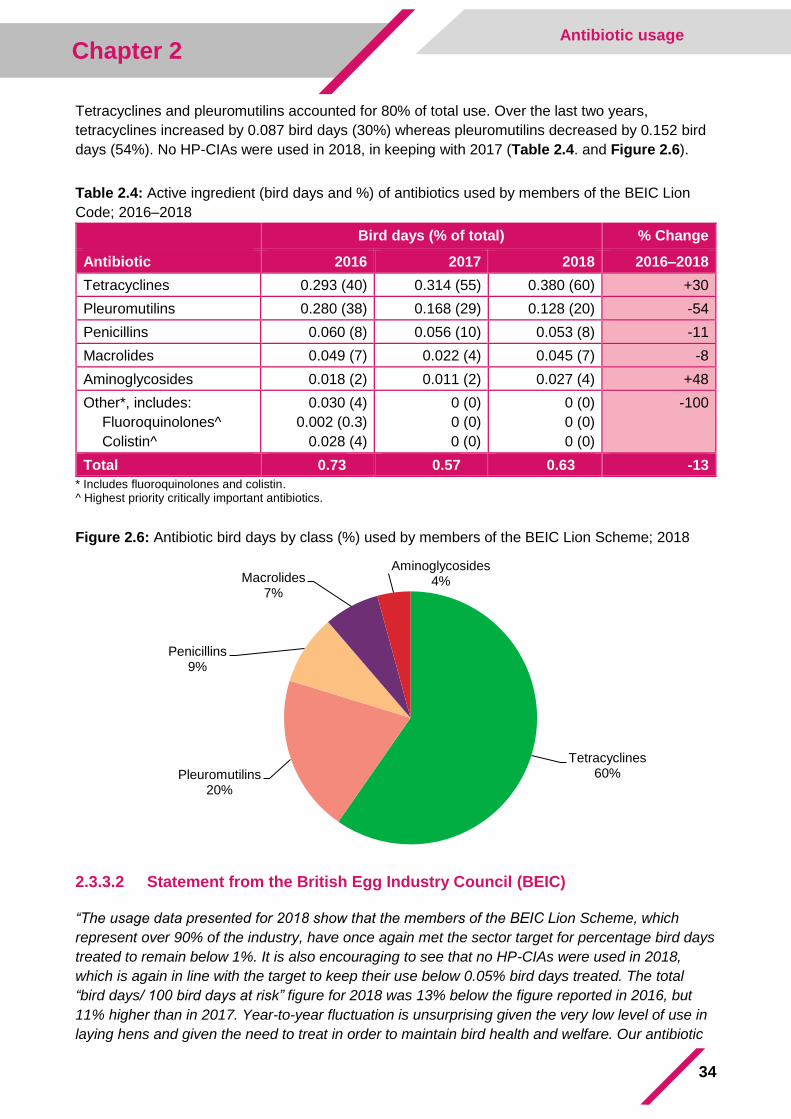
Tetracyclines and pleuromutilins accounted for 80% of total use. Over the last two years,
tetracyclines increased by 0.087 bird days (30%) whereas pleuromutilins decreased by 0.152 bird
days (54%). No HP-CIAs were used in 2018, in keeping with 2017 (Table 2.4. and Figure 2.6).
Table 2.4: Active ingredient (bird days and %) of antibiotics used by members of the BEIC Lion
Code; 2016–2018
Bird days (% of total) % Change
Antibiotic 2016 2017 2018 2016–2018
Tetracyclines 0.293 (40) 0.314 (55) 0.380 (60) +30
Pleuromutilins 0.280 (38) 0.168 (29) 0.128 (20) -54
Penicillins 0.060 (8) 0.056 (10) 0.053 (8) -11
Macrolides 0.049 (7) 0.022 (4) 0.045 (7) -8
Aminoglycosides 0.018 (2) 0.011 (2) 0.027 (4) +48
Other*, includes:
Fluoroquinolones^
Colistin^
0.030 (4)
0.002 (0.3)
0.028 (4)
0 (0)
0 (0)
0 (0)
0 (0)
0 (0)
0 (0)
-100
Total 0.73 0.57 0.63 -13
* Includes fluoroquinolones and colistin. ^ Highest priority critically important antibiotics.
Figure 2.6: Antibiotic bird days by class (%) used by members of the BEIC Lion Scheme; 2018
2.3.3.2 Statement from the British Egg Industry Council (BEIC)
“The usage data presented for 2018 show that the members of the BEIC Lion Scheme, which
represent over 90% of the industry, have once again met the sector target for percentage bird days
treated to remain below 1%. It is also encouraging to see that no HP-CIAs were used in 2018,
which is again in line with the target to keep their use below 0.05% bird days treated. The total
“bird days/ 100 bird days at risk” figure for 2018 was 13% below the figure reported in 2016, but
11% higher than in 2017. Year-to-year fluctuation is unsurprising given the very low level of use in
laying hens and given the need to treat in order to maintain bird health and welfare. Our antibiotic
Tetracyclines60%Pleuromutilins
20%
Penicillins9%
Macrolides7%
Aminoglycosides4%
35
Chapter 2 Antibiotic usage
use recording system has been expanded this year to collect data on the indications of each
treatment. We hope this will help farmers and veterinarians better understand the main needs for
medication and help them reduce the need for medication.”
2.3.4 Gamebirds
2.3.4.1 Antibiotic usage data
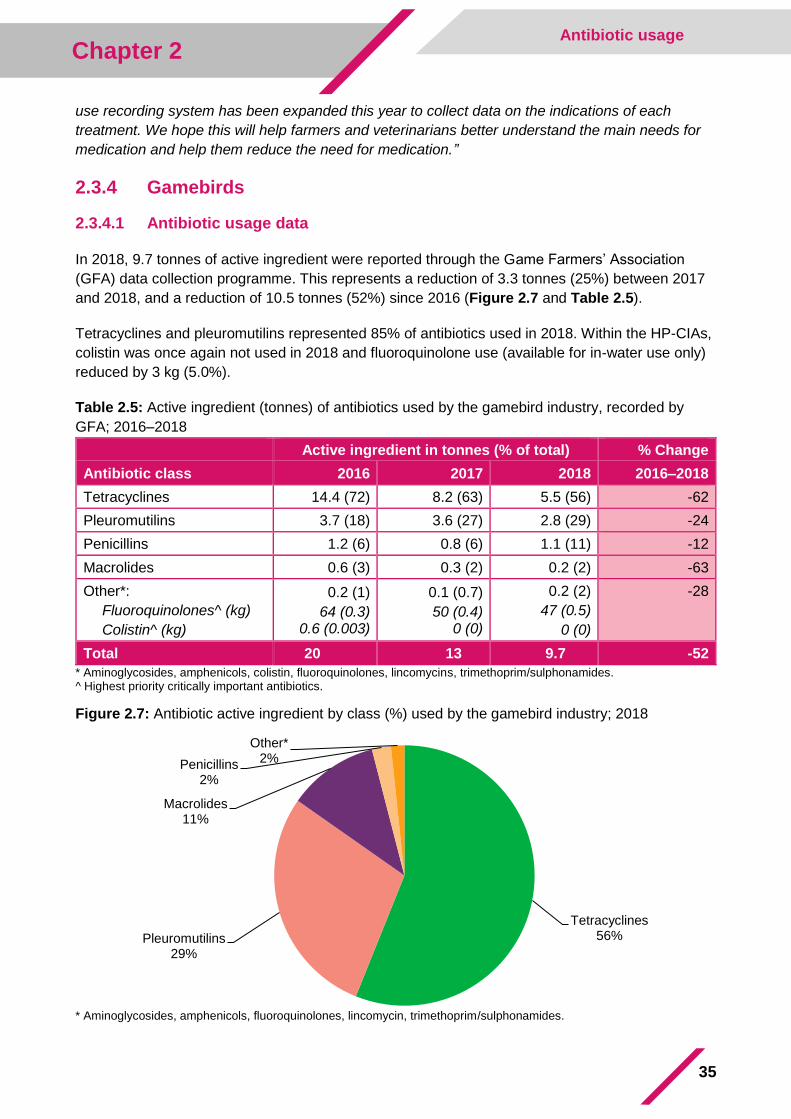
In 2018, 9.7 tonnes of active ingredient were reported through the Game Farmers’ Association
(GFA) data collection programme. This represents a reduction of 3.3 tonnes (25%) between 2017
and 2018, and a reduction of 10.5 tonnes (52%) since 2016 (Figure 2.7 and Table 2.5).
Tetracyclines and pleuromutilins represented 85% of antibiotics used in 2018. Within the HP-CIAs,
colistin was once again not used in 2018 and fluoroquinolone use (available for in-water use only)
reduced by 3 kg (5.0%).
Table 2.5: Active ingredient (tonnes) of antibiotics used by the gamebird industry, recorded by
GFA; 2016–2018
Active ingredient in tonnes (% of total) % Change
Antibiotic class 2016 2017 2018 2016–2018
Tetracyclines 14.4 (72) 8.2 (63) 5.5 (56) -62
Pleuromutilins 3.7 (18) 3.6 (27) 2.8 (29) -24
Penicillins 1.2 (6) 0.8 (6) 1.1 (11) -12
Macrolides 0.6 (3) 0.3 (2) 0.2 (2) -63
Other*:
Fluoroquinolones^ (kg)
Colistin^ (kg)
0.2 (1)
64 (0.3) 0.6 (0.003)
0.1 (0.7)
50 (0.4) 0 (0)
0.2 (2)
47 (0.5)
0 (0)
-28
Total 20 13 9.7 -52
* Aminoglycosides, amphenicols, colistin, fluoroquinolones, lincomycins, trimethoprim/sulphonamides. ^ Highest priority critically important antibiotics.
Figure 2.7: Antibiotic active ingredient by class (%) used by the gamebird industry; 2018
* Aminoglycosides, amphenicols, fluoroquinolones, lincomycin, trimethoprim/sulphonamides.
Tetracyclines56%Pleuromutilins
29%
Macrolides11%
Penicillins2%
Other*2%
36
Chapter 2 Antibiotic usage
Analysis of usage data by route of administration shows that in-feed medication accounted for 46%
antibiotic use, and this has reduced by 2.5 tonnes (35%) since 2017 and 10.4 tonnes (70%) since
2016. In-water medication reduced by 0.8 tonnes (14%) since 2017, to the same levels seen in
2016.
2.3.4.2 Statement from the Game Farmers’ Association
“The reductions demonstrated in 2018 reflect a further year of good engagement by the gamebird
sector, and the industry has halved antibiotic use since our voluntary campaign was rolled out in
2016. In particular, the reduction in in-feed use reflects a continuing focus on treating actual
disease outbreaks rather than feeding medicated rations 'just in case'. However, the gamebird
sector will not stop here, and are continuing to push for further antibiotic reductions.”
2.3.5 Cattle
2.3.5.1 Dairy usage
The dairy data for 2018 cover 2,978 farms and represent 30% of UK dairy cattle. This is a larger
sample than last year, with relatively higher coverage in Wales and Scotland (Table 2.6). The
mean herd size within the sample is 226 dairy breed animals over 2 years of age, which is 30%
higher than the overall UK mean. Because of these differences in the sample population of farms
between years, caution should be taken when interpreting trends. In addition, antibiotic usage in
this convenience sample may not be representative of the whole UK dairy population.
In this sample of dairy farms, 4.9 tonnes of antibiotic active ingredient were used, which represents
17 mg/kg. Sales of 3rd and 4th generation cephalosporins continued to fall and there was no colistin
use in 2018. Overall, HP-CIAs accounted for 2% of antibiotic active ingredient used, a reduction
from 4% in 2017.
Table 2.6: Comparison of national coverage of adult dairy cows (over 2 years of age) included in
the FarmVet Systems sample; 2017–2018
% coverage
2017 2018
England 30 31
Northern Ireland 33 33
Wales 12 31
Scotland 17 20
UK 26 30
* Calculated by comparing the number of dairy cattle >2 years of age in the sample with national records of number of dairy cows >2 years of age (with and without offspring). Note the percentages are slightly lower than those reported last year, when only cows >2 years of age with offspring from national records were considered in the calculation.
As in previous years, penicillins/1st generation cephalosporins, aminoglycosides and tetracyclines
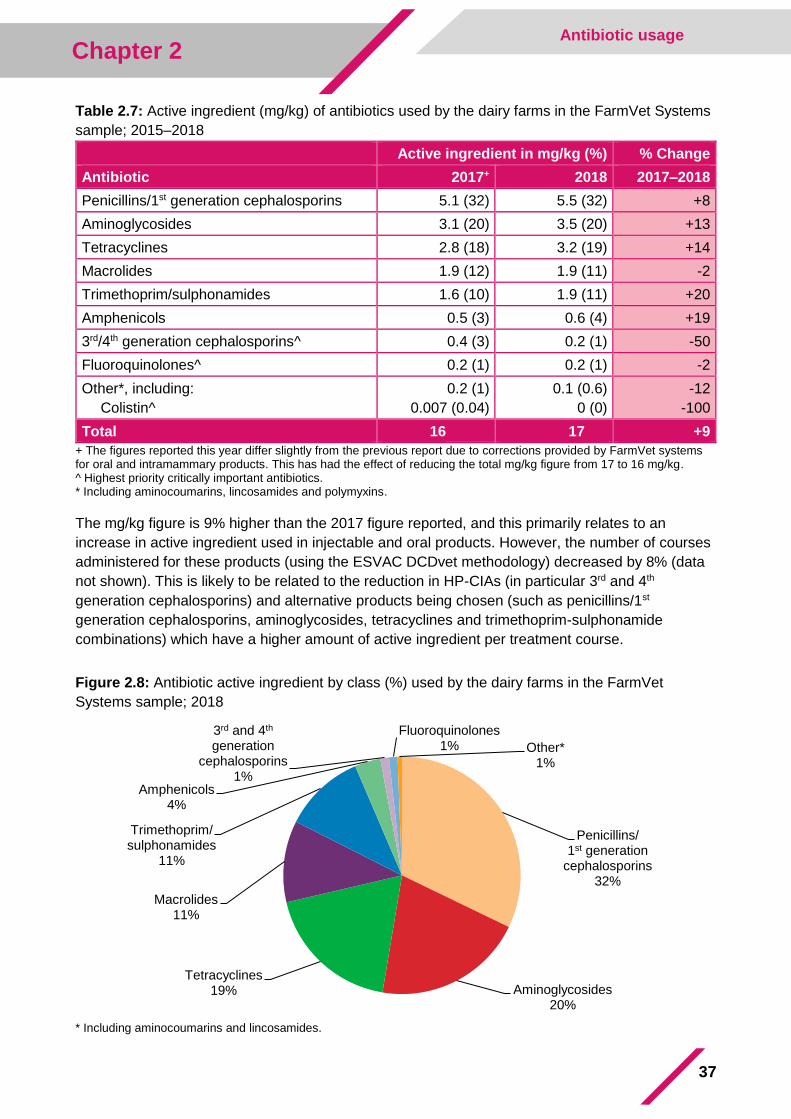
were the most commonly used antibiotic classes (Table 2.7 and Figure 2.8). The highest volume
of active ingredient was administered by injection (66%) or orally (19%).
37
Chapter 2 Antibiotic usage
Table 2.7: Active ingredient (mg/kg) of antibiotics used by the dairy farms in the FarmVet Systems
sample; 2015–2018
Active ingredient in mg/kg (%) % Change
Antibiotic 2017+ 2018 2017–2018
Penicillins/1st generation cephalosporins 5.1 (32) 5.5 (32) +8
Aminoglycosides 3.1 (20) 3.5 (20) +13
Tetracyclines 2.8 (18) 3.2 (19) +14
Macrolides 1.9 (12) 1.9 (11) -2
Trimethoprim/sulphonamides 1.6 (10) 1.9 (11) +20
Amphenicols 0.5 (3) 0.6 (4) +19
3rd/4th generation cephalosporins^ 0.4 (3) 0.2 (1) -50
Fluoroquinolones^ 0.2 (1) 0.2 (1) -2
Other*, including:
Colistin^
0.2 (1)
0.007 (0.04)
0.1 (0.6)
0 (0)
-12
-100
Total 16 17 +9
+ The figures reported this year differ slightly from the previous report due to corrections provided by FarmVet systems for oral and intramammary products. This has had the effect of reducing the total mg/kg figure from 17 to 16 mg/kg. ^ Highest priority critically important antibiotics. * Including aminocoumarins, lincosamides and polymyxins.
The mg/kg figure is 9% higher than the 2017 figure reported, and this primarily relates to an
increase in active ingredient used in injectable and oral products. However, the number of courses
administered for these products (using the ESVAC DCDvet methodology) decreased by 8% (data
not shown). This is likely to be related to the reduction in HP-CIAs (in particular 3rd and 4th
generation cephalosporins) and alternative products being chosen (such as penicillins/1st
generation cephalosporins, aminoglycosides, tetracyclines and trimethoprim-sulphonamide
combinations) which have a higher amount of active ingredient per treatment course.
Figure 2.8: Antibiotic active ingredient by class (%) used by the dairy farms in the FarmVet
Systems sample; 2018
* Including aminocoumarins and lincosamides.
Penicillins/ 1st generation
cephalosporins32%
Aminoglycosides20%
Tetracyclines19%
Macrolides11%
Trimethoprim/ sulphonamides
11%
Amphenicols4%
3rd and 4th
generation cephalosporins
1%
Fluoroquinolones1% Other*
1%
38
Chapter 2 Antibiotic usage
2.3.5.2 Beef usage
The beef data for 2018 cover 3,458 farms in Great Britain and represent 7.5% of the slaughter
animals for GB and 5.5% for the UK. It is therefore a much smaller sample than for dairy,
increasing the likelihood that the results are not representative of the beef population in the UK. In
addition, farms in England are over-represented, largely because far fewer farms were excluded
from the sample due to the presence of sheep (Table 2.8).
Table 2.8: Comparison of national coverage of the beef Population Correction Unit (PCU) included
in the FarmVet Systems sample; 2018* and % farms excluded due to the presence of sheep
% Coverage % Farms excluded due to presence of sheep
England 9 40
Wales 5 65
Scotland 4 68
* Calculated by comparing PCU for the sample with PCU per country, using data from BCMS and making the same assumptions (i.e. with a beef farm defined as having <15 calves born to dairy dams).
The usage data showed that 1.1 tonnes of antibiotic active ingredient were used in this sample of
farms, which represents 21 mg/kg. HP-CIAs represented 1% of antibiotics administered, with no
colistin use reported.
Tetracyclines, penicillins/1st generation cephalosporins and aminoglycosides were the most
commonly used antibiotic classes (Table 2.9 and Figure 2.9). The highest volume of active
ingredient was administered by injection (71%) or orally (24%).
Table 2.9: Active ingredient (mg/kg) of antibiotics used by the beef farms in the FarmVet Systems
sample; 2018
Antibiotic mg/kg (%)
Tetracyclines 7.3 (35)
Penicillins plus 1st generation cephalosporins 5.0 (24)
Aminoglycosides 3.8 (18)
Macrolides 1.7 (8)
Amphenicols 1.5 (7)
Trimethoprim/sulphonamides 1.3 (6)
3rd and 4th generation cephalosporins^ 0.2 (0.7)
Fluoroquinolones^ 0.1 (0.5)
Other* 0.1 (0.4)
Colistin^ 0 (0)
Total 21
^ Highest priority critically important antibiotics. * Including aminocoumarins and lincosamides.
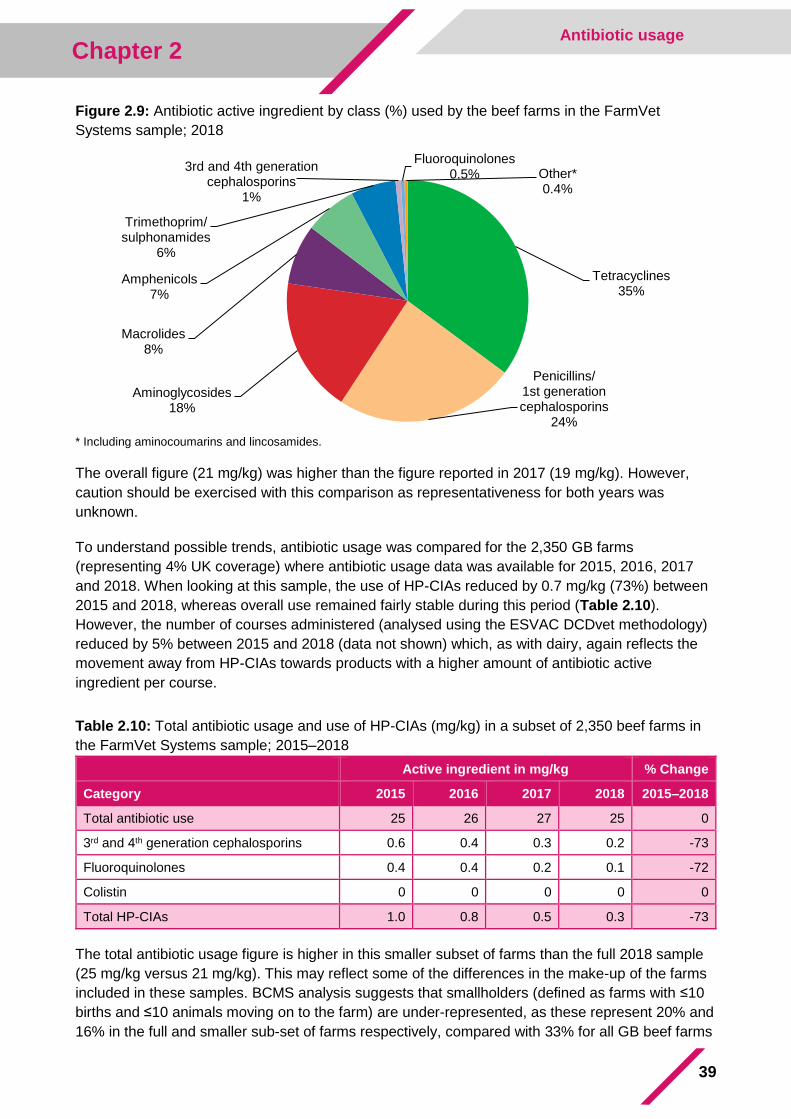
39
Chapter 2 Antibiotic usage
Figure 2.9: Antibiotic active ingredient by class (%) used by the beef farms in the FarmVet
Systems sample; 2018
* Including aminocoumarins and lincosamides.
The overall figure (21 mg/kg) was higher than the figure reported in 2017 (19 mg/kg). However,
caution should be exercised with this comparison as representativeness for both years was
unknown.
To understand possible trends, antibiotic usage was compared for the 2,350 GB farms
(representing 4% UK coverage) where antibiotic usage data was available for 2015, 2016, 2017
and 2018. When looking at this sample, the use of HP-CIAs reduced by 0.7 mg/kg (73%) between
2015 and 2018, whereas overall use remained fairly stable during this period (Table 2.10).
However, the number of courses administered (analysed using the ESVAC DCDvet methodology)
reduced by 5% between 2015 and 2018 (data not shown) which, as with dairy, again reflects the
movement away from HP-CIAs towards products with a higher amount of antibiotic active
ingredient per course.
Table 2.10: Total antibiotic usage and use of HP-CIAs (mg/kg) in a subset of 2,350 beef farms in
the FarmVet Systems sample; 2015–2018
Active ingredient in mg/kg % Change
Category 2015 2016 2017 2018 2015–2018
Total antibiotic use 25 26 27 25 0
3rd and 4th generation cephalosporins 0.6 0.4 0.3 0.2 -73
Fluoroquinolones 0.4 0.4 0.2 0.1 -72
Colistin 0 0 0 0 0
Total HP-CIAs 1.0 0.8 0.5 0.3 -73
The total antibiotic usage figure is higher in this smaller subset of farms than the full 2018 sample
(25 mg/kg versus 21 mg/kg). This may reflect some of the differences in the make-up of the farms
included in these samples. BCMS analysis suggests that smallholders (defined as farms with ≤10
births and ≤10 animals moving on to the farm) are under-represented, as these represent 20% and
16% in the full and smaller sub-set of farms respectively, compared with 33% for all GB beef farms
Tetracyclines35%
Penicillins/1st generation cephalosporins
24%
Aminoglycosides18%
Macrolides8%
Amphenicols7%
Trimethoprim/sulphonamides
6%
3rd and 4th generation cephalosporins
1%
Fluoroquinolones0.5% Other*
0.4%
40
Chapter 2 Antibiotic usage
(calculated by making the same assumptions, i.e. with a beef farm defined as having <15 calves
born to dairy dams, but without excluding farms which contain sheep).
2.3.5.3 Cattle sales targets
In the sector-specific targets document (Responsible Use of Medicines in Agriculture Alliance,
2017), the dairy and beef sectors made a commitment to reduce the use of injectable HP-CIAs by
50% by 2020 (using 2016 as the baseline). This can be measured by analysing the sales of such
products that include cattle in their license. Although some of these products include other species
in their license indication, industry feedback suggests that the majority (75%) are used in cattle.
Table 2.11 shows that this target is close to being met, with a 53% reduction in cattle injectable
HP-CIAs since 2015.
Table 2.11: Sales (mg/kg) of injectable HP-CIAs with a licenced indication for cattle and of
intramammary tubes (course doses, DCDvet), using methodology defined by ESVAC; 2015–2018
Category
2015 2016 2017 2018
(target)
2020
% Change
2015–2018
Injectable HP-CIA products licenced for cattle (mg/kg) 1.075 0.922+ 0.704 0.502 0.461 -46%
Intramammary HP-CIA products (DCDvet) 0.332+ 0.236 0.174 0.120 0.166 -64%
Intramammary tubes – lactating cow (DCDvet) 0.808+ 0.818 0.694 0.776 0.727 -4%
Intramammary tubes – dry cow (DCDvet) 0.732+ 0.605 0.547 0.644 0.586 -12%
+ Baseline year for targets.
For the dairy sector, there are also targets to reduce intramammary HP-CIAs by 50% by 2020 and
reduce dry cow intramammary use and lactating cow intramammary use by 20% and 10%, from a
2015 baseline. The sector has exceeded the target on intramammary HP-CIA use, with a 64%
reduction since 2015. However, the total use of lactating cow and dry cow intramammary products
need to reduce by a further 6% and 9% respectively over the next two years for these particular
targets to be reached.
The reductions in HP-CIA use demonstrated by the sales data are slightly lower than those
indicated by the usage data, again highlighting how the sample of dairy and beef farms included in
the usage data may not be fully representative of the whole UK situation.
2.3.5.4 Statement from Cattle Health and Welfare Group (CHAWG)
“The downward trend in the sales of injectable and intramammary HP-CIAs is very encouraging.
The sample usage beef and dairy data suggests that this has been achieved alongside a reduction
in the number of antibiotic courses administered. This is testament to the work of the sectors in
promoting responsible antibiotic use and has also been greatly helped by the strengthened Red
Tractor requirement, which was introduced in June 2018 and requires that HP-CIAs are only used
as a last resort, alongside antibiotic sensitivity and/or diagnostic testing.
During 2018, the CHAWG Antimicrobial Usage sub-group (CHAWG AMU) consulted and agreed
on core farm benchmarking metric(s) for the dairy sector and are carrying out the same process for
the beef sector. Further details can be found here - http://beefandlamb.ahdb.org.uk/returns/health-
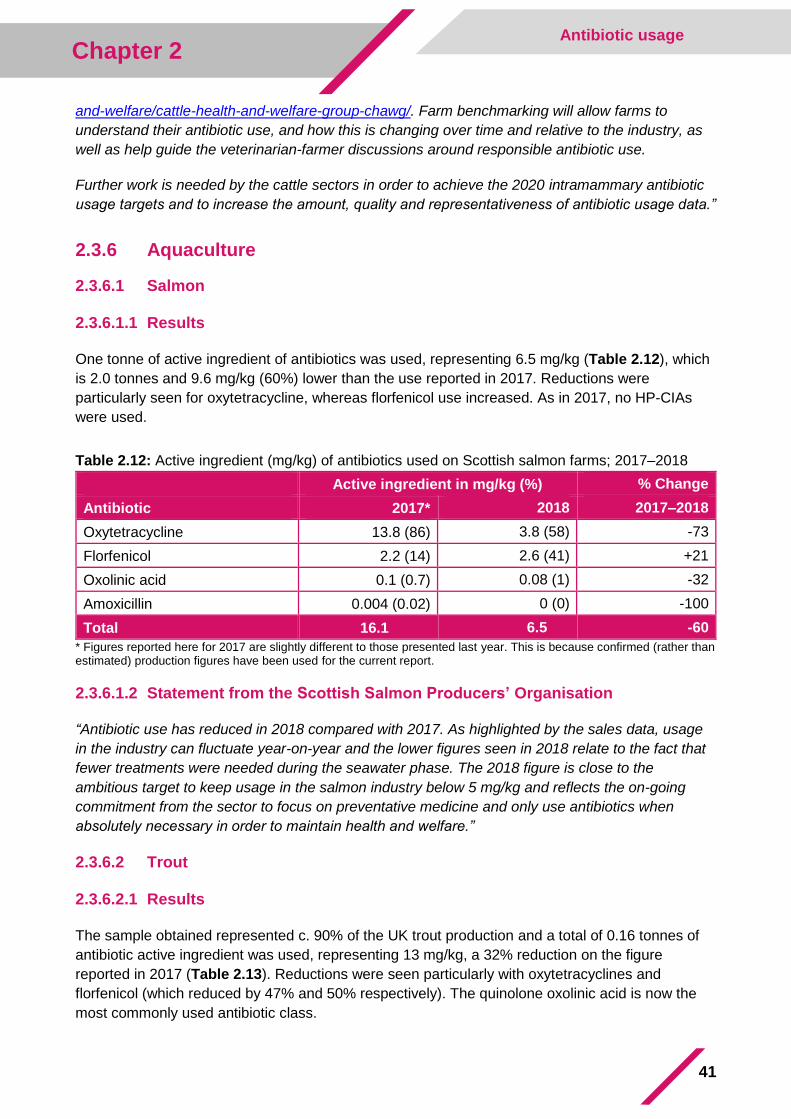
41
Chapter 2 Antibiotic usage
and-welfare/cattle-health-and-welfare-group-chawg/. Farm benchmarking will allow farms to
understand their antibiotic use, and how this is changing over time and relative to the industry, as
well as help guide the veterinarian-farmer discussions around responsible antibiotic use.
Further work is needed by the cattle sectors in order to achieve the 2020 intramammary antibiotic
usage targets and to increase the amount, quality and representativeness of antibiotic usage data.”
2.3.6 Aquaculture
2.3.6.1 Salmon
2.3.6.1.1 Results
One tonne of active ingredient of antibiotics was used, representing 6.5 mg/kg (Table 2.12), which
is 2.0 tonnes and 9.6 mg/kg (60%) lower than the use reported in 2017. Reductions were
particularly seen for oxytetracycline, whereas florfenicol use increased. As in 2017, no HP-CIAs
were used.
Table 2.12: Active ingredient (mg/kg) of antibiotics used on Scottish salmon farms; 2017–2018
Active ingredient in mg/kg (%) % Change
Antibiotic 2017* 2018 2017–2018
Oxytetracycline 13.8 (86) 3.8 (58) -73
Florfenicol 2.2 (14) 2.6 (41) +21
Oxolinic acid 0.1 (0.7) 0.08 (1) -32
Amoxicillin 0.004 (0.02) 0 (0) -100
Total 16.1 6.5 -60
* Figures reported here for 2017 are slightly different to those presented last year. This is because confirmed (rather than estimated) production figures have been used for the current report.
2.3.6.1.2 Statement from the Scottish Salmon Producers’ Organisation
“Antibiotic use has reduced in 2018 compared with 2017. As highlighted by the sales data, usage
in the industry can fluctuate year-on-year and the lower figures seen in 2018 relate to the fact that
fewer treatments were needed during the seawater phase. The 2018 figure is close to the
ambitious target to keep usage in the salmon industry below 5 mg/kg and reflects the on-going
commitment from the sector to focus on preventative medicine and only use antibiotics when
absolutely necessary in order to maintain health and welfare.”
2.3.6.2 Trout
2.3.6.2.1 Results
The sample obtained represented c. 90% of the UK trout production and a total of 0.16 tonnes of
antibiotic active ingredient was used, representing 13 mg/kg, a 32% reduction on the figure
reported in 2017 (Table 2.13). Reductions were seen particularly with oxytetracyclines and
florfenicol (which reduced by 47% and 50% respectively). The quinolone oxolinic acid is now the
most commonly used antibiotic class.
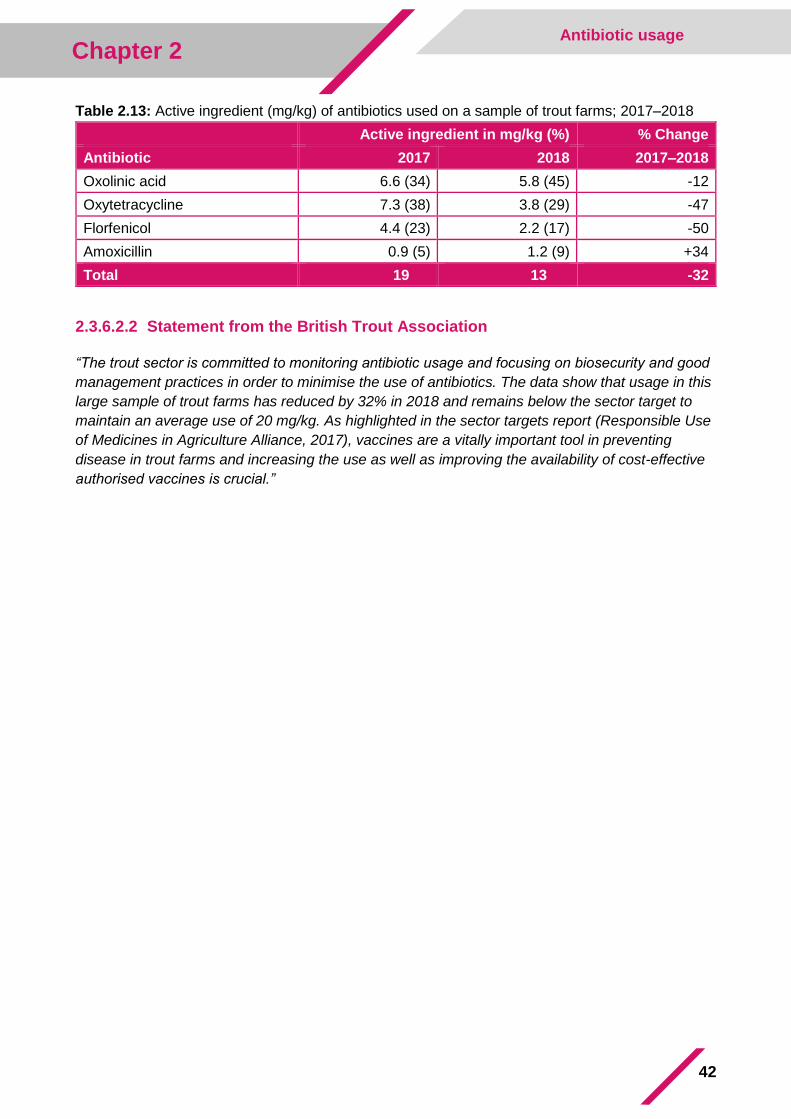
42
Chapter 2 Antibiotic usage
Table 2.13: Active ingredient (mg/kg) of antibiotics used on a sample of trout farms; 2017–2018
Active ingredient in mg/kg (%) % Change
Antibiotic 2017 2018 2017–2018
Oxolinic acid 6.6 (34) 5.8 (45) -12
Oxytetracycline 7.3 (38) 3.8 (29) -47
Florfenicol 4.4 (23) 2.2 (17) -50
Amoxicillin 0.9 (5) 1.2 (9) +34
Total 19 13 -32
2.3.6.2.2 Statement from the British Trout Association
“The trout sector is committed to monitoring antibiotic usage and focusing on biosecurity and good
management practices in order to minimise the use of antibiotics. The data show that usage in this
large sample of trout farms has reduced by 32% in 2018 and remains below the sector target to
maintain an average use of 20 mg/kg. As highlighted in the sector targets report (Responsible Use
of Medicines in Agriculture Alliance, 2017), vaccines are a vitally important tool in preventing
disease in trout farms and increasing the use as well as improving the availability of cost-effective
authorised vaccines is crucial.”
43
Chapter 2 Antibiotic usage
2.4 Methods Pigs
The antibiotic usage data in pigs were extracted from the electronic Medicines Book for Pigs (eMB),
developed by the pig sector with support from the VMD, and launched by the Agriculture and Horticulture
Development Board Pork (AHDB-Pork) in 2016.
The scope and limitations of the data (as provided by AHDB-Pork) are presented below:
▪ These data are national aggregated figures for antibiotic usage calculated from individual unit data
held in the eMB;
▪ eMB uptake to date has been voluntary (although since 2017 at the request of industry, data entry
into eMB has been required by the Red Tractor and Quality Meat Scotland assurance schemes), and
this sample may not be representative for the whole of the UK;
▪ In terms of UK pig production, the eMB data covers 56% for 2015, 62% for 2016, 87% for 2017 and
89% for 2018;
▪ The data are inputted by producers and, although clear outliers have been identified and queried,
AHDB is not able to validate every individual producer’s data. However, at a national aggregated
level, the data provide an estimation of national usage and allow year-on-year comparisons;
▪ The data for 2018 were extracted from eMB in May 2019;
▪ The eMB database and the calculations within it are subject to a series of quality assurance checks
to ensure national aggregated figures are as accurate as possible. As a result of this process, the
eMB system is continuing to develop to further improve data accuracy;
▪ The calculations used for the eMB data are in-line with the methods used by the ESVAC project, to
allow comparisons to be made with European counterparts.
Meat poultry The British Poultry Council (BPC) provided antibiotic usage data for the poultry meat (chicken, turkey and
duck) sectors. BPC runs BPC Antibiotic Stewardship, which covers 90% of UK poultry meat production. This
process of data collection started in 2012 and producers are responsible for submitting quarterly (chicken,
duck) or annual (turkey and all breeders) antibiotic usage data in the form of an aggregate spreadsheet. BPC
then collate the data and report usage by sector in their annual report. This includes the overall annual
amount of active ingredient used (in tonnes), which covers both breeders and producers.
For the producers, this is then compared with the population at risk of treatment to create a mg/kg usage
figure. BPC calculates the population at risk of treatment by using annual slaughter numbers and
standardised estimated weights at time of treatment (chickens: 1.0 kg as derived by ESVAC; turkeys: 6.5 kg
as derived by ESVAC; ducks: 1.75 kg as derived by BPC based on ESVAC principles).
BPC carries out the calculations using ESVAC methodology. The process of calculating the quantity of
antibiotic active ingredient has been validated by the VMD.
Laying hens
The collection of antibiotic usage data for the laying hen industry is organised by the British Egg Industry
Council (BEIC). Sharing these data with BEIC is mandatory through the Lion Scheme, which represents over
90% of the UK laying hen industry.
All egg producers, pullet rearers and breeding companies are required to report any use of an antibiotic to
their subscriber. This is then reported to the BEIC on a quarterly basis. The BEIC collated aggregate annual
antibiotic pack level data and provided it to the VMD, who carried out the calculations and validation of the
usage by active ingredient using ESVAC methodology. Denominator data are available from monthly records
of the total number of birds in the scheme, averaged over the year.
The data published here as ‘actual daily bird days/100 bird days at risk’ represent the average number of
days treatment administered per chicken over a 100 day period.
Note that a ‘mg/kg’ figure has not been included, as ESVAC methodology does not include a standardised
method for laying hens.
44
Chapter 2 Antibiotic usage
Gamebirds
The Game Farmers’ Association (GFA) coordinated a comprehensive, voluntary data collection exercise to
measure the use of antibiotics throughout the sector for 2018. This involved the collection of in-feed
medication records from game feed producers (which supply 95% of game farmers and rearers) and
prescribing records from specialist gamebird vets (of which 75% of game farmers and rearers are clients).
Each company was asked to provide a spreadsheet showing the amount of antibiotics used in 2018. GFA
aggregated the results and provided them to the VMD, who then used ESVAC methodology to calculate the
amount of antibiotic active ingredient administered by the game sector.
Note that a ‘mg/kg’ figure has not been included, as ESVAC methodology does not include a standardised
method for gamebirds.
Cattle industry
The data from dairy and beef farms presented in this report were taken from FarmVet Systems, a software
company which extracts and cleanses sales data from Practice Management Systems and which can
determine whether the medicine has been delivered to a farm keeping cattle.
In this analysis, farms were considered dairy if they had greater than or equal to 15 calves born to dairy
dams, using information derived from movement records (British Cattle Movement Service [BCMS] for
England, Wales and Scotland, and Animal Plant Health Inspection Service for Northern Ireland). For these
farms, the average number of dairy breed animals over two years of age was determined for each farm and
used to calculate the mg/kg using ESVAC methodology.
Farms which had fewer than 15 calves born to dairy dams were considered beef. In addition, farms were
removed if Radar GB Census Survey data indicated the presence of sheep or if data showed ‘sheep-only’
products had been used on the farm. This is because it is not possible to easily distinguish usage between
sheep and beef cattle from practice management data. Note that it was only possible to carry out this sheep
analysis for farms from Great Britain, so no farms in Northern Ireland were included in the beef dataset. For
all eligible beef farms, the number of slaughtered cows, steers, bulls, heifers and calves was collected using
BCMS movement records and used to calculate the mg/kg using ESVAC methodology. Note that living cattle
present on the farm are not including in the ESVAC beef denominator. This is different to the equivalent
metric for dairy herds, sheep flocks and pig herds, where breeding populations on farms are part of the
denominator.
Overall, the sample for 2018 represents 30% UK dairy cows and 7.5% beef production in Great Britain. For
both the beef and dairy farms, the VMD converted the aggregate usage data into amount of antibiotic active
ingredient using the standard ESVAC methodology. Products that did not include ‘cattle’ in the target species
in the SPC were excluded from the analysis. However, it is possible that some of the products excluded were
used in cattle via the Cascade system. It is also possible that products licenced for ‘multi-species’ – including
cattle – may have been used in other species kept on the farm.
Aquaculture
The trout data were collected from the main veterinary practices dealing with trout in England and Scotland,
and represent c. 90% of UK trout production. The salmon usage data were collected by the Scottish Salmon
Producers’ Organisation (SSPO) from all veterinary practices treating salmon in Scotland and therefore
represent 100% of Scottish salmon production. The aggregated data were analysed as mg/kg using ESVAC
methodology, where kg represents the weight of slaughtered fish as live weight.
It is important to note that around 30% of trout are reared for restocking waters for angling rather than
directly for food production. Antibiotic use on these restocking fish will be captured in the weight of active
ingredient, but not in the weight denominator, leading to a potential overestimate of the mg/kg. It should also
be noted that salmon have a three-year production cycle, so the tonnes of fish produced in any one year do
not fully represent the overall salmon population that may require treatment.
CHAPTER 3 EU Harmonised Monitoring of Antibiotic Resistance
The EU harmonised monitoring of antibiotic resistance is a programme set out in the
Commission Implementing Decision 2013/652/EU (European Commission, 2013), which
mandates all EU Member States to monitor and report antibiotic resistance in zoonotic and
commensal bacteria from healthy food-producing animals and food products at retail. An
overview of the sampling plan, by year, is summarised in Table S3.1.1 of the supplementary
material. The sampling size and strategy are designed to provide a sample which is
representative of the wider population for each combination of bacteria and animal species.
In 2018, EU Member States were mandated to carry out the following testing:
▪ Susceptibility testing of Escherichia coli obtained from caecal samples taken from
healthy broilers and fattening turkeys at slaughter;
▪ Testing for the presence of Extended-Spectrum Beta-Lactamase (ESBL)-, AmpC Beta-
Lactamase (AmpC)-, or carbapenemase-producing E. coli in caecal contents from
broilers and fattening turkeys at slaughter, as well as samples of fresh chicken meat at
retail;
▪ Susceptibility testing of Salmonella spp. isolates derived from boot swab/dust samples
from broiler, layer and turkey flocks collected on farm under the framework of the
National Control Programmes for Salmonella spp. in poultry;
▪ Susceptibility testing of Salmonella spp. isolates derived from broiler and fattening turkey
neck skin samples taken at slaughter by Food Business Operators;
▪ Susceptibility testing of Campylobacter jejuni obtained from caecal samples taken at
slaughter from broilers and fattening turkeys.
The results of the testing of isolates from caecal samples, neck skin samples and poultry flocks
are presented in this chapter. The Food Standards Agency (FSA) leads on the testing of chicken
meat samples and presents the results in their own reports
(https://www.food.gov.uk/research/foodborne-diseases/eu-harmonised-survey-of-antimicrobial-
resistance-amr-on-retail-meats-pork-and-beefchicken-0).
46
Chapter 3 EU Monitoring
3.1 Summary Escherichia coli
▪ There was no resistance to colistin or meropenem in E. coli from broilers or turkeys.
▪ Resistance to cefotaxime and ceftazidime was detected in 1.6% and 0.5%, respectively, of
E. coli from broilers, but not in isolates from turkeys.
▪ Resistance to ciprofloxacin was detected in 4.4% and 2.8% of isolates from broilers and
turkeys respectively, which is a decline in resistance in turkey isolates since 2014.
▪ A decline in resistance since 2014 was noted to most antibiotics in isolates from broilers
and turkeys, including to ampicillin, chloramphenicol, nalidixic acid, sulphonamides,
tetracyclines and trimethoprim.
▪ In total, 4.0% of broiler caecal samples yielded E. coli with an ESBL phenotype and 6.3%
E. coli with an AmpC phenotype. Of turkey caecal samples, 2.4% yielded E. coli with an
ESBL phenotype and 1.1% with an AmpC phenotype. For all aspects this is a reduction
since 2016.
▪ Presumptive carbapenemase-producing E. coli were not detected.
▪ All EU harmonised AMR outcome indicators show a four-year trend of decreasing
resistance and increasing susceptibility.
Salmonella spp.
▪ A total of 83.6% of Salmonella isolates from broiler flocks were susceptible to all the
antibiotics tested. This was 80.8% for layer flock isolates and 20.0% for turkey flock
isolates.
▪ There was no resistance to cefotaxime or ceftazidime in isolates from broiler, layer and
turkey flocks.
▪ Low resistance was detected to ciprofloxacin in Salmonella from broiler (6.4%), layer
(3.8%) and turkey (5.3%) flocks.
▪ Two of three S. Enteritidis isolates from broiler flocks showed resistance to colistin –
S. Enteritidis is a group D Salmonella, which may show a degree of intrinsic resistance to
colistin. No other isolates from broiler, layer and turkey flocks were resistant to colistin.
▪ There was no resistance to meropenem in Salmonella isolates from broiler, layer or turkey
flocks. Resistance to gentamicin was detected in isolates from layer (1.9%) and turkey
(1.2%) flocks, but not in isolates from broiler flocks.
▪ Overall, resistance in Salmonella spp. isolated from poultry flocks under the National
Control Programmes fluctuated between 2014–2018.
▪ No resistance was detected in FBO broiler isolates to cefotaxime, ceftazidime,
ciprofloxacin, colistin, gentamicin or meropenem.
▪ Two of three FBO turkey isolates were resistant to sulphonamides and tetracyclines and
the third one was susceptible to all the antibiotics tested.
Campylobacter jejuni
▪ Resistance to ciprofloxacin was detected in 48.0% of isolates from broilers and in 31.0%
from turkeys.
▪ Resistance to erythromycin was detected in 0.6% of C. jejuni from broilers and in 0.6% of
isolates from turkeys.
▪ Resistance to the six antibiotics tested in C. jejuni from broilers has slightly increased
compared to previous monitoring years, whereas resistance has either slightly decreased
or remained stable in turkey isolates.
47
Chapter 3 EU Monitoring
3.2 Methods
3.2.1 Sample collection
Caecal samples were taken from healthy broilers and turkeys at slaughter, in accordance with
Decision 2013/652/EU (European Commission, 2013), by Food Standards Agency (FSA)
personnel. The sampling plan was randomised, stratified and weighted by slaughter throughput.
Samples were collected from the biggest slaughterhouses, jointly covering 61% of the UK
throughput in 2018. Sample collection was randomised and evenly distributed throughout the year.
One caecal sample was collected per epidemiological unit (slaughter batch).
Boot/dust swabs were collected in accordance with EU Regulation (EC) No. 2160/2003 (European
Commission, 2003) and the National Control Programmes (NCPs) for layers, broilers and turkeys.
Swabs were taken from all flocks included in the NCPs and a randomised sample of the isolates
obtained from those swabs was further analysed (unless there were fewer than 170 isolates, in
which case all isolates were tested).
Under the requirements of Commission Regulation (EC) No. 2073/2005 (European Commission,
2005) on microbiological criteria for foodstuffs (process hygiene criteria only) Food Business
Operators (FBOs) collect neck skin samples which are submitted to private laboratories for
bacteriological culture. Any Salmonella isolate should then be submitted to the Animal and Plant
Health Agency (APHA) for serotyping and susceptibility testing.
3.2.2 Antibiotic susceptibility testing (AST)
AST was carried out by the national reference laboratories (NRLs). Bacterial isolates (E. coli and
Salmonella spp.) were cultured and a single colony selected for susceptibility testing. Standardised
broth microdilution was used to determine the minimum inhibition concentration (MIC) against a
panel of antibiotics in accordance with Decision 2013/652/EU and the EFSA manual (European
Food Safety Authority et al., 2019b).
In addition, caecal samples were cultured for ESBL-/AmpC-/carbapenemase-producing E. coli
following the procedures outlined in Decision 2013/652/EU. This included a pre-enrichment step
followed by inoculation of samples onto MacConkey agar plates supplemented with 1 mg/L
cefotaxime for isolation of ESBL- or AmpC-producing E. coli and chromID OXA-48 and chromID
CARBA agars for isolation of carbapenemase-producing E. coli.
Whole genome sequencing (WGS) and in silico bioinformatic tools were used to detect the
antibiotic resistance determinants for the ESBL-/AmpC-phenotypes identified. The isolates were
sequenced using the Illumina NextSeq platform followed by quality control steps and mapping of
the raw reads to a database of antibiotic resistance genes, using the APHA SeqFinder pipeline
(Anjum et al., 2016, Duggett et al., 2017). The sequence of isolates negative for all known ESBL-,
AmpC- and carbapenemase-encoding genes were investigated for promoter mutations in ampC,
which is compatible with increased expression of the chromosomal ampC, using the APHA
SeqFinder pipeline.
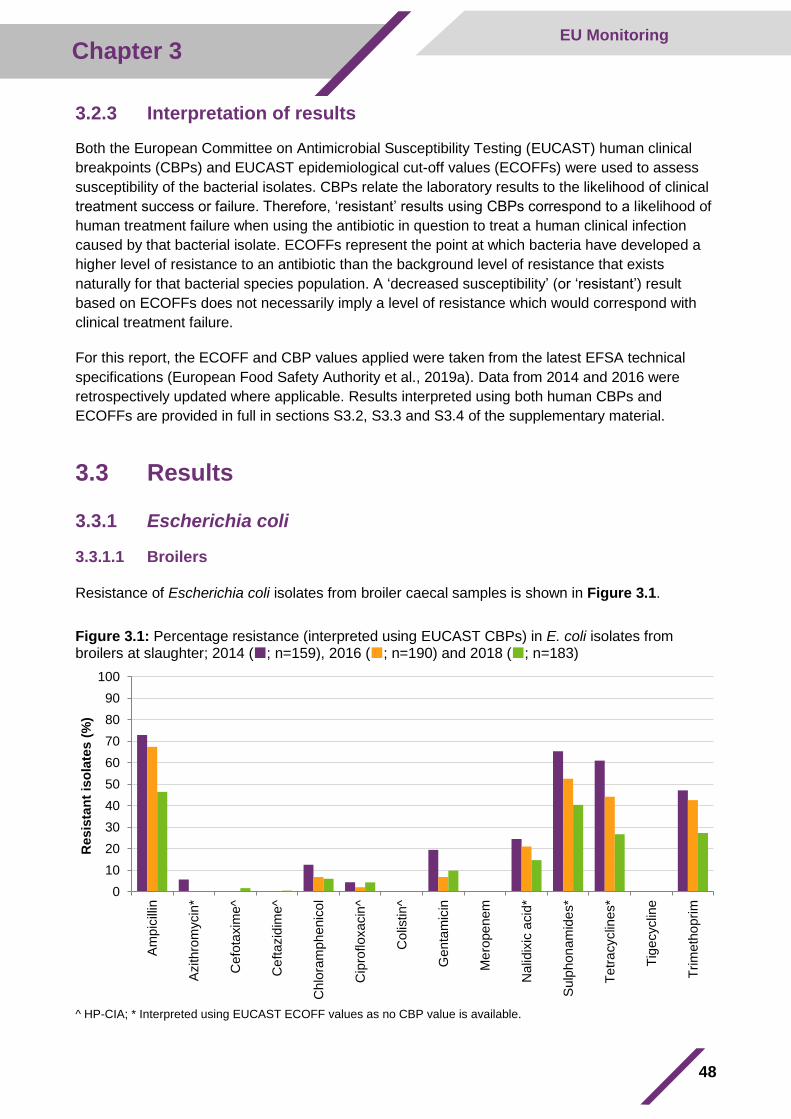
48
Chapter 3 EU Monitoring
3.2.3 Interpretation of results
Both the European Committee on Antimicrobial Susceptibility Testing (EUCAST) human clinical
breakpoints (CBPs) and EUCAST epidemiological cut-off values (ECOFFs) were used to assess
susceptibility of the bacterial isolates. CBPs relate the laboratory results to the likelihood of clinical
treatment success or failure. Therefore, ‘resistant’ results using CBPs correspond to a likelihood of
human treatment failure when using the antibiotic in question to treat a human clinical infection
caused by that bacterial isolate. ECOFFs represent the point at which bacteria have developed a
higher level of resistance to an antibiotic than the background level of resistance that exists
naturally for that bacterial species population. A ‘decreased susceptibility’ (or ‘resistant’) result
based on ECOFFs does not necessarily imply a level of resistance which would correspond with
clinical treatment failure.
For this report, the ECOFF and CBP values applied were taken from the latest EFSA technical
specifications (European Food Safety Authority et al., 2019a). Data from 2014 and 2016 were
retrospectively updated where applicable. Results interpreted using both human CBPs and
ECOFFs are provided in full in sections S3.2, S3.3 and S3.4 of the supplementary material.
3.3 Results
3.3.1 Escherichia coli
3.3.1.1 Broilers
Resistance of Escherichia coli isolates from broiler caecal samples is shown in Figure 3.1.
Figure 3.1: Percentage resistance (interpreted using EUCAST CBPs) in E. coli isolates from broilers at slaughter; 2014 (; n=159), 2016 (; n=190) and 2018 (; n=183)
^ HP-CIA; * Interpreted using EUCAST ECOFF values as no CBP value is available.
0
10
20
30
40
50
60
70
80
90
100
Am
pic
illin
Azithro
mycin
*
Ce
fota
xim
e^
Ce
ftazid
ime^
Ch
lora
mph
enic
ol
Cip
rofloxacin
^
Co
listin^
Gen
tam
icin
Me
rope
nem
Na
lidix
ic a
cid
*
Sulp
hon
am
ide
s*
Tetr
acyclin
es*
Tig
ecyclin
e
Trim
eth
oprim
Resis
tan
t is
ola
tes (
%)
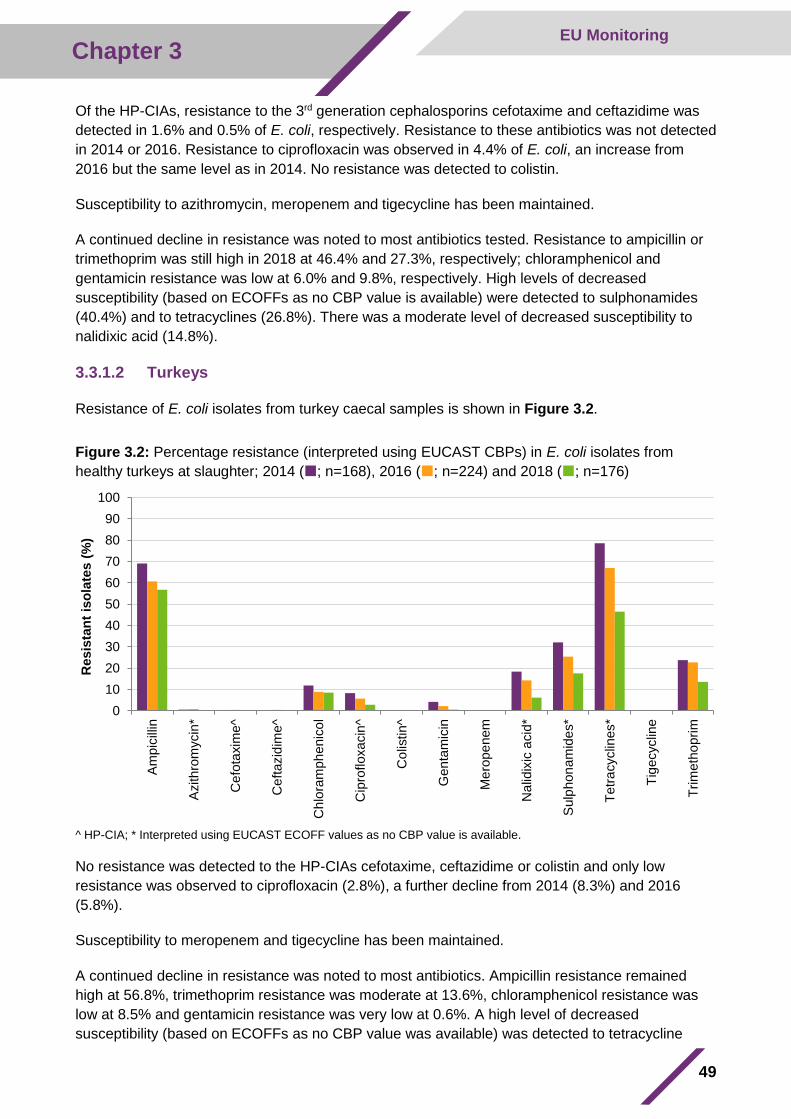
49
Chapter 3 EU Monitoring
Of the HP-CIAs, resistance to the 3rd generation cephalosporins cefotaxime and ceftazidime was
detected in 1.6% and 0.5% of E. coli, respectively. Resistance to these antibiotics was not detected
in 2014 or 2016. Resistance to ciprofloxacin was observed in 4.4% of E. coli, an increase from
2016 but the same level as in 2014. No resistance was detected to colistin.
Susceptibility to azithromycin, meropenem and tigecycline has been maintained.
A continued decline in resistance was noted to most antibiotics tested. Resistance to ampicillin or
trimethoprim was still high in 2018 at 46.4% and 27.3%, respectively; chloramphenicol and
gentamicin resistance was low at 6.0% and 9.8%, respectively. High levels of decreased
susceptibility (based on ECOFFs as no CBP value is available) were detected to sulphonamides
(40.4%) and to tetracyclines (26.8%). There was a moderate level of decreased susceptibility to
nalidixic acid (14.8%).
3.3.1.2 Turkeys
Resistance of E. coli isolates from turkey caecal samples is shown in Figure 3.2.
Figure 3.2: Percentage resistance (interpreted using EUCAST CBPs) in E. coli isolates from
healthy turkeys at slaughter; 2014 (; n=168), 2016 (; n=224) and 2018 (; n=176)
^ HP-CIA; * Interpreted using EUCAST ECOFF values as no CBP value is available.
No resistance was detected to the HP-CIAs cefotaxime, ceftazidime or colistin and only low
resistance was observed to ciprofloxacin (2.8%), a further decline from 2014 (8.3%) and 2016
(5.8%).
Susceptibility to meropenem and tigecycline has been maintained.
A continued decline in resistance was noted to most antibiotics. Ampicillin resistance remained
high at 56.8%, trimethoprim resistance was moderate at 13.6%, chloramphenicol resistance was
low at 8.5% and gentamicin resistance was very low at 0.6%. A high level of decreased
susceptibility (based on ECOFFs as no CBP value was available) was detected to tetracycline
0
10
20
30
40
50
60
70
80
90
100
Am
pic
illin
Azithro
mycin
*
Ce
fota
xim
e^
Ce
ftazid
ime^
Ch
lora
mph
enic
ol
Cip
rofloxacin
^
Co
listin^
Gen
tam
icin
Me
rope
nem
Na
lidix
ic a
cid
*
Sulp
hon
am
ide
s*
Tetr
acyclin
es*
Tig
ecyclin
e
Trim
eth
oprim
Resis
tan
t is
ola
tes (
%)
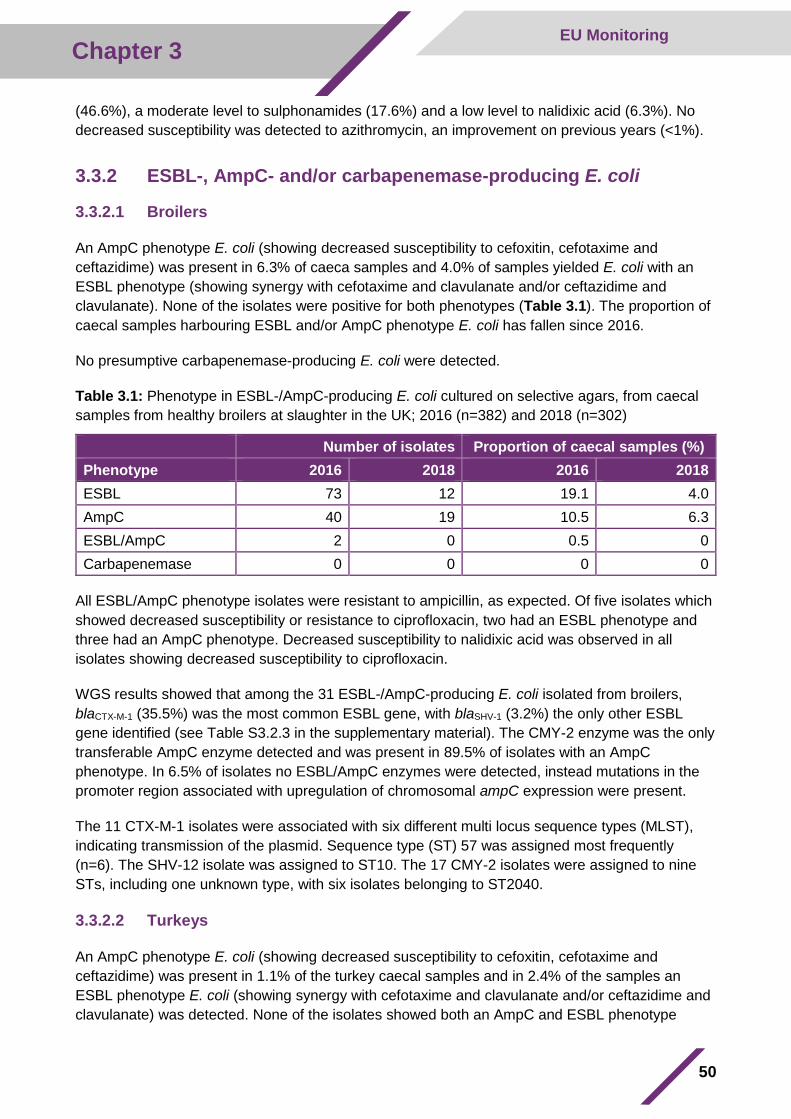
50
Chapter 3 EU Monitoring
(46.6%), a moderate level to sulphonamides (17.6%) and a low level to nalidixic acid (6.3%). No
decreased susceptibility was detected to azithromycin, an improvement on previous years (<1%).
3.3.2 ESBL-, AmpC- and/or carbapenemase-producing E. coli
3.3.2.1 Broilers
An AmpC phenotype E. coli (showing decreased susceptibility to cefoxitin, cefotaxime and
ceftazidime) was present in 6.3% of caeca samples and 4.0% of samples yielded E. coli with an
ESBL phenotype (showing synergy with cefotaxime and clavulanate and/or ceftazidime and
clavulanate). None of the isolates were positive for both phenotypes (Table 3.1). The proportion of
caecal samples harbouring ESBL and/or AmpC phenotype E. coli has fallen since 2016.
No presumptive carbapenemase-producing E. coli were detected.
Table 3.1: Phenotype in ESBL-/AmpC-producing E. coli cultured on selective agars, from caecal
samples from healthy broilers at slaughter in the UK; 2016 (n=382) and 2018 (n=302)
Number of isolates Proportion of caecal samples (%)
Phenotype 2016 2018 2016 2018
ESBL 73 12 19.1 4.0
AmpC 40 19 10.5 6.3
ESBL/AmpC 2 0 0.5 0
Carbapenemase 0 0 0 0
All ESBL/AmpC phenotype isolates were resistant to ampicillin, as expected. Of five isolates which
showed decreased susceptibility or resistance to ciprofloxacin, two had an ESBL phenotype and
three had an AmpC phenotype. Decreased susceptibility to nalidixic acid was observed in all
isolates showing decreased susceptibility to ciprofloxacin.
WGS results showed that among the 31 ESBL-/AmpC-producing E. coli isolated from broilers,
blaCTX-M-1 (35.5%) was the most common ESBL gene, with blaSHV-1 (3.2%) the only other ESBL
gene identified (see Table S3.2.3 in the supplementary material). The CMY-2 enzyme was the only
transferable AmpC enzyme detected and was present in 89.5% of isolates with an AmpC
phenotype. In 6.5% of isolates no ESBL/AmpC enzymes were detected, instead mutations in the
promoter region associated with upregulation of chromosomal ampC expression were present.
The 11 CTX-M-1 isolates were associated with six different multi locus sequence types (MLST),
indicating transmission of the plasmid. Sequence type (ST) 57 was assigned most frequently
(n=6). The SHV-12 isolate was assigned to ST10. The 17 CMY-2 isolates were assigned to nine
STs, including one unknown type, with six isolates belonging to ST2040.
3.3.2.2 Turkeys
An AmpC phenotype E. coli (showing decreased susceptibility to cefoxitin, cefotaxime and
ceftazidime) was present in 1.1% of the turkey caecal samples and in 2.4% of the samples an
ESBL phenotype E. coli (showing synergy with cefotaxime and clavulanate and/or ceftazidime and
clavulanate) was detected. None of the isolates showed both an AmpC and ESBL phenotype
51
Chapter 3 EU Monitoring
(Table 3.2). There was a reduction in the proportion of turkey caecal samples yielding AmpC or
ESBL E. coli since 2016.
One caecal sample yielded E. coli which were resistant to cefotaxime, did not show synergy with
clavulanate and had a cefoxitin MIC at the microbiological breakpoint.
No presumptive carbapenemase-producing E. coli were detected.
Table 3.2: Phenotype in ESBL-/AmpC-producing E. coli cultured on selective agars, from caecal
samples from healthy fattening turkeys at slaughter in the UK; 2016 (n=362) and 2018 (n=373)
Phenotype Number of isolates Proportion of isolates (%)
Proportion of caecal samples (%)
2016 2018 2016 2018 2016 2018
ESBL 12 9 70.6 69.2 3.3 2.4
AmpC 5 4 29.4 30.8 1.4 1.1
ESBL/AmpC 0 0 0 0 0 0
Carbapenemase 0 0 0 0 0 0
Of the 13 E. coli which had an AmpC or an ESBL phenotype, all were resistant to ampicillin, as
expected. Four isolates which showed decreased susceptibility or resistance to ciprofloxacin had
an ESBL phenotype; three of these showed decreased susceptibility to nalidixic acid.
WGS results showed that among 14 ESBL/AmpC producing E. coli from turkeys (one isolate had
an AmpC genotype but not phenotype), 64.3% harboured CTX-M enzymes, the only ESBL gene
type detected (see Table S3.2.5 of the supplementary material). blaCTX-M-1 was the most common
allele (35.7%), followed by blaCTX-M-14 (21.4%) and blaCTX-M-15 (7.1%). As a proportion of the total
caecal samples, 1.3% were positive for blaCTX-M-1 E. coli. No plasmid mediated transferrable AmpC
enzymes were recovered, instead mutations in the ampC promoter region causing overexpression
of the gene were present.
The five isolates harbouring an ampC mutation were assigned to two STs, with four isolates being
ST1730. An isolate harbouring the CTX-M-15 gene was assigned to a novel ST, as was one of the
three CTX-M-14 isolates; the other two isolates were assigned to ST93. The CTX-M-1 isolates
were assigned to four unique STs, with ST10 isolates being recovered twice.
3.3.3 Salmonella spp.
3.3.3.1 Broilers
3.3.3.1.1 Isolates from National Control Programme for Salmonella
Of the Salmonella isolates from broiler flocks 83.6% were susceptible (based on ECOFFs) to the
full panel of antibiotics tested, an improvement from 2016 (67.6%).
No resistance was detected to the HP-CIAs cefotaxime or ceftazidime, but low resistance was
detected to colistin (1.2%) and ciprofloxacin (6.4%) (Figure 3.3). The two isolates showing
resistance to colistin were S. Enteritidis, a group D Salmonella, which may show a degree of
intrinsic resistance to colistin.
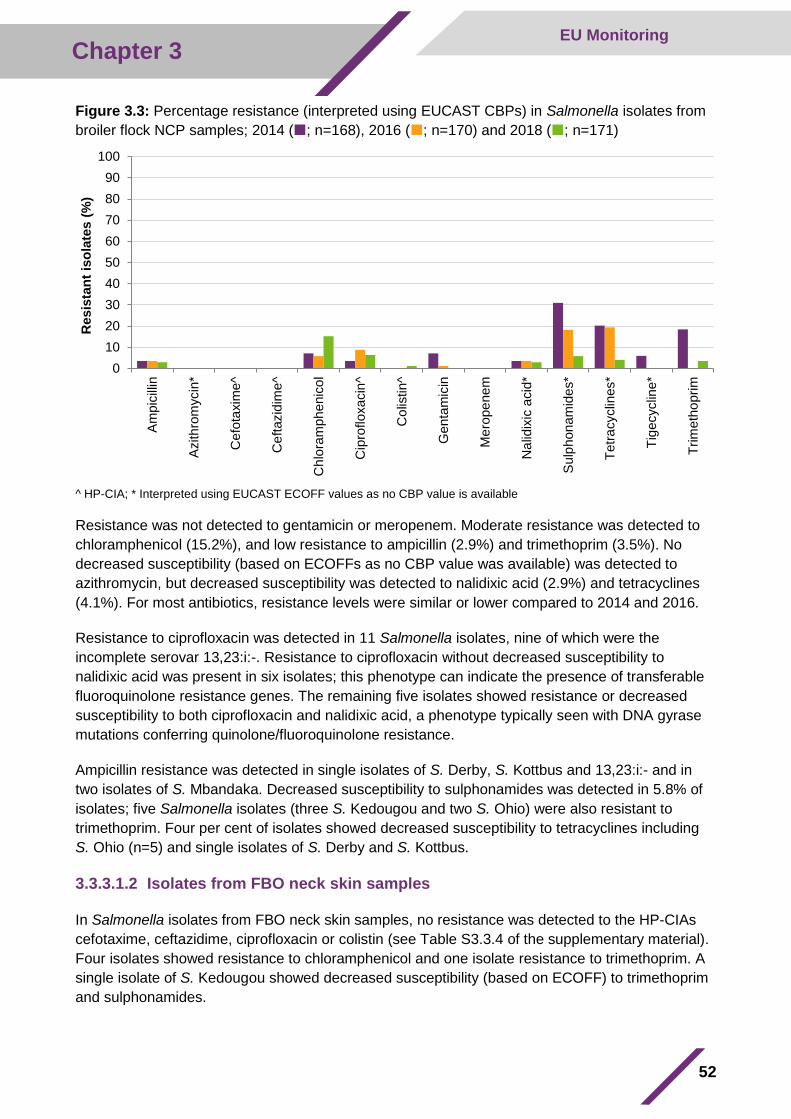
52
Chapter 3 EU Monitoring
Figure 3.3: Percentage resistance (interpreted using EUCAST CBPs) in Salmonella isolates from
broiler flock NCP samples; 2014 (; n=168), 2016 (; n=170) and 2018 (; n=171)
^ HP-CIA; * Interpreted using EUCAST ECOFF values as no CBP value is available
Resistance was not detected to gentamicin or meropenem. Moderate resistance was detected to
chloramphenicol (15.2%), and low resistance to ampicillin (2.9%) and trimethoprim (3.5%). No
decreased susceptibility (based on ECOFFs as no CBP value was available) was detected to
azithromycin, but decreased susceptibility was detected to nalidixic acid (2.9%) and tetracyclines
(4.1%). For most antibiotics, resistance levels were similar or lower compared to 2014 and 2016.
Resistance to ciprofloxacin was detected in 11 Salmonella isolates, nine of which were the
incomplete serovar 13,23:i:-. Resistance to ciprofloxacin without decreased susceptibility to
nalidixic acid was present in six isolates; this phenotype can indicate the presence of transferable
fluoroquinolone resistance genes. The remaining five isolates showed resistance or decreased
susceptibility to both ciprofloxacin and nalidixic acid, a phenotype typically seen with DNA gyrase
mutations conferring quinolone/fluoroquinolone resistance.
Ampicillin resistance was detected in single isolates of S. Derby, S. Kottbus and 13,23:i:- and in
two isolates of S. Mbandaka. Decreased susceptibility to sulphonamides was detected in 5.8% of
isolates; five Salmonella isolates (three S. Kedougou and two S. Ohio) were also resistant to
trimethoprim. Four per cent of isolates showed decreased susceptibility to tetracyclines including
S. Ohio (n=5) and single isolates of S. Derby and S. Kottbus.
3.3.3.1.2 Isolates from FBO neck skin samples
In Salmonella isolates from FBO neck skin samples, no resistance was detected to the HP-CIAs
cefotaxime, ceftazidime, ciprofloxacin or colistin (see Table S3.3.4 of the supplementary material).
Four isolates showed resistance to chloramphenicol and one isolate resistance to trimethoprim. A
single isolate of S. Kedougou showed decreased susceptibility (based on ECOFF) to trimethoprim
and sulphonamides.
0
10
20
30
40
50
60
70
80
90
100A
mpic
illin
Azithro
mycin
*
Ce
fota
xim
e^
Ce
ftazid
ime^
Ch
lora
mph
enic
ol
Cip
rofloxacin
^
Co
listin^
Gen
tam
icin
Me
rope
nem
Na
lidix
ic a
cid
*
Sulp
hon
am
ide
s*
Tetr
acyclin
es*
Tig
ecyclin
e*
Trim
eth
oprim
Resis
tan
t is
ola
tes (
%)
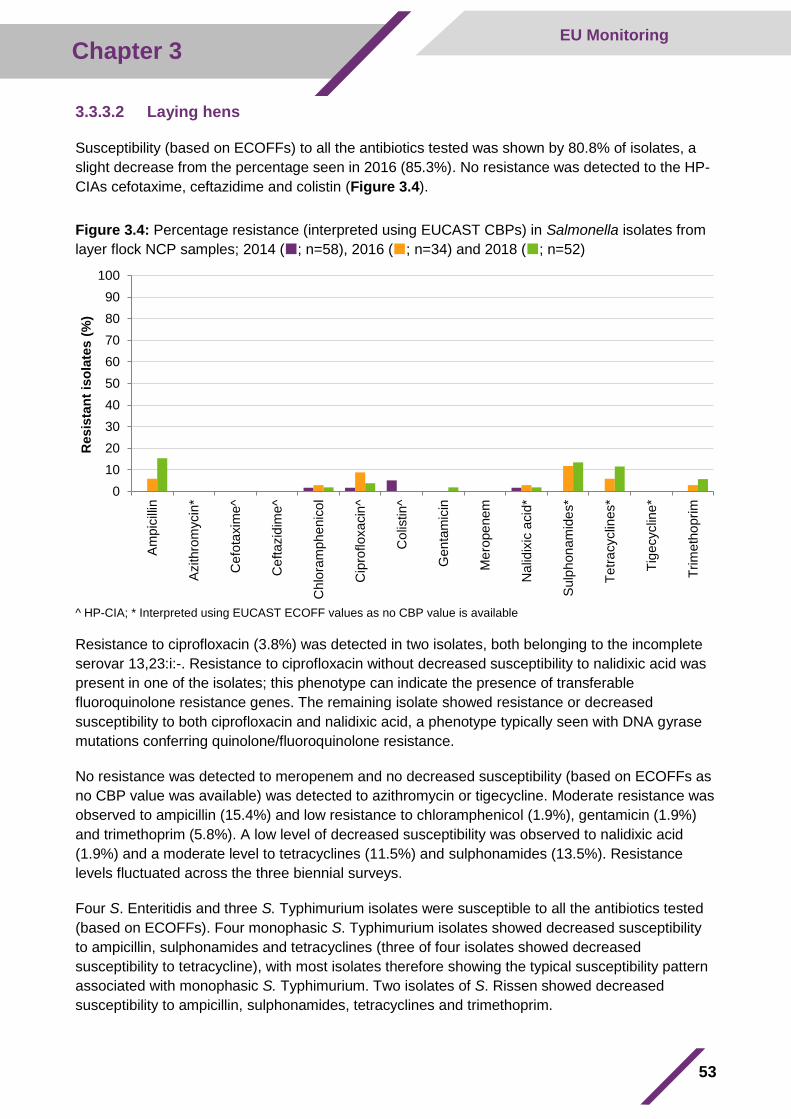
53
Chapter 3 EU Monitoring
3.3.3.2 Laying hens
Susceptibility (based on ECOFFs) to all the antibiotics tested was shown by 80.8% of isolates, a
slight decrease from the percentage seen in 2016 (85.3%). No resistance was detected to the HP-
CIAs cefotaxime, ceftazidime and colistin (Figure 3.4).
Figure 3.4: Percentage resistance (interpreted using EUCAST CBPs) in Salmonella isolates from
layer flock NCP samples; 2014 (; n=58), 2016 (; n=34) and 2018 (; n=52)
^ HP-CIA; * Interpreted using EUCAST ECOFF values as no CBP value is available
Resistance to ciprofloxacin (3.8%) was detected in two isolates, both belonging to the incomplete
serovar 13,23:i:-. Resistance to ciprofloxacin without decreased susceptibility to nalidixic acid was
present in one of the isolates; this phenotype can indicate the presence of transferable
fluoroquinolone resistance genes. The remaining isolate showed resistance or decreased
susceptibility to both ciprofloxacin and nalidixic acid, a phenotype typically seen with DNA gyrase
mutations conferring quinolone/fluoroquinolone resistance.
No resistance was detected to meropenem and no decreased susceptibility (based on ECOFFs as
no CBP value was available) was detected to azithromycin or tigecycline. Moderate resistance was
observed to ampicillin (15.4%) and low resistance to chloramphenicol (1.9%), gentamicin (1.9%)
and trimethoprim (5.8%). A low level of decreased susceptibility was observed to nalidixic acid
(1.9%) and a moderate level to tetracyclines (11.5%) and sulphonamides (13.5%). Resistance
levels fluctuated across the three biennial surveys.
Four S. Enteritidis and three S. Typhimurium isolates were susceptible to all the antibiotics tested
(based on ECOFFs). Four monophasic S. Typhimurium isolates showed decreased susceptibility
to ampicillin, sulphonamides and tetracyclines (three of four isolates showed decreased
susceptibility to tetracycline), with most isolates therefore showing the typical susceptibility pattern
associated with monophasic S. Typhimurium. Two isolates of S. Rissen showed decreased
susceptibility to ampicillin, sulphonamides, tetracyclines and trimethoprim.
0
10
20
30
40
50
60
70
80
90
100
Am
pic
illin
Azithro
mycin
*
Ce
fota
xim
e^
Ce
ftazid
ime^
Ch
lora
mph
enic
ol
Cip
rofloxacin
^
Co
listin^
Gen
tam
icin
Me
rope
nem
Na
lidix
ic a
cid
*
Sulp
hon
am
ide
s*
Tetr
acyclin
es*
Tig
ecyclin
e*
Trim
eth
oprim
Resis
tan
t is
ola
tes (
%)
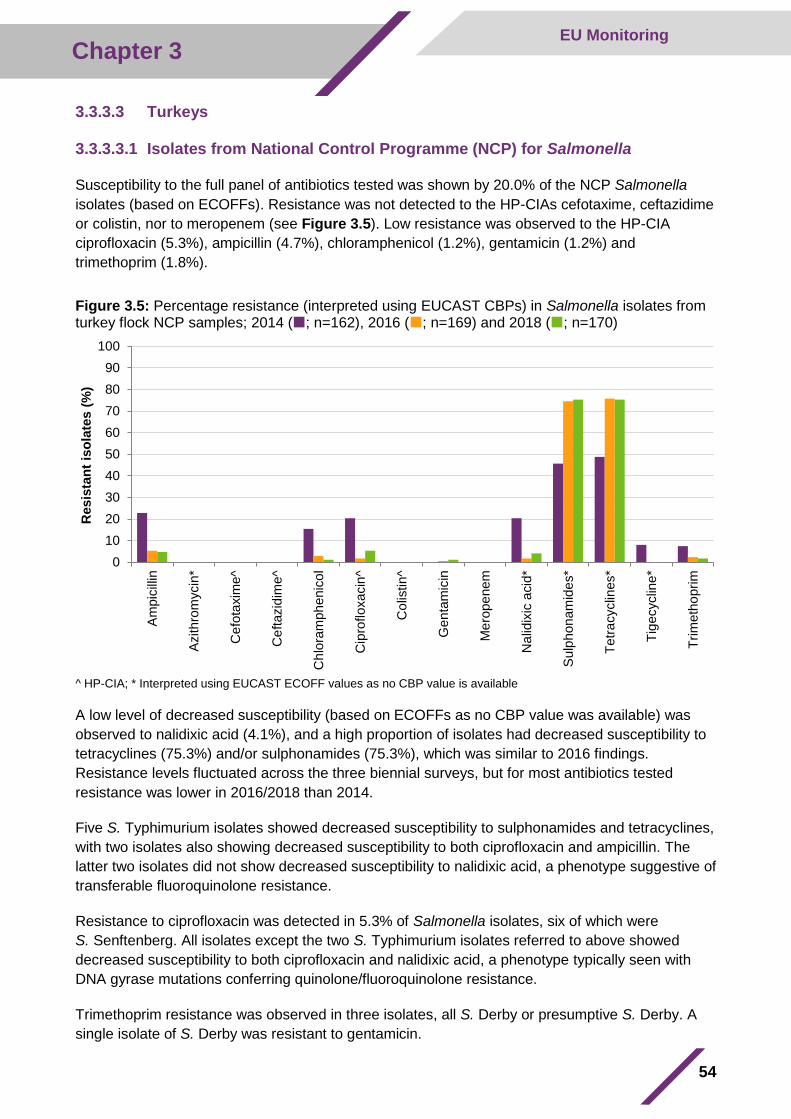
54
Chapter 3 EU Monitoring
3.3.3.3 Turkeys
3.3.3.3.1 Isolates from National Control Programme (NCP) for Salmonella
Susceptibility to the full panel of antibiotics tested was shown by 20.0% of the NCP Salmonella
isolates (based on ECOFFs). Resistance was not detected to the HP-CIAs cefotaxime, ceftazidime
or colistin, nor to meropenem (see Figure 3.5). Low resistance was observed to the HP-CIA
ciprofloxacin (5.3%), ampicillin (4.7%), chloramphenicol (1.2%), gentamicin (1.2%) and
trimethoprim (1.8%).
Figure 3.5: Percentage resistance (interpreted using EUCAST CBPs) in Salmonella isolates from turkey flock NCP samples; 2014 (; n=162), 2016 (; n=169) and 2018 (; n=170)
^ HP-CIA; * Interpreted using EUCAST ECOFF values as no CBP value is available
A low level of decreased susceptibility (based on ECOFFs as no CBP value was available) was
observed to nalidixic acid (4.1%), and a high proportion of isolates had decreased susceptibility to
tetracyclines (75.3%) and/or sulphonamides (75.3%), which was similar to 2016 findings.
Resistance levels fluctuated across the three biennial surveys, but for most antibiotics tested
resistance was lower in 2016/2018 than 2014.
Five S. Typhimurium isolates showed decreased susceptibility to sulphonamides and tetracyclines,
with two isolates also showing decreased susceptibility to both ciprofloxacin and ampicillin. The
latter two isolates did not show decreased susceptibility to nalidixic acid, a phenotype suggestive of
transferable fluoroquinolone resistance.
Resistance to ciprofloxacin was detected in 5.3% of Salmonella isolates, six of which were
S. Senftenberg. All isolates except the two S. Typhimurium isolates referred to above showed
decreased susceptibility to both ciprofloxacin and nalidixic acid, a phenotype typically seen with
DNA gyrase mutations conferring quinolone/fluoroquinolone resistance.
Trimethoprim resistance was observed in three isolates, all S. Derby or presumptive S. Derby. A
single isolate of S. Derby was resistant to gentamicin.
0
10
20
30
40
50
60
70
80
90
100
Am
pic
illin
Azithro
mycin
*
Ce
fota
xim
e^
Ce
ftazid
ime^
Ch
lora
mph
enic
ol
Cip
rofloxacin
^
Co
listin^
Gen
tam
icin
Me
rope
nem
Na
lidix
ic a
cid
*
Sulp
hon
am
ide
s*
Tetr
acyclin
es*
Tig
ecyclin
e*
Trim
eth
oprim
Resis
tan
t is
ola
tes (
%)
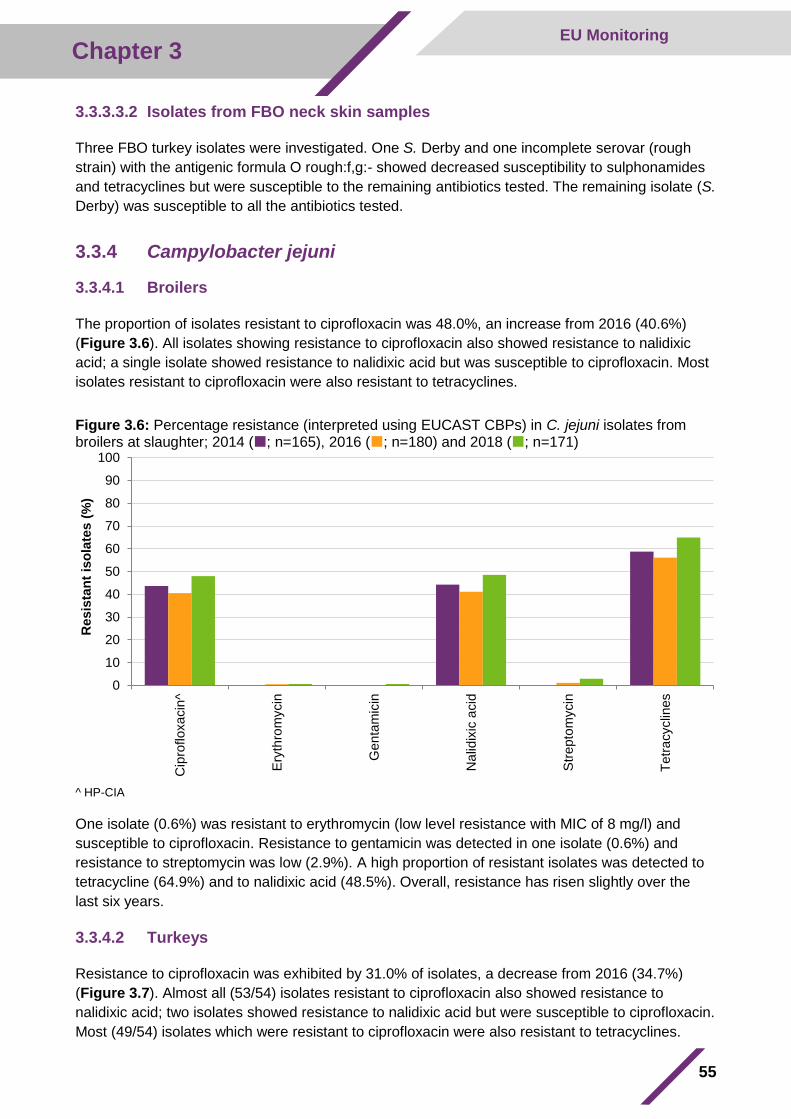
55
Chapter 3 EU Monitoring
3.3.3.3.2 Isolates from FBO neck skin samples
Three FBO turkey isolates were investigated. One S. Derby and one incomplete serovar (rough
strain) with the antigenic formula O rough:f,g:- showed decreased susceptibility to sulphonamides
and tetracyclines but were susceptible to the remaining antibiotics tested. The remaining isolate (S.
Derby) was susceptible to all the antibiotics tested.
3.3.4 Campylobacter jejuni
3.3.4.1 Broilers
The proportion of isolates resistant to ciprofloxacin was 48.0%, an increase from 2016 (40.6%)
(Figure 3.6). All isolates showing resistance to ciprofloxacin also showed resistance to nalidixic
acid; a single isolate showed resistance to nalidixic acid but was susceptible to ciprofloxacin. Most
isolates resistant to ciprofloxacin were also resistant to tetracyclines.
Figure 3.6: Percentage resistance (interpreted using EUCAST CBPs) in C. jejuni isolates from broilers at slaughter; 2014 (; n=165), 2016 (; n=180) and 2018 (; n=171)
^ HP-CIA
One isolate (0.6%) was resistant to erythromycin (low level resistance with MIC of 8 mg/l) and
susceptible to ciprofloxacin. Resistance to gentamicin was detected in one isolate (0.6%) and
resistance to streptomycin was low (2.9%). A high proportion of resistant isolates was detected to
tetracycline (64.9%) and to nalidixic acid (48.5%). Overall, resistance has risen slightly over the
last six years.
3.3.4.2 Turkeys
Resistance to ciprofloxacin was exhibited by 31.0% of isolates, a decrease from 2016 (34.7%)
(Figure 3.7). Almost all (53/54) isolates resistant to ciprofloxacin also showed resistance to
nalidixic acid; two isolates showed resistance to nalidixic acid but were susceptible to ciprofloxacin.
Most (49/54) isolates which were resistant to ciprofloxacin were also resistant to tetracyclines.
0
10
20
30
40
50
60
70
80
90
100
Cip
rofloxacin
^
Ery
thro
mycin
Gen
tam
icin
Na
lidix
ic a
cid
Str
epto
mycin
Tetr
acyclin
es
Resis
tan
t is
ola
tes (
%)
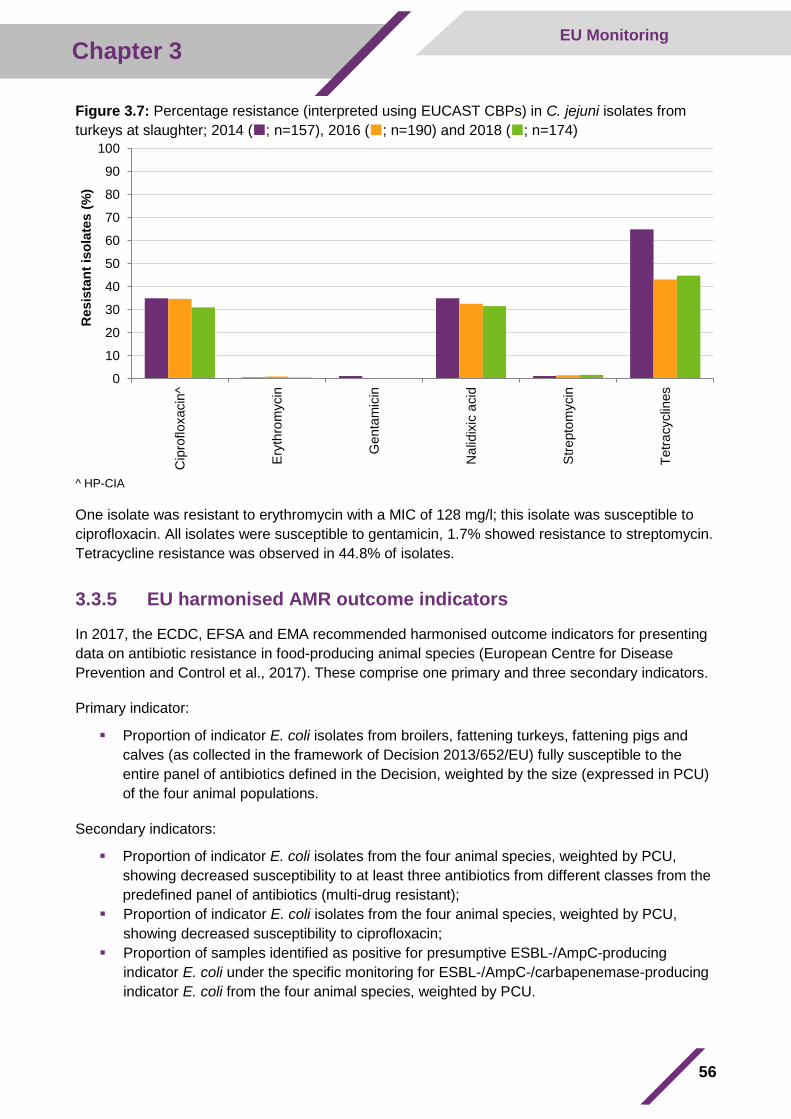
56
Chapter 3 EU Monitoring
Figure 3.7: Percentage resistance (interpreted using EUCAST CBPs) in C. jejuni isolates from
turkeys at slaughter; 2014 (; n=157), 2016 (; n=190) and 2018 (; n=174)
^ HP-CIA
One isolate was resistant to erythromycin with a MIC of 128 mg/l; this isolate was susceptible to
ciprofloxacin. All isolates were susceptible to gentamicin, 1.7% showed resistance to streptomycin.
Tetracycline resistance was observed in 44.8% of isolates.
3.3.5 EU harmonised AMR outcome indicators
In 2017, the ECDC, EFSA and EMA recommended harmonised outcome indicators for presenting
data on antibiotic resistance in food-producing animal species (European Centre for Disease
Prevention and Control et al., 2017). These comprise one primary and three secondary indicators.
Primary indicator:
▪ Proportion of indicator E. coli isolates from broilers, fattening turkeys, fattening pigs and
calves (as collected in the framework of Decision 2013/652/EU) fully susceptible to the
entire panel of antibiotics defined in the Decision, weighted by the size (expressed in PCU)
of the four animal populations.
Secondary indicators:
▪ Proportion of indicator E. coli isolates from the four animal species, weighted by PCU,
showing decreased susceptibility to at least three antibiotics from different classes from the
predefined panel of antibiotics (multi-drug resistant);
▪ Proportion of indicator E. coli isolates from the four animal species, weighted by PCU,
showing decreased susceptibility to ciprofloxacin;
▪ Proportion of samples identified as positive for presumptive ESBL-/AmpC-producing
indicator E. coli under the specific monitoring for ESBL-/AmpC-/carbapenemase-producing
indicator E. coli from the four animal species, weighted by PCU.
0
10
20
30
40
50
60
70
80
90
100
Cip
rofloxacin
^
Ery
thro
mycin
Gen
tam
icin
Na
lidix
ic a
cid
Str
epto
mycin
Tetr
acyclin
es
Resis
tan
t is
ola
tes (
%)
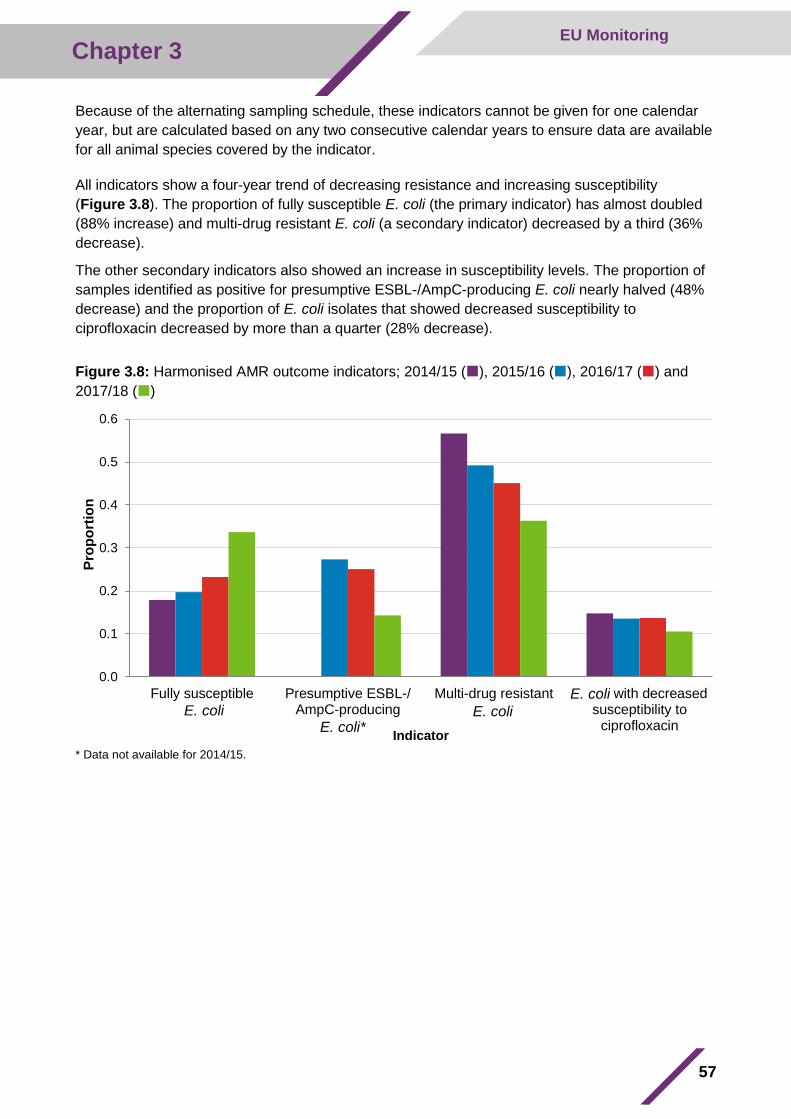
57
Chapter 3 EU Monitoring
Because of the alternating sampling schedule, these indicators cannot be given for one calendar
year, but are calculated based on any two consecutive calendar years to ensure data are available
for all animal species covered by the indicator.
All indicators show a four-year trend of decreasing resistance and increasing susceptibility
(Figure 3.8). The proportion of fully susceptible E. coli (the primary indicator) has almost doubled
(88% increase) and multi-drug resistant E. coli (a secondary indicator) decreased by a third (36%
decrease).
The other secondary indicators also showed an increase in susceptibility levels. The proportion of
samples identified as positive for presumptive ESBL-/AmpC-producing E. coli nearly halved (48%
decrease) and the proportion of E. coli isolates that showed decreased susceptibility to
ciprofloxacin decreased by more than a quarter (28% decrease).
Figure 3.8: Harmonised AMR outcome indicators; 2014/15 (), 2015/16 (), 2016/17 () and
2017/18 ()
* Data not available for 2014/15.
0.0
0.1
0.2
0.3
0.4
0.5
0.6
Fully susceptibleE. coli
Presumptive ESBL-/AmpC-producing
E. coli*
Multi-drug resistantE. coli
E. coli with decreasedsusceptibility to
ciprofloxacin
Pro
po
rtio
n
Indicator
E. coli E. coli
E. coli* E. coli
1 http://www.legislation.gov.uk/uksi/1989/285/made
CHAPTER 4 Clinical Surveillance of Antibiotic Resistance
Clinical surveillance is a programme of passive surveillance which evaluates antibiotic
resistance in bacteria of relevance to animal health, isolated from carcases or other
diagnostic samples submitted by private veterinary surgeons to APHA veterinary
laboratories in England and Wales. When a potential bacterial pathogen is identified,
antibiotic susceptibility testing is performed to provide the practitioner with relevant
information for treatment. Similar programmes are conducted by Scottish (SRUC
Veterinary Services) and Northern Irish (Agri-Food Biosciences Institute, AFBI-NI)
laboratories. This chapter for the majority reports the APHA methods and results.
The primary aim of the programme is to provide a diagnostic service for veterinarians.
However, it also helps to identify new and emerging patterns of resistance, particularly
since treatment failure is a frequent reason for submission of samples. The programme
also incorporates results from the susceptibility testing of Salmonella spp. isolates
recovered from animals and their environment, as part of the UK Zoonoses Order
19891. Any findings that are considered to pose a potential risk to human or animal
health are reported to the Defra Antibiotic Resistance Coordination (DARC) group and
to the Veterinary Medicines Directorate (VMD) for consideration and management in
accordance with the protocols outlined in the VMD AMR Contingency Plan:
https://www.gov.uk/government/uploads/system/uploads/attachment_data/file/576403/1
095349-v1_contingency_external.pdf.
59
Chapter 4 Clinical Surveillance
4.1 Summary
The resistance levels observed in many veterinary bacteria showed limited change over the
monitoring period covered by this report (2016–2018).
Many veterinary pathogens, especially respiratory pathogens, remain susceptible to authorised
veterinary antibiotics, including those compounds which have been authorised for many years. The
majority of isolates of the main respiratory pathogens in sheep, cattle and pigs (P. multocida, M.
haemolytica, B. trehalosi, H. somni, A. pleuropneumoniae) in 2018 were susceptible to
enrofloxacin and florfenicol. The proportion of swine dysentery isolates showing resistance to
tiamulin is low and although penicillin resistance was detected in a single S. suis from pigs,
penicillin resistance in bovine mastitis streptococci (S. dysgalactiae and S. uberis) was not
detected. A large increase in resistance to tetracyclines was however observed in M. haemolytica
from both cattle and sheep in 2017 and 2018, compared to 2016.
For 3rd generation cephalosporins and fluoroquinolones (HP-CIAs), cefotaxime resistance in
diagnostic E. coli isolates from neonatal calves and lambs in 2018 was 11% and 2% respectively,
whilst cefpodoxime resistance in E. coli in the same year was 3% in neonatal piglets and 4% in
chickens. Although some fluctuation has occurred, these figures have remained relatively
unchanged over the period 2016–2018. Enrofloxacin resistance in diagnostic E. coli isolates from
neonatal calves, lambs and piglets in 2018 was 4%, 1% and 8% respectively, representing
declines on preceding years, whilst enrofloxacin was 3% in chickens. Colistin resistance was
detected in one E. coli isolate (0.5%) from pigs in 2018; but not any other E. coli.
There was a marked decline in 2016 in resistance to several antibiotics in diagnostic E. coli
isolates from chickens, coinciding with a reduction in antibiotic use in broilers. Levels of resistance
observed in 2017 and 2018 were generally similar to those recorded in 2016, although an
exception to this general trend was resistance to doxycycline, which has increased.
Livestock-associated methicillin-resistant Staphylococcus aureus (LA-MRSA) ST398 was not
recovered from food-producing animals in Scotland or Wales but was isolated from a turkey
sample in England and from four pig samples in Northern Ireland in 2018.
The proportion of fully sensitive S. Typhimurium increased by 20% to 54.4%.
Resistance to 3rd generation cephalosporins and to fluoroquinolones (HP-CIAs) was very low in
Salmonella spp. Resistance to ciprofloxacin was 0.1%, one single isolate (an S. Mbandaka from a
broiler chicken) was resistant to ceftazidime and cefotaxime.
Highly ciprofloxacin resistant S. Kentucky and multi-drug resistant S. Infantis were detected in a
by-product of unknown origin and a dog, respectively. These resistant strains are epidemic in parts
of Europe but are only sporadically detected in England and Wales. They have previously been
associated with contaminated raw pet food for pets.
60
Chapter 4 Clinical Surveillance
4.2 Methods
4.2.1 Sample sources
Bacterial isolates were from samples of field cases of clinical disease undergoing investigation for
diagnostic purposes by practising veterinary surgeons.
For Salmonella spp., any laboratory isolating these from animals (for species specified in the UK
Zoonoses Order) and their environment in Great Britain is required to notify and submit an isolate
to a Defra-approved laboratory for characterisation including antibiotic sensitivity testing.
4.2.2 Susceptibility testing methodology
The method used was that formerly recommended by the British Society for Antimicrobial
Chemotherapy (BSAC). The susceptibility tests described in this chapter were performed (unless
otherwise stated) by disc diffusion on Isosensitest Agar (Oxoid) with appropriate media
supplementation where necessary for fastidious organisms. The disc antibiotic concentrations used
were as stated in Table S4.1.1 of the supplementary material, and a semi-confluent inoculum was
used. BSAC human breakpoints, where available, were used for the interpretation of the veterinary
antibiotic susceptibility results.
Isolates were classed as either sensitive or resistant; intermediate isolates (meaning not
susceptible to a standard dose but susceptible to an increased dose) were included under the
resistant category. The disc diffusion breakpoints used are given in Table S4.1.1 of the
supplementary material which also provides the MIC corresponding to that zone diameter
breakpoint where this is known or has been estimated from APHA data on file.
Published breakpoints are not available for all animal species and for all of the bacterial
organism/antibiotic combinations which may require testing. In these cases, a uniform cut-off point
of 13 mm zone size diameter has been used to discriminate between sensitive and resistant
isolates. This breakpoint is the historical APHA veterinary breakpoint and although it has been
used for a considerable number of years, published validation data are not available for several
organism-antibiotic combinations (Table S4.1.1 of the supplementary material). However, where
most isolates of a particular organism are highly resistant or fully susceptible to an antibiotic,
breakpoint issues may affect only a low number of isolates.
Breakpoints used to interpret the results from the antimicrobial susceptibility testing are reviewed
on a regular basis. Data presented in this report and the supplementary material are
retrospectively updated when required to reflect any changes to the interpretative criteria and
ensure consistency and comparability of the data.
For some bacterial pathogens, very few isolates are recovered in any one year and therefore the
prevalence of resistance and any trends need to be interpreted with caution. Due to issues with
sampling representativeness, results in this chapter cannot be extrapolated to the general
livestock population.
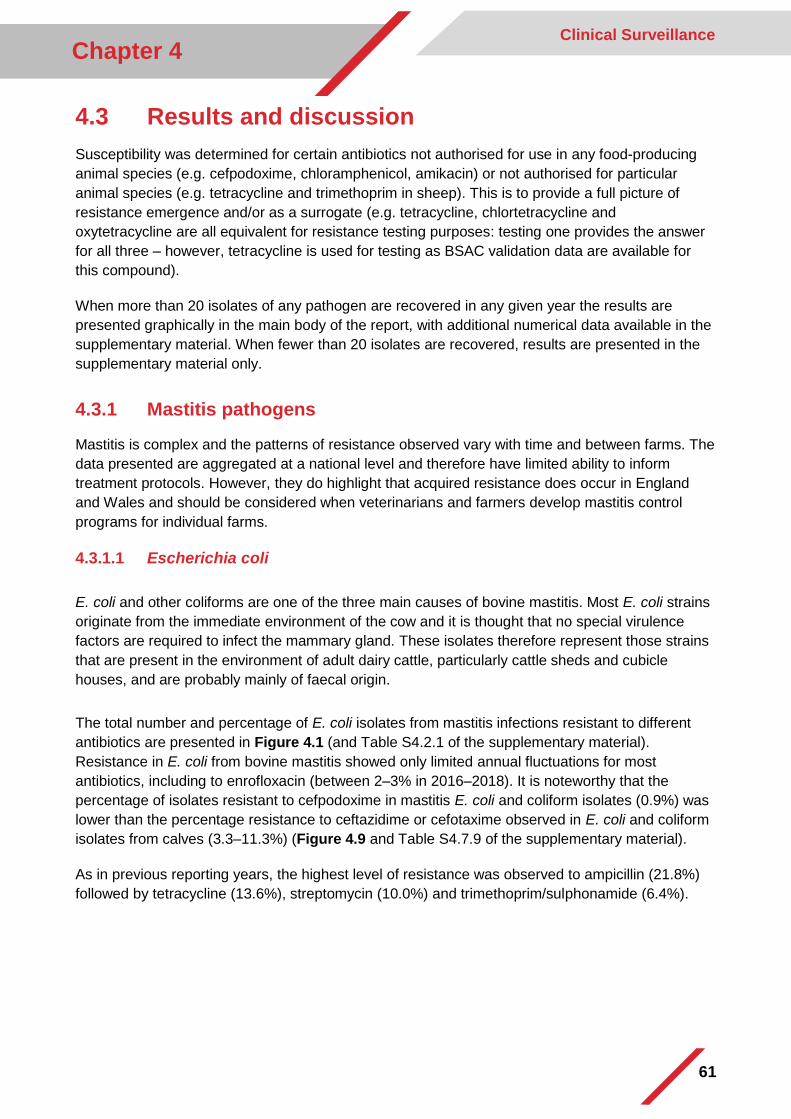
61
Chapter 4 Clinical Surveillance
4.3 Results and discussion
Susceptibility was determined for certain antibiotics not authorised for use in any food-producing
animal species (e.g. cefpodoxime, chloramphenicol, amikacin) or not authorised for particular
animal species (e.g. tetracycline and trimethoprim in sheep). This is to provide a full picture of
resistance emergence and/or as a surrogate (e.g. tetracycline, chlortetracycline and
oxytetracycline are all equivalent for resistance testing purposes: testing one provides the answer
for all three – however, tetracycline is used for testing as BSAC validation data are available for
this compound).
When more than 20 isolates of any pathogen are recovered in any given year the results are
presented graphically in the main body of the report, with additional numerical data available in the
supplementary material. When fewer than 20 isolates are recovered, results are presented in the
supplementary material only.
4.3.1 Mastitis pathogens
Mastitis is complex and the patterns of resistance observed vary with time and between farms. The
data presented are aggregated at a national level and therefore have limited ability to inform
treatment protocols. However, they do highlight that acquired resistance does occur in England
and Wales and should be considered when veterinarians and farmers develop mastitis control
programs for individual farms.
4.3.1.1 Escherichia coli
E. coli and other coliforms are one of the three main causes of bovine mastitis. Most E. coli strains
originate from the immediate environment of the cow and it is thought that no special virulence
factors are required to infect the mammary gland. These isolates therefore represent those strains
that are present in the environment of adult dairy cattle, particularly cattle sheds and cubicle
houses, and are probably mainly of faecal origin.
The total number and percentage of E. coli isolates from mastitis infections resistant to different
antibiotics are presented in Figure 4.1 (and Table S4.2.1 of the supplementary material).
Resistance in E. coli from bovine mastitis showed only limited annual fluctuations for most
antibiotics, including to enrofloxacin (between 2–3% in 2016–2018). It is noteworthy that the
percentage of isolates resistant to cefpodoxime in mastitis E. coli and coliform isolates (0.9%) was
lower than the percentage resistance to ceftazidime or cefotaxime observed in E. coli and coliform
isolates from calves (3.3–11.3%) (Figure 4.9 and Table S4.7.9 of the supplementary material).
As in previous reporting years, the highest level of resistance was observed to ampicillin (21.8%)
followed by tetracycline (13.6%), streptomycin (10.0%) and trimethoprim/sulphonamide (6.4%).
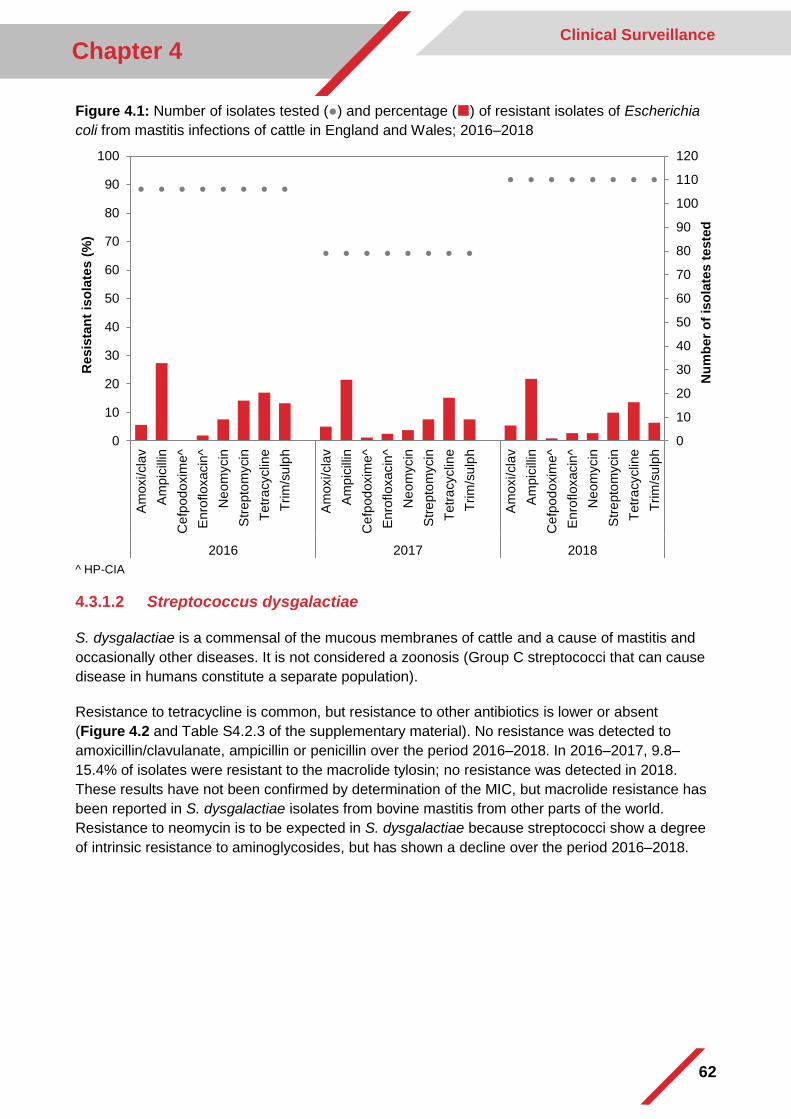
62
Chapter 4 Clinical Surveillance
Figure 4.1: Number of isolates tested (●) and percentage () of resistant isolates of Escherichia
coli from mastitis infections of cattle in England and Wales; 2016–2018
^ HP-CIA
4.3.1.2 Streptococcus dysgalactiae
S. dysgalactiae is a commensal of the mucous membranes of cattle and a cause of mastitis and
occasionally other diseases. It is not considered a zoonosis (Group C streptococci that can cause
disease in humans constitute a separate population).
Resistance to tetracycline is common, but resistance to other antibiotics is lower or absent
(Figure 4.2 and Table S4.2.3 of the supplementary material). No resistance was detected to
amoxicillin/clavulanate, ampicillin or penicillin over the period 2016–2018. In 2016–2017, 9.8–
15.4% of isolates were resistant to the macrolide tylosin; no resistance was detected in 2018.
These results have not been confirmed by determination of the MIC, but macrolide resistance has
been reported in S. dysgalactiae isolates from bovine mastitis from other parts of the world.
Resistance to neomycin is to be expected in S. dysgalactiae because streptococci show a degree
of intrinsic resistance to aminoglycosides, but has shown a decline over the period 2016–2018.
0
10
20
30
40
50
60
70
80
90
100
110
120
0
10
20
30
40
50
60
70
80
90
100
Am
oxi/cla
v
Am
pic
illin
Ce
fpod
oxim
e^
Enro
floxacin
^
Ne
om
ycin
Str
epto
mycin
Tetr
acyclin
e
Trim
/su
lph
Am
oxi/cla
v
Am
pic
illin
Ce
fpod
oxim
e^
Enro
floxacin
^
Ne
om
ycin
Str
epto
mycin
Tetr
acyclin
e
Trim
/su
lph
Am
oxi/cla
v
Am
pic
illin
Ce
fpod
oxim
e^
Enro
floxacin
^
Ne
om
ycin
Str
epto
mycin
Tetr
acyclin
e
Trim
/su
lph
2016 2017 2018
Nu
mb
er
of
iso
late
s t
este
d
Resis
tan
t is
ola
tes (
%)
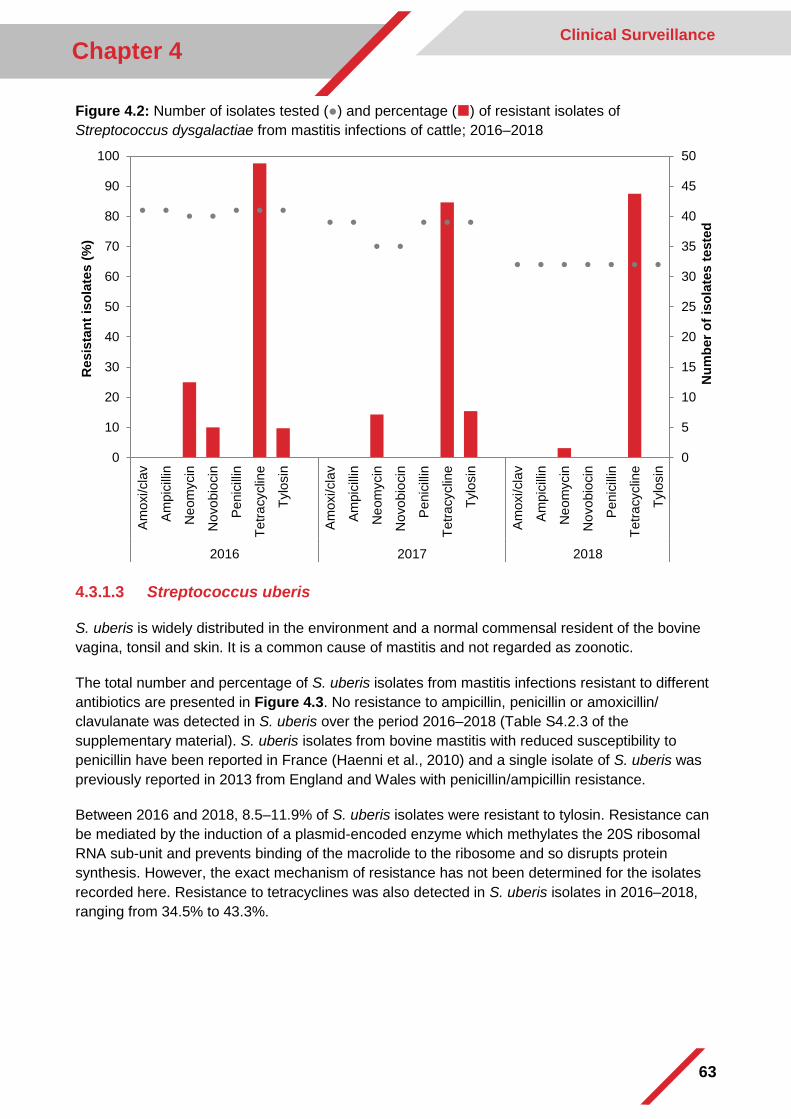
63
Chapter 4 Clinical Surveillance
Figure 4.2: Number of isolates tested (●) and percentage () of resistant isolates of
Streptococcus dysgalactiae from mastitis infections of cattle; 2016–2018
4.3.1.3 Streptococcus uberis
S. uberis is widely distributed in the environment and a normal commensal resident of the bovine
vagina, tonsil and skin. It is a common cause of mastitis and not regarded as zoonotic.
The total number and percentage of S. uberis isolates from mastitis infections resistant to different
antibiotics are presented in Figure 4.3. No resistance to ampicillin, penicillin or amoxicillin/
clavulanate was detected in S. uberis over the period 2016–2018 (Table S4.2.3 of the
supplementary material). S. uberis isolates from bovine mastitis with reduced susceptibility to
penicillin have been reported in France (Haenni et al., 2010) and a single isolate of S. uberis was
previously reported in 2013 from England and Wales with penicillin/ampicillin resistance.
Between 2016 and 2018, 8.5–11.9% of S. uberis isolates were resistant to tylosin. Resistance can
be mediated by the induction of a plasmid-encoded enzyme which methylates the 20S ribosomal
RNA sub-unit and prevents binding of the macrolide to the ribosome and so disrupts protein
synthesis. However, the exact mechanism of resistance has not been determined for the isolates
recorded here. Resistance to tetracyclines was also detected in S. uberis isolates in 2016–2018,
ranging from 34.5% to 43.3%.
0
5
10
15
20
25
30
35
40
45
50
0
10
20
30
40
50
60
70
80
90
100A
moxi/cla
v
Am
pic
illin
Ne
om
ycin
No
vo
bio
cin
Penic
illin
Tetr
acyclin
e
Tylo
sin
Am
oxi/cla
v
Am
pic
illin
Ne
om
ycin
No
vo
bio
cin
Penic
illin
Tetr
acyclin
e
Tylo
sin
Am
oxi/cla
v
Am
pic
illin
Ne
om
ycin
No
vo
bio
cin
Penic
illin
Tetr
acyclin
e
Tylo
sin
2016 2017 2018
Nu
mb
er
of
iso
late
s t
este
d
Resis
tan
t is
ola
tes (
%)
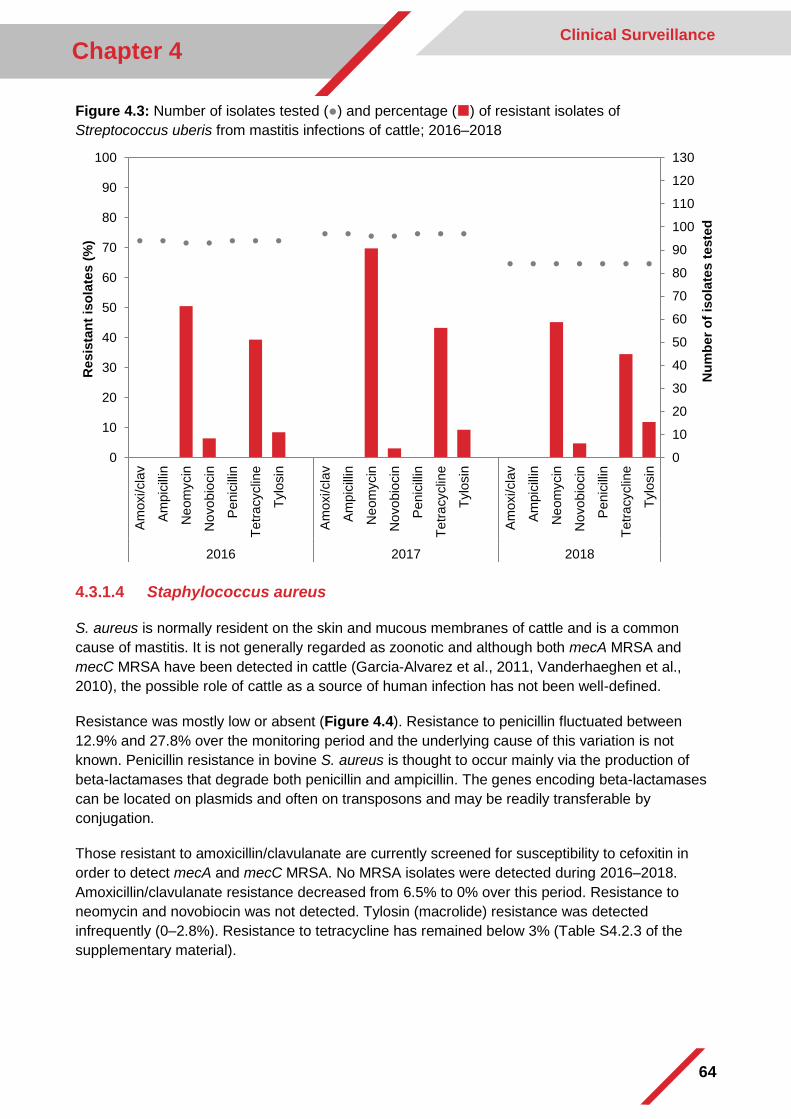
64
Chapter 4 Clinical Surveillance
Figure 4.3: Number of isolates tested (●) and percentage () of resistant isolates of
Streptococcus uberis from mastitis infections of cattle; 2016–2018
4.3.1.4 Staphylococcus aureus
S. aureus is normally resident on the skin and mucous membranes of cattle and is a common
cause of mastitis. It is not generally regarded as zoonotic and although both mecA MRSA and
mecC MRSA have been detected in cattle (Garcia-Alvarez et al., 2011, Vanderhaeghen et al.,
2010), the possible role of cattle as a source of human infection has not been well-defined.
Resistance was mostly low or absent (Figure 4.4). Resistance to penicillin fluctuated between
12.9% and 27.8% over the monitoring period and the underlying cause of this variation is not
known. Penicillin resistance in bovine S. aureus is thought to occur mainly via the production of
beta-lactamases that degrade both penicillin and ampicillin. The genes encoding beta-lactamases
can be located on plasmids and often on transposons and may be readily transferable by
conjugation.
Those resistant to amoxicillin/clavulanate are currently screened for susceptibility to cefoxitin in
order to detect mecA and mecC MRSA. No MRSA isolates were detected during 2016–2018.
Amoxicillin/clavulanate resistance decreased from 6.5% to 0% over this period. Resistance to
neomycin and novobiocin was not detected. Tylosin (macrolide) resistance was detected
infrequently (0–2.8%). Resistance to tetracycline has remained below 3% (Table S4.2.3 of the
supplementary material).
0
10
20
30
40
50
60
70
80
90
100
110
120
130
0
10
20
30
40
50
60
70
80
90
100
Am
oxi/cla
v
Am
pic
illin
Ne
om
ycin
No
vo
bio
cin
Penic
illin
Tetr
acyclin
e
Tylo
sin
Am
oxi/cla
v
Am
pic
illin
Ne
om
ycin
No
vo
bio
cin
Penic
illin
Tetr
acyclin
e
Tylo
sin
Am
oxi/cla
v
Am
pic
illin
Ne
om
ycin
No
vo
bio
cin
Penic
illin
Tetr
acyclin
e
Tylo
sin
2016 2017 2018
Nu
mb
er
of
iso
late
s t
este
d
Resis
tan
t is
ola
tes (
%)
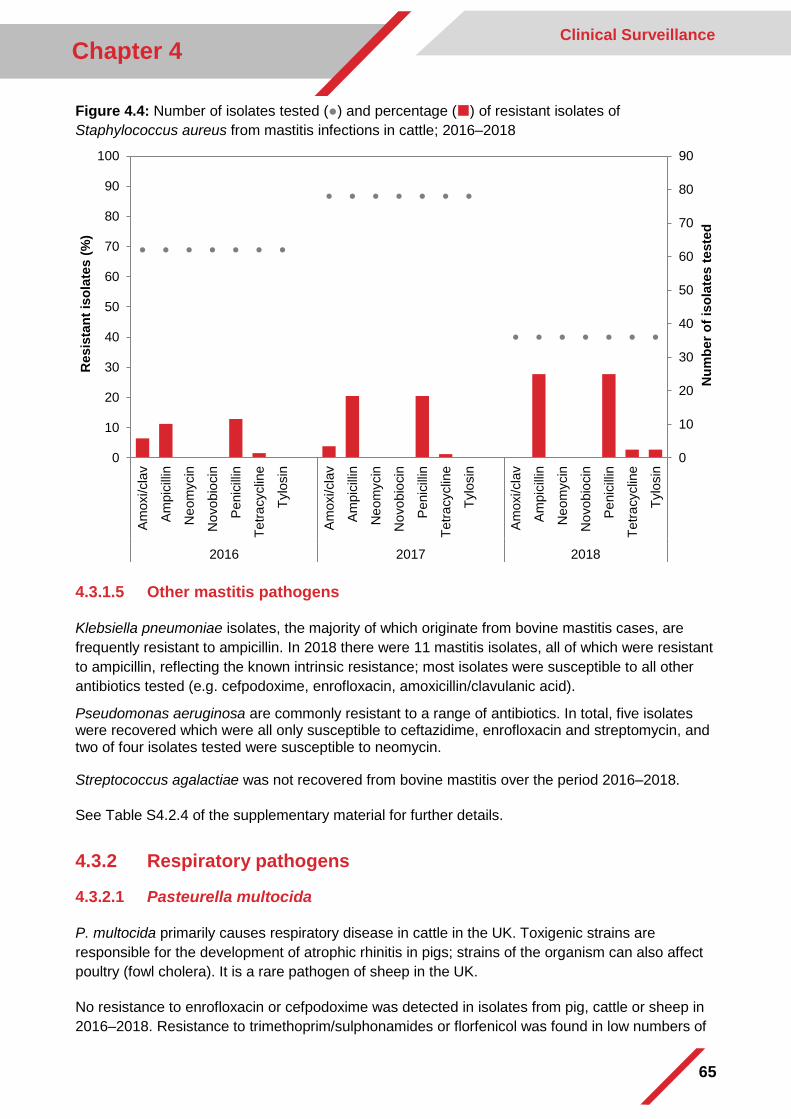
65
Chapter 4 Clinical Surveillance
Figure 4.4: Number of isolates tested (●) and percentage () of resistant isolates of
Staphylococcus aureus from mastitis infections in cattle; 2016–2018
4.3.1.5 Other mastitis pathogens
Klebsiella pneumoniae isolates, the majority of which originate from bovine mastitis cases, are
frequently resistant to ampicillin. In 2018 there were 11 mastitis isolates, all of which were resistant
to ampicillin, reflecting the known intrinsic resistance; most isolates were susceptible to all other
antibiotics tested (e.g. cefpodoxime, enrofloxacin, amoxicillin/clavulanic acid).
Pseudomonas aeruginosa are commonly resistant to a range of antibiotics. In total, five isolates were recovered which were all only susceptible to ceftazidime, enrofloxacin and streptomycin, and two of four isolates tested were susceptible to neomycin.
Streptococcus agalactiae was not recovered from bovine mastitis over the period 2016–2018.
See Table S4.2.4 of the supplementary material for further details.
4.3.2 Respiratory pathogens
4.3.2.1 Pasteurella multocida
P. multocida primarily causes respiratory disease in cattle in the UK. Toxigenic strains are
responsible for the development of atrophic rhinitis in pigs; strains of the organism can also affect
poultry (fowl cholera). It is a rare pathogen of sheep in the UK.
No resistance to enrofloxacin or cefpodoxime was detected in isolates from pig, cattle or sheep in
2016–2018. Resistance to trimethoprim/sulphonamides or florfenicol was found in low numbers of
0
10
20
30
40
50
60
70
80
90
0
10
20
30
40
50
60
70
80
90
100A
moxi/cla
v
Am
pic
illin
Ne
om
ycin
No
vo
bio
cin
Penic
illin
Tetr
acyclin
e
Tylo
sin
Am
oxi/cla
v
Am
pic
illin
Ne
om
ycin
No
vo
bio
cin
Penic
illin
Tetr
acyclin
e
Tylo
sin
Am
oxi/cla
v
Am
pic
illin
Ne
om
ycin
No
vo
bio
cin
Penic
illin
Tetr
acyclin
e
Tylo
sin
2016 2017 2018
Nu
mb
er
of
iso
late
s t
este
d
Resis
tan
t is
ola
tes (
%)
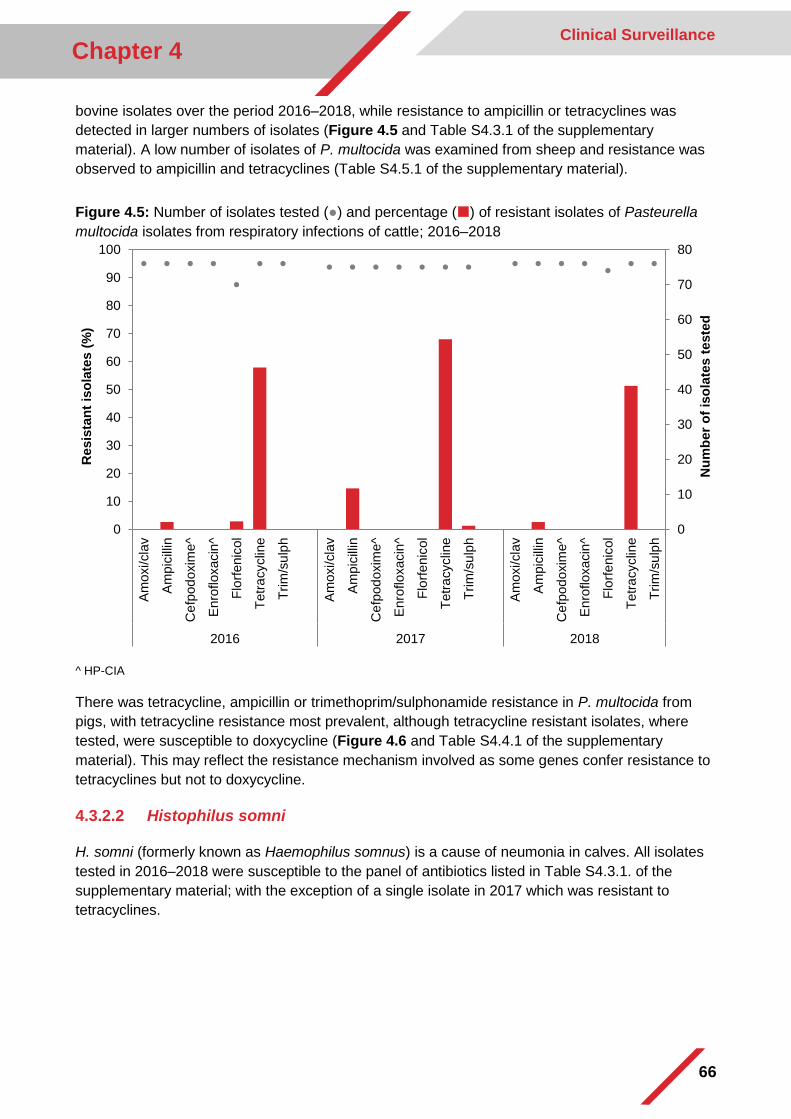
66
Chapter 4 Clinical Surveillance
bovine isolates over the period 2016–2018, while resistance to ampicillin or tetracyclines was
detected in larger numbers of isolates (Figure 4.5 and Table S4.3.1 of the supplementary
material). A low number of isolates of P. multocida was examined from sheep and resistance was
observed to ampicillin and tetracyclines (Table S4.5.1 of the supplementary material).
Figure 4.5: Number of isolates tested (●) and percentage () of resistant isolates of Pasteurella
multocida isolates from respiratory infections of cattle; 2016–2018
^ HP-CIA
There was tetracycline, ampicillin or trimethoprim/sulphonamide resistance in P. multocida from
pigs, with tetracycline resistance most prevalent, although tetracycline resistant isolates, where
tested, were susceptible to doxycycline (Figure 4.6 and Table S4.4.1 of the supplementary
material). This may reflect the resistance mechanism involved as some genes confer resistance to
tetracyclines but not to doxycycline.
4.3.2.2 Histophilus somni
H. somni (formerly known as Haemophilus somnus) is a cause of neumonia in calves. All isolates
tested in 2016–2018 were susceptible to the panel of antibiotics listed in Table S4.3.1. of the
supplementary material; with the exception of a single isolate in 2017 which was resistant to
tetracyclines.
0
10
20
30
40
50
60
70
80
0
10
20
30
40
50
60
70
80
90
100
Am
oxi/cla
v
Am
pic
illin
Ce
fpod
oxim
e^
Enro
floxacin
^
Flo
rfenic
ol
Tetr
acyclin
e
Trim
/su
lph
Am
oxi/cla
v
Am
pic
illin
Ce
fpod
oxim
e^
Enro
floxacin
^
Flo
rfenic
ol
Te
tra
cyclin
e
Trim
/su
lph
Am
oxi/cla
v
Am
pic
illin
Ce
fpod
oxim
e^
Enro
floxacin
^
Flo
rfenic
ol
Tetr
acyclin
e
Trim
/su
lph
2016 2017 2018
Nu
mb
er
of
iso
late
s t
este
d
Resis
tan
t is
ola
tes (
%)
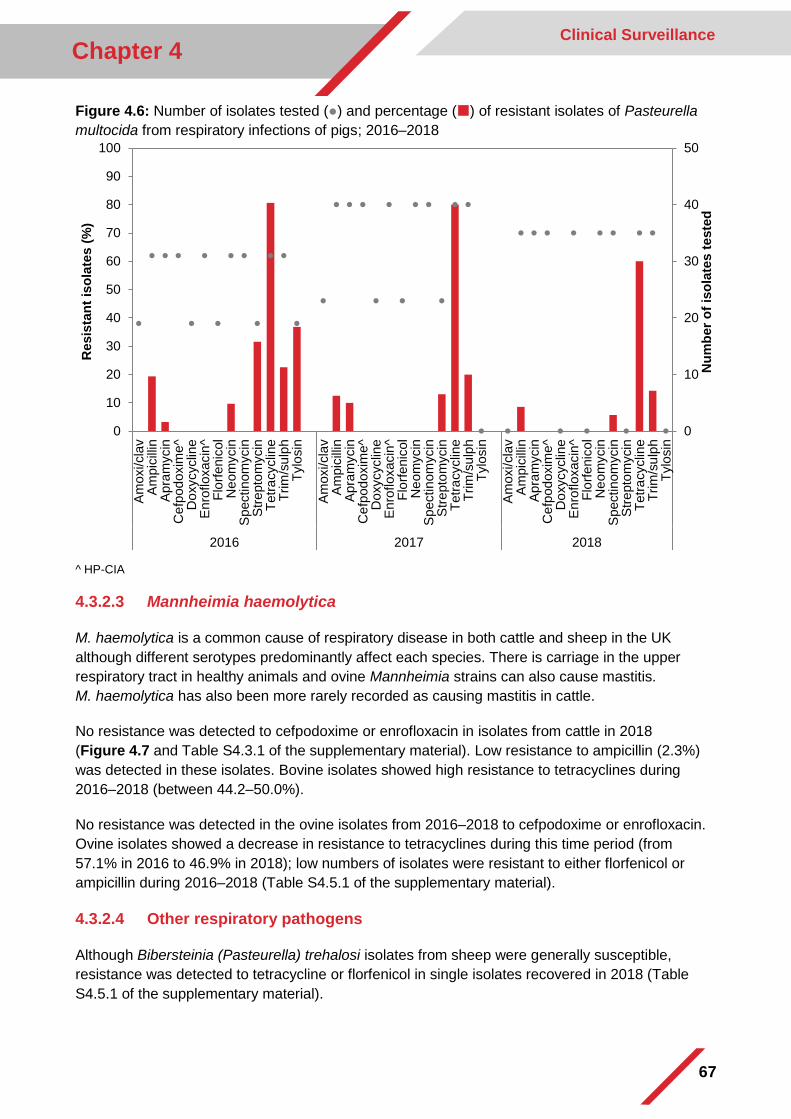
67
Chapter 4 Clinical Surveillance
Figure 4.6: Number of isolates tested (●) and percentage () of resistant isolates of Pasteurella
multocida from respiratory infections of pigs; 2016–2018
^ HP-CIA
4.3.2.3 Mannheimia haemolytica
M. haemolytica is a common cause of respiratory disease in both cattle and sheep in the UK
although different serotypes predominantly affect each species. There is carriage in the upper
respiratory tract in healthy animals and ovine Mannheimia strains can also cause mastitis.
M. haemolytica has also been more rarely recorded as causing mastitis in cattle.
No resistance was detected to cefpodoxime or enrofloxacin in isolates from cattle in 2018
(Figure 4.7 and Table S4.3.1 of the supplementary material). Low resistance to ampicillin (2.3%)
was detected in these isolates. Bovine isolates showed high resistance to tetracyclines during
2016–2018 (between 44.2–50.0%).
No resistance was detected in the ovine isolates from 2016–2018 to cefpodoxime or enrofloxacin.
Ovine isolates showed a decrease in resistance to tetracyclines during this time period (from
57.1% in 2016 to 46.9% in 2018); low numbers of isolates were resistant to either florfenicol or
ampicillin during 2016–2018 (Table S4.5.1 of the supplementary material).
4.3.2.4 Other respiratory pathogens
Although Bibersteinia (Pasteurella) trehalosi isolates from sheep were generally susceptible,
resistance was detected to tetracycline or florfenicol in single isolates recovered in 2018 (Table
S4.5.1 of the supplementary material).
0
10
20
30
40
50
0
10
20
30
40
50
60
70
80
90
100A
moxi/cla
vA
mpic
illin
Apra
mycin
Ce
fpod
oxim
e^
Do
xycyclin
eE
nro
floxacin
^F
lorf
enic
ol
Ne
om
ycin
Spectinom
ycin
Str
epto
mycin
Tetr
acyclin
eT
rim
/su
lph
Tylo
sin
Am
oxi/cla
vA
mpic
illin
Apra
mycin
Ce
fpod
oxim
e^
Do
xycyclin
eE
nro
floxacin
^F
lorf
enic
ol
Ne
om
ycin
Spectinom
ycin
Str
epto
mycin
Tetr
acyclin
eT
rim
/su
lph
Tylo
sin
Am
oxi/cla
vA
mpic
illin
Apra
mycin
Ce
fpod
oxim
e^
Do
xycyclin
eE
nro
floxacin
^F
lorf
enic
ol
Ne
om
ycin
Spectinom
ycin
Str
epto
mycin
Tetr
acyclin
eT
rim
/su
lph
Tylo
sin
2016 2017 2018
Nu
mb
er
of
iso
late
s t
este
d
Resis
tan
t is
ola
tes (
%)
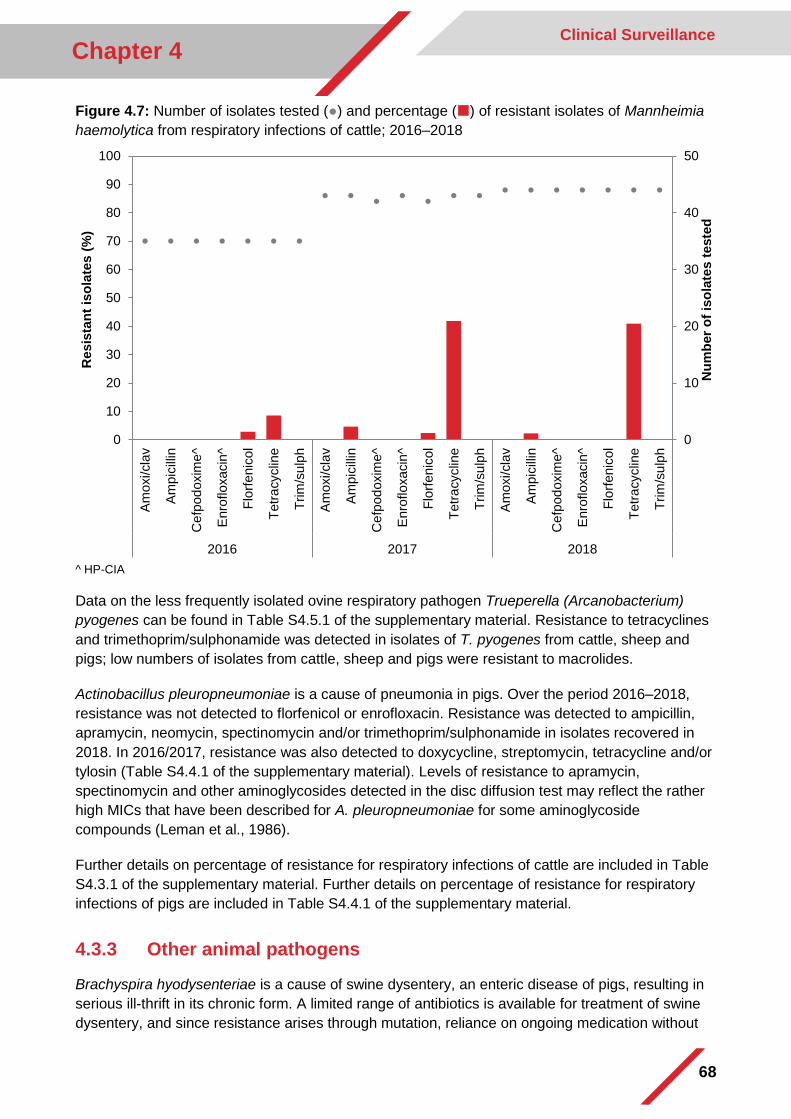
68
Chapter 4 Clinical Surveillance
Figure 4.7: Number of isolates tested (●) and percentage () of resistant isolates of Mannheimia
haemolytica from respiratory infections of cattle; 2016–2018
^ HP-CIA
Data on the less frequently isolated ovine respiratory pathogen Trueperella (Arcanobacterium)
pyogenes can be found in Table S4.5.1 of the supplementary material. Resistance to tetracyclines
and trimethoprim/sulphonamide was detected in isolates of T. pyogenes from cattle, sheep and
pigs; low numbers of isolates from cattle, sheep and pigs were resistant to macrolides.
Actinobacillus pleuropneumoniae is a cause of pneumonia in pigs. Over the period 2016–2018,
resistance was not detected to florfenicol or enrofloxacin. Resistance was detected to ampicillin,
apramycin, neomycin, spectinomycin and/or trimethoprim/sulphonamide in isolates recovered in
2018. In 2016/2017, resistance was also detected to doxycycline, streptomycin, tetracycline and/or
tylosin (Table S4.4.1 of the supplementary material). Levels of resistance to apramycin,
spectinomycin and other aminoglycosides detected in the disc diffusion test may reflect the rather
high MICs that have been described for A. pleuropneumoniae for some aminoglycoside
compounds (Leman et al., 1986).
Further details on percentage of resistance for respiratory infections of cattle are included in Table
S4.3.1 of the supplementary material. Further details on percentage of resistance for respiratory
infections of pigs are included in Table S4.4.1 of the supplementary material.
4.3.3 Other animal pathogens
Brachyspira hyodysenteriae is a cause of swine dysentery, an enteric disease of pigs, resulting in
serious ill-thrift in its chronic form. A limited range of antibiotics is available for treatment of swine
dysentery, and since resistance arises through mutation, reliance on ongoing medication without
0
10
20
30
40
50
0
10
20
30
40
50
60
70
80
90
100A
moxi/cla
v
Am
pic
illin
Ce
fpod
oxim
e^
Enro
floxacin
^
Flo
rfenic
ol
Tetr
acyclin
e
Trim
/su
lph
Am
oxi/cla
v
Am
pic
illin
Ce
fpod
oxim
e^
Enro
floxacin
^
Flo
rfenic
ol
Tetr
acyclin
e
Trim
/su
lph
Am
oxi/cla
v
Am
pic
illin
Ce
fpod
oxim
e^
Enro
floxacin
^
Flo
rfenic
ol
Tetr
acyclin
e
Trim
/su
lph
2016 2017 2018
Nu
mb
er
of
iso
late
s t
este
d
Resis
tan
t is
ola
tes (
%)
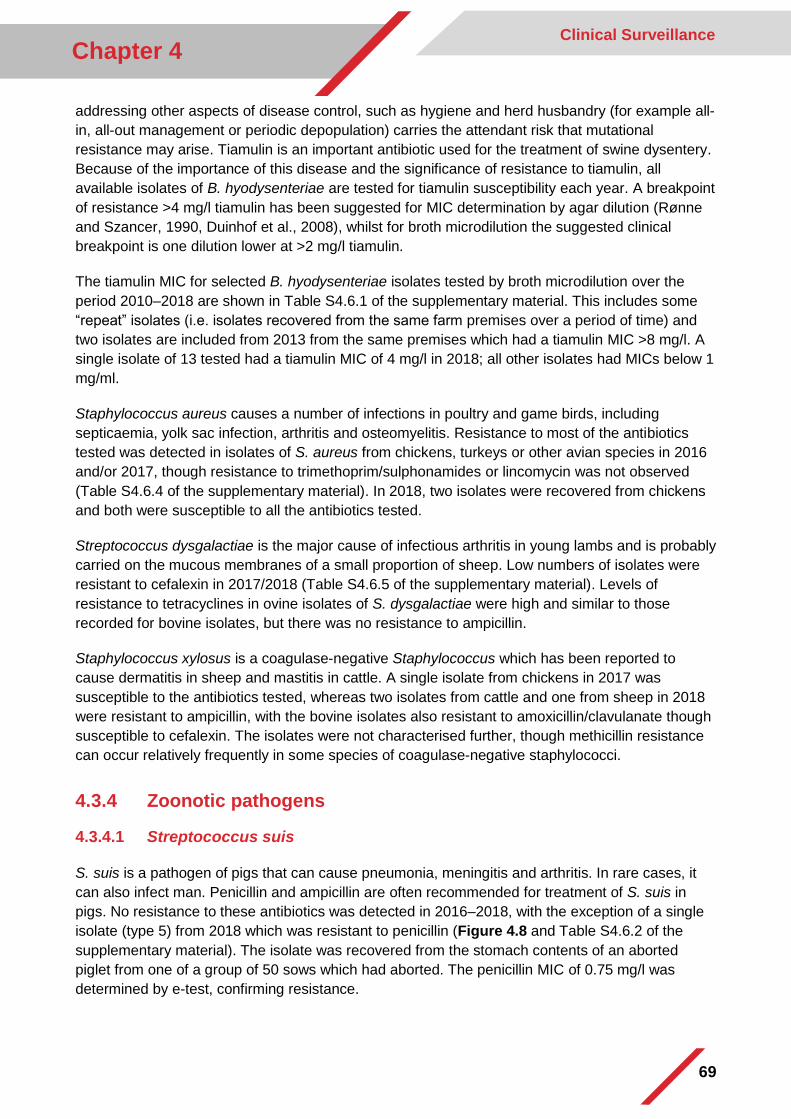
69
Chapter 4 Clinical Surveillance
addressing other aspects of disease control, such as hygiene and herd husbandry (for example all-
in, all-out management or periodic depopulation) carries the attendant risk that mutational
resistance may arise. Tiamulin is an important antibiotic used for the treatment of swine dysentery.
Because of the importance of this disease and the significance of resistance to tiamulin, all
available isolates of B. hyodysenteriae are tested for tiamulin susceptibility each year. A breakpoint
of resistance >4 mg/l tiamulin has been suggested for MIC determination by agar dilution (Rønne
and Szancer, 1990, Duinhof et al., 2008), whilst for broth microdilution the suggested clinical
breakpoint is one dilution lower at >2 mg/l tiamulin.
The tiamulin MIC for selected B. hyodysenteriae isolates tested by broth microdilution over the
period 2010–2018 are shown in Table S4.6.1 of the supplementary material. This includes some
“repeat” isolates (i.e. isolates recovered from the same farm premises over a period of time) and
two isolates are included from 2013 from the same premises which had a tiamulin MIC >8 mg/l. A
single isolate of 13 tested had a tiamulin MIC of 4 mg/l in 2018; all other isolates had MICs below 1
mg/ml.
Staphylococcus aureus causes a number of infections in poultry and game birds, including
septicaemia, yolk sac infection, arthritis and osteomyelitis. Resistance to most of the antibiotics
tested was detected in isolates of S. aureus from chickens, turkeys or other avian species in 2016
and/or 2017, though resistance to trimethoprim/sulphonamides or lincomycin was not observed
(Table S4.6.4 of the supplementary material). In 2018, two isolates were recovered from chickens
and both were susceptible to all the antibiotics tested.
Streptococcus dysgalactiae is the major cause of infectious arthritis in young lambs and is probably
carried on the mucous membranes of a small proportion of sheep. Low numbers of isolates were
resistant to cefalexin in 2017/2018 (Table S4.6.5 of the supplementary material). Levels of
resistance to tetracyclines in ovine isolates of S. dysgalactiae were high and similar to those
recorded for bovine isolates, but there was no resistance to ampicillin.
Staphylococcus xylosus is a coagulase-negative Staphylococcus which has been reported to
cause dermatitis in sheep and mastitis in cattle. A single isolate from chickens in 2017 was
susceptible to the antibiotics tested, whereas two isolates from cattle and one from sheep in 2018
were resistant to ampicillin, with the bovine isolates also resistant to amoxicillin/clavulanate though
susceptible to cefalexin. The isolates were not characterised further, though methicillin resistance
can occur relatively frequently in some species of coagulase-negative staphylococci.
4.3.4 Zoonotic pathogens
4.3.4.1 Streptococcus suis
S. suis is a pathogen of pigs that can cause pneumonia, meningitis and arthritis. In rare cases, it
can also infect man. Penicillin and ampicillin are often recommended for treatment of S. suis in
pigs. No resistance to these antibiotics was detected in 2016–2018, with the exception of a single
isolate (type 5) from 2018 which was resistant to penicillin (Figure 4.8 and Table S4.6.2 of the
supplementary material). The isolate was recovered from the stomach contents of an aborted
piglet from one of a group of 50 sows which had aborted. The penicillin MIC of 0.75 mg/l was
determined by e-test, confirming resistance.
70
Chapter 4 Clinical Surveillance
Isolates resistant to tetracyclines, trimethoprim/sulphonamide, tylosin or lincomycin were all
detected. The resistance to tetracycline, which is not commonly used for the treatment of this
disease in pigs, could be due to exposure in asymptomatic pigs following oral administration of
tetracycline for the treatment of a different condition. Further details are presented in Table S4.6.2
of the supplementary material.
Figure 4.8: Number of isolates tested (●) and percentage () of resistant isolates of
Streptococcus suis from pigs; 2016–2018
^ HP-CIA
4.3.4.2 Livestock Associated-MRSA (LA-MRSA)
LA-MRSA are different from other types of MRSA, such as hospital or community associated
strains, which are more frequently found in humans. Anyone who has contact with colonised
livestock can become colonised with LA-MRSA but prolonged colonisation is more likely in humans
who have regular, prolonged contact with colonised animals. LA-MRSA usually lives in the nose or
on skin, and an opportunist pathogen. Usually this is a local skin infection, but occasionally it can
cause diseases such as pneumonia or bacteraemia.
Further information for people who work with livestock is available at:
https://www.gov.uk/government/publications/la-mrsa-information-for-people-who-work-with-
livestock.
Since the first discovery in 2005, LA-MRSA was found to be prevalent in livestock around the
world. It was detected in the UK for the first time in 2013, and sporadic cases are detected
annually. Clonal Complex (CC) 398 is the most common LA-MRSA CC group isolated from food-
0
10
20
30
40
50
60
70
80
90
0
10
20
30
40
50
60
70
80
90
100
Am
pic
illin
Enro
floxacin
^
Lin
com
ycin
Penic
illin
Tetr
acyclin
e
Trim
/su
lph
Tylo
sin
Am
pic
illin
Enro
floxacin
^
Lin
com
ycin
Penic
illin
Tetr
acyclin
e
Trim
/su
lph
Tylo
sin
Am
pic
illin
Enro
floxacin
^
Lin
com
ycin
Penic
illin
Tetr
acyclin
e
Trim
/su
lph
Tylo
sin
2016 2017 2018
Nu
mb
er
of
iso
late
s t
este
d
Resis
tan
t is
ola
tes (
%)
71
Chapter 4 Clinical Surveillance
producing animal populations in the UK. All isolates are whole genome sequenced and shared with
Public Health England (PHE) to investigate any possible associations with infections in humans.
A summary of all findings identified by UK government veterinary laboratories is provided in
Table 4.1. These reports should not be interpreted as a prediction of prevalence in the animal
population, as samples have been collected through differing methods of passive surveillance in
animals which are affected with clinical disease. Results may therefore not be representative of the
wider, healthy population.
LA-MRSA was not recovered in 2018 from food-producing animals in Scotland or Wales, but it was
detected in a turkey sample from England and in four pig samples from Northern Ireland, all
submitted for clinical diagnosis.
Table 4.1: Findings of LA-MRSA in the UK by government laboratories; 2013–2018
Country Clonal complex Year Species Source of the sample
England and Wales
CC398 2013 Poultry Clinical investigation
CC398 2014 Pig Clinical investigation
CC398 2015 Pig Research project
CC398 2016 Turkey Clinical investigation
CC398 2016 Beef cattle Clinical investigation
CC398 2016 Pig Other investigation
CC398 2017 Pig Clinical investigation
CC398 2018 Turkey Clinical investigation
Northern Ireland
CC398 2014 Pig Clinical investigation
CC30 2015 Pig Clinical investigation
CC398 2015 Dairy cattle Clinical investigation
CC398 2015 Pig (n=2) Clinical investigation
CC398 2016 Pig (n=2) Clinical investigation
CC398 2017 Pig (n=3) Clinical investigation
CC398 2018 Pig (n=4) Clinical investigation
Scotland CC398 2017 Pheasant Clinical investigation
4.3.4.3 Other zoonotic pathogens
Corynebacterium pseudotuberculosis, the cause of caseous lymphadenitis in sheep, has been
reported as an uncommon zoonosis. However, corynebacteria may be an emerging cause of
zoonoses, particularly in people with intercurrent immunosuppressive disease, such as HIV
infection. Resistance was not detected in 2017, although only low numbers of isolates were
available for susceptibility testing and no isolates were obtained in 2018. Irrespective of in vitro
susceptibility, treatment of clinical cases of this infection in sheep is often difficult because of the
difficulties in delivering sufficient antibiotic to the typical “onion-ring” abscesses that occur.
Erysipelothrix rhusiopathiae is widely distributed in nature and occurs as a commensal or pathogen
of a very wide range of vertebrates and invertebrates. The main reservoir amongst the domestic
72
Chapter 4 Clinical Surveillance
species is probably pigs, though infection of both birds and rodents is said to be common. A low
number of isolates of this organism has been isolated (from pigs, sheep and chickens) and the
main resistance detected has been to tetracycline and trimethoprim/sulphonamide. All isolates
were susceptible to penicillin/ampicillin (see Table S4.6.3 of the supplementary material for
information on resistance in E. rhusiopathiae isolated from pigs), which is the usual treatment for
human infection.
Listeria are widely distributed in the environment and can be isolated from soil, decaying
vegetation and poorly fermented silage. Asymptomatic faecal carriage occurs in man and in many
species of animal. Only low numbers of bovine isolates were isolated (data not shown). Cefalexin-
resistance was observed in both bovine and ovine isolates, reflecting the intrinsic resistance of
Listeria spp. to this antibiotic. Isolates were otherwise sensitive, apart from low numbers of isolates
from sheep in 2016 which were resistant to tetracycline (Table S4.6.5 for details on
L. monocytogenes recovered from sheep infections). Listeria ivanovii were recovered from sheep
in 2016 and 2017 and were susceptible to the panel of antibiotics reported (data not shown), but no
L. ivanovii were recovered from sheep in 2018.
Six isolates of Klebsiella pneumoniae were recovered from avian species in 2018, all were
resistant to ampicillin, reflecting the known intrinsic resistance to ampicillin (data not shown).
4.3.5 Escherichia coli
E. coli is an important potential zoonotic. E. coli is a commensal organism in animals and humans
and has the capacity to function as a reservoir of transferable resistance determinants. The E. coli
and coliforms presumptively identified as E. coli referred to in the tables in this report will include
some E. coli strains which are pathogenic for animals as well as commensal strains.
This section includes all isolates of E. coli and coliform bacteria presumptively identified as E. coli,
with the exception of isolates recovered from milk which are included in the section on mastitis
organisms (see section 4.3.1.1). The majority of isolates reported in this section were recovered
from faeces or intestinal contents.
Collated data from England and Wales are presented in the main body of the report. Due to
differences in methodology, data for Scotland and Northern Ireland are presented in Tables
S4.7.1–S4.7.15 of the supplementary material.
Collated data for the major food-producing animal species tested are shown in Table 4.2. In
general, the level of resistance to HP-CIAs in E. coli isolates was low to moderate during 2016–
2018 (2.1–13.2%).
For cattle, pigs and sheep the data are also analysed for each species by the age categories of
neonatal, pre- or post-weaning and adult (see Figure 4.10, Figure 4.12 and Figure 4.14,
respectively). Resistance is usually less prevalent in older animals, including those older animals
which are slaughtered for meat. The large differences in the prevalence of resistance commonly
observed in cattle, pigs and sheep of different ages mean that the level of resistance shown in the
summary table and figures for animals of all ages may reflect, to a significant degree, the
proportions of each age-class which have contributed to the total. Similar considerations can apply
to the contribution of different animal production types, for example laying hens and broiler
chickens. These considerations should be borne in mind when interpreting the summary figures.
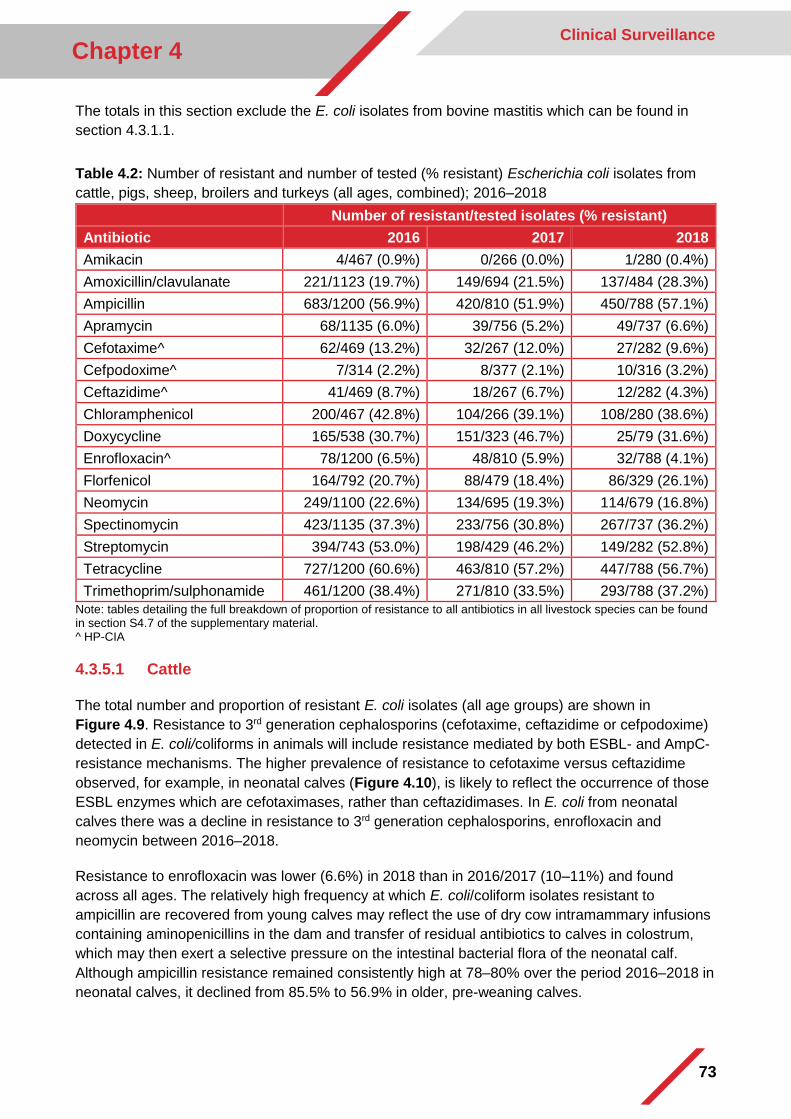
73
Chapter 4 Clinical Surveillance
The totals in this section exclude the E. coli isolates from bovine mastitis which can be found in
section 4.3.1.1.
Table 4.2: Number of resistant and number of tested (% resistant) Escherichia coli isolates from
cattle, pigs, sheep, broilers and turkeys (all ages, combined); 2016–2018
Number of resistant/tested isolates (% resistant)
Antibiotic 2016 2017 2018
Amikacin 4/467 (0.9%) 0/266 (0.0%) 1/280 (0.4%)
Amoxicillin/clavulanate 221/1123 (19.7%) 149/694 (21.5%) 137/484 (28.3%)
Ampicillin 683/1200 (56.9%) 420/810 (51.9%) 450/788 (57.1%)
Apramycin 68/1135 (6.0%) 39/756 (5.2%) 49/737 (6.6%)
Cefotaxime^ 62/469 (13.2%) 32/267 (12.0%) 27/282 (9.6%)
Cefpodoxime^ 7/314 (2.2%) 8/377 (2.1%) 10/316 (3.2%)
Ceftazidime^ 41/469 (8.7%) 18/267 (6.7%) 12/282 (4.3%)
Chloramphenicol 200/467 (42.8%) 104/266 (39.1%) 108/280 (38.6%)
Doxycycline 165/538 (30.7%) 151/323 (46.7%) 25/79 (31.6%)
Enrofloxacin^ 78/1200 (6.5%) 48/810 (5.9%) 32/788 (4.1%)
Florfenicol 164/792 (20.7%) 88/479 (18.4%) 86/329 (26.1%)
Neomycin 249/1100 (22.6%) 134/695 (19.3%) 114/679 (16.8%)
Spectinomycin 423/1135 (37.3%) 233/756 (30.8%) 267/737 (36.2%)
Streptomycin 394/743 (53.0%) 198/429 (46.2%) 149/282 (52.8%)
Tetracycline 727/1200 (60.6%) 463/810 (57.2%) 447/788 (56.7%)
Trimethoprim/sulphonamide 461/1200 (38.4%) 271/810 (33.5%) 293/788 (37.2%)
Note: tables detailing the full breakdown of proportion of resistance to all antibiotics in all livestock species can be found in section S4.7 of the supplementary material. ^ HP-CIA
4.3.5.1 Cattle
The total number and proportion of resistant E. coli isolates (all age groups) are shown in
Figure 4.9. Resistance to 3rd generation cephalosporins (cefotaxime, ceftazidime or cefpodoxime)
detected in E. coli/coliforms in animals will include resistance mediated by both ESBL- and AmpC-
resistance mechanisms. The higher prevalence of resistance to cefotaxime versus ceftazidime
observed, for example, in neonatal calves (Figure 4.10), is likely to reflect the occurrence of those
ESBL enzymes which are cefotaximases, rather than ceftazidimases. In E. coli from neonatal
calves there was a decline in resistance to 3rd generation cephalosporins, enrofloxacin and
neomycin between 2016–2018.
Resistance to enrofloxacin was lower (6.6%) in 2018 than in 2016/2017 (10–11%) and found
across all ages. The relatively high frequency at which E. coli/coliform isolates resistant to
ampicillin are recovered from young calves may reflect the use of dry cow intramammary infusions
containing aminopenicillins in the dam and transfer of residual antibiotics to calves in colostrum,
which may then exert a selective pressure on the intestinal bacterial flora of the neonatal calf.
Although ampicillin resistance remained consistently high at 78–80% over the period 2016–2018 in
neonatal calves, it declined from 85.5% to 56.9% in older, pre-weaning calves.
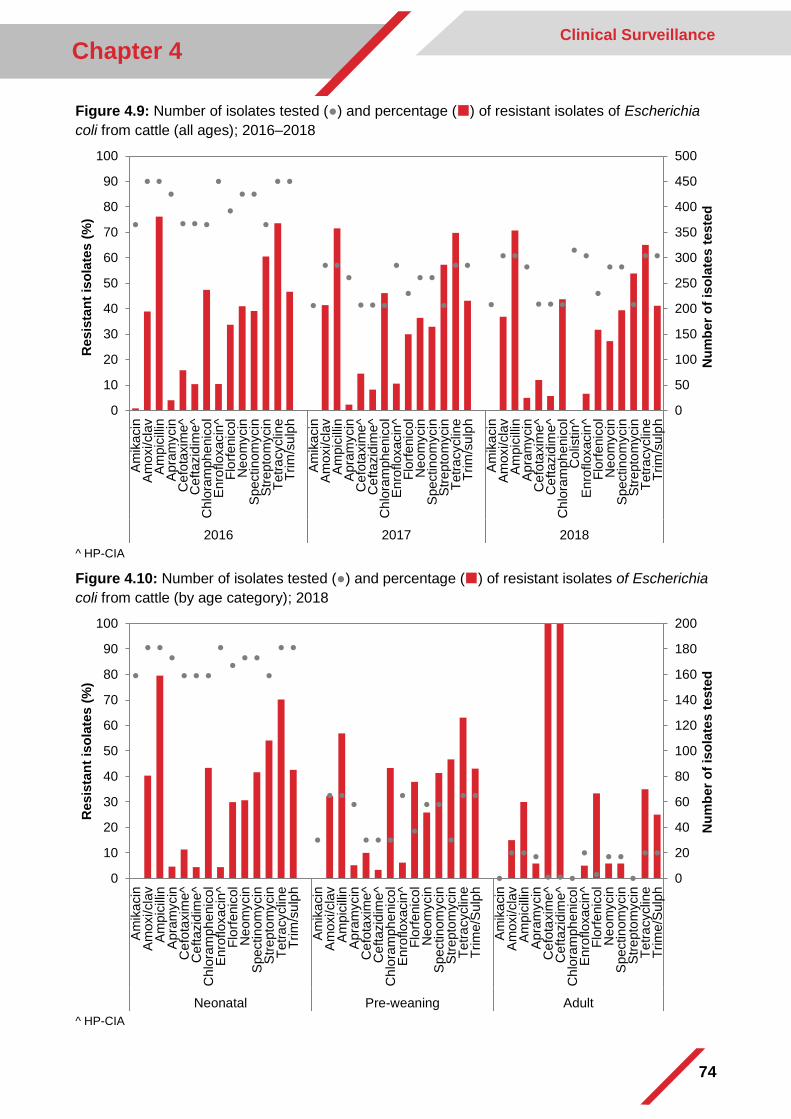
74
Chapter 4 Clinical Surveillance
Figure 4.9: Number of isolates tested (●) and percentage () of resistant isolates of Escherichia
coli from cattle (all ages); 2016–2018
^ HP-CIA
Figure 4.10: Number of isolates tested (●) and percentage () of resistant isolates of Escherichia
coli from cattle (by age category); 2018
^ HP-CIA
0
50
100
150
200
250
300
350
400
450
500
0
10
20
30
40
50
60
70
80
90
100
Am
ika
cin
Am
oxi/cla
vA
mpic
illin
Apra
mycin
Ce
fota
xim
e^
Ce
ftazid
ime^
Ch
lora
mph
enic
ol
Enro
floxacin
^F
lorf
enic
ol
Ne
om
ycin
Spectinom
ycin
Str
epto
mycin
Tetr
acyclin
eT
rim
/su
lph
Am
ika
cin
Am
oxi/cla
vA
mpic
illin
Apra
mycin
Ce
fota
xim
e^
Ce
ftazid
ime^
Ch
lora
mph
enic
ol
Enro
floxacin
^F
lorf
enic
ol
Ne
om
ycin
Spectinom
ycin
Str
epto
mycin
Tetr
acyclin
eT
rim
/su
lph
Am
ika
cin
Am
oxi/cla
vA
mpic
illin
Apra
mycin
Ce
fota
xim
e^
Ce
ftazid
ime^
Ch
lora
mph
enic
ol
Co
listin^
Enro
floxacin
^F
lorf
enic
ol
Ne
om
ycin
Spectinom
ycin
Str
epto
mycin
Tetr
acyclin
eT
rim
/su
lph
2016 2017 2018
Nu
mb
er
of
iso
late
s t
este
d
Resis
tan
t is
ola
tes (
%)
0
20
40
60
80
100
120
140
160
180
200
0
10
20
30
40
50
60
70
80
90
100
Am
ika
cin
Am
oxi/cla
vA
mpic
illin
Apra
mycin
Ce
fota
xim
e^
Ce
ftazid
ime^
Ch
lora
mph
enic
ol
Enro
floxacin
^F
lorf
enic
ol
Ne
om
ycin
Spectinom
ycin
Str
epto
mycin
Tetr
acyclin
eT
rim
/su
lph
Am
ika
cin
Am
oxi/cla
vA
mpic
illin
Apra
mycin
Ce
fota
xim
e^
Ce
ftazid
ime^
Ch
lora
mph
enic
ol
Enro
floxacin
^F
lorf
enic
ol
Ne
om
ycin
Spectinom
ycin
Str
epto
mycin
Tetr
acyclin
eT
rim
e/S
ulp
h
Am
ika
cin
Am
oxi/cla
vA
mpic
illin
Apra
mycin
Ce
fota
xim
e^
Ce
ftazid
ime^
Ch
lora
mph
enic
ol
Enro
floxacin
^F
lorf
enic
ol
Ne
om
ycin
Spectinom
ycin
Str
epto
mycin
Tetr
acyclin
eT
rim
e/S
ulp
h
Neonatal Pre-weaning Adult
Nu
mb
er
of
iso
late
s t
este
d
Resis
tan
t is
ola
tes (
%)
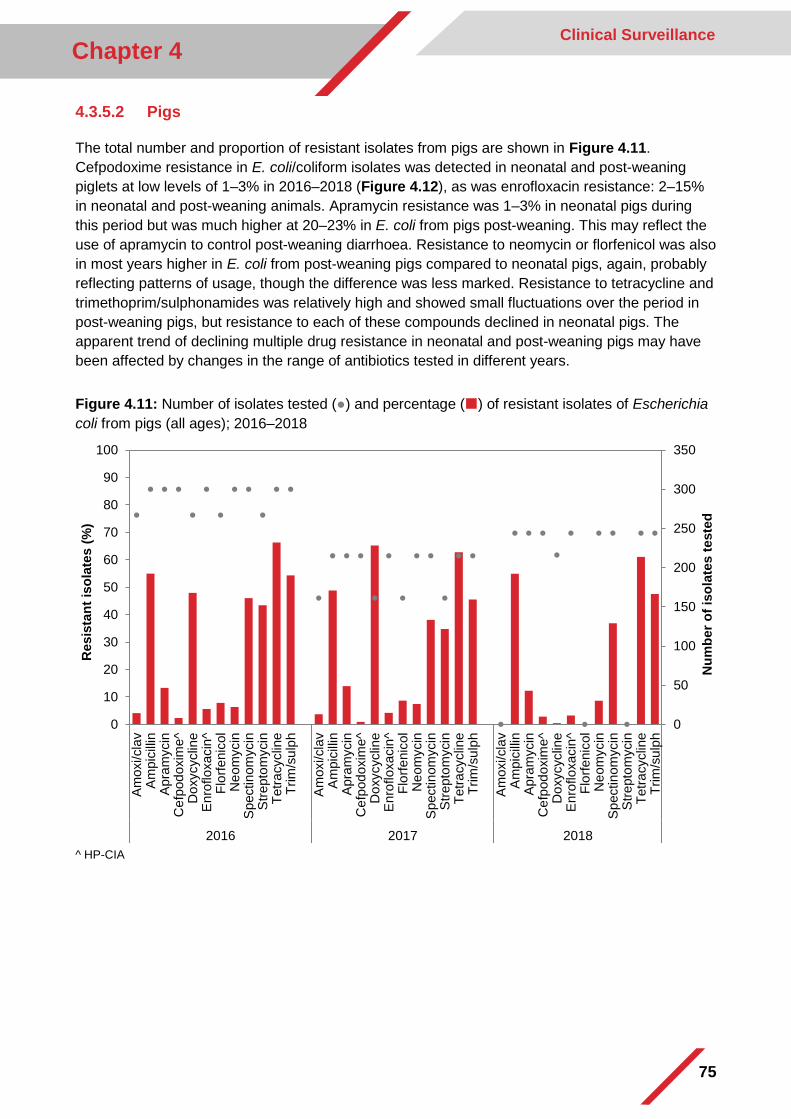
75
Chapter 4 Clinical Surveillance
4.3.5.2 Pigs
The total number and proportion of resistant isolates from pigs are shown in Figure 4.11.
Cefpodoxime resistance in E. coli/coliform isolates was detected in neonatal and post-weaning
piglets at low levels of 1–3% in 2016–2018 (Figure 4.12), as was enrofloxacin resistance: 2–15%
in neonatal and post-weaning animals. Apramycin resistance was 1–3% in neonatal pigs during
this period but was much higher at 20–23% in E. coli from pigs post-weaning. This may reflect the
use of apramycin to control post-weaning diarrhoea. Resistance to neomycin or florfenicol was also
in most years higher in E. coli from post-weaning pigs compared to neonatal pigs, again, probably
reflecting patterns of usage, though the difference was less marked. Resistance to tetracycline and
trimethoprim/sulphonamides was relatively high and showed small fluctuations over the period in
post-weaning pigs, but resistance to each of these compounds declined in neonatal pigs. The
apparent trend of declining multiple drug resistance in neonatal and post-weaning pigs may have
been affected by changes in the range of antibiotics tested in different years.
Figure 4.11: Number of isolates tested (●) and percentage () of resistant isolates of Escherichia
coli from pigs (all ages); 2016–2018
^ HP-CIA
0
50
100
150
200
250
300
350
0
10
20
30
40
50
60
70
80
90
100
Am
oxi/cla
vA
mpic
illin
Apra
mycin
Ce
fpod
oxim
e^
Do
xycyclin
eE
nro
floxacin
^F
lorf
enic
ol
Ne
om
ycin
Spectinom
ycin
Str
epto
mycin
Tetr
acyclin
eT
rim
/su
lph
Am
oxi/cla
vA
mpic
illin
Apra
mycin
Ce
fpod
oxim
e^
Do
xycyclin
eE
nro
floxacin
^F
lorf
enic
ol
Ne
om
ycin
Spectinom
ycin
Str
epto
mycin
Tetr
acyclin
eT
rim
/su
lph
Am
oxi/cla
vA
mpic
illin
Apra
mycin
Ce
fpod
oxim
e^
Do
xycyclin
eE
nro
floxacin
^F
lorf
enic
ol
Ne
om
ycin
Spectinom
ycin
Str
epto
mycin
Tetr
acyclin
eT
rim
/su
lph
2016 2017 2018
Nu
mb
er
of
iso
late
s t
este
d
Resis
tan
t is
ola
tes (
%)
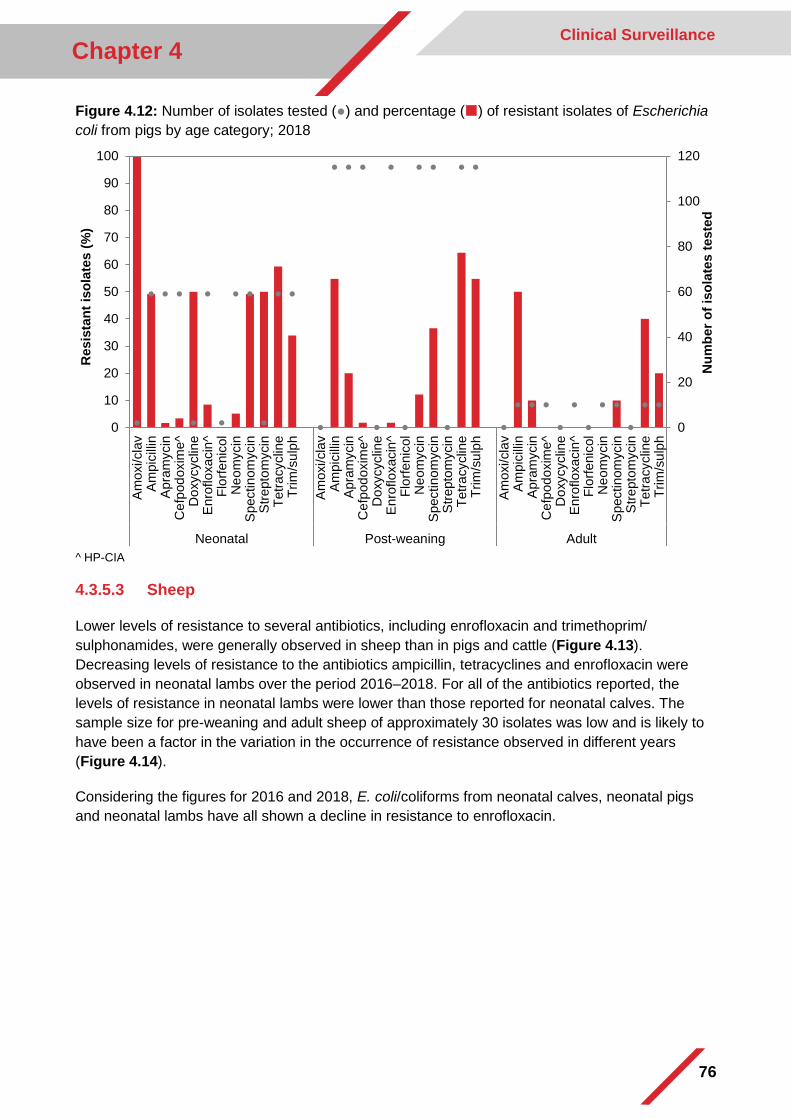
76
Chapter 4 Clinical Surveillance
Figure 4.12: Number of isolates tested (●) and percentage () of resistant isolates of Escherichia
coli from pigs by age category; 2018
^ HP-CIA
4.3.5.3 Sheep
Lower levels of resistance to several antibiotics, including enrofloxacin and trimethoprim/
sulphonamides, were generally observed in sheep than in pigs and cattle (Figure 4.13).
Decreasing levels of resistance to the antibiotics ampicillin, tetracyclines and enrofloxacin were
observed in neonatal lambs over the period 2016–2018. For all of the antibiotics reported, the
levels of resistance in neonatal lambs were lower than those reported for neonatal calves. The
sample size for pre-weaning and adult sheep of approximately 30 isolates was low and is likely to
have been a factor in the variation in the occurrence of resistance observed in different years
(Figure 4.14).
Considering the figures for 2016 and 2018, E. coli/coliforms from neonatal calves, neonatal pigs
and neonatal lambs have all shown a decline in resistance to enrofloxacin.
0
20
40
60
80
100
120
0
10
20
30
40
50
60
70
80
90
100
Am
oxi/cla
vA
mpic
illin
Apra
mycin
Ce
fpod
oxim
e^
Do
xycyclin
eE
nro
floxacin
^F
lorf
enic
ol
Ne
om
ycin
Spectinom
ycin
Str
epto
mycin
Tetr
acyclin
eT
rim
/su
lph
Am
oxi/cla
vA
mpic
illin
Apra
mycin
Ce
fpod
oxim
e^
Do
xycyclin
eE
nro
floxacin
^F
lorf
enic
ol
Ne
om
ycin
Spectinom
ycin
Str
epto
mycin
Tetr
acyclin
eT
rim
/su
lph
Am
oxi/cla
vA
mpic
illin
Apra
mycin
Ce
fpod
oxim
e^
Do
xycyclin
eE
nro
floxacin
^F
lorf
enic
ol
Ne
om
ycin
Spectinom
ycin
Str
epto
mycin
Tetr
acyclin
eT
rim
/su
lph
Neonatal Post-weaning Adult
Nu
mb
er
of
iso
late
s t
este
d
Resis
tan
t is
ola
tes (
%)
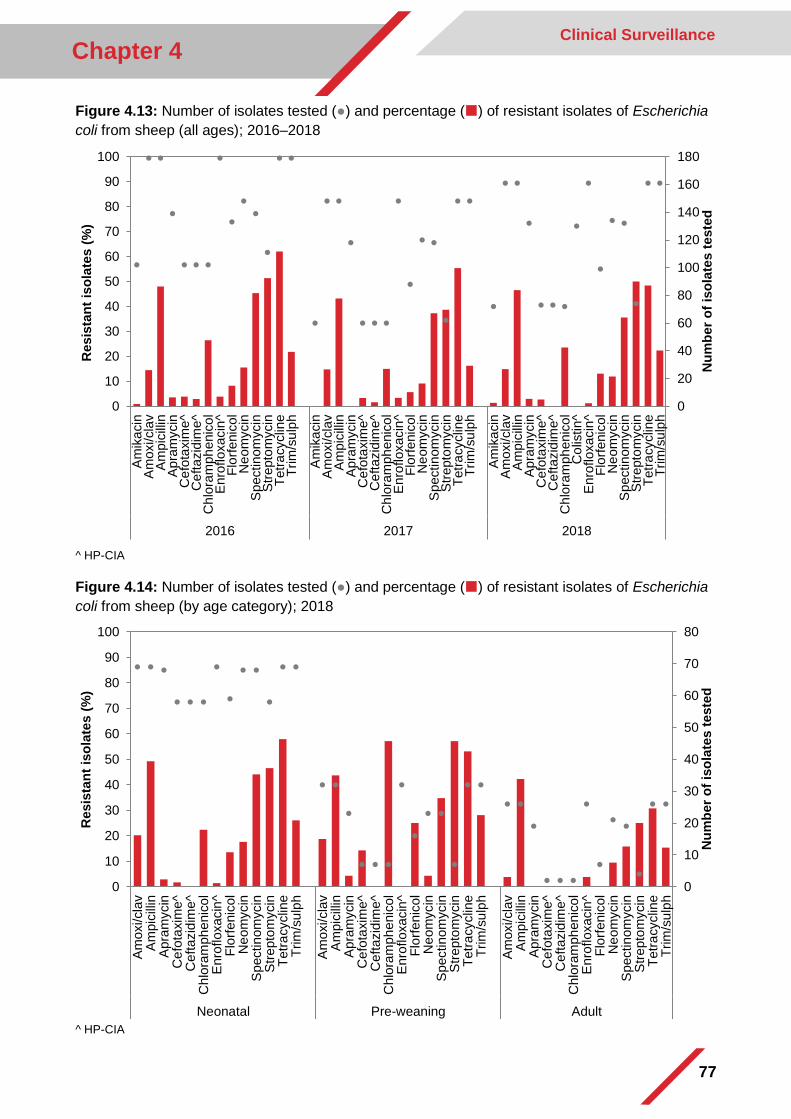
77
Chapter 4 Clinical Surveillance
Figure 4.13: Number of isolates tested (●) and percentage () of resistant isolates of Escherichia
coli from sheep (all ages); 2016–2018
^ HP-CIA
Figure 4.14: Number of isolates tested (●) and percentage () of resistant isolates of Escherichia
coli from sheep (by age category); 2018
^ HP-CIA
0
20
40
60
80
100
120
140
160
180
0
10
20
30
40
50
60
70
80
90
100
Am
ika
cin
Am
oxi/cla
vA
mpic
illin
Apra
mycin
Ce
fota
xim
e^
Ce
ftazid
ime^
Ch
lora
mph
enic
ol
Enro
floxacin
^F
lorf
enic
ol
Ne
om
ycin
Spectinom
ycin
Str
epto
mycin
Tetr
acyclin
eT
rim
/su
lph
Am
ika
cin
Am
oxi/cla
vA
mpic
illin
Apra
mycin
Ce
fota
xim
e^
Ce
ftazid
ime^
Ch
lora
mph
enic
ol
Enro
floxacin
^F
lorf
enic
ol
Ne
om
ycin
Spectinom
ycin
Str
epto
mycin
Tetr
acyclin
eT
rim
/su
lph
Am
ika
cin
Am
oxi/cla
vA
mpic
illin
Apra
mycin
Ce
fota
xim
e^
Ce
ftazid
ime^
Ch
lora
mph
enic
ol
Co
listin^
Enro
floxacin
^F
lorf
enic
ol
Ne
om
ycin
Spectinom
ycin
Str
epto
mycin
Tetr
acyclin
eT
rim
/su
lph
2016 2017 2018
Nu
mb
er
of
iso
late
s t
este
d
Resis
tan
t is
ola
tes (
%)
0
10
20
30
40
50
60
70
80
0
10
20
30
40
50
60
70
80
90
100
Am
oxi/cla
vA
mpic
illin
Apra
mycin
Ce
fota
xim
e^
Ce
ftazid
ime^
Ch
lora
mph
enic
ol
Enro
floxacin
^F
lorf
enic
ol
Ne
om
ycin
Spectinom
ycin
Str
epto
mycin
Te
tra
cyclin
eT
rim
/su
lph
Am
oxi/cla
vA
mpic
illin
Apra
mycin
Ce
fota
xim
e^
Ce
ftazid
ime^
Ch
lora
mph
enic
ol
Enro
floxacin
^F
lorf
enic
ol
Ne
om
ycin
Spectinom
ycin
Str
epto
mycin
Tetr
acyclin
eT
rim
/su
lph
Am
oxi/cla
vA
mpic
illin
Apra
mycin
Ce
fota
xim
e^
Ce
ftazid
ime^
Ch
lora
mph
enic
ol
Enro
floxacin
^F
lorf
enic
ol
Ne
om
ycin
Spectinom
ycin
Str
epto
mycin
Tetr
acyclin
eT
rim
/su
lph
Neonatal Pre-weaning Adult
Nu
mb
er
of
iso
late
s t
este
d
Resis
tan
t is
ola
tes (
%)
78
Chapter 4 Clinical Surveillance
4.3.5.4 Chickens and turkeys
Cefpodoxime resistance ranged from 3% to 4% in E. coli/coliforms from chickens in 2016–2018,
representing a decline since 2015 when 11% resistance was recorded (Figure 4.15 and Table
S4.7.5 of the supplementary material). Usage of 3rd generation cephalosporins has not been
permitted in poultry by the BPC since 2012. However, other beta-lactam compounds, for example
ampicillin, can also exert a degree of selective pressure for 3rd generation cephalosporin
resistance, though this has been shown to be lower than that exerted by the 3rd generation
cephalosporins.
Levels of resistance detected to the fluoroquinolone enrofloxacin in E. coli/coliforms from chickens
over the period 2015–2018 declined from 17% to 1–3%, temporally coincident with recent industry
initiatives to reduce use of fluoroquinolones in broilers.
Resistance in E. coli isolates from turkeys is shown in Table S4.7.6 of the supplementary material.
Figure 4.15: Number of isolates tested (●) and percentage () of resistant isolates of Escherichia
coli from chickens; 2016–2018
^ HP-CIA
4.3.6 Salmonella spp.
Due to the relevance of Salmonella as a zoonotic pathogen, and the importance of the serovar,
and even phage type, of an isolate when investigating potential epidemiological links between
animal and human cases, results are presented by individual serovar/phage type in this section.
Resistance to 3rd generation cephalosporins and fluoroquinolones in Salmonella isolates is of
0
50
100
150
200
250
300
0
10
20
30
40
50
60
70
80
90
100
Am
oxi/cla
v
Am
pic
illin
Apra
mycin
Ce
fpod
oxim
e^
Do
xycyclin
e
Enro
floxacin
^
Ne
om
ycin
Spectinom
ycin
Tetr
acyclin
e
Trim
/su
lph
Am
oxi/cla
v
Am
pic
illin
Apra
mycin
Ce
fpod
oxim
e^
Do
xycyclin
e
Enro
floxacin
^
Ne
om
ycin
Spectinom
ycin
Tetr
acyclin
e
Trim
/su
lph
Am
oxi/cla
v
Am
pic
illin
Apra
mycin
Ce
fpod
oxim
e^
Co
listin^
Do
xycyclin
e
Enro
floxacin
^
Ne
om
ycin
Spectinom
ycin
Tetr
acyclin
e
Trim
/su
lph
2016 2017 2018
Nu
mb
er
of
iso
late
s t
este
d
Resis
tan
t is
ola
tes (
%)
79
Chapter 4 Clinical Surveillance
particular importance, since these antibiotics are most commonly used for the treatment of human
salmonellosis, when treatment is required. However, it should be noted that most cases of non-
typhoidal Salmonella infection in humans are non-invasive, limited to the gastro-intestinal tract and
do not require antibiotic treatment. Where resistance to 3rd generation cephalosporins and
fluoroquinolones is detected in a food-producing animal(s), attempts are made to visit the farms in
order to explain the significance of the findings and provide appropriate advice on control.
The number of cultures received from a farm varies enormously, especially in the case of those
received from poultry premises. Some poultry companies have a continuous monitoring
programme and large numbers of Salmonella isolates may be received from a particular company
relating to one premises. Thus, in that situation, the numbers of isolates of a particular serotype
and their antibiotic susceptibility may not reflect the prevalence in the animal population as a whole
but rather the intensity of the monitoring programme on a farm or group of farms. Therefore, to
better indicate the prevalence of resistance, only the first isolate from each incident has usually
been tested. More detailed results can be found in section S4.8 of the supplementary material.
4.3.6.1 All Salmonella
Of the 4,414 Salmonella isolates tested in 2018, 3,376 (76.5%) were sensitive to all of the
antibiotics tested (Figure 4.16). This is similar to the situation in 2017 (71.2%).
Figure 4.16: Percentage of Salmonella spp. isolates susceptible to all tested antibiotics, from
different sources and animal species; in 2016 (), 2017 () and 2018 ()
* Ducks, horses, dogs, other non-avian species, other avian species, feed and farm environment.
The percentage of Salmonella isolates that were resistant to ciprofloxacin in 2018 was 0.1%; one
single isolate (S. Mbandaka from a broiler chicken) was resistant to ceftazidime and cefotaxime.
Ciprofloxacin, cefotaxime or ceftazidime resistance was not detected in S. Enteritidis from animals
in 2018. No cefotaxime or ceftazidime resistance was detected in S. Typhimurium from animals in
2018. These findings are important since these serovars are of particular public health importance.
0
10
20
30
40
50
60
70
80
90
100
Cattle Sheep Pigs Chickens Turkeys Other* All
Iso
late
s s
uscep
tib
le t
o
all t
este
d a
nti
bio
tics (
%)
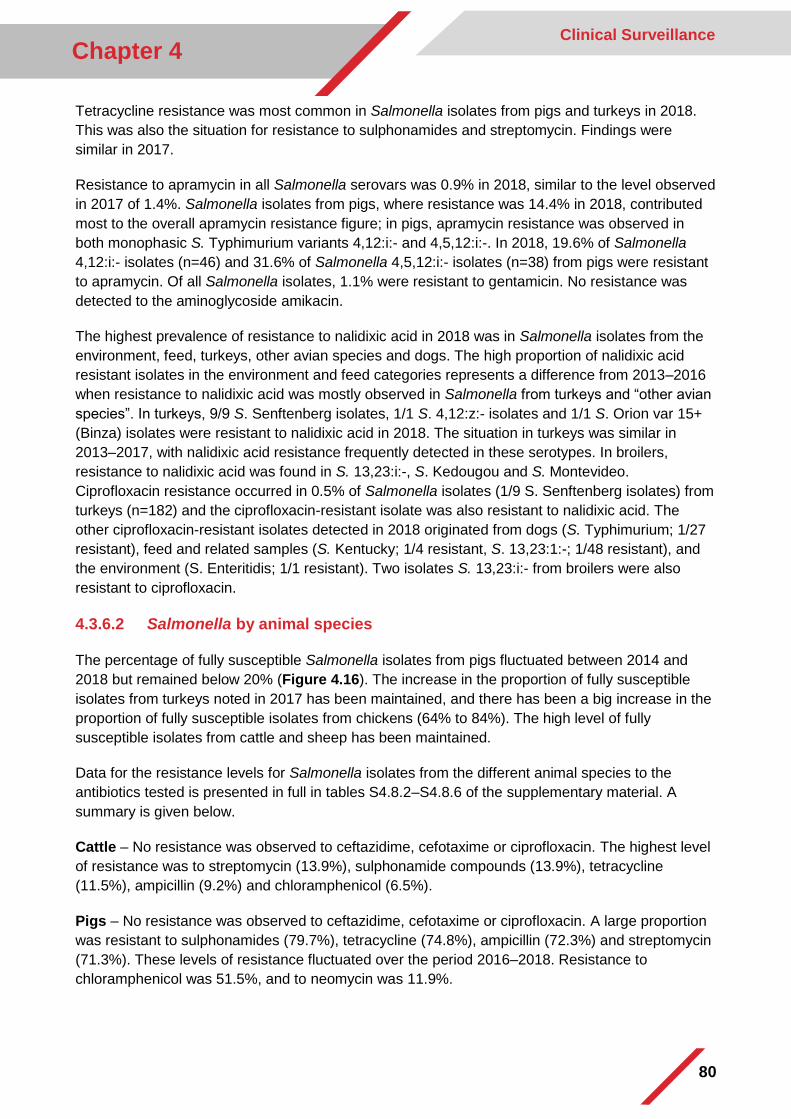
80
Chapter 4 Clinical Surveillance
Tetracycline resistance was most common in Salmonella isolates from pigs and turkeys in 2018.
This was also the situation for resistance to sulphonamides and streptomycin. Findings were
similar in 2017.
Resistance to apramycin in all Salmonella serovars was 0.9% in 2018, similar to the level observed
in 2017 of 1.4%. Salmonella isolates from pigs, where resistance was 14.4% in 2018, contributed
most to the overall apramycin resistance figure; in pigs, apramycin resistance was observed in
both monophasic S. Typhimurium variants 4,12:i:- and 4,5,12:i:-. In 2018, 19.6% of Salmonella
4,12:i:- isolates (n=46) and 31.6% of Salmonella 4,5,12:i:- isolates (n=38) from pigs were resistant
to apramycin. Of all Salmonella isolates, 1.1% were resistant to gentamicin. No resistance was
detected to the aminoglycoside amikacin.
The highest prevalence of resistance to nalidixic acid in 2018 was in Salmonella isolates from the
environment, feed, turkeys, other avian species and dogs. The high proportion of nalidixic acid
resistant isolates in the environment and feed categories represents a difference from 2013–2016
when resistance to nalidixic acid was mostly observed in Salmonella from turkeys and “other avian
species”. In turkeys, 9/9 S. Senftenberg isolates, 1/1 S. 4,12:z:- isolates and 1/1 S. Orion var 15+
(Binza) isolates were resistant to nalidixic acid in 2018. The situation in turkeys was similar in
2013–2017, with nalidixic acid resistance frequently detected in these serotypes. In broilers,
resistance to nalidixic acid was found in S. 13,23:i:-, S. Kedougou and S. Montevideo.
Ciprofloxacin resistance occurred in 0.5% of Salmonella isolates (1/9 S. Senftenberg isolates) from
turkeys (n=182) and the ciprofloxacin-resistant isolate was also resistant to nalidixic acid. The
other ciprofloxacin-resistant isolates detected in 2018 originated from dogs (S. Typhimurium; 1/27
resistant), feed and related samples (S. Kentucky; 1/4 resistant, S. 13,23:1:-; 1/48 resistant), and
the environment (S. Enteritidis; 1/1 resistant). Two isolates S. 13,23:i:- from broilers were also
resistant to ciprofloxacin.
4.3.6.2 Salmonella by animal species
The percentage of fully susceptible Salmonella isolates from pigs fluctuated between 2014 and
2018 but remained below 20% (Figure 4.16). The increase in the proportion of fully susceptible
isolates from turkeys noted in 2017 has been maintained, and there has been a big increase in the
proportion of fully susceptible isolates from chickens (64% to 84%). The high level of fully
susceptible isolates from cattle and sheep has been maintained.
Data for the resistance levels for Salmonella isolates from the different animal species to the
antibiotics tested is presented in full in tables S4.8.2–S4.8.6 of the supplementary material. A
summary is given below.
Cattle – No resistance was observed to ceftazidime, cefotaxime or ciprofloxacin. The highest level
of resistance was to streptomycin (13.9%), sulphonamide compounds (13.9%), tetracycline
(11.5%), ampicillin (9.2%) and chloramphenicol (6.5%).
Pigs – No resistance was observed to ceftazidime, cefotaxime or ciprofloxacin. A large proportion
was resistant to sulphonamides (79.7%), tetracycline (74.8%), ampicillin (72.3%) and streptomycin
(71.3%). These levels of resistance fluctuated over the period 2016–2018. Resistance to
chloramphenicol was 51.5%, and to neomycin was 11.9%.
81
Chapter 4 Clinical Surveillance
Sheep – There was no resistance to ceftazidime, cefotaxime or ciprofloxacin. The highest level of
resistance was to streptomycin (7.6%), sulphonamides (7.2%), tetracycline (6.9%) and ampicillin
(6.5%). A decrease in the levels of resistance to these antibiotics was seen compared with 2017.
Chickens – Resistance to 3rd generation cephalosporins or fluoroquinolones (ciprofloxacin) was
very low (0.1% of the isolates). The highest levels of resistance were seen to sulphonamides
(11.3%) and tetracycline (7.8%), which were lower than the previous year. Similar to previous
years, gentamicin resistance was present in a very low number of isolates (0.5%).
Turkeys – The low level of ciprofloxacin resistance (0.6%) was similar to the previous year, and no
resistance to 3rd generation cephalosporins was detected. The highest level of resistance was to
streptomycin (71.8%), sulphonamides (69.6%) and tetracycline (69.1%). These levels were higher
than those reported in 2017.
4.3.6.3 Top ten Salmonella serovars isolated in 2014–2018
Some serovars can have characteristic patterns of resistance, so knowledge of the most frequently
isolated serovars can be of benefit when considering trends in resistance. The ‘top ten’ serovars of
non-typhoidal Salmonella isolates recovered from cattle, pigs, sheep, chickens and turkeys in
Great Britain in 2014–2018 are presented in Figure 4.17. S. Derby, S. Dublin and S. Mbandaka
are generally the most consistently isolated serovars year-on-year, but in 2018 the most frequent
isolated serovar was 13,23:i:- (n=681), followed by Mbandaka (n=514) and (presumptive) Derby
(n=439). Details on the number of commonly recovered serovars in Scotland and Northern Ireland
are provided separately in Table S4.8.10 and S4.8.11 of the supplementary material.
Figure 4.17: Top ten most commonly isolated Salmonella serovars from livestock in Great Britain
in 2018, with corresponding data for previous years
4.3.6.4 Salmonella Dublin
Of the 320 Salmonella Dublin cultures tested during 2018, 96.2% were susceptible to all
16 antibiotics tested (Table 4.3). This percentage has shown only slight fluctuations over the
period 2006–2018 and the majority of isolates remain susceptible; this has been the situation since
20142015
2016
2017
2018
0
100
200
300
400
500
600
700
No
. o
f is
ola
tes
* Data includes presumptive S. Derby
82
Chapter 4 Clinical Surveillance
surveillance began in 1971. Most S. Dublin isolates (89.0 %) originated from cattle in 2018, in
keeping with previous years. Isolates from species other than cattle in 2018, comprised 12 isolates
from sheep, 10 from dogs, one from an alpaca, one from a cat and 11 from animal feed.
Table 4.3: Resistance in Salmonella Dublin: percentage of resistant isolates; 2014–2018
Percentage of resistant isolates
Antibiotic
2014 2015 2016 2017 2018
(n=286) (n=226) (n=245) (n=272) (n=320)
Ampicillin 0.7 1.8 0.4 0 0
Chloramphenicol 0 0.4 0.4 0 0.3
Furazolidone 0.3 0 0 0 0
Nalidixic acid 0 2.2 1.2 0 2.2
Neomycin 0.3 2.2 0 0 0.3
Streptomycin 2.4 4 1.6 0 0.3
Sulphonamide compounds 0.7 0 0 0 0.3
Tetracycline 0.3 0.4 0.4 0 0.3
Trimethoprim/sulfamethoxazole 0.7 0 0 0 0
4.3.6.5 Salmonella Typhimurium
Eight definitive or undefined types were most frequent (445 of 504 isolates) and were examined for
susceptibility (Figure 4.18). The proportion of S. Typhimurium sensitive to the 16 antibiotics
included in the panel rose considerably in 2018 (54.4%, compared with 34.2% in 2017). This is
likely to be related to an increase in S. Typhimurium isolation from sheep, in particular of an RDNC
('Reacts Does Not Conform') strain that is sensitive to the panel of antibiotics.
Figure 4.18: Percentage of fully susceptible isolates of S. Typhimurium (and number tested) of
eight most frequent definitive or undefined types subjected to susceptibility testing at APHA; 2018
n=47 n=28
n=34
n=13n=201
n=40 n=39
n=43
0
10
20
30
40
50
60
70
80
90
100
DT104 DT12 DT193 DT2 RDNC U288 U302 UNTY
Iso
late
s s
uscep
tib
le t
o
all 1
6 a
nti
bio
tics (
%)
Phage type
83
Chapter 4 Clinical Surveillance
Figure 4.19 (and Table S4.8.8 of the supplementary material) present an overview of percentage
of resistance in S. Typhimurium to the antibiotics tested in 2016–2018. The generally high level of
resistance of S. Typhimurium isolates observed in recent years has partly been a reflection of the
contribution of DT104 and its variants DT104B and U302 which have comprised more than a
quarter of isolates in some years in the previous decade. Only one of 47 DT104 isolates was
sensitive to all of the antibiotics tested in 2018. All remaining DT104 and 37/39 U302 isolates were
resistant to at least one of the 16 antibiotics (there were no isolates of DT104B recovered in 2018).
The proportion of S. Typhimurium isolates comprising DT104 and its variants, which had shown a
general decline in 2007–2014, has shown a recent resurgence. The resurgence of pentavalent
(AmCSSuT) S. Typhimurium DT104 continued in 2018. The typical pentavalent resistance pattern
was the most common resistance pattern seen in S. Typhimurium DT104 isolates, occurring in
82.9% of isolates. This was mainly due to an increased number of incidents of this clone in cattle
and sheep from 2017.
Figure 4.19: Salmonella Typhimurium: percentage of resistant isolates in 2016 (; n=166), 2017
(; n=187) and 2018 (; n=504)
^ HP-CIA; * no data available for 2016 and 2017
None of the 47 DT104 isolates were resistant to nalidixic acid or trimethoprim/sulphamethoxazole.
No isolates of DT104 were recovered from turkeys in 2012 to 2018. DT104 isolates from turkeys,
when detected, have commonly shown nalidixic acid resistance in previous years.
Salmonella Typhimurium U288 and DT193 from pigs accounted for 7.3% and 4.2% of the total
numbers of S. Typhimurium isolates respectively; only one of the U288 and DT193 isolates from
pigs was fully susceptible in 2018.
Considering all definitive types of S. Typhimurium, resistance to trimethoprim/sulphamethoxazole
has fluctuated markedly in recent years (between 27% and 45%). It has been predominantly
0
10
20
30
40
50
60
70
80
90
100
Resis
tan
t is
ola
tes (
%)
84
Chapter 4 Clinical Surveillance
isolates from pigs that have accounted for these fluctuations. A high proportion of many definitive
types of S. Typhimurium isolated from pigs are resistant to trimethoprim/sulfamethoxazole. The
definitive and undefined phage types of S. Typhimurium resistant to trimethoprim/
sulfamethoxazole and recovered from pigs in 2018 included contributions primarily from isolates of
two phage types DT193 and U288. AmCSSuTTm was the most common resistance pattern
observed in both DT193 isolates (14 isolates) and U288 isolates (22 isolates) from pigs.
After a peak in apramycin resistance in S. Typhimurium in 2011 and 2012, resistance fluctuated
between 0–2%.
One S. Typhimurium isolate from a dog was resistant to ciprofloxacin in 2018, whilst no amikacin
resistant isolates were recovered in 2018. No isolates were resistant to ceftazidime and
cefotaxime. One isolate from a cat and one from a dog were resistant to nalidixic acid.
4.3.6.6 Monophasic Salmonella Serotypes
Eighty-eight isolates of Salmonella 4,12:i:- were tested, belonging to definitive phage types DT120
(n=7), DT193 (n=70), DT2 (n=2), DT32 (n=1) and undefined phage type U311 (n=1); seven
isolates were not typable. Most isolates were from pigs (52.3%) with feed and related samples
being the next most common source of origin (12.5%). The most common pattern of resistance
observed was AmSSuT, which occurred in 36/70 of DT193 isolates, in 2/7 DT120 isolates, 1/1
U311 isolates and in 1/7 of the isolates which were not typable with phages. Considering the
DT193 isolates, 51/70 had the AmSSuT resistance pattern alone or with one or more additional
resistances.
A total of 79 isolates of Salmonella 4,5,12:i:- were tested, including phage types DT193 (n=72),
DT12 (n=1) and U311 (n=2); four isolates were untypable. The most common resistance pattern in
DT193 isolates was AmSSuT, occurring in 52.8% of isolates. Most isolates of monophasic
Salmonella 4,5,12:i:- DT193 were from pigs (48.1%).
For aminoglycosides other than streptomycin, apramycin resistance was detected in 19.6% and
neomycin resistance in 17.4% of 4,12:i:- from pigs (n=46). Apramycin resistance was detected in
31.6% and neomycin resistance in 26.3% of 4,5,12:i:- from pigs (n=38). Resistance to apramycin
was also observed in 6.7% of 4,5,12:i:- isolates from feed or feed constituents (n=15). Resistance
to the aminoglycosides apramycin and neomycin was therefore detected in monophasic
S. Typhimurium isolates from both pigs and feed in 2018. In 2017, neomycin resistance was
detected in 4,5,12:i:- isolates from feed, and it was detected in both 4,12:i:- and 4,5,12:i:- isolates
from pigs.
4.3.6.7 Salmonella other than Dublin or Typhimurium
Of the 3,589 isolates of serotypes other than S. Dublin and S. Typhimurium tested, 77.7% were
sensitive to all the antibiotics in the panel, an increase on the figure recorded in 2017, when 71.2%
were fully sensitive (Figure 4.20). Forty-eight isolates (1.3% of the total) were S. Enteritidis, of
which 44 (91.7%) were fully susceptible. Two isolates, a phage type 13a from feed and a PT8 from
a snake, were resistant to nalidixic acid.
Neomycin resistant Salmonella isolates originated mainly from chicken (1,630 isolates; 1.1%
resistant) pigs (123 isolates; 14.6% resistant), feed or feed constituents (826 isolates; 1.1%
resistant), and ducks (336 isolates; 3.9% resistant). In ducks, S. Indiana was the main serotype
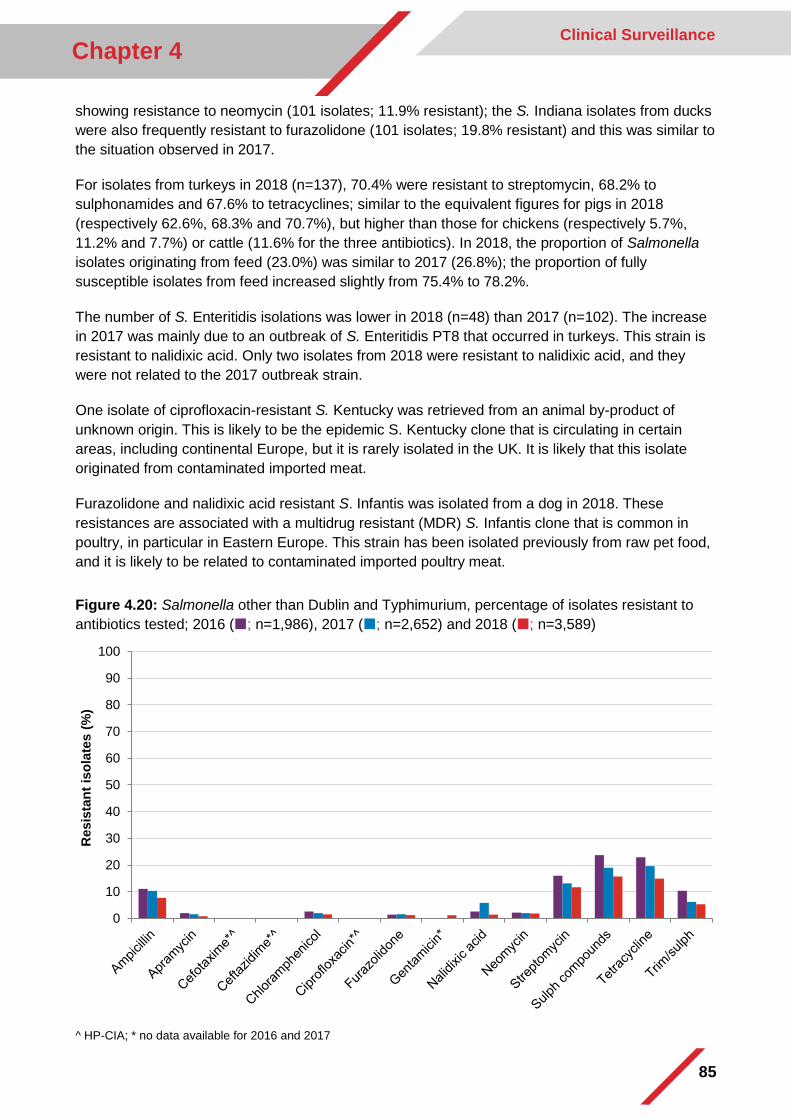
85
Chapter 4 Clinical Surveillance
showing resistance to neomycin (101 isolates; 11.9% resistant); the S. Indiana isolates from ducks
were also frequently resistant to furazolidone (101 isolates; 19.8% resistant) and this was similar to
the situation observed in 2017.
For isolates from turkeys in 2018 (n=137), 70.4% were resistant to streptomycin, 68.2% to
sulphonamides and 67.6% to tetracyclines; similar to the equivalent figures for pigs in 2018
(respectively 62.6%, 68.3% and 70.7%), but higher than those for chickens (respectively 5.7%,
11.2% and 7.7%) or cattle (11.6% for the three antibiotics). In 2018, the proportion of Salmonella
isolates originating from feed (23.0%) was similar to 2017 (26.8%); the proportion of fully
susceptible isolates from feed increased slightly from 75.4% to 78.2%.
The number of S. Enteritidis isolations was lower in 2018 (n=48) than 2017 (n=102). The increase
in 2017 was mainly due to an outbreak of S. Enteritidis PT8 that occurred in turkeys. This strain is
resistant to nalidixic acid. Only two isolates from 2018 were resistant to nalidixic acid, and they
were not related to the 2017 outbreak strain.
One isolate of ciprofloxacin-resistant S. Kentucky was retrieved from an animal by-product of
unknown origin. This is likely to be the epidemic S. Kentucky clone that is circulating in certain
areas, including continental Europe, but it is rarely isolated in the UK. It is likely that this isolate
originated from contaminated imported meat.
Furazolidone and nalidixic acid resistant S. Infantis was isolated from a dog in 2018. These
resistances are associated with a multidrug resistant (MDR) S. Infantis clone that is common in
poultry, in particular in Eastern Europe. This strain has been isolated previously from raw pet food,
and it is likely to be related to contaminated imported poultry meat.
Figure 4.20: Salmonella other than Dublin and Typhimurium, percentage of isolates resistant to
antibiotics tested; 2016 (; n=1,986), 2017 (; n=2,652) and 2018 (; n=3,589)
^ HP-CIA; * no data available for 2016 and 2017
0
10
20
30
40
50
60
70
80
90
100
Resis
tan
t is
ola
tes (
%)
86
References
Anjum, M. F., Duggett, N. A., Abuoun, M., et al. (2016). Colistin resistance in Salmonella and Escherichia coli isolates from a pig farm in Great Britain. Journal of Antimicrobial Chemotherapy 71(8): 2306-13.
Department of Health and Social Care & Department for Environment Food & Rural Affairs (2013). UK Five Year Antimicrobial Resistance Strategy 2013 to 2018. Available from: https://assets.publishing.service.gov.uk/government/uploads/system/uploads/attachment_data/file/244058/20130902_UK_5_year_AMR_strategy.pdf.
Duggett, N. A., Sayers, E., Abuoun, M., et al. (2017). Occurrence and characterization of mcr-1-harbouring Escherichia coli isolated from pigs in Great Britain from 2013 to 2015. Journal of Antimicrobial Chemotherapy 72(3): 691-5.
Duinhof, T. F., Dierikx, C. M., Koene, M. G. J., et al. (2008). Multiresistentie bij Brachyspira hyodysenteriae - isolaten op een varkensvermeerderingsbedrijf in Nederland. Tijdschrift voor Diergeneeskunde 133(14-15): 604-8.
European Centre for Disease Prevention and Control, European Food Safety Authority Panel on Biological Hazards & European Medicines Agency Committee for Medicinal Products for Veterinary Use (2017). ECDC, EFSA and EMA Joint Scientific Opinion on a list of outcome indicators as regards surveillance of antimicrobial resistance and antimicrobial consumption in humans and food-producing animals. EFSA Journal 15(10): 5017.
European Commission (2003). Regulation (EC) No 2160/2003 of the European Parliament and of the Council of 17 November 2003 on the control of salmonella and other specified food-borne zoonotic agents. Official Journal of the European Union 46(L325).
European Commission (2005). COMMISSION REGULATION (EC) No 2073/2005 of 15 November 2005 on microbiological criteria for foodstuffs. Official Journal of the European Union 48(L338).
European Commission (2013). Commission Implementing Decision of 12 November 2013 on the monitoring and reporting of antimicrobial resistance in zoonotic and commensal bacteria (2013/652/EU). Official Journal of the European Union, 56(L303).
European Food Safety Authority, Aerts, M., Battisti, A., et al. (2019a). Technical specifications on harmonised monitoring of antimicrobial resistance in zoonotic and indicator bacteria from food‐producing animals and food. EFSA Journal 17(6): e5709.
European Food Safety Authority, Beloeil, P.-A., Guerra, B., et al. (2019b). Manual for reporting on antimicrobial resistance within the framework of Directive 2003/99/EC and Decision 2013/652/EU for information derived from the year 2018. EFSA Supporting publication doi:10.2903/sp.efsa.2019.EN-1559(26).
European Medicines Agency (2011). European Surveillance of Veterinary Antimicrobial Consumption. Trends in the sales of veterinary antimicrobial agents in nine European countries (2005-2009). (EMA/238630/2011) Available from: https://www.ema.europa.eu/veterinary-regulatory/overview/antimicrobial-resistance/european-surveillance-veterinary-antimicrobial-consumption-esvac.
European Medicines Agency (2018). European Surveillance of Veterinary Antimicrobial Consumption. Sales of veterinary antimicrobial agents in 30 European countries in 2016. (EMA/184855/2017) Available from: https://www.ema.europa.eu/documents/report/sales-
87
veterinary-antimicrobial-agents-30-european-countries-2016-trends-2010-2016-eighth-esvac_en.pdf.
Garcia-Alvarez, L., Holden, M. T., Lindsay, H., et al. (2011). Meticillin-resistant Staphylococcus aureus with a novel mecA homologue in human and bovine populations in the UK and Denmark: a descriptive study. The Lancet Infectious Diseases 11(8): 595-603.
Haenni, M., Galofaro, L., Ythier, M., et al. (2010). Penicillin-binding protein gene alterations in Streptococcus uberis isolates presenting decreased susceptibility to penicillin. Antimicrobial Agents and Chemotherapy 54(3): 1140-5.
Leman, A. D., Straw, B., Glock, R. D., et al. (1986). Diseases of Swine, Ames, Iowa, USA, Iowa State University Press.
Responsible Use of Medicines in Agriculture Alliance (2017). Targets Task Force Report 2017. Available from: https://www.ruma.org.uk/wp-content/uploads/2017/10/RUMA-Targets-Task-Force-Report-2017-FINAL.pdf.
Rønne, H. & Szancer, J. (1990). In vitro susceptibility of Danish field isolates of Treponema hyodysenteriae to chemotherapeutics in swine dysentery (SD) therapy. Interpretation of MIC results based on the pharmacokinetic properties of the antibacterial agents. Proceedings of the 11th IPVS Congress, July 1 to 5, Lausanne, Switzerland, p. 126.
Vanderhaeghen, W., Cerpentier, T., Adriaensen, C., et al. (2010). Methicillin-resistant Staphylococcus aureus (MRSA) ST398 associated with clinical and subclinical mastitis in Belgian cows. Veterinary Microbiology 144(1-2): 166-71.
World Health Organization (2018) WHO Collaborating Centre for Drug Statistics Methodology - ATCvet Index 2018. https://www.whocc.no/atcvet/atcvet_index/.
88
Annexes
Annex A: List of figures
Figure 1.1: Total quantity of antibiotic active ingredient (tonnes) sold in the UK per year using
ESVAC methodology; 2005–2018 ................................................................................................. 14
Figure 1.2: Active ingredient (mg/kg) of antibiotics sold licenced for use in food-producing animal
species; 2014–2018 ...................................................................................................................... 14
Figure 1.3: Active ingredient (% of total sales) of antibiotics sold for all animal species by route of
administration; 2018 ...................................................................................................................... 15
Figure 1.4: Distribution of sales (tonnes) of HP-CIAs for all animal species by the major
administration routes (injectables, oral/water, intramammaries, tablets): (a) 3rd and 4th generation
cephalosporins and (b) fluoroquinolones; 2018 ............................................................................. 16
Figure 1.5: Sales of dry and lactating cow intramammary products (courses per dairy cow); 2014–
2018.............................................................................................................................................. 16
Figure 1.6: Active ingredient (% weight) of antibiotics sold for all animal species by antibiotic class;
2018.............................................................................................................................................. 18
Figure 1.7: Active ingredient (mg/kg) of antibiotics by antibiotic class and HP-CIAs, sold for food-
producing animal species; 2014–2018 .......................................................................................... 21
Figure 1.8: Active ingredient (% weight) of antibiotics sold for dogs and cats combined by antibiotic
class; 2018.................................................................................................................................... 23
Figure 1.9: Active ingredient (mg/kg) of antibiotics sold for use in dogs and cats; 2014–2018...... 24
Figure 1.10: Active ingredient (mg/kg) of HP-CIAs, sold for dogs and cats combined:
fluoroquinolones and 3rd and 4th generation cephalosporins; 2014–2018 ...................................... 24
Figure 1.11: EU harmonised primary (total sales of veterinary antibiotics in mg/kg and secondary
(sales in mg/kg for 3rd and 4th generation cephalosporins, quinolones and polymyxins) outcome
indicators for antibiotic consumption in food-producing animal species in the UK; 2014–2018 ...... 25
Figure 2.1: HP-CIA usage recorded for active ingredient (mg/kg) of antibiotics in eMB Pigs:
colistin, 3rd and 4th generation cephalosporins and fluoroquinolones; 2015–2018 ......................... 29
Figure 2.2: Antibiotic active ingredients by class (%) reported in eMB Pigs; 2018 ........................ 30
Figure 2.3: Active ingredient (tonnes) of antibiotics used by all members of BPC Antibiotic
Stewardship; 2014–2018 .............................................................................................................. 31
Figure 2.4: Active ingredient (mg/kg) of antibiotics used by all members of BPC Antibiotic
Stewardship by species (chicken, turkey and duck); 2014, 2015, 2016, 2017 and 2018 ............... 32
89
Figure 2.5: Antibiotic active ingredient by class (%) used by members of BPC Antibiotic
Stewardship; 2018 ........................................................................................................................ 33
Figure 2.6: Antibiotic bird days by class (%) used by members of the BEIC Lion Scheme; 2018 . 34
Figure 2.7: Antibiotic active ingredient by class (%) used by the gamebird industry; 2018 ........... 35
Figure 2.8: Antibiotic active ingredient by class (%) used by the dairy farms in the FarmVet
Systems sample; 2018 .................................................................................................................. 37
Figure 2.9: Antibiotic active ingredient by class (%) used by the beef farms in the FarmVet
Systems sample; 2018 .................................................................................................................. 39
Figure 3.1: Percentage resistance (interpreted using EUCAST CBPs) in E. coli isolates from
broilers at slaughter; 2014 (n=159), 2016 (n=190) and 2018 (n=183) ........................................... 48
Figure 3.2: Percentage resistance (interpreted using EUCAST CBPs) in E. coli isolates from
healthy turkeys at slaughter; 2014 (n=168), 2016 (n=224) and 2018 (n=176) ............................... 49
Figure 3.3: Percentage resistance (interpreted using EUCAST CBPs) in Salmonella isolates from
broiler flock NCP samples; 2014 (n=168), 2016 (n=170) and 2018 (n=171) .................................. 52
Figure 3.4: Percentage resistance (interpreted using EUCAST CBPs) in Salmonella isolates from
layer flock NCP samples; 2014 (n=58), 2016 (n=34) and 2018 (n=52) .......................................... 53
Figure 3.5: Percentage resistance (interpreted using EUCAST CBPs) in Salmonella isolates from
turkey flock NCP samples; 2014 (n=162), 2016 (n=169) and 2018 (n=170) .................................. 54
Figure 3.6: Percentage resistance (interpreted using EUCAST CBPs) in C. jejuni isolates from
broilers at slaughter; 2014 (n=165), 2016 (n=180) and 2018 (n=171) ........................................... 55
Figure 3.7: Percentage resistance (interpreted using EUCAST CBPs) in C. jejuni isolates from
turkeys at slaughter; 2014 (n=157), 2016 (n=190) and 2018 (n=174) ............................................ 56
Figure 3.8: Harmonised AMR outcome indicators; 2014/15, 2015/16, 2016/17 and 2017/18 ....... 57
Figure 4.1: Number of isolates tested and percentage of resistant isolates of Escherichia coli from
mastitis infections of cattle in England and Wales; 2016–2018 ..................................................... 62
Figure 4.2: Number of isolates tested and percentage of resistant isolates of Streptococcus
dysgalactiae from mastitis infections of cattle; 2016–2018 ............................................................ 63
Figure 4.3: Number of isolates tested and percentage of resistant isolates of Streptococcus uberis
from mastitis infections of cattle; 2016–2018 ................................................................................. 64
Figure 4.4: Number of isolates tested and percentage of resistant isolates of Staphylococcus
aureus from mastitis infections in cattle; 2016–2018 ..................................................................... 65
Figure 4.5: Number of isolates tested and percentage of resistant isolates of Pasteurella multocida
isolates from respiratory infections of cattle; 2016–2018 ............................................................... 66
90
Figure 4.6: Number of isolates tested and percentage of resistant isolates of Pasteurella multocida
from respiratory infections of pigs; 2016–2018 .............................................................................. 67
Figure 4.7: Number of isolates tested and percentage of resistant isolates of Mannheimia
haemolytica from respiratory infections of cattle; 2016–2018 ........................................................ 68
Figure 4.8: Number of isolates tested and percentage of resistant isolates of Streptococcus suis
from pigs; 2016–2018 ................................................................................................................... 70
Figure 4.9: Number of isolates tested and percentage of resistant isolates of Escherichia coli from
cattle (all ages); 2016–2018 .......................................................................................................... 74
Figure 4.10: Number of isolates tested and percentage of resistant isolates of Escherichia coli
from cattle (by age category); 2018 ............................................................................................... 74
Figure 4.11: Number of isolates tested and percentage of resistant isolates of Escherichia coli
from pigs (all ages); 2016–2018 .................................................................................................... 75
Figure 4.12: Number of isolates tested and percentage of resistant isolates of Escherichia coli
from pigs by age category; 2018 ................................................................................................... 76
Figure 4.13: Number of isolates tested and percentage of resistant isolates of Escherichia coli
from sheep (all ages); 2016–2018 ................................................................................................. 77
Figure 4.14: Number of isolates tested and percentage of resistant isolates of Escherichia coli
from sheep (by age category); 2018 ............................................................................................. 77
Figure 4.15: Number of isolates tested and percentage of resistant isolates of Escherichia coli
from chickens; 2016–2018 ............................................................................................................ 78
Figure 4.16: Percentage of Salmonella spp. isolates susceptible to all tested antibiotics, from
different sources and animal species; in 2016, 2017 and 2018 ..................................................... 79
Figure 4.17: Top ten most commonly isolated Salmonella serovars from livestock in Great Britain
in 2018, with corresponding data for previous years ..................................................................... 81
Figure 4.18: Percentage of fully susceptible isolates of S. Typhimurium (and number tested) of
eight most frequent definitive or undefined types subjected to susceptibility testing at APHA; 2018
..................................................................................................................................................... 82
Figure 4.19: Salmonella Typhimurium: percentage of resistant isolates in 2016 (n=166), 2017
(n=187) and 2018 (n=504) ............................................................................................................ 83
Figure 4.20: Salmonella other than Dublin and Typhimurium, percentage of isolates resistant to
antibiotics tested; 2016 (n=1,986), 2017 (n=2,652) and 2018 (n=3,589) ....................................... 85
91
Annex B: List of tables
Table 1.1: Active ingredient (tonnes) of antibiotic sold for all animal species by route of
administration; 2014–2018 ............................................................................................................ 15
Table 1.2: Active ingredient (tonnes and % of total sales) of antibiotics sold for the animal species
category indicated; 2014–2018 ..................................................................................................... 17
Table 1.3: Active ingredient (tonnes or kg) of antibiotics sold for all animal species by antibiotic
class; 2014–2018 .......................................................................................................................... 19
Table 1.4: Tonnes of antibiotic class sold for each animal species category (% bars of total tonnes
for each category); 2018 ............................................................................................................... 20
Table 1.5: Active ingredient (tonnes or kg) of antibiotics by antibiotic class sold for use in dogs and
cats; 2014–2018 ........................................................................................................................... 22
Table 2.1: Usage recorded for active ingredient (mg/kg) of antibiotics in eMB Pigs by antibiotic
class; 2015–2018 .......................................................................................................................... 29
Table 2.2: HP-CIA usage (active ingredient of antibiotics, mg/kg) recorded in eMB Pigs; 2015–18
..................................................................................................................................................... 30
Table 2.3: Active ingredient (tonnes) of antibiotics used by all members of BPC Antibiotic
Stewardship by antibiotic class; 2014–2018 .................................................................................. 32
Table 2.4: Active ingredient (bird days and %) of antibiotics used by members of the BEIC Lion
Code; 2016–2018 ......................................................................................................................... 34
Table 2.5: Active ingredient (tonnes) of antibiotics used by the gamebird industry, recorded by
GFA; 2016–2018........................................................................................................................... 35
Table 2.6: Comparison of national coverage of adult dairy cows (over 2 years of age) included in
the FarmVet Systems sample; 2017–2018 ................................................................................... 36
Table 2.7: Active ingredient (mg/kg) of antibiotics used by the dairy farms in the FarmVet Systems
sample; 2015–2018 ...................................................................................................................... 37
Table 2.8: Comparison of national coverage of the beef Population Correction Unit (PCU) included
in the FarmVet Systems sample; 2018 and % farms excluded due to the presence of sheep ....... 38
Table 2.9: Active ingredient (mg/kg) of antibiotics used by the beef farms in the FarmVet Systems
sample; 2018 ................................................................................................................................ 38
Table 2.10: Total antibiotic usage and use of HP-CIAs (mg/kg) in a subset of 2,350 beef farms in
the FarmVet Systems sample; 2015–2018 ................................................................................... 39
Table 2.11: Sales (mg/kg) of injectable HP-CIAs with a licenced indication for cattle and of
intramammary tubes (course doses, DCDvet), using methodology defined by ESVAC; 2015–2018
..................................................................................................................................................... 40
92
Table 2.12: Active ingredient (mg/kg) of antibiotics used on Scottish salmon farms; 2017–2018 .. 41
Table 2.13: Active ingredient (mg/kg) of antibiotics used on a sample of trout farms; 2017–2018 42
Table 3.1: Phenotype in ESBL-/AmpC-producing E. coli cultured on selective agars, from caecal
samples from healthy broilers at slaughter in the UK; 2016 (n=382) and 2018 (n=302) ................ 50
Table 3.2: Phenotype in ESBL-/AmpC-producing E. coli cultured on selective agars, from caecal
samples from healthy fattening turkeys at slaughter in the UK; 2016 (n=362) and 2018 (n=373) .. 51
Table 4.1: Findings of LA-MRSA in the UK by government laboratories; 2013–2018 ................... 71
Table 4.2: Number of resistant and number of tested (% resistant) Escherichia coli isolates from
cattle, pigs, sheep, broilers and turkeys (all ages, combined); 2016–2018 .................................... 73
Table 4.3: Resistance in Salmonella Dublin: percentage of resistant isolates; 2014–2018 ........... 82
93
Annex C: Data background and limitations
Antibiotic sales data
▪ Sales data do not permit accurate analysis of antibiotic consumption by animal species or
production category. Some formulations of antibiotics are authorised with indications for
use in more than one species, e.g. pigs and poultry. It is not possible to ascertain from
sales data in which species the product was used.
▪ A given quantity of antibiotic may represent many doses in small animals or few doses in
large animals. It is not possible to predict the number of doses represented by the quantity
sold.
▪ Changes in quantities of veterinary antibiotics sold should be considered in parallel with
changes in the UK animal population over the corresponding time period. The populations
of animal species are an important denominator and may vary quite markedly from year to
year depending on market conditions for animal derived food. Similarly variations in the size
of the animals being treated should be taken into consideration as larger animals will
require a larger relative quantity of antibiotics over a treatment period.
▪ To try and address the variation in animal populations and demographics, over time and
between countries, the ESVAC project has developed a Population Correction Unit (PCU),
a calculation that estimates the weight of the animal (or group of animals) receiving an
antibiotic at the most likely time of administration. This unit is now used across EU Member
States and is currently the best approximation of consumption. We have used this form of
analysis in this report.
▪ Sales data in general over-estimate use, as not all antibiotics sold will be used. There is
natural wastage resulting from pack sizes that do not meet dose need, and from drug
expiry. In addition, a product could be sold one year and used, for example, the next year.
▪ Some products may be sold to UK feed mills for inclusion in feed which is then exported
outside of the UK; currently there is no method for separating these sales from the total UK
sales data, resulting in an over-estimate of use in UK feed.
▪ Some products may be imported into the UK on a Special Import Certificate; currently there
is no method for including these data in the total UK sales data, resulting in an under-
estimate of use in the UK.
▪ Medication sold for use in humans may be used in animals under certain circumstances,
according to the prescribing Cascade; figures on such use are not included in the data
presented. Further information on Cascade prescribing can be found in section S1.4 of the
supplementary material.
Resistance data, EU AMR harmonised monitoring scheme
▪ The sampling size and strategy are designed to provide a sample which is representative of
the wider population for each combination of bacteria and animal species.
▪ The organisms for which the legislation outlines monitoring provisions, such as Salmonella
spp. and E. coli, are of direct relevance to human health. Additionally, the panel of
antibiotics against which these organisms must be tested has been selected based on
relevance to human health and includes antibiotics, such as 3rd and 4th generation
cephalosporins and fluoroquinolones that are defined by the World Health Organization
(WHO) as the HP-CIAs.
▪ The legislation and accompanying technical specifications provide a standardised and
harmonised sampling methodology which produce comparable and robust susceptibility
94
data for a representative proportion of food-producing animals and food products across
the EU. However, animal species are monitored on alternating years, therefore not
providing annual data.
▪ The legislation provides a harmonised set (EUCAST) of epidemiological cut-off values
(ECOFFs) and human clinical break points (CBPs) to interpret susceptibility to antibiotics.
This will enable the comparison of animal resistance data with similar data generated for
human health, both within the UK and across the EU. Minimum inhibitory concentrations
(MICs) are also recorded and will enable any future changes in ECOFFs or CBPs to be
taken into account.
▪ It should be noted that when using selective culture methods, the occurrence of ESBL-,
AmpC- or carbapenemase-producing E. coli is assessed with much greater sensitivity than
when using non-selective culture methods. The difference is most likely explained by the
fact that the population of ESBL-, AmpC- or carbapenemase-producing E. coli may be a
minority among the E. coli populations in the gut flora of these food-producing animals, so
the probability of randomly picking a resistance phenotype from a non-selective agar plate
is low for most samples tested. Therefore, these selective methods are not able to quantify
the risk which these bacteria may potentially pose to human or animal health. Selective
methods are used to detect low numbers of resistant E. coli which may be present as a
minor component of the total flora.
Resistance data, clinical surveillance
There are a number of limitations associated with the antibiotic resistance data and they should be
borne in mind when interpreting results from the veterinary clinical surveillance programme. This is
a biased population and cannot be considered to accurately reflect the bacterial populations
present within the general animal population in the UK:
▪ Veterinary surgeons have the option to submit samples to private laboratories rather than
Government laboratories/Veterinary Investigation Centres. The proportion of samples that
Government laboratories test compared to other laboratories is not known, and therefore
we cannot know how representative the samples processed by APHA, SRUC Veterinary
Services and AFBI are of total diagnostic submissions.
▪ Furthermore, geographical proximity of a farm or veterinary practice to a Government
diagnostic laboratory may have an impact on the submission rate of samples; clinical
surveillance may therefore, naturally, over-represent the animal populations within certain
geographical areas.
▪ Other factors can also influence the submission rate of samples to veterinary diagnostic
laboratories. These can include for example the severity of disease, impact on production
or the value of the animals involved.
▪ The surveillance performed on chickens includes a range of types of bird (layers, broilers,
breeders and others) as well as both commercial and backyard flocks. The occurrence of
resistance can be influenced by a number of factors, including the types of chickens
examined, degree of epidemic spread of certain bacterial clones that may be resistant, the
emergence, dissemination and transfer of resistance determinants between and amongst
bacteria as well as by the selective pressure exerted by the use of antibiotics.
▪ The levels of resistance demonstrated by the clinical surveillance isolates presented in this
report may be higher than those seen in the wider bacterial populations present within
animals in England and Wales. This is because samples from diseased animals may be
95
submitted from animals that have been unresponsive to initial antibiotic therapy, and thus
the isolates recovered may have already been exposed to antibiotic pressure(s).
▪ Isolates from companion animals which are submitted to APHA, are only investigated for
antibiotic resistance if there is a public health concern. Therefore, bacteria from these
animal groups are under‐represented in this report. APHA does not provide a veterinary
diagnostic service for companion animals.
▪ The veterinary clinical surveillance data detail the number of bacterial isolates that
underwent sensitivity testing, but not the numbers of animals for which samples were
submitted for examination. Several bacteria may have been cultured from an individual
animal or from a group of animals on the same farm. This type of clustering is not
accounted for in the report, though since only low numbers of bacteria are usually
subjected to susceptibility testing from the same outbreak of disease, its importance is
probably limited.
▪ The diagnostic tests performed on any sample received through the clinical surveillance
programme are dependent on the individual case; i.e. isolates of the same bacterial species
are not always tested against the same panel of antibiotics. Therefore, if resistance is not
detected in one isolate, it may not mean that resistance is not present, but that it was not
tested for. This is especially true of commensal organisms.
▪ Criteria for the susceptibility testing of some veterinary pathogens are not well-established;
this document presents the data which have been collected and acknowledges their
limitations and shortcomings. Resistances of particular importance or significance are
wherever possible subject to confirmatory testing. The disc diffusion test can be regarded
as a screening test, enabling the rapid testing of large numbers of isolates in a cost-
effective way and providing a timely result for veterinarians which can assist them in the
selection of antimicrobial chemotherapy.
▪ The breakpoints used for determining resistance for isolates recovered under the veterinary
clinical surveillance programme in GB are those recommended by BSAC. These
breakpoints were originally determined for human medicine and their use in veterinary
medicine is based on the assumption that the concentration of antibiotic at the site of
infection is approximately the same in animals as it is in humans. Currently it is not known if
this assumption is always correct, especially as different dosing regimens may be used in
different animals and pharmacokinetics may vary between species. Currently, there is
insufficient data available to apply animal species specific breakpoints to all organism/
antibiotic combinations where these are required.
▪ Different antibiotic susceptibility testing methodologies are used in England and Wales
(APHA), Scotland (SRUC Veterinary Services), and Northern Ireland (AFBI). APHA and
SRUC Veterinary Services use BSAC methodology to determine resistance/susceptibility
based on human clinical breakpoints, whilst AFBI use CLSI. In light of the different
methodologies and breakpoints used, the amalgamated results of UK wide
monitoring should be interpreted with caution.
▪ For antibiotic susceptibility testing done by APHA, in the case of some veterinary drug-bug
combinations a BSAC CBP value may not exist. In this case, APHA may have derived a
tentative or suggested breakpoint or the historical veterinary breakpoint (zone size cut‐off of
resistant: ≤13 mm) may have been used to define resistance. The breakpoints used are set
out in S4.1 of the supplementary material.
▪ E. coli isolates are not collected from routine samples from healthy livestock in Northern
Ireland. Only clinical cases submitted for post-mortem investigation of colibacillosis, or
similar diseases, will proceed to isolate pathogenic E. coli. AMR testing on E. coli isolates is
96
mainly performed if samples are coming from less than 2-week old calves and animals with
bovine mastitis.
▪ With regards to E. coli, each organisation in the UK sets their own criteria for testing AMR
in E. coli from clinically sick animals and these criteria are not uniform. This is pertinent to
highlight as the selection of isolates for susceptibility testing based on age or other criteria
can influence the result obtained. Bacterial isolates recovered from young animals can
often be more resistant than those from older animals and this relates to the fact that
antibiotics are in general more frequently administered to young animals than to older
animals.
97
Annex D: Sources for reporting of sales data
To enable calculation of sold quantities of active ingredient of antibiotics, data were supplied by:
Marketing Authorisation Holders (MAHs)
It is mandatory for Market Authorisation Holders of manufactured antibiotics to provide the
Veterinary Medicines Directorate with total annual sales data for each antibiotic product sold within
the UK. Data were collected, verified and analysed to calculate the total weight, in tonnes, of each
active ingredient sold for each antibiotic. Antibiotic sales data are collected as a proxy for antibiotic
use.
Periodic Safety Update Reports (PSURs)
Sales figures submitted by MAHs in PSURs, for the purpose of Pharmacovigilance, were used to
validate sales data published in this report. Where a PSUR had been returned to the VMD
Pharmacovigilance team in the 2018 calendar year, reported sales were compared to those
returned to the AMR team and any discrepancies were queried.
To enable calculation of the Population Correction Unit, data were supplied by:
Defra Statistics division
The live weights of animals slaughtered for food are calculated by Defra. The population numbers
of food-producing animals were supplied by Defra via the ‘Agriculture in the UK’ report.
CEFAS
The annual live weight of fish at slaughter for the UK was supplied by CEFAS (Centre for
Environment, Fisheries and Aquaculture Science).
TRACES
Import and export figures obtained from TRACES were provided by the European Surveillance of
Veterinary Antimicrobial Consumption (ESVAC) project and used in the calculation of the PCU.
98
Annex E: Glossary of terms
Active ingredient The part of an antibiotic medicine that acts against the bacterial
infection. Alternatively called ‘active substance’.
AMEG Antimicrobial Advice ad hoc Expert Group; AMEG is an ad hoc
group established by the European Medicines Agency jointly under
the Committee for Medicinal Products for Veterinary Use (CVMP)
and the Committee for Medicinal Products for Human Use
(CHMP). The AMEG was set up to provide guidance on the impact
on public health and animal health of the use of antibiotics in
animals, and on the measures to manage the possible risk to
humans.
ATCvet Anatomical Therapeutic Chemical classification system for
veterinary medicinal products
AHDB Agriculture and Horticulture Development Board
Antibiotic A large group of antibacterial substances capable of destroying or
inhibiting the growth of bacteria, used for treatment or prevention
of bacterial infections.
Antimicrobial Naturally occurring, semi-synthetic or synthetic substances that
exhibit antimicrobial activity (kill or inhibit the growth of micro-
organisms). Used for treatment or prevention of infections.
Antimicrobials include antibacterials (antibiotics), antivirals,
antifungals and antiprotozoals.
Antibiotic/antimicrobial
resistance
The ability of a bacterium/micro-organism to grow or survive in the
presence of an antibiotic at a concentration that is usually
sufficient to inhibit or kill bacteria/micro-organisms of the same
species.
BPC British Poultry Council
CBP Clinical Break Point: relates the laboratory results to the likelihood
of clinical treatment success or failure.
CHAWG Cattle Health and Welfare Group
Critically Important
Antibiotics
These are antibiotic classes, which are the sole or one of limited
available therapies, to treat serious bacterial infections in people
and are used to treat infections caused by bacteria that may be
transmitted to humans from non-human sources or, bacteria that
may acquire resistance genes from non-human sources (WHO
definition).
HP-CIAs Highest Priority Critically Important Antibiotics. In this report the
classification according to the AMEG has been used; therefore the
following classes of antibiotics are included under HP-CIAs:
fluoroquinolones; 3rd and 4th generation cephalosporins and
colistin.
99
Defra Department for Environment, Food and Rural Affairs
ECOFF Epidemiological cut-off value: represents the point at which
bacteria have developed a higher level of resistance to an
antibiotic than the background level of resistance that exists
naturally for that bacterial species. A ‘resistant’ (or ‘non-
susceptible’) ECOFF does not necessarily imply a level of
resistance which would correspond with clinical treatment failure.
EMA European Medicines Agency
ESVAC European Surveillance of Veterinary Antimicrobial Consumption
Food-producing animal
(species)
Animals used for food production including (but not limited to): cattle,
sheep, pigs, poultry, salmon, trout and bees.
Injectable product A product which is administered to animals via injection.
Intramammary product A product which is administered into the udder.
Medicated feeding
stuff
Feeding stuffs that contain a veterinary medicine and that are
intended for feeding to animals without further processing.
MIC Minimum Inhibitory Concentration: the lowest concentration of an
antibiotic that inhibits visible growth of a bacterium after overnight
incubation.
Non-food-producing
animal (species)
Animals not reared for food. These are mainly companion animals
including (but not limited to): dogs, cats, horses, small mammals,
rabbits and birds.
PHWC Pig Health and Welfare Council
Oral/water product A product that is administered to animals orally. In this report this
includes boluses, topdressings, powders, dissolvable powders,
solutions.
Population Correction
Unit (PCU)
This is a technical unit of measurement which is used to represent
the estimated weight at treatment of livestock and slaughtered
animals. It takes into account a country’s animal population over a
year, along with the estimated weight of each particular species at
the time of treatment with antibiotics. 1 PCU = 1 kg of different
categories of livestock and slaughtered animals.
Premix Veterinary medicinal products intended for incorporation into
medicated feeding stuffs.
Prodrug Ingredient that after administration is metabolized (i.e. converted
within the body) into the pharmacologically active drug.
PSUR Periodic Safety Update Report. Pharmacovigilance documents
submitted by marketing authorisation holders (MAHs) at defined time
points post-authorisation. These documents are intended to provide
100
a safety update resulting in an evaluation of impact of the reports on
the risk-benefit of a medicinal product.
TRACES The 'TRAde Control and Expert System' (TRACES) is the European
Commission’s online management tool for all sanitary requirements
on intra-EU trade and importation of animals, semen and embryo,
food, feed and plants.
VMD Veterinary Medicines Directorate, an Executive Agency of the
Department for Environment, Food and Rural Affairs (Defra).
WHO World Health Organization
101
Annex F: Contributors
Compiled by the Veterinary Medicines Directorate
Contributing Pharmaceutical Companies and Other Marketing Authorisation Holders
▪ Alfamed ▪ Industrial Veterinaria S.A.
▪ Alfasan Nederland B.V. ▪ Intervet Ltd,
▪ Andres Pintaluba S.A. ▪ Kela N.V.
▪ Animalcare Limited ▪ Kernfarm B.V.
▪ aniMedica GmbH ▪ Krka Dd
▪ Aniserve GmbH ▪ Laboratorios Calier S.A.
▪ Avimedical B.V. ▪ Laboratorios Hipra S.A.
▪ Bayer Plc ▪ Laboratorios Karizoo S.A.
▪ Bela-Pharm GmbH & Co. KG ▪ Laboratorios Maymo S.A.
▪ Bimeda Animal Health Ltd ▪ Laboratorios SYVA S.A.U
▪ Boehringer Ingelheim Animal Health Ltd ▪ Lavet Pharmaceuticals Ltd
▪ Ceva Animal Health Ltd ▪ Le Vet Beheer B.V.
▪ Chanelle Animal Health Ltd ▪ Livisto Int.’I.S.L
▪ Cross Vetpharm Group Ltd ▪ Merial Animal Health Ltd
▪ Dechra Ltd ▪ Nimrod Veterinary Products Ltd
▪ Divasa Farmavic S.A. ▪ Norbrook Laboratories Ltd
▪ Dopharma Research B.V. ▪ Oropharma N.V.
▪ ECO Animal Health ▪ Pharmanovo GmbH
▪ Ecuphar N.V. ▪ Pharmaq Ltd
▪ Eli Lilly & Company Ltd ▪ Pharmsure International Ltd
▪ Elanco Europe Ltd ▪ Phibro Animal Health S.A.
▪ Emdoka bvba ▪ Qalian Ltd
▪ Eurovet Animal Health B.V. ▪ Richter Pharma AG
▪ Fatro S.P.A. ▪ SP Veterinaria S.A.
▪ Forte Healthcare Ltd ▪ Univet Ltd
▪ Franklin Pharmaceuticals Ltd ▪ Vetcare Oy
▪ Global Vet Health S.L. ▪ Vétoquinol UK Ltd
▪ Harkers Ltd ▪ Vetpharma Animal Health S.L.
▪ HCS bvba ▪ Virbac S.A.
▪ Huvepharma N.V. ▪ VMD N.V.
▪ I.C.F. Sri Industria Chimica Fine ▪ Zoetis UK Ltd
Contributors of other statistics:
▪ Defra Statistics Branch Scottish Government
▪ Department of Agriculture and Rural Development, Northern Ireland
▪ Centre for Environment Fisheries and Aquaculture Science