ultimate capacity of steel angles subjected to eccentric
TRANSCRIPT

Ultimate Capacity of Steel Angles Subjected to
Eccentric Compressive Load
by
Iftesham Bashar
MASTER OF SCIENCE IN CIVIL ENGINEERING (STRUCTURAL)
Department of Civil Engineering
BANGLADESH UNIVERSITY OF ENGINEERING AND TECHNOLOGY
2012
Ultimate Capacity of Steel Angles Subjected to
Eccentric Compressive Load
by
Iftesham Bashar
A thesis submitted to the Department of Civil Engineering of Bangladesh University of
Engineering and Technology, Dhaka, in partial fulfillment of the requirements for the
degree of
MASTER OF SCIENCE IN CIVIL ENGINEERING (STRUCTURAL)
2012

The thesis titled “Ultimate Capacity of Steel Angles Subjected to Eccentric
Compressive Load” submitted by Iftesham Bashar, Student No. 100704337F, and
Session: October 2007 has been accepted as satisfactory in partial fulfillment of the
requirement for the degree of M.Sc. Engg. (Civil and Structural) on 25th
January, 2012.
BOARD OF EXAMINERS
______________________________________
Dr. Khan Mahmud Amanat Chairman
Professor (Supervisor)
Department of Civil Engineering, BUET,
Dhaka-1000
______________________________________
Dr. Md. Mujibur Rahman Member
Professor and Head (Ex-officio)
Department of Civil Engineering, BUET,
Dhaka-1000
______________________________________
Dr. A. M. M. Taufiqul Anwar Member
Professor
Department of Civil Engineering, BUET,
Dhaka-1000
_____________________________________
Dr. Mahbuba Begum Member
Associate Professor
Department of Civil Engineering, BUET,
Dhaka-1000
______________________________________
Dr. Alamgir Habib Member
Professor (Retd.) (External)
Department of Civil Enginerring, BUET,
Dhaka-1000
Apartment # 2A, House # 124, Road # 9A
Dhanmondi, Dhaka.

DECLARATION
It is declared that, except where specific references are made to other investigators, the
work embodied in this thesis paper is the result of investigation carried out only by the
author under the supervision of Dr. Khan Mahmud Amanat, Professor, Department of
Civil Engineering, BUET. Neither the thesis nor any part of it has been submitted to or
is being submitted elsewhere for any other purposes.
Iftesham Bashar
(Author)
i

Dedicated
to
My Parents
ii

iii
ACKNOWLEDGEMENTS
I would like to express my heartfelt gratitude to the Almighty Allah for each and
every achievement of my life.
I would like to express my sincerest regards to my thesis supervisor, Dr. Khan
Mahmud Amanat for his guidance and encouragement during the course of this
research and throughout my master’s education. I am greatly indebted to him for all
his adept guidance, affectionate assistance, and enthusiastic encouragement
throughout the progress of this thesis. It would have been impossible to carry out this
study without his dynamic direction and critical judgment of the progress.
I wish to express my deepest gratitude to the Department of Civil Engineering,
BUET, the Head of the Department of Civil Engineering and all the members of the
BPGS committee to give me such a great opportunity of doing my M.Sc. and this
contemporary research work on eccentrically loaded single steel angles. I would also
like to specially thank the members of the defense board for their time and patience.
I greatly acknowledge all my friends and staffs of the university for their assistance
and encouragement. Finally, I would like to thank my parents and my family
members, for their undying love, encouragement and support at all stages of my life.
I would like to convey my special thanks to my mother for her perpetual patience
caring my babies while I was busy in my research works. The achievement of this
goal would have been impossible without their blessings.

Table of Contents
Page
No.
Declaration i
Dedication ii
Acknowledgements iii
Abstract iv
Chapter 1 Introduction
1.1 General 1
1.2 Background and Research Significance 1
1.3 Objectives of the Present Study 3
1.4 Methodology of the Study 3
1.5 Organization of the Thesis 4
Chapter 2 Literature Review
2.1 Introduction 5
2.2 Ultimate Compressive Load Capacity of Structural Steel Members 5
2.3 Development of Column Buckling Theory 8
2.4 Eccentrically Loaded Column Buckling Theory 11
2.4.1 General 11
2.4.2 Development of Eccentrically Loaded Column Buckling
Theory
12
2.4.2.1 Theoretical Investigations 12
2.4.2.2 Experimental Investigations 14
2.4.2.3 Numerical Investigations 17
2.5 Experiment of Elgaaly et al (1991) 18
2.5.1 Test Procedure 20
2.5.2 Test Results (Elgaaly et al 1991) 20
2.6 Code Provisions to Determine Ultimate Compressive Load Capacity
of Structural Steel Angles
23
2.6.1 ASCE Standard 10-97: Design of Latticed Steel
Transmission Structures
23
2.6.2 AISC 2005 Specification 25
2.6.3 BS (8100) Formula (1999) 26
2.6.4 AASHTO Formula 29
2.6.5 IS Code Formula 29
2.6.6 CRC Formula 31
2.7 Example Calculation 32
2.8 Remarks 41
v

Chapter 3 Methodology for Finite Element Analysis
3.1 Introduction 43
3.2 Finite Element Modeling of the Truss System 43
3.2.1 Modeling Methodology 43
3.2.2 Material Properties 52
3.2.3 Loading and Boundary Conditions 53
3.2.3.1 Restraints 53
3.2.3.2 Loads 53
3.2.4 Meshing 53
3.2.5
3.2.6
Solution Method
Mesh Sensitivity
55
56
3.3 Typical Analysis Results 56
3.3.1 Typical Load-Deflection Behavior 56
3.3.2 Deflected Shapes 57
3.4 Validation of Finite Element Model 60
Chapter 4 Results and Discussions
4.1 Introduction 62
4.2 Principal Features of Present Analysis 62
4.3 Presentation of Results 63
4.3.1 Axial Force vs Lateral Displacement Response 63
4.3.2 Deformation Characteristics of the Target Angle 66
4.3.2.1 General 66
4.3.2.2 Initial Stage 67
4.3.2.3 Final Stage 68
4.3.3 Comparative Results 69
4.3.3.1
4.3.3.2
Typical Comparative Load vs Deflection Graphs
Correlation between Test and Present Study
69
72
4.3.3.2 Comparison with Codes and Discussions 75
4.4
4.5
Interpretation and Explanation of Observations
Remarks
80
84
Chapter 5 Conclusion
5.1 General 85
5.2 Findings 85
5.3 Scpoe for Future Investigation 86
References
87
Appendices
Appendix-A : Results for single bolted angles 91
Results for double bolted angles
92
vi

Appendix-B : Ultimate Capacity of Angles Using Code Formulas
Appendix-C : Comparative Results of Single Bolted Angles
Comparative Results of Double Bolted Angles
93
103
105
vii


ABSTRACT
Steel angles have a wide range of structural applications requiring a comprehensive
design methodology. Steel angles, although used universally, such as in lattice
microwave towers and transmission towers have not received a comparable attention
for various reasons. The behavior of angles is different to some extent from that of
other commonly used steel shapes because they are unsymmetric sections and are
usually attached to other members by one leg only resulting the load to be applied
eccentrically. Eccentrically loaded single steel angles are one of the most difficult
structural members to analyze and design. They are prone to failure modes that are
not usually associated with other steel shapes. The ultimate compressive load
carrying capacity of single steel angles subjected to eccentrically applied axial load
is investigated in this project as part of a three dimensional truss. In this thesis, a
previously conducted experimental study is simulated. A finite element study was
conducted to properly understand the complex load carrying behavior of single
angles. Account is taken of member eccentricity, local deformation as well as
material and geometric non-linearity. Results are then compared with experimental
records and with those found by means of internationally adopted standard codes. It
is demonstrated that the finite element model closely predicted the experimental
ultimate loads and the behavior of steel angles. Hence, finite element analysis of
structures composed of single angles may be an easy alternative to physical testing
of these structures. From the present study it has been observed that only the ASCE
Standard 10-97 predicts angle capacity to a reasonable extent when compared to
both FE analyses and experimental results. Generally, AISC, BS and IS Codes
underestimate the capacity while AASHTO and CRC Formulas overpredict the
capacity. It is therefore recommended that in the design of three-dimensional trusses
and lattice towers, the provisions of ASCE Standard 10-97 should be followed.
iv

Chapter 1
INTRODUCTION
1.1 GENERAL
Angles are one of the most important sections used in steel structures. Sometimes an
entire structure is composed of steel angle sections such as lattice towers used in
telecommunication and power transmission sectors. The lattice tower is analyzed and
designed assuming that each member is a two-force member of truss (which is
subjected to tension and compression only). But in practical cases, in latticed towers,
trusses, etc. many members are connected by one leg to carry compressive loads.
This loads the member in axial compression with end moments due to the eccentric
connection. The resulting problem is rather complex to be analyzed because of the
eccentricity of load with respect to both principal axes and the uncertain nature of the
end restraints which would render the problem of finding an effective length factor
difficult. There are different codes worldwide for the analysis and design of single
steel angles having different design provisions. Until today, the electrical towers
have been designed without considering the effect of eccentricity on the ultimate
load carrying capacity of single steel angles, which is a prime limitation for
designing safe towers. Hence, there is a significant scope to investigate this matter.
This investigation is expected to provide the design engineer some definite
guidelines and recommendations for designing suitably load resistant tower
structures.
1.2 BACKGROUND AND RESEARCH SIGNIFICANCE
Single angles are used as primary structural components and members. Their
analysis and design should be done properly to assure that inadequate single angles
do not result. The loading of single angle struts is typically eccentric, producing
flexure about a non-principal axis. Furthermore, analysis may be complicated by the
possibility of torsional or lateral buckling of the angle. Often the most difficult aspect

Introduction
2
of evaluation of column capacity for single angles is the determination of the
effective slenderness ratio. The effective length factor can often be evaluated or
estimated about the x and y axes of the angle. However, these are not the principal
axes for the angle, so the determination of the governing slenderness ratio is not
easy. The most common situation has the ends of the angles attached with one leg to
a chord stem or gusset plate. This connection generally produces a relatively rigid
rotational restraint in the plane of the attached leg. The perpendicular leg usually has
a small restraint due to the flexibility of the stem or gusset about the chord's axis.
Due to the difference in effective lengths about the two geometric axes, the radius of
gyration does no longer represent the critical value. Therefore, the design and
analysis of steel angles become very complex. Traditionally, various international
design practices on eccentrically loaded single angle struts differ from each other
very widely. The specifications that deal with general steel construction are found
very conservative in estimating the design strength of eccentrically loaded single-
angle members. On the other hand, the specifications and manuals that deal with
lattice transmission towers that predominantly use steel angle members are found to
be much less conservative. As for example, the slenderness ratios of eccentrically
loaded single angle struts are modified in ASCE Manual No. 52 (American Society
of Civil Engineers, 1988) to make use of the formulas applicable to concentrically
loaded struts; Canadian tower design practice CSA-S37 (Canadian Standards
Association, 1986) and British practice (British Standards Institution, 1985) is to
ignore the eccentricity and limit the strength of eccentrically loaded single angle
struts to a certain percentage of the strength of corresponding concentric axially
loaded struts (reported by Adluri and Madugula (1992)). More detailed provisions
have probably not been put into code form for several reasons - perceived lack of
importance and analysis complexity. There were some efforts in the previous works
of the researchers to provide experimental data in an area of steel research that
clearly needs the information to revise the existing design procedures. Although
angle members are seemingly simple structural shapes used in several kinds of
applications, their design is quite complicated and has not been resolved completely
to the satisfaction of design engineers. Part of the reason for this is the lack of
sufficient experimental data for angles in comparison with some of the other standard

Introduction
3
structural shapes, e.g., wide flange sections. It becomes therefore obvious to make a
formulation for predicting ultimate compressive load carrying capacity of the single
steel angles. Proper analysis and design of single angle struts can only be
accomplished with some effort which is required to find appropriate governing
provisions as well as applying them correctly.
1.3 OBJECTIVES OF THE PRESENT STUDY
The objective of the study is to investigate latticed structures composed of single
angles by means of numerical finite element analysis. Three dimensional finite
element study will be carried out to simulate previously done experimental works by
the researchers. Comparison of compressive load capacity of the single angles
obtained by finite element analysis, different code formulas and previous
experimental results shall be made. Attempt will be made to provide a guideline for
rational design of single angle structures.
1.4 METHODOLOGY OF THE STUDY
For the purpose of carrying out the investigation, the compressive load carrying
behavior of a number of equal leg single steel angle members have been studied
using finite element method as part of a three dimensional truss as was tested by
Elgaaly et al (1991). Both for single bolted and double bolted configuration, the
effective length of the angle members under the analysis, have been modified to
simulate the actual conditions as close to the practical. The finite element analysis
incorporates shell element for modeling the entire system. Both material and
geometric non-linearity have been included during analysis. The finite element
problem is inherently nonlinear due to the plasticity of the model. Therefore, it
requires that, in addition to multiple iterations per load step for convergence, the
loads be applied in small increments, to characterize the actual load history. Arc-
length method has been applied to solve the concerned non-linear problem. Then,
compressive load capacities of the same angle members have been evaluated using
different code formulas. And, finally comparisons of results from previous test, code
formulas and finite element analysis have been presented.

Introduction
4
1.5 ORGANIZATION OF THE THESIS
The thesis is organized to best represent and discuss the problem and findings that
come out from the studies performed. Chapter 1 introduces the problem, in which an
overall idea is presented before entering into the main studies and discussion.
Chapter 2 is Literature Review, which represents the work performed so far in
connection with it collected from different references. It also describes the strategy of
advancement for the present problem to a success. Chapter 3 is all about the finite
element modeling exclusively used in this problem and it also shows some figures
associated with this study for proper presentation and understanding. Chapter 4 is the
corner stone of this thesis write up, which solely describes the computational
investigation made throughout the study in details with presentation by many tables
and figures followed by some discussions. Chapter 5, the concluding chapter,
summarizes the whole study as well as points out some further directions.

Chapter 2
LITERATURE REVIEW
2.1 INTRODUCTION
Steel angles are one of the most important and simplest type of structural
compression members. They are used in a variety of structures because of the ease
with which they can be fabricated and erected into structure or structural
components. This is facilitated to a large extent by the basic simplicity and
adaptability of the angle shape (figure 2.2). They are extensively used as primary leg
and diagonal members of latticed electrical transmission line towers (figure 2.1) and
antenna-supporting tower; as the chord members in plane trusses; as web and
bracing members in latticed towers, trusses; open-web steel joists and frames; as
lintels spanning openings over doors, windows etc. These structural components can
be either single or built-up angles; equal or unequal-leg angles; hot-rolled or cold-
formed. They are subjected to axial (either concentric or eccentric) or transverse
loads, or a combination of axial and transverse loads and moments, producing
stresses either below or above the proportional limit of the material. The analysis of
members composed of angle shapes is relatively complicated than, for instance, that
of wide flange shapes. Because, angle is an unsymmetric shape loaded eccentrically
through one side of the section (figure 2.3). Eccentrically loaded single-angle struts
are among the most difficult structural members to analyze and design.
2.2 ULTIMATE COMPRESSIVE LOAD CAPACITY OF
STRUCTURAL STEEL MEMBERS
Ultimate compressive load capacity of a structural member may be defined as the
load carrying capacity of that member at which it fails by buckling or yielding or a
combination of the two. Usually short members fail by yielding, whereas, long and
slender members fail by buckling characterized by large lateral deflections.

Literature Review 6
Figure 2.1 Four-legged electrical transmission tower (pylon) with single
steel angles

Literature Review 7
In between these extremes, columns of intermediate slenderness exhibit a combined
failure mode involving both yielding and large lateral deflections (figure 2.4).
Figure 2.2 Image of single equal leg angle members
Figure 2.3 Image of a typical bolted connection of single angle members

Literature Review 8
Figure 2.4 Failure characteristics of short and long compression members
2.3 DEVELOPMENT OF COLUMN BUCKLING THEORY
The behavior of single steel angles subjected to buckling is almost similar to that of
columns. The theory of elastic flexural buckling of concentrically loaded columns
was formulated by Leonhard Euler (1757). As described by Popov (2003), Euler
considered a perfectly straight column with no eccentric axial load (both end pinned).
The Euler formula describes the critical load for elastic buckling and is valid only for
long columns. The theory clearly fails to describe short columns, since it predicts
infinite resistance to compressive loads for slenderness ratio tending to zero (figure
2.5).

Literature Review 9
Figure 2.5 The short/intermediate/long classification of columns in terms of
stress-slenderness ratio curve
Engesser extended the elastic column buckling theory in 1889 (Engesser formula, as
described by Bleich (1952)). He assumed that inelastic buckling occurs with no
increase in load, and the relation between stress and strain should be defined by
tangent modulus Et.
The principal assumption which caused the tangent modulus theory to be erroneous
is that as the member changes from a straight to bent form, no strain reversal takes
place. So, Engesser in 1895 corrected his original theory (as described by Salmon
and Johnson in 1996) by accounting for the different tangent modulus of the tensile
increment. This is known as the reduced modulus or double modulus. The
assumptions are the same as before. That is, there is no increase in load as buckling
occurs.
Both the Tangent-Modulus Theory and Reduced-Modulus Theory were accepted
theories of inelastic buckling. But the engineers were faced with the confusion that
the reduced modulus theory was correct, but the experimental data was closer to the

Literature Review 10
tangent modulus theory. Shanley (1947) eventually resolved the problem by
conducting very careful experiments on small aluminum columns. He observed that
lateral deflection started very near the theoretical tangent modulus load and the load
capacity increased with increasing lateral deflections. The column axial load
capacity never reached the calculated reduced or double modulus load. Therefore, he
developed a column model to explain the observed phenomenon. He reasoned that
the tangent modulus theory is valid when buckling is accompanied by a simultaneous
increase in the applied load of sufficient magnitude to prevent strain reversal in the
member. The applied load given by the tangent modulus theory increases
asymptotically to that given by the double modulus theory.
In practice, however, most structures suffer plastic knockdown and the
experimentally obtained buckling loads are much less than the Euler (1757)
predictions. For structures in this category, a suitable formula is the Rankine-Gordon
formula (as mentioned by Tall in 1974) which is a semi-empirical formula, and takes
into account the crushing strength of the material, its Young's modulus and its
slenderness ratio, namely l/r. This criteria is based on experimental results.
Another equation is Tetmajer Equation (reported by Tall in 1974) which is a linear
formula and is valid in the range of inelastic buckling when the current slenderness
ratio (L/r) is less than the critical slenderness ratio.
For very short columns the yield stress (with appropriate design factor) can be used
for predicting the ultimate load capacity. But for columns that are not short, and
where the Euler formula gives stress above the yield stress, empirical methods of
design should be used. One popular equation in use since the early 1900s is the
Johnson formula (as described by Tall in 1974) which can be used for columns with
slenderness ratios below a transition slenderness ratio. The Johnson Parabola is one
of these curve fitting methods, and has been used commonly in structural
engineering. It is an inverted parabola, symmetric about the point (0, σy) tangent to
the Euler curve.
In practice a structure cannot be perfectly straight, and the analysis for such a
structure would become more realistic if account could be taken of the slight

Literature Review 11
deviations from straightness of the centroidal axis of the strut. From this
consideration, Perry-Robertson Approach (as reported by Trahair and Bradford in
1988) has been initiated.
In addition to above theories, further observations regarding inelastic buckling were
made by Lin (1950), Duberg and Wilder (1950). Most of their analysis was based on
a lot of experiments on inelastic behavior of column member.
The maximum load lying between the tangent modulus load and the double modulus
load for any time-independent elastic-plastic material and cross-section was
accurately determined by Lin (1950).
Duberg and Wilder (1950) have further concluded that for materials whose stress -
strain curves change gradually in the inelastic range, the maximum column load can
be appreciably above the tangent modulus load. If, however, the material in the
inelastic range tends rapidly to exhibit plastic behavior the maximum load is only
slightly higher than the tangent modulus load. These researches also included elastic-
plastic nature of materials.
2.4 ECCENTRICALLY LOADED COLUMN BUCKLING
THEORY
2.4.1 General
In reality, columns are often subjected to eccentric loading which causes
development of bending stress as well as generates possible buckling behavior.
There is always some eccentricity in the applied loading of a member due to initial
imperfections in the section or in its boundary conditions. When a compressive load
is increased, eccentricity sets up bending in the member causing it to deflect. In turn,
the deflection increases the eccentricity, which increases the bending. This may
progress to where the bending increases at a greater rate than the compressive
loading and the member becomes unstable. This phenomenon can occur in columns,
flanges, plates and shells subject to compression. In figure 2.6, illustration of the
stress that a column experiences under increasing eccentric loading has been shown.

Literature Review 12
Figure 2.6 Form of the stress prism changes from an even distribution to a very
uneven distribution due to increasing eccentricity of loading
It is clear that with increasing eccentricity of loading, the stress becomes bending in
nature. This bending stress introduces bending moment, which a column section
must resist in addition to compressive stress under equilibrium condition.
2.4.2 Development of Eccentrically Loaded Column Buckling
Theory
2.4.2.1 Theoretical Investigations
In a brief account of the development of the theory of eccentrically loaded columns,
Ostenfeld (1898), over a century ago, made an attempt to derive design formulas for
centrally and eccentrically loaded columns. His method was based upon the concept
that the critical column load is defined as the loading which first produces external
fiber stresses equal to the yield strength.
Ros (1928) established a simplified stability theory of eccentrically loaded columns
and proved the theoretical results by a number of tests. They assumed that the
deflected center line of the column can be represented by the half wave of a sine
curve but based the computation of the critical load upon the actual stress-strain
Literature Review 13
diagram.
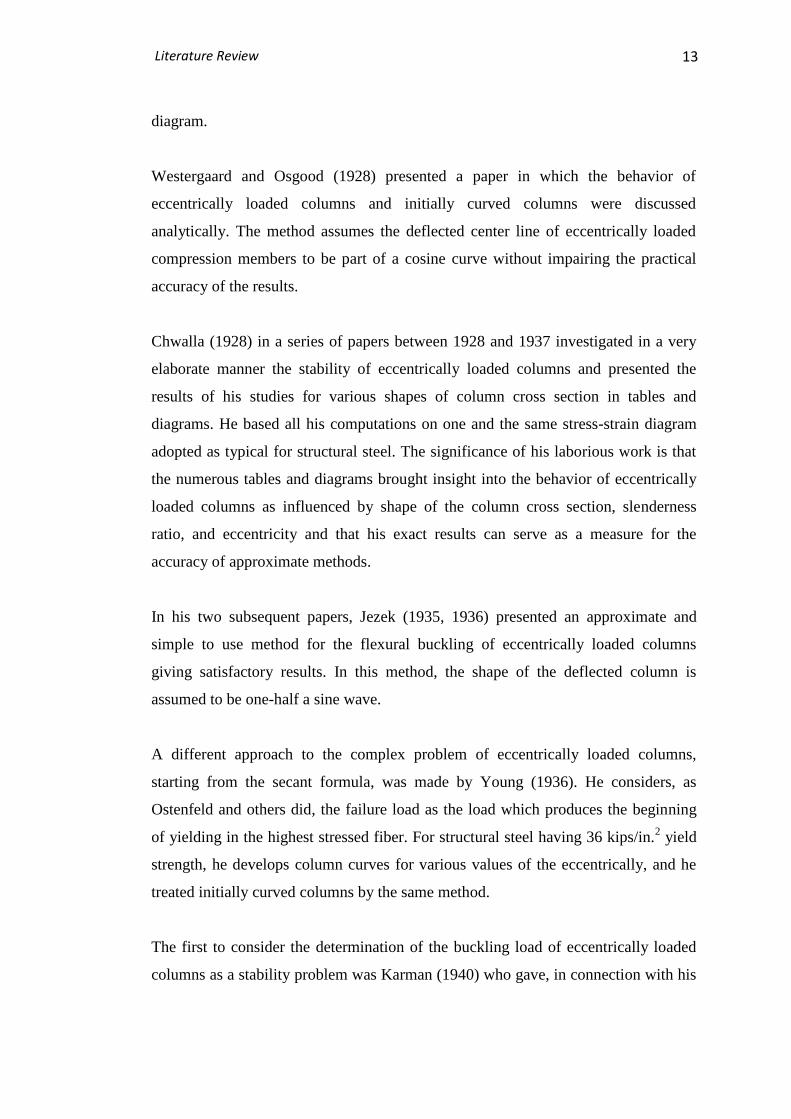
Westergaard and Osgood (1928) presented a paper in which the behavior of
eccentrically loaded columns and initially curved columns were discussed
analytically. The method assumes the deflected center line of eccentrically loaded
compression members to be part of a cosine curve without impairing the practical
accuracy of the results.
Chwalla (1928) in a series of papers between 1928 and 1937 investigated in a very
elaborate manner the stability of eccentrically loaded columns and presented the
results of his studies for various shapes of column cross section in tables and
diagrams. He based all his computations on one and the same stress-strain diagram
adopted as typical for structural steel. The significance of his laborious work is that
the numerous tables and diagrams brought insight into the behavior of eccentrically
loaded columns as influenced by shape of the column cross section, slenderness
ratio, and eccentricity and that his exact results can serve as a measure for the
accuracy of approximate methods.
In his two subsequent papers, Jezek (1935, 1936) presented an approximate and
simple to use method for the flexural buckling of eccentrically loaded columns
giving satisfactory results. In this method, the shape of the deflected column is
assumed to be one-half a sine wave.
A different approach to the complex problem of eccentrically loaded columns,
starting from the secant formula, was made by Young (1936). He considers, as
Ostenfeld and others did, the failure load as the load which produces the beginning
of yielding in the highest stressed fiber. For structural steel having 36 kips/in.2 yield
strength, he develops column curves for various values of the eccentrically, and he
treated initially curved columns by the same method.
The first to consider the determination of the buckling load of eccentrically loaded
columns as a stability problem was Karman (1940) who gave, in connection with his

Literature Review 14
investigations on centrally loaded columns, a complete and exact analysis of this
rather involved problem. He called attention to the sensitiveness of short and
medium-length columns to even very slight eccentrically of the imposed load, which
reduce the carrying capacity of straight columns considerably.
Bleich (1952) also developed simple algebraic formulas for the approximate method
of design of eccentrically loaded columns which fail by flexural buckling about the
weak axis.
Trahair (2007) in a series of papers (from 2001 to 2007) investigated the behavior of
single angle sections thoroughly. These papers summarize a design method for angle
sections which is rational, consistent and economical. Though his research works are
confined to assume angles as flexural members, they are quite informative and give a
clear and concise idea about complex load behaviour characteristics of angles.
2.4.2.2 Experimental Investigations
Stang and Strickenberg (1922) conducted the first compression tests on angle
members in the United States. One hundred and seventy tests were performed on
hot-rolled single angles, and a wide variety of end connections and slenderness ratios
were considered. End fixity factors were determined for different end conditions. For
large slenderness ratios, the results were in good agreement with Euler's buckling
formula and the reduced modulus theory agreed well with the average test values for
single angles with smaller slenderness ratios. It was also found that load eccentricity
and end restraint are very important in evaluating single-angle strength, with load
eccentricity having more effect than end restraint for slenderness ratios below about
85. Further, unequal leg angles were stronger when connected by their short leg.
Wakabayashi and Nonaka (1965) studied 10 equal-leg hot-rolled 79090 mm
angles under concentric loading for slenderness ratios ranging between 40 and 150.
Hemispherical ends were employed and the results were used to develop a design
method. Of the 10 test specimens, seven failed in flexural buckling.

Literature Review 15
Yokoo et al. (1968) performed a study that included the testing of hot-rolled single-
angle members loaded concentrically in compression using a ball-joint connection.
Torsional deformations were predominant in concentrically loaded specimens. They
also showed that boundary conditions for twisting do not significantly affect the
failure load.
Equal-leg high-strength steel angles 67575 mm and 66565 mm in size were
tested by Ishida (1968).The tests showed that the load-carrying capacity of mild steel
angles was generally higher compared to hot-rolled high-strength steel angles, which
contain large residual stresses.
Kennedy and Murty (1972) presented a rational buckling analysis that was designed
to overcome limitations in the American Institute of Steel Construction (AISC)
Specifications and the Canadian Standards Association (CSA) design code. As part
of the testing program designed to verify the analytical buckling analysis, 72 single-
angle struts were tested with ends both fixed and hinged. All angles were designed to
fail inelastically, and actual dimensions and yield stresses were measured as part of
the testing program.
Wood (1975) reported that a series of tests were performed on 153 crossed diagonal
angles in lattice transmission towers. All of the tests were conducted using tower
substructures in order to duplicate actual end conditions. One-, two-, and three-bolt
connections were evaluated for members of different slenderness ratios. All of the
test specimens failed in the elastic buckling range and their strengths were compared
with the Euler buckling load.
Mueller and Erzurumlu (1983) investigated the overall performance of single-angle
columns. The parameters studied were yield stress, load eccentricity, and end
restraint. To conduct parametric studies, an analytical study was also performed.
Mueller and Wagner (1983) performed further testing to gain more knowledge
regarding the post buckling performance of angle members. Several parameters were

Literature Review 16
studied, including end restraint, slenderness ratio, load eccentricity, and intermediate
supports.
Kitipornchai and Lee (1984) performed a series of tests on hot-rolled single-angle,
double-angle, and tee struts failing in the inelastic range. A total of 54 specimens
were tested under concentric loading with special pinned-end supports designed to
restrain twisting about the longitudinal axis. The results were compared to theoretical
predictions as well as various design codes.
Al-Sayed and Bjorhovde (1989) reported the results of an experimental investigation
on 12 steel-angle columns failing in flexural or torsional-flexural buckling modes.
The tests were conducted under concentric loads using spherical ends that permitted
both bending and twisting deformations. The results include residual stresses, stub-
column strengths, and other observations. Initial out-of-straightness was not
measured.
The ultimate compressive load capacity of single steel angles subjected to
eccentrically applied axial load has been investigated by Leander Bathon (1993).
Seventy-five full-scale tests (thirty one single angle equal-leg and forty four single
angle unequal-leg specimens) were done with data collected in the elastic, inelastic
and post buckling regions of member’s performance. Test specimens were made of
A36 steel angle sections connected to the end plate by bolts. The end plates were
supported using a ball joint in an attempt to model end conditions that were
unrestrained against rotation. The results of the tests were compared with predicted
load capacities obtained from ASCE Manual 52 for the Design of Steel Transmission
Towers (1988), which is the design guide for lattice steel transmission towers.
Experiments were carried out by Adluri and Madugula in 1996. They comprised 26
tests and had six different sizes and 23 different slenderness ratios. They produced
test data with slenderness parameter λ between 0.91 and 2.44.The ratio of the
nominal leg width to leg thickness ranged from 6 to 16.All the test specimens
including those prone to local buckling failed in flexural buckling before exhibiting

Literature Review 17
some local failure. Finally they were able to develop several column curves to verify
test results. It was observed that the generated column curves were very close to test
results.
2.4.2.3 Numerical Investigations
Adluri (1994) used Finite Element Method to simulate the behavior of steel angles
under flexural buckling. For the purpose of analysis, the steel angle is discretized
into several strips of elements along the length. Each strip is subdivided into
individual finite elements. Eight-node finite elements with six degrees of freedom at
each node were used. The element stiffness was computed using a reduced
integration scheme with four Gause points per element. The angle geometry was
defined with a sinusoidal initial out-of-straightness along the major axis. The
maximum midheight out-of-straightness was prescribed as length/1,500. The results
show good agreement between theory and experiments. Most of the predicted
strengths are close to but below test results by up to 10%.
Studies on the use of the finite-element method (FEM) for steel angles were reported
by Lu et al. (1983) and Chuenmei (1984). Applicability of the FEM for a failure
analysis of schifflerized steel-angle members was shown by Adluri et al. (1991).
However, the application of the method is not very suitable for the development of
column curves, because of the large amount of computational effort required even
with the computing power available today.
An exploratory study was conducted by Haaijer, Carskaddan and Grubb (1981) to
investigate the feasibility of using a finite element analysis in lieu of a physical test
of an eccentrically loaded single angle column connected by one leg. Only elastic
behavior was considered so that the results are applicable to relatively slender
members.
A combination of finite element and finite segment approaches has been used by Hu
and Lu (1981) to determine the complete load-deflection relationships of single-
angle struts subjected to eccentric compressive loads, with or without end restraints.

Literature Review 18
A rational design procedure for eccentrically loaded single angles is also being
developed.
2.5 EXPERIMENT OF ELGAALY et al (1991)
In 1991, Elgaaly et al conducted tests on 50 non-slender single steel angles as part of
a three dimensional latticed truss. Both the specimens with eccentric single bolted
and double bolted end connections were investigated. Of the specimens, 25 were
double bolted and the rest 22 were single bolted at their ends. Table 2.1 lists the
angle sections by groups depending on difference in cross-sectional dimensions,
slenderness ratios (l/r) and end conditions.
Table 2.1: Test specimens (Elgaaly et al. 1991)
The selection of specific member sizes for testing was based on both the capacity of
the truss and the need to cover slenderness ratio range from 0 to 120. The three
dimensional truss used to test each specimen is shown in figure 2.7. The truss was
designed so that the target angle would fail first without introducing significant
deformations in the remainder of the truss. Following each test, only the target angle
was replaced, allowing multiple tests to be conducted in the same setting. Load was
applied via two 100 kip capacity hydraulic jacks, which allowed the load on each
side of the truss to be kept balanced. Then the test results were given and six failure
modes were identified. These failure modes depend on the member slenderness ratio,
the angle leg width/ thickness ratio, and the end connection detail. These failure
modes can be generally classified as global with no appreciable local failures, or

Literature Review 19
Fig
ure
2.7
Tes
t se
tup o
f E
lgaa
ly e
t al
(1991)

Literature Review 20
local failures that triggered global failures in some cases. Finally, the design rules
given by the AISC Buildings Design Specification and the ASCE Manual 52 for the
design of Steel Transmission Towers were evaluated. The AISC Specification
requirements were found to be conservative. Meanwhile, the ASCE Manual 52
requirements were found to be unsafe, particularly in the cases where failure is due to
the local buckling of the angle leg. Table 2.1 lists the characteristics and numbers of
the test specimens chosen.
2.5.1 Test Procedure
After the initial readings were taken, the load was applied manually in small
increments via the two hydraulic jacks (figure 2.7). At the end of each increment, the
load was manually recorded, and the strain gage and transducer readings were taken
by the computer. When failure of the specimen was imminent, the size of the load
increments was reduced to approximately half its initial value. Each test was stopped
after excessive deformations to the test specimen indicating it had failed.
2.5.2 Test Results (Elgaaly et al 1991)
Figures 2.8 to 2.11 are typical member force vs displacement in horizontal and in
vertical plane graphs obtained from the results of the test of Elgaaly. And the tables
2.2 and 2.3 list the cross sectional dimensions, width-thickness ratio, yield stress,
failure modes as well as failure loads for different angle specimens with buckling
load factors (n).
Figure 2.8 Member Force versus Strain and Displacement Specimen 34 (test of
Elgaaly et al 1991)

Literature Review 21
Figure 2.9 Member Force versus Strain and Displacement Specimen 42 (test of
Elgaaly et al 1991)
Figure 2.10 Member Force versus Strain and Displacement Specimen 9 (test of
Elgaaly et al 1991)
Figure 2.11 Member Force versus Strain and Displacement Specimen 26 (test of
Elgaaly et al 1991)

Literature Review 22
Table 2.2: Test Results for Double-Bolted Specimens (Elgaaly et al 1991)

Literature Review 23
Table 2.3: Test Results for Single-Bolted Specimens (Elgaaly et al 1991)
2.6 CODE PROVISIONS TO DETERMINE ULTIMATE
COMPRESSIVE LOAD CAPACITY OF STRUCTURAL
STEEL ANGLES
2.6.1 ASCE Standard 10-97: Design of Latticed Steel
Transmission Structures
According to ASCE Standard 10-97, for angle compression members with
normal framing eccentricities at both ends of the unsupported panel,
r
L
r
KL5.060 for 1200
r
L (2.1)

Literature Review 24
y
cF
EC
2
The ratio w/t should not exceed 25, where, w = flat width and t = thickness of leg.
The design compressive stress (Fa) on the gross cross-sectional area shall be one of
the following equations (2.3) and (2.4):
y
c
a FC
rKLF
2
2
11
for, cCr
KL
22
rKL
EFa
for, cCr
KL
provided the largest value of w/t does not exceed the limiting value given by:
yFt
w 80
lim
If w/t exceeds the limiting value, the design compressive stress (Fa) shall be
according to equations no. (2.3) or (2.4) except with the replacement of Fcr for Fy
which is given by:
ycr Ftw
twF
lim
677.0677.1 for
yFt
w
t
w 144
lim
220332.0
tw
EFcr
for yFt
w 144
Where,
Fy = minimum guaranteed yield stress (MPa or ksi)
E = modulus of elasticity (MPa or ksi)
L = unbraced length (mm or inch)
r = radius of gyration (mm or inch)
K = effective length coefficient
Ψ = 1 for Fy in ksi and 2.62 for Fy in MPa
(2.2)
(2.3)
(2.4)
(2.5)
(2.6)
(2.7)
Literature Review 25
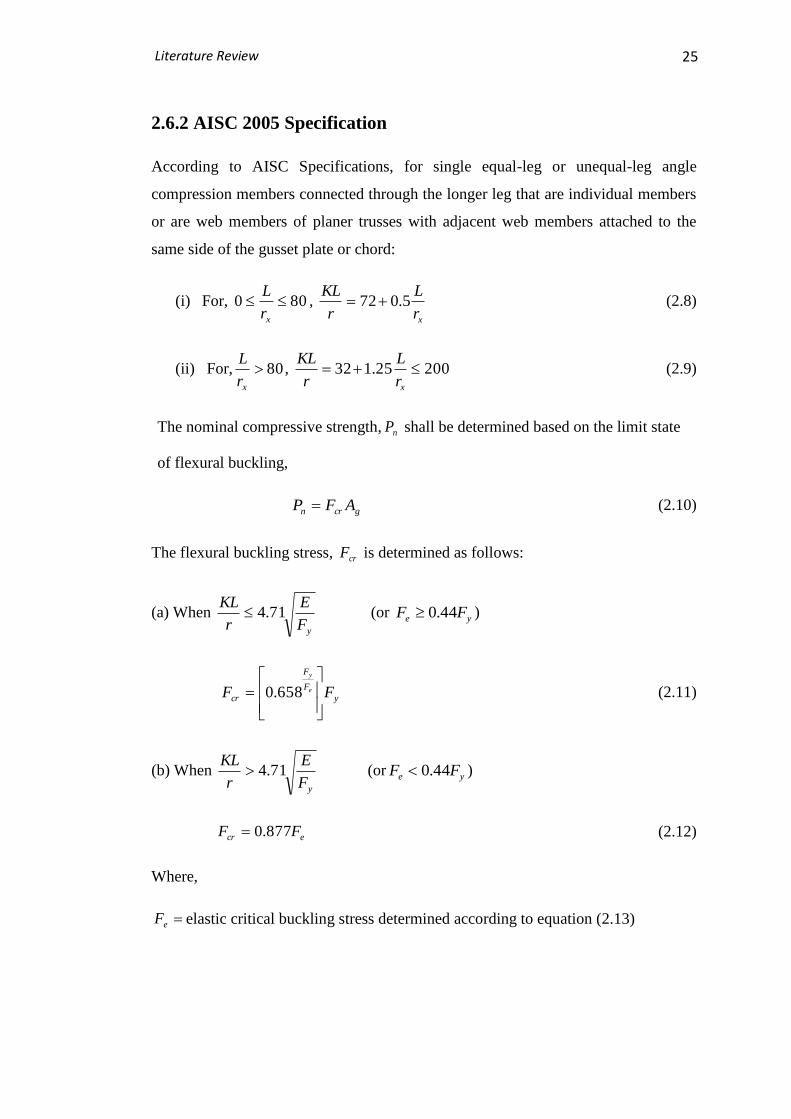
2.6.2 AISC 2005 Specification
According to AISC Specifications, for single equal-leg or unequal-leg angle
compression members connected through the longer leg that are individual members
or are web members of planer trusses with adjacent web members attached to the
same side of the gusset plate or chord:
(i) For, 800 xr
L,
xr
L
r
KL5.072 (2.8) (2.8)
(ii) For, 80xr
L, 20025.132
xr
L
r
KL (2.9)
The nominal compressive strength, nP shall be determined based on the limit state
of flexural buckling,
gcrn AFP (2.10)
The flexural buckling stress, crF is determined as follows:
(a) When yF
E
r
KL71.4 (or ye FF 44.0 )
y
F
F
cr FF e
y
658.0 (2.11)
(b) When yF
E
r
KL71.4 (or ye FF 44.0 )
ecr FF 877.0 (2.12)
Where,
eF elastic critical buckling stress determined according to equation (2.13)

Literature Review 26
2
2
r
KL
EFe
(2.13)
2.6.3 BS (8100) Formula (1999)
According to British Standard (8100), for lattice towers, a single lattice is commonly
used where the loads are light and the length (Ld) is relatively short. For the case, the
slenderness ratio, λ for single steel angles should be taken as,
vv
d
rL
(2.14)
In order to calculate the design buckling resistance of the member, the effective
slenderness Λeff should be determined from:
Λeff = KΛ (2.15)
Where,
Λ = the relative slenderness of the member about the appropriate axis for which the
strength is required and is given by:
1
Λ (2.16)
Where,
λ = the slenderness ratio obtained from equation no. (2.14)
and
5.0
1
y
E
(2.17)
when,
E = 205000 MPa
K = effective slenderness factor depending on the structural configuration and is
given as follows:

Literature Review 27
33.1t
B
2
2
1.5
t
B
Er
For single and double bolted angle legs, which are normal to the frame and has
discontinuous both ends,
ΛK
58.07.0 (2.18)
For hot rolled angle sections, the reference stress, r is given by:
yr , if t
B (2.19)
t
Byr
2 , if 33.1
t
B (2.20)
, , if (2.21)
Where,
σy=The specific minimum yield stress of material of member (ksi or MPa)
B = the leg length of the angle (inch or mm)
t = the thickness of angle leg (inch or mm)
y
E
567.0 (2.22)
E= the modulus of elasticity (MPa or ksi)
The design of buckling resistance, N of a compression member should be taken as:
m
rAjN
(2.23)
Where,
j = 0.8 for single angle members connected by one bolt at each end,
0.9 for single angle members connected by one bolt at one end and continuous at
the other end and 1.0 in all other cases;
A= the cross-sectional area of the member (in2 or mm
2);
= the reduction factor for the relevant buckling mode and should be determined
from:

Literature Review 28
22.015.0 effeff ΛΛa
5.022
1
effΛ
(2.24)
Here,
(2.25)
a = an imperfection factor corresponding to the appropriate buckling curve
which should be obtained from the following table:
Buckling curve Imperfection factor, a
A 0.21
B 0.34
C 0.49
D 0.76
γm= the partial factor on strength as given in BS 8100-1 and -4,appropriate to the
quality class of the structure:
For angle section towers which have successfully been subjected to full-scale tests
under the equivalent factored loading or where similar configurations have been type
tested:
γm is 1.0 for Class A structures;
γm is 1.1 for Class B structures;
γm varies from about 1.2 to 1.35 for Class C structures depending on the performance
requirements.

Literature Review 29
22
2 135000000
..
r
L
r
LSF
EF
ee
a
ce CrL
2.6.4 AASHTO Formula
AASHTO formula is a simple adoption of the AISC formula in which AASHTO
uses a different factor of safety (F.S) and a constant value of effective length factor
(K) for bolted or riveted connection. The AASHTO formulae for allowable stress
(Fa) are:
E
Fr
L
SF
FF
y
e
y
a 2
2
41
.. for ce CrL (2.26)
for (2.27)
Here y
cF
EC
22 , F.S = 2.12, K= 0.75 (2.28)
2.6.5 IS Code Formula
According to Indian Standard 800:2007, common hot rolled steel members used for
carrying axial compression, usually fail by flexural buckling. The buckling strength
of these members is affected by residual stresses, initial bow and accidental
eccentries of load. To account for all these factors, the strength of members
subjected to axial compression is defined by buckling class a, b, c, or d as given
below:
Buckling
Class
a b c d
Imperfection
Factor, α
0.21 0.34 0.49 0.76

Literature Review 30
The design compressive strength of a member is given by:
cded fAP (2.29)
Where,
Ae = effective sectional area (here, the gross sectional area shall be taken as the
effective sectional area for all compression members fabricated by welding,
bolting or riveting so long as the section is semi-compact or better)
fcd = design compressive stress obtained as per the following equation:
mo
y
mo
y
cd
fff
(2.30)
Where,
χ = stress reduction factor for different buckling class, slenderness ratio and
yield stress
= 5.022
1
(2.31)
fy = yield stress of the material
γmo = partial safety factor for material strength
= 1.1
22.015.0 (2.32)
λ = non-dimensional effective slenderness ratio (angles are usually loaded
eccentrically by connecting one of its legs either to a gusset or to an adjacent
member. Such angles will buckle in flexural-torsional mode in which there will be
significant twisting of the member. Such twisting may be facilitated by the flexibility
of the gusset plate and the other members connected to it. Thus, to account for the
reduction in strength due to flexural-torsional mode, the code gives an equivalent
slenderness rati0 ( λeq ) instead of λ as a function of the overall slenderness ratio and
the width-thickness ratio as given below:
2
3
2
21 kkk vveq (2.33)
Where,
k1, k2, k3 = constants depending upon the end condition as given below:

Literature Review 31
No of
bolts at
each end
connection
Gusset/connecting
member fixity 1k 2k 3k
2 Fixed 0.20 0.35 20
Hinged 0.70 0.60 5
1 Fixed 0.75 0.35 20
Hinged 1.25 0.50 60
250
2E
r
l
vv
vv
and
250
22
21
E
t
bb
(2.34)
Here,
λvv = slenderness ratio for flexural buckling
λφ = slenderness ratio for torsional buckling
l = centre to centre length of the supporting member
rvv = radius of gyration about the minor axis
b1, b2 = width of the two legs of the angle (mm)
t = thickness of the leg (mm)
ε = yield stress ratio
=
5.0
250
yf ; (2.35)
fy = yield stress of material (MPa)
2.6.6 CRC Formula
The basic column-strength curve adopted by the Column Research Council
(CRC) is based on parabolic equation proposed by Bleich as:
])(4
1[ 2
2 r
L
E
ey
ycr
(2.36)
In above equation 2.36,
cr = critical stress for column
Literature Review 32
5.13925.132 xr
L
r
KL
51.11671.4 yF
E
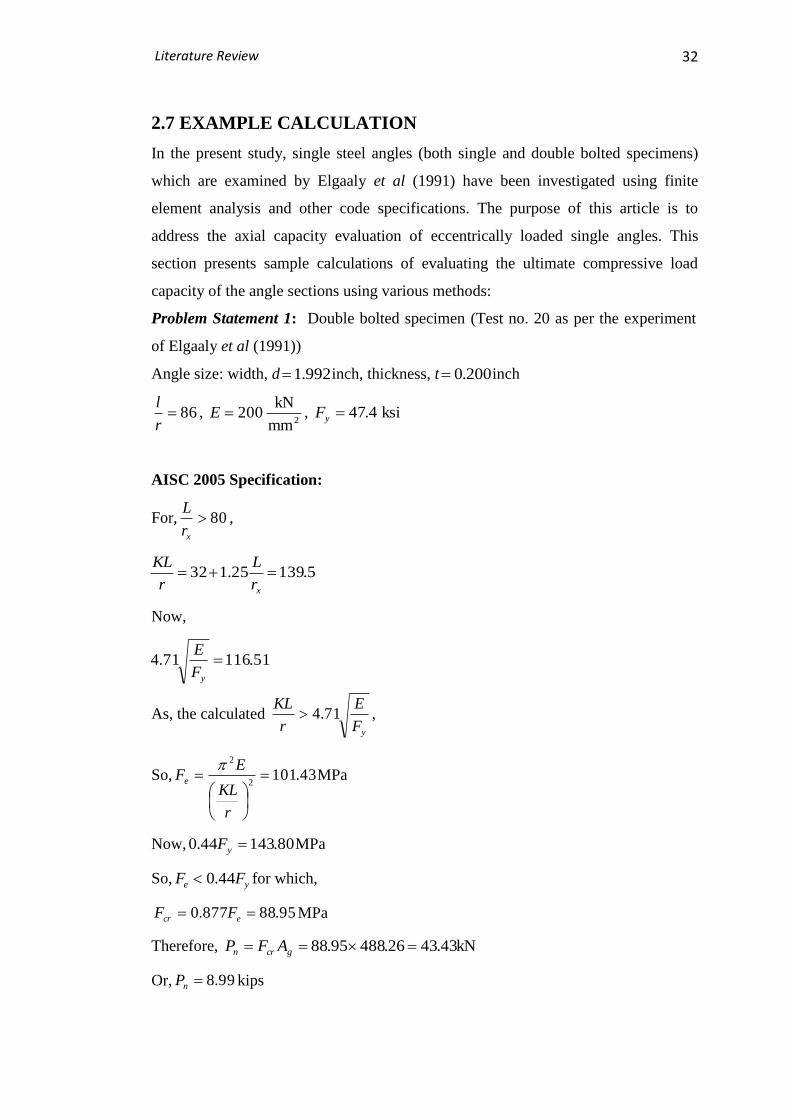
2.7 EXAMPLE CALCULATION
In the present study, single steel angles (both single and double bolted specimens)
which are examined by Elgaaly et al (1991) have been investigated using finite
element analysis and other code specifications. The purpose of this article is to
address the axial capacity evaluation of eccentrically loaded single angles. This
section presents sample calculations of evaluating the ultimate compressive load
capacity of the angle sections using various methods:
Problem Statement 1: Double bolted specimen (Test no. 20 as per the experiment
of Elgaaly et al (1991))
Angle size: width, d 992.1 inch, thickness, t 200.0 inch
86r
l,
2mm
kN200E , ksi4.47yF
AISC 2005 Specification:
For, 80xr
L,
Now,
As, the calculated yF
E
r
KL71.4 ,
So, 43.1012
2
r
KL
EFe
MPa
Now, 80.14344.0 yF MPa
So, ye FF 44.0 for which,
95.88877.0 ecr FF MPa
Therefore, kN43.4326.48895.88 gcrn AFP
Or, 99.8nP kips
Literature Review 33
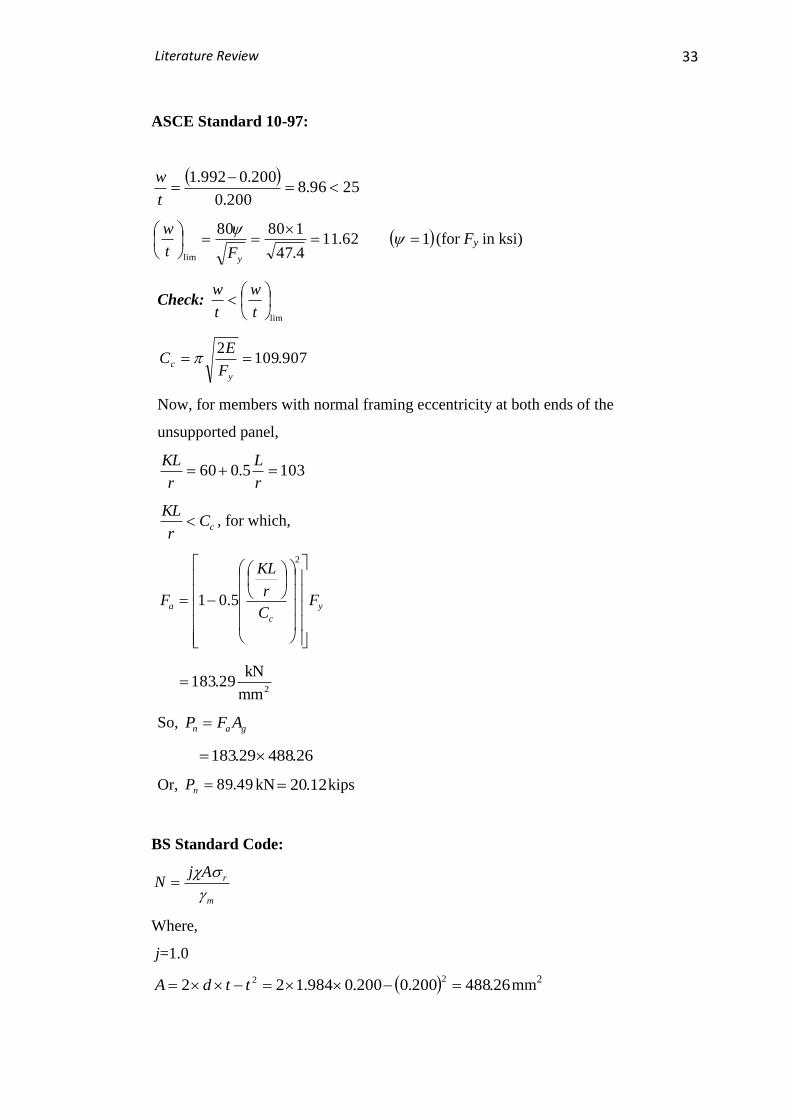
ASCE Standard 10-97:
2596.8
200.0
200.0992.1
t
w
62.114.47
18080
lim
yFt
w 1 (for Fy in ksi)
Check: lim
t
w
t
w
907.1092
y
cF
EC
Now, for members with normal framing eccentricity at both ends of the
unsupported panel,
1035.060 r
L
r
KL
cCr
KL , for which,
y
c
a FC
r
KL
F
2
5.01
2mm
kN29.183
So, gan AFP
26.48829.183
Or, 49.89nP kN 12.20 kips
BS Standard Code:
m
rAjN
Where,
j=1.0
26.488200.0200.0984.12222 ttdA mm
2

Literature Review 34
222
1
effΛ
5684.0
Here,
4495.12427.12.02427.134.015.02.015.0 22 effeff ΛΛa
and 2427.1093.1137.1 KΛAeff
Now,
ΛK
58.07.0 ( both end discontinuous)
1
58.07.0
158.07.0
=1.23
Now,
96.9200.0
992.1
t
B
2.14567.0 y
E
Now,
for t
B,
823.326895.64.47 yr MPa
0.1m (let, for class-(1) structures)
Therefore,
0.1
823.326257.4885684.00.1 N
86
895.64.47
205000
58.07.0
5.0

Literature Review 35
39.20 kips
AASHTO Formula:
Allowable stress,
E
Fr
L
SF
FF
ye
y
a 2
2
41
. (for c
e Cr
L )
2050004
895.64.478675.01
0.1
895.64.472
2
89.24 kips
Though, AASHTO Code, factor of safety, F.S=2.12, but in the present study, it has
been assumed 1.0.
IS Code Formula:
875.0250
5.0
yf
106.1
250
2
E
r
l
vv
vv
1281.0
250
22
21
E
t
bb
9779.02
3
2
21 kkk vveq
1687.19779.02.09779.049.015.02.015.0 22 eqeq
553.0
15.022
eq
So, 697.180895.64.47553.0 mo
y
cd
ff
MPa

Literature Review 36
23.88697.18026.488 dP kN 84.19 kips
CRC Formula:
668.226])(4
1[ 2
2
r
L
E
ey
ycr
MPa
88.242571.488668.226 g
AP crn kips
Figure 2.12 Buckling load capacity of single steel angle member for
Elgaaly (test no.20, angle size:50.6×50.6×5.08) evaluated in
various codes
Angle capacity found by different codes as shown are graphically summarized in
figure 2.12. It has been observed that only the ASCE Standard 10-97 and IS Code
gives reasonably close values for the buckling load capacity of single steel angles as
part of a truss structure, whereas the AISC and BS (British Standard) underpredict at
a large extent from the test result obtained from Elgaaly et al (1991). And the other
codes AASHTO, CRC formulas give approximately same results, but overpredicts
the test results to some extent.

Literature Review 37
Problem Statement 2: Single bolted specimen (Test no. 53 as per the experiment of
Elgaaly et al)
Angle size: width, d=1.749 inch, thickness, t=0.133 inch
92r
l,
2mm
kN200E , ksi2.51yF
AISC 2005 Specification:
For, 80xr
L,
0.14725.132 xr
L
r
KL
Now,
11.11271.4 yF
E
As, the calculated yF
E
r
KL71.4 ,
So, 35.912
2
r
KL
EFe
MPa
Now, yF44.0 33.155 MPa
So, ye FF 44.0 for which,
11.8035.91877.0 crF MPa
So, 13.2374.28811.80 gcrn AFP kN
Or, 20.5nP kips
ASCE Standard 10-97:
2515.12
133.0
133.0749.1
t
w
18.112.51
18080
lim
yFt
w 1 (for Fy in ksi)
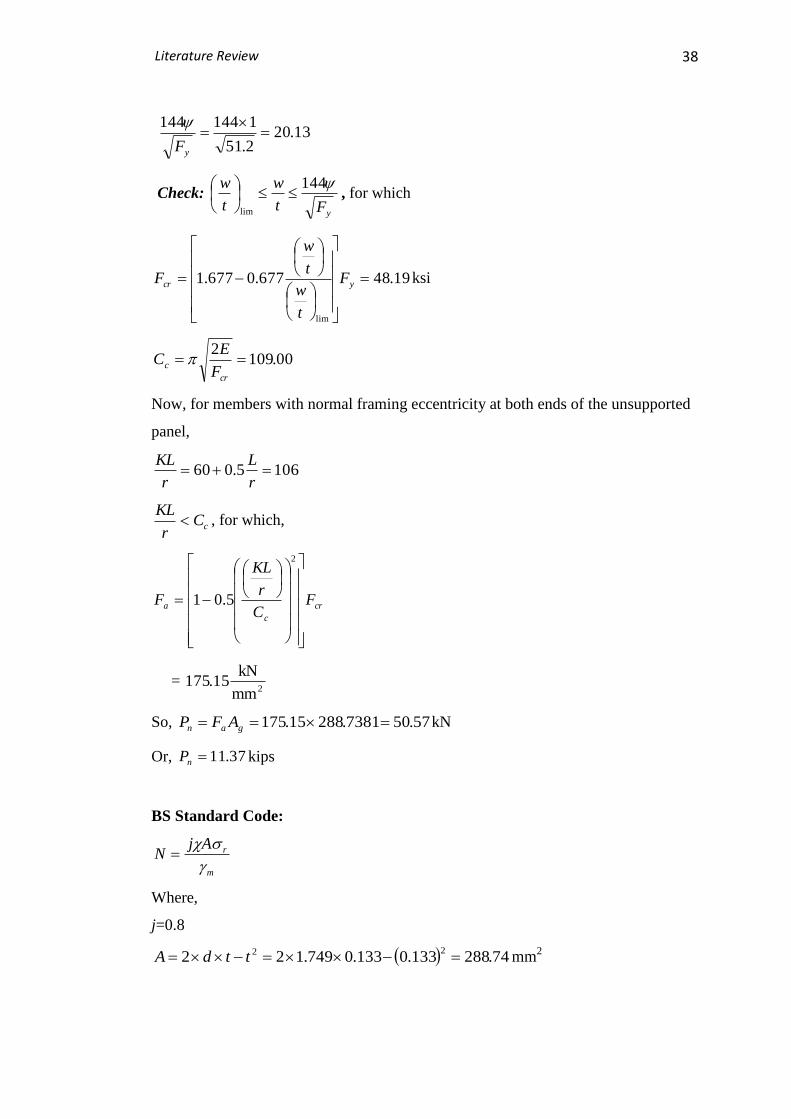
Literature Review 38
13.202.51
1144144
yF
Check:
yFt
w
t
w 144
lim
, for which
19.48677.0677.1
lim
ycr F
t
w
t
w
F ksi
00.1092
cr
cF
EC
Now, for members with normal framing eccentricity at both ends of the unsupported
panel,
1065.060 r
L
r
KL
cCr
KL , for which,
cr
c
a FC
r
KL
F
2
5.01
= 2mm
kN15.175
So, 57.507381.28815.175 gan AFP kN
Or, 37.11nP kips
BS Standard Code:
m
rAjN
Where,
j=0.8
74.288133.0133.0749.12222 ttdA mm
2

Literature Review 39
222
1
effΛ
3688.0
Here,
733.143.12.043.134.015.02.015.0 22 effeff ΛΛa and
43.1215.1177.1 KΛΛeff
ΛK
58.07.0 ( both end discontinuous)
=1.177
Now,
15.13133.0
749.1
t
B
66.13895.62.51
205000567.0567.0
y
E
Now, for t
B,
024.353895.62.51 yr MPa
0.1m (let, for class-(1) structures)
Therefore,
0.1
024.35374.2883688.08.0 N
86.30073 N
76.6 kips
AASHTO Formula:
Allowable stress,
E
Fr
L
SF
FF
ye
y
a 2
2
41
. (for c
e Cr
L )
2000004
895.62.519275.01
0.1
895.62.512
2
Literature Review 40
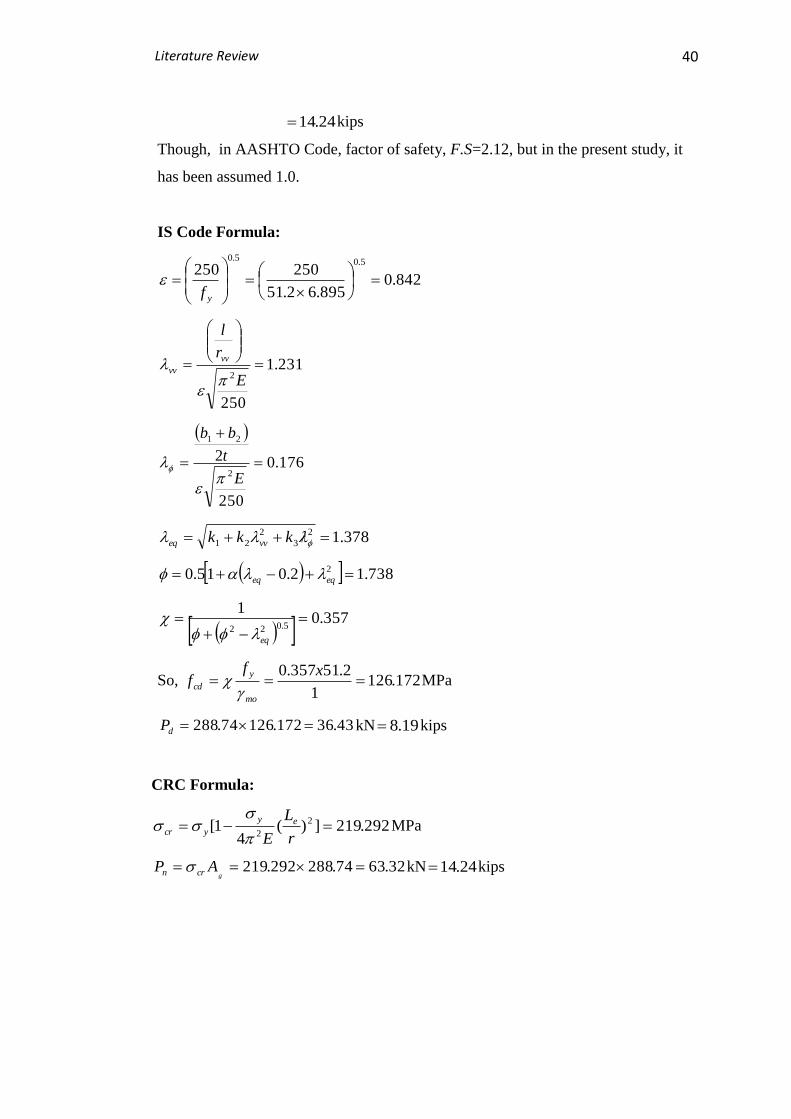
24.14 kips
Though, in AASHTO Code, factor of safety, F.S=2.12, but in the present study, it
has been assumed 1.0.
IS Code Formula:
842.0895.62.51
2502505.05.0
yf
231.1
250
2
E
r
l
vv
vv
176.0
250
22
21
E
t
bb
378.12
3
2
21 kkk vveq
738.12.015.0 2 eqeq
357.0
15.022
eq
So, 172.1261
2.51357.0
xff
mo
y
cd
MPa
43.36172.12674.288 dP kN 19.8 kips
CRC Formula:
292.219])(4
1[ 2
2
r
L
E
ey
ycr
MPa
32.6374.288292.219 g
AP crn kN 24.14 kips

Literature Review 41
Figure 2.13 Buckling load capacity of single steel angle member for
Elgaaly (test no.53, angle size:50.6×50.6×5.08) evaluated in
various codes
Angle capacity found by different codes as shown are graphically summarized in
figure 2.13. It has been observed from figure 2.13 that as before like in the case of
double bolted specimens only the ASCE Standard 10-97 reasonably predicts the
buckling load capacity of single steel angles as part of a truss structure, whereas the
AISC, BS (British Standard) and IS Code underpredicts to a large extent from the
test result obtained from Elgaaly et al (1991). And the other codes AASHTO, CRC
formulas give approximately same results, but overpredicts the test results to some
extent. But the main distinguishing point is the difference in accuracy of the results
obtained from various methods due to the difference in the number of bolts in end
connections of target angles.
2.8 REMARKS
Single steel angles are one of the most important structural components. There have
been some researches carried out by past scientists throughout the world. Some of
the works aimed at the principal governing factors which influence the load carrying
nature of angles. In our country, little work has been carried out as per author’s

Literature Review 42
knowledge. Moreover, it has been shown that capacities of angles predicted by
different codes vary significantly. So, the author feels that there should be more
research oriented studies regarding the issue for providing more data to have proper
guideline for better estimation of compressive loads of angles eccentrically loaded in
structures. This will also help to bring any modification in the designing parameters
of angles in the codes. Hence, the proposed study is expected to provide the design
engineers with some definite guidelines on these areas.

Chapter 3
METHODOLOGY FOR FINITE ELEMENT
ANALYSIS
3.1 INTRODUCTION
The finite element method (FEM) is the most popular simulation method to predict
the physical behavior of systems and structures. Although the method was originally
developed to find a solution for problems of structural mechanics it can nowadays be
applied to a large number of engineering disciplines in which the physical
description results in a mathematical formulation with some typical differential
equations which can be solved numerically. Much research work has been done in
the field of numerical modeling during the recent years which enables engineers
today to perform simulations close to reality. Nonlinear phenomena in structural
mechanics such as nonlinear material behavior, large deformations or contact
problems have become standard modeling tasks. If experimental or analytical results
are available it is easily possible to verify any finite element result. In this chapter,
the actual work regarding the finite element modeling of a single steel angle
connected to horizontal and vertical angles as a component of a truss has been
described in detail. The representation of various physical elements with the FEM
(Finite Element Modeling) elements, properties assigned to them, boundary
conditions, material behavior and analysis types have also been discussed. The
various obstacles faced during modeling, material behavior used and details of finite
element meshing were also discussed in detail.
3.2 FINITE ELEMENT MODELING OF THE TRUSS SYSTEM
3.2.1 Modeling Methodology
FEM is a powerful technique originally developed for numerical solution of complex
problems in structural mechanics, and it remains the method of choice for complex

Methodology for Finite Element Analysis 44
systems. A large number of finite element analysis computer packages are available.
Of these packages, ANSYS 11.0 has been chosen for its versatility and relative ease
of use. ANSYS is capable of modeling and analyzing a vast range of two-
dimensional and three-dimensional practical problems. An example of the
configuration of the three dimensional finite element model of the truss structure is
shown in the figure 3.1. The model consists a target angle. The truss is designed so
that the target angle fails first without introducing significant deformations in the
remainder of the truss. Following each test, only the target angle is replaced,
allowing multiple tests to be conducted in the same setting as was conducted by
Elgaaly et al (1991).
Figure 3.1 General 3-D sketch of the problem
Both the provisions for single bolted and double bolted connections have been made
at the two ends of the target angle by modifying the effective length of that angle
member. Angle specimens were discretized into a mesh of elements using general-
purpose 4-node Shell 181 elements as specified in ANSYS. The target angle is
discretized into different mesh size considering the cross-sectional dimensions of the

Methodology for Finite Element Analysis 45
target angle rather than the dimensions of other angle members. Discussion about the
element is shown below in details:
SHELL181 Element Description
SHELL181 is suitable for analyzing thin to moderately-thick shell structures. It is a
4-node element with six degrees of freedom at each node: translations in the x, y, and
z directions, and rotations about the x, y, and z-axes. (If the membrane option is
used, the element has translational degrees of freedom only). The degenerate
triangular option should only be used as filler elements in mesh generation.
SHELL181 is well-suited for linear, large rotation, and/or large strain nonlinear
applications. Change in shell thickness is accounted for in nonlinear analyses. In the
element domain, both full and reduced integration schemes are supported.
SHELL181 accounts for follower (load stiffness) effects of distributed pressures.
Figure 3.2 SHELL181 Geometry
xo = Element x-axis if ESYS is not provided.
x = Element x-axis if ESYS is provided.

Methodology for Finite Element Analysis 46
SHELL181 Input Data
The geometry, node locations, and the coordinate system for this element are shown
in "SHELL181 ". The element is defined by four nodes: I, J, K, and L. The element
formulation is based on logarithmic strain and true stress measures. The element
kinematics allows for finite membrane strains (stretching).The thickness of the shell
may be defined at each of its nodes. The thickness is assumed to vary smoothly over
the area of the element. If the element has a constant thickness, only TK(I) needs to
be input. If the thickness is not constant, all four thicknesses must be input. A
summary of the element input is given in below (Table 3.1).
Table 3.1 SHELL181 Input Summary
Element name SHELL181
Nodes
I, J, K, L
Degrees of Freedom
UX, UY, UZ, ROTX, ROTY, ROTZ if
KEYOPT (1) = 0
UX, UY, UZ if KEYOPT (1) = 1
Real Constants
TK(I), TK(J), TK(K), TK(L), THETA,
ADMSUA, E11, E22, DRILL,
MEMBRANE, BENDING
Material Properties
EX, EY, EZ, (PRXY, PRYZ, PRXZ, or
NUXY, NUYZ, NUXZ),
ALPX, ALPY, ALPZ (or CTEX, CTEY,
CTEZ or THSX, THSY, THSZ),
DENS, GXY, GYZ, GXZ
Modeling Methodology of Target Angle
The finite element analysis has considered both the single bolted and double bolted
target angle specimens as tested by Elgaaly et al (1991). For single bolted target
angles, the connected leg has been divided into four portions and the outstanding leg
has been divided into two areas. The attached area of the connected leg either to the
top or bottom chord has only one portion for single bolted angles (figure 3.3). For
double bolted target angles, the connected leg has been divided into six portions and

Methodology for Finite Element Analysis 47
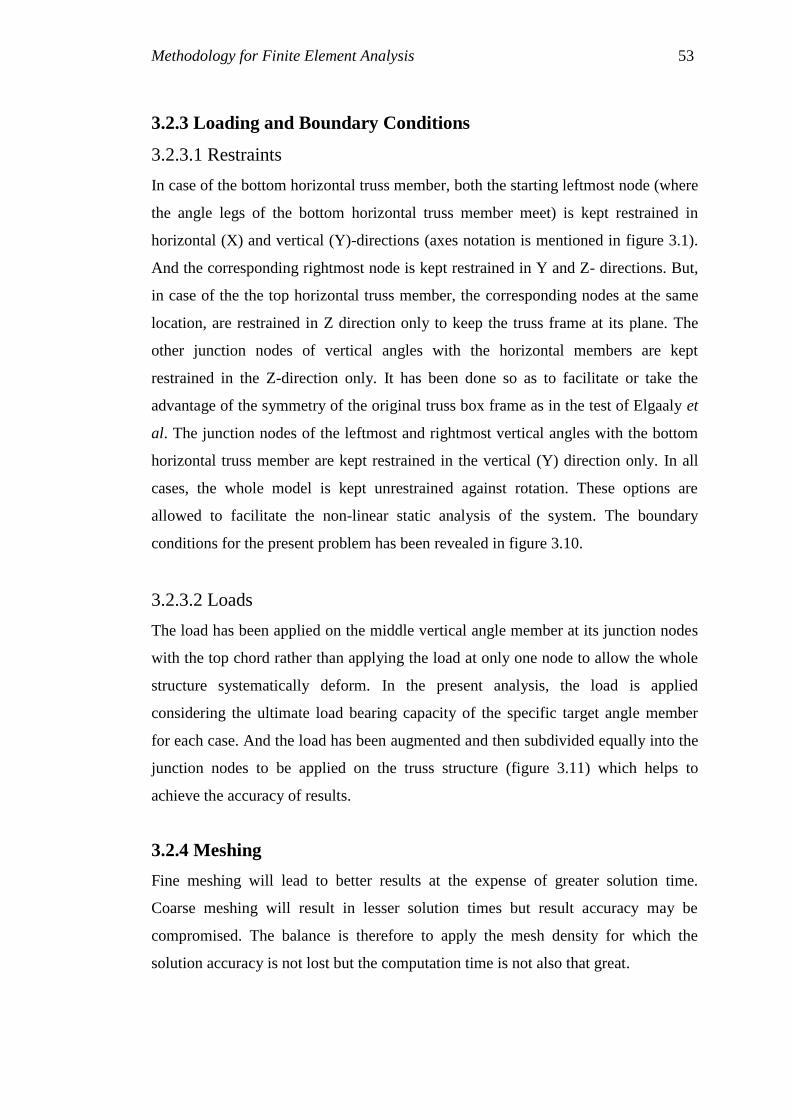
the outstanding leg has been divided into four areas (figure 3.4). The attached area of
the connected leg either to the top or bottom chord has two equal portions of areas
for double bolted angles (figure 3.5). Figure 3.5 shows how a target angle is
connected to the bottom chord.
Figure 3.3 Area formation of target angle for single bolted specimen
Calculation of Member Forces
Experiment of Elgaaly et al(1991)
The method used to calculate member forces from strain readings involves direct
integration of the stress over the cross-sectional area and was developed to handle the
inelastic failures encountered for the specimens tested. Figure 3.8 shows a typical
strain diagram. The member force is computed as follows using numerical
integration:
where AE = portion of the cross section where Eε < FY; AP = portion of the cross
section where Eε > FY; and FY = the actual yield stress of the specimen. An
advantage of this method is that it easily allows the inclusion of residual stresses in
the analysis.
(3.1)
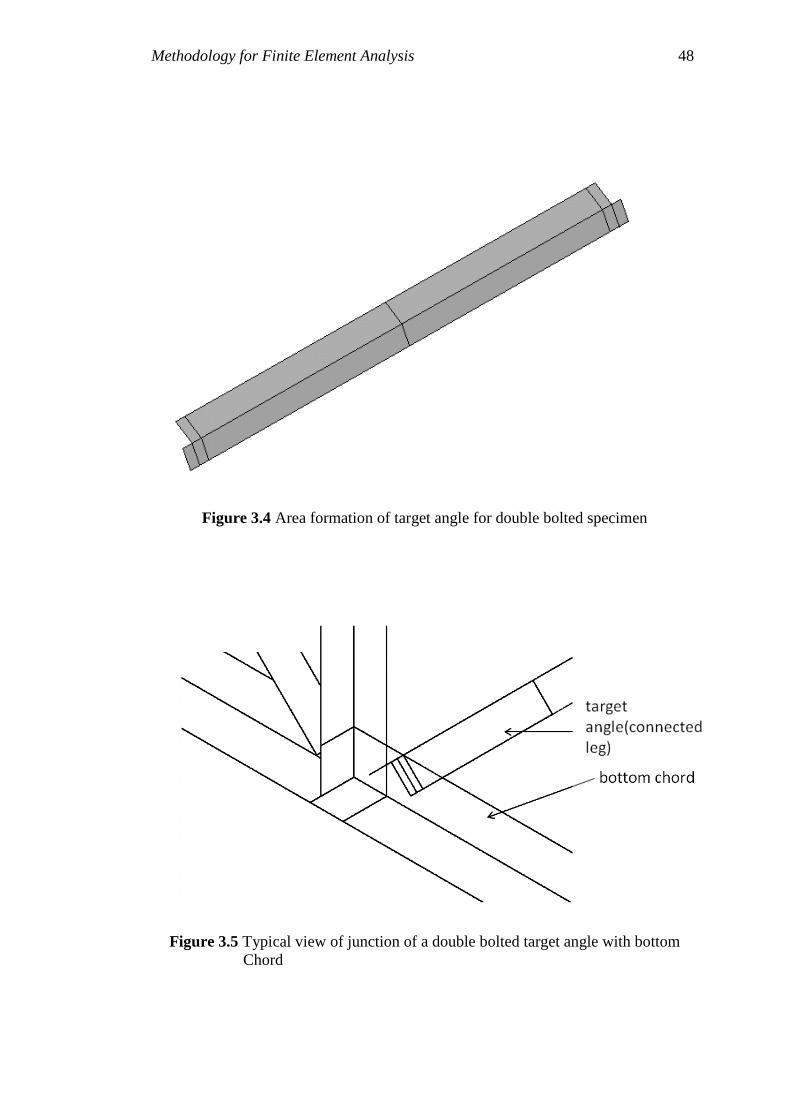
Methodology for Finite Element Analysis 48
Figure 3.4 Area formation of target angle for double bolted specimen
Figure 3.5 Typical view of junction of a double bolted target angle with bottom
Chord

Methodology for Finite Element Analysis 49
(a) Single bolted angle (b) Double bolted angle
Figure 3.6 Area formation of target angle (half of the specimen)
Figure 3.7(a) Typical view of calculating member force from element stresses along

Methodology for Finite Element Analysis 50
mid cross-section (double bolted target angle)
Figure 3.7(b) Typical element divisions along the mid cross-section of target angle
for calculating element stresses to obtain the member force of the
corresponding angle
This is accomplished by combining the residual stress diagram with the measured
stress distribution, and using an elastic-plastic material model. The member force is
then obtained as follows:
where, AE = portion of the cross section where (Eε R )< FY; AP =portion of the
cross section where (Eε R ) > FY; and R = the residual stress.
Finite Element Analysis
In the present study, the member force of target angles have been calculated using
element stresses. Then using the universal equation:
AreaStressForce
the member force has been evaluated. For this purpose, at first, the angle member has
been divided into two equal divisions (figure 3.6 (a) and figure 3.6(b)). Then, taking
either the lower half or the upper half portion, an infinitesimal strip of a number of
elements have been chosen as target whose stresses are to be obtained (figure 3.7(a)).
(3.2)
(3.3)

Methodology for Finite Element Analysis 51
Fig
ure
3.8
Typic
al s
trai
n d
istr
ibuti
on (
test
of
(Elg
aaly
et
al
(1991))

Methodology for Finite Element Analysis 52
Finally, the member force has been calculated by directly integrating the
multiplication of individual element stress and corresponding element area as shown
in figure 3.7(b).
3.2.2 Material Properties
The materials for the elements have been taken as bilinear kinematic hardening
(BKIN). The option assumes that the total stress range is equal to twice the yield
stress, which is recommended for general small-strain use for materials that obey von
Mises yield criteria (which includes most metals).
Figure 3.9 Bilinear kinematic hardening (BKIN)
In the figure 3.9,
y = yield stress
y = strain corresponding to yield stress
E1 = modulus of elasticity up to yield point
E2 = modulus of elasticity after exceeding yield point
The Poisson’s ratio is taken as 0.25. The modulus of elasticity of the angle members
has been assumed 200 kN/mm2 (the modulus of elasticity of steel).
Methodology for Finite Element Analysis 53
3.2.3 Loading and Boundary Conditions
3.2.3.1 Restraints
In case of the bottom horizontal truss member, both the starting leftmost node (where
the angle legs of the bottom horizontal truss member meet) is kept restrained in
horizontal (X) and vertical (Y)-directions (axes notation is mentioned in figure 3.1).
And the corresponding rightmost node is kept restrained in Y and Z- directions. But,
in case of the the top horizontal truss member, the corresponding nodes at the same
location, are restrained in Z direction only to keep the truss frame at its plane. The
other junction nodes of vertical angles with the horizontal members are kept
restrained in the Z-direction only. It has been done so as to facilitate or take the
advantage of the symmetry of the original truss box frame as in the test of Elgaaly et
al. The junction nodes of the leftmost and rightmost vertical angles with the bottom
horizontal truss member are kept restrained in the vertical (Y) direction only. In all
cases, the whole model is kept unrestrained against rotation. These options are
allowed to facilitate the non-linear static analysis of the system. The boundary
conditions for the present problem has been revealed in figure 3.10.
3.2.3.2 Loads
The load has been applied on the middle vertical angle member at its junction nodes
with the top chord rather than applying the load at only one node to allow the whole
structure systematically deform. In the present analysis, the load is applied
considering the ultimate load bearing capacity of the specific target angle member
for each case. And the load has been augmented and then subdivided equally into the
junction nodes to be applied on the truss structure (figure 3.11) which helps to
achieve the accuracy of results.
3.2.4 Meshing
Fine meshing will lead to better results at the expense of greater solution time.
Coarse meshing will result in lesser solution times but result accuracy may be
compromised. The balance is therefore to apply the mesh density for which the
solution accuracy is not lost but the computation time is not also that great.

Methodology for Finite Element Analysis 54
Figure 3.10 Finte element model with loads and boundary conditions
Figure 3.11 Close-up mesh with loads and boundary conditions

Methodology for Finite Element Analysis 55
An optimal solution is to use a fine mesh in areas of high stress gradient and a
coarser mesh in the remaining areas. Thus, in the finite element model of the present
study the target angle is discretized into finer mesh sizes considering the cross-
sectional dimensions of the target angle rather than the dimensions of other angle
members. The meshing of the remaining truss members has been done in such a
manner so that the overall mesh size for each member remains uniform.
3.2.5 Solution Method
A number of solution tools are available for the solution of nonlinear structural
problems. Complete investigation of the nonlinear behavior of structures must follow
the equilibrium path; identify and compute the singular points like limit or
bifurcation points, whose secondary branches in the equilibrium path must be
examined and followed. Several techniques to achieve the solution pattern on the
equilibrium path were presented in literature. Load controlled Newton-Raphson
method was the earliest method in this regard; but it fails near the limit point. To
overcome difficulties with limit points, displacement control techniques were
introduced. However for structural systems exhibiting snap-through or snap-back
Figure 3.12 Arc-Length Methodology

Methodology for Finite Element Analysis 56
behavior these techniques lead to error. One way to overcome the errors is the arc-
length method which was first developed by Crisfield in 1991. It has become a
powerful tool to use with finite element formulation for complete analysis of the
load-deflection path. The method uses the explicit spherical iterations to maintain the
orthogonality between the arc-length radius and orthogonal directions. It is assumed
that all load magnitudes are controlled by a single scalar parameter (i.e., the total
load factor). As the displacement vectors and the scalar load factor are treated as
unknowns, the arc-length method itself is an automatic load step method. For
problems with sharp turns in the load-displacement curve or path dependent
materials, it is necessary to limit the arc-length radius using the initial arc-length
radius. During the solution, the arc-length method will vary the arc-length radius at
each arc-length substep according to the degree of nonlinearities that is involved. The
convergence of the arc-length method at a particular substep is shown in figure 3.12.
3.2.6 Mesh Sensitivity
Mesh Density is usually an important factor influencing both the accuracy and cost
of the numerical solution. Analyses to assess the effect of mesh density were
performed on a typical test angle having cross sectional dimensions: L
50.7550.754.83 (test 42 according to the test data of Elgaaly). It has been observed
that both for the target angle and for the other angles in the truss, 4 divisions across
the width of each angle is good enough to obtain an optimal solution with excepted
time limit. The same mesh density was used for each analysis.
3.3 TYPICAL ANALYSIS RESULTS
3.3.1 Typical Load-Deflection Behavior
The load-deflection relationship has been signed out as the best characterization of
the load carrying behavior of single steel angles subjected to eccentric axial loads.
During the finite element analysis of the truss, a load was imposed on the structure
subdiving it on each of the junction nodes of the middle vertical angle with the top
chord. Due to the nodal loads, each time target angle has undergone an axial
compressive force along with some axial shortening (figure 3.13). At different stages

Methodology for Finite Element Analysis 57
of applying load, corresponding axial forces and axial shortenings have been
obtained. Typical axial load (P) versus lateral displacement ( ) curves obtained
from non-linear finite element analysis using this methodology are shown in figures
3.14 and 3.15, the first one for a double bolted angle (test 34) and the next one for a
single bolted angle (test 26) according to the test data of Elgaaly (1991).
Figure 3.13 General two-dimensional figure of the model
In the figure 3.13,
F = applied axial compressive load
R = support reactions
P = axial compressive load capacity of the target angle
Δ = axial displacement (shortening) due to applied compressive load
3.3.2 Deflected Shapes
Typical deflected shape of the finite element model has been shown in Figure 3.16.
The deflected shape has been exaggerated in Figure 3.17 for illustration process.
Figure 3.18 depicts the deflected model from top view.
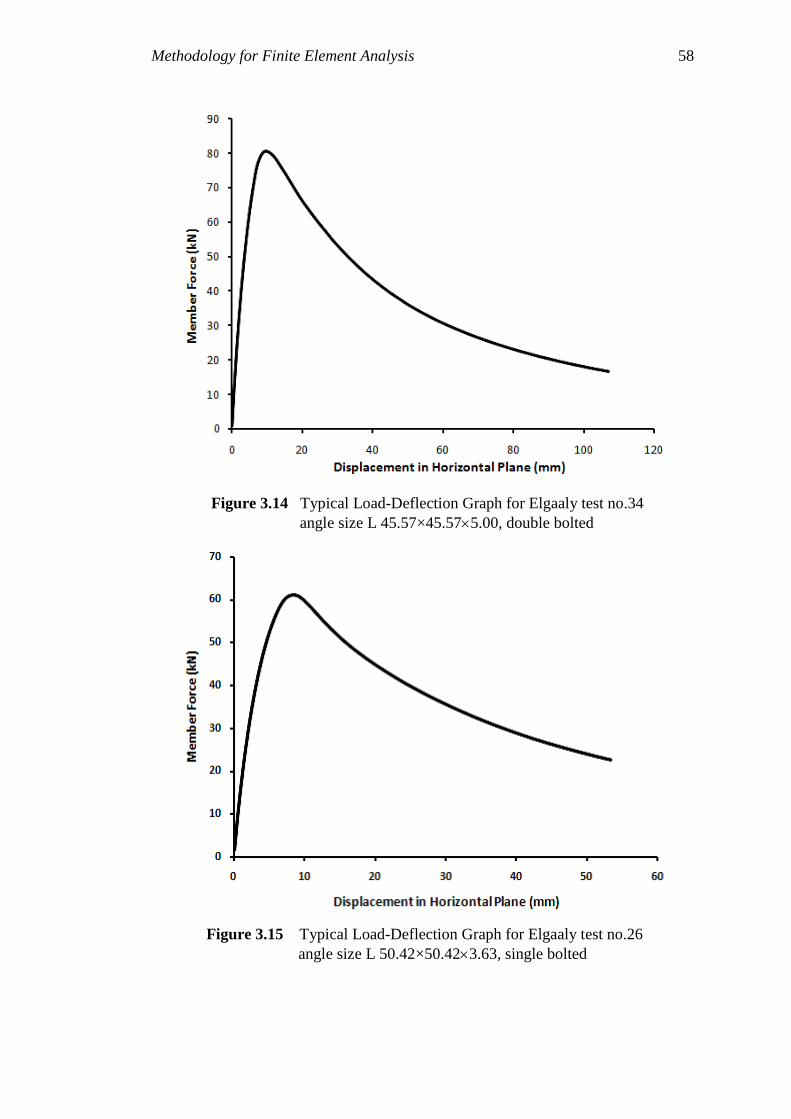
Methodology for Finite Element Analysis 58
Figure 3.14 Typical Load-Deflection Graph for Elgaaly test no.34
angle size L 45.57×45.575.00, double bolted
Figure 3.15 Typical Load-Deflection Graph for Elgaaly test no.26
angle size L 50.42×50.423.63, single bolted

Methodology for Finite Element Analysis 59
Figure 3.16 Typical deflected shape of the model
Figure 3.17 Typical deflected shape of the model (close-up view)
Figure 3.18 Typical deflected shape of the model (top view)

Methodology for Finite Element Analysis 60
3.4 VALIDATION OF FINITE ELEMENT MODEL
In the present study it has been assumed that finite element modeling can reasonably
simulate the behavior of the single steel angles subjected to eccentric compressive
load as a part of a truss structure. In his paper, Elgaaly described the load-deflection
characteristics of two single bolted angles (test 42 (angle size: L 50.7550.754.83),
test 26 (angle size: L 50.4250.423.63)) and two double bolted angles (test 34
(angle size: L 50.0650.063.38), test 9 (angle size: L 45.5745.575.00)). The
author has used finite element methods described earlier to recreate the load-
deflection characteristics of the same angle members in order to validate the finite
element analysis adopted in the present study. Both the results obtained from the test
of Elgaaly (1991) and from finite element analysis for each angle member have been
graphically represented in chapter 4 (figure 4.8 to figure 4.11) and then compared.
Figure 3.19 shows typical comparative load-deflection graph for test 34. It has been
observed that, the load-deflection curve obtained from test data of Elgaaly and from
data of the present study follow the same trend and the peak loads are also very close
to each other.
Figure 3.19 Load-deflection graph of test 34: angle size L 45.57×45.575.00
(double bolted)
Methodology for Finite Element Analysis 61
The main distinguishing point is that in the present study, more data has been taken
to accurately obtain the actual load-deflection behavior of target angle members.


Methodology for Finite Element Analysis 48

Methodology for Finite Element Analysis 49

Methodology for Finite Element Analysis 50

Methodology for Finite Element Analysis 51
57


Chapter 4
RESULTS AND DISCUSSIONS
4.1 INTRODUCTION
The prime objective of this thesis is to simulate the truss system and the actual
conditions of the tests conducted by Elgaaly et al (1991) on non-slender single-
angle-compression members. These members (denoted as target angles) were tested
to failure as part of a three-dimensional truss. The experimental program of Elgaaly;
including the test specimens, test apparatus, instrumentation, and test procedure has
been described in detail in article no. 2.5. The truss system used for the test of
Elgaaly has been tried to model and analyze using finite element method in the
present study. The necessary input data, loads, boundary conditions, slight
modifications for the advantage of finite element modeling of the actual test set-up
etc. have been discussed concisely in chapter-3. In the present section, the results of
finite element analysis along with the ultimate compressive load capacity using
different code formulas and the test results of Elgaaly has been presented. All the
results are compared in values and graphically represented for the ease to justify the
results from various aspects and to make comments and suggestions for further
recommendations.
4.2 PRINCIPAL FEATURES OF PRESENT ANALYSIS
A total of 50 single angle specimens were tested as a part of a three-dimensional
truss by Elgaaly et al (1991) of which the failure loads have been obtained for 47
specimens. These are the angle members which have been reinvestigated by the
author using finite element analysis. The load capacities of same angles have also
been calculated using the AISC 2005 Specification, ASCE Standard 10-97:
Design of Latticed Steel Transmission Structures, British Standard 8100 (Lattice
towers and masts-Part 3), AASHTO Formula, CRC (Column Research Council)
Formula and IS-800-2007(Indian Standard).
Results and Discussions 63
There are 22 single-bolted and 25 double-bolted angle members having different
width-thickness ratio, slenderness ratio and separate distinguished yield stresses.
In calculating the member force of separate target angles using finite element
analysis, the slenderness ratio and yield stress have been kept as input as
mentioned in the test of Elgaaly et al (1991).
The failure load is determined from axial load versus displacement data that were
obtained from non-linear analysis using finite element method. The failure load is
taken as the maximum axial load, which occurs just prior to buckling of the
specimen. Large increases in displacement coupled with decreasing in axial load
are common for global flexural failures, thus giving a well-defined failure load.
For the purpose of comparison with experimental strength, the factors of safety
employed in different code provisions are taken as unity.
4.3 PRESENTATION OF RESULTS
4.3.1 Axial Force vs Lateral Displacement Response
Different failure modes with distinguished failure loads have been found for both
single bolted and double bolted specimens.. For the ease of discussion, 8 specimens
(4 single bolted and 4 double bolted) are chosen by the author as the representative of
47 specimens to describe the salient features of the buckling analysis of the target
angles. The single bolted target angles are designated by the test number: 53, 35, 31,
and 42 and the double bolted target angles are designated by test number: 1, 34, 20
and 18 according to the test of Elgaaly (1991).
The geometric properties as well as loading conditions etc of the reference specimens
aforementioned are listed in the table 4.1(a) and table 4.1(b). The figures 4.1 and 4.2
show the typical pattern of the load vs displacement graphs, where response is
observed to be linear until failure. As expected, all samples failed due to buckling of
the connected leg of the target angle. The failure mode was global flexural torsional
(FT) mode without local buckling of the angle leg which is similar to the failure
mode of specimen 24 as described by Elgaaly (figure 4.3). As observed, all the load-

Results and Discussions 64
deflection graphs show the same trend. Once the pick load reaches, after that point
force eventually diminishes with further increase of deflection.
Table 4.1(a): Properties of Reference Specimens (single bolted)
test
no.
width,
w
(mm)
thickness,
t
(mm)
w/t slenderness
ratio, l/r
yield
stress,
FY
(kN/mm2)
Failure load (kN)
Elgaaly
Test
Present
Analysis
42 50.75 4.83 10.52 81 317.9 80.51 83
35 44.93 5.13 8.76 93 339.9 75.44 77.71
31 50.39 5.08 9.92 81 339.2 85.98 91.41
53 44.42 3.38 13.15 92 353 48.04 47.42
Figure 4.1 Typical axial force vs lateral displacement graph for single bolted angles
based on Finite Element Analysis
From figure 4.1, it has been demonstrated that the peak loads are different for the
target angles. The reason of the variations in results may be due to different width-
thickness ratio, slenderness ratio, yield stress etc of the target angles. For example,
let us consider test 53 and test 31. The specimen of test 31 has larger cross-sectional
width and thickness but lower w/t ratio (9.92) and lesser value of yield stress (339.2
kN/mm2) as compared to the specimen of test 53. It has been observed that in case of
both Finite Element Study and test of Elgaaly, with the increase of w/t ratio, l/r ratio

Results and Discussions 65
and yield stress, the ultimate load capacity of angle sections decrease. As expected,
for all the target angles, the load capacities of angles increase with the decrease of l/r
ratio. With the increase of w/t ratio, load capacity increases for the specimens having
same yield stress (test 31 and test 35). For the specimens having same l/r ratio, load
capacity decrease with the increase of w/t ratio and decrease of yield stress (test 42
and 31).
Table 4.1(b): Properties of Reference Specimens (double bolted)
test
no.
width,
w
(mm)
thickness,
t
(mm)
w/t slenderness
ratio, l/r
yield
stress, FY
(kN/mm2)
Failure load (kN)
Elgaaly
Test
Present
Analysis
18 63.17 5.05 12.50 67 315.2 112.7 114.2
20 50.6 5.08 9.96 86 326.9 97.5 92.1
34 45.57 5 9.11 99 342.8 80.2 80.9
1 43.97 3.53 12.45 98 344.1 49.2 53.7
Figure 4.2 Typical axial force vs lateral displacement graph for double bolted angles
based on Finite Element Analysis
From the illustration of figure 4.2, different peak loads for the reference specimens
are seen like single bolted specimens. In all cases, with the increase of slenderness
ratio, load capacity of angle sections decrease. Let us consider, test 18 and test 20. In
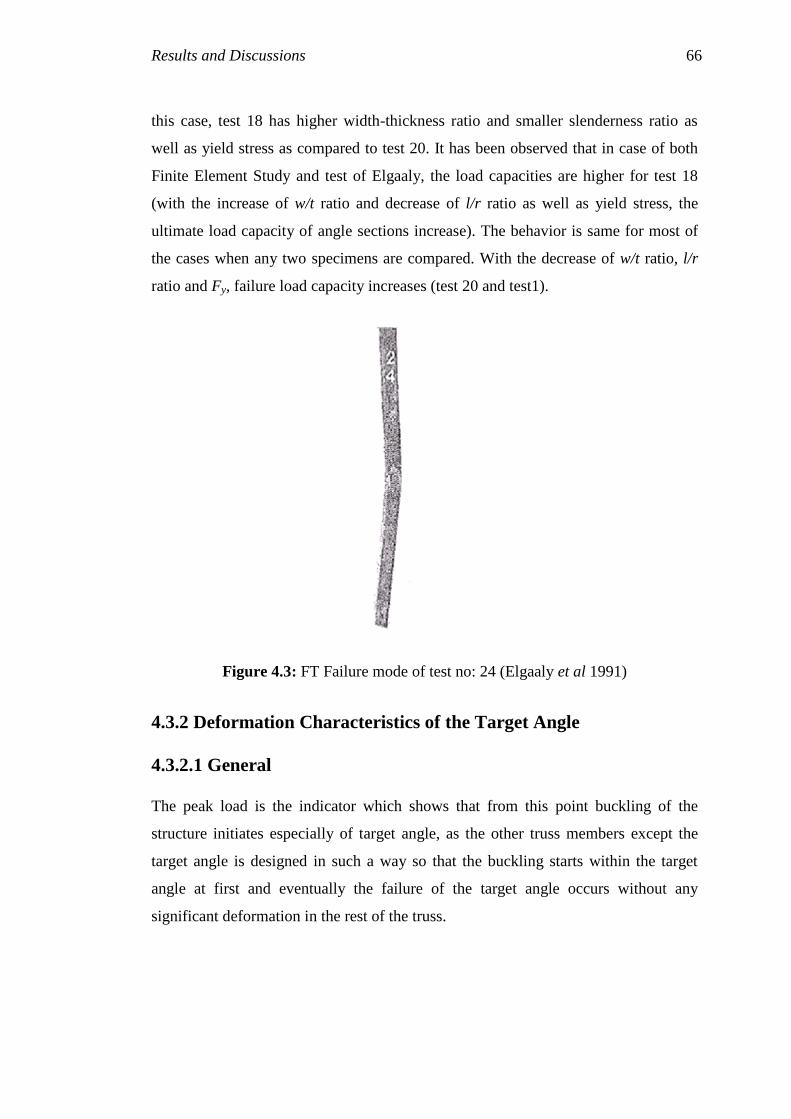
Results and Discussions 66
this case, test 18 has higher width-thickness ratio and smaller slenderness ratio as
well as yield stress as compared to test 20. It has been observed that in case of both
Finite Element Study and test of Elgaaly, the load capacities are higher for test 18
(with the increase of w/t ratio and decrease of l/r ratio as well as yield stress, the
ultimate load capacity of angle sections increase). The behavior is same for most of
the cases when any two specimens are compared. With the decrease of w/t ratio, l/r
ratio and Fy, failure load capacity increases (test 20 and test1).
Figure 4.3: FT Failure mode of test no: 24 (Elgaaly et al 1991)
4.3.2 Deformation Characteristics of the Target Angle
4.3.2.1 General
The peak load is the indicator which shows that from this point buckling of the
structure initiates especially of target angle, as the other truss members except the
target angle is designed in such a way so that the buckling starts within the target
angle at first and eventually the failure of the target angle occurs without any
significant deformation in the rest of the truss.

Results and Discussions 67
Let us consider the case of test 53 of Elgaaly (1991).The specimen has width-
thickness ratio is equal to 13.15 with slenderness ratio of 92.0 (the highest ratio of all
the groups of single bolted target angles). From finite element analysis the obtained
failure load is 47.42 kN whereas compressive load carrying capacity from the test of
Elgaaly is 48.04 kN and from ASCE Manual the calculated load capacity is 50.66
kN. So, it has been observed that finite element analysis reasonably estimates the test
load whereas ASCE Manual overestimates the load capacity to some extent. The
finite element analysis gives the failure patterns represented below:
4.3.2.2 Initial stage
Just when the load reaches the pick, no significant deformation is observed initially.
But gradually when the load tends to decrease and reaches a small but considerable
percentage of the pick load value, some extent of deformation occurs. In this stage,
the deflection initiates with the bending of the connected leg of the target angle. The
rest of the truss members are in the position where they were (figures 4.4, 4.5, and
4.6).
Figure 4.4 Deflection pattern of the truss frame at the early stage of buckling (front
view)
Figure 4.5 Deflection pattern of the truss frame at the early stage of buckling (top
view (close-up))

Results and Discussions 68
Figure 4.6 Deflection pattern of the truss frame at the early stage of buckling (front
view (close-up))
4.3.2.3 Final stage
When the load value eventually diminishes and comes to the final diminishing point,
the deflection is associated with the bending of the connected leg along with the
twisting of the unconnected leg of the target angle. Additionally the unconnected leg
of the top horizontal member also faces twisting.
Figure 4.7 Deflection pattern of the truss frame at the final stage of buckling (front
view)
Figure 4.8 Deflection pattern of the truss frame at the final stage of buckling (top
view (closeup))

Results and Discussions 69
The lower middle half portion of the target angle faces severe bending stress
specially the lowermost connected region of the target angle. The middle vertical
angle and the corresponding junction have displaced downwards from their original
position. The deflected shapes of the target angle can be easily realized from figure
4.7 and figure 4.8.
4.3.3 Comparative Results
4.3.3.1 Typical comparative load vs deflection graphs
In his paper, Elgaaly described the member force vs displacement graphs of 2 single
bolted (test 42 and test 26) and 2 double bolted (test 34 and test 9) target angles. The
same specimens are analyzed by means of finite element method. It has been
observed from the comparative figures 4.9 to 4.12 that results from test of Elgaaly
and from Finite Element Method are relatively close for all the specimens except for
specimen of test 26 (the reason may be the higher w/t ratio of the specimen, which is
13.88 and it is noteworthy that test 26 is included in group 8, which have single
bolted specimens having higher w/t ratios as compared to the other groups as
mentioned by Elgaaly). The observed deviations may be due to the fact that during
modeling the truss system, bolted connection is simply replaced by modeling the
connecting portions as the integral parts as the component angle members. So in the
finite element model considered here, no stress concentration has occurred, moreover
in modeling, the entire truss system has same stiffness and the restraints are almost
fixed in the majority of the junction points. But these are not the actual conditions
while the test was performed by Elgaaly (1991) on the same angle members. So,
some overestimation occurs for some of the angles. Overall, finite element analysis
gives more logical results for double bolted angles than for single bolted specimens
as the prevailing methodology of modeling the truss frame in finite element is more
compatible to the restraint conditions of double bolted conditions (more fixity in
double bolted than single bolted connections).

Results and Discussions 70
Figure 4.9 Load-deflection graph of angle size L 45.5745.575.00, double bolted
(test 34)
Figure 4.10 Load-deflection graph of angle size L 50.7550.754.83, single bolted
(test 42)

Results and Discussions 71
Figure 4.11 Load-deflection graph of angle size L 50.0650.063.38, double bolted
(test 9)
Figure 4.12 Load-deflection graph of angle size L 50.4250.423.63, single bolted
(test 26)

Results and Discussions 72
4.3.3.2 Correlation between test and present study
For both double bolted and single bolted target angles, the failure loads obtained
from finite element analysis as well as test of Elgaaly and geometric properties of the
specimens are represented in table 4.2 (a) and table 4.2 (b). Correlation between test
data of Elgaaly and present analysis are studied for single and double bolted angles
(shown in figure 4.13 and figure 4.14 respectively).
Table 4.2(a): Results for single bolted angles
Test
no.
w
(mm)
t
(mm)
w/t l/r yield
stress, FY
(kN/mm2)
Failure load (kN)
Elgaaly
test
Present
analysis
P
factor
P
factor
(%)
53 44.42 3.38 13.15 92 353 48.04 47.42 0.99 99
54 44.37 3.35 13.23 92 341.3 44.3 46.17 1.04 104
55 44.55 3.45 12.90 92 353 44.79 48.93 1.09 109
56 44.42 3.43 12.96 92 351.6 46.35 48.31 1.04 104
57 44.48 3.45 12.87 92 359.9 43.99 49.28 1.12 112
24 45.42 4.95 9.17 93 339.2 67.43 75.26 1.12 112
35 44.93 5.13 8.76 93 339.9 75.44 77.71 1.03 103
36 45.16 5.26 8.59 93 343.4 77.8 80.73 1.04 104
37 45.11 4.83 9.35 93 347.5 60 73.66 1.23 123
26 50.42 3.63 13.88 80 342 45.64 61.12 1.34 134
27 50.19 3.51 14.32 80 331.6 38.88 57.16 1.47 147
28 50.83 3.68 13.80 80 356.5 42.39 64.05 1.51 151
38 49.96 3.53 14.15 80 350.3 49.86 59.25 1.19 119
31 50.39 5.08 9.92 81 339.2 85.98 91.41 1.06 106
40 50.75 4.98 10.19 81 322.7 71.08 86.91 1.22 122
41 50.67 5 10.13 81 317.2 81.04 86.25 1.06 106
42 50.75 4.83 10.52 81 317.9 80.51 83 1.03 103
45 62.99 5.13 12.28 65 326.8 87.36 117.03 1.34 134
46 63.53 5.16 12.32 65 331.6 86.69 119.74 1.38 138
47 63.63 5 12.72 65 331.6 89.81 115.64 1.29 129
48 63.45 4.93 12.88 65 328.9 93.72 112.53 1.20 120
49 63.07 5.03 12.54 65 343.4 88.69 118.54 1.34 134
Mean=78.19kN; Standard deviation=25.52kN (present analysis)
Correlation coefficient
Linear regression (trendline) which have been plotted in figure 4.13 and figure 4.14
indicate that:
Co-efficient of determination, R2=0.856 (for single bolted specimens)
0.879 (for double bolted specimens)

Results and Discussions 73
Figure 4.13 Correlation between test and present study for single bolted target
angles
Figure 4.14 Correlation between test and present study for double bolted target
angles
And correlation co-efficient, R= 925.0856.0 (single bolted)
= 0.938(double bolted)

Results and Discussions 74
Generally, the correlation coefficient, R, ranges from -1 to +1. R equal to 1.0
indicates a perfect correlation. Therefore, the R values obtained for both single and
double bolted angles indicate nearly perfect correlations.
Table 4.2(b): Results for double bolted angles
Test
no.
w
(mm)
t
(mm)
w/t l/r yield
stress, FY
(kN/mm2)
Failure load (kN)
Elgaal
y test
Present
analysis
P
factor
P
factor
(%)
1 43.97 3.53 12.45 98 344.1 49.2 53.7 1.09 109
2 43.69 3.58 12.20 98 363.4 66.1 56 0.85 85
3 43.99 3.45 12.74 98 341.4 63.6 52.1 0.82 82
4 44.02 3.56 12.38 98 344.8 61.7 54.3 0.88 88
5 44.07 3.43 12.85 98 340.7 58.2 51.6 0.89 89
6 44.75 5.05 8.85 99 328.3 98.2 78.7 0.8 80
7 44.88 4.93 9.11 99 335.9 97 77.9 0.8 80
8 44.88 5.03 8.92 99 329 93.5 78.7 0.84 84
33 44.91 4.98 9.02 99 353.1 85.5 81.1 0.95 95
34 45.57 5 9.11 99 342.8 80.2 80.9 1.01 101
9 50.06 3.38 14.82 85 324.1 51.4 56.6 1.1 110
10 50.11 3.33 15.06 85 320 48.8 55.2 1.13 113
11 50.14 3.43 14.62 85 324.8 64.5 57.9 0.9 90
12 51.21 3.33 15.39 85 342.8 52.8 57.7 1.09 109
13 49.96 3.38 14.79 85 329.7 64.5 57.1 0.89 89
20 50.6 5.08 9.96 86 326.9 97.5 92.1 0.94 94
21 50.47 5.13 9.84 86 315.9 88.3 90.8 1.03 103
22 50.42 4.95 10.18 86 328.3 94.6 89.7 0.95 95
43 50.83 5.08 10.00 86 315.9 84.9 90.3 1.06 106
44 51 5.03 10.17 86 313.8 82.1 89.1 1.09 109
18 63.17 5.05 12.50 67 315.2 112.7 114.2 1.01 101
19 63.07 5.05 12.48 67 327.6 110.1 117.3 1.07 107
50 63.6 5.16 12.33 67 336.6 117.9 122.9 1.04 104
51 63.7 5.08 12.54 67 327.6 111 118.7 1.07 107
52 63.8 5.31 12.02 67 329.7 116.1 124.8 1.07 107
Mean=79.98kN; Standard deviation=24.82kN (present analysis)
Capacity factor (P factor)
The capacity factor (P-factor) is the ratio of angle capacity obtained from present
analysis to the actual test capacity. Evaluating the P-factor is a way to show how
close the actual angle capacity is to the angle capacity obtained from finite element
analysis. It has been observed that for single bolted specimens, all values of P-factors
except for test 53 is greater than 1.00 which indicates that finite element analysis
Results and Discussions 75
gives reasonably close results to the test with a slight overestimation. In case of
double bolted angles, P-factors for some of the angles are less than 1.00 indicating
underestimation of corresponding test results.
Standard deviation
Standard deviation is a widely used measure of variability or diversity which shows
how much variation or dispersion exists from the average (mean, or expected value).
The standard deviation is the root mean square (RMS) deviation of the values from
their arithmetic mean. Generally, a low standard deviation indicates that the data
points tend to be very close to the mean, whereas high standard deviation indicates
that the data points are spread out over a large range of values. In case of single
bolted angles, the arithmetic mean of the results of finite element study is equal to
78.19 with a standard deviation of 25.57. In case of double bolted angles, the
arithmetic mean is 79.98 and the corresponding standard deviation is 24.82. Both the
values of standard deviations are much lower than corresponding means indicating
that most of the data points are very close to the mean values. Moreover, it also
means that most of the data (about 68%, assuming a normal distribution) have a
failure load within one standard deviation of the mean and almost all the data (about
95%) have a failure load within two standard deviations of the mean.
4.3.3.3 Comparison with codes and discussions
Comparative results of single bolted angles
The bar charts are presented in figure 4.15 to 4.22 for the ease of discussion of
results of buckling loads of single and double bolted angles using various renowned
code provisions, test performed by Elgaaly et al and finite element analysis. In case
of single and double bolted target angles, the test result, finite element output and
result evaluated from ASCE code show relatively close values. The figures for single
bolted angles depict that finite element outputs slightly overestimates the load
carrying capacity of angles found from test.
86
87

Results and Discussions 76
Figure 4.15 Comparison of buckling load for Elgaaly test no.53
angle size L 44.4244.423.38, single bolted
Figure 4.16 Comparison of buckling load for Elgaaly test no.35
angle size L 44.9344.935.13, single bolted

Results and Discussions 77
Figure. 4.17 Comparison of buckling load for Elgaaly test no.31
angle size L 44.9344.935.13, single bolted
Figure 4.18 Comparison of buckling load for Elgaaly test no.42
angle size L 50.7550.754.83, single bolted

Results and Discussions 78
The figures for double bolted angles also show the same trend for the majority of
cases. Of the other codes, Indian standard code gives relatively close results to test,
FEM and ASCE in case of double bolted angles, whereas underestimates the load
capacities of single bolted angles. The AASHTO and CRC Formula give the same
result. The British standard code and the AISC Formula underestimate the test results
at a large extent. The difference in results obtained using code formulas may be due
to some reasons- different codes have different formulas for effective slenderness
ratio (KL/r). Secondly, there are some codes (BS Code, IS Code, ASCE standard 10-
97 etc) having built in factor of safeties which are the integral part of the formulas
and very difficult to identify them and to exclude them in evaluating the ultimate
load capacity of angle sections.
Comparative results of double bolted angles
Figure 4.19 Comparison of buckling load for Elgaaly test no.1
angle size L 43.9743.973.53, double bolted
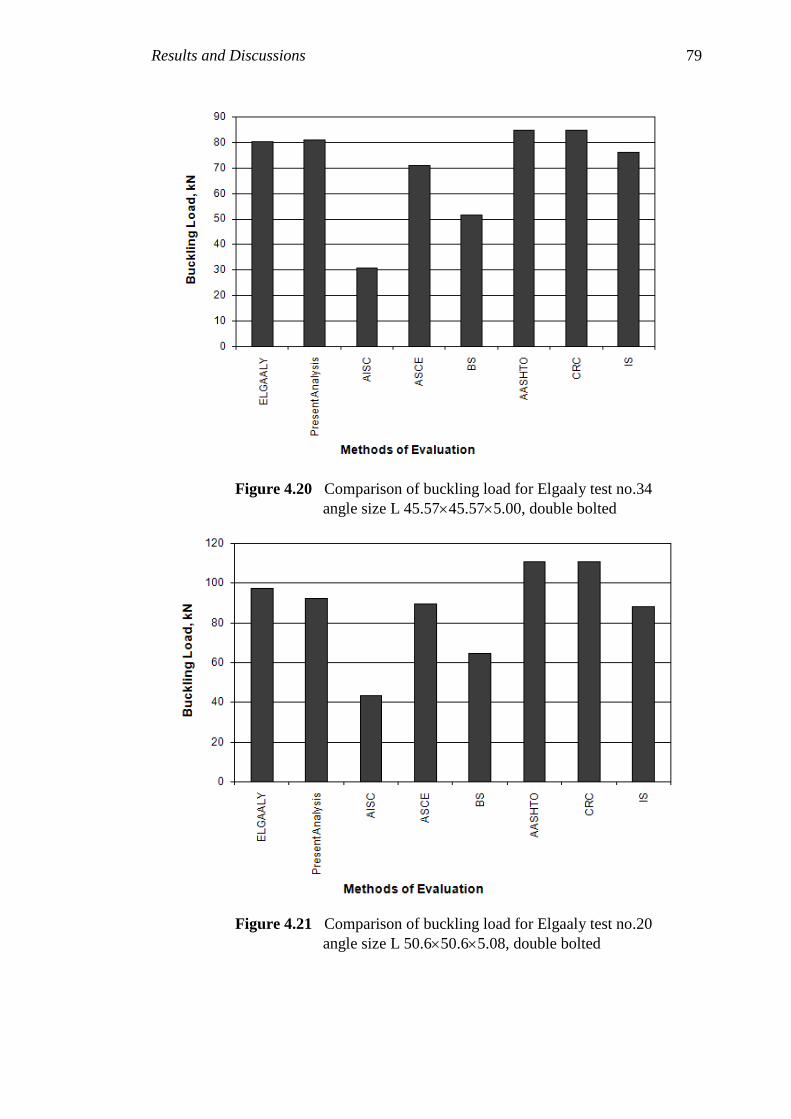
Results and Discussions 79
Figure 4.20 Comparison of buckling load for Elgaaly test no.34
angle size L 45.5745.575.00, double bolted
Figure 4.21 Comparison of buckling load for Elgaaly test no.20
angle size L 50.650.65.08, double bolted

Results and Discussions 80
Figure 4.22 Comparison of buckling load for Elgaaly test no.18
angle size L 63.17 63.175.05, double bolted
4.4 INTERPRETATION AND EXPLANATION OF
OBSERVATIONS For convenience and also for comparing the buckling loads a variable n, which is
defined as the ratio of the failure load divided by the uniform yield capacity of the
section (yield stress multiplied by the cross-sectional area), has been calculated. This
facilitates the accounting for the effect of the variations in area and yield stress
among the test specimens. Moreover % difference in n values of both single bolted
and double bolted angle specimens have been calculated. Table 4.4 pairs groups by
size and lists the percent difference in n values between the corresponding groups.
For better comparison, the average n values for both single and double bolted target
angles have been summarized in figure 4.20 and figure 4.21 respectively.

Results and Discussions 81
Table 4.4 Comparison of single bolted versus double bolted angles
Group
(1)
Angle size
(2)
l/r
(3)
End
condition
s
(4)
Elgaaly test Present analysis
Average
n
(5)
Percent
differen
ce in n
(6)
Average
n
(7)
Percent
differen
ce in n
(8)
1 44.45x44.45x3.18 98 Double 0.582 31 0.521 11
6 44.45x44.45x3.18 92 Single 0.444 0.468
2 44.45x44.45x4.76 99 Double 0.636 34 0.554 6
7 44.45x44.45x4.76 93 Single 0.476 0.522
3 50.8x50.8x3.18 85 Double 0.525 43 0.530 6
8 50.8x50.8x3.18 80 Single 0.368 0.502
4 50.8x50.8x4.76 86 Double 0.575 12 0.581 4
9 50.8x50.8x4.76 81 Single 0.514 0.560
5 63.5x63.5x4.76 67 Double 0.556 27 0.585 2
10 63.5x63.5x4.76 65 Single 0.438 0.572
Single bolted versus double bolted specimens
Figure 4.20 Comparison of buckling load factor, n
for single bolted angles

Results and Discussions 82
Figure 4.21 Comparison of buckling load factor, n
for double bolted angles
From Tables 4.4, it is seen that the double-bolted specimens are stronger than the
single-bolted specimens. From test, the average n value for the double-bolted
specimens is 0.575, which is 28% higher than that of the single-bolted specimens and
from finite element analysis, the average n value for the double-bolted specimens is
0.554, which is 5.5% higher than that of the single-bolted specimens. Moreover,
from finite element analysis, % difference in average n values for the double-bolted
specimens is 3.79, which is within the expected accuracy limit. But, for the single
bolted angles, the % difference is 17.14 which is above the accuracy limit. In
general, as observed, failure mechanism and load versus displacement characteristics
vary depending on:
-Effect of b/t ratio
-Effect of end restraints
-Effect of slenderness ratio
Effect of b/t ratio
It has been observed that in case of single bolted specimens, target angles of group-6,
as the width-thickness ratio decreases, the failure load evaluated from finite element
analysis increases proportionally. For higher b/t ratios, out of plane buckling occurs
as in the case of single bolted specimen number 53.

Results and Discussions 83
Effect of end restraints
The difference in strength between the corresponding groups with double and single
bolted connections is primarily due to the difference in end restraint conditions. In
the test of Elgaaly, the largest difference in n values occurs between groups 3 and 8
(43%). On the other hand, from the finite element analysis, the largest difference in n
values occurs between groups 1 and 6 (11%). This difference is mostly attributed to
significantly higher stress concentrations in the single-bolted connections as
compared with the double-bolted connections. The smallest difference in strength is
between groups 4 and 9 (12%) from test results, whereas, the smallest difference in n
values occurs between groups 5 and 10 (2%) from finite element study. According to
the test results of Elgaaly, the failure modes for both of these groups are the same,
with the dominant effect being global flexural buckling, which tends to emphasize
the importance of the difference in rotational end restraint as opposed to local leg
crippling.
Effect of slenderness ratio
It is expected that with the increase of slenderness ratio, axial load carrying capacity
of single steel angles decrease. But this is the case with a concentrically loaded
structure. But in case of eccentrically loaded structures, with the increase of
slenderness ratio, failure load does not decrease, rather it increases. This is the case
with the test specimens of Elgaaly. Both the test results and the results from finite
element analysis exhibit same behavior.
Relationship between Slenderness and Strength
Another area that requires explanation is the difference in failure loads between
groups of different sizes and similar end conditions. It is intuitively expected that
column strength increases with decreasing L/r ratios, and n approaches unity as L/r
approaches a limiting value close to zero. However, this is the case only for
concentrically loaded struts, which do not exhibit local failures or torsional effects.
All of the specimens tested were loaded eccentrically, and most exhibited significant
local and torsional deformations. As a result, n does not necessarily increase with
decreasing L/r values. This is true for both the single and double bolted specimens

Results and Discussions 84
for the results obatained from test of Elgaaly et al. For example, group 2 has an L/r
ratio of about 99 and double-bolted ends, and group 4 has an L/r ratio of 86 and
double-bolted ends as well, yet the average n value for group 4 is 12% lower than
that of group 2. One reason for the difference is the presence of local-torsional
effects in group 4 (b/t is about 10), which do not occur in group 2 (b/t is about 9).
Further, since all of the angles were fabricated with the bolt holes centered on the
connected legs, the load eccentricity was slightly greater for group 4 (b = 2 in.) than
for group 2 (b = 1.75 in.). This same reasoning applies when comparing any two
groups with similar end conditions that indicate decreasing n values with decreasing
L/r values. But, the same groups (group 2 and group 4) exhibit increase of average n
value for the decrease of L/r ratio observed from finite element analysis. In this case,
n value for group 4 is about 4.9% higher than that for group 2. It is of interest to note
that groups 7 and 9, which are the single-bolted counterparts of groups 2 and 4,
exhibit increasing n values with decreasing L/r values from test results of Elgaaly as
is intuitively expected. This is because the single-bolt connections cause identical
flexural-torsional failure in both groups 7 and 9, whereas the predominant failure
mode in group 2 is different from that of group 4. Finite element study also shows
the same behavior for groups 7 and 9, where n value for group 9 is about 7.3% higher
than that for group 7. The average n values for angles of all the groups exhibit same
behavior as in the test of Elgaaly, except for group 5 and group 10.
4.5 REMARKS
The results of present study are generally in well agreement with those obtained from
test of Elgaaly (1991). Hence, hopefully finite element studies may be satisfactorily
conducted for predicting the ultimate load capacity of steel angles for designing safe
tower structures. Among the codes, only the ASCE Standard 10-97 evaluates the
angle capacities with reasonable accuracy which concurs with test results as well as
with the finite element study. Therefore, design criteria of ASCE Standard 10-97
may be followed for calculating design load capacity of single angles.

Results and Discussions 85
Chapter 5
CONCLUSIONS
5.1 GENERAL
The behavior of a single angle compression member is complicated by the details of its
connection to the rest of the structure, and by the behavior of the members connected to
it. Connections are usually made to one leg of the angle so that the angle is loaded
eccentrically in a plane that lies between its principal planes. Different types of end
connection provide different types of restraint both in and out of the plane of the
connected leg. The thesis originated with the aim to validate the eccentric compressive
load carrying capacity of a single steel angle (designated as target angle; either single
bolted or double bolted) as part of a three-dimensional truss tested by Elgaaly et al
(1991). The entire system has been modeled and analyzed using Finite Element Method.
It has been proved that Finite Element Analysis can simulate the truss system and its
connection, load as well as overall practical conditions satisfactorily. And the failure
loads of the target angles obtained from finite element analysis are fairly close to the test
results obtained by Elgaaly. Therefore, the finite element model can accurately predict
the strength and behavior of single steel angles as part of a truss system.
5.2 FINDINGS
Based on the study, the following conclusions can be arrived at:
The response of steel single angles subjected to axial eccentric loading is
investigated by means of numerical modeling based on finite element techniques.
Results show that Finite Element Analysis can simulate the practical test
conditions satisfactorily and analysis results closely match with past experimental
records. So finite element studies may be an easy alternative of physical testing of
Conclusions 86
single angle structures and can be used for routine design of steel angles which will
be helpful to find out better solutions for engineers.
The load carrying capacity of the same angles has been evaluated by means of
internationally adopted standard codes for a better understanding and comparison
of results. Among the codes, The ASCE Standard 10-97 gives relatively
satisfactory results as compared to test of Elgaaly and finite element method. The
rest of the codes either overestimate or underestimate the compressive load
capacity of angle members.
It is therefore recommended that in the design of three-dimensional lattice towers
the provisions of ASCE Standard 10-97 should be followed.
5.3 SCOPE FOR FUTURE INVESTIGATION
The following recommendations may be suggested for future research work:
The present study analyzed the load capacity of some equal leg single steel angles
which were tested by Elgaaly et al (1991). The accuracy of the finite element
model considered in the study may be verified for unequal leg angle sections tested
in similar past experiments.
The angle sections investigated in this project are in the range of slenderness ratio
less than critical value i.e. all the angles are non-slender. Therefore, study can be
extended for the slender angle members.
Column curves may be established for steel angle sections which can be adopted
for routine design or may be used to calibrate special code clauses.
Finite Element study can be conducted for the ultimate capacity of bracing angle
members used in towers and trusses.
REFERENCES
Adluri, S. M. R., Madugula, M. K. S., Monforton, G. R., “Finite Element
Failure Analysis of Schifflerized Angles,” Comp. and Struct., London,
England, Vol. 41, No. 5, P. 1087-1093, 1991.
Adluri, S. M. R., and Madugula, M. K. S., "Eccentrically Loaded Steel
Single Angle Members," American Inst. of Steel Constr. Engrg. J., Vol. 29,
No. 2, P. 59-66, 1992.
Adluri, S. M. R., Studies on Steel Angle Columns, PhD dissertation,
Department of Civil and Environmental Engineering, University of Winsor,
Winsor Ontario, Canada, 1994.
Adluri, S. M. R., and Madugula, M. K. S., “Development of Column Curve
for Steel Angles,” Journal of Structural. Engineering, ASCE, Vol. 122, No.
3, P. 309-317, March, 1996.
Al-Sayed, S. H., and Bjorhovde, R., “Experimental Study of Single Angle
Columns,” J. Constructional Steel Res., London, England, Vol. 12, No. 2,
P. 83-102, 1989.
Bathon, L., Mueller, W. H., and Kempner, L., “Ultimate Load Capacity of
Single Steel Angles,” Journal of Structural Engineering, ASCE, Vol. 119,
No.1, P. 279-300, Jan., 1993.
Bleich, F., Buckling Strength of Metal Structures, New York: McGraw-hill,
1952.
Chuenmei, G., “Elasto-plastic Buckling of Steel Angle Columns,” Journal of
Structural Engineering, ASCE, Vol. 110, No. 6, P. 1391-1395, 1984.
Chwalla, E., “Die Stabilitat zentrisch und exzentrisch gedruckter Stabe aus
Baus-tahl,” Sitzungsberichte der Akademic de Wissenschaften in Wien, Abt.
IIa, Vienna, Austria, Vol. 137, P. 469, 1928.
Duberg, J. E., and Wilder, T. W., “Column Behavior in the Plastic Stress
Range,” J. Aeron. Sci., Vol. 17, No. 6, P. 323-327, 1950.
88
Elgaaly, M., Dagher, H., and Davids, W., “Behavior of Single Angle
Compression Members,” Journal of Structural Engineering, ASCE, Vol.
117, No. 12, P. 3720-3741, Dec., 1991.
Haaijer, G., Carskaddan, P. S., and Grubb, M. A., “Eccentric Load Test of
Angle Column Simulated with MSC/NASTRAN Finite Element Program,”
Proc., Annu. Meeting, Struct. Stability Res. Council (SSRC), Chicago,
Illinois, April, 1981.
Hu, Xue-Ren, and Lu, Le-Wu, “Ultimate Strength Analysis of Single Angle
Struts with End Restraints,” Report No. 471. 3, Firtz Engineering
Laboratory, Lehigh University, Bethlehem, Pa., 1981.
Ishida, A., “Experimental Study on Column Carrying Capacity of „SHY
Steel‟ Angles,” Yawata Technical Report No. 265, Yawata Iron & Steel Co.,
Ltd., Tokyo, Japan, Dec., 1968, P. 8564-8582 and P. 8761-8763, (in
Japanese).
Jezek, K., “Naherungsberechnung der Tragkraft exzentrisch gedruckterv
Stahlstabe,” Der Stahlbau, Berlin, Germany, Vol. 8, No. 12, P. 89-96, June
7, 1935,
Jezek, K., “Die Tragfahigkeit axial gedruckter und auf Biegung
beanspruchter Stahlstabe,” Der Stahlbau, Berlin, Germany, Vol. 9, No. 2, P.
12-14, Jan. 17, 1936,; Vol. 9, No. 3, P. 22-24, Jan. 31, 1936,; Vol. 9, No. 5,
P. 39-40, Feb. 28, 1936.
Karman, T., L. G. Dunn, and H.S. Tsien, “The Influence of Curvature on the
Buckling Characteristics of Structures,” Jour. Aeronaut. Sci., Vol. 7, P. 276,
1940.
Kennedy, J. B., and Murty, Madugula, K. S., “Buckling of Steel Angle and
Tee Struts,” Journal of the Structural Division, ASCE, Vol. 98, No. ST11, P.
2507-2522, Proc. Paper 9348, Nov., 1972.
Kitipornchai, S., and Lee, H. W., “Inelastic Experiments on Angles and Tee
Struts,” Res. Report No. CE54, Dept. of Civ. Engrg., Univ. of Queensland,
St. Lucia, Australia, 1984.
Lin, T. H., “Inelastic Column Buckling.” J. Aeron. Sci., Vol. 17, No. 3, P.
159-172, 1950.

89
Lu, L. W., Shen, Z. Y., Hu, X. R., “Inelastic Instability Research at Lehigh
University,” Proc., Michel R. Home Int. Conf. on Instability and Plastic
Collapse of Steel Strut., 1983.
Mueller, W. H., and Erzurumlu, H., “Limit State Behavior of Steel Angle
Columns,” Civil-Structural Engineering Division of Engineering and
Applied Science, Portland State University, Portland, Oreg, 1983.
Mueller, W. H., and Wagner, A. L., “Plastic Behavior of Steel Angle
Columns,” Civil-Structural Engineering Division of Engineering and
Applied Science, Portland State University, Portland, Oreg, 1983.
Ostenfeld, A., “Exzentrische and zentrische knickfestigkeit,” Zeitschrift des
vereines deutscher Ingenieure, Vol. 42, P. 1462, 1898.
Popov, E. P., Engineering Mechanics of Solids, Indian Branch: Pearson
Education (Singapore) Pte. Ltd., 2003.
Ros, M., “Die Bemessung zentrisch und exzentrisch gedruckter Stabe auf
knickunf ,” Report, 2nd
Congress, International Association for Bridge and
Structural Engineering, Vienna, Austria, 1928.
Salmon, C. G., and Johnson, J. E., Steel Structures: Design and Behavior.
Emphasizing Load and Resistance Factor Design, New York: HarperCollins
College Publishers, 1996.
Shanley, F. R., “Inelastic Column Theory,” J. Aero. Sci., Vol. 14, No. 5, P.
261-267, May, 1947.
Stang, A. H., and Strickenberg, L. R., “Results of Some Compression Tests
of Structural Steel Angles,” Technologic Paper of the United States Bureau
of Standards No. 218, Government Printing Office, Washington, D. C., 1922.
Tall. L., Structural Steel Design, and New York: John Wiley & Sons, 1974.
Trahair, N. S., Bradford, M. A., The Behaviour and Design of Steel
Structures, 2ndEd. Chapman&Hall, London, UK, 1988.
Trahair, N. S., “Behaviour of Single Angle Steel Beams,” Res. Report No.
R884, School. of Civ. Engrg., The Univ. of Sydney, Sydney NSW 2006,
Australia, August, 2007.
Wakabayashi, M., and Nonaka, T., “On the Buckling Strength of Angles in
Transmission Towers.” Bulletin of the Disaster Prevention Research

90
Institute, Kyoto University, Kyoto, Japan, Vol. 15, Part 2, No. 91, P. 1-8,
Nov., 1965.
Westergaard, H.M., and Osgood, W. R., “Strength of Steel Columns,”
Transactions, American Society of Mechanical Engineers, Vol. 50, Paper
No. APM-50-9, P. 65-80, 1928.
Wood, A. B., “Buckling Tests on Crossed Diagonals in Latticed Towers,”
Electra, Working Group 08 of Study Committee 22 of the International
Conference on Large High Voltage Electric Systems, Paris, France, Vol. 38,
P. 89-99, Jan., 1975.
Yokoo, Y., Wakabayashi. M., and Nonaka. T., “An Experimental Study on
Buckling of Angles,” Yawata Technical Report No. 265, Yawata Iron &
Steel Co., Ltd., Tokyo, Japan, P. 8543-8563 and P. 8759-8760, December,
1968 (in Japanese).
Young, D. H., “Rational Design of Steel Columns,” Transactions, ASCE,
Vol. 101, P. 422-451, 1936.

APPENDIX A
Results for single bolted angles
Test
no.
width, w
(mm)
thickness, t
(mm)
slenderness
ratio,
l/r
yield stress,
FY
(kN/mm2)
Failure load (kN)
Elgaaly
test
Present
analysis
AISC ASCE BS AASHTO CRC IS
53 44.42 3.38 92 353 48.04 47.42 23.13 50.66 30.07 63.38 63.34 36.43
54 44.37 3.35 92 341.3 44.3 46.17 22.91 47.64 29.31 61.96 61.92 35.36
55 44.55 3.45 92 353 44.79 48.93 23.66 51.91 30.82 64.9 64.9 37.67
56 44.42 3.43 92 351.6 46.35 48.31 23.44 51.42 30.47 64.14 64.14 37.14
57 44.48 3.45 92 359.9 43.99 49.28 23.62 51.82 31.09 65.25 65.25 38.03
24 45.42 4.95 93 339.2 67.43 75.26 33.45 73.93 42.92 90.61 90.61 59.29
35 44.93 5.13 93 339.9 75.44 77.71 34.21 75.57 43.95 92.7 92.7 61.38
36 45.16 5.26 93 343.4 77.8 80.73 35.18 77.75 45.46 95.72 95.77 63.87
37 45.11 4.83 93 347.5 60 73.66 32.43 71.66 42.12 88.65 88.65 58.09
26 50.42 3.63 80 342 45.64 61.12 35.05 62.18 40.83 87.23 87.23 44.75
27 50.19 3.51 80 331.6 38.88 57.16 33.72 58.45 37.99 82.33 82.33 41.59
28 50.83 3.68 80 356.5 42.39 64.05 35.81 63.3 42.12 91.45 91.41 46.97
38 49.96 3.53 80 350.3 49.86 59.25 33.76 58.58 38.65 85.36 85.31 43.28
31 50.39 5.08 81 339.2 85.98 91.41 47.37 93.27 55.42 118.45 118.41 70.14
40 50.75 4.98 81 322.7 71.08 86.91 46.79 91.01 53.15 113.42 113.42 66.45
41 50.67 5 81 317.2 81.04 86.25 46.97 90.78 52.8 112.58 112.58 66.05
42 50.75 4.83 81 317.9 80.51 83 45.46 87.94 51.15 109.11 109.11 63.25
45 62.99 5.13 65 326.8 87.36 117.03 73.53 130.82 81.26 167.2 167.2 85.76
46 63.53 5.16 65 331.6 86.69 119.74 74.55 133.44 83.18 171.43 171.43 87.63
47 63.63 5 65 331.6 89.81 115.64 72.55 128.5 80.95 166.8 166.84 84.02
48 63.45 4.93 65 328.9 93.72 112.53 71.3 124.99 79.09 162.84 162.84 81.62
49 63.07 5.03 65 343.4 88.69 118.54 72.24 129.66 82.47 170.67 170.67 86.16
91
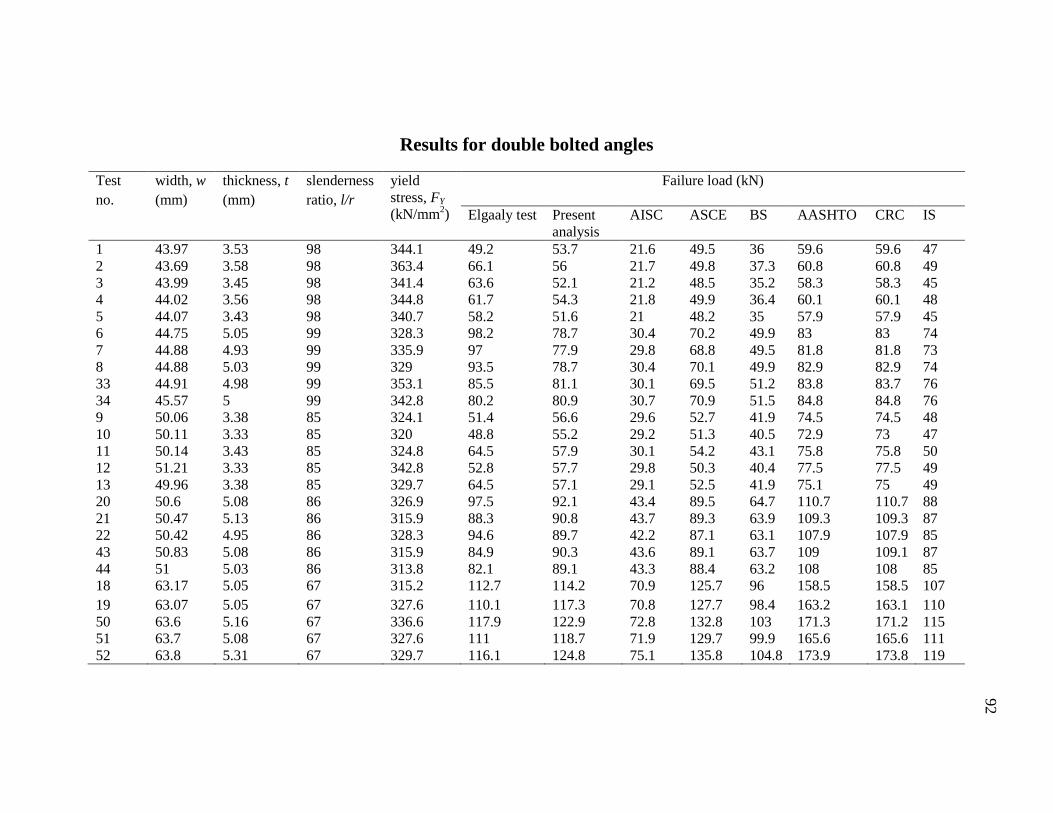
Results for double bolted angles
Test
no.
width, w
(mm)
thickness, t
(mm)
slenderness
ratio, l/r
yield
stress, FY
(kN/mm2)
Failure load (kN)
Elgaaly test Present
analysis
AISC ASCE BS AASHTO CRC IS
1 43.97 3.53 98 344.1 49.2 53.7 21.6 49.5 36 59.6 59.6 47
2 43.69 3.58 98 363.4 66.1 56 21.7 49.8 37.3 60.8 60.8 49
3 43.99 3.45 98 341.4 63.6 52.1 21.2 48.5 35.2 58.3 58.3 45
4 44.02 3.56 98 344.8 61.7 54.3 21.8 49.9 36.4 60.1 60.1 48
5 44.07 3.43 98 340.7 58.2 51.6 21 48.2 35 57.9 57.9 45
6 44.75 5.05 99 328.3 98.2 78.7 30.4 70.2 49.9 83 83 74
7 44.88 4.93 99 335.9 97 77.9 29.8 68.8 49.5 81.8 81.8 73
8 44.88 5.03 99 329 93.5 78.7 30.4 70.1 49.9 82.9 82.9 74
33 44.91 4.98 99 353.1 85.5 81.1 30.1 69.5 51.2 83.8 83.7 76
34 45.57 5 99 342.8 80.2 80.9 30.7 70.9 51.5 84.8 84.8 76
9 50.06 3.38 85 324.1 51.4 56.6 29.6 52.7 41.9 74.5 74.5 48
10 50.11 3.33 85 320 48.8 55.2 29.2 51.3 40.5 72.9 73 47
11 50.14 3.43 85 324.8 64.5 57.9 30.1 54.2 43.1 75.8 75.8 50
12 51.21 3.33 85 342.8 52.8 57.7 29.8 50.3 40.4 77.5 77.5 49
13 49.96 3.38 85 329.7 64.5 57.1 29.1 52.5 41.9 75.1 75 49
20 50.6 5.08 86 326.9 97.5 92.1 43.4 89.5 64.7 110.7 110.7 88
21 50.47 5.13 86 315.9 88.3 90.8 43.7 89.3 63.9 109.3 109.3 87
22 50.42 4.95 86 328.3 94.6 89.7 42.2 87.1 63.1 107.9 107.9 85
43 50.83 5.08 86 315.9 84.9 90.3 43.6 89.1 63.7 109 109.1 87
44 51 5.03 86 313.8 82.1 89.1 43.3 88.4 63.2 108 108 85
18 63.17 5.05 67 315.2 112.7 114.2 70.9 125.7 96 158.5 158.5 107
19 63.07 5.05 67 327.6 110.1 117.3 70.8 127.7 98.4 163.2 163.1 110
50 63.6 5.16 67 336.6 117.9 122.9 72.8 132.8 103 171.3 171.2 115
51 63.7 5.08 67 327.6 111 118.7 71.9 129.7 99.9 165.6 165.6 111
52 63.8 5.31 67 329.7 116.1 124.8 75.1 135.8 104.8 173.9 173.8 119
92

93
APPENDIX B
Ultimate Capacity of Angles Using Code Formulas
Problem Statement 1: Double bolted specimen (Test no. 20 as per the experiment of
Elgaaly et al (1991))
Angle size: width, d 992.1 inch, thickness, t 200.0 inch
86r
l,
2mm
kN200E , ksi4.47yF
AISC 2005 Specification:
For, 80xr
L,
5.1398625.13225.132 xr
L
r
KL
Now,
51.116895.64.47
1020071.471.4
3
yF
E
As, the calculated yF
E
r
KL71.4 ,
So,
43.1015.139
102002
32
2
2
r
KL
EFe MPa
Now, 80.143895.64.4744.044.0 yF MPa
So, ye FF 44.0 for which,
95.8843.101877.0 crF MPa
Therefore, kN43.4326.48895.88 gcrn AFP

94
Or, 99.8nP kips
ASCE Standard 10-97:
2596.8
200.0
200.0992.1
t
w
62.114.47
18080
lim
yFt
w 1 (for Fy in ksi)
Check: lim
t
w
t
w
907.109895.64.47
1020022 3
y
cF
EC
Now, for members with normal framing eccentricity at both ends of the unsupported
panel,
103865.0605.060 r
L
r
KL
cCr
KL , for which,
y
c
a FC
r
KL
F
2
5.01
895.64.47907.109
1035.01
2
2mm
kN29.183
So, gan AFP
26.48829.183
Or, 49.89nP kN 12.20 kips

95
BS Standard Code:
m
rAjN
Where,
j=1.0
26.488200.0200.0984.12222 ttdA mm
2
222
1
effΛ
222
2427.14495.14495.1
1
5684.0
Here,
4495.12427.12.02427.134.015.02.015.0 22 effeff ΛΛa
and 2427.1093.1137.1 KΛΛeff
Now,
ΛK
58.07.0 ( both end discontinuous)
1
58.07.0
158.07.0
=1.23
86
895.64.47
205000
58.07.0
5.0

96
Now,
96.9200.0
992.1
t
B
2.14895.64.47
205000567.0567.0
y
E
Now, for t
B,
823.326895.64.47 yr MPa
0.1m (let, for class-(1) structures)
Therefore,
0.1
823.326257.4885684.00.1 N
644.90701 N/mm2
39.20 kips
AASHTO Formula:
Allowable stress,
E
Fr
L
SF
FF
ye
y
a 2
2
41
. (for c
e Cr
L )
2050004
895.64.478675.01
0.1
895.64.472
2
89.24 kips
Though, AASHTO Code, factor of safety, F.S=2.12, but in the present study, it has been
assumed 1.0.
IS Code Formula:
875.0895.64.47
2502505.05.0
yf

97
106.1
250
10200875.0
86
250
322
E
r
l
vv
vv
1281.0
250
10200875.008.52
25968.50
250
2322
21
E
t
bb
9779.01281.020106.135.020.0 222
3
2
21 kkk vveq
1687.19779.02.09779.049.015.02.015.0 22 eqeq
553.0
9779.01687.11687.1
115.0225.022
eq
So, 697.180895.64.47553.0 mo
y
cd
ff
MPa
23.88697.18026.488 dP kN 84.19 kips
CRC Formula:
2
32
2
286
102004
895.64.471895.64.47])(
41[
r
L
E
ey
ycr
= 226.668 MPa
kips88.242571.488668.226 xAPgcrn
Problem Statement 2: Single bolted specimen (Test no. 53 as per the experiment of
Elgaaly et al)
Angle size: width, d=1.749 inch, thickness, t=0.133 inch
92r
l,
2mm
kN200E , ksi2.51yF

98
AISC 2005 Specification:
For, 80xr
L,
0.1479225.13225.132 xr
L
r
KL
Now,
11.112895.62.51
1020071.471.4
3
yF
E
As, the calculated yF
E
r
KL71.4 ,
So,
35.910.147
102002
32
2
2
r
KL
EFe MPa
Now, 895.62.5144.044.0 yF MPa 33.155 MPa
So, ye FF 44.0 for which,
11.8035.91877.0 crF MPa
So, 13.2374.28811.80 gcrn AFP kN
Or, 20.5nP kips
ASCE Standard 10-97:
2515.12
133.0
133.0749.1
t
w
18.112.51
18080
lim
yFt
w 1 (for Fy in ksi)
13.202.51
1144144
yF

99
Check:
yFt
w
t
w 144
lim
, for which
19.482.5118.11
15.12677.0677.1677.0677.1
lim
ycr F
t
w
t
w
F ksi
00.109895.619.48
1020022 3
cr
cF
EC
Now, for members with normal framing eccentricity at both ends of the unsupported
panel,
106925.0605.060 r
L
r
KL
cCr
KL , for which,
cr
c
a FC
r
KL
F
2
5.01
895.619.4800.109
1065.01
2
= 2mm
kN15.175
So, 57.507381.28815.175 gan AFP kN
Or, 37.11nP kips
BS Standard Code:
m
rAjN

100
Where,
j=0.8
74.288133.0133.0749.12222 ttdA mm
2
222
1
effΛ
222
43.1733.1733.1
1
3688.0
Here,
733.143.12.043.134.015.02.015.0 22 effeff ΛΛa and
43.1215.1177.1 KΛΛeff
ΛK
58.07.0 ( both end discontinuous)
1
58.07.0
158.07.0
92
895.62.51
205000
58.07.0
5.0
=1.177
Now,
15.13133.0
749.1
t
B
66.13895.62.51
205000567.0567.0
y
E

101
Now, for t
B,
024.353895.62.51 yr MPa
0.1m (let, for class-(1) structures)
Therefore,
0.1
024.35374.2883688.08.0 N
86.30073 N
76.6 kips
AASHTO Formula:
Allowable stress,
E
Fr
L
SF
FF
ye
y
a 2
2
41
. (for c
e Cr
L )
2000004
895.62.51921
0.1
895.62.512
2
24.14 kips
Though, in AASHTO Code, factor of safety, F.S=2.12, but in the present study, it has
been assumed 1.0.
IS Code Formula:
842.0895.62.51
2502505.05.0
yf
231.1
250
10200842.0
92
250
322
E
r
l
vv
vv

102
176.0
250
10200842.0378.32
2425.44
250
2322
21
x
E
t
bb
378.1176.020231.135.075.0 222
3
2
21 kkk vveq
738.1378.12.0378.149.015.02.015.0 22 eqeq
357.0
378.1738.1738.1
115.0225.022
eq
So, 172.1261
2.51357.0
xff
mo
y
cd
MPa
43.36172.12674.288 dP kN 19.8 kips
CRC Formula:
2
32
2
292
102004
895.62.511895.62.51])(
41[
r
L
E
ey
ycr
= 219.292 MPa
32.6374.288292.219 g
AP crn kN 24.14 kips
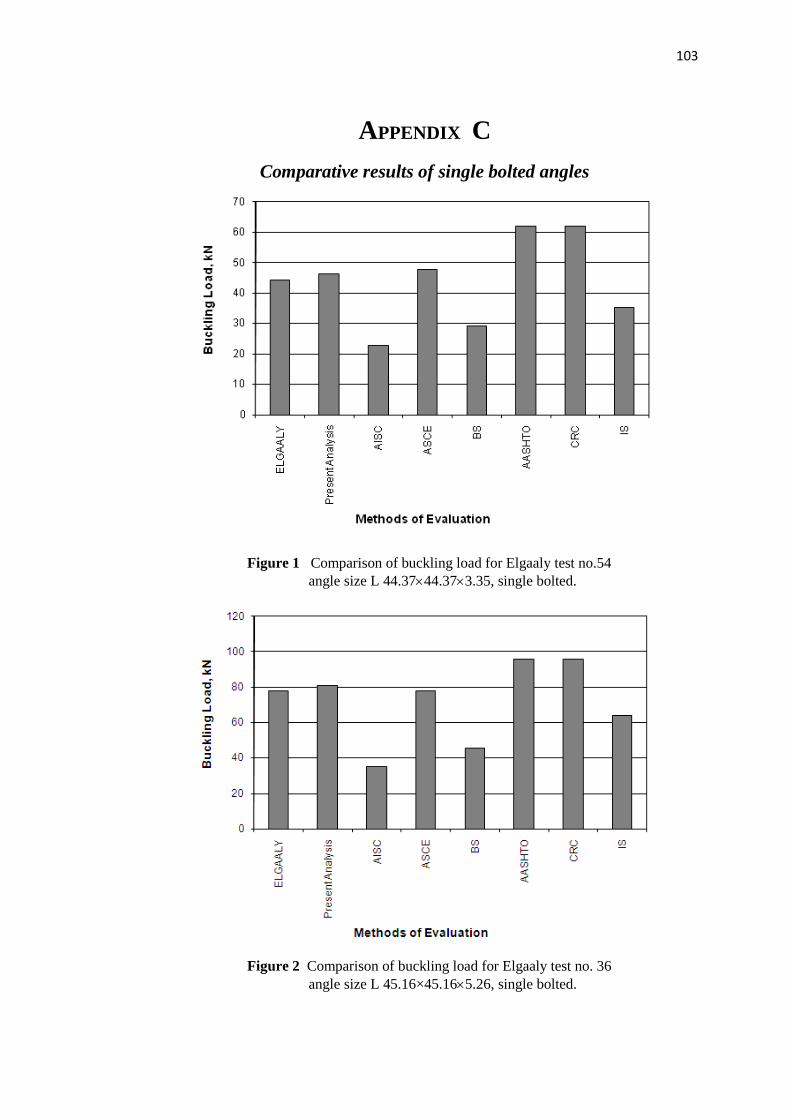
103
APPENDIX C
Comparative results of single bolted angles
Figure 1 Comparison of buckling load for Elgaaly test no.54 angle size L 44.3744.373.35, single bolted.
Figure 2 Comparison of buckling load for Elgaaly test no. 36
angle size L 45.16×45.165.26, single bolted.

104
Figure 3 Comparison of buckling load for Elgaaly test no. 40
angle size L 50.75×50.754.98, single bolted.
Figure 4 Comparison of buckling load for Elgaaly test no. 49
angle size L 63.07×63.075.03, single bolted.

105
Comparative results of double bolted angles
Figure 1 Comparison of buckling load for Elgaaly test no. 2
angle size L 43.69×43.693.58, double bolted.
Figure 2 Comparison of buckling load for Elgaaly test no. 10
angle size L 50.11×50.113.33, double bolted.

106
Figure 3 Comparison of buckling load for Elgaaly test no. 22
angle size L 50.42×50.424.95, double bolted.
Figure 4 Comparison of buckling load for Elgaaly test no. 50
angle size L 63.60×63.605.16, double bolted.