ultra-clean, efficient, reliable power - energy.gov · ultra-clean, efficient, reliable power...
TRANSCRIPT

Ultra-Clean, Efficient, Reliable Power
Reformer-Electrolyzer-Purifier (REP)for Production of Hydrogen [CO2 Pump]
2016 AMR (Annual Merit Review), Washington DC
P.I. / Presenter -- Fred Jahnke ( [email protected] )
FuelCell Energy, Inc.June 8, 2016
Project ID #: PD112
This presentation does not contain any proprietary, confidential, or otherwise restricted information

Overview
Timeline • Start: October 2014• End: September 2016
Budget• Total Budget: $1,250,509
- Total Recipient Share: $254,215 - Total Federal Share: $996,294
• Expended to Date*: $1,147,000- Total Recipient Share: $233,000 - Total Federal Share: $914,000
*as of 4/30/16 + committed funds
Barriers Barriers to hydrogen infrastructure:• High cost
• Transportation costs high• Limited areas of production
• Emissions limit potential sites• Scalability of production to local
demand
Funded Partners• UC Irvine National Fuel Cell Center
2

RelevanceImpact of REP Technology1. Lower cost hydrogen
• Can meet DOE Targets - Long term H2 less than 2 $/kg2. Low carbon emissions
• Can meet DOE Targets - CO2 emissions less than 5,000 g/gge(< 50% typ SMR)
• System utilizes waste heat• 100% conversion of CH4 with recycle• Low power high temperature electrolysis removes CO2 • 100% H2 recovery with recycle
3. ~Zero NOx, CO, SOx emissions when integrated with DFC® fuel cell4. System fully scalable
• Number of cells determines capacity• Home fueler (2kg/d) to large scale 16,000 kg/d
5. Manufacturing facilities already in place and operating• Will use same components currently being manufactured for
DFC® fuel cells
3

Approach
• Use existing FuelCell Energy MCFC (molten carbonate fuel cell) components
• Operate MCFC in electrolyzer mode as CO2 pump• Phase 1 – single cell testing and model development
Long term testing / life determination• Phase 2 – Multi cell stack testing and thermal
management• Optimization of configuration options using H2A
model (UCI support) and commercialization plan• Integrate input from potential users and stakeholders
• Integration with DFC® operating fuel cell • Other sources of waste heat• H2 users, low and high pressure• CO2 capture potential, Power storage
4

REP Basic Operation
REPSmall Amount
of Power
SteamHydrogen
- natural gas, - biogas, - syngas
CO2, O2
Potential Solution for California Hydrogen Infrastructure
Reforming – Electrolyzer - Purifier
Fuel
CO2 Pumping
5
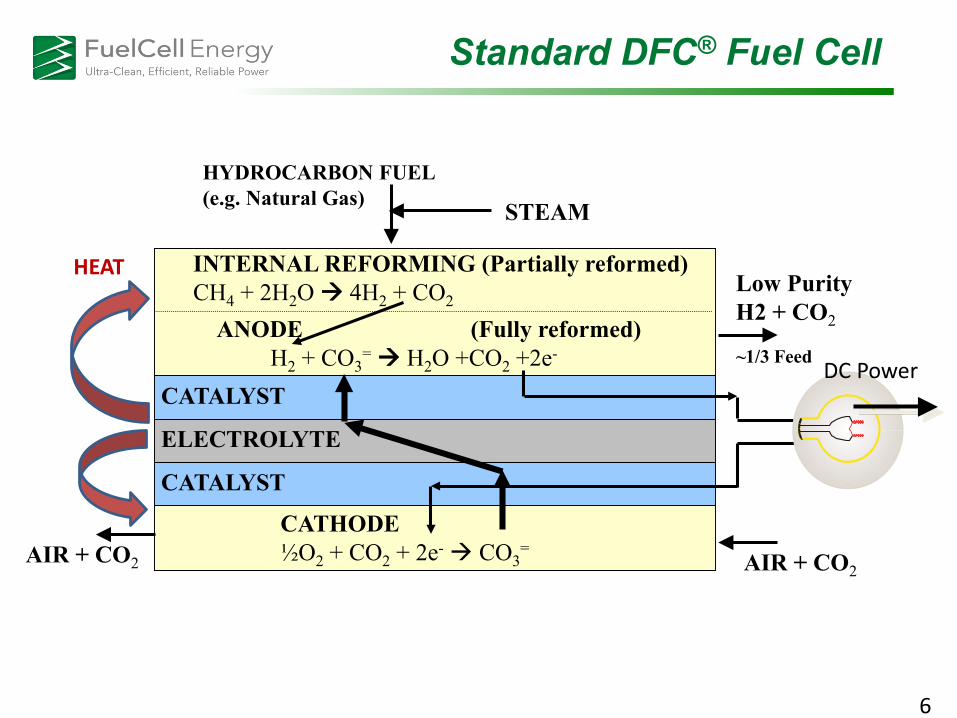
CATHODE ½O2 + CO2 + 2e- CO3
=
INTERNAL REFORMING (Partially reformed)CH4 + 2H2O 4H2 + CO2
ANODE (Fully reformed)H2 + CO3
= H2O +CO2 +2e-
CATALYST
CATALYST
ELECTROLYTE
HYDROCARBON FUEL(e.g. Natural Gas)
AIR + CO2
STEAM
DC Power
AIR + CO2
Low Purity H2 + CO2
~1/3 Feed
Standard DFC® Fuel Cell
HEAT
6

CATHODE CO3
= ½ O2 + CO2 + 2e-
Full Reforming
ANODE H2O +CO2 +2e- H2 + CO3
=
CATALYST
CATALYST
ELECTROLYTE
Natural Gas3 x CH4
STEAM
High PurityHydrogen
H2O +CH4 H2 + CO2 Internal Reforming Rx H2O +CO H2 + CO2 Internal Shift Rx
WASTE HEAT
3 x HEAT NEED
Reformer-Electrolyzer-Purifier (REP) Kickoff Meeting 8-26-14.pptx
CO2 + ½ O2
+ Air
DC Power
Dilution Air
REP Cell Technology
PARTIAL REFORMERH2O + CH4 H2 + CO + CO2 + CH4
HEAT ~10x H2 per cell
(CO2 Pump)(CO2+O= Pump)5 x Steam
10 x H2 per cell generated, external heat source is needed
4H2 + CO2
7

Challenges Faced
1. First of kind systema) Control of systemb) Safe operationc) Test facility limitations
2. Change in operating conditions compared to DFC®a) 3 x more feedb) 5 x more steamc) Pre-reforming of feed gas
3. Safe venting of product H24. High ampere power supply
8

Accomplishments
1. Single Cell Performance a) Performance matched expectationsb) Detailed model developed based on data
2. Life of fuel cell (based on single cell)a) Over 4,000 hours of operationb) Test halted due to power and feed interruptionsc) Degradation rate target achievedd) 2 – 5 yr stack projected life
3. Full Scale Cells Stack Testa) 30 Cell stack built and testedb) Testing produced 97-98% H2 @100 kg/d, matched
modelc) Good thermal profile generated
4. Analyzed system options (continuing)
9

REP Single Cell Test Facility
SingleCell
H2 Methanator
Feed Reformer
~3% of area
0.15 kg/d
10

Stable Operation over Long Term
Based on these accelerated test results, expect 2-5 year stack life.
11

REP Stack Testing
100 kg/d 2000 kg/d
12
Single cell test
100 kg/d test
Future

Preparing for Full Load Test
MBOP
(Mechanical Balance of
Plant)Feed
Prep, Fuel & Air Flow
REP30 cellStack
Pre-Reformer
DC Power(40 kw)
13
Walk Way
25 ft20
ft
Using existing DFC equipment for testing
100 kg/d potential
Same Equipment as needed for Standalone REP Demonstration
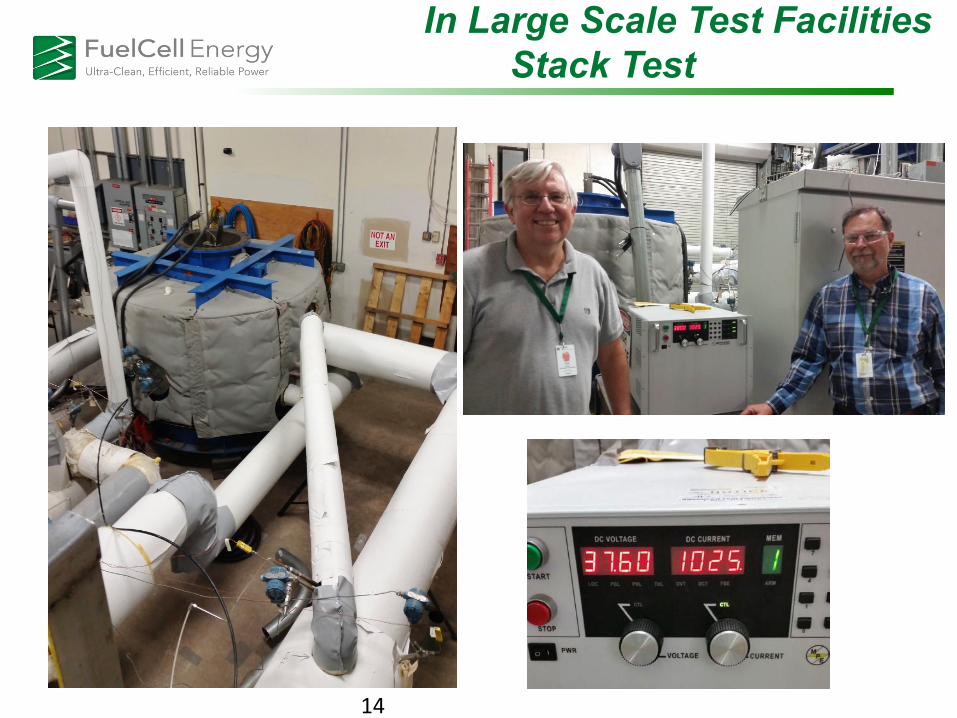
In Large Scale Test FacilitiesStack Test
14

Target Design Test Results
Amps 1040 950
Volts/cell <1.35 1.21 1.22
H2 Purity >95% 97.4 97.5
Kwh/kg <8 7.4 7.6
Kg/day ~100 123 110
CO2,g/gge ~5,500 4,900 4,700
Stack Full Load Test, NG Feed
Meets Target
Meets Target
Meets Target
Meets Target
Large Scale REP stack proven to be capable of 97%+ pure H2 production with low power input
REP 30 Cell 400kw HMB MixedGases 3-31-16ad.xlsmREP 30 Cell 400kw 950A 20H2 N2 HMB MixedGases 4-29-16.xlsm
15

Target Design Test Results
Amps 1040 1025
Volts/cell <1.35 1.24 1.19
H2 Purity >95% 97.7 98.3
Kwh/kg --- 28.1 27.4
Kg/day --- 33 32
Stack Full Load , Anode Exhaust Feed
CO2 Free* H2 productionUnit performs as expected with major feed variation
*Only CO2 emitted is CO2 from power production 16

Stack Test Temperature Profile
• Excellent temperature profile at full load• Currently using to confirm modeling
Lower T Mid T Higher T
4/22/16 17:55
In-Cell Max Delta T 59 F(Max T- Min T)
97.5 % H2
17

Case mmbtu NG /kg
Kw NG /Kw H2
REP Power, kwh/kg
H2 Purity, %
Water, kg/kg
Operating Costs, $/kg(1)
CO2, g/gge(2)
1. Base Case - Integrated with DFC 0.069 0.62 7.915 97% 9.3 0.925 4,5292. Standalone - Grid Powered 0.114 1.02 7.216 98% 9.3 1.188 6,6193. Standalone - Ext LP Steam 0.095 0.84 7.211 97% 9.3 1.058 5,5904. Standalone - Self Powered 0.138 1.23 0.000 97% 9.3 0.488 8,0825. Standalone - Syngas Grid 0.066 0.59 12.181 98% 8.7 1.529 0(6)
6. Int with DFC - AE Pwr Storage 0.010 0.09 29.518 98% 9.2 1.886 0(4)
7. Int with SOFC - AE Pwr Storage 0.000 0.00 23.768 97% 0(3) 1.529 0(4,5)
8. Standalone - ADG Feed 0.104 0.93 10.277 98% 9.3 1.296 0(6)
REP Cas es HM B Sum m ary R5.x ls m
Assumes $6.77/mmbtu NG (LHV), $0.057/kwh power. (2) Does not include CO2 associated with power used. (3) All water needed is already in SOFC anode exhaust (4) No additional CO2 emitted other than CO2 from power production (5) Potential CO2 capture for zero CO2 power from NG as well as H2 (6) Renewable Hydrocarbon Feed
(1)
System Analysis
18

Sources of Waste Heat
REP Operating Temperature
~40% of heat is low level (<250°)F
Low Pressure Steam
HPres SteamBoiler
Standard DFC
Gas Turbine
Heat Treating
DieselEngine
Integrated DFC
Glass Furnace
19

Impact of “Free” Waste Heat on Op Cost
$1.19
$1.06 $1.03
$0.93 $0.90
“Free” waste heat reduces cost of H2 $0.29/kg, low level $0.13/kg 20

Impact of Different Feeds
REP
Lowest Cost with off peak power
CO2 Free H2REP systems
As T
este
d
7.6
As T
este
d
27.4
21

UCI Economic Analysis using H2A
$1.69 $1.87
$5.14
$0
$1
$2
$3
$4
$5
$6
REP SMR PEME
Cos
t of H
ydro
gen
($/k
g)
DOE 2015 Target: Distributed production from NG
DOE 2017 Target: Distributed water electrolysis
Hydrogen(1) production cost in a 1500 kg/day design capacity forecourt station with various production technologies (ECS Trans. 2016 71(1): 179-192)
(1) based on 99.995% H2 at 300 psig for all cases22

UCI Model Predictions
• Temperature profile generated from a quasi-3D MCFC dynamic model• Developing the MCEC model and verify with the experiment
measurement
Cross-flow configuration steady-state temperature profile, Uf=65%
23

Technology Transfer Activities
1. Presentation to DOE/HPTT2. Presentation at Fuel Cell Seminar3. Continuing to identify stakeholders from HPTT,
California Hydrogen Business Council, UCI and other meetings
4. Initiating development of users workshop in California (UCI leading)
5. Patent application filed 2014, additional patents filed 2015, continuing as technology develops
6. Analyzed home refueler opportunity
UCI = University of California, IrvineHTTP = Hydrogen Production Technology Team
24

REP Development Summary
1. Single Cell Performance and Life results excellent2. Accurate model REP developed 3. Met Go-NoGo decision, proceeded to 100 kg/d test4. Optimizing system shows great potential for low CO2 emissions
a) Integrated with DFC and SOFCb) Standalone system / low level heat integrationc) Alternate feedstocks (gasifier, ADG, waste gas)d) Potential for zero CO2 production of H2
5. Initial performance test of short stack (100 kg/d)a) Excellent at low and full load. Performed as expectedb) No impact of operation in REP mode seen on stack
Same power generation performance before and after REP operation
25

Future Work Plan
1. Continue single cell testinga. Feedstock variation (Including ADG, Anode Exhaust)b. CO2/O2 co-production
2. Analyze 100 kg/d test results3. Update H2A model analysis based on stack test data4. Conceptual design of on-site REP system for low cost H2
refueling5. Identify potential funding for continuation of 100 kg/d
testing (long term testing)6. Presentation to HPTT stakeholders (in May)7. Final report
Need longer term full scale stack testing to confirm stack life (not part of initial program)
26