ultrafast molecular orbital imaging based on attosecond...
TRANSCRIPT

Ultrafast molecular orbital imagingbased on attosecond photoelectron
diffraction
Yang Li,1 Meiyan Qin,1 Xiaosong Zhu,1 Qingbin Zhang,1 PengfeiLan,1,3 and Peixiang Lu1,2,∗
1Wuhan National Laboratory for Optoelectronics and School of Physics, Huazhong Universityof Science and Technology, Wuhan 430074, China
2Laboratory of Optical Information Technology, Wuhan Institute of Technology, Wuhan430073, China
3 [email protected]∗[email protected]
Abstract: We present ab initio numerical study of ultrafast ionizationdynamics of H+
2 as well as CO2 and N2 exposed to linearly polarizedattosecond extreme ultraviolet pulses. When the molecules are alignedperpendicular to laser polarization direction, photonionization of thesemolecules show clear and distinguishing diffraction patterns in molecu-lar attosecond photoelectron momentum distributions. The internucleardistances of the molecules are related to the position of the associ-ated diffraction patterns, which can be determined with high accuracy.Moreover, the relative heights of the diffraction fringes contain fruitfulinformation of the molecular orbital structures. We show that the diffractionspectra can be well produced using the two-center interference model.By adopting a simple inversion algorithm which takes into account thesymmetry of the initial molecular orbital, we can retrieve the molecularorbital from which the electron is ionized. Our results offer possibilityfor imaging of molecular structure and orbitals by performing molecularattosecond photoelectron diffraction.
© 2015 Optical Society of America
OCIS codes: (020.2649) Strong field laser physics; (260.3230) Ionization; (270.6620) Strong-field process.
References and links1. P. B. Corkum and F. Krausz, “Attosecond science,” Nat. Phys. 3, 381–387 (2007).2. F. Krausz and M. Ivanov, “Attosecond physics,” Rev. Mod. Phys. 81, 163–234 (2009).3. F. Lepine, M. Ivanov, and M. J. J. Vrakking “Attosecond molecular dynamics: fact or fiction?” Nat. Photonics 8,
195–204 (2014).4. S. R. Leone, C. W. McCurdy, J. Burgdorfer, L. S. Cederbaum, Z. Chang, N. Dudovich, J. Feist, C. H. Greene,
M. Ivanov, R. Kienberger, U. Keller, M. F. Kling, Z-H. Loh, T. Pfeifer, A. N. Pfeiffer, R. Santra, K. Schafer, A.Stolow, U. Thumm, and M. J. J. Vrakking, “What will it take to observe processes in ’real time’?” Nat. Photonics8, 162–166 (2014).
5. Y. Mairesse, A. de Bohan, L. J. Frasinski, H. Merdji, L. C. Dinu, P. Monchicourt, P. Breger, M. Kovacev, R.Taızeb, B. Carre, H. G. Muller, P. Agostini, and P. Saleres, ”Attosecond Synchronization of High-Harmonic SoftX-rays,” Science 302, 1540–1543 (2003).
6. R. Kienberger, E. Goulielmakis, M. Uiberacker, A. Baltuska, V. Yakovlev, F. Bammer, A. Scrinzi, Th. Wester-walbesloh, U. Kleineberg, U. Heinzmann, M. Drescher, and F. Krausz, “Atomic transient recorder,” 427, 817–821(2004).
#232875 - $15.00 USD Received 20 Jan 2015; revised 21 Mar 2015; accepted 7 Apr 2015; published 16 Apr 2015 (C) 2015 OSA 20 Apr 2015 | Vol. 23, No. 8 | DOI:10.1364/OE.23.010687 | OPTICS EXPRESS 10687

7. E. Goulielmakis, M. Schultze, M. Hofstetter, V. S. Yakovlev, J. Gagnon, M. Uiberacker, A. L. Aquila, E. M.Gullikson, D. T. Attwood, R. Kienberger, F. Krausz, and U. Kleineberg, “Single-cycle nonlinear optics,” Science320, 1614–1617 (2008).
8. Y. Zhou, C. Huang, Q. Liao, and P. Lu, “Classical Simulations Including Electron Correlations for SequentialDouble Ionization,” Phys. Rev. Lett. 109, 053004 (2012).
9. M. Lein, “Molecular imaging using recolliding electrons,” J. Phys. B: At. Mol. Opt. Phys. 40, R135–R173 (2007).10. S. Haessler, J. Caillat, and P. Salieres, “Self-probing of molecules with high harmonic generation,” J. Phys. B:
At. Mol. Opt. Phys. 44, 203001 (2011).11. P. Salieres, A. Maquet, S. Haessler, J. Caillat, and R Taıeb, “Imaging orbitals with attosecond and Angstorm
resolutions: toward attochemistry?” Rep. Prog. Phys. 75, 062401 (2012).12. J. Itatani, J. Levesque, D. Zeidler, H. Niikura, H. Pepin, J. C. Kieffer, P. B. Corkum, and D. M. Villeneuve,
“Tomographic imaging of molecular orbitals,” Nature (London) 432, 867 (2004).13. S. Haessler, J. Caillat, W. Boutu, C. Giovanetti-Teixeira, T. Ruchon, T. Auguste, Z. Diveki, P. Breger, A. Maquet,
B. Carre, R. Taıeb, and P. Salieres, “Attosecond imaging of molecular electronic wavepackets,” Nature Phys. 6,200 (2010).
14. C. Vozzi, M. Negro, F. Calegari, G. Sansone, M. Nisoli, S. De Silvestri, and S. Stagira, “Generalized molecularorbital tomography,” Nature Phys. 7, 822 (2011).
15. Y. Li, X. Zhu, P. Lan, Q. Zhang, M. Qin, and P. Lu, “Molecular-orbital tomography beyond the plane-waveapproximation,” Phys. Rev. A 89, 045401 (2014).
16. J. Mauritsson, P. Johnsson, E. Mansten, M. Swoboda, T. Ruchon, A. L’Huillier, and K. J. Schafer, “CoherentElectron Scattering Captured by an Attosecond Quantum Stroboscope,” Phys. Rev. Lett. 100, 073003 (2008).
17. M. Swoboda, T. Fordell, K. Klunder, J. M. Dahlstr?m, M. Miranda, C. Buth, K. J. Schafer, J. Mauritsson, A.L’Huillier, and M. Gisselbrecht, “Phase Measurement of Resonant Two-Photon Ionization in Helium,” Phys.Rev. Lett. 104, 103003 (2010).
18. K. Klunder, J. M. Dahlstrom, M. Gisselbrecht, T. Fordell, M. Swoboda, D. Guenot, P. Johnsson, J. Caillat, J.Mauritsson, A. Maquet, R. Taıeb, and A. L’Huillier, “Probing Single-Photon Ionization on the Attosecond TimeScale,” Phys. Rev. Lett. 106, 143002 (2011).
19. C. Altuccia, R. Velottaa and J. P. Marangosb, “Ultra-fast dynamic imaging: an overview of current techniques,their capabilities and future prospects,” J. Mod. Opt. 57, 916–952 (2010).
20. H. D. Cohen, U. Fano, “Interference in the photo-ionization of molecules,” Phys. Rev. 150, 30 (1966).21. T. Zuo, A. D. Bandrauk, and P. B. Corkum, “Laser-induced electron diffraction: a new tool for probing ultrafast
molecular dynamics,” Chem. Phys. Lett. 259, 313–320 (1996).22. M. Spanner, O. Smirnova, P. B. Corkum, and M. Y. Ivanov, “Reading diffraction images in strong field ionization
of diatomic molecules,” J. Phys. B: At. Mol. Opt. Phys. 37, L243–L250 (2004).23. J. Henkel, M. Lein, and V. Engel, “Interference in above threshold ionization electron distributions from
molecules,” Phys. Rev. A 83, 051401(R) (2011).24. M. Meckel, D. Comtois, D. Zeidler, A. Staudte, D. Pavicic H. C.Bandulet, H. Pepin, J. C. Kieffer, R. Dorner, D.
M. Villeneuve, and P. B. Corkum, “Laser-induced electron tunneling and diffraction,” Science 320, 1478–1482(2008).
25. Y. Huismans, A. Rouzee, A. Gijsbertsen, J. H. Jungmann, A. S. Smolkowska, P. S. W. M. Logman, F. Lepine,C. Cauchy, S. Zamith, T. Marchenko, J. M. Bakker, G. Berden, B. Redlich, A. F. G. van der Meer, H. G. Muller,W. Vermin, K. J. Schafer, M. Spanner, M. Y. Ivanov, O. Smirnova, D. Bauer, S. V. Popruzhenko, and M. J. J.Vrakking, “Time-resolved holography with photoelectron,” Science 331, 61–64 (2011).
26. X. B. Bian, Y. Huismans, O. Smirnova, Y. J. Yuan, M. J. J. Vrakking, and A. D. Bandrauk, “Subcycle interferencedynamics of time-resolved photoelectron holography with midinfrared laser pulses,” Phys. Rev. A 84, 043420(2011).
27. X. B. Bian and A. D. Bandrauk, “Attosecond time-resolved imaging of molecular structure by photoelectronholography,” Phys. Rev. Lett. 108, 263003 (2012).
28. J. R. Schneider, “FLASH-from accelerator test facility to the first single-pass soft x-ray free-electron laser,” J.Phys. B: At. Mol. Opt. Phys. 43, 194001 (2010).
29. M.-C. Chen, C. Hernandez-Garcıa, C. Mancuso, F. Dollar, B. Galloway, D. Popmintchev, P.-C. Huang, B. Walker,L. Plaja, A. Jaron-Becker, A. Becker, T. Popmintchev, M. M. Murnane, and H. C. Kapteyn, “Generation of brightisolated attosecond soft X-ray pulses driven by multicycle midinfrared lasers,” Proc. Natl. Acad. Sci.U.S.A. 111,E2361 (2014).
30. J. Luo, Y. Li, Z. Wang, Q. Zhang, and P. Lu, “Ultra-short isolated attosecond emission in mid-infrared inhomo-geneous fields without CEP stabilization,” J. Phys. B: At. Mol. Opt. Phys. 46, 145602 (2013).
31. S. X. Hu, L. A. Collins, and B. I. Schneider, “Attosecond photoelectron microscopy of H+2 ,” Phys. Rev. A 80,
023426 (2009).32. C. Huang, Y. Zhou, Q. Liao, and P. Lu, “Imaging molecular structures with high-energy photoelectrons produced
by extreme ultraviolet pulses,” J. Opt. Soc. Am. B 29, 734–737 (2012).33. K.-J. Yuan, S. Chelkowski, and A. D. Bandrauk, “Molecular photoelectron angular distributions with intense
attosecond circularly polarized UV laser pulses,” Chem. Phys. Let. 592, 334–340 (2014).
#232875 - $15.00 USD Received 20 Jan 2015; revised 21 Mar 2015; accepted 7 Apr 2015; published 16 Apr 2015 (C) 2015 OSA 20 Apr 2015 | Vol. 23, No. 8 | DOI:10.1364/OE.23.010687 | OPTICS EXPRESS 10688

34. M. D. Feit, J. A. Fleck, and A. Steiger, “Solution of the Schrodinger equation by a spectral method,” J. Comput.Phys. 47, 412–433 (1982).
35. R. de Nalda, E. Heesel, M. Lein, N. Hay, R. Velotta, E. Springate, M. Castillejo, and J. P. Marangos, “Roleof orbital symmetry in high-order harmonic generation from aligned molecules,” Phys. Rev. A 69, 031804(R)(2004).
36. M. Peters, T. T. Nguyen-Dang, C. Cornaggia, S. Saugout, E. Charron, A. Keller, and O. Atabek, “Ultrafastmolecular imaging by laser-induced electron diffraction,” Phys. Rev. A 83, 051403(R) (2011).
37. M. Peters, T. T. Nguyen-Dang, E. Charron, A. Keller, and O. Atabek, “Laser-induced electron diffraction: a toolfor molecular orbital imaging,” Phys. Rev. A 85, 053417 (2012).
38. J. Javanainen, J. H. Eberly, and Q. Su, “Numerical simulations of multiphoton ionization and above-thresholdelectron spectra,” Phys. Rev. A 38, 3430 (1988).
39. S. Chelkowski, C. Foisy, and A. D. Bandrauk, “Electron-nuclear dynamics of multiphoton H+2 dissociative ion-
ization in intense laser fields,” Phys. Rev. A 57, 1176–1185 (1998).40. X. M. Tong, K. Hino, and N. Toshima, “Phase-dependent atomic ionization in few-cycle intense laser fields,”
Phys. Rev. A 74, 031405 (2006).41. T. Seideman, “Revival Structure of Aligned Rotational Wave Packets,” Phys. Rev. Lett. 83, 497 (1999).42. J. Ortigoso, M. Rodrıguez, M. Gupta, and B. Friedrich, “Time evolution of pendular states created by the inter-
action of molecular polarizability with a pulsed nonresonant laser field,” J. Chem. Phys. 110, 3870 (1999).
1. Introduction
Advances in the understanding of the interaction of intense laser pulses with matter have openedversatile perspectives in ultrafast optics, for observing new phenomena and developing newtechnologies [1–4]. Among this, the generation of attosecond extreme ultraviolet (XUV) pulsesin atomic and molecular gases based on high harmonic generation (HHG) has attracted consid-erable attentions for its potential use of probing the structure and ultrafast electron dynamics inmatters with unprecedented temporal and spatial resolutions [5–8].
The application of the XUV pulses can be summarized into two categories. In the first cat-egory, during the HHG process, the recolliding electron wavepacket encodes information onthe generating molecule in the emitted harmonics. Thus the harmonic signal is used to re-trieve temporal and structural insight into the generating targets itself, known as ”self-probing”schemes [9–11]. Specifically, it can be used to create a tomographic reconstruction of molecu-lar orbitals, called molecular orbital tomography [12–15]. On the other hand, the availability ofisolated attosecond XUV pulses extends the femtosecond spectroscopy and femto-chemistry tothe attosecond domain, which is the natural time scale of the electron motion [16–18]. Also, itwas recently shown that the attosocond XUV pulses could also provide Angstorm resolved im-ages of electron wavepackets in molecules [11]. The combination of attosocond and Angstormresolution makes it possible to imaging the most fundamental process of physics and chemistryin real time [3, 19].
In the ultrafast imaging experiments, one usually exploits available information of molecularstructure in the molecular photonionization spectra. The original idea was proposed by Cohenand Fano [20] more than forty years ago that the photonionization of a diatomic molecule canbe viewed as a microscopic version of Young’s double-slit experiment. The emitted electrons,which are initially shared between the two indistinguishable nuclei, would be coherent whentheir de Broglie wavelengths are comparable to the molecular equilibrium internuclear distance.Such that the electron wavepacket interference effect would appear in the oscillatory behaviorof photonionization cross sections in perturbative single-photon ionization. When extendingto nonperturbative regime, a new imaging technique called laser induced electron diffraction(LIED) was proposed by Zuo et al [21]. When molecules are exposed to few cycle femtosec-ond laser pulse, laser induced electrons may rescatter with different nuclei. The interferencebetween the amplitudes arising from different scattering centers would appear in the photo-nionization momentum distributions (PMD), carrying structure information of the molecule.However, in a femtosecond laser pulse, a train of several electron wavepackets recollides within
#232875 - $15.00 USD Received 20 Jan 2015; revised 21 Mar 2015; accepted 7 Apr 2015; published 16 Apr 2015 (C) 2015 OSA 20 Apr 2015 | Vol. 23, No. 8 | DOI:10.1364/OE.23.010687 | OPTICS EXPRESS 10689

one pulse and one recollision is convoluted by several recollisions and diffraction events. Theoverlap of multiple diffraction events, each yielding different energy spectra due to changinglaser intensity, leads to extra complications in the diffraction patterns. Besides, the presence ofthe laser field would distort the electron energy spectra and add an extra dependence on rec-ollision time of the spectra. All these problems make it extremely complicated to retrieve thestructure information of the target molecule [22–27].
The fast development of ultrashort free-electron lasers (FELs) and attosecond XUV pulse byHHG make it available of high-energy XUV light sources [28–30]. A fascinating ultrafast imag-ing technique called molecular attosecond photoelectron diffraction (MAPD) [31–33] emerges,making use of the interaction between and XUV pulses and molecules. The sketch of MAPD isshown in Fig. 1. A molecule is aligned perpendicular to polarization direction of XUV pulse.The XUV photons eject the single electron from molecule. Photonionization takes place whenthe electron is close to one of the two nuclei, which therefore act as two ”slits”. The interferencepattern appears in PMD of the emitted electrons. When the PMD is measured, the internucleardistance can be determined. Further, if the molecular orbital is expressed as linear combinationof atomic orbitals (LCAO), the symmetry of the combined atomic orbitals is encoded in thedetailed structure of the interference image, which allow us to retrieve the molecular orbitalusing PMD.
Fig. 1. The sketch of molecular attosecond photoelectron diffraction. The ultrashort XUVlaser pulse is polarized perpendicular to the molecular axis and the blue dashed line in-dicates its propagation direction. The XUV photons eject the electron from the moleculewhen the electron is close to one of the nuclei. Therefore the two nuclei act as ”slits” inthe microscopic double-slit experiment. By measuring the momentum distribution of theejected electrons, the molecular internuclear distance can be determined and the symmetryof molecular orbital can be retrieved.
In this paper, We present a systematic study of ultrafast imaging of molecular orbitals withdifferent symmetries using MAPD technique. Three typical molecules (and molecular ions),i.e., H+
2 , CO2 and N2 are chosen. The PMD of each molecule is obtained by solving the two-dimensional time-dependent Schrodinger equation (TDSE) within Born-Oppenheimer (BO) ap-proximation. The effective single-active-electron (SAE) potential is adopted to correctly repro-duce the highest occupied molecular orbitals (HOMO) of each molecule. Clear diffraction pat-terns appear in PMD. The internuclear distance can be determined with respect to the positionof interference fringes. By stretching the molecules, the diffraction patterns change accordinglywhich in turn determine the change of internuclear distance with high precision. Furthermore,the detailed structure of the interference image, i.e., the relative heights of the interferencefringes reflects the structure information of molecular orbitals. Using a simple two-center inter-ference model, we successfully reproduced the difference pattern and it shows good agreement
#232875 - $15.00 USD Received 20 Jan 2015; revised 21 Mar 2015; accepted 7 Apr 2015; published 16 Apr 2015 (C) 2015 OSA 20 Apr 2015 | Vol. 23, No. 8 | DOI:10.1364/OE.23.010687 | OPTICS EXPRESS 10690

with the TDSE calculations. These results enable us to retrieve the molecular orbital for PADwith an inversion algorithm invoking the symmetry of the initial molecular orbital.
2. Theoretical model
To simulate the photoionization process in attosecond XUV pulse, we use the split-operatorspectral method [34] to numerically solve the corresponding two-dimensional TDSE (atomicunits are used unless stated otherwise)
i∂∂ t
ψ(�r, t) = H (�r, t)ψ(�r, t), (1)
where�r ≡ (x,y) denotes the electron position in (x,y) plane. Below we assume that the molec-ular orbital is aligned in the x direction. The Hamiltonian reads
H (�r, t) =−12
∇2 +V (�r)+�r ·�E(t). (2)
�E(t) is the electronic field which is polarized along the y direction, perpendicular to the molec-ular axis. We use a ten-cycle linearly polarized XUV pulse with wavelength of 5 nm. Theelectron field with a sine-squared envelope is expressed as
�E(t) = E0 sin2(πtT)cos(ωt)�ey, (3)
in which E0, ω and T is the amplitude, angular frequency and the duration of the XUV pulse,respectively. The laser intensity is chosen to be 1.0×10¹⁵W/cm2. The high intensity and shortwavelength of the XUV pulse enable us to generate photoelectrons with energy as high as200eV in the nonperturbative single-photon ionization process. The corresponding de Brogliewavelength of the high-energy electron is about 1.8 a.u., which is less than the molecular equi-librium internuclear distance. Thus the diffraction of high-energy electrons can achieve accu-rate measurement of the molecular internuclear distance. The effective SAE soft-core poten-tial [35–37] is in the form of
V (�r) =−N
∑j=1
Z∞j +(Z0
j −Z∞j )exp(−|�r j|2/σ2
j )√|�r j|2 +ζ 2
j
. (4)
The subscript j = 1, ...,N labels the nuclei at fixed positions �ρ j and �r j =�r−�ρ j. Z∞j +(Z0
j −Z∞
j )exp(−|�r j|2/σ2j ) denotes the position-dependent screened effective charge for the j-th nu-
cleus, where Z∞j is the effective nuclear charge of the nucleus j as seen by an electron at infinite
distance and Z0j is the bare charge of nucleus j. Parameter σ j characterizes the decrease of the
effective charge with the distance to the nucleus. ζ j is the soft-core parameter. For H+2 , the ef-
fective charge is chosen to be constant and the ordinary soft-core potential [38] is reproduced.For CO2 and N2, the values of Z∞
j were derived from a Mulliken analysis carried out in ab initiostudy. The values of the parameters of three molecules are summarized in Tab. 1.
The initial normalized wavefuntion is obtained by imaginary-time propagation and orthog-onalization under symmetry conditions corresponding to HOMO of each molecule. After that,the initial wavefunction is served as the initial condition for the real-time propagation. Thetime-dependent wavefuntion ψ(�r, t) is propagated using the second-order split-operator spec-tral method [34] in real time on a Cartesian grid. Due to the linearity of the Schrodinger equa-tion, the electron wave function ψ(ti) (�r is omitted for simplicity) at a given time ti can be splitinto two parts:
ψ(ti) = ψ(ti)[1−Fs(Rc)]+ψ(ti)Fs(Rc) = ψI(ti)+ψII(ti). (5)
#232875 - $15.00 USD Received 20 Jan 2015; revised 21 Mar 2015; accepted 7 Apr 2015; published 16 Apr 2015 (C) 2015 OSA 20 Apr 2015 | Vol. 23, No. 8 | DOI:10.1364/OE.23.010687 | OPTICS EXPRESS 10691

Table 1. Values of all parameters used for soft-core potentials of H+2 , CO2 and N2 [37].
Molecule H+2 CO2 N2
Nucleus H H O C O N N
ζ j (a.u.) 1.0 1.0 1.0 1.0 1.0 1.2 1.2σ2
j (a.u.) ∞ ∞ 0.577 0.750 0.577 0.700 0.700Z0
j 1.0 1.0 8 6 8 7 7Z∞
j 1.0 1.0 0.173 0.654 0.173 0.500 0.500
Here, Fs(Rc)= 1/(1+e−(r−Rc)/Δ) is a split function that separates the whole space into the inner(0 → Rc) and outer (Rc → Rmax) regions smoothly [39, 40]. ψI represents the wave functionin the inner region and it is propagated under the full Hamiltonian using the split-operatoralgorithm. ψII stands for the wave function in the outer region and it is propagated under theVolkov Hamiltonian analytically. We first calculate
C (�p, ti) =∫
ψII(ti)e−i[�p+�A(ti)]·�r
2πd2�r, (6)
where �A(ti) =∫ ∞ti�E(τ)dτ is the vector potential of the laser pulse. Then we propagate ψII from
ti to the end of the laser pulse as
ψ(∞, ti) =∫
C (�p, ti)ei�p·�r
2πd2�p, (7)
with C (�p, ti) = exp(−i
∫ ∞ti
12 [�p+
�A(τ)]2dτ)
C (�p, ti). Finally, the electron momentum distribu-
tion is obtained as
d2P(�p)dEdΩ
=
∣∣∣∣∣∑iC (�p, ti)
∣∣∣∣∣2
, (8)
where E is the electron energy associated with �p as E = |�p|2/2 and Ω is the angle of theemitted electron. After the end of the pulse, the wave function is propagated for additional fewfemtoseconds to collect the ”slow” photoelectrons. In our simulations, the grid size is the samefor x and y directions: Δx = Δy = 0.1 a.u. and the grid ranges from -300 a.u. to 300 a.u. ineach direction. The boundary of the inner region Rc is 100 a.u.. The real time step is chosenas Δt = 0.001 a.u. which satisfies the convergence condition Δt/Δx2 < 0.5. After the pulse, thewave function propagates freely for 3 fs.
3. Results and discussions
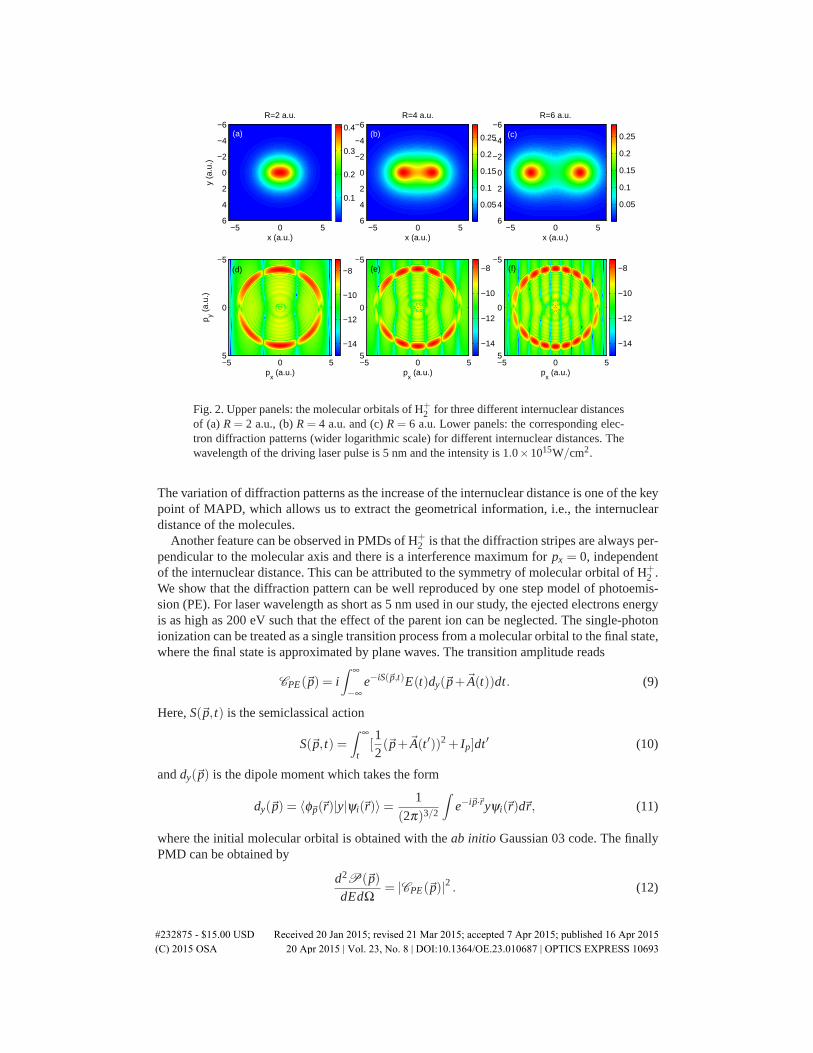
Figure 2 shows the molecular orbitals of H+2 and the corresponding electron diffraction pat-
terns for three different internuclear distances under the nonperturbative single-photon ioniza-tion process. With high intensity XUV pulse, there are also multiphoton absorptions. However,electrons due to multiphoton ionization process appear at higher momentum region and have noinfluence for electrons with low momentum. Below we will concentrate on the single-photonionized electrons. Clear diffraction fringes are observed in the electron momentum distributionsand these fringes are markedly well resolved in the ponderomotive motion ”circle” correspond-ing to the momentum region of the ejected electrons by single-photon ionization. Moreover, bystretching the molecules from R = 2 a.u. to R = 6 a.u., the number of diffraction fringes in-crease with the internuclear distance, which is similar to Young’s double-slit experiment [20].
#232875 - $15.00 USD Received 20 Jan 2015; revised 21 Mar 2015; accepted 7 Apr 2015; published 16 Apr 2015 (C) 2015 OSA 20 Apr 2015 | Vol. 23, No. 8 | DOI:10.1364/OE.23.010687 | OPTICS EXPRESS 10692
x (a.u.)
y (a
.u.)
R=2 a.u.
−5 0 5
−6
−4
−2
0
2
4
6
x (a.u.)
R=4 a.u.
−5 0 5
−6
−4
−2
0
2
4
6
x (a.u.)
R=6 a.u.
−5 0 5
−6
−4
−2
0
2
4
6
px (a.u.)
p y (a.
u.)
−5 0 5
−5
0
5
px (a.u.)
−5 0 5
−5
0
5
px (a.u.)
−5 0 5
−5
0
5
0.1
0.2
0.3
0.4
0.05
0.1
0.15
0.2
0.25
0.05
0.1
0.15
0.2
0.25
−14
−12
−10
−8
−14
−12
−10
−8
−14
−12
−10
−8
(b) (c)(a)
(d) (e) (f)
Fig. 2. Upper panels: the molecular orbitals of H+2 for three different internuclear distances
of (a) R = 2 a.u., (b) R = 4 a.u. and (c) R = 6 a.u. Lower panels: the corresponding elec-tron diffraction patterns (wider logarithmic scale) for different internuclear distances. Thewavelength of the driving laser pulse is 5 nm and the intensity is 1.0×10¹⁵W/cm2.
The variation of diffraction patterns as the increase of the internuclear distance is one of the keypoint of MAPD, which allows us to extract the geometrical information, i.e., the internucleardistance of the molecules.
Another feature can be observed in PMDs of H+2 is that the diffraction stripes are always per-
pendicular to the molecular axis and there is a interference maximum for px = 0, independentof the internuclear distance. This can be attributed to the symmetry of molecular orbital of H+
2 .We show that the diffraction pattern can be well reproduced by one step model of photoemis-sion (PE). For laser wavelength as short as 5 nm used in our study, the ejected electrons energyis as high as 200 eV such that the effect of the parent ion can be neglected. The single-photonionization can be treated as a single transition process from a molecular orbital to the final state,where the final state is approximated by plane waves. The transition amplitude reads
CPE(�p) = i∫ ∞
−∞e−iS(�p,t)E(t)dy(�p+�A(t))dt. (9)
Here, S(�p, t) is the semiclassical action
S(�p, t) =∫ ∞
t[12(�p+�A(t ′))2 + Ip]dt ′ (10)
and dy(�p) is the dipole moment which takes the form
dy(�p) = 〈φ�p(�r)|y|ψi(�r)〉= 1
(2π)3/2
∫e−i�p·�ryψi(�r)d�r, (11)
where the initial molecular orbital is obtained with the ab initio Gaussian 03 code. The finallyPMD can be obtained by
d2P(�p)dEdΩ
= |CPE(�p)|2 . (12)
#232875 - $15.00 USD Received 20 Jan 2015; revised 21 Mar 2015; accepted 7 Apr 2015; published 16 Apr 2015 (C) 2015 OSA 20 Apr 2015 | Vol. 23, No. 8 | DOI:10.1364/OE.23.010687 | OPTICS EXPRESS 10693
px (a.u.)
p y (a.
u.)
R=2 a.u.
−5 0 5
−5
0
5
px (a.u.)
R=4 a.u.
−5 0 5
−5
0
5
px (a.u.)
R=6 a.u.
−5 0 5
−5
0
5
px (a.u.)
p y (a.
u.)
−5 0 5
−5
0
5
px (a.u.)
−5 0 5
−5
0
5
px (a.u.)
−5 0 5
−5
0
5
−9
−8.5
−8
−7.5
−9
−8.5
−8
−7.5
−9
−8.5
−8
−7.5
−10
−9.5
−9
−8.5
−8
−7.5
−10
−9.5
−9
−8.5
−8
−7.5
−10
−9.5
−9
−8.5
−8
−7.5
(a) (b) (c)
(d) (e) (f)
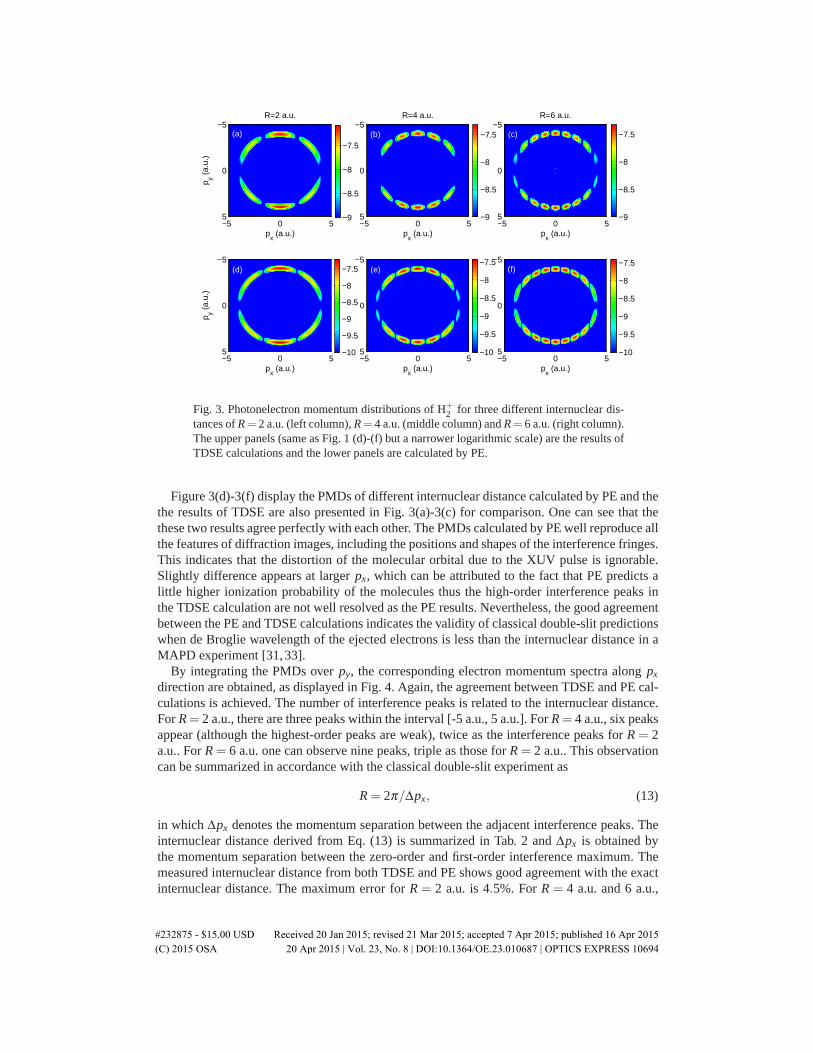
Fig. 3. Photonelectron momentum distributions of H+2 for three different internuclear dis-
tances of R= 2 a.u. (left column), R= 4 a.u. (middle column) and R= 6 a.u. (right column).The upper panels (same as Fig. 1 (d)-(f) but a narrower logarithmic scale) are the results ofTDSE calculations and the lower panels are calculated by PE.
Figure 3(d)-3(f) display the PMDs of different internuclear distance calculated by PE and thethe results of TDSE are also presented in Fig. 3(a)-3(c) for comparison. One can see that thethese two results agree perfectly with each other. The PMDs calculated by PE well reproduce allthe features of diffraction images, including the positions and shapes of the interference fringes.This indicates that the distortion of the molecular orbital due to the XUV pulse is ignorable.Slightly difference appears at larger px, which can be attributed to the fact that PE predicts alittle higher ionization probability of the molecules thus the high-order interference peaks inthe TDSE calculation are not well resolved as the PE results. Nevertheless, the good agreementbetween the PE and TDSE calculations indicates the validity of classical double-slit predictionswhen de Broglie wavelength of the ejected electrons is less than the internuclear distance in aMAPD experiment [31, 33].
By integrating the PMDs over py, the corresponding electron momentum spectra along px
direction are obtained, as displayed in Fig. 4. Again, the agreement between TDSE and PE cal-culations is achieved. The number of interference peaks is related to the internuclear distance.For R = 2 a.u., there are three peaks within the interval [-5 a.u., 5 a.u.]. For R = 4 a.u., six peaksappear (although the highest-order peaks are weak), twice as the interference peaks for R = 2a.u.. For R = 6 a.u. one can observe nine peaks, triple as those for R = 2 a.u.. This observationcan be summarized in accordance with the classical double-slit experiment as
R = 2π/Δpx, (13)
in which Δpx denotes the momentum separation between the adjacent interference peaks. Theinternuclear distance derived from Eq. (13) is summarized in Tab. 2 and Δpx is obtained bythe momentum separation between the zero-order and first-order interference maximum. Themeasured internuclear distance from both TDSE and PE shows good agreement with the exactinternuclear distance. The maximum error for R = 2 a.u. is 4.5%. For R = 4 a.u. and 6 a.u.,
#232875 - $15.00 USD Received 20 Jan 2015; revised 21 Mar 2015; accepted 7 Apr 2015; published 16 Apr 2015 (C) 2015 OSA 20 Apr 2015 | Vol. 23, No. 8 | DOI:10.1364/OE.23.010687 | OPTICS EXPRESS 10694

−5 0 50
0.5
1R=2 a.u.
px (a.u.)
Pro
babi
lity
(arb
.uni
ts)
−5 0 50
0.5
1R=4 a.u.
px (a.u.)
Pro
babi
lity
(arb
.uni
ts)
−5 0 50
0.5
1R=6 a.u.
px (a.u.)
Pro
babi
lity
(arb
.uni
ts)
−5 0 50
0.5
1
px (a.u.)
Pro
babi
lity
(arb
.uni
ts)
−5 0 50
0.5
1
px (a.u.)
Pro
babi
lity
(arb
.uni
ts)
−5 0 50
0.5
1
px (a.u.)
p y (a.
u.)
(a) (b) (c)
(d) (e) (f)
Fig. 4. Electron momentum spectra of H+2 along the px direction by integration over py for
R = 2 a.u. (left column), R = 4 a.u. (middle column) and R = 6 a.u. (right column). Theupper panels are the results of TDSE calculations and the lower panels are calculated byPE.
we also calculated the internuclear distance averaged over high-order interference peaks. Theerror of measured internuclear distance is less than 3%. All these results imply that the MAPDserves as a efficient tool to measure the internuclear distance of H+
2 .
Table 2. Measured internuclear distance of H+2 from TDSE as well as PE in comparison
with the exact internuclear distance. The internuclear distance is calculated using the zero-order and first-order ionization peaks
Internuclear Measured R(a.u.) Measured R(a.u.)distance of H+
2 R(a.u.) from TDSE from PE
2.0 2.091 2.0684.0 4.069 4.0426.0 6.064 6.013
Next, we will turn to a slightly more complicated molecule, CO2. Figure 5(b) and 5(e) dis-play the electron momentum distributions of CO2 from equilibrium to stretched internucleardistance. Similar as H+
2 , The PMDs of CO2 also show clear diffraction patterns on the pondero-motive motion circle. By stretching the molecule from R = 2.24 a.u. to R = 3 a.u., the numberdiffraction fringes increase with the internuclear distance. However, there is a clear differenceof the PMDs between CO2 and H+
2 . For H+2 it is an interference maximum at px = 0, while
for CO2 it is an interference minimum. This fact can be attributed to the symmetry propertiesof HOMO of CO2. Figure 5(a) and 5(d) show the HOMO of CO2 for R = 2.24 a.u. and R = 3a.u., respectively. The HOMO of CO2, which is of Πg symmetry, is antisymmetric with respectto two nodal planes: one containing the molecular axis and another containing the carbon ionand perpendicular to the molecular axis. During the interaction between the molecule and theXUV pulse, the structure properties of molecular orbital are converged in the propagation of theelectron wavepacket and the initial symmetry persists to some extend under the force of laser
#232875 - $15.00 USD Received 20 Jan 2015; revised 21 Mar 2015; accepted 7 Apr 2015; published 16 Apr 2015 (C) 2015 OSA 20 Apr 2015 | Vol. 23, No. 8 | DOI:10.1364/OE.23.010687 | OPTICS EXPRESS 10695

x (a.u.)
R=
2.24
a.u
.
y (a
.u.)
−5 0 5
−6
−4
−2
0
2
4
6
x (a.u.)
R=
3 a.
u.
y (a
.u.)
−5 0 5
−6
−4
−2
0
2
4
6
px (a.u.)
p y (a.
u.)
−5 0 5
−5
0
5
px (a.u.)
p y (a.
u.)
−5 0 5
−5
0
5
px (a.u.)
−5 0 5
−5
0
5
px (a.u.)
−5 0 5
−5
0
5
−0.2
0
0.2
−0.2
0
0.2
−5
−4.5
−4
−3.5
−3
−2.5
−5
−4.5
−4
−3.5
−3
−2.5
−8
−7
−6
−5
−8
−7
−6
−5
(b) (c)
(e) (f)
(a)
(d)
Fig. 5. Left column: HOMO of CO2 for two different internuclear distances of (a) R =2.24 a.u. and (d) R = 3 a.u. The corresponding photonelectron momentum distributions arecalculated by TDSE (middle column) and PE (right column), respectively. Laser parametersare the same as Fig. 2.
fields [37]. Thereby, the symmetry properties are imprinted onto the PMDs, leading to distinctdiffraction patterns for molecule with different symmetries. This fact is also confirmed by PEcalculations, as presented in Fig. 5(c) and 5(f). The electron momentum distributions calculatedby PE show clear diffraction patterns and interference minimum appears at px = 0. Althoughthe high-order diffraction fringes are not well resolved for TDSE calculations compared withPE, The information contained in low-order fringes is enough for reading the internuclear dis-tance and retrieving the symmetry properties of the molecular orbital. This issue only becomescritical for molecules with short internuclear separations. For these molecules, the number ofinterference fringes is limited, so it is hard to measure the internuclear distance from the diffrac-tion pattern. This shortcoming can be overcome by using XUV pulse with shorter wavelength,such that more energetic electron can be ejected and the radius of the ponderomotive motion cir-cle becomes larger to include more interference fringes. Thereby the short internuclear distancecan be readily read out from the diffraction pattern.
The integrated electron momentum spectra for different internuclear distances over py areshown in Fig. 6, calculated by TDSE (left column) and PE (right column), respectively. Thesetwo results also agree well with each other. For both internuclear distances, there is a inter-ference minimum at px = 0, so a direct analogy to the double-slit experiment is not feasiblefor CO2, due to the symmetry properties of HOMO. Using the linear combination of atomicorbitals (LCAO) scheme, the HOMO of CO2, which possess Πg symmetry, can be expressed asthe antisymmetric combination of two 2py atomic orbitals of oxygen that are oriented perpen-dicular to the molecular axis. The two oxygens’ 2py orbital is antisymmetric, which can be alsoviewed as two ”slits”. The difference is that one slit is masked by a phase function, changing thephase of the electron wavepacket ejected from this slit by π . As a consequence, the interferencemaximum and minimum exchange their positions. We calculate the internuclear separations ofthe two oxygen ions using the zero-order and first-order interference minimum and then the
#232875 - $15.00 USD Received 20 Jan 2015; revised 21 Mar 2015; accepted 7 Apr 2015; published 16 Apr 2015 (C) 2015 OSA 20 Apr 2015 | Vol. 23, No. 8 | DOI:10.1364/OE.23.010687 | OPTICS EXPRESS 10696

−5 0 50
0.5
1
px (a.u.)
R=
4.4
8 a.
u.
Pro
babi
lity
(arb
.uni
ts)
−5 0 50
0.2
0.4
0.6
0.8
1
px (a.u.)
R=
6 a
.u.
Pro
babi
lity
(arb
.uni
ts)
−5 0 50
0.2
0.4
0.6
0.8
1
px (a.u.)
Pro
babi
lity
(arb
.uni
ts)
−5 0 50
0.2
0.4
0.6
0.8
1
px (a.u.)
Pro
babi
lity
(arb
.uni
ts)
(a) (b)
(c) (d)
Fig. 6. Electron momentum spectra of CO2 along the px direction by integration over py forR = 2.24 a.u. (upper panels) and R = 4 a.u. (Lower panels). The left column is the resultsof TDSE calculations and the right column is calculated by PE.
C-O bond length is obtained by dividing the measured internuclear separations by two. Theresults are summarized in Tab. 3. The measured C-O bond length from TDSE and PE showsgood agreement with the exact one. The maximum error is less than 3% for both cases. Moreprecisely, we calculated the averaged C-O bond length over three interference minimums forR = 2.24 a.u. and four minimums for R = 3 a.u.. The results are R = 2.197 a.u. and R = 3.045a.u.,respectively, with error less than 2%. Therefore, it is apparent to see that MAPD is alsouseful for probing molecules with antisymmetry properties.
Table 3. Measured C-O bond length of CO2 from TDSE as well as PE in comparison withthe exact bond-length from equilibrium to stretched geometries. The C-O bond length iscalculated using the zero-order and first-order interference minimum.
C-O bond length Measured R(a.u.) Measured R(a.u.)of CO2 R(a.u.) from TDSE from PE
2.24 (equilibrium) 2.189 2.2543.00 (stretched) 2.989 3.062
Another molecule for the demonstration of MAPD is N2. In the case of N2, the HOMO, ofΣg symmetry, is symmetry about the molecular axis and with two nodal planes ,each of themcontaining one nitrogen ion, perpendicular to the molecular axis. The upper panels of Fig. 7shows HOMO of N2 for three different internuclear separations 2.05 a.u., 4 a.u. and 6 a.u..The HOMO is a bonding orbital which can be expressed as a combination as two px nitrogenorbitals aligned along the molecular axis. These structure properties make the correspondingPMDs a little more complicated, as shown in Fig. 7 (middle panels for TDSE and lower panelsfor PE). The general trend of the PMDs is the same as H+
2 and CO2 : as the internuclear dis-tance stretched from equilibrium 2.05 a.u. to 6 a.u., the number of diffraction stripes increasesaccordingly. However, the detailed structure is different. At px = 0, there is a small maximum,which becomes invisible for large internuclear separations. Then the intensity becomes morepronounced for higher-order fringes. This characteristic is attributed to the structure properties
#232875 - $15.00 USD Received 20 Jan 2015; revised 21 Mar 2015; accepted 7 Apr 2015; published 16 Apr 2015 (C) 2015 OSA 20 Apr 2015 | Vol. 23, No. 8 | DOI:10.1364/OE.23.010687 | OPTICS EXPRESS 10697

x (a.u.)
y (a
.u.)
R=2.05 a.u.
−5 0 5
−5
0
5
x (a.u.)
R= 4 a.u.
−5 0 5
−5
0
5
x (a.u.)
R=6 a.u.
−5 0 5
−5
0
5
px (a.u.)
p y (a.
u.)
−5 0 5
−5
0
5
px (a.u.)
−5 0 5
−5
0
5
px (a.u.)
−5 0 5
−5
0
5
px (a.u.)
p y (a.
u.)
−5 0 5
−5
0
5
px (a.u.)
−5 0 5
−5
0
5
px (a.u.)
−5 0 5
−5
0
5
−0.4−0.200.2
−0.2
0
0.2
−0.2
0
0.2
−4.5
−4
−3.5
−3
−4.5
−4
−3.5
−4.5
−4
−3.5
−8
−7
−6
−8
−7
−6
−8
−7
−6
(c)(b)(a)
(d) (e) (f)
(h)(g) (i)
Fig. 7. Upper panels: HOMO of N2 from equilibrium to stretched internuclear distances(a) R = 2.05 a.u., (b) R = 4 a.u. and (c) R = 6 a.u. The corresponding photonelectronmomentum distributions are calculated by TDSE (middle panels) and PE (lower panels),respectively. Laser parameters are the same as Fig. 2.
for N2 orbital. The HOMO of N2 shows alternating positive and negative lobes along the molec-ular axis and electron wavepackets ejected from different part of the orbital interfere with eachother. So it is not a trivial task to directly relate to the double-slit experiment without additionalassumptions. Nevertheless, we can at least measure the value of the internuclear distance fromthe period of the oscillations in its fringe pattern.
The integrated electron momentum spectra of N2 for different internuclear distances over py
are shown in Fig. 8, calculated by TDSE (upper panels) and PE (lower panels), respectively. Therelative heights of the diffraction fringes can be more clearly viewed from Fig. 8. The heightof the interference peaks increases for high-order fringes, which originate from the interplaybetween the interference of the positive and negative lobes of HOMO. For our purpose ofmeasuring the internuclear distance, We calculated it from one period of the oscillation locatedat moderate px, as indicated by the dashed lines in Fig. 8. The value of internuclear distances areobtained from Eq. (13), summarized in Tab. 4. For stretched R = 4 a.u. and 6 a.u., the measuredinternuclear distances show good agreement with the exact ones, including the TDSE and PEresults. While for equilibrium R = 2.05 a.u., The maximum error is 12%, which is due tothe complicated diffraction pattern of N2 and the limited numbers of interference fringes. Ourresults suggest that in order to precisely measure the equilibrium internuclear distance of N2
one should use XUV pulses with shorter wavelength.Above discussions are based the assumption that the molecule is perfectly aligned perpen-
dicular to the electric field. Next we will go one step further to investigate the influence ofmolecular alignment effects. In reality, the alignment is achieved by exciting the molecule intoa rotational wave packet by a moderately intense pump pulse. In this case, perfect alignmentcan not be achieved and the effect of angular dispersion should be taken into account in the ex-periment of MAPD. We take CO2 for example to investigate the alignment effect on the PMD.The effect of molecular partial alignment is simulated by incoherent superposition of PMD of
#232875 - $15.00 USD Received 20 Jan 2015; revised 21 Mar 2015; accepted 7 Apr 2015; published 16 Apr 2015 (C) 2015 OSA 20 Apr 2015 | Vol. 23, No. 8 | DOI:10.1364/OE.23.010687 | OPTICS EXPRESS 10698

−5 0 50
0.5
1
px (a.u.)
Pro
babi
lity
(arb
.uni
ts)
R=2.05 a.u.
−5 0 50
0.5
1
px (a.u.)
Pro
babi
lity
(arb
.uni
ts)
R=4 a.u.
−5 0 50
0.5
1
px (a.u.)
Pro
babi
lity
(arb
.uni
ts)
R=6 a.u.
−5 0 50
0.5
1
px (a.u.)
Pro
babi
lity
(arb
.uni
ts)
−5 0 50
0.5
1
px (a.u.)
Pro
babi
lity
(arb
.uni
ts)
−5 0 50
0.5
1
px (a.u.)
Pro
babi
lity
(arb
.uni
ts)
(a) (b) (c)
(d) (e) (f)
Fig. 8. Electron momentum spectra of N2 along the px direction by integration over py forR = 2.05 a.u. (left column), R = 4 a.u. (middle column) and R = 6 a.u. (right column). Theupper panels are the results of TDSE calculations and the lower panels are calculated byPE. The black dashed lines in each panel indicate one oscillation period used for measuringthe internuclear distance.
Table 4. Measured internuclear distance of N2 from TDSE as well as PE in comparison withthe exact internuclear distance. The internuclear distance is calculated using the zero-orderand first-order ionization peaks
Internuclear Measured R(a.u.) Measured R(a.u.)distance of N2 R(a.u.) from TDSE from PE
2.05 2.291 2.3144.00 4.093 4.0226.00 6.097 6.086
different angles given by
S (�p) =∫
|∑i
C (�p, ti,θ)|2ρ(θ ;τ)dθ , (14)
whereC (�p, ti,θ) is calculated by Eq. (6) for different angles and ρ(θ ;τ) is the weighted angulardistribution written as
ρ(θ ;τ) = (1/Z)∑Ji
Q(Ji)Ji
∑Mi=−Ji
∫|ΨJiMi(θ ,φ ;τ)|2dφ . (15)
Here Q(Ji) = exp(−BJi(Ji + 1)/(kBT )) is the Boltzmann distribution function of the initialfield-free state |Ji,Mi〉 at temperature T , Z = ∑Jmax
J=0(2J + 1)Q(J) is the partition function, kB
and B are the Boltzmann constant and the rotational constant of the molecule, respectively.ΨJiMi(θ ,φ ;τ) is the time-dependent rotational wave packet excited from the initial state |Ji,Mi〉by the pump pulse, and is obtained by solving the TDSE within the rigid-rotor approximation[41, 42]
i∂Ψ(θ ,φ ;τ)
∂ t= [BJ2 − Ep(τ)2
2(α‖ cos2 θ +α⊥ sin2 θ)]Ψ(θ ,φ ;τ), (16)
#232875 - $15.00 USD Received 20 Jan 2015; revised 21 Mar 2015; accepted 7 Apr 2015; published 16 Apr 2015 (C) 2015 OSA 20 Apr 2015 | Vol. 23, No. 8 | DOI:10.1364/OE.23.010687 | OPTICS EXPRESS 10699

where α‖ and α⊥ are the anisotropic polarizabilities in parallel and perpendicular directionswith respect to the molecular axis, respectively. The degree of alignment is characterized by thealignment parameter < cos2 θ > yielding
< cos2 θ > (τ) = (1/Z)∑Ji
Q(Ji)Ji
∑Mi=−Ji
〈ΨJiMi(θ ,φ ;τ)|cos2 θ |ΨJiMi(θ ,φ ;τ)〉. (17)
px (a.u.)
p y (a.
u.)
−5 0 5
−5
0
5−5 0 50
0.2
0.4
0.6
0.8
1
px (a.u.)
Pro
babi
lity
(arb
.uni
ts)
19.5 20 20.5 21 21.5 22 22.5
0.2
0.4
0.6
Delay (ps)
<<
cos2 θ>
>
−5
−4.5
−4
−3.5
−3
−2.5
(b)
(c)
(a)
(d)
180°
270°
90°
0.88
0.44
0°
A
Fig. 9. (a) The alignment factor << cos2 θ >> for linearly polarized laser pulse with in-tensity of 4.0×10¹³W/cm2. The point A indicates the delay of 21.1 ps that the simulationis performed at. (b) The polar plots of the angular distributions at point A. (c) Angular av-eraged photoelectron momentum distribution for CO2 at equilibrium R = 2.24 a.u. and (d)the corresponding electron momentum spectra along the px direction.
In our simulations, a 100-fs (FWHM) 800-nm linearly polarized pump pulse with intensityof 4.0×10¹³W/cm2 is used to nonadiabatically align the CO2 molecule. The initial rotationaltemperature is taken to be 40 K. The time evolution of the alignment factor < cos2 θ > (τ)is presented in Fig. 9(a). We choose delay of 21.1 ps indicate by point A. The correspondingweighted angular distribution ρ(θ ;τ) is shown in Fig. 9(b). One can see that strong alignment ofCO2 is achieved by the pump pulse. After that, a delayed XUV pulse polarized perpendicular tothe pump pulse is used to ionize the molecule. The angular averaged photoelectron momentumdistribution is calculated by Eq. (14), as displayed in Fig. 9(c). In comparison with the perfectalignment case shown in Fig. 5(b), the angular averaged PMD successfully reproduces all thefringes of the diffraction pattern, except that the contrast of fringes becomes weak. But weare still able to exact the internuclear distance and symmetry properties of the molecule fromthe slightly less contrasted diffraction pattern. As shown in Fig. 9(d), the integrated electronmomentum spectrum is well resolved and the positions of the interference fringes do not shiftcompared to Fig. 6(a). The less contrast of the fringes can be overcome by high-repetitionand high-accuracy data recording for experimental realization. Thus we conclude that angulardispersion do not affect the extraction of internuclear distance and symmetry properties fromthe diffraction pattern.
Below we aim at retrieving the molecular orbital from the diffraction pattern using a simpletwo-center interference model [33]. The two-center interference model can be derived from PE,i.e., Eq. (9). In our case, the typical electron momentum on the ponderomotive motion circle is4.2 a.u. and the amplitude of the vector potential �A(t) for the 5-nm XUV pulse with intensity of1.0× 1015W/cm2 is E0/ω = 0.04 a.u.. Such that |�p| |�A(t)|. Under this condition, the laser
#232875 - $15.00 USD Received 20 Jan 2015; revised 21 Mar 2015; accepted 7 Apr 2015; published 16 Apr 2015 (C) 2015 OSA 20 Apr 2015 | Vol. 23, No. 8 | DOI:10.1364/OE.23.010687 | OPTICS EXPRESS 10700

x (a.u.)
y (a
.u.)
H2+
−5 0 5
−5
0
5
x (a.u.)
CO2
−5 0 5
−5
0
5
x (a.u.)
N2
−5 0 5
−5
0
5
0.1
0.2
0.4
−0.2
−0.1
0
0.1
0.2
−0.4
−0.2
0
0.2(b)(a) (c)
Fig. 10. The reconstructed molecular orbitals of (a) H+2 , (b) CO2 and (c) N2.
dressed effect of the ionized electrons and the distortion of molecular orbital can be neglectedand we obtain �p+�A(t)� �p. Thus Eq. (9) can be approximated by
CPE(�p)� dy(�p)i∫ ∞
−∞e−iS(�p,t)E(t)dt. (18)
The dipole moment dy(�p) can be viewed as the Fourier transform of ψi(�r) weight by y, yielding
CPE(�p) ∝ F [yψi(�r)]. (19)
And therefore the electron momentum spectra can be written as
T (px) ∝∫
|F [yψi(�r)]|2dpy. (20)
For H+2 , the initial orbital is expressed as linear combinations of two hydrogenic 1s orbital
located at ±R/2, i.e., ψH+2= ψ1s(x − R/2,y) + ψ1s(x + R/2,y). By expressing ψ1s(x,y) as
α exp(−β r), the electron momentum spectra for H+2 in Eq. (20) is
TH+2(px) ∝ α
sin2(pxR/2)(p2
x +β 2)2 . (21)
In this equation, the measured internuclear distance R is obtained from Tab. 2 as 2.091 a.u..β serves as a fitting parameter to reproduce the diffraction pattern of Fig. 4(a). For CO2, TheHOMO is an antisymmetric combination of two 2py atomic orbitals of oxygen that are ori-ented perpendicular to the molecular axis, i.e., ψCO2 = ψ2py(x−R,y)−ψ2py(x+R,y), whereψ2py(x,y) is αyexp(−β r). Thus the electron momentum spectra for CO2 is
TCO2(px) ∝ αcos2(pxR)
(p2x +β 2)9/2
. (22)
Again, the C-O bond length R is obtained from Tab. 3 as 2.189 a.u. and the parameter β isdetermined by fitting the diffraction pattern of Fig. 5(a). For N2. the HOMO is combined oftwo 2py atomic orbitals of oxygen aligned along the molecular axis, which can be expressedas ψN2 = ψ2px(x−R/2,y)−ψ2px(x+R/2,y), where ψ2px(x,y) is αxexp(−β r). It is hard toprovide an analytical expression for the electron momentum spectra for N2, so we numericallycalculate it using Eq. (20) with R obtained from Tab. 4. The fitting parameter β is determinedto best reproduce Fig. 8(a). For all the three molecules, the parameter α is calculated by nor-malization of the molecular orbital. The reconstructed molecular orbitals are displayed in Fig.
#232875 - $15.00 USD Received 20 Jan 2015; revised 21 Mar 2015; accepted 7 Apr 2015; published 16 Apr 2015 (C) 2015 OSA 20 Apr 2015 | Vol. 23, No. 8 | DOI:10.1364/OE.23.010687 | OPTICS EXPRESS 10701

10. They all reproduce the main features of each target molecule and show good agreementwith the real molecular orbitals. The results demonstrate that the MAPD technique permits theretrieval of not only the geometrical information but also the orbital structure of the moleculefrom observable photoelectron momentum distributions. We should remind that the knowledgeof the symmetry properties needs to be known a priori in order to retrieve the shape of theorbitals.
4. Conclusion
In summary, we have presented a systematic theoretical analysis of the ionization dynamics ofH+
2 , CO2 and N2 molecules in intense ultrashort linearly polarized XUV pulses within theframework of molecular attosecond photoelectron diffraction. The momentum distributionsof the emitted photoelectrons are calculated by solving the two-dimensional time-dependentSchrodinger equation as well as the photoemission method. We have shown that, if the moleculeis initially aligned perpendicular to the field polarization, the internuclear distance of themolecule can be determined from the diffraction pattern of the photoelectron momentum dis-tribution with a high accuracy of a few percent. The partial alignment effect has been consideredand the robustness of internuclear distance measurement with respect to the rotational motionshas been demonstrated. Besides, we have also shown that the symmetry properties of moleculesare also imprint into PMD and the molecular orbitals can be successfully reconstructed using aninversion algorithm based on two-center interference model. Our results provide an theoreticalguide for ultrafast attosecond photoelectron imaging of molecules.
All the discussions in this paper are based on single-active-electron approximations. Recentexperiments have shown that molecules interacting with a strong laser field could be ionizedfrom several valence orbitals with different symmetries simultaneously [11]. Thus an overlapof multiple diffraction events could appear in the momentum distributions. Due to differentsymmetries of the orbitals, the contribution of multichannel contributions can be disentangledwith a fitted procedure. This implies that the molecular attosecond photoelectron diffractionalso offers possibility to study multielectron effect.
Acknowledgment
This work was supported by the 973 Program of China under Grant No. 2011CB808103, theNNSF of China under Grants No. 11404123, 11234004, and 61275126, the Doctoral fund ofMinistry of Education of China under Grant No. 20100142110047. Numerical simulations pre-sented in this paper were carried out using the High Performance Computing Center experi-mental testbed in SCTS/CGCL (see http://grid.hust.edu.cn/hpcc).
#232875 - $15.00 USD Received 20 Jan 2015; revised 21 Mar 2015; accepted 7 Apr 2015; published 16 Apr 2015 (C) 2015 OSA 20 Apr 2015 | Vol. 23, No. 8 | DOI:10.1364/OE.23.010687 | OPTICS EXPRESS 10702