ultrafast probing of ejection dynamics of rydberg atoms...
TRANSCRIPT
THE JOURNAL OF CHEMICAL PHYSICS 137, 214302 (2012)
Ultrafast probing of ejection dynamics of Rydberg atoms and molecularfragments from electronically excited helium nanodroplets
Oliver Bünermann,1,2,a) Oleg Kornilov,1,2,b) Daniel J. Haxton,1 Stephen R. Leone,1,2,3
Daniel M. Neumark,1,2 and Oliver Gessner1
1Ultrafast X-ray Science Laboratory, Chemical Sciences Division, Lawrence Berkeley National Laboratory,Berkeley, California 94720, USA2Department of Chemistry, University of California, Berkeley, California 94720, USA3Department of Physics, University of California, Berkeley, California 94720, USA
(Received 20 July 2012; accepted 7 November 2012; published online 3 December 2012)
The ejection dynamics of Rydberg atoms and molecular fragments from electronically excited he-lium nanodroplets are studied with time-resolved extreme ultraviolet ion imaging spectroscopy.At excitation energies of 23.6 ± 0.2 eV, Rydberg atoms in n = 3 and n = 4 states are ejectedon different time scales and with significantly different kinetic energy distributions. Specifically,n = 3 Rydberg atoms are ejected with kinetic energies as high as 0.85 eV, but their appear-ance is delayed by approximately 200 fs. In contrast, n = 4 Rydberg atoms appear within thetime resolution of the experiment with considerably lower kinetic energies. Major features in theRydberg atom kinetic energy distributions for both principal quantum numbers can be describedwithin a simple elastic scattering model of localized perturbed atomic Rydberg atoms that are ex-pelled from the droplet due to their repulsive interaction with the surrounding helium bath. Time-dependent kinetic energy distributions of He2
+ and He3+ ions are presented that support the forma-
tion of molecular ions in an indirect droplet ionization process and the ejection of neutral Rydbergdimers on a similar time scale as the n = 3 Rydberg atoms. © 2012 American Institute of Physics.[http://dx.doi.org/10.1063/1.4768422]
I. INTRODUCTION
Helium nanodroplets are sub-micrometer scale clustersof superfluid helium that are formed in a supersonic expan-sion of cryogenically cooled helium gas.1–4 Their role as asuperfluid, cryogenic matrix for electronic,5–7 vibrational,3, 8, 9
and rotational10, 11 spectroscopy of embedded species has ledto a steadily growing interest in understanding the fundamen-tal interactions and dynamics inside helium nanodroplets.9, 12
A detailed description of the electronically excited states ofhelium droplets, all of which lie in the extreme ultraviolet(EUV) region of the electromagnetic spectrum, has provedto be particularly challenging. Synchrotron-based work in thegroups of Möller13 and Toennies14 paved the way to studythese highly excited states and their relaxation pathways. Inparticular, the observation of discrete fluorescence from des-orbed Rydberg atoms and molecules by von Haeften andco-workers unraveled a remarkable cooling mechanism,15 inwhich EUV excitation of droplets resulted in localization andejection of an electronically excited He* atom or He2
* dimer.While photoionization studies of Fröchtenicht et al.14 and Pe-terka et al.16, 17 indicated the existence of an indirect ioniza-tion channel at excitation energies beyond ∼23 eV, ejectionof electronically excited neutral species is believed to be thedominant de-excitation mechanism of droplets excited below
a)Present address: Institute for Physical Chemistry, Georg-August-UniversityGöttingen, Tammanstr. 6, 37077 Göttingen, Germany.
b)Present address: Max-Born-Institute, Max-Born-Str. 2A, 12489 Berlin,Germany.
the atomic ionization limit of 24.6 eV.15, 18, 19 In this paper,we report time-resolved experiments in order to gain a deeperunderstanding of the physics that govern the ejection of Ry-dberg atoms and larger fragments from electronically excitedhelium nanodroplets.
The advent of laser-based femtosecond EUV lightsources20–25 has enabled a new class of experiments to probethe electronic and nuclear dynamics of helium droplets in thetime domain.18, 19, 26 Using femtosecond time-resolved EUVphotoelectron imaging, Kornilov et al.19 identified heliumatoms in electronically aligned 1s4p states and unaligned 1s3dstates as the dominant Rydberg fragments after excitation oflarge (〈N〉 = 2 × 10⁶) droplets with photon energies of 23.6± 0.2 eV. The ejection time scales of atoms in 1s4p statesand 1s3d states were determined to be < 120 fs and ∼220 fs,respectively. In addition, electron signal at near zero kineticenergy (ZEKE) was observed with a rise time of 2-3 ps. Theseobservations were rationalized within a theoretical model thatdescribes electronically excited droplet states by localized,perturbed atomic Rydberg states. This relatively simple modelgives a surprisingly accurate description of the EUV absorp-tion band structure of large helium droplets. An importantconsequence of the model is that, within a specific band,the excitation energy increases monotonically with increas-ing depth of the excitation within the droplet surface region.This correlation is supported by the results of an ion imag-ing study by Bünermann et al.26 and a theoretical ab initiostudy of excited states in small helium clusters by Closser andHead-Gordon.27
0021-9606/2012/137(21)/214302/9/$30.00 © 2012 American Institute of Physics137, 214302-1
214302-2 Bünermann et al. J. Chem. Phys. 137, 214302 (2012)
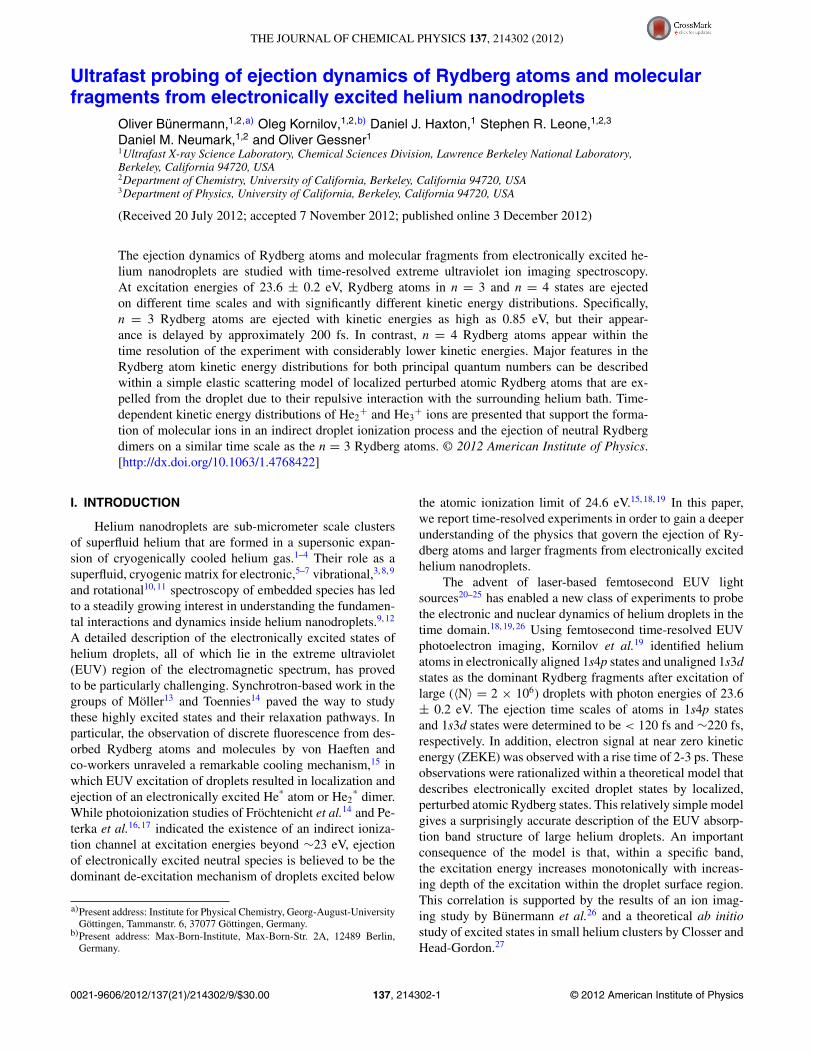
FIG. 1. Illustration of the femtosecond EUV-pump/IR-probe experiment to monitor the ejection dynamics of Rydberg atoms from electronically excited heliumnanodroplets.
In this paper, we report complementary measurementsthat probe the time-evolving kinetic energy distributions(KEDs) of the Rydberg atoms ejected from He droplets sub-sequent to EUV excitation. As shown in Figure 1, He dropletsare excited with a femtosecond EUV pump pulse centeredat 23.6 eV, resulting in ejection of He* atoms that are ion-ized with an 800 nm femtosecond probe pulse. Using time-resolved ion imaging techniques, we can thus determine theRydberg atom abundance and kinetic energy distribution as afunction of pump-probe delay. We also present results on theobservation of He2
+ and He3+ molecular ions.
The experimental results are combined with the find-ings of a previous femtosecond EUV photoelectron imag-ing study19 in order to draw a comprehensive picture of theRydberg atom ejection mechanism. We find that there aretwo contributions to the Rydberg atom dynamics: within thecross correlation of the laser pulses, He*(1s4p) atoms areejected from the droplets with low kinetic energies, whereasHe*(1s3d) atoms appear on a time scale of 200 fs with con-siderably higher kinetic energies. These results are explainedusing a Monte Carlo multiple scattering simulation of theRydberg atom trajectories in the droplet surface region. Thepotential energy surfaces for the trajectories are derivedfrom a simplified version of the localized perturbed atomicRydberg state picture of droplet excitations described in pre-vious work.19 The overall picture from this analysis is thatHe*(1s3d) atoms are formed deeper within the droplet thanHe*(1s4p) atoms. The He*(1s3d) atoms thus experience agreater degree of repulsion with the surrounding He atomsand traverse a larger potential gradient en route to leaving thedroplet.
II. EXPERIMENT
The experiment is described in detail in Refs. 18 and 26.Briefly, the apparatus consists of two major parts: a high har-monic generation beam line to create ultrashort EUV lightpulses and a molecular beam instrument equipped with both aphotoelectron velocity map imaging spectrometer and an ionimaging spectrometer.
The beam line is driven by a Ti:Sapphire based femtosec-ond laser system, providing pulses with 25 fs pulse duration,785 nm central wavelength, and energies up to 5 mJ per pulseat a repetition rate of 3 kHz. The infrared (IR) laser beam issplit into two beams. The main part is used to generate highharmonics in a gas cell filled with krypton. Two silicon mir-rors placed at Brewster’s angle for the fundamental light filterout most of the IR photons while most of the EUV light isreflected. An additional tin filter blocks the remaining IR andsuppresses EUV radiation beyond 24 eV. This filter is a cru-cial component in the setup since it has a major impact on thespectrum of the EUV beam that excites the droplets. Previousmeasurements were performed using an aluminum filter witha significantly broader transmission window extending far be-yond the atomic helium ionization potential of 24.6 eV.26 Thesecond part of the IR beam is routed through a computer-controlled delay stage. Both beams are combined by meansof an annular 45◦ mirror, with the EUV pulse passing througha central hole and the IR light reflected by the mirror. Thebeams travel collinearly and reflect off a concave multilayermirror. This mirror fulfills two purposes: its multilayer struc-ture is optimized for reflection of the 15th harmonic at anominal photon energy of 23.7 eV, and it focuses both beams

214302-3 Bünermann et al. J. Chem. Phys. 137, 214302 (2012)
into the ion/electron spectrometer where they intersect the he-lium droplet beam.
The molecular beam instrument consists of a sourcechamber, a differential pumping stage, and a detection cham-ber. The beam of helium nanodroplets is created by expand-ing helium gas under high pressure and low temperaturesthrough a 5 μm nozzle into vacuum. In the expansion, thehelium cools down further and eventually forms droplets. Thedroplets then travel through a skimmer into the differentialpumping stage and reach the ion/electron spectrometer af-ter passing through a second skimmer. The experiments de-scribed here are performed at source conditions of T0 = 13K and P0 = 80 bar leading to an average droplet size of 〈N〉= 2×10⁶ atoms per droplet.4
Both light beams intersect the droplet beam in the inter-action volume of a Wiley-McLaren ion time-of-flight (TOF)spectrometer28 equipped with a time- and position sensitivedetector.29 From the TOF and the detector hit positions, theion mass, the kinetic energy distribution, and the ion emis-sion angular distribution are derived. Note that this is nota velocity-map imaging experiment;30 the detector providesposition and timing information for each detected ion, fromwhich the ion kinetic energy is directly obtained.
For each pump-probe delay, two measurements are per-formed, one with both pump and probe beams incident onthe target (“pump + probe”) and one with the EUV pumpbeam exclusively (“pump-only”). The IR probe beam alonedoes not produce any signal. All pump-probe signals pre-sented here are corrected by subtracting pump-only contri-butions that arise from EUV ionization of the ground statedroplets from the pump + probe signals. Each time-delayscan is performed multiple times in alternating directions (in-creasing and decreasing time delay) to minimize the impactof long term drifts in the experimental setup. The delay stepwidth is 20 fs for scans with 1 ps maximum delay and 0.2 psfor scans with 10 ps maximum delay. Typical data acquisitiontimes are on the order of 3–5 min per data point.
III. RESULTS
The time-dependent ion mass spectra consist almost ex-clusively of monomer, dimer, and trimer ions (Figure 2(a),note the logarithmic scaling of the ordinate). The relative ionyields drop significantly with increasing mass; trimer ions ac-count for less than 5% of the total ion signal. Despite the nom-inal 24 eV cutoff energy of the tin filter, a small contributionof high energy photons (>24.6 eV) reaches the interactionregion, leading to some He+ background signal in the pump-only spectrum due to direct ionization of helium droplets andhelium atoms. This signal does not contribute to the time-dependent data discussed below because the aforementionedcorrection procedure eliminates signals emerging solely fromthe EUV pump pulse.
Figure 2(b) shows the predominant partial ion yields as afunction of pump-probe delay �t. The He+ signal rises withinthe time resolution of the experiment (120 fs, full-width-at-half-maximum, FWHM), increases during the next ∼200 fs,and then remains constant. In contrast, the He2
+ and He3+
transients exhibit an instantaneous rise followed by a fast de-
0 2 4 6 8 10
0.0
0.5
1.0
He He He
norm
. cou
nts
delay (ps)
+
+
+2
3
(b)
2 4 6 8 10 12 14 16
1
10
100
coun
ts (s
-1)
HeN
pump only pump probe: 0.1 ps pump probe: 10 ps
+
(a)
FIG. 2. (a) EUV-pump only mass spectra (solid) and EUV-pump/IR-probemass spectra recorded at pump-probe time delays of 0.1 ps (open) and 10 ps(striped). (b) Transient partial ion yields of different HeN
+ ions, normalizedto the same maximum intensity at 10 ps. Note that some of the data shown in(a) have been published in previous work.26
cay within ∼200 fs and a subsequent rise on a 2–3 ps timescale. All of these time scales are similar to those previouslyreported in time-resolved photoelectron spectra of He dropletsin the same size range;19 the instantaneous rise correlates tothe appearance of He*(n = 4) Rydberg atoms, the 200 fs timescale corresponds to the decay of the initially excited dropletstate and the appearance of He*(n = 3) Rydberg atoms, whilethe 2-3 ps rise of the He2
+ and He3+ ions is close to that of
the near ZEKE photoelectron signal. These correspondencesare considered in more detail below.
Figures 3(a) and 3(b) show detector hit position distri-butions of He+ ions at 100 fs and 10 ps pump-probe delay,respectively. Note the logarithmic scaling of the false colorplots. The slightly tilted narrow streaks in the images areresiduals of the subtraction procedure that suppresses signalsfrom direct ionization of He background gas along the laserbeam path by high energy light leaking through the Sn fil-ter. This signal does not contribute to the pump-probe datapresented in the following since the residual consists of bothsmall positive and negative values that average to zero in theanalysis. However, the streaks are good indicators for possible
-20 -10 0 10 20
-20
-10
0
10
20(b)
laser
heliu
m
10ps
y - position (mm)
x -
posi
tion
(mm
)
100 fs
(a)
-20 -10 0 10 20
6E-4 0.01 0.2 1
FIG. 3. Detector hit position distributions of He+ ions at pump-probe delaysof (a) 100 fs and (b) 10 ps. The slightly tilted narrow streaks in the imagesare residuals of the subtraction procedure that suppresses direct ionizationsignals from He background gas along the laser beam path as indicated onthe right. Note the logarithmic scaling of the false color plots.
214302-4 Bünermann et al. J. Chem. Phys. 137, 214302 (2012)
background contributions from atomic He in our pump-probedata. The background atoms that contribute to the streaks aremarked by very low kinetic energies on the order of kT (T≈ 200 K) and therefore spread only very little across the de-tector during their flight time, leading to a vertical projectionof the laser beam onto the ion detector. In contrast, the Ry-dberg atoms ejected by the droplets have larger kinetic en-ergies, which result in the much broader isotropic distribu-tion of He+ ions centered on the crossing point between thelaser beam and the droplet beam. This distinction confirmsthat a predominant fraction of the He+ ions detected in thepump-probe experiment stems from droplets rather than back-ground gas. The different diameters of the isotropic distribu-tions in Figures 3(a) and 3(b) reflect the change of the He+
kinetic energy distribution as the pump-probe delay is varied.However, the isotropic character of this signal originatingfrom the droplets is maintained at all pump-probe delays.
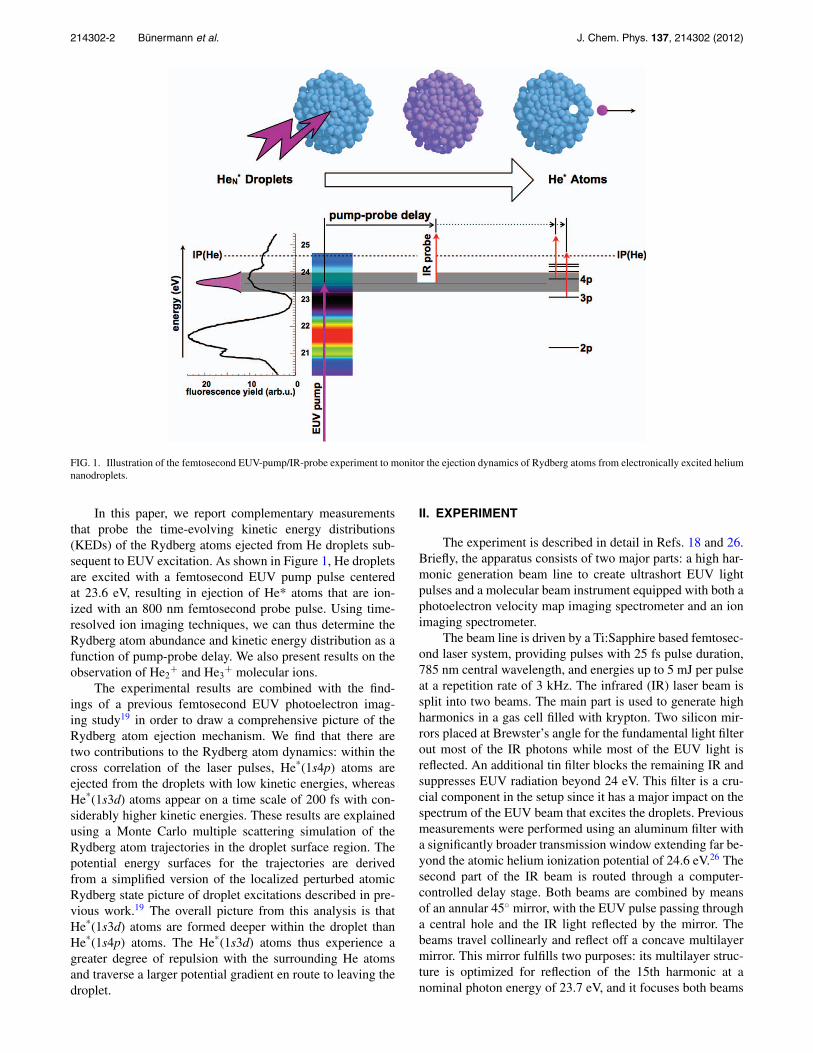
Figure 4(b) shows KED (vertical axis) of He+ ions asa function of �t (horizontal axis). Note that the false colorscale is logarithmic. At each time delay, the KED peaks atzero kinetic energy and falls off monotonically toward higherenergies. It is readily apparent that the He+ KED changessignificantly with pump-probe time delay. Ions with kineticenergies below ∼150 meV appear as soon as the pump andprobe pulses overlap. Significantly, higher kinetic energiesare only observed for delays beyond ∼200 fs. The black datapoints in Figures 4(a) and 4(c) are derived by integrating Fig-ure 4(b) over all kinetic energies and all time delays, respec-tively, and thus represent the total He+ signal as a function oftime, I(�t), and the time-integrated KED, P(E), of the He+
ions. Similar plots for He2+ and He3
+ are shown in Figures5 and 6. Note that the integrated I(�t) curves from the two-dimensional measurements are the same as the time-resolvedmass spectra in Figure 2(b), except for different normaliza-tions.
0.00.20.40.60.8
0.04 0.5 6
(b)
0.0 0.5 1.00.00.20.40.60.8 (d)
0
50
100(a)
0.1 1 10
delay Δt (ps)
kine
tic e
nerg
y (e
V)
I (co
unts
/s)
P (counts/s)
data fit M1 M2
(c)
FIG. 4. Time-dependent ion kinetic energy distributions for He+ (b). Thetime-dependent He+ ion intensity I(�t) ((a) black dotted) is derived by in-tegrating (b) along the kinetic energy axis. The black dotted kinetic energydistribution P(E) in (c) is derived by integrating (b) along the delay axis. Thered and green lines in (a) and (c) represent the components M1 and M2 asdescribed in the text; the gray lines represent the overall fit. Panel (d) showsthe two-dimensional fit of the transient ion kinetic energy distributions. Notethe logarithmic scale of the false color plots.
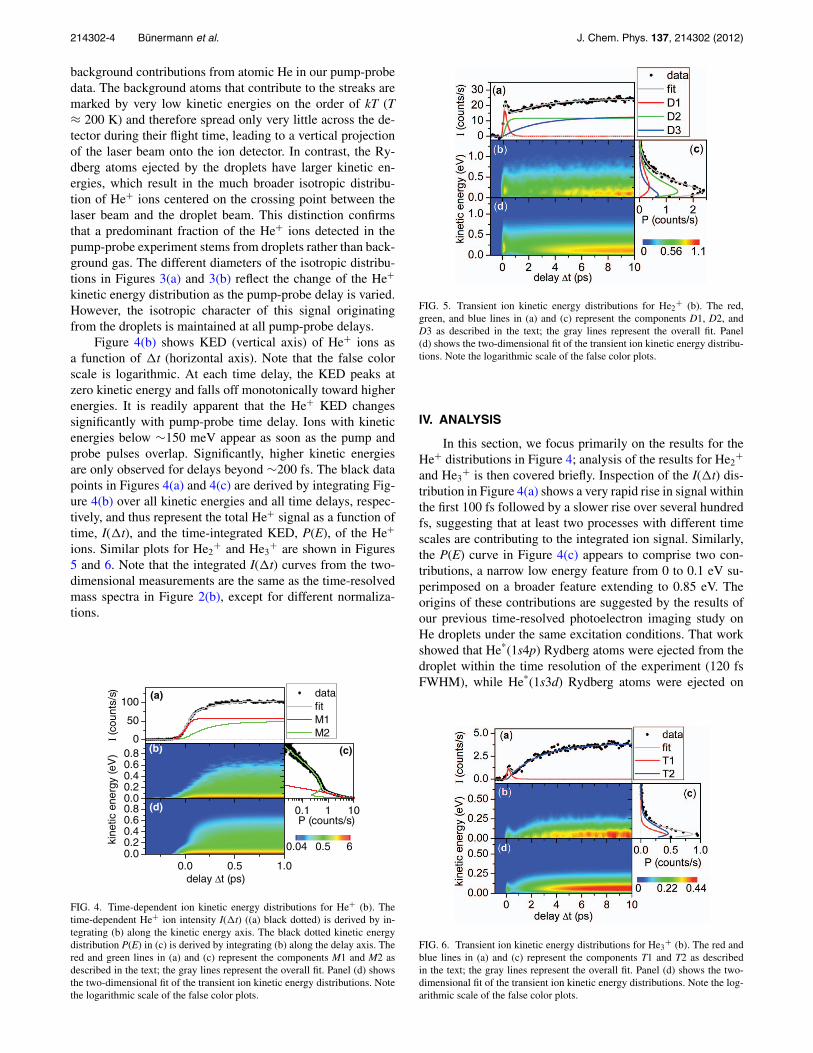
FIG. 5. Transient ion kinetic energy distributions for He2+ (b). The red,
green, and blue lines in (a) and (c) represent the components D1, D2, andD3 as described in the text; the gray lines represent the overall fit. Panel(d) shows the two-dimensional fit of the transient ion kinetic energy distribu-tions. Note the logarithmic scale of the false color plots.
IV. ANALYSIS
In this section, we focus primarily on the results for theHe+ distributions in Figure 4; analysis of the results for He2
+
and He3+ is then covered briefly. Inspection of the I(�t) dis-
tribution in Figure 4(a) shows a very rapid rise in signal withinthe first 100 fs followed by a slower rise over several hundredfs, suggesting that at least two processes with different timescales are contributing to the integrated ion signal. Similarly,the P(E) curve in Figure 4(c) appears to comprise two con-tributions, a narrow low energy feature from 0 to 0.1 eV su-perimposed on a broader feature extending to 0.85 eV. Theorigins of these contributions are suggested by the results ofour previous time-resolved photoelectron imaging study onHe droplets under the same excitation conditions. That workshowed that He*(1s4p) Rydberg atoms were ejected from thedroplet within the time resolution of the experiment (120 fsFWHM), while He*(1s3d) Rydberg atoms were ejected on
FIG. 6. Transient ion kinetic energy distributions for He3+ (b). The red and
blue lines in (a) and (c) represent the components T1 and T2 as describedin the text; the gray lines represent the overall fit. Panel (d) shows the two-dimensional fit of the transient ion kinetic energy distributions. Note the log-arithmic scale of the false color plots.
214302-5 Bünermann et al. J. Chem. Phys. 137, 214302 (2012)
a time scale of 220 fs. We therefore start out in the analy-sis based on the assumption that the data in Figure 4 reflectthe KED and time-dependent yield of these two He* excitedstates.
Based on the above considerations, the two-dimensionaldata set in Figure 4(b) is fit as the sum of two products
M(E,�t) = IM1(�t)PM1(E) + IM2(�t)PM2(E). (1)
Here, the PM1,M2(E) functions are the KEDs of He* atomswith principal quantum numbers n = 4 (M1) and n = 3(M2). These are assumed to be time-independent and onlytheir relative contributions IM1,M2(�t) change as a function ofthe pump-probe delay �t. The time-dependent relative yieldsIM1,M2(�t) are expressed as the Heaviside step function θ (�t)for n = 4 and an exponentially rising component that appearson a 220 fs time scale for n = 3, leading to
M(E,�t) = θ (�t)PM1(E) + [1 − e−�t / 220 f s]PM2(E).(2)
The KEDs are derived in a series of least-squares fitsusing Eq. (2) convoluted with a Gaussian distribution thataccounts for the experimental time resolution of 120 fs(FWHM). The two-dimensional data set is divided into nar-row (10 meV wide) energy slices: Mi(Ei,�t) = M(Ei ≤ E< Ei
+ δE,�t), δE = 10 meV, Ei = i · δE. The pump-probe signalin each slice is fitted according to Eq. (2), yielding two ampli-tudes PM1(Ei) and PM2(Ei). The series of amplitudes PM1(Ei),PM2(Ei) are point-wise representations of the KEDs of thetwo components PM1(E) and PM2(E), which are plotted as redand green curves, respectively, in Figure 4(c). Correspond-ingly, the time-dependent functions IM1(�t) and IM2(�t), con-voluted with the experimental time resolution, are plottedas the red and green curves, respectively, in Figure 4(a).Figure 4(d) shows the two-dimensional modeling of the databy the fit results. The fit quality is very good. Note that thelogarithmic color scale permits to distinguish differences be-tween the data in Figure 4(b) and the two-dimensional fit inFigure 4(d) on a level of a few percent of the maximum inten-sity.
An alternative fitting procedure in which both relativeyields IM1,M2(�t) are described by exponentially rising con-tributions In(�t) = 1 − e�t / τn with freely variable rise timesτ n leads to similar results (e.g., a 200 ± 40 fs rise time forcomponent M2), but doubling the number of free fit parame-ters significantly increases the uncertainty of the energy dis-tributions PM1,M2(E). In contrast, fixing the time constants tothe values derived from our previous photoelectron imagingstudy19 leads to well-defined fit results and permits a directcomparison to the corresponding electron measurements.
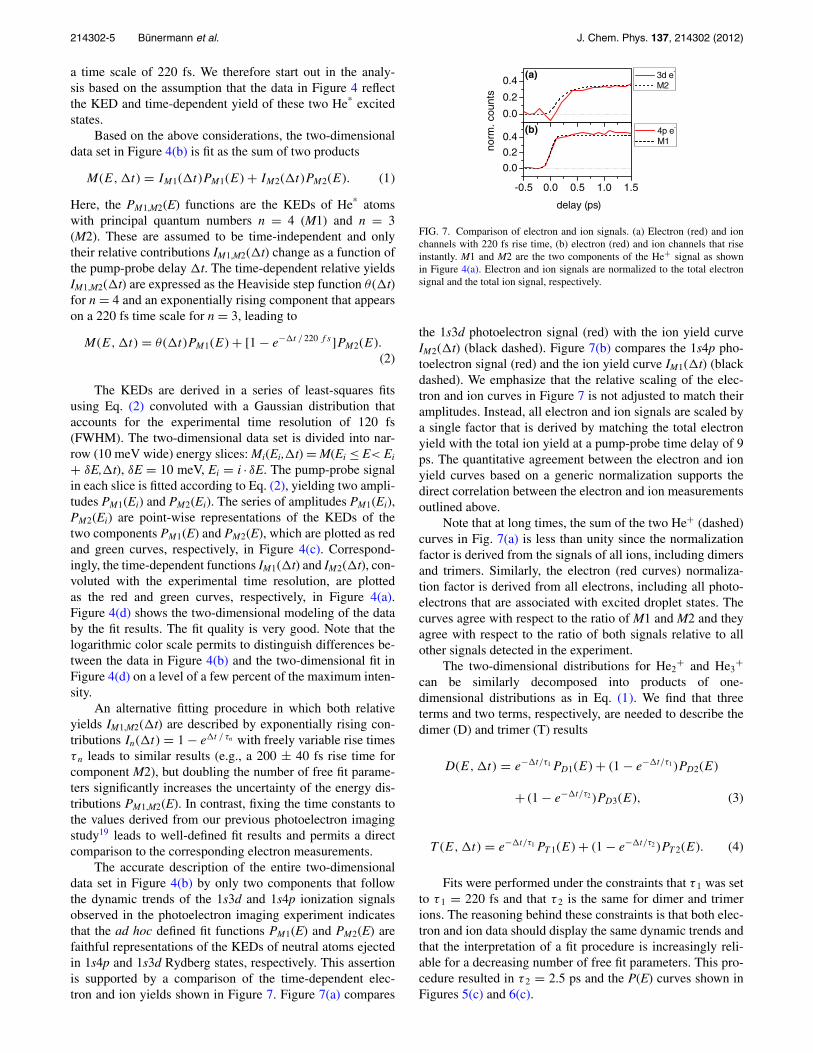
The accurate description of the entire two-dimensionaldata set in Figure 4(b) by only two components that followthe dynamic trends of the 1s3d and 1s4p ionization signalsobserved in the photoelectron imaging experiment indicatesthat the ad hoc defined fit functions PM1(E) and PM2(E) arefaithful representations of the KEDs of neutral atoms ejectedin 1s4p and 1s3d Rydberg states, respectively. This assertionis supported by a comparison of the time-dependent elec-tron and ion yields shown in Figure 7. Figure 7(a) compares
0.0
0.2
0.4
norm
. cou
nts
3d e-
M2(a)
-0.5 0.0 0.5 1.0 1.5
0.0
0.2
0.4
delay (ps)
4p e-
M1(b)
FIG. 7. Comparison of electron and ion signals. (a) Electron (red) and ionchannels with 220 fs rise time, (b) electron (red) and ion channels that riseinstantly. M1 and M2 are the two components of the He+ signal as shownin Figure 4(a). Electron and ion signals are normalized to the total electronsignal and the total ion signal, respectively.
the 1s3d photoelectron signal (red) with the ion yield curveIM2(�t) (black dashed). Figure 7(b) compares the 1s4p pho-toelectron signal (red) and the ion yield curve IM1(�t) (blackdashed). We emphasize that the relative scaling of the elec-tron and ion curves in Figure 7 is not adjusted to match theiramplitudes. Instead, all electron and ion signals are scaled bya single factor that is derived by matching the total electronyield with the total ion yield at a pump-probe time delay of 9ps. The quantitative agreement between the electron and ionyield curves based on a generic normalization supports thedirect correlation between the electron and ion measurementsoutlined above.
Note that at long times, the sum of the two He+ (dashed)curves in Fig. 7(a) is less than unity since the normalizationfactor is derived from the signals of all ions, including dimersand trimers. Similarly, the electron (red curves) normaliza-tion factor is derived from all electrons, including all photo-electrons that are associated with excited droplet states. Thecurves agree with respect to the ratio of M1 and M2 and theyagree with respect to the ratio of both signals relative to allother signals detected in the experiment.
The two-dimensional distributions for He2+ and He3
+
can be similarly decomposed into products of one-dimensional distributions as in Eq. (1). We find that threeterms and two terms, respectively, are needed to describe thedimer (D) and trimer (T) results
D(E,�t) = e−�t/τ1PD1(E) + (1 − e−�t/τ1 )PD2(E)
+ (1 − e−�t/τ2 )PD3(E), (3)
T (E,�t) = e−�t/τ1PT 1(E) + (1 − e−�t/τ2 )PT 2(E). (4)
Fits were performed under the constraints that τ 1 was setto τ 1 = 220 fs and that τ 2 is the same for dimer and trimerions. The reasoning behind these constraints is that both elec-tron and ion data should display the same dynamic trends andthat the interpretation of a fit procedure is increasingly reli-able for a decreasing number of free fit parameters. This pro-cedure resulted in τ 2 = 2.5 ps and the P(E) curves shown inFigures 5(c) and 6(c).
214302-6 Bünermann et al. J. Chem. Phys. 137, 214302 (2012)
V. DISCUSSION
A. Modeling the Rydberg atom ejection mechanism:Coupling of electronic excitation and nuclear motion
In the following, a microscopic description of the Ryd-berg atom emission is presented that correctly predicts themajor features of the monomer ion KEDs. The descriptionis based on a model that assigns excited droplet states be-low 24 eV to perturbed atomic Rydberg states located in thedroplet surface region. The model is described in detail by Ko-rnilov et al.19 Briefly, the energies of atomic Rydberg statesembedded in the droplet are approximated by the eigenvaluesof a model hamiltonian with a potential that consists of theCoulomb potential of the ionic core of the Rydberg state plusa step function that represents the average influence of thedroplet environment on the Rydberg electron. The distance ofthe barrier from the ionic core is approximated by the nearestneighbor distribution inside the droplet.17 The barrier height isestimated to scale linearly with the local density surroundingthe Rydberg atom, ranging from 0 eV in the free atom limitof the outermost surface regions to 1 eV in the droplet bulk;the latter value corresponds to the energy of a free electron inliquid He relative to the vacuum.31
The resulting potential is described by
V (r, R) = −1
r+ V0(R)θ (r − rnn), (5)
where V0(R) = 1 eV × ρ(R) / ρbulk is the barrier height as afunction of the local density ρ(R) at a distance R of the ioniccore from the droplet center, r is the distance between the Ry-dberg electron and the ionic core, rnn is the nearest neigh-bor distance, and θ (r−rnn) is the Heaviside step function. Theoriginal model19 employed cylindrically symmetric potentialsto account for the local density variations within the spatialextent of a single Rydberg atom. Here, we apply a simplifiedversion that assumes spherically symmetric potentials for thedescription of the localized Rydberg excitations as describedby Eq. (5). This choice was made because simulations of theKEDs using the cylindrically symmetric potentials resulted inconsiderably poorer agreement with experiment, as discussedin more detail in Sec. V C.
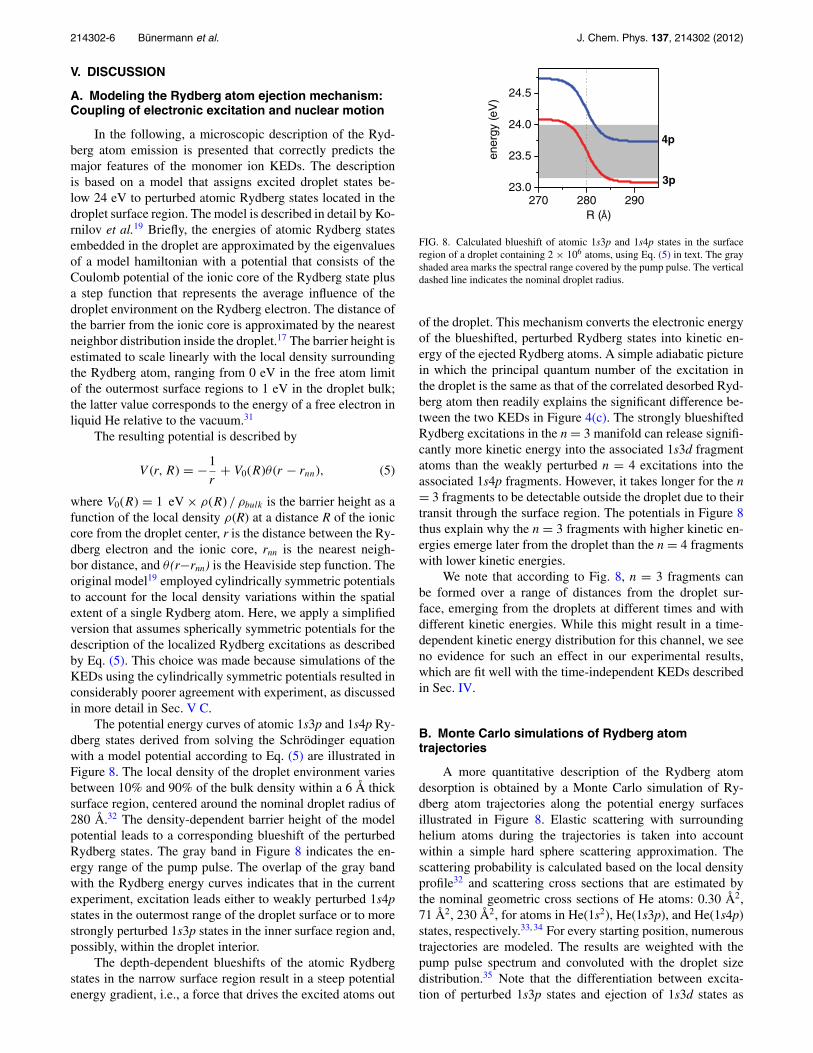
The potential energy curves of atomic 1s3p and 1s4p Ry-dberg states derived from solving the Schrödinger equationwith a model potential according to Eq. (5) are illustrated inFigure 8. The local density of the droplet environment variesbetween 10% and 90% of the bulk density within a 6 Å thicksurface region, centered around the nominal droplet radius of280 Å.32 The density-dependent barrier height of the modelpotential leads to a corresponding blueshift of the perturbedRydberg states. The gray band in Figure 8 indicates the en-ergy range of the pump pulse. The overlap of the gray bandwith the Rydberg energy curves indicates that in the currentexperiment, excitation leads either to weakly perturbed 1s4pstates in the outermost range of the droplet surface or to morestrongly perturbed 1s3p states in the inner surface region and,possibly, within the droplet interior.
The depth-dependent blueshifts of the atomic Rydbergstates in the narrow surface region result in a steep potentialenergy gradient, i.e., a force that drives the excited atoms out
270 280 29023.0
23.5
24.0
24.5
ener
gy (e
V)
R ( )
4p
3p
FIG. 8. Calculated blueshift of atomic 1s3p and 1s4p states in the surfaceregion of a droplet containing 2 × 10⁶ atoms, using Eq. (5) in text. The grayshaded area marks the spectral range covered by the pump pulse. The verticaldashed line indicates the nominal droplet radius.
of the droplet. This mechanism converts the electronic energyof the blueshifted, perturbed Rydberg states into kinetic en-ergy of the ejected Rydberg atoms. A simple adiabatic picturein which the principal quantum number of the excitation inthe droplet is the same as that of the correlated desorbed Ryd-berg atom then readily explains the significant difference be-tween the two KEDs in Figure 4(c). The strongly blueshiftedRydberg excitations in the n = 3 manifold can release signifi-cantly more kinetic energy into the associated 1s3d fragmentatoms than the weakly perturbed n = 4 excitations into theassociated 1s4p fragments. However, it takes longer for the n= 3 fragments to be detectable outside the droplet due to theirtransit through the surface region. The potentials in Figure 8thus explain why the n = 3 fragments with higher kinetic en-ergies emerge later from the droplet than the n = 4 fragmentswith lower kinetic energies.
We note that according to Fig. 8, n = 3 fragments canbe formed over a range of distances from the droplet sur-face, emerging from the droplets at different times and withdifferent kinetic energies. While this might result in a time-dependent kinetic energy distribution for this channel, we seeno evidence for such an effect in our experimental results,which are fit well with the time-independent KEDs describedin Sec. IV.
B. Monte Carlo simulations of Rydberg atomtrajectories
A more quantitative description of the Rydberg atomdesorption is obtained by a Monte Carlo simulation of Ry-dberg atom trajectories along the potential energy surfacesillustrated in Figure 8. Elastic scattering with surroundinghelium atoms during the trajectories is taken into accountwithin a simple hard sphere scattering approximation. Thescattering probability is calculated based on the local densityprofile32 and scattering cross sections that are estimated bythe nominal geometric cross sections of He atoms: 0.30 Å2,71 Å2, 230 Å2, for atoms in He(1s2), He(1s3p), and He(1s4p)states, respectively.33, 34 For every starting position, numeroustrajectories are modeled. The results are weighted with thepump pulse spectrum and convoluted with the droplet sizedistribution.35 Note that the differentiation between excita-tion of perturbed 1s3p states and ejection of 1s3d states as
214302-7 Bünermann et al. J. Chem. Phys. 137, 214302 (2012)
0.0
0.2
0.4
0.6
0.8
1.0
norm
. cou
nts
experiment model model, no scatter
n = 4(a)
0.0 0.2 0.4 0.6 0.8 1.00.0
0.2
0.4
0.6
0.8
1.0
kinetic energy (eV)
n = 3(b)
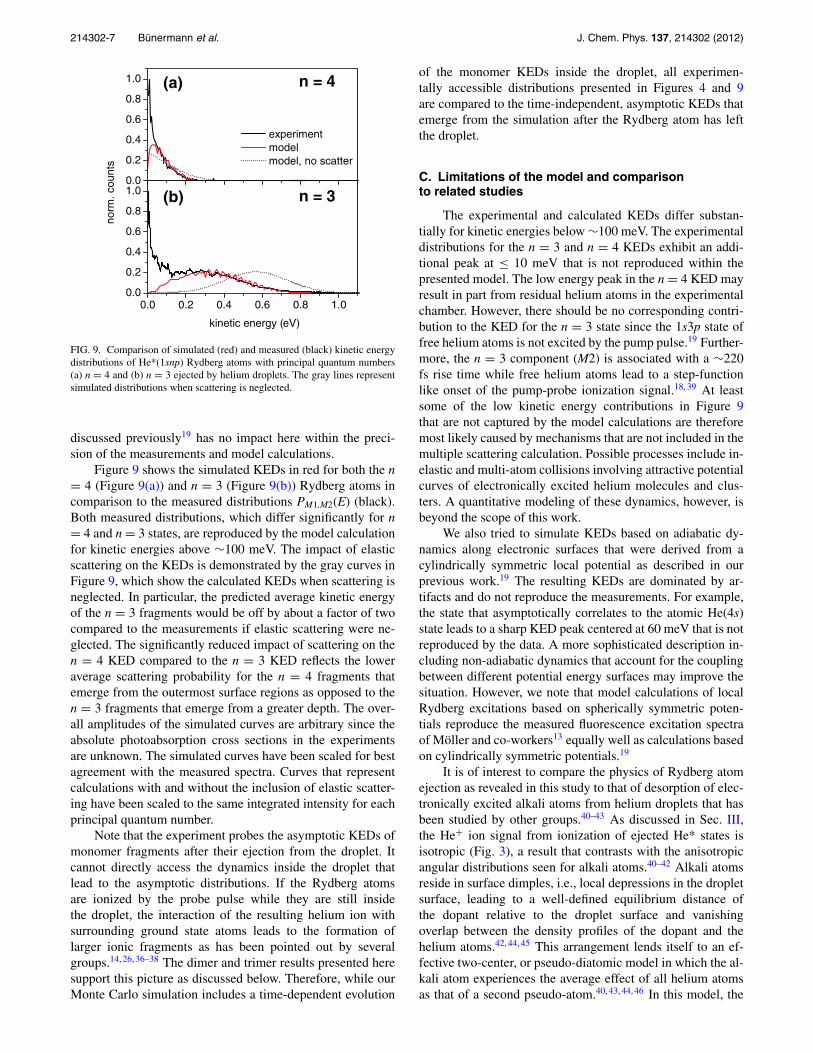
FIG. 9. Comparison of simulated (red) and measured (black) kinetic energydistributions of He*(1snp) Rydberg atoms with principal quantum numbers(a) n = 4 and (b) n = 3 ejected by helium droplets. The gray lines representsimulated distributions when scattering is neglected.
discussed previously19 has no impact here within the preci-sion of the measurements and model calculations.
Figure 9 shows the simulated KEDs in red for both the n= 4 (Figure 9(a)) and n = 3 (Figure 9(b)) Rydberg atoms incomparison to the measured distributions PM1,M2(E) (black).Both measured distributions, which differ significantly for n= 4 and n = 3 states, are reproduced by the model calculationfor kinetic energies above ∼100 meV. The impact of elasticscattering on the KEDs is demonstrated by the gray curves inFigure 9, which show the calculated KEDs when scattering isneglected. In particular, the predicted average kinetic energyof the n = 3 fragments would be off by about a factor of twocompared to the measurements if elastic scattering were ne-glected. The significantly reduced impact of scattering on then = 4 KED compared to the n = 3 KED reflects the loweraverage scattering probability for the n = 4 fragments thatemerge from the outermost surface regions as opposed to then = 3 fragments that emerge from a greater depth. The over-all amplitudes of the simulated curves are arbitrary since theabsolute photoabsorption cross sections in the experimentsare unknown. The simulated curves have been scaled for bestagreement with the measured spectra. Curves that representcalculations with and without the inclusion of elastic scatter-ing have been scaled to the same integrated intensity for eachprincipal quantum number.
Note that the experiment probes the asymptotic KEDs ofmonomer fragments after their ejection from the droplet. Itcannot directly access the dynamics inside the droplet thatlead to the asymptotic distributions. If the Rydberg atomsare ionized by the probe pulse while they are still insidethe droplet, the interaction of the resulting helium ion withsurrounding ground state atoms leads to the formation oflarger ionic fragments as has been pointed out by severalgroups.14, 26, 36–38 The dimer and trimer results presented heresupport this picture as discussed below. Therefore, while ourMonte Carlo simulation includes a time-dependent evolution
of the monomer KEDs inside the droplet, all experimen-tally accessible distributions presented in Figures 4 and 9are compared to the time-independent, asymptotic KEDs thatemerge from the simulation after the Rydberg atom has leftthe droplet.
C. Limitations of the model and comparisonto related studies
The experimental and calculated KEDs differ substan-tially for kinetic energies below ∼100 meV. The experimentaldistributions for the n = 3 and n = 4 KEDs exhibit an addi-tional peak at ≤ 10 meV that is not reproduced within thepresented model. The low energy peak in the n = 4 KED mayresult in part from residual helium atoms in the experimentalchamber. However, there should be no corresponding contri-bution to the KED for the n = 3 state since the 1s3p state offree helium atoms is not excited by the pump pulse.19 Further-more, the n = 3 component (M2) is associated with a ∼220fs rise time while free helium atoms lead to a step-functionlike onset of the pump-probe ionization signal.18, 39 At leastsome of the low kinetic energy contributions in Figure 9that are not captured by the model calculations are thereforemost likely caused by mechanisms that are not included in themultiple scattering calculation. Possible processes include in-elastic and multi-atom collisions involving attractive potentialcurves of electronically excited helium molecules and clus-ters. A quantitative modeling of these dynamics, however, isbeyond the scope of this work.
We also tried to simulate KEDs based on adiabatic dy-namics along electronic surfaces that were derived from acylindrically symmetric local potential as described in ourprevious work.19 The resulting KEDs are dominated by ar-tifacts and do not reproduce the measurements. For example,the state that asymptotically correlates to the atomic He(4s)state leads to a sharp KED peak centered at 60 meV that is notreproduced by the data. A more sophisticated description in-cluding non-adiabatic dynamics that account for the couplingbetween different potential energy surfaces may improve thesituation. However, we note that model calculations of localRydberg excitations based on spherically symmetric poten-tials reproduce the measured fluorescence excitation spectraof Möller and co-workers13 equally well as calculations basedon cylindrically symmetric potentials.19
It is of interest to compare the physics of Rydberg atomejection as revealed in this study to that of desorption of elec-tronically excited alkali atoms from helium droplets that hasbeen studied by other groups.40–43 As discussed in Sec. III,the He+ ion signal from ionization of ejected He* states isisotropic (Fig. 3), a result that contrasts with the anisotropicangular distributions seen for alkali atoms.40–42 Alkali atomsreside in surface dimples, i.e., local depressions in the dropletsurface, leading to a well-defined equilibrium distance ofthe dopant relative to the droplet surface and vanishingoverlap between the density profiles of the dopant and thehelium atoms.42, 44, 45 This arrangement lends itself to an ef-fective two-center, or pseudo-diatomic model in which the al-kali atom experiences the average effect of all helium atomsas that of a second pseudo-atom.40, 43, 44, 46 In this model, the
214302-8 Bünermann et al. J. Chem. Phys. 137, 214302 (2012)
angular momentum component (�) along the symmetry axisof the system is a good quantum number in the ground andexcited states of the doped droplet, leading to energy split-tings between states with different values of � that can be ex-perimentally resolved. Just as in diatomic molecules,47 therecan be a preference for exciting a droplet with its symme-try axis either parallel or perpendicular to the laser polariza-tion direction, depending on �� for the transition in question.The subsequent fast desorption of alkali atoms along the sur-face normal with negligible scattering on surrounding heliumatoms can then lead to highly anisotropic photofragment an-gular distributions.40–42
The physical picture in the experiment on pure dropletsis very different, since there is no corresponding axis of sym-metry. The He*(4p) atoms are ejected from the droplet with anisotropic angular distribution but an aligned electronic distri-bution, as revealed by the photoelectron angular distributionfrom these fragments observed in our previous work.19 Theseresults are consistent with the initial VUV excitation beingstrongly localized on one or a small number of He atoms atthe droplet surface, with the excitation probability of a partic-ular surface atom being independent of its position. The re-sulting He*(4p) atom experiences only a mild repulsion withthe droplet, as indicated in Fig. 8, and leaves the droplet whileretaining the degree of electronic alignment similar to thatseen for the analogous excitation of an isolated He atom. TheHe*(3d) atoms are also ejected isotropically, but show no elec-tronic alignment, as expected for a stronger interaction withthe droplet environment and consistent with our picture thatthese fragments result from excitation within the droplet (butstill near the surface). The exact nature of the excitation lead-ing to formation of these fragments is still an open question,however.
D. Dimer and trimer ions
The dynamics that underlie the He2+ and He3
+ signalsare still under consideration. It is likely that the component ofthe He2
+ signal that exhibits a rise time of τ 1 = 220 fs (greencurves in Figures 5(a) and 5(c)) results from ejection of He2
*
from the droplet that is ionized by the probe pulse, given thesimilarity with the atomic He*(n = 3) signal in Figure 4. Thesignal decaying on a τ 1 = 220 fs time scale may be due to ion-ization of excited Rydberg atoms while they are still withinthe surface region of the droplet. This assertion is supportedby the observation of an isotropically emitted photoelectronsignal that decays on the same time scale and that has previ-ously been associated with ionization of excited droplets bythe probe pulse.19
It is striking that the rise time τ 2 = 2.5 ps for the slowestcomponents of the He2
+ and He3+ signals is similar to that for
the ZEKE photoelectron signal seen in our earlier work.19 Al-though the origin of the ZEKE signal is still under discussion,it most likely results from autoionization within the droplet orfrom electronically excited smaller clusters ejected from thedroplet. The slowly rising components of the He2
+ and He3+
signals would then correspond to ionic species whose forma-tion accompanies autoionization.
VI. CONCLUSIONS
Ultrafast ejection dynamics of helium Rydberg atomswith principal quantum numbers n = 3, 4 from electroni-cally excited helium nanodroplets are studied by femtosec-ond time-resolved EUV ion imaging. Comparison to previ-ous time-resolved photoelectron spectra confirms that atomsin different Rydberg states are ejected on different time scalesand with different kinetic energies. While atoms in n = 4states separate from the droplet within less than 120 fs andwith kinetic energies below 200 meV, atoms in n = 3 statesare ejected within 220 fs and with kinetic energies up to850 meV. The correlation between the quantum-state depen-dent ejection time scales and kinetic energy distributions isexplained within a model that describes electronically ex-cited droplet states within a picture of localized atomic Ry-dberg states whose energies are blueshifted by their interac-tion with the surrounding helium bath. Within this model, thehelium density gradient in the droplet surface region leadsto a corresponding potential energy gradient that drives theexcited atoms out of the cluster. Monte Carlo simulations ofn = 3, 4 Rydberg atom trajectories based on this model repro-duce major parts of the kinetic energy distributions for bothprincipal quantum numbers. Some very low kinetic energycontributions are not captured by the model and are tenta-tively assigned to inelastic and multi-atom collisions involv-ing attractive potential curves of electronically excited heliummolecules and clusters.
Time-dependent He2+ and He3
+ kinetic energy distribu-tions indicate that dimer and trimer fragments are producedin a variety of processes. A previously observed indirect ion-ization process is likely linked to the formation of both dimerand trimer ions. Excited neutral dimers may be ejected on asimilar time scale as n = 3 atoms. Generally, trimer ions carryless than half the kinetic energy of dimer ions. For each typeof fragment, however, different formation processes lead tosimilar kinetic energy distributions.
ACKNOWLEDGMENTS
O.B. would like to thank the Deutsche Forschungsge-meinschaft (DFG) for funding his tenure at the Ultrafast X-rayScience Laboratory. This work was supported by the Director,Office of Science, Office of Basic Energy Sciences, ChemicalSciences Division of the U.S. Department of Energy (DOE)under Contract No. DEAC02–05CH11231.
1H. Buchenau, E. L. Knuth, J. Northby, J. P. Toennies, and C. Winkler,J. Chem. Phys. 92, 6875 (1990).
2J. P. Toennies and A. F. Vilesov, Annu. Rev. Phys. Chem. 49, 1 (1998).3C. Callegari, K. K. Lehmann, R. Schmied, and G. Scoles, J. Chem. Phys.115, 10090 (2001).
4J. P. Toennies and A. F. Vilesov, Angew. Chem. Int. Ed. 43, 2622 (2004).5F. Stienkemeier and A. F. Vilesov, J. Chem. Phys. 115, 10119 (2001).6S. Smolarek, A. M. Rijs, W. J. Buma, and M. Drabbels, Phys. Chem. Chem.Phys. 12, 15600 (2010).
7P. Claas, G. Droppelmann, C. P. Schulz, M. Mudrich, and F. Stienkemeier,J. Phys. Chem. A 111, 7537 (2007).
8M. Hartmann, R. E. Miller, J. P. Toennies, and A. F. Vilesov, Science 272,1631 (1996).
9S. Grebenev, J. P. Toennies, and A. F. Vilesov, Science 279, 2083 (1998).
214302-9 Bünermann et al. J. Chem. Phys. 137, 214302 (2012)
10I. Reinhard, C. Callegari, A. Conjusteau, K. K. Lehmann, and G. Scoles,Phys. Rev. Lett. 82, 5036 (1999).
11C. Callegari, I. Reinhard, K. K. Lehmann, G. Scoles, K. Nauta, and R. E.Miller, J. Chem. Phys. 113, 4636 (2000).
12Y. Kwon, P. Huang, M. V. Patel, D. Blume, and K. B. Whaley, J. Chem.Phys. 113, 6469 (2000).
13M. Joppien, R. Karnbach, and T. Möller, Phys. Rev. Lett. 71, 2654(1993).
14R. Fröchtenicht, U. Henne, J. P. Toennies, A. Ding, M. Fieber-Erdmann,and T. Drewello, J. Chem. Phys. 104, 2548 (1996).
15K. von Haeften, A. R. B. de Castro, M. Joppien, L. Moussavizadeh, R. vonPietrowski, and T. Möller, Phys. Rev. Lett. 78, 4371 (1997).
16D. S. Peterka, A. Lindinger, L. Poisson, M. Ahmed, and D. M. Neumark,Phys. Rev. Lett. 91, 043401 (2003).
17D. S. Peterka, J. H. Kim, C. C. Wang, L. Poisson, and D. M. Neumark,J. Phys. Chem. A 111, 7449 (2007).
18O. Kornilov, C. C. Wang, O. Bünermann, A. T. Healy, M. Leonard, C.Peng, S. R. Leone, D. M. Neumark, and O. Gessner, J. Phys. Chem. A 114,1437 (2010).
19O. Kornilov, O. Bünermann, D. J. Haxton, S. R. Leone, D. M. Neumark,and O. Gessner, J. Phys. Chem. A 115, 7891 (2011).
20L. Nugent-Glandorf, M. Scheer, D. A. Samuels, A. M. Mulhisen, E. R.Grant, X. Yang, V. M. Bierbaum, and S. R. Leone, Phys. Rev. Lett. 87,193002 (2001).
21E. Gagnon, P. Ranitovic, X.-M. Tong, C. L. Cocke, M. M. Murnane, H. C.Kapteyn, and A. S. Sandhu, Science 317, 1374 (2007).
22T. Pfeifer, C. Spielmann, and G. Gerber, Rep. Prog. Phys. 69, 443(2006).
23P. Antoine, A. L’Huillier, and M. Lewenstein, Phys. Rev. Lett. 77, 1234(1996).
24T. Ditmire, K. Kulander, J. K. Crane, H. Nguyen, and M. D. Perry, J. Opt.Soc. Am. B 13, 406 (1996).
25J. F. Hergott, M. Kovacev, H. Merdji, C. Hubert, Y. Mairesse, E. Jean, P.Breger, P. Agostini, B. Carre, and P. Salieres, Phys. Rev. A 66, 021801(R)(2002).
26O. Bünermann, O. Kornilov, S. R. Leone, D. M. Neumark, and O. Gessner,IEEE J. Sel. Top. Quantum Electron. 18, 308 (2012).
27K. D. Closser and M. Head-Gordon, J. Phys. Chem. A 114, 8023 (2010).28W. C. Wiley and I. H. McLaren, Rev. Sci. Instrum. 26, 1150 (1955).29O. Jagutzki, A. Cerezo, A. Czasch, R. Dorner, M. Hattass, M. Huang, V.
Mergel, U. Spillmann, K. Ullmann-Pfleger, T. Weber, H. Schmidt-Bocking,and G. D. W. Smith, IEEE Trans. Nucl. Sci. 49, 2477 (2002).
30A. T. J. B. Eppink and D. H. Parker, Rev. Sci. Instrum. 68, 3477 (1997).31M. A. Woolf and G. W. Rayfield, Phys. Rev. Lett. 15, 235 (1965).32J. Harms, J. P. Toennies, and F. Dalfovo, Phys. Rev. B 58, 3341 (1998).33I. L. Beigman and V. S. Lebedev, Phys. Rep. 250, 95 (1995).34E. Clementi and D. L. Raimondi, J. Chem. Phys. 38, 2686 (1963).35E. L. Knuth and U. Henne, J. Chem. Phys. 110, 2664 (1999).36B. E. Callicoatt, K. Förde, L. F. Jung, T. Ruchti, and K. C. Janda, J. Chem.
Phys. 109, 10195 (1998).37M. Ovchinnikov, B. L. Grigorenko, K. C. Janda, and V. A. Apkarian,
J. Chem. Phys. 108, 9351 (1998).38J. Seong, K. C. Janda, N. Halberstadt, and F. Spiegelmann, J. Chem. Phys.
109, 10873 (1998).39L. H. Haber, B. Doughty, and S. R. Leone, Phys. Rev. A 79, 031401(R)
(2009).40E. Loginov, C. Callegari, F. Ancilotto, and M. Drabbels, J. Phys. Chem. A
115, 6779 (2011).41L. Fechner, B. Grüner, A. Sieg, C. Callegari, F. Ancilotto, F. Stienkemeier,
and M. Mudrich, Phys. Chem. Chem. Phys. 14, 3843 (2012).42A. Hernando, M. Barranco, M. Pi, E. Loginov, M. Langlet, and M.
Drabbels, Phys. Chem. Chem. Phys. 14, 3996 (2012).43M. Theisen, F. Lackner, and W. E. Ernst, J. Chem. Phys. 135, 074306
(2011).44F. Ancilotto, E. Cheng, M. W. Cole, and F. Toigo, Z. Phys. B: Condens.
Matter 98, 323 (1995).45C. Callegari and F. Ancilotto, J. Phys. Chem. A 115, 6789 (2011).46O. Bünermann, G. Droppelmann, A. Hernando, R. Mayol, and F. Stienke-
meier, J. Phys. Chem. A 111, 12684 (2007).47R. N. Zare, Mol. Photochem. 4, 1 (1972).