ultrasensitive on-chip immunoassays with a nanoparticle ...ultrasensitive on-chip immunoassays with...
TRANSCRIPT

HAN ET AL. VOL. 6 ’ NO. 10 ’ 8570–8582 ’ 2012
www.acsnano.org
8570
September 09, 2012
C 2012 American Chemical Society
Ultrasensitive On-Chip Immunoassayswith a Nanoparticle-AssembledPhotonic CrystalJin-Hee Han,† L. Sudheendra,† Hee-Joo Kim,‡ Shirley J. Gee,‡ Bruce D. Hammock,‡ and Ian M. Kennedy†,*
Departments of †Mechanical and Aerospace Engineering and ‡Entomology, University of California, Davis, California 95616, United States
Miniaturization continues to be adominant theme in the develop-ment of new instrumentation for
biological research. Although conventionalmicroarrays have facilitated many break-throughs in life sciences by identifying spe-cific gene sequences or protein analytes,1,2
further reduction in size to a nanoscale canoffer significant advantages, particularly im-provement in the assay speed.3 However,the reduction in the size of an array posesproblems that are related to a low signal-to-noise ratio anddetectability of the signal. Thedetectable size of the spots in a microarray islimited byoptical resolution to dimensions ofapproximately a visible wavelength. To over-come such a complication, many nanoarray-based detection schemes have relied on thedevelopment of high-resolution sensing (i.e.,atomic force microscope,4 Kelvin probe forcemicroscope,5 and total internal reflectionfluorescent microscope6).Photonic crystals (PC) have been applied
in a variety of ways for enhanced bio-sensing.7�16 PCs have been assembled via
colloids,10�13 but this leads to complexstructures that are not robust and ideal fordisease diagnosis and proteomics. The sen-sing element in these cases was attached tothe surface of a photonic crystal. Theseplatforms provide a great improvement inthe signal-to-noise ratio due to the photoniceffects but rely on standard protocols toperform the immunoassay, thereby requir-ing copious amounts of antibodies andtime-consuming washing steps. Such anapproach does little to alleviate nonspecificbinding issues. Here we show the advan-tage of a particle-based assay, in conjunc-tion with the PC structure, to provide a newgeneration of supersensitive bioassay. Par-ticles are commonly used as solid supportsfor antibody immobilization to improve thecontrol of antibody concentration, to im-prove the speed of assays, and to facilitate
separation from solution by making useof the well-controlled surface area, surfacecharge, functional groups, and choice ofsignal transduction that particles canprovide.17�22 For example, Haukanes andKvam17 demonstrated the effectiveness ofusingmagnetic particles in bioassays for cellseparation and isolation of specific nucleicacid sequence. Jager and Rijkers22 comparedthe characteristics of a particle-based immu-noassay to conventional ELISA for detect-ion of cytokine. The particle-based multiplex
* Address correspondence [email protected].
Received for review April 15, 2012and accepted September 9, 2012.
Published online10.1021/nn301656c
ABSTRACT
Electrophoretic particle entrapment system (EPES) is employed to generate 2D array of
nanoparticles coated with biological molecules (i.e., antibodies). Phase matching of the excitation
and the emission in the 2D arrays with particles produces a highly enhanced fluorescence signal that
was shown to improve the limit of detection in immunoassays. The phase matching is achieved
when the particle are in the sub-100 nm range. A comparison between different size particles shows
that the sensitivity of an immunoassay is extended to a range that is difficult to achieve with
standard technology (e.g., enzyme-linked immunosorbent assay-ELISA). The effectiveness of this
novel configuration of particle-in-a-well was demonstrated with an assay for human epidermal
growth factor receptor 2 (HER2; breast cancer biomarker), with a detection limit as low as
10 attomolar (aM) in less than 10 μL of serum-based sample. The limit of detection of HER2
indicated far superior assay performance compared to the corresponding standard 96-well plate-
based ELISA. The particle-based photonic platform reduces the reagent volume and the time for
performing an assay in comparison to competingmethods. The simplicity of operation and the level
of sensitivity demonstrated here can be used for rapid and early stage detection of biomarkers.
KEYWORDS: electrophoretic particle entrapment system (EPES) . nanoparticles .nanoarray . immunoassay . human epidermal growth factor receptor 2 (HER2)
ARTIC
LE

HAN ET AL. VOL. 6 ’ NO. 10 ’ 8570–8582 ’ 2012
www.acsnano.org
8571
immunoassay showed the superiority in terms ofsensitivity, detection speed and minimization of thesample volume. The typical limit of detection (LOD) forthe particle based multiplex immunoassay was a fewpg/mL level and the assay time was hours. In addition,Becton Dickinson Biosciences (San Diego, CA)18 havedeveloped a particle-based cytometric array systemusing micrometer-sized particles and optical detectionwith extensive multiplexing capability and LOD at thepg/mL level for various human cytokines. As we shallshow, the introduction of the nanoparticle into thephotonic structure may confer an additional advan-tage in terms of detectability of fluorophore labels thatare confined to the vicinity of the wells.Our immunoplatform is simple, affordable, and pro-
vides an alternativemethod for the generation of func-tionalized arrays at the nanoscale. Our unique methodof electrophoretic trapping of antibody-functionalizednanoparticles into nanowells of specific sizes hasbeen demonstrated to yield a highly effective arraythat can be generated simply with a 2 V direct current(DC) source on an indium tin oxide (ITO)-coated glassslide.23 Our results show that reducing the size of theparticles is critical in realizing the advantages offeredby the PC structure. The nanostructured PC-microar-rays of nanoparticles-in-wells provide complete immu-no-platforms with an assay completed on a single chipand with sensitivity that is vastly superior to conven-tional immunoassays with significantly shorter assaytimes and much smaller volumes of sample.
RESULTS
Electrophoretic Particle Entrapment in Nano- or Microwells.An electrophoretic particle entrapment system (EPES)was used to trap carboxylated polystyrene particlesconjugated with capture antibodies into the PC struc-tures engineered into a polymethyl methacrylate(PMMA)-lift off layer (LOL) 2000-ITO glass slide. ThePC patterned chip was placed on a solid mantle with
another ITO glass slide placed parallel on the top(Figure 1). The ITO at the bottom of the well wasused as the electrode. The slides were each equippedwith microscale manipulators to precisely control thelocation of the top and bottom slides horizontallyor vertically. To create perpendicular electrophoreticforces, the bottom slide was connected to the positiveelectrical terminal while the top slidewas connected tothe ground terminal. The nanoparticles were added tothe surface of the patterned bottom slide in a dropletof deionized water. The upper ITO glass slide was thenplaced onto the droplet. The distance between twoslides was 490 μm. The surface charge of the sus-pended particles was negative due to the carboxylterminal group on the particles. After placing the topITO glass slide onto the droplet of particle solution andturning on the voltage, negatively charged particlesmigrated toward the surface of opposite electricalpolarity. The EPES was operated for 15 min to 1 h.The operating time was adjusted to accommodateparticles of different sizes considering zeta-potentialmeasurements and the number of wells on the array.The number of wells on an array was 5476 wells with40 nm particles, 625 wells with 200 nm particles, 25wells with 1 μm particles, and one well with 5 μmparticles. The applied voltage was 2 V (DC) during theEPES process. Each particle conjugated with the antibo-dies was trapped into the wells based on their diameterand the size of the well. The size of the wells for 40 nm,200 nm, 1 μm, and 5 μm particles was 60 nm, 250 nm,1.5 μm, and 7 μm, respectively. Multiple sizes of wells canbe used, in principle, for which the largest particles areadded to the chip first and occupy all the large wells,followed sequentially by decreasing particle size.
Particles were not found at the surface of thePMMA as seen in Figure 2a�d. In addition, only a singleparticle was trapped into its corresponding well(Figure 2e,f). After trapping, the solution between thetwo slides was removed by sliding the top ITO glass
Figure 1. EPES andnanoarray. 2-D front viewof the EPES; the ITO surface of the patternedPMMA-LOL-ITOglass slide (bottom)was connected to the positive terminal, while the ITO surface of the ITO glass slide (top) was connected to the groundterminal. The thickness of LOL 2000 nm and PMMA was 155 and 85 nm, respectively. The solution between the slidesconsisted of the negatively charged nanoparticles and deionized (DI) water; Inside circle shows a 3D view of the nanoarraywith trapped particles.
ARTIC
LE

HAN ET AL. VOL. 6 ’ NO. 10 ’ 8570–8582 ’ 2012
www.acsnano.org
8572
slide parallel to the bottom slide with the voltage stillon. The surface tension of the droplet liquid wassufficient to completely remove untrapped particlesfrom the surface. There was no additional rinsing
procedure for removing nonspecifically bound parti-cles from the surface of the chip.
Optical Analysis. To understand the interaction ofelectromagnetic radiation with the arrays generated
Figure 2. The nano- or microarrays/well with fluorescent carboxylated polystyrene particle (ex: 650 nm, em: 690 nm)conjugatedwith goat-anti-RIgG located to correspondingwells based on the size of particle after trapping using the EPES. (a)Fluorescent images of 40 nm particle/wells with 650 nm periodicity, (b) 200 nm particles/wells with 2 μmperiodicity, (c) 1 μmparticle/wells with 10 μm periodicity, (d) 5 μm particle/well, (e) scanning electron microscope (SEM) images of 200 nmparticles/wells, (f) SEM images of 5 μm particle/well. White broken line indicates detection area (52 � 52 μm) where theexcitation laser was focused and emitted fluorescent signal was collected.
ARTIC
LE

HAN ET AL. VOL. 6 ’ NO. 10 ’ 8570–8582 ’ 2012
www.acsnano.org
8573
with various sizes of particles, the fabricated PC struc-tures with particles in the wells were modeled byemploying the electromagnetic wave model in theRF module of COMSOL Multiphysics (v. 4.1; COMSOLInc., Burlington, MA, U.S.A.). Normal incidence of thetransverse electric (TE) field of the incoming electro-magnetic wave was assumed, consistent with theexperimental conditions. Maxwell's equations weresolved for the given frequency, electric field of the TEmode of electromagnetic wave, and the refractiveindex and the geometry of the PC. Figure 3a showsthe 3-D geometry of the nanostructured microarraywith boundary conditions used in the model. Thethickness of the PMMA/LOL and ITO was 240 and50 nm, respectively. The width (W) of the well and itsperiodicity were varied based on the size of theparticles. Width/periodicity (D) was 60 nm/650 nm for40 nmparticles, 250 nm/2 μm for 200 nmparticles, and1.5 μm/10 μm for 1 μm particles (modeling was notperformed for the 5 μm well). The periodicity fordifferent particles was chosen to provide uniformityof the particle distribution over the area of the array(52 � 52 μm). In a given area of the array, theperiodicity was varied such that the ratio of periodicityand the particle diameter was ∼10. The particle dis-tribution with corresponding periodicity also providedalmost the same surface area coated with captureantibodies for each particle size case (for 40 nm-nanoarray, the surface area is 2.85 times less than thatof 200 nm, 1 μm, and 5 μm array/well). Holding thesurface areas approximately constant, and hence thetotal amount of antibodies available for binding ap-proximately constant, allowed us to focus on theeffects of the PCon signal enhancement anddetection.
Supporting Information, Table S1 shows the ma-terial properties of polymethyl methacrylate (PMMA),glass, polystyrene, air, and indium tin oxide (ITO) usedfor modeling. The coating layer of the photoresists wasassumed to be a single layer of PMMA because thedifference of permittivity between the PMMA and theLOL was not significant. A scattering boundary condi-tionwas adopted in themodel. Based on themeasuredpower of the 532 nm laser diode intensity focused onthe PC, the boundary value of the incoming electricfieldwas set to 6140 V/m. The electric fields at the otherboundaries were set to zero. The same boundaryconditions were used in all cases. Figure 3b�g showsthe spatial distribution of the electric field intensityconfined within the PC. Frequencies of the electro-magnetic (EM) wave corresponded to the excitation(maximum 532 nm) and emission (maximum 555 nm)spectra of the fluorophore: 5.64� 1014 and 5.4� 1014 Hzwere used, respectively. For a 40 nm nanoarray with650 nmperiodicity, we observed the resonance in the PCstructure for the wavelength between 532 and 555 nm.
To experimentally verify the presence of resonancesdue to theperiodic nanostructure, twodifferent refractive
index materials, glycerin (refractive index: 1.47), andwater (1.33) were added to the particle-based immu-nocomplex contained in the array of 40 nm wells. Theintensity of the fluorescence was measured after theaddition of each of the fluids and was compared tothe intensity observed when air was the surroundingmedium. For each test, rabbit-immunoglobulin G (RIgG)was used to construct the immunocomplex on theparticles under the same conditions that were usedfor the main experiments. The addition of water to thetop of the chip caused a 1.3� decrease in themeasuredfluorescence; the addition of glycerin caused a 6-foldreduction in fluorescence signal (Supporting Informa-tion, Table S2). The reduction of signal with reductionin relative difference in refractive index is consistentwith the suppression of PC behavior, which is refractiveindex dependent.
To understand the effect of the particle in the PCstructure, a numerical model with 40 nm particles with650 nm periodicity was compared with the 200 nmparticles with the same periodicity. For the wave-lengths of interest (532�555 nm), the results showedthat the size of the nanoparticle is an important param-eter in achieving resonance (Supporting Information,Figure S1). For particles in excess of 100 nm, the size ofthe particle also imposed restrictions on the periodicityand the depth of the well. These are important pa-rameters that determine the phase matching of thewaves due to the periodic structure, such a grating.24
For example, the depth of the periodic structure, l ,must satisfy the relation λG/2 > l > λG/4 for first orderdiffraction, where λG is the wavelength of the lightexperiencing the guided mode resonances. Therefore,considering the emission wavelength of Alexa-532, theeffective range of the depth is 278 nm > l > 139 nm.The numerical model of these particles in a periodicarray shows that the incorporation of 40 nm particlesinto the wells efficiently utilizes the tail of the evanes-cent field that extends into the superstrate region(PMMA) for excitation of the fluorophores on its sur-face. Larger particles such as the 1 μm particles thatwere incorporated into an array showed strong Miescattering due to the large diameter of the particle.25
The Mie scattering interferes with the Bragg scatteringand inhibits the phase matching required for fluores-cence enhancement.
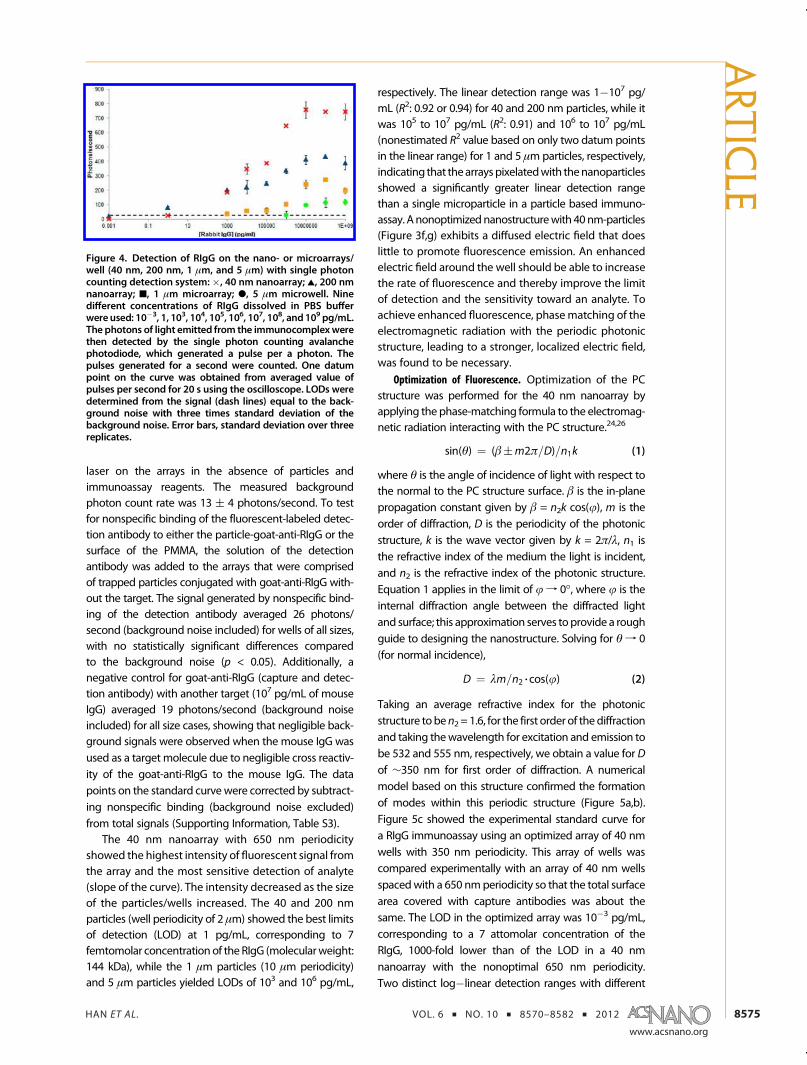
Detection of Rabbit-Immunoglobulin G (RIgG): Comparisonbetween Nanostructured and Microstructured Arrays. Immu-noassay experiments were performed to prove for thelimit of detection for nano and microstructured arrays.A single-photon counting detection system was usedalong with a 532 nm laser for excitation. Light ata wavelength of 555 nm emitted was collected fromthe immunocomplex on the detection area of thearray (52 � 52 μm; white broken line in Figure 2a�d).Figure 4 shows the standard curves for four differentarrays based on the size of particles (40 nm, 200 nm,
ARTIC
LE

HAN ET AL. VOL. 6 ’ NO. 10 ’ 8570–8582 ’ 2012
www.acsnano.org
8574
1 μm, and 5 μm). Nine different concentrationsof RIgG dissolved in phosphate buffered saline(PBS) were detected using sandwich immunoassays:10�3, 1, 103, 104, 105, 106, 107, 108, and 109 pg/mL.
A goat-anti-RIgG�Alexa 532 conjugate was used as afluorescently labeled detection antibody at a concen-tration of 107 pg/mL. Background noise that originatedfrom the 532 nm laser was measured by shining the
Figure 3. Numerical modeling of the nanoarray with PC structure. (a) 3-D geometry of the nanoarray; W/D: 60 nm/650 nm(40 nm particle), 250 nm/2 μm (200 nm particle), 1.5 μm/10 μm (1 μmparticle), 7 μm/0 μm (5 μmparticle); v: 50 nm; l : 240 nm(85 nm PMMA and 155 nm LOL; PMMA and LOL 2000 were assumed to be single layer in the model), a: 1.1 mm, (b) spatialdistribution of the electric field intensity confined within 1 μmPC-microarray for 532 nmwavelength, (c) 1 μmPC-microarrayfor 555 nm wavelength, (d) 200 nm PC-nanoarray for 532 nm, (e) 200 nm PC-nanoarray for 555 nm, (f) 40 nm PC-nanoarraywith 650 nm eriodicity for 532 nm, (g) 40 nm PC-nanoarray with 650 nm periodicity for 555 nm.
ARTIC
LE
HAN ET AL. VOL. 6 ’ NO. 10 ’ 8570–8582 ’ 2012
www.acsnano.org
8575
laser on the arrays in the absence of particles andimmunoassay reagents. The measured backgroundphoton count rate was 13 ( 4 photons/second. To testfor nonspecific binding of the fluorescent-labeled detec-tion antibody to either the particle-goat-anti-RIgG or thesurface of the PMMA, the solution of the detectionantibody was added to the arrays that were comprisedof trapped particles conjugated with goat-anti-RIgG with-out the target. The signal generated by nonspecific bind-ing of the detection antibody averaged 26 photons/second (background noise included) for wells of all sizes,with no statistically significant differences comparedto the background noise (p < 0.05). Additionally, anegative control for goat-anti-RIgG (capture and detec-tion antibody) with another target (107 pg/mL of mouseIgG) averaged 19 photons/second (background noiseincluded) for all size cases, showing that negligible back-ground signals were observed when the mouse IgG wasused as a target molecule due to negligible cross reactiv-ity of the goat-anti-RIgG to the mouse IgG. The datapoints on the standard curvewere corrected by subtract-ing nonspecific binding (background noise excluded)from total signals (Supporting Information, Table S3).
The 40 nm nanoarray with 650 nm periodicityshowed the highest intensity of fluorescent signal fromthe array and the most sensitive detection of analyte(slope of the curve). The intensity decreased as the sizeof the particles/wells increased. The 40 and 200 nmparticles (well periodicity of 2 μm) showed the best limitsof detection (LOD) at 1 pg/mL, corresponding to 7femtomolar concentration of theRIgG (molecularweight:144 kDa), while the 1 μm particles (10 μm periodicity)and 5 μm particles yielded LODs of 103 and 106 pg/mL,
respectively. The linear detection range was 1�107 pg/mL (R2: 0.92 or 0.94) for 40 and 200 nm particles, while itwas 105 to 107 pg/mL (R2: 0.91) and 106 to 107 pg/mL(nonestimated R2 value based on only two datum pointsin the linear range) for 1 and 5 μmparticles, respectively,indicating that thearrayspixelatedwith thenanoparticlesshowed a significantly greater linear detection rangethan a single microparticle in a particle based immuno-assay. Anonoptimizednanostructurewith 40nm-particles(Figure 3f,g) exhibits a diffused electric field that doeslittle to promote fluorescence emission. An enhancedelectric field around the well should be able to increasethe rate of fluorescence and thereby improve the limitof detection and the sensitivity toward an analyte. Toachieve enhanced fluorescence, phasematching of theelectromagnetic radiation with the periodic photonicstructure, leading to a stronger, localized electric field,was found to be necessary.
Optimization of Fluorescence. Optimization of the PCstructure was performed for the 40 nm nanoarray byapplying the phase-matching formula to the electromag-netic radiation interacting with the PC structure.24,26
sin(θ) ¼ (β(m2π=D)=n1k (1)
where θ is the angle of incidence of light with respect tothe normal to the PC structure surface. β is the in-planepropagation constant given by β = n2k cos(j), m is theorder of diffraction, D is the periodicity of the photonicstructure, k is the wave vector given by k = 2π/λ, n1 isthe refractive index of the medium the light is incident,and n2 is the refractive index of the photonic structure.Equation 1 applies in the limit of jf 0�, where j is theinternal diffraction angle between the diffracted lightand surface; this approximation serves to provide a roughguide to designing the nanostructure. Solving for θf 0(for normal incidence),
D ¼ λm=n2 3 cos(j) (2)
Taking an average refractive index for the photonicstructure to ben2 = 1.6, for the first order of thediffractionand taking thewavelength for excitation and emission tobe 532 and 555 nm, respectively, we obtain a value for Dof ∼350 nm for first order of diffraction. A numericalmodel based on this structure confirmed the formationof modes within this periodic structure (Figure 5a,b).Figure 5c showed the experimental standard curve fora RIgG immunoassay using an optimized array of 40 nmwells with 350 nm periodicity. This array of wells wascompared experimentally with an array of 40 nm wellsspacedwith a 650 nmperiodicity so that the total surfacearea covered with capture antibodies was about thesame. The LOD in the optimized array was 10�3 pg/mL,corresponding to a 7 attomolar concentration of theRIgG, 1000-fold lower than of the LOD in a 40 nmnanoarray with the nonoptimal 650 nm periodicity.Two distinct log�linear detection ranges with different
Figure 4. Detection of RIgG on the nano- or microarrays/well (40 nm, 200 nm, 1 μm, and 5 μm) with single photoncounting detection system:�, 40 nm nanoarray; 2, 200 nmnanoarray; 9, 1 μm microarray; b, 5 μm microwell. Ninedifferent concentrations of RIgG dissolved in PBS bufferwereused: 10�3, 1, 103, 104, 105, 106, 107, 108, and109 pg/mL.The photons of light emitted from the immunocomplexwerethen detected by the single photon counting avalanchephotodiode, which generated a pulse per a photon. Thepulses generated for a second were counted. One datumpoint on the curve was obtained from averaged value ofpulses per second for 20 s using the oscilloscope. LODs weredetermined from the signal (dash lines) equal to the back-ground noise with three times standard deviation of thebackground noise. Error bars, standard deviation over threereplicates.
ARTIC
LE

HAN ET AL. VOL. 6 ’ NO. 10 ’ 8570–8582 ’ 2012
www.acsnano.org
8576
slopeswere foundathighconcentrations (103�107pg/mL;R2: 0.95) and at low concentrations (10�3�103 pg/mL;R2: 0.99). The signal enhancement also depended on thechoice of fluorophore used for the probe. Alexa 532fluorophore showed the best spectral fit to take advan-tage of the PC structure in the optimized array because
the peak wavelengths for both excitation and emissionof the fluorophore was closely associated with en-hanced electric fields observed in the numerical model(Supporting Information, Figure S2).
Detection of HER2 in Serum. Enhanced limits of detec-tion can be of great benefit for the early diagnosis of
Figure 5. Optimization of PC structure of the nanoarray and immunoassay. (a) Spatial distribution of electric field in 40 nmnanoarray with 350 nm periodicity using the numerical model; 532 nm wavelength and (b) 555 nm wavelength. (c) Thestandard curve from the immunoassay of detecting RIgG using 40 nm nanoarray with 350 nm periodicity. The plot on topshows the assay response over the concentration range (10�3�108 pg/mL). The plot onbottom shows a quasi-linear responsein the attomolar to picomolar range. Dash line is equal to the background noise with three times standard deviation of thebackground noise. Error bars, standard deviation over three replicates.
ARTIC
LE

HAN ET AL. VOL. 6 ’ NO. 10 ’ 8570–8582 ’ 2012
www.acsnano.org
8577
disease and infection. An immunoassay for HER2 posi-tive breast cancer in human serum provides a con-venient model for testing the practical value of the PC/nanoparticle assay given the ready availability of bothantibodies and target molecules in known concentra-tions. In practice, however, the natural backgroundlevels of HER2 may obviate the need for the reductionof the LOD to very low levels. Figure 6 shows thestandard curve for the HER2 immunoassay usingthe optimized array of 40 nm particles. In addition, astandard curve was obtained for the correspondingstandard 96-well plate-based ELISA (five different con-centrations of HER2 dissolved in PBS were used: 25.6,128, 640, 32 � 102, and 16 � 103 pg/mL). The recom-binant HER2 was spiked to 25% human serum to showthe reliability in a clinical diagnosis. The mixing ratio ofserum to PBS buffer was chosen to reduce matrixeffects.27 The concentration range was 10�3 to 107
pg/mL. Background noise was 13( 4 photons/second.Nonspecific binding of fluorescently labeled detectionantibody to either the particle-monoclonal captureantibody to HER2 or to the surface of PMMA gave riseto a signal of 12 ( 2 photons/second (backgroundnoise excluded). To test for any false-positive effectcaused by the residue of either unbound HER2 to theparticle-capture antibody or fluorescently labeled de-tection antibody in the wells after incubation followedby removal of solution, the particles without captureantibody were used for an immunoassay on the array(other conditions were same). The signal was not differ-ent from the background noise. For a negative control,nonspiked serum in PBS was used; serum contains anumber of different kinds of proteins with millimolarconcentrations28 that could present interferences inthe assay. The signal difference between the negativecontrol and background noise was negligible at onephoton/second. The test results for nonspecific bindingand the negative control were in the range of thebackground noise within three standard deviations.
The two distinct log�linear detection ranges forHER2 were found at 103�107 pg/mL (R2: 0.99) and at10�3�103 pg/mL (R2: 0.99). The limit of detection was10�3 pg/mL, corresponding to a 10 attomolar concen-tration based on the molecular weight of recombinantHER2 (98.6 kDa, R&D systems). The LOD was 106-foldlower than that of standard 96-well plate-based ELISAmeasuring absorbance (1 ng/mL).
DISCUSSION
Our results have demonstrated the controlled deliv-ery of biological reagents bound to particles to specificspots on a substrate through EPES. This controllednanostructured is shown to yield significant improve-ments in the limit of detection for a variety of immu-noassays for reasons that are discussed below.To achieve a reproducible immunoassay, it is im-
portant to have reliable and consistent deposition of
particles conjugated with biological molecules intotheir corresponding nanowells: the EPES method de-monstrated 100% trapping efficiency given sufficienttime (Figure 2a�f). By using a weak trapping force, theEPES easily resolved the problemof locating antibodiesat multiple desired sites of the array in a short timewithout damage to the proteins. The size and locationof the nanowells can be easily controlled leading tothe possibility of high-throughput assays. Furthermore,EPES proved to be a simple yet effective way ofremoving either particle or biological molecules fromthe surface of the array by using the Couette-flow.For the reliable application of our particle based PC/
EPES system to the immunoassay, we used 40 nmparticles-capture antibody in a pixelated nanoarraywith PC structure for detecting breast cancer bio-marker HER2 in serum. The LOD was improved amillion-fold (10 aM) over the corresponding standard96-well plate-based ELISA. As noted already, the detec-tion limit in our assay is much better than is neededfor clinical application of the HER2 assay because thethreshold level to determine the existence of a breastcancer tumor is 15 ng/mL.29 However, this model assayserves to demonstrate the significant advantages ofusing a particle-based immunocomplex within a PCstructure that is constructedwith nanoparticles inwells.We exploited the advantages of particle-based as-
says by using the particles to construct a well-orderednanoscale array of particles in a fast, efficient manner.Negative charges on the carboxylated particles en-abled use of electrophoretic transport for localizingparticles to nanoscale wells with an electrically con-ductive substrate (ITO) with positive charge at thebottom of each well. The PC structure is formed by asolid-bound immunocomplex, consisting of captureantibodies, analytes, and detection antibodies plusfluorophores, that sits on a high refractive index sub-strate (ITO). In a related concept, Ganesh et al.30
explored leaky modes in nanostructures to enhance
Figure 6. Detection of HER2 using 40 nm nanoarray with350 nm periodicity ([). The standard curve obtained fromconventional 96-well plate-based ELISA was compared (b).Seven different concentrations of HER2 spiked into 25%human serumwere used: 10�3, 1, 103, 104, 105, 106, and 107
pg/mL on the nanoarray. In the case of conventional ELISA,five different concentrations of HER2 dissolved in PBS wereused: 25.6, 128, 640, 32 � 102, and 16 � 103 pg/mL. Errorbars, standard deviation over three replicates.
ARTIC
LE

HAN ET AL. VOL. 6 ’ NO. 10 ’ 8570–8582 ’ 2012
www.acsnano.org
8578
emission from quantum dots dispersed on the PCsurface. More recently, the same group has demon-strated up to 89% enhancement in the limits of detec-tion of cancer biomarkers with a Cy5 dye and photonicstructure.8 Based on the available literature on phase-matched nanostructures with PC features and ourexperimental and modeling results, it is likely thatguided mode resonances and mode coupling leadingto leaky mode extraction play an important role in ourfluorescence enhancement.The combination of nanoparticles in an array of
nanowells, constituting in effect a pixelated singlemicrospot, is the key to achieving extremely low LOD.Pixelation of a microspot down to 40 nm with specificperiodicity is themost important factor in coupling theBragg scattering with resonances in a PC structure forsignal extraction. For 200 nm particles in the PCstructure, in the absence of resonance, diffraction stillprovides an enhancement of fluorescence.31 The ef-fects of diffraction vanish progressively with an in-crease in the size of the particles, leading to theobserved deterioration in the LOD (Figure 4). The effectismost pronounced for the optimal combination of thesmallest nanoparticles and nanowells with the correctspacing for first order diffraction. The size and spacingof the nanowells is dictated by the wavelengths ofvisible light that are used for excitation and emission.By comparing the LOD and log�linear detection rangefor 40nmparticles in a pixelated arraywith a single 5 μmparticle in a well, we found that the use of the singlephoton counting detection systemwas not, by itself, themost important factor in obtaining femtomolar andattomolar level sensitivity. In fact, the sensitivity in a40 nm particle pixelated nanoarray could be enhancedmore that 1000-fold by optimizing just the PC structure.In the detection of cancer biomarkers in serum,
careful rinsing procedures are needed in general toreduce false-positive effects that arise from otherproteins in the serum. Our method needed a simpleone-time rinsing with a 10 μm droplet of deionizedwater for highly effective particle removal during theEPES process. The effectiveness of the simple rinsingprocedure could be verified by demonstrating negli-gible values of the negative control compared tobackground noise using only serum. Nonspecificbinding of carboxylated polystyrene particles to thePMMA surface was prevented due to the hydrophilicsurface provided by carboxyl groups.32 The spreadingof a molecule on a surface is time-dependent:33 our20 min incubation time is shorter than the typical time(over 1 h) that is used for immobilizing antibodieson PMMA surface.34,35 The short incubation time leadsto less binding of proteins on a surface so that theCouette-flow that is established between the movingtop plate and stationary bottom plate during the EPESwashing procedure can easily remove proteins on thebare PMMA surface.
The remarkably low LOD is well beyond the limitindicated by the equilibrium dissociation constant, Kd.It should be recalled that femtomolar and subfemto-molar analyte concentrations are routinely detected bymicroarrays;36 these levels are well below the levelsassociated with Kd. In a thorough analysis of immu-noassay performance, Ekins et al.37 estimated theminimum analyte population that is identifiable on amicrospot; factors that can improve the LOD include anincreased density of capture antibodies and relativelylow concentrations of secondary detection antibodies.Chang et al.38 described a novel array that worked on adigital basis by counting enzyme-linked immunocom-plexes in a femtoliter well. They achieve single mole-cule detection, albeit at the expense of a somewhatmore complex assay than the one that we are report-ing. Citing skepticism with regard to their detectionlimits that are much lower than Kd, they undertook athorough analysis of the system and arrived at thesame conclusions as we and Ekin et al. did: under theright conditions, Kd does not impose a fundamentallimit on the detection limit.In the PC format, several factors combine to reduce
the LOD to very low levels. It is known that the numberof antibodies immobilized on particles can exceedthe estimates based on the surface area of theparticles.39,40 Hence, we benefit from an increase inantibody density by using the nanoparticle to immo-bilize capture antibodies. In addition, our improvementin signal-to-noise ratio (a 10-fold improvement with40 nmparticles in comparison to a single 5 μmparticle)leads to further enhancement in the LOD. Our simpleanalysis shows that Kd is not the controlling factorunder a set of limiting conditions that we are able tosatisfy. If the total antigen concentration [Ag] , [Ab],where [Ab] is the total available capture antibodyconcentration, then [Ab] is approximately constant.Furthermore, if [Ab] . Kd, then it is straightforward toshow that the concentration of the bound complex[AgAb] is approximately independent of Kd and pro-portional to [Ag] without considering the details ofadsorption. These conditions are satisfied with ourassay system and are only feasible as a result of theultrasensitive detectability of the nanophotonic array,the density of capture antibodies, and the small scaleof the microspot.The very low detection limits that we report raise
several interesting issues. Sheehan and Whitman41
showed that the reduction of the size of a sensor tothe nanoscale may not be advantageous in terms ofthe detection limits due to mass transport limitations.In other words, in a realistic assay time scale, very fewanalyte molecules will be able to diffuse to the sensorregion from the sample volume, unless they are some-how directed. In our case, that may seem to contradictour results. However, it must be realized that ournanoparticles are distributed over a wide region in
ARTIC
LE

HAN ET AL. VOL. 6 ’ NO. 10 ’ 8570–8582 ’ 2012
www.acsnano.org
8579
arrays of 52 � 52 μm with a pitch of 650 nm or 26 �26 μm with a pitch of 350 nm, so we are not limited bydiffusion of analyte to a single nanospot; our sensor iseffectively a distributed nanoarray and will exhibit masstransport limits that are more akin to a microarray.Based on the concentration of the analyte in our
10 μL sample that covered 9 separate arrays, each 26�26 μm,we obtained an estimate of the likely number ofanalyte molecules that were captured, about five perindividual array. With higher sensitivity in the assay,that is, greater slope of the standard curve at the lowrange, we might expect to see some quantization ofthe signal. However, our relative insensitivity to analyteconcentration precluded the possibility of discerningsingle molecule binding events. The log�linear natureof the curve at low concentrations is suggestive of aTemkin isotherm for which there is a random distribu-tion of binding energies at a surface. Johnson andArnold42 found that a Temkin isotherm offered a goodfit to their measurements of protein adsorption tometal ligands on a surface for which there was adistribution of binding energies. Our primary captureantibodies were passively adsorbed onto the particlesand therefore a random distribution of affinities andbinding energies for analytes should be expected. Forthat case, and at very low concentrations, a Temkinisotherm presents a plausible model of the adsorptionprocess under our experimental conditions. It is con-sistent with the log dependence on analyte concentrationthat we have seen in all of the assays that we considered.Greater sensitivity would be achieved with a covalentattachment of the antibodies to the particle surface butat the expense of available surface charge for the EPESprocess; wehave found that EPESdoes notwork followingcovalent attachment of antibodies. Magnetophoresis withsuperparamagnetic nanoparticles would be necessary inthis case and is the subject of ongoing research.Other studies have demonstrated femto- or atto-
molar sensitivity for immunoassays: a carbon nanotubebased immunoassay with electrical transistor measure-ments detected environmental pollutants with a limitof detection (LOD) of 500 fM;43 a DNA bar codemethodusing magnetic particles for detecting prostate-speci-fic antigen (PSA) demonstrated an LOD of 30 aM;44 an
electrochemical immunosensor using a gold-film-coated electrode and magnetic particles for detectingcancer biomarkers also yielded an LOD of 30 aM;45
and a microarray-based immunoassay for detectingcytokines also showed a low-to-middle femtomolarsensitivity.36 However, such methods still require com-plex, time-consuming efforts in fabrication of thedevice, sample preparation, and immobilization ofbiological molecules using self-assembled monolayer(SAM); these methods may also require interrogationof large sample volumes over a considerable amountof time. These disadvantages do not pertain to ourPCEPES system. In comparison to those immunoassaytechniques,36,43�45 our PC-nanowell array/EPES is rela-tively simple to implement and requires less incuba-tion time and a smaller volume of bioreagents forsimilar or better sensitivity than comparable subfem-tomolar systems. This superiority translates to a rapidand field-deployable biosensor system that can beemployed broadly for identifying biomarkers of dis-ease or for illicit drug testing, among other potentialapplications.
CONCLUSION
We have reported a novel, yet simple, PC-immu-noassay platform that is readily constructed by usingnanoparticles that are conjugated with biological re-agents. A facile electrophoretic particle trappingmeth-od was used to assemble a photonic crystal thatenhances fluorescent signals while achieving extre-mely low background noise. In contrast to micro-meter-sized particles that have been used in the past,sub-100 nm particles in nanowells fully exploit theenhanced fluorescence excitation and extraction thatis afforded by coupling to the nanophotonic crystalstructure with optimized periodicity. This enhance-ment translated to ultrasensitive detection of IgG andbreast cancer biomarker at low attomolar concentra-tions, overcoming the limits imposed by antibodyaffinity in conventional immunoassays. The sensitivityand the speed of the assay performed on the PC-nanoarray demonstrated a ground-breaking conceptin ultrasensitive bioassays thatmay provide new point-of-care tools for human health diagnostics and care.
METHODSMaterials. The 40 nm fluorescent carboxylated polystyrene
(PS) nanoparticles (F-8789; ex: 660 nm/em: 680 nm) werepurchased from Invitrogen (Carlsbad, CA). The 200 nm fluorescentcarboxylated PS nanoparticles (FC02F/9770; 660/690) and 1 μmfluorescent carboxylated PS microparticles (FC04F/8608; 660/690)were purchased from Bangs Laboratories (Fishers, IN). The 5 μmfluorescent carboxylated PS microparticles (2308; ex: 660/685)were purchased from Phosphorex (Fall River, MA).
Goat-anti-RIgG and goat-anti-RIgG�Alexa 532 used forcapture antibody and detection antibody, respectively, werepurchased from Invitrogen. Monoclonal capture antibody to
HER2 (MAB1129), biotinylated polyclonal detection antibody toHER2 (BAF1129), and recombinant HER2 were purchased fromR&D Systems, Inc. (Minneapolis, MN). Streptavidin-Alexa 532 waspurchased from Invitrogen. TMB (3,30 ,5,50-tetramethylbenzidine)was purchased from Sigma-Aldrich (St. Louis, MO). Streptavidin-horseradish peroxidase (HRP)was purchased fromPierce ThermoPierce Scientific (Rockford, IL).
Indium tin oxide (ITO)-coated glass wafer (CG-81N-1515; resis-tance: 30�60Ω) waspurchased fromDelta Technologies (Stillwater,MN). All chemicals used for fabrication of the arrays/well wereobtained from the University of California;Davis, NorthernCaliforniaNanotechnologyCenter: acetone (Sigma-Aldrich, St. Louis,
ARTIC
LE

HAN ET AL. VOL. 6 ’ NO. 10 ’ 8570–8582 ’ 2012
www.acsnano.org
8580
MO), LOL-2000 (MicroChem, Newton, MA), 2% 950 PMMA A2(MicroChem), methyl isobutyl ketone (MIBK, Sigma-Aldrich),isopropyl alcohol (IPA, Mallinckrodt Baker), and CD-26 (tetramethyl-ammonium hydroxide, MicroChem). A 100� infinity correctedobjective lens (M Plan APO; NA: 0.7; working distance: 6.0 mm;focal length: 2 mm) was purchased from Mitutoyo (Kawasaki,Japan). The beam splitter (FF545/650-Di01), 532 nm long passfilter (BLP01-532R-25), 532 nm notch filter (NF01-532U-25), and633 nm notch filter (NF02-633S-25) were purchased fromSemrock (Rochester, NY). The single-photon counting ava-lanche photodiode (SPAD; SPCM-AQRH-13; dark count: 500counts/s max) was purchased from PerkinElmer (Waltham,MA). The CCD camera (TCA-5.0C; 5.0 MP) for imaging thearrays/well with fluorescent particles was purchased from Tuc-sen Image Technology Inc. (FuJian, China).
Immunoassays on Nano/Microarrays/well. A 1mL aliquot of 0.05%(w/v) fluorescent carboxylated polystyrene particles (40 nm,200 nm, 1 μm, and 5 μm) were coated with goat-anti-RIgG bypassive adsorption considering 100% bound coverage of theantibody to surface of the particle based on particle size. Theamount of the antibody for full coverage was estimated byusing a protocol provided by the vendor. To ensure a well-distributed monolayer of absorbed antibody, we used theantibody at a concentration three times greater than theconcentration indicated by the data from the particle vendor(Bangs Laboratories, TechNote 205). The mixing time was 2 h atroom temperature followed by overnight incubation at 4 �C.The mixed solution was then washed and finally suspended inDI water. After trapping the particle-goat-anti-RIgG into nano-or microwells corresponding to their sizes, 10 μL of target RIgGdissolved in 1� PBS buffer was dropped to the area where atotal of nine arrays/well (the distance between the arrays/wellswas 250 μm) were located, hence, the amounts of the targetmolecules in 10 μL were shared by an individual array that wasthe unit for signal harvesting. The arrays/wells were thenincubated for 20 min at room temperature followed by removalof the solution. The solution is removed by the Couette-flowestablished between the moving top plate and the stationarybottom plate. Finally, 10 μL of 107 pg/mL goat-anti-RIgG�Alexa532 dissolved in 1� PBS buffer was dropped onto the arrays/well. The chip was then incubated for another 20 min followedby removal of the solution. Concentrations of the target werevaried from 10�3 to 109 pg/mL, while the concentration offluorescently labeled antibody was fixed.
In addition, to demonstrate practical performance of thenanoparticle basedPC-array in clinical diagnosis, HER2was used astarget. Monoclonal capture antibody to HER2 was coated onto40 nm fluorescent carboxylated PS particles by using the sameprotocol used in case of goat-anti-RIgG. Biotinylated polyclonaldetection antibody to HER2 was conjugated with streptavidin-Alexa 532 using a standard protocol. The volume of recombinantHER2 (target) and detection antibody-Alexa 532 used for eachdroplet onto the nanoarray was 10 μL. Detection antibody-Alexa532 was used at fixed concentration of 107 pg/mL. The recombi-nant HER2 for the concentration range of 10�3�107 pg/mL wasspiked into 25% human serum. For the serum sample, to removethe proteins from the surface of the array, an additional rinsingprocedure with 10 μL DI water was performed. The method forremoval of the DI water was the same as that of the bioreagents.The data points on the standard curve from all immunoassayswere obtained fromthree random replicates out of the nine arrays.
Conventional 96-Well Plate-Based ELISA for Detecting HER2. A 96-well ELISA plate (Maxisorp, Nunc) was coated with monoclonalcapture antibody to HER2 at 8 � 106 pg/mL in PBS by 2 hincubation at 37 �C. Nonspecific sites of the plate were blockedwith 400 μL of 1% BSA in PBS per each well, followed by 2 hincubation at 37 �C. A total of 100 μL of various concentrationsof HER2 diluted in PBS (25.6, 128, 640, 32� 102, 16� 103 pg/mL)were added towells and the plate was incubated for 1 h at roomtemperature with gentle rocking. The plate was washed fivetimes with PBST and 100 μL of a biotinylated polyclonal detec-tion antibody to HER2was added. After a 1 h incubation at roomtemperature, the plate was washed five times with PBST, andthen 100 μL of streptavidin-HRP (1/6000 dilution in PBS) wasadded and the platewas incubated at room temperature for 1 h.
The plate was washed five times with PBST and 100 μL of theHRP substrate solution (400 μL of 0.6% TMB in DMSO and 100 μLof 1% H2O2 solution into 25mL of citrate buffer) was added andthe reaction was stopped after 15 min by adding 50 μL of 2 MH2SO4 solution. Absorbance was obtained by reading the plateat 450 nmwith a plate reader (Molecular Device, Sunnyvale, CA).
Photonic Nano/Microarrays/Well Fabrication (Supporting Information,Figure S3). The indium tin oxide (ITO)-coated glass wafer wasselected for its electrical and optical properties. High electricalconductivity of ITO was used for trapping the particles con-jugated with biological molecules. On the other hand, the highrefractive index of ITO contributed to create wave-guidedmodes in the nanoarrays. In addition, its optical transparencyaided optic-based detection. Before coating the resist, thewaferwas washed with acetone and fully spin-dried. LOL-2000 wasspin-coated on thewafer at 6500 rpm for 45 s, followed by beingbaked at 180 �C for 300 s. After cooling the wafer, 2% 950 PMMAA2 was spin-coated on the LOL-ITO-glass wafer at 500 rpm for 5 sfollowed by 3000 rpm for 45 s. Thewafer was then placed on a hotplate at 180 �C for 80 s. Eventually the bilayer coating proceduremade a total 240 nm thickness coating. The thickness wasmeasured by an ellipsometer (Auto EL-2, Rudolph ResearchAnalytical, Hackettstown, NJ, U.S.A.). The coated wafer was cutinto 37.5� 25mmchips. The chipwas patterned using a scanningelectron microscope (SEM) equipped with a nanometer patterngeneration system (NPGS, FI 430 NanoSEM electron beam litho-graphy system, FEI, Hillsboro, OR, U.S.A.) at 30 KeV, 24 pA beamcurrent, and 1.2 spot size. The chip was then developed using 1:3MIBK/IPA for 90 S, followed by being rinsed with IPA for 60 s.46 Tofully eliminate any LOL-2000 residue that remained on the ITOsurface, additional developing was performed by using 1:5:5 CD-26/H2O/IPA for 15 s. The chip was rinsed with DI water and dried.
Single Photon Counting Detection System. Supporting Informa-tion, Figure S4 shows the schematic of homemade epi-fluo-rescent single photon counting detection system. A particletrapped in the well was detected with a 100�-infinity correctedobjective lens. A 532 nmCW laser was used to excite fluorescentprobes of the immunocomplex. A 632 nm laser was used toimage the fluorescent particles trapped into the wells. To guidethe 532 or 632 nm laser to the nanoarray at sample stage andemitted light toward a SPAD or a CCD camera, the dual edges-beam splitter was located before a 75 mm focal length convexlens that was used as a tube lens for the infinity corrected lens.The light emitted from the immunocomplex or fluorescentparticles through the objective, tube lens, and beam splitterwas filtered to eliminate the background of 532 or 632 nm bandand simultaneously transmit all other wavebands by using 532 nmlong pass filter, 532 nm notch filter, and 633 nm notch filter. Thedetection sites were confirmed with the 20� or 10� eyepieces.The photons of light emitted from the immunocomplexwere thencollected by the SPAD which generated a pulse per a photon. Thepulses were counted by using an oscilloscope (WavePro 7000;Lecroy, Chestnut Ridge, NY) connected to the SPAD.
Conflict of Interest: The authors declare no competingfinancial interest.
Acknowledgment. The authors thank the Northern Califor-nia Nanotechnology Center at the University of California;Davis for the facilities used in the fabrication of nanoarrays andProfessor T. Young for permission to use his zeta potentialanalyzer.We thank J. Nellis for his help in constructing the singlephoton counting detection system. The project described wassupported by Award No. P42ES004699 from the NationalInstitute of Environmental Health Sciences. The content is solelythe responsibility of the authors and does not necessarilyrepresent the official views of the National Institute of Environ-mental Health Sciences or the National Institutes of Health. Thiswork was also supported by Grant 200911634 from NIAID, NIH.Additional support was provided by the National ResearchInitiative of the USDA Cooperative State Research, Educationand Extension Service, Grant No. 2009-35603-05070.
Supporting Information Available: Figures S1�4 and TablesS1�3. This material is available free of charge via the Internet athttp://pubs.acs.org.
ARTIC
LE

HAN ET AL. VOL. 6 ’ NO. 10 ’ 8570–8582 ’ 2012
www.acsnano.org
8581
REFERENCES AND NOTES1. Peeters, J. K.; Spek, P. J. V. d. Growing Applications and
Advancements in Microarray Technology and AnalysisTools. Cell Biochem. Biophys. 2005, 43, 149–166.
2. Chan, S. M.; Ermann, J.; Su, L.; Fathman, G.; Utz, P. J. ProteinMicroarrays for Multiplex Analysis of Signal TransductionPathways. Nat. Med. 2004, 10, 1390–1396.
3. Lynch, M.; Mosher, C.; Huff, J.; Nettikadan, S.; Johnson, J.;Henderson, E. Functional Protein Nanoarrays for Biomar-ker Profiling. Proteomics 2004, 4, 1695–1702.
4. Lee, M.; Kang, D.-K.; Yang, H.-K.; Park, K.-H.; Choe, S. Y.;Kang, C.; Chang, S.-I.; Han, M. H.; Kang, I.-C. ProteinNanoarray on Prolinker Surface Constructed By AtomicForceMicroscopyDip-PenNanolithography for Analysis ofProtein Interaction. Proteomics 2006, 6, 1094–1103.
5. Sinensky, A. K.; Belcher, A. M. Label-Free and High-Resolu-tion Protein/DNA Nanoarray Analysis Using Kelvin ProbeForce Microscopy. Nat. Nanotechnol. 2007, 2, 653–659.
6. Kang, S. H.; Kim, Y. J.; Yeung, E. S. Detection of Single-Molecule DNA Hybridization by Using Dual-Color TotalInternal Reflection Fluorescence Microscopy. Anal. Bioa-nal. Chem. 2007, 387, 2663–2671.
7. Li, H.; Wang, J.; Pan, Z.; Cui, L.; Xu, L.; Wang, R.; Song, Y.;Jiang, L. Amplifying Fluorescence Sensing Based on In-verse Opal Photonic Crystal toward Trace TNT Detection.J. Mater. Chem. 2011, 21, 1730–1735.
8. Huang, C. S.; George, S.; Lu, M.; Chaudhery, V.; Tan, R. M.;Zangar, R. C.; Cunningham, B. T. Application of PhotonicCrystal Enhanced Fluorescence to Cancer Biomarker Mi-croarrays. Anal. Chem. 2011, 83, 1425–1430.
9. Block, I. D.; Mathias, P. C.; Ganesh, N.; Jones, S. I.; Dorvel,B. R.; Vikra, C.; Vodkin, L. O.; Bashir, R.; Cunningham, B. T. ADetection Instrument for Enhanced-Fluorescence andLabel-Free Imaging on Photonic Crystal Surfaces. Opt.Express. 2009, 17, 13222–13235.
10. Zhao, Y.; Zhao, X.; Sun, C.; Li, J.; Zhu, R.; Gu, Z. Encoded SilicaColloidal Crystal Beads as Supports for Potential MultiplexImmunoassay. Anal. Chem. 2008, 80, 1598–1605.
11. Zhang, Y.; Wang, J.; Huang, Y.; Song, Y.; Jiang, L. Fabricationof Functional Colloidal Photonic Crystals Based on Well-Designed Latex Particles. J. Mater. Chem. 2011, 21, 14113–14126.
12. Li, H.; Wang, J. X.; Liu, F.; Song, Y. L.; Wang, R. M. Fluores-cence Enhancement by Heterostructure Colloidal Photo-nic Crystals with Dual Stopbands. J. Colloid Interface Sci.2011, 356, 63–68.
13. Shen, W. Z.; Li, M. Z.; Xu, L. A.; Wang, S. T.; Jiang, L.; Song,Y. L.; Zhu, D. B. Highly Effective Protein Detection forAvidin-Biotin System Based on Colloidal Photonic CrystalsEnhanced Fluoroimmunoassay. Biosens. Bioelectron. 2011,26, 2165–2170.
14. Zlatanovic, S.; Mirkarimi, L. W.; Sigalas, M. M.; Bynum, M. A.;Chow, E.; Robotti, K. M.; Burr, G. W.; Esener, S.; Grot, A.Photonic Crystal Microcavity Sensor for UltracompactMonitoring of Reaction Kinetics and Protein Concentra-tion. Sens. Actuators, B 2009, 141, 13–19.
15. El Beheiry, M.; Liu, V.; Fan, S. H.; Levi, O. SensitivityEnhancement in Photonic Crystal Slab Biosensors. Opt.Express. 2010, 18, 22702–22714.
16. Chaudhery, V.; Huang, C.-S.; Pokhriyal, A.; Polans, J.;Cunningham, B. T. Spatially Selective Photonic CrystalEnhanced Fluorescnece and Application to BackgroundReduction for Biomolecule Detection Assays. Opt. Express.2011, 9, 1–17.
17. Haukanes, B. I.; Kvam, C. Application of Magnetic Beads inBioassays. Biotechnology 1993, 11, 60–63.
18. Morgan, E.; Varro, R.; Sepulveda, H.; Ember, J. A. CytometricBead Array: A Multiplexed Assay Platform with Applica-tions in Various Areas of Biology. Clin. Immunol. 2004, 110,252–266.
19. Wilson, R.; Cossins, A. R.; Spiller, D. G. Encoded Microcar-riers for High-Throughput Multiplexed Detection. Angew.Chem., Int. Ed. 2006, 45, 6104–6117.
20. Kellar, K. L.; Kalwar, R. R.; Dubois, K. A.; Crouse, D.; Chafin,W. D.; Kane, B.-E. Multiplexed Fluorescent Bead-Based
Immunoassays for Quantitation of Human Cytokinesin Serum and Culture Supernatants. Cytometry 2001, 45,27–36.
21. Krishhan, V. V.; Khan, I. H.; Luciw, P. A. Multiplexed Micro-bead Immunoassays by Flow Cytometry for MolecularProfiling: Basic Concepts and Proteomics Applications.Crit. Rev. Biotechnol. 2009, 29, 29–43.
22. Jager, W. d.; Rijkers, G. T. Solid-Phase and Bead-BasedCytokine Immunoassay: A Comparison.Methods 2006, 38,294–303.
23. Han, J.-H.; Lakshmana, S.; Kim, H.-J.; Hass, E. A.; Gee, S.;Hammock, B. D.; Kennedy, I. M. High Performance Electro-phoresis System for Site-Specific Entrapment of Nanopar-ticles in a Nanoarray. Proc. SPIE 2010, 75740L.
24. Hessel, A.; Oliner, A. A. A New Theory of Woods Anomalieson Optical Gratings. Appl. Opt. 1965, 4, 1275–&.
25. Lam, C. C.; Leung, P. T.; Young, K. Explicit AsymptoticFormulas for the Positions, Widths, And Strengths ofResonances in Mie Scattering. J. Opt. Soc. Am. B 1992, 9,1585–1592.
26. Rosenblatt, D.; Sharon, A.; Friesem, A. A. Resonant GratingWaveguide Structures. IEEE J. Quantum Electron. 1997, 33,2038–2059.
27. Rissin, D. M.; Kan, C. W.; Campbell, T. G.; Howes, S. C.;Fourniew, D. R.; Song, L.; Piech, T.; Patel, P. P.; Chang, L.;Rivnak, A. J.; Fereel, E. P.; Randall, J. D.; Provuncher, G. K.;Walt, D. R.; Duffy, D. C. Single-Molecule Enzyme-LinkedImmunosorbent Assay Detects Serum Proteins at Subfem-tomolar Concentrations. Nat. Biotechnol. 2010, 28, 595–599.
28. Wild, D., The Immunoassay Handbook, 3rd ed.; Elsevier:New York, NY, 2005.
29. Gohring, J. T.; Dale, P. S.; Fan, X. Detection of HER2 BreastCancer Biomarker Using the Opto-Fluidic Ring ResonatorBiosensor. Sens. Actuators, B 2010, 146, 226–230.
30. Ganesh, N.; Zhang, W.; Mathias, P. C.; Chow, E.; Soares, J. A.M. T.; Malyarchuk, V.; Smith, A. D.; Cunningham, B. T.Enhanced Fluorescence Emission from Quantum Dotson a Photonic Crystal Surface. Nat. Nanotechnol. 2007, 2,515–520.
31. Goh, J. B.; Tam, P. L.; Loo, R. W.; Goh, M. C. A QuantitativeDiffraction-Based Sandwich Immunoassay. Anal. Biochem.2003, 313, 262–266.
32. Han, J.-H.; Kim, K.-S.; Yoon, J.-Y. The Enhanced DiffusionalMixing for Latex Immunoagglutination Assay in a Micro-fluidic Device. Anal. Chim. Acta 2007, 584, 252–259.
33. Dee, K. C.; Puleo, D. A.; Bizios, R. An Introduction to Tissue-Biomaterial Interactions; JohnWiley & Sons, Inc.: Hoboken,NJ, 2002.
34. Rucker, V. C.; Havenstrite, K. L.; Simmons, B. A.; Sickafoose,S. M.; Herr, A. E.; Shediac, R. Functional Antibody Immobi-lization on 3-Dimensional Polymeric Surfaces Generatedby Reactive Ion Etching. Langmuir 2005, 21, 7621–7625.
35. Liu, Y.; Hu, W.; Lu, Z.; Li, C. M. Photografted Poly(methylmethacrylate)-Based High Performance Protein Micro-arrays for Hepatitis B Virus Biomarker Detection in HumanSerum. Med. Chem. Commun. 2010, 1, 132–135.
36. Kusnezow, W.; Syagailo, Y. V.; Ruffer, S.; Baudenstiel, N.;Gauer, C.; Hoheisel, J. D.; Wild, D.; Goychuk, I. OptimalDesign of Microarray Immunoassays to Compensate forKinetic Limitation. Mol. Cell Proteomics 2006, 5, 1681–1696.
37. Ekins, R. P.; Berger, H.; Chu, F. W.; Finckh, P.; Krause, F.Miniaturized Immunoassays: Ultrasensitive MultianalyteImmunoassays on a Chip. Nanobiology 1998, 4, 197–220.
38. Chang, L.; Rissin, D. M.; Fournier, D. R.; Piech, T.; Patel, P. P.;Wilson, D. H.; Duffy, D. C. Single Molecule Enzyme-LinkedImmunosorbent assays: Theoretical Considerations. J.Immunol. Methods 2012, 378, 102–115.
39. Ghitescu, L.; Bendayan, M. Immunolabeling Efficiency ofProtein A-Gold Complexes. J. Histochem. Cytochem. 1990,38, 1523–1530.
40. Jiang, W.; Kim, B. Y. S.; Rutka, J. T.; Chan, W. C. W. Nano-particle-Mediated Cellular Response Is Size-Dependent.Nat. Nanotechnol. 2008, 3, 145–150.
ARTIC
LE

HAN ET AL. VOL. 6 ’ NO. 10 ’ 8570–8582 ’ 2012
www.acsnano.org
8582
41. Sheehan, P. E.; Whitman, L. J. Detection Limits for Nano-scale Biosensors. Nano Lett. 2005, 5, 803–807.
42. Johnson, R. D.; Arnold, F. H. The Temkin Isotherm De-scribes Heterogeneous Protein Adsorption. Biochim. Bio-phys. Acta 1995, 1247, 293–297.
43. Wijaya, I. P.M.; Nie, T. J.; Gandhi, S.; Boro, R.; Palaniappan, A.;Hau, G. W.; Rodriguez, I.; Suri, C. R.; Mhaisalkar, S. G.Femtomolar Detection of 2,4-Dichlorophenoxyacetic AcidHerbicides via Competitive Immunoassays Using Micro-fluidic Based Carbon Nanotube Liquid Gated Transistor.Lab Chip 2010, 10, 634–638.
44. Nam, J.-M.; Thaxton, C. S.; Mirkin, C. A. Nanoparticle-BasedBio�Bar Codes for theUltrasensitive Detection of Proteins.Science 2003, 301, 1884–1886.
45. Munge, B. S.; Coffey, A. L.; Doucette, J. M.; Somba, B. K.;Malhotra, R.; Patel, V.; Gutkind, J. S.; Rusling, J. F. Nano-structured Immunosensor for Attomolar Detection ofCaner Biomarker Interleukin-8 Using Massively LabeledSuperparamagnetic Particles. Angew. Chem. 2011, 123,8061–8064.
46. Tseng, A. A.; Chen, K.; Chen, C. D.; Ma, K. J. Electron BeamLithography in Nanoscale Fabrication: Recent Develop-ment. IEEE Trans. Electron. Packag. Manuf. 2003, 26, 141–149.
ARTIC
LE
page S1
SUPPORTING INFORMATION
for
Ultrasensitive immunoassays with a nanoparticle-based photonic
crystal
Jin-Hee Han1, L. Sudheendra
1, Hee-Joo Kim
2, Shirley J. Gee
2, Bruce D.
Hammock2, Ian M. Kennedy
1
1Department of Mechanical and Aerospace Engineering
2Department of Entomology, University of California, Davis, California 95616, USA.
Correspondence should be addressed to I. M. K. ([email protected]).

page S2
Supplemental Figure S1. Numerical modeling of the nanoarray with PC structure. (top) 200 nm-particles
with 650 nm-periodicity for 532 nm-wavelength, (bottom) 555 nm-wavelength.

page S3
Supplemental Figure S2. Energy density time average as a function of frequency showing resonance.
Data on the graph corresponds to the surface of the particles in wells (red circle).

page S4
Supplemental Figure S3. Fabrication of nano- or micro- arrays/well.

page S5
Supplemental Figure S4. The schematic of the single photon counting detection system.

page S6
Supplemental Table S1. Properties of materials used in the numerical model
Refractive index Relative
permeability
Relative
permittivity
Electrical
conductivity (S/m)
PMMA 1.53 0.9 3.0 10-19
Glass 1.50 1.0 4.8 10-14
Polystyrene 1.55 0.9 2.5 10-16
AIR 1.0 1 1 10-30
ITO 2.0 1 3.6 4500
In refractive index of the PMMA, the averaged value of PMMA (1.48) and LOL (1.58) was used.

page S7
Supplemental Table S2. Fluorescent signals on a 40 nm-nanoarray with 650 nm-periodicity using two
different refractive index materials-periodic structures
Glycerine-PMMA Water-PMMA Air-PMMA
Signal (photons/second) 134±23 570±65 757±58
The concentration of the target analyte (rabbit-IgG): 10 µg/ml

page S8
Supplemental Table S3. The datum points used on the standard curve for quantifying rabbit IgG
Fluorescent signal ± SD (photons/second)
Arrays/Spot 1000
µg/ml
10
µg/ml
10
µg/ml
1
µg/ml
0.1
µg/ml
0.01
µg/ml
0.001
µg/ml
10-6
µg/ml NC NSB
5 µm 135±19 132±34 116±11 46±28 - - - - 18±1 31±2
1 µm 201±20 278±0 246±31 107±0 64±20 61±5 43±1 - 16±5 18±2
200 nm 398±46 442±0 422±31 344±16 258±14 231±46 211±0 89±12 24±6 23±2
40 nm 761±57 762±0 775±58 663±4 404±0 365±36 204±6 43±3 17±3 31±2
BN 13±4
SD: Standard deviation over three replicates, NC: Negative control, NSB: Non-specific binding, BN:
Background noisy