ultrasonic measurement of air gap between metal walls ... · pdf fileultrasonic measurement of...
TRANSCRIPT

Ultrasonic Measurement of Air Gap Between Metal Walls Using Bending Waves
Alex Karpelson Kinectrics Inc.
E-mail: [email protected]
1. Introduction Design, containing two metal walls (e.g. tubes, plates, or other parts) with air/gas gap between them, is typical in many industries. Because of various reasons (aging, size change, temperature and radiation influence, vibrations, creep, mechanical displacements and others) this air gap changes during product lifetime. Such a change can lead to system malfunction and even damage. In order to prevent this, the gap width, e.g. between two concentric metal tubes (this is the most typical case), should be continuously monitored. Very often access to the tubes is possible only from within the inner tube (IT), which can be filled with water. Typically the gap width is measured by using eddy-current technique. The transmit coil, located inside the IT, induces low frequency current flow around the circumference of both tubes. This flow creates a reaction field which affects the pick-up voltages in the receive coil. The change in the overall reaction field due to the local proximity between tubes creates the typical response signal. However, the accuracy of such measurements is rather low. Theoretically, to improve the accuracy, the high-frequency eddy current probe can be used. However, due to electromagnetic field attenuation in the metal wall of the IT, such a probe provides only low amplitude response. Moreover, the results of eddy-current measurements are affected by changes in material electric conductivity, tube wall thickness, and others. The only alternative technique, which can be used for accurate gap measurement, is the ultrasonic (UT) method, which currently is extensively used for tube inspection. Ultrasound is not affected by variations in electrical conductivity or permeability, and it can provide the desired accurate measurements and 100% mapping. Besides, the UT equipment is portable and inexpensive; works from within the IT filled with water; and can stand radiation and temperature. The objective of this paper is to describe results of the feasibility study concerning abilities of low-frequency UT bending (flexural) waves in the IT wall to measure the air gap between two concentric metal tubes with access only from within the IT. 2. Standard Pulse-Echo Technique Unfortunately, the simplest pulse-echo (PE) UT technique with normal beam transducer located inside the IT cannot be used for air gap measurement. If gap between tubes is filled with water, then the UT transducer, located inside the IT and working in PE mode, can easily generate high amplitude reflections from the outside surface (OS) of the IT and the inside surface (IS) of the outer tube (OT), thus providing the accurate absolute gap measurement. The experiments were performed using computerized scanning rig, Winspect software for data acquisition and processing, SONIX STR-81G digitizer card, and UTEX UT-340 pulser-receiver. Set-up contained two concentric metal tubes: the IT with wall thickness 4mm and inside diameter

2
103mm, and the OT with wall thickness 1mm and inside diameter 130mm. The IT was filled with water. At first, ∼1mm gap between the IT and OT was filled with water, and 10MHz transducer (focal length FL=33mm and aperture diameter D=9.5mm) located inside the IT in water with water-path WP=9mm was applied in PE mode. Experiments showed that gap could be reliably and accurately measured, see Fig. 1. The time-of-flight between 1st IT OS reflection and 1st OT IS reflection is ∼1.2µs. For ultrasound velocity in water ∼1.5mm/µs it gives ∼1mm gap width, which matches with mechanically measured gap width. Figure 1. A-scan of IT/OT 1mm wide gap filled with water. Probe: normal beam 10MHz transducer with FL=33mm, D=9.5mm and WP=9mm located inside IT in water and working in PE mode. However, when gap is filled with air, it turned out that amplitude of the UT signal reflected from OT was extremely weak and could not be detected at the existing noise level. It occurred because ultrasound practically did not pass through interface metal/air. The response amplitude is determined, among other factors, by transmission pressure coefficient [1-2]
21
22
ZZ
ZTp +
= ,
(1) where Z1 is the acoustic impedance of the media where acoustic beam comes from (Z1=31Mrayl for metal tube in our case), and Z2 is the acoustic impedance of the media where acoustic beam goes in (Z2=0.00045Mrayl for air in our case).
IT IS reflection
1st IT OS reflection
2nd IT OS reflection
1st OT IS reflection
2nd OT IS reflection
IT/OT 1mm gap

3
As a result, for interface IT/air the transmission coefficient Tp=0.003%; it corresponds to ∼90dB attenuation. That is why the UT response, reflected from the OT IS when gap filled with air, cannot be detected. For water Z2=1.5Mrayl and respectively Tp=10% for interface IT/water. That is why the UT signal, reflected from the OT IS, when gap is filled with water, can be easily detected. So, the signal reflected from the OT, when gap is filled with air, is extremely weak, besides that there are many strong multiple reflections within the IT wall. These signals absolutely mask weak reflection from the OT: see Fig 2 showing various reflections for 8mm gap including PE response from OT IS arriving at ~50µs after 1st IT OS reflection.
Figure 2. A-scan of 8mm gap filled with air. Probe: normal beam 10MHz transducer with FL=33mm, D=9.5mm and WP=9mm located inside IT in water and working in PE mode. Note that at low gain the whole picture is, of course, much cleaner, but there is no chance that reflection from the interface air/OT can be detected. At high gain theoretically it could be detected, if it would not be masked by very strong multiple reflections. Thus, the obtained results show that standard PE method cannot be used for air gap measurement. Because of this some other UT technique should be used to accurately measure air gap between two concentric metal tubes. A few attempts were made to use UT technique, which generates standing resonant acoustic waves within the gap in order to measure its width. Since the resonant standing wave in comparison with a running one has much larger amplitude, the response can probably be detected and used for gap measurement. Such resonant method is analogous to contact UT resonant thickness gauging technique. The proposed resonant method has been experimentally tested; it turned out that it really allowed increasing sensitivity 10-100 times in comparison with standard PE technique, however even the best obtained results were not sufficiently sensitive and effective for practical application.
Multiple reflections within the IT wall
Reflection from interface air/OT is very weak and
should be there for 8mm gap

4
3. Low-Frequency Bending Oscillations of Tube Wall In order to effectively transmit acoustic signal through water and metal tube wall into air and receive the reflected signal, one should use the IT wall as a thin membrane performing bending (flexural) oscillations. Low-frequency bending oscillations of the IT wall in the transmission mode can be excited e.g. by a small vibration shaker located inside the IT in water. The oscillating tube wall will work then as a rather efficient radiator of low-frequency acoustic waves in air. After reflecting from the OT the air wave will come back to the IT and excite secondary flexural oscillations (asymmetric Lamb waves) in the IT wall. Such waves will excite the longitudinal leaky waves transmitted in water inside the IT, which can be received by a low-frequency transducer-receiver positioned there. The proposed method, using bending oscillations of the IT wall to transmit and receive acoustic waves propagating in three media (water, metal, and air), is probably the only technique among large variety of UT methods, which possesses a sufficient effectiveness. It turned out (see below) that by forcing the IT wall to vibrate as a whole, i.e. to work as a thin membrane, performing low-frequency flexural oscillations, it was possible to transmit in air (transmission mode) and in water (reception mode) the acoustic waves with required amplitude. Recall, that low-frequency bending oscillations of thin plates were used for a long time to transmit sonic waves between various media (gas, solid, and liquid) without huge loss; and no other UT method can do it. For instance, so called “carbon” microphones, widely used some time ago, were very efficient: they converted weak sound waves into flexural vibrations of a thin metal membrane; these vibrations in turn caused a varying pressure in graphite powder, which entailed the graphite resistance change. Another example is the ability of a hydrophone (sonar) to detect even a weak sound, generated inside a submarine in air and transmitted through boat metal hull into outside water; only flexural vibrations of the hull are able to transmit a very weak sonic wave from air into water through metal layer with sufficient intensity. 3.1 Theoretical background Consider metal plate of thickness h in z-direction and infinite in two other directions x and y, adjacent water half-space semi-infinite in z-direction at the front surface z=0, and adjacent air half-space semi-infinite in z-direction at the back surface z=h. In general case, a flexural wave propagating in a thin plate (asymmetric Lamb wave) should be accompanied by leaky longitudinal waves propagating in the water and air adjacent to the plate. To describe this phenomenon system of the following equations is needed [3-4]. First equation is the equation for mechanical displacement in a bending wave propagating in a thin plate (Euler-Bernoulli plate equation). (Expression “bending wave in a thin plate” means that plate thickness is small compared with bending wavelength; oscillations are only in z-direction perpendicular to the plane of the plate; displacement, particle velocity and strain are uniform in normal direction, i.e. they do not depend on coordinate z; wave is propagating in two directions x and y, i.e. wave vector has only two components in the plate plane).
( ) ( ) hzazwp tzyxPtzyxPyyxx
Dt
h == ++
∂∂+
∂∂∂+
∂∂−=
∂∂
,,,,,,2 04
4
22
4
4
4
2
2 ξξξξρ , (2)

5
where ( )tyx ,,ξ is the mechanical displacement of the plate in z-direction; pρ is the density of
plate material; h is the thickness of the plate; ( )23 112 σ−= hED is the flexural rigidity (bending modulus) of the plate; E is the Young’s modulus of plate material; σ is the Poisson’s ratio of plate material; ( ) 0,,, =zw tzyxP is the pressure exerted by water on the plate, which can be
expressed in terms of the water velocity potential t
P www ∂
∂−= ϕρ ; ( ) hza tzyxP =,,, is the
pressure exerted by air on the plate, which can be expressed in terms of the air velocity potential
tP a
aa ∂∂−= ϕρ ; wρ is the density of the water; aρ is the density of the air; ( )tzyxw ,,,ϕ is the
water velocity potential; ( )tzyxa ,,,ϕ is the air velocity potential.
Using expressions for wP and aP equation (2) can be written as follows
hza
azw
wp ttyyxxD
th == ∂
∂−∂
∂−
∂∂+
∂∂∂+
∂∂−=
∂∂ ϕρϕρξξξξρ 04
4
22
4
4
4
2
2
2 , (3)
Second equation is the wave equation for velocity potential wϕ describing the leaky longitudinal
wave accompanying a flexural wave in a plate and propagating in water half-space adjacent to the plate at 0=z and located at 0<z :
2
2
22
2
2
2
2
2 1
tczyxw
w
www
∂∂=
∂∂+
∂∂+
∂∂ ϕϕϕϕ
,
(4) where wc is the speed of propagation of sound in water.
Third equation is the wave equation for velocity potential aϕ describing the leaky longitudinal
wave accompanying a flexural wave in a plate and propagating in air half-space adjacent to the plate at hz = and located at hz > :
2
2
22
2
2
2
2
2 1
tczyxa
w
aaa
∂∂=
∂∂+
∂∂+
∂∂ ϕϕϕϕ
,
(5) where ac is the speed of propagation of sound in water.
Forth equation is the boundary condition at the interface plate/water at 0=z . The normal component of the water particle velocity at the surface must be equal to the particle velocity of the plate:
( ) ( )
0
,,,,,
=∂∂=
∂∂
z
w
z
tzyx
t
tyx ϕξ
(6) Fifth equation is boundary condition at the interface plate/air at hz = . Normal component of the air particle velocity at the surface must be equal to the particle velocity of the plate:
6
( ) ( )
hz
a
z
tzyx
t
tyx
=∂∂=
∂∂ ,,,,, ϕξ
(7) Equations (3)-(7) describe propagation of bending wave in a thin plate (asymmetric Lamb wave) and two related leaky waves in the adjacent media, water and air. To solve system (3)-(7), analyze the idealized case and assume that solution can be presented in a complex form as three associated continuous plane traveling waves: ( ) ( )[ ]tkykxiAtyx ωξ −+= exp,, , (8) ( ) ( )[ ]tzkkykxiBtzyx ww ωϕ −++= exp,,, ,
(9) ( ) ( )[ ]tzkkykxiCtzyx aa ωϕ −++= exp,,, ,
(10) where A , B and C are the amplitudes of the respected waves; k is the wave number of a bending wave in the plate; ω is the angular frequency; wk is the wave number of plane leaky
longitudinal wave in water in z-direction; and ak is the wave number of plane leaky longitudinal
wave in air in z-direction. The assumed solutions (8)-(10) describe model, where a flexural continuous traveling wave (asymmetric Lamb wave) propagates in a thin plate infinite in two directions (formula (8)). Amplitude A and frequency ω of this wave depend on the external driving force, which excites this wave. The wave number k of the bending wave in a plate and frequency ω are connected by the dispersion formula obtained below. The flexural traveling wave in a plate generates two continuous plane traveling leaky longitudinal waves propagating in water (formula (9)) and air (formula (10)) with the same frequency ω but different amplitudes B and C . Both leaky waves are associated with a bending wave in the plate and propagate along the plane of the plate (i.e. in x and y directions) with the same wave number k . But in z-direction normal to the plane of the plate they propagate with specific wave numbers wk and ak .
Substitute (9) and (10) into (4) and (5) respectively and obtain formulae for the wave numbers
wk and ak as moduli of the complex functions:
22
22 2k
ck
w
w −= ω ,
(11)
22
22 2k
ck
a
a −= ω ,
(12) Now substitute (8), (9) and (11) into (6) and derive formula for amplitude B of the leaky wave in water as modulus of the complex function:

7
222 2 kc
cAB
w
w
−−=
ωω
(13) Substitute (8), (10) and (12) into (7) and derive formula for amplitude C of the leaky wave in air as modulus of the complex function:
−−
−=
a
a
a
a
c
kchi
kc
cAC
222
222
2exp
2
ω
ωω
(14) And at last, substitute (8), (9) and (13) into (3) and, neglecting a very weak pressure
tP a
aa ∂∂−= ϕρ exerted by air on the plate, obtain the dispersion formula
( ) 224
222
242
42
ωρω
ωρhkD
kc
cw
w
ww −=−
(15) The obtained solution (8)-(15) describes a traveling continuous flexural wave (asymmetric Lamb wave) propagating in a thin metal plate and accompanied by two traveling continuous plane leaky waves propagating in the adjacent media, water and air. Recall that amplitude A of the bending wave and frequency ω depend on the external driving force, which excites the oscillations. In our case in the transmission mode this force is exerted by a vibration shaker located inside the IT in water and impacting the IT IS. In the reception mode this force is exerted by an air wave impinging on the IT OS. Of course, this solution is the approximate one based on the following assumptions:
1. The plate was assumed infinite in x and y directions. That is why there is only one traveling bending wave in these two directions: no reflections from plate boundaries.
2. The water and air were assumed infinite in x and y directions and semi-infinite in z direction. That is why there are only one traveling leaky wave in water and one in air in all three directions: no reflections from boundaries.
3. It was assumed that excitation force was continuous with frequency ω . 4. The problem (3)-(7) was solved for a plate but tube wall is curved in circumferential
direction. 5. It was assumed that there are only plane leaky waves in the water and air (see formulae
(9) and (10)), while in reality these leaky waves are more complex.
Note that although the obtained solution (8)-(15) based on such assumptions is valid only for the idealized case, but the model predictions have approximate validity for a real case. Formulae (8)-(15) allow calculating (more precisely, estimating) the main parameters of various acoustic waves used to effectively transmit signals from water into air and back through a metal plate.
8
To prove efficiency of this method in comparison with a standard UT PE technique, evaluate the energy transmission coefficient ET for the case, when the incident wave from air impinges on the front surface of a thin metal plate adjacent to water at the back surface. It can be done using formulae (8)-(15) or much simpler approximate expression from [4]
2
21log101
+==
a
p
I
TE Z
Z
W
WT ,
(16) where TW is the power in the wave transmitted from air into water through a metal plate; IW is
the power in the air incident wave;
−−= 21
w
ppp c
VhiZ ρω is the specific acoustic
impedance of the plate with air at the front surface and water at the back surface; pV is the phase
velocity of a flexural wave in the plate; aaa cZ ρ= is the characteristic acoustic impedance of the
air. Substitute all necessary parameters of the metal plate, air and water into (16) and obtain that
dBTE 58−= . It means that power of the transmitted acoustic wave in water is ~800 times less than power of the incident acoustic wave in air, and respectively [1-2] acoustic pressure in water is ~28 times less than pressure of the incident acoustic wave in air. Very similar results for ET value were obtained using formulae (8)-(15) and expressing amplitude B of the wave in water through amplitude C of the wave in air. For comparison note, that for normal longitudinal wave transmitted from air into water through the same metal plate, the energy transmission coefficient dBTE 120−= . It means that power of the transmitted wave in water is ~10 6 times less than power of the incident wave in air. This value was calculated using traditional formula for ET and standard numbers of characteristic acoustic impedances of water, air and metal [1-2]. Respectively, the acoustic pressure in water is ~10 3 times less than pressure of the incident acoustic wave in air. The obtained number of transmission coefficient dBTE 58−= for technique using the bending
wave in a thin metal plate located between air and water, and magnitude dBTE 120−= for a traditional UT PE method for this three-layer medium, clearly demonstrate efficiency of the bending-wave technique (difference in ET is about 103). Moreover, these numbers explain a high sensitivity of bending wave method in both examples described earlier. The obtained results allow assuming that method using bending wave in a thin plate located between water and air can be prospective for measuring the air gap between two concentric metal tubes. 3.2 Some problems related to bending-wave technique Despite very prospective high potential sensitivity, the bending-wave method has at least two major challenges, which should be addressed in order to make this technique workable for gap measurement.

9
First problem is a very high level of the background acoustic “noise” - strong signals related to different waves and multiple reflections within the IT wall. As a matter of fact, flexural vibrations of the IT wall, excited by a vibration shaker, generate a very strong direct response in transducer-receiver. The amplitude of this response is about 100-1000 times greater, than the expected amplitude of the wave carrying information about the IT/OT gap. Moreover, the shapes and spectra of these two types of waves are similar. Therefore, some special technique should be used to distinguish a comparatively weak response, generated by acoustic waves in the air gap, at the background of analogous but much stronger signal, excited directly by the IT wall bending oscillations. To overcome this difficulty one can e.g. employ a number of sensitive receivers and then cross-correlate their signals - method widely used in seismoacoustics. To solve our problem, it was suggested to use some high resolution analog-to-digital converter (at least 12bit, because 212=4096) and two identical transducers located in one axial plane but oriented at 1800 apart in radial direction and one shaker (impact hammer) positioned in the middle between them in the same axial plane (see Fig. 3). Figure 3. Schematic of gap measurement system, consisting of two identical transducers, located in one axial plane but oriented at 1800 apart in radial direction, and one impact hammer positioned in the middle between them in the same axial plane. Such a system should give identical responses, when two gaps facing the opposite transducers are equal. If these gaps are not equal, the responses of transducers should differ, because waves propagating in air gaps will reach probes at different times. As a result, digitizing signals of these two transducers with high accuracy and subtracting one from other, it may be possible to detect the gap-waves, which arrive to the respective transducers at different moments of time. It will allow correlating the received signal with gap width. Second problem is variations in the IT and inspection system parameters, which affect the received signals. Such IT parameters, as shape (e.g. ovality), wall thickness, inside diameter, and physical characteristics of tube material, may differ from one tube to another and may even vary in one tube. Probes and impact hammer cannot be absolutely symmetrically positioned and
OT Transducer 1
IT
Transducer 2
Impact hammer
Water Air gap

10
oriented in the module-holder; module itself can never be perfectly centered; and probes cannot be exactly identical. All these parameters are the influential essential ones, because they strongly affect the outcome of measurements. Therefore, some special technique should be used to distinguish a response, generated by acoustic wave in air gap, from signals variations, initiated by numerous changes in parameters of the IT and inspection system. It was suggested that such signal processing methods as averaging, filtering, and cross-correlation, should separate the responses (gap-waves), carrying information about gap width, from signal variations, generated by changes in the IT and inspection system parameters. It was expected that using all methods mentioned above, it would be possible to minimize the background “acoustic noise”, obtain good gap-wave responses for different gaps, and correlate the received signal with gap width. However, due to a very simplified experimental setup (see Section 4 below), it did not happen. Therefore, it was decided to use only relative measurements to characterize the gap and to try also the other technique employing only one transducer and impact hammer located close to it: just above or below the transducer (Fig. 4). Figure 4. Schematic of gap measurement system, consisting of one transducer and impact hammer positioned just above the probe. One transducer method gives only absolute measurement results unlike relative difference in two transducers technique. Therefore, the whole measurement system should be accurately calibrated, and this is not easy because many factors lead to signal variations. The other possibility is to use again relative measurements comparing signals obtained at different angle positions of the system. Note, that one transducer method has a significant advantage in comparison with two transducers technique: there is no need to care about probes similarity, and the whole mechanical setup is simpler. Therefore, the number of factors leading to measurement errors is less, and so the total error is smaller. 3.3 Experimental setup
OT IT
Transducer
Impact hammer
Water
Air gap
11
Since this project was just a feasibility study, only preliminary experiments were performed. Tests were done using very simple and therefore inaccurate mechanical setup containing the IT and OT installed on a special holder with micrometer to change and measure the air gap. The measurement system included data acquisition software based on MATLAB, digitizer card (24-Bit and 204.8kS/s), high-sensitive low-frequency acoustic emission (AE) sensors, high-sensitive low-frequency vibration accelerometers, and mechanical spring-loaded manual impact hammer. To perform the experiments, two different setups employing two or one transducer were used as shown in Figs 3 and 4, respectively. Pieces of the IT and OT ~200mm long with impact hammer and transducer-receivers positioned inside the IT were installed on a standard three axis translational scanning system with rotary motion capability. 3.4 Test procedure At first simple tests were performed in order to estimate the sensitivity of bending-wave method and compare it to theoretical predictions. These experiments were done exciting very weak sonic waves in air outside the OT and trying to detect them using transducer located inside the IT in water. Then the main series of experiments was performed using two different methods with two or one transducers as presented in Figs. 3 and 4. In two transducers method their signals were digitized, averaged, filtered, cross-correlated, and then subtracted. In one transducer technique the received signal was digitized, averaged, filtered and cross-correlated at various angle positions of transducer and impact hammer. At first, the nominal gap (8mm everywhere between IT and OT) was set using micrometer. Then the IT was hit by impact hammer ten times, and signals received by transducers were averaged and processed. This procedure was performed for different gaps. Experiments were done using different transducers: high-sensitive 15kHz AE sensors R1.5-UC-1, high-sensitive 30kHz AE sensors R3UC-1, and high-sensitive vibration accelerometers 1024-4 with center frequency 10kHz. To increase amplitude of the received signals and make them less distorted and more uniform, tests were also performed employing special made transducer caps, which contour the IT IS. Experiments were done at different water-paths from 0 to 3mm. Using special software written in MATLAB, various signal processing methods were employed. The received signals were averaged over ten hits to decrease the random errors. Then FFT was performed and signals spectra were analyzed. In addition, the averaged signals were filtered using different low-pass, high-pass and band-pass filters. Finally, the envelopes of the received
signals ( )tf have been analyzed by performing the Hilbert transform ( ) ( )∫∞
∞− −=
tt
tdtftFHi
1
111π
of
this signal. The best results were obtained in time domain using 15kHz and 30kHz AE sensors with caps and 0-50kHz low-pass filter. 4. Results and discussion 4.1 Sensitivity estimates At first, signals generated by a weak sound in air (finger snap) and received by the AE sensor were compared for two cases: when sensor was located on the open space in air and when it was in water inside the IT. In both cases the signals were easily detectable, but signal amplitude in the
12
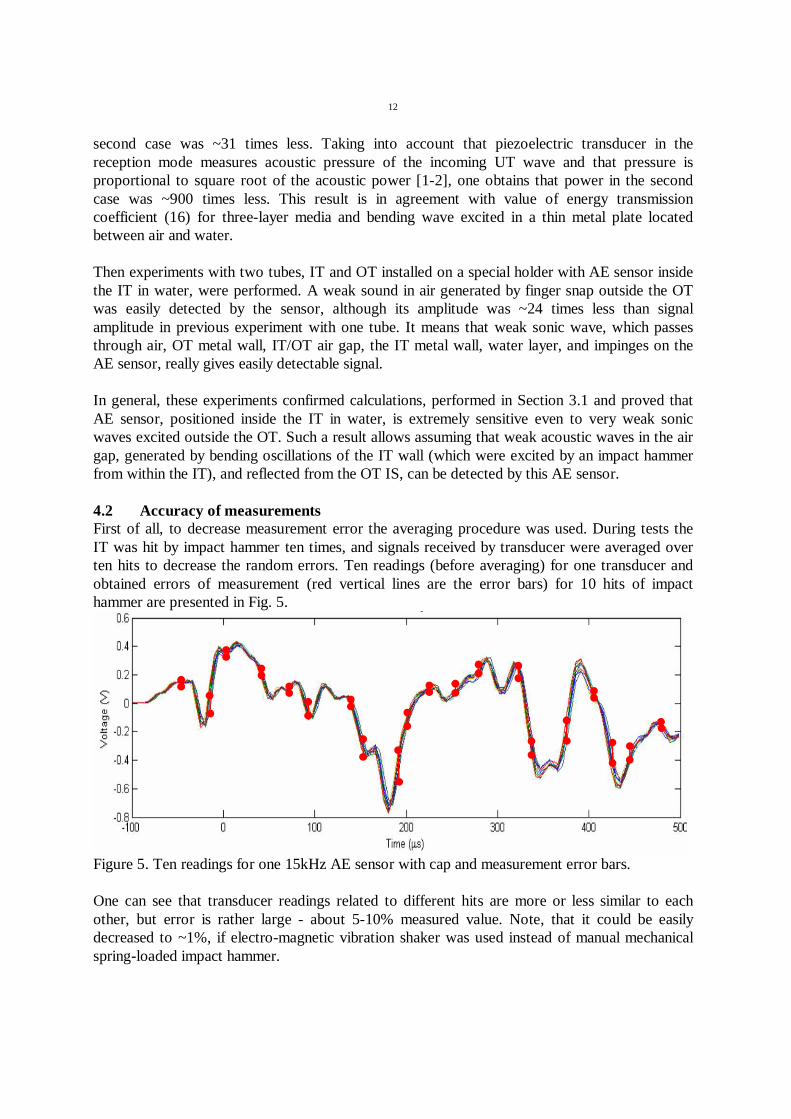
second case was ~31 times less. Taking into account that piezoelectric transducer in the reception mode measures acoustic pressure of the incoming UT wave and that pressure is proportional to square root of the acoustic power [1-2], one obtains that power in the second case was ~900 times less. This result is in agreement with value of energy transmission coefficient (16) for three-layer media and bending wave excited in a thin metal plate located between air and water. Then experiments with two tubes, IT and OT installed on a special holder with AE sensor inside the IT in water, were performed. A weak sound in air generated by finger snap outside the OT was easily detected by the sensor, although its amplitude was ~24 times less than signal amplitude in previous experiment with one tube. It means that weak sonic wave, which passes through air, OT metal wall, IT/OT air gap, the IT metal wall, water layer, and impinges on the AE sensor, really gives easily detectable signal. In general, these experiments confirmed calculations, performed in Section 3.1 and proved that AE sensor, positioned inside the IT in water, is extremely sensitive even to very weak sonic waves excited outside the OT. Such a result allows assuming that weak acoustic waves in the air gap, generated by bending oscillations of the IT wall (which were excited by an impact hammer from within the IT), and reflected from the OT IS, can be detected by this AE sensor. 4.2 Accuracy of measurements First of all, to decrease measurement error the averaging procedure was used. During tests the IT was hit by impact hammer ten times, and signals received by transducer were averaged over ten hits to decrease the random errors. Ten readings (before averaging) for one transducer and obtained errors of measurement (red vertical lines are the error bars) for 10 hits of impact hammer are presented in Fig. 5.
Figure 5. Ten readings for one 15kHz AE sensor with cap and measurement error bars. One can see that transducer readings related to different hits are more or less similar to each other, but error is rather large - about 5-10% measured value. Note, that it could be easily decreased to ~1%, if electro-magnetic vibration shaker was used instead of manual mechanical spring-loaded impact hammer.

13
The second source of errors was low mechanical accuracy of the system. Initially, it was expected, that in two transducers method when gap is nominal everywhere (i.e. gaps are equal 8mm on two opposite sides of the IT), the whole system (tubes, transducers, impact hammer, holder, etc) would be symmetric and signals received by both transducers should be similar within measurement accuracy. The asymmetric signals were expected to appear only when gaps were different at two opposite sides of the IT (see Fig. 3). However, even at equal gaps the readings of two transducers were different. Most probably such factors as low mechanical accuracy of the system, difference between transducers parameters, poor centering, positioning and orientation of impact hammer and AE sensors in relation to each other and IT IS, lead to such large differences between responses. It was also expected, that in one transducer method when gap is nominal 8mm everywhere around the IT, the signals received by transducer at various angle positions should be similar within measurement accuracy. Different signals were expected to appear only when gaps differed at different angles. However, it turned out that even at equal nominal gaps everywhere around IT the transducer readings were different. Data after averaging for one transducer at various angle positions of this transducer and impact hammer and at 8mm nominal gap everywhere around the IT are presented in Fig.6.
Figure 6. Averaged data for one 30kHz AE sensor without cap at various angle positions and at nominal 8mm gap everywhere around the IT. It is clear that transducer responses are very different at various angles, particularly after 300µs. Most probably, the low mechanical accuracy of the system entailed such large differences between responses. For future practical application of bending-wave technique it is absolutely necessary to decrease the measurement errors. To do it, first of all, an electro-magnetic shaker with consistent force output should be employed. Then, the whole mechanical setup should be redesigned to provide a required high accuracy. Such parameters of transducer as center frequency, diameter, bandwidth, material of protector, and shape of front surface, should be optimized to obtain a high sensitivity and decrease signal distortion. And finally, the most appropriate signal processing methods
0deg 45deg 90deg 180deg 270deg
14
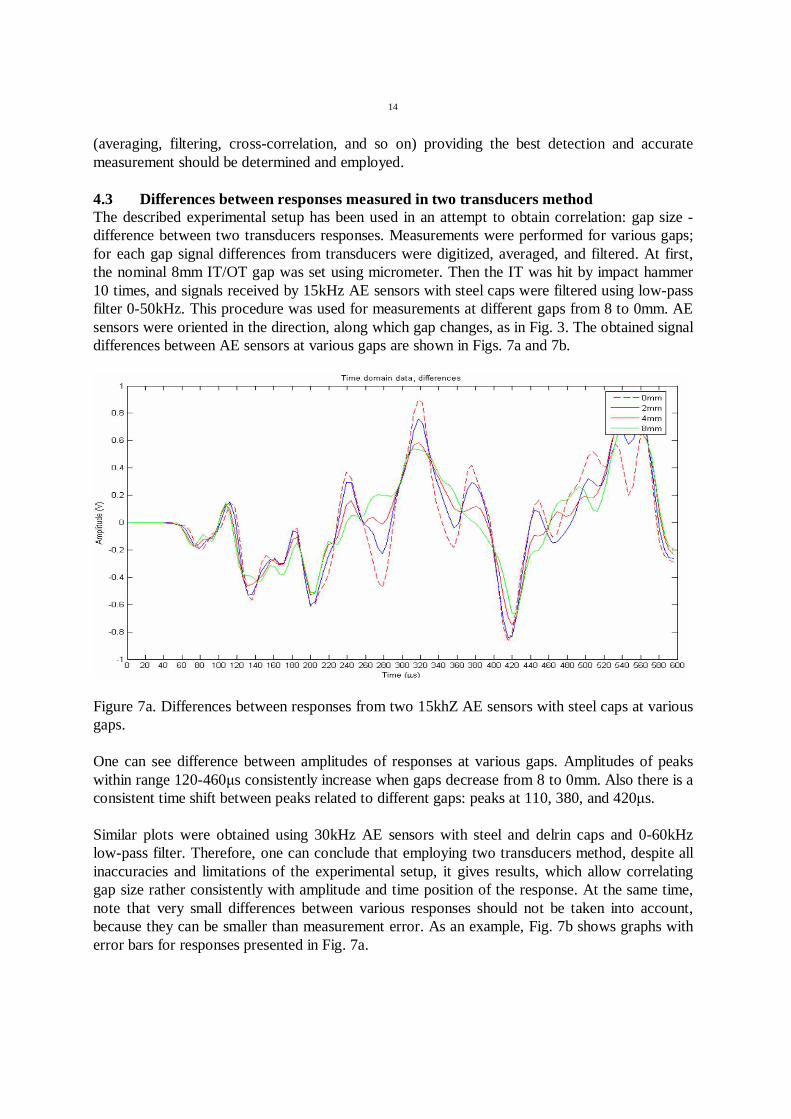
(averaging, filtering, cross-correlation, and so on) providing the best detection and accurate measurement should be determined and employed. 4.3 Differences between responses measured in two transducers method The described experimental setup has been used in an attempt to obtain correlation: gap size - difference between two transducers responses. Measurements were performed for various gaps; for each gap signal differences from transducers were digitized, averaged, and filtered. At first, the nominal 8mm IT/OT gap was set using micrometer. Then the IT was hit by impact hammer 10 times, and signals received by 15kHz AE sensors with steel caps were filtered using low-pass filter 0-50kHz. This procedure was used for measurements at different gaps from 8 to 0mm. AE sensors were oriented in the direction, along which gap changes, as in Fig. 3. The obtained signal differences between AE sensors at various gaps are shown in Figs. 7a and 7b.
Figure 7a. Differences between responses from two 15khZ AE sensors with steel caps at various gaps. One can see difference between amplitudes of responses at various gaps. Amplitudes of peaks within range 120-460µs consistently increase when gaps decrease from 8 to 0mm. Also there is a consistent time shift between peaks related to different gaps: peaks at 110, 380, and 420µs. Similar plots were obtained using 30kHz AE sensors with steel and delrin caps and 0-60kHz low-pass filter. Therefore, one can conclude that employing two transducers method, despite all inaccuracies and limitations of the experimental setup, it gives results, which allow correlating gap size rather consistently with amplitude and time position of the response. At the same time, note that very small differences between various responses should not be taken into account, because they can be smaller than measurement error. As an example, Fig. 7b shows graphs with error bars for responses presented in Fig. 7a.

15
Figure 7b. Differences between responses from two 15kHz AE sensors with steel caps for signals shown in Fig. 7a with error bars. 4.4 Responses measured in one transducer method Employing one transducer method measurements were performed for various gaps too. For each gap signals from transducer were digitized, averaged, and filtered. At first, the nominal 8mm gap was set. Then the IT was hit by impact hammer 10 times, and signals received by 15kHz AE sensor with steel cap were filtered using low-pass filter 0-50kHz. AE sensor and hammer were oriented in gap change direction, as in Fig. 4. The obtained signals from AE sensor at various gaps are shown in Fig. 8.
Figure 8. Responses from 15kHz AE sensor with steel cap at various gaps. There are definite differences between amplitudes of responses at various gaps. Although these differences are not large, one can clearly see that amplitudes of peaks within range -20-200µs consistently decrease when gaps decrease from 6 to 0mm. Similar plots were obtained using 30kHz AE sensors with delrin cap and 0-60kHz low-pass filter. So, it is possible to conclude that employing one transducer method, despite all
0mm 1mm 2mm 4mm 6mm

16
inaccuracies and limitations of the testing setup, it gives results, which allow correlating gap size more or less consistently with amplitude of the response. 4.5 Responses measured at various offsets of testing setup Another series of experiments was performed to determine how the received signal varies depending on changes in the test system parameters and tube characteristics, because it is necessary to distinguish a response, generated by acoustic wave in air gap, from signal variations, initiated by these changes. Experiments were done at different transducer offsets, then at various angle positions of probes and shaker, and finally on different IT samples. At first, series of experiments was performed using two transducers method at different offsets: small (~1.5mm) and large (~3mm) by moving transducers and impact hammer in two perpendicular radial directions. Measurements at each offset were performed for various gaps; for each gap signals from two 15kHz AE sensors with caps were digitized, averaged, filtered, and then subtracted. The objective of these experiments was to check ability of testing system to distinguish different gaps at various offsets. Typical results are presented in Figs. 9-10.
Figure 9. Differences between responses from two 15kHz AE sensors with caps at small 1.5mm offset at various gaps.
0.5mm
4mm
8mm

17
Figure 10. Differences between responses from two 15kHz AE sensors with caps at large 3mm offset at various gaps. As one can see in Figs. 9-10, the differences between amplitudes of responses at various gaps are consistent and can be observed at different offsets. Amplitudes of all peaks within range 140-440µs consistently change, when gap varies from 8 to 0.5mm. Similar results were obtained for radial offsets in two perpendicular directions applying one transducer method. Then the same series of experiments has been performed for 30kHz AE sensors using two transducers and one transducer methods. All obtained responses were similar to ones presented in Figs. 9-10. Therefore, the setup used for measurements gives results, which allow correlating gap size rather consistently with amplitude of the response even at pretty large 3mm offset. It means that measuring technique and setup were pretty robust to centering. 4.6 Responses obtained at various angle positions The next series of experiments was performed using one transducer method and two transducers method at different angle positions of testing system by rotating rod with transducers and impact hammer. Measurements at each angle position were performed for various gaps. At each gap signals from 30kHz AE sensors were digitized, averaged, and filtered. It was expected that data obtained at various angles would be for sure different, because change of the transducer angle position with respect to the small gap leads to a change of the response shape due to variations of time-of-flight of different waves carrying information about this gap. The goal of these experiments was to check the ability of testing system to distinguish various gaps at different angle positions of the system. Responses for two transducers method obtained at 450 and 900 angles with respect to small gap angle position are presented in Figs. 11-12.
0.5mm
4mm
8mm
18
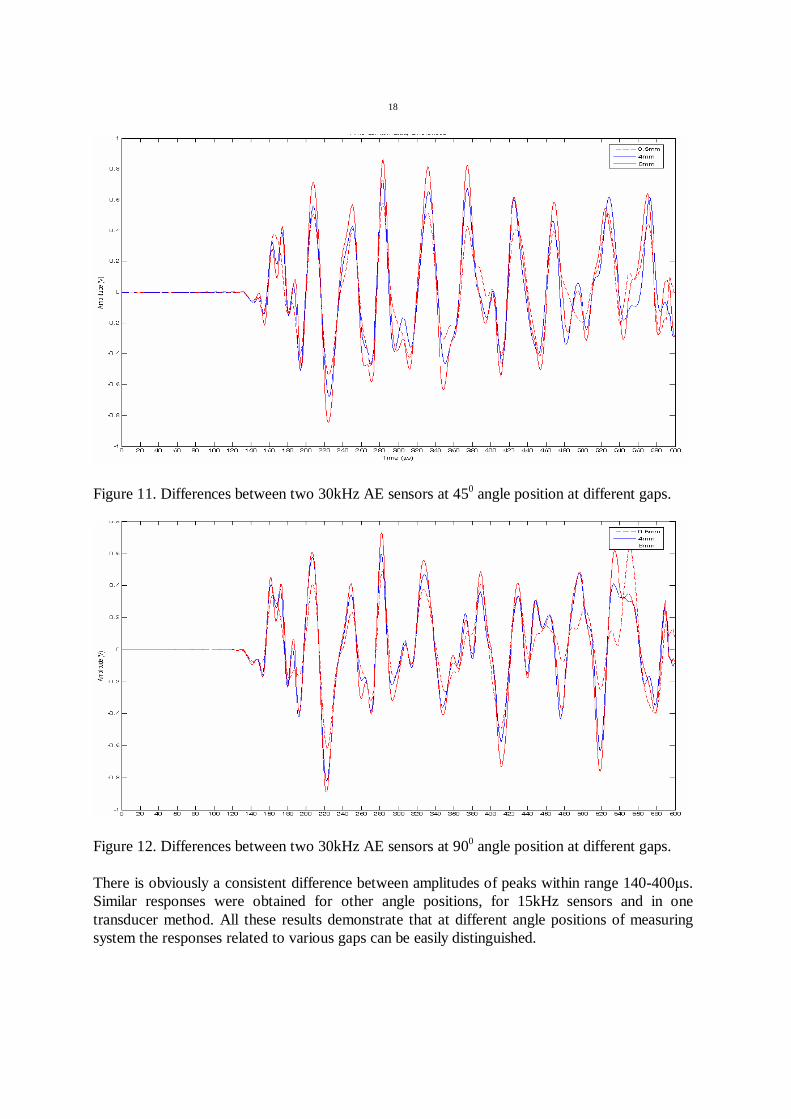
Figure 11. Differences between two 30kHz AE sensors at 450 angle position at different gaps.
Figure 12. Differences between two 30kHz AE sensors at 900 angle position at different gaps. There is obviously a consistent difference between amplitudes of peaks within range 140-400µs. Similar responses were obtained for other angle positions, for 15kHz sensors and in one transducer method. All these results demonstrate that at different angle positions of measuring system the responses related to various gaps can be easily distinguished.
19
Second group of tests related to different angle positions of the system was performed with objective to use measurements, obtained at various angle positions, for gap characterization by comparing responses related to different angles. Responses for one transducer method for two gaps are presented in Figs. 13-14.
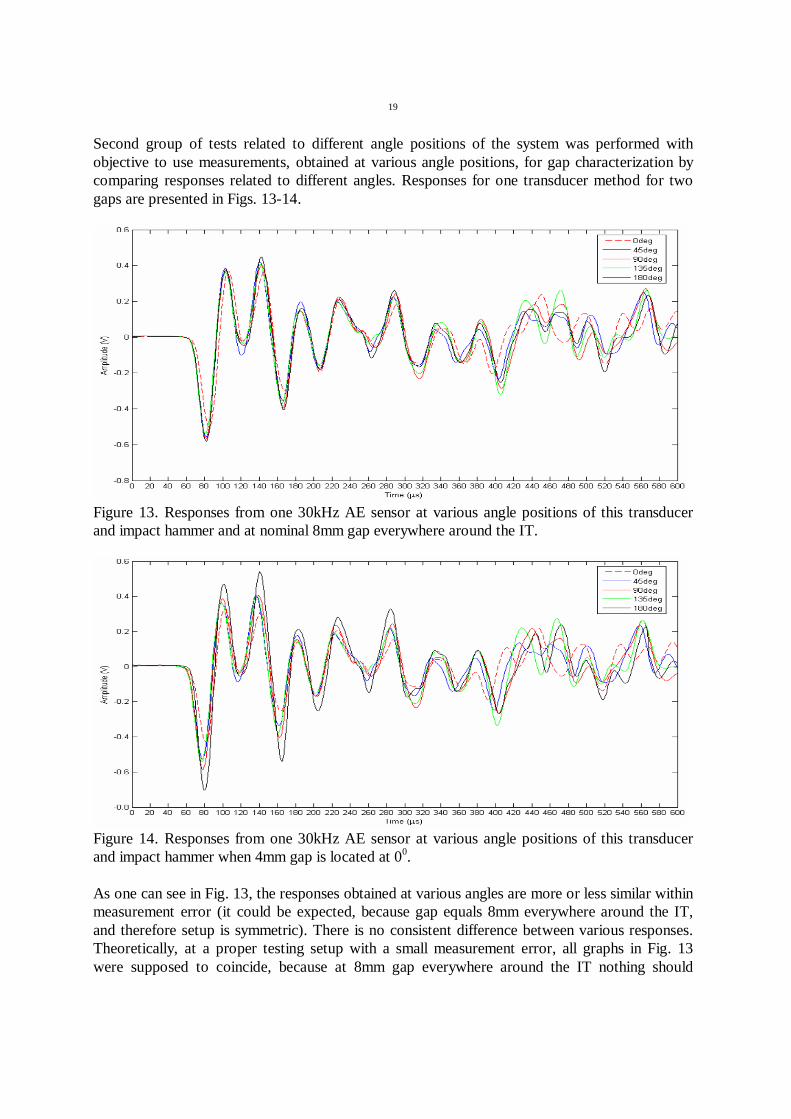
Figure 13. Responses from one 30kHz AE sensor at various angle positions of this transducer and impact hammer and at nominal 8mm gap everywhere around the IT.
Figure 14. Responses from one 30kHz AE sensor at various angle positions of this transducer and impact hammer when 4mm gap is located at 00. As one can see in Fig. 13, the responses obtained at various angles are more or less similar within measurement error (it could be expected, because gap equals 8mm everywhere around the IT, and therefore setup is symmetric). There is no consistent difference between various responses. Theoretically, at a proper testing setup with a small measurement error, all graphs in Fig. 13 were supposed to coincide, because at 8mm gap everywhere around the IT nothing should

20
depend on the angle position of testing system. On the other hand, Fig. 14 clearly demonstrates that when 4mm gap is located at 00, responses related to various angle positions of the testing system are quite different. There is a consistent difference between amplitudes of peaks within range 60-300µs, when transducer angle position changes from 0 to 1800. Response with minimum peaks amplitudes (dashed red line) corresponds to 00 angle of testing system, when transducer/hammer orientation coincides with a small gap orientation (see Fig. 4). Response with maximum peaks amplitudes (solid black line) corresponds to 1800 angle position of the testing system, when transducer/hammer orientation is opposite to small gap orientation. At all other angle positions the responses have peaks with intermediate amplitudes. Similar responses were obtained for 15kHz sensor and in two transducers method. All these results demonstrate that testing setup provides data, which allow correlating gap size and position of a small gap more or less consistently with amplitude of the response at different angle positions of the system. It means that results obtained at different angle positions of the setup can probably be used for gap measurement. 4.7 Measured responses for various tubes The last series of experiments was performed using one and two transducers method and different IT samples in order to check how response depends on variations of such parameters as tube shape (e.g. ovality), dimensions (inside diameter and wall thickness), and material properties (microstructure, grain size, inhomogeneities, imperfections, etc). Tests were done using three new different IT samples ##2-4. (The initial IT sample #1 has been used during all previous experiments). Measurements of each new sample ##2-4 were performed for various gaps; for each gap signals from 30kHz AE sensors were digitized, averaged, filtered, and subtracted. Results for two new different IT samples #2 and #4 are presented in Figs. 15-16.
Figure 15. Differences between responses from 30kHz AE sensors for tube #2 at various gaps.

21
Figure 16. Differences between responses from 30kHz AE sensors for tube #4 at various gaps. The goal of these experiments was to check the ability of the system to distinguish various gaps using different tube samples, because IT shape, dimensions, and material characteristics may differ from one tube to another and may even vary in one tube. As one can see in Figs. 15-16, for different new IT samples the differences between amplitudes of responses at various gaps change rather consistently, when gap varies from 8 to 0mm. Analogous results were obtained for 15kHz sensor and in two transducers method. Therefore, it is possible to conclude, that experimental setup gives results, which allow correlating gap size with amplitude of the response for different tube samples. It means that, despite variations in the IT shape, dimensions, and material properties, responses related to various gaps can be distinguished in different tubes. 5. CONCLUSIONS
• The feasibility study was performed to estimate the ability of acoustic low-frequency bending-wave technique to accurately measure air gap between two concentric metal tubes. Method is based on tapping the IT IS by impact hammer, located inside the IT in water, and detecting the response of low-frequency sonic wave transmitted through the air gap and reflected from the OT. The tube wall vibrates as a whole performing the bending (flexural) oscillations and transmitting the sonic waves in the air gap. These waves, propagating within the gap and reflected from the OT, can be detected by a low-frequency high-sensitive acoustic transducer-receiver located inside the IT in water.
• Theoretical analysis predicts that this technique should be very sensitive and probably it may be very useful for measuring air gap between two tubes.
• The major problem is a high level of the background acoustic “noise” - strong signals, related to different waves and multiple reflections within the IT wall. It was suggested to use high resolution analog-to-digital converter and two identical transducers oriented at
22
1800 apart in radial direction and one impact hammer positioned in the middle between them. Such a system should give identical responses, when two gaps facing the opposite transducers are equal. If these gaps are not equal, the responses of transducers will differ. As a result, digitizing signals from two transducers and subtracting one from the other, it probably will be possible to detect the gap-wave and size the gap.
• The second problem is variations in the IT and test system parameters, which affect the received signals. Such IT parameters, as shape (e.g. ovality), wall thickness, diameter, and characteristics of material, may differ from one tube to another and may even vary in one tube. Probes and impact hammer are always positioned with some tolerance and probes cannot be absolutely identical. Averaging, filtering, and cross-correlation should help to separate the responses, carrying information about air gap, from signal variations, generated by changes in the IT and inspection system parameters.
• The experimental setup included specially developed data acquisition software based on MATLAB, 24-Bit digitizer card, 15kHz and 30kHz AE sensors, manual mechanical spring-loaded impact hammer, and tube holder with micrometer. Received signals were averaged, filtered and processed; and their spectra and envelopes were analyzed.
• Sensitivity measurements confirmed calculations and proved that bending-wave technique is extremely sensitive even to very weak sonic waves.
• Unfortunately, the measurement error of experimental setup was pretty large because of low mechanical accuracy, difference between transducers parameters, poor centering and orientation of impact hammer and AE sensors. To decrease the measurement errors, first of all, an electro-magnetic shaker with consistent force output should be employed and the whole mechanical setup should be more accurate. Transducer parameters should be optimized to obtain a high sensitivity and decrease signal distortion. And finally, the most appropriate signal processing methods should be determined and employed.
• Despite all inaccuracies and limitations of the testing system, the setup has been used to analyze correlation between gap size and received signals. Obtained data show that despite low accuracy the bending-wave technique allows correlating gap rather consistently with amplitude and time position of transducer response.
• Series of experiments was performed to determine how changes in the IT and system parameters affect the performance. Tests were done at different transducer offsets, various angle positions of the system, and on a few different IT samples. It was necessary to check ability of the testing system to distinguish different gaps at various probe offsets, at different angle positions of the system, and on different tube samples.
• Obtained data demonstrate that bending-wave technique and experimental setup allow correlating gap size rather consistently with amplitude of the response even at pretty large probe offsets, at different angle positions of the system, and on different tube samples. It means that measuring technique and setup are pretty robust to centering, responses obtained at various angle positions can be used for gap measurement, and gap width can be determined in different tubes.
6. REFERENCES
1. V. A. Shutilov, “Fundamental Physics of Ultrasound”, Gordon and Breach Science Publishers, New York, 1988.
23
2. Nondestructive Testing Handbook. Second Edition. Vol. 7. Ultrasonic Testing. American Society for Nondestructive Testing Inc, 1991.
3. L. D. Landau and E. M. Lifshits, “Theory of Elasticity”, Pergamon Press, Oxford, 1986. 4. D. Pierce, “Acoustics”, McGraw Hill, N-Y, 1981.