ultrasonic nde of solid-state bonds: inertia and friction ...pnagy/publications/nagy and adler, j....
TRANSCRIPT

Journal of Nondestructive Evaluation, Vol. 7, ?Cos. 3/4, 1988
Ultrasonic NDE of Solid-State Bonds: Inertia and Friction Welds
Peter B. Nagy and Laszlo Adler 1
Received April 8, 1988; revised September 2, 1988
This paper discusses a number of special ultrasonic NDE problems of particular interest to inertia and friction welds, but most of the results can be readily applied to other similar or dissimilar solid-state bonds as well. One of the major problems associated with dissimilar bonds is the "blinding" effect of the strong interface reflection caused by the inherent elastic discontinuity at the otherwise flawless boundary. A novel signal-processing technique based on the symmetric part of the boundary reflections from the two opposite sides of the interface is introduced and shown to yield a quantitative measure of boundary imperfection even for very good, apparently flawless bonds. The second problem addressed in this paper is the so-called "cold-weld" effect. As a combined result of heat softening and external pressure, intimate mechanical contact can be achieved without real fusion. Frequency analysis of the reflected ultrasonic signal from such cold-welded areas is shown to be capable of measuring the degree of plastic deformation at the contacting surfaces and, indirectly, to assess interface pressure and temperature. The third problem considered in this paper is the ultrasonic evaluation of the characteristic layered distribution of the grain structure in flawless inertia and friction welds. As an example, the thickness of the heat-affected zone (HAZ) was determined by ultrasonic spectroscopy, and the results were found to be in good agreement with independent optical profile measurements. Furthermore, the HAZ thickness is shown to be strongly correlated to welding pressure, therefore it offers a sensitive indicator for bond quality assessment as well.
KEY WORDS: Inertia friction weld; interface assessment; solid-state bond characterization.
1. I N T R O D U C T I O N
Inertia friction welding is a solid-state joining process which utilizes frictional heat generated be- tween the members to be welded and external axial pressure. The schematic diagram of the friction-weld- ing process is shown in Fig. 1. One part is held stat ionary and the other is rotated (a), then they are pushed together (b). Frictional heating plasticizes a thin surface layer (c) which is extruded from the joint
XThe Ohio State University, Columbus, Ohio 43210.
199
by the axial pressure applied to the workpieces (d). There are two slightly different versions of this bond- ing process usually referred to as inertia and friction welding. In inertia welding, the moving part is mounted on a flywheel capable of storing the large amount of kinetic energy needed to produce the necessary friction heat. When the rotation speed reaches the desired value, the spindle is disconnected from the power source, and immediately the ram moves the spindle axially to force the two workpieces tightly together. In friction welding, the power source continues to drive the spindle while the stationary
0195-9298/88/1200-0199506.00/0©1988 Plenum Publishing Corporation

200 Nagy and Adler
a
b
C
500
~"FLASH" Fig. 1. The friction welding process.
workpiece is pushed lightly against the rotating one. In this version, the rotation and pressure are contin- ued for a predetermined time until the weld interface is properly heated. Finally, rotation is halted as quickly as possible with a spindle brake, and the axial pressure is increased to full strength to com- plete the weld.
Generally, friction welding facilitates more con- trolled heating of the workpieces, therefore it can yield better bonds. In both versions, heat is confined to a relatively thin surface layer. At no time does the material on either side of the interface reach its melting point, even when dissimilar materials with widely different melting points are joined. Even if excessive welding energy were applied, plastic metal would be extruded from the weld zone before it could melt. Figure 2 shows the calculated interface temperature distribution for steel during the inertia welding processJ 1) The perimeter reaches the peak temperature much more rapidly than the center does because of a higher velocity. Heat is conducted to the center from neighboring regions, and the interface temperature reaches its peak value just below the melting point within 0.1-0.2 s (of course, in friction
3000
2500
2000 W
D
1500 w
w 1000
0 .01
3000
, , , , , , , , , i I , ° i i | !
~ j Melt ing Point . . . . . . . . . . . . . .
/ / / /
! i i I I I
.02 .04 .06.080.1 0.2 0.4 0.6 0.81.0
TIME (sec.)
Fig. 2. Calculated interface temperature distribution for steel. (1)
welding, the heating process takes much more time, let us say 20 s).
Welding pressure affects the bonding process directly as well as indirectly through changing the temperature distribution at the interface and its vari- ation with time during the welding process. Figure 3 shows the interface temperature vs. time curves for steel at different welding pressures. (1) Higher pres- sure results in higher temperature, but only for a shorter time, therefore center defects may be ex- pected, especially with large diameter weldments.
I I
2500
E 2000
w D
1500
w
1000
500
°o ; 110 1'5 210 25 TIME (sec.)
Fig. 3. Effect of pressure on temperature distribution. (1)

Sol id State Bonds 201
Similar defects occur at low speed, too, as a result of insufficient heating of the center region.
Mostly peripheral defects can be expected at low pressure. Due to the "friction-hill" effect, the pres- sure distribution across the interface is not uniform, as it is shown in Fig. 4. (2) Since there is no strong lateral restraint at the edges, the deformation pres- sure is inevitably low and coalescence may not occur. Additional defects can include quench or restraint cracks and carbides precipitated at the interface. Lack of surface preparation and poor squareness can be responsible for gross oxide entrapment and lack of bond between surfaces. Improper machine align- ment and inadequate part damping may cause geo- metrical distortions. Most defects can be overcome by careful adjustment of the welding parameters and surface preparation, but detection of such defects necessitates the application of special NDE tech- niques.
Three major NDE problems associated with in- ertia and friction welds are discussed separately in the following three sections. The first section focuses on ultrasonic flaw detection at dissimilar solid-solid interfaces. The second section deals with the ultra- sonic detection and characterization of cold welds, a common type of interface imperfection especially in the center part of inertia welds. Finally, the third section discusses the problem of characterizing the typical sandwich-like layered macrostructure of iner- tia and friction welds by ultrasonic frequency analy- sis.
Pressure
[:)max
Friction-Hill
• , D i a m e t e r ~ ,
Fig. 4. Friction-hill effect for homogeneous compression of a disk with Coulomb friction. (2)
Table 1. Material Combinations Used in this Study
Type Mismatch ~ Materials
Similar
Dissimilar
None Stainless steel 304L-304L
Small Stainless steel ( - 1%) 304L-PH 13-8 Mo Medium Stainless steel-copper ( - 5%) 304L-OFHC Large Stainless steel-aluminum
- 50%) 304L- ALl100 (TW1) 304L-AL6061-T6
~Acoustic impedance mismatch = - - z l - z 2 z l + z 2
2. ULTRASONIC FLAW DETECTION AT DISSIMILAR I N T E R F A C E S
Ultrasonic flaw detection at disimilar interfaces is badly limited by the "blinding" effect of the strong reflections from the otherwise perfect boundary it- self. Table I shows the acoustic impedance mismatch for material combinations used in this study.
Friction welds of similar materials, e.g., stainless steel-stainless steel joints, present no problem for ultrasonic flaw detection, but also do not usually contain gross defects. For slightly dissimilar joints, such as the stainless steel-precipitation-hardened steel combination, the acoustical impedance mis- match is as small as 1%, therefore gross defects can be easily detected. Of course, more dissimilar joins are much more difficult to inspect for interface flaws. The impedance mismatch ranges from a low 5% in the case of stainless steel-copper to a very high 50%
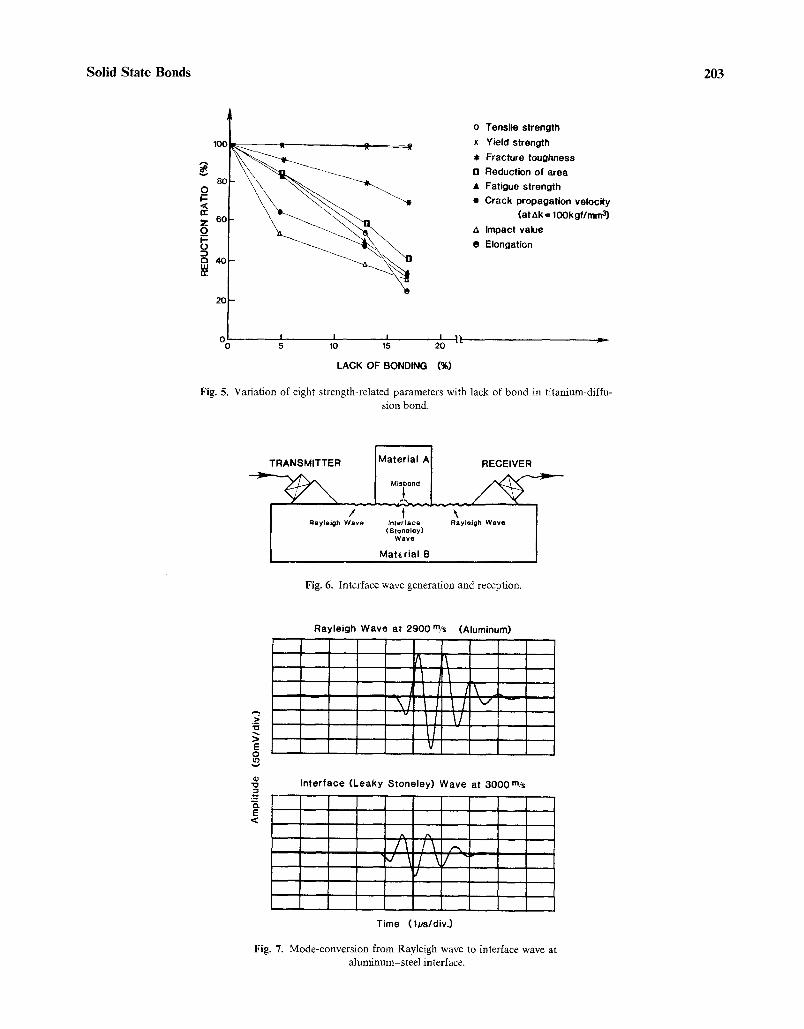
for stainless steel-aluminum. How do these inherent reflections compare to the back-scattered signals from small defects to be detected? It is impossible to establish a general detection threshold for ultrasonic NDE of different solid-state bonds with widely dif- ferent types of defects. Even on an individual basis, assessment of the adverse effect of a certain bound- ary imperfection on bond quality is greatly compli- cated by the large number of possible quality param- eters and the lack of comprehensive experimental data. As an example, Fig. 5 shows the variation of eight strength-related parameters with lack of bond- ing in titanium diffusion bonds. (3) (To the best of our knowledge, similar comprehensive study has not yet been carried out for friction welds). Different param- eters are affected very differently. For example, ten- sile strength seems to be not affected at all by small partial lack of bond, while impact strength decreases by as much as 70% due to only 17% lack of bond. As
202 Nagy and Adler
an average, 2-3% lack of bond does appreciably reduce bond quality, therefore it should be detected by ultrasonic inspection.
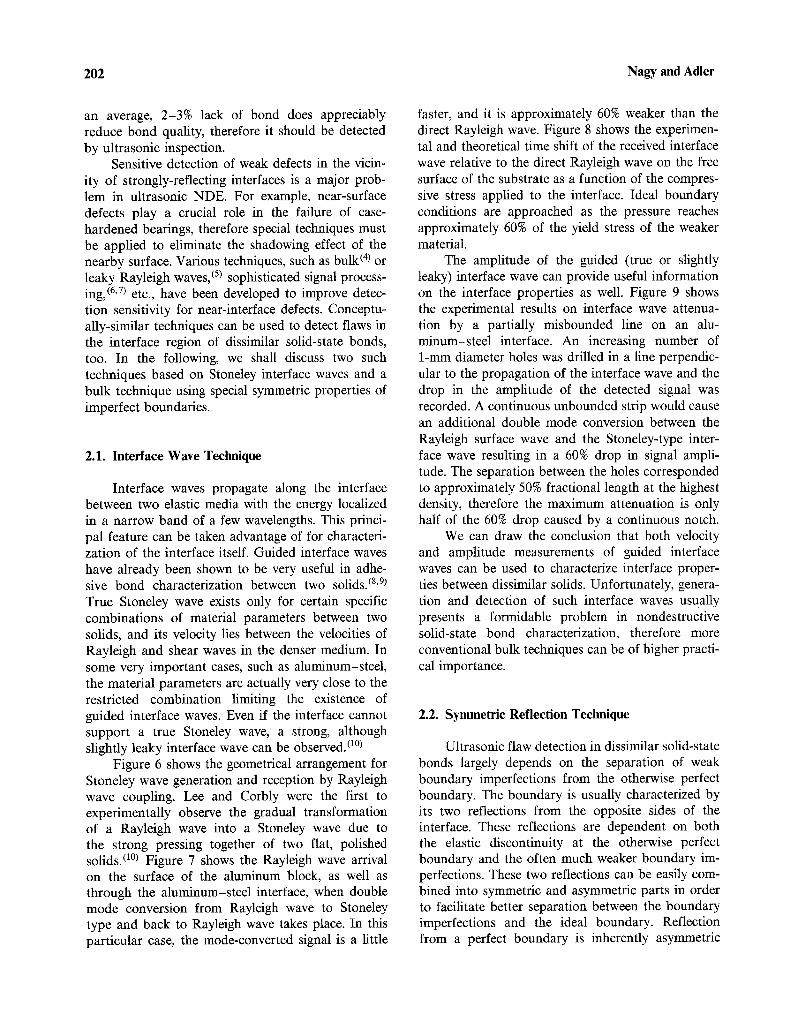
Sensitive detection of weak defects in the vicin- ity of strongly-reflecting interfaces is a major prob- lem in ultrasonic NDE. For example, near-surface defects play a crucial role in the failure of case- hardened bearings, therefore special techniques must be applied to eliminate the shadowing effect of the nearby surface. Various techniques, such as bulk (4~ or leaky Rayleigh waves, (5) sophisticated signal process- ing, (6,v) etc., have been developed to improve detec- tion sensitivity for near-interface defects. Conceptu- ally-similar techniques can be used to detect flaws in the interface region of dissimilar solid-state bonds, too. In the following, we shall discuss two such techniques based on Stoneley interface waves and a bulk technique using special symmetric properties of imperfect boundaries.
2.1. Interface Wave Technique
Interface waves propagate along the interface between two elastic media with the energy localized in a narrow band of a few wavelengths. This princi- pal feature can be taken advantage of for characteri- zation of the interface itself. Guided interface waves have already been shown to be very useful in adhe- sive bond characterization between two solids. (8'9) True Stoneley wave exists only for certain specific combinations of material parameters between two solids, and its velocity lies between the velocities of Rayleigh and shear waves in the denser medium. In some very important cases, such as aluminum-steel, the material parameters are actually very close to the restricted combination limiting the existence of guided interface waves. Even if the interface cannot support a true Stoneley wave, a strong, although slightly leaky interface wave can be observed. (1°~
Figure 6 shows the geometrical arrangement for Stoneley wave generation and reception by Rayleigh wave coupling. Lee and Corbly were the first to experimentally observe the gradual transformation of a Rayleigh wave into a Stoneley wave due to the strong pressing together of two flat, polished solids. 0°) Figure 7 shows the Rayleigh wave arrival on the surface of the aluminum block, as well as through the aluminum-steel interface, when double mode conversion from Rayleigh wave to Stoneley type and back to Rayleigh wave takes place. In this particular case, the mode-converted signal is a little
faster, and it is approximately 60% weaker than the direct Rayleigh wave. Figure 8 shows the experimen- tal and theoretical time shift of the received interface wave relative to the direct Rayleigh wave on the free surface of the substrate as a function of the compres- sive stress applied to the interface. Ideal boundary conditions are approached as the pressure reaches approximately 60% of the yield stress of the weaker material.
The amplitude of the guided (true or slightly leaky) interface wave can provide useful information on the interface properties as well. Figure 9 shows the experimental results on interface wave attenua- tion by a partially misbounded line on an alu- minum-steel interface. An increasing number of 1-mm diameter holes was drilled in a line perpendic- ular to the propagation of the interface wave and the drop in the amplitude of the detected signal was recorded. A continuous unbounded strip would cause an additional double mode conversion between the Rayleigh surface wave and the Stoneley-type inter- face wave resulting in a 60% drop in signal ampli- tude. The separation between the holes corresponded to approximately 50% fractional length at the highest density, therefore the maximum attenuation is only half of the 60% drop caused by a continuous notch.
We can draw the conclusion that both velocity and amplitude measurements of guided interface waves can be used to characterize interface proper- ties between dissimilar solids. Unfortunately, genera- tion and detection of such interface waves usually presents a formidable problem in nondestructive solid-state bond characterization, therefore more conventional bulk techniques can be of higher practi- cal importance.
2.2. Symmetric Reflection Technique
Ultrasonic flaw detection in dissimilar solid-state bonds largely depends on the separation of weak boundary imperfections from the otherwise perfect boundary. The boundary is usually characterized by its two reflections from the opposite sides o f the interface. These reflections are dependent on both the elastic discontinuity at the otherwise perfect boundary and the often much weaker boundary im- perfections. These two reflections can be easily com- bined into symmetric and asymmetric parts in order to facilitate better separation between the boundary imperfections and the ideal boundary. Reflection from a perfect boundary is inherently asymmetric
Solid State Bonds 203
10(
8O o= I- < rr Z 60 o_ o o 40 w
0 0
20
i i i i 1l- 5 10 15 20
LACK OF BONDING (%)
o Tensile strength x Yield strength
Fracture toughness B Reduction of area ,t Fatigue strength • Crack propagation velocity
(at ~k = lOOkgf/mm 3) A Impact value • Elongation
Fig. 5. Variation of eight strength-related parameters with lack of bond in titanium-diffu- sion bond.
TRANSMITTER [ Material A 1 RECEIVER
°°
/ t \ Ray le igh Wave In ter feee Ray le igh Wave
(S tone ley ) Wave
Mate rial B
Fig. 6. Interface wave generation and reception.
,>
E o
m
E <
Rayleigh Wave at 2900 m/s (Aluminum)
I I \ J. \ / I I 1.1 ~ -
v I / V
V Interface (Leaky Stoneley) Wave at 3000 m/s
A A , - , " \ 1 \ / "
I
Time ( lps/div.)
Fig. 7. Mode-conversion from Rayleigh wave to interface wave at alun'finum-steel interface.

204 Nagy and Adler
6 0 0
5 0 0
' ~ 4 0 0
"~ 3 0 0
• ~- 2 0 0 I--
1 0 0
A A
A x x
x
~ ,~ Zk & & ~. ,~ A ~. A ~, .~ .e., ~ A I - T I P R E D I C T E D
x x x x x x x x x x * x x ~ A I - F e P R E D I C T E D
T I - F e P R E D I C T E D o o o o
0 0
0 0
X
X
o • x o
o o
0 0
0
o T i - F e
x A I - F e
& A I - T I
I I I I I I 17 i I ( .1 .2 .3 .4 . .6 . .8 .9 1.0
Applied Compressive Stress (Normalized)
Fig. 8. Experimental and theoretical time shift between the direct Rayleigh surface wave and the guided interface wave as a function of compressive stress normalized to the yield stress for the weaker material. (10)
Imperfect Dissimilar Interface
R a = ~
/ \ R1- R2 R1 + R2
2 Rs= 2"
/ Perfect Dissimilar Interface
i zl I Ra -'5 ~-----Ra
\ Imperfect Similar Interface
Fig. 10. Symmetric-asymmetric separation of interface pro- perties.
Bonded Area Holes
R a y l e i g h 5 t o n e l e y R a y l e i g h W a v e W a v e W a v e
1 0 0
9 0
8 0
7 0
6 0 "O
3 : = 5 0 e~
E < 4O
> 3o
a~ n,.
2 0
Continuous Strip
Number of Holes
Fig. 9. Interface wave attentuation by a partially misbounded line on an a luminum-steel interface.
since the step function in the elastic properties of a dissimilar bond exhibits different signs from the op- posite directions, i.e., a downward step in the acous- tic impedance from one side looks like an upward one from the other side. At the same time, most boundary imperfections, such as lack of bonding, porosity or inclusions, surface roughness, etc., will destroy this asymmetric nature and look more or less the same from both sides, therefore they contribute to the symmetric component only.
Figure 10 shows the basic concept of the sug- gested signal-processing technique. The feasibility of such a simple separation depends on the mostly symmetric nature of boundary imperfections. Un- bounded areas and cavities always have higher com- pliance than both parts of the dissimilar bond, there- fore they look more or less symmetric from both sides. Very dense inclusions appear as a higher acoustic impedance region from both sides, therefore they introduce strong symmetric reflection, too. Sometimes, but not very often, the imperfect bound- ary region happens to be an intermediate transition causing reduced reflection from both sides. Even in such unusual cases, the imperfection often violates the true asymmetric nature of the perfect interface and results in a measurable symmetric reflection.
Let us demonstrate the above technique through the widely-used quasi-static model for imperfect in- terfaces. (n) For a plane wave incident normally on the interface, use of effective boundary conditions
Solid State Bonds 205
leads to a reflection coefficient
Z 2 - Z l ( m°°2) j ~ (Z2Z1 Z 2 + Z 1 1 - + Z2-gZ~
R I = m ~ 2
1--~---+ Z2-~ Z 1 I~ + m
m)
(1)
where ~0 denotes the angular frequency, and m and are the effective mass per unit area and the interra- cial stiffness, respectively. By changing the indices of Z t and Z 2. The asymmetric and symmetric terms can be written as follows
Ra - m
m ~ 2
Z 2 _ Z1 1 - 4K Z 2 + Z l m ~ 2 j o a ( Z 2 Z l )
1 - - 4 7 + Z 2-+ Z 1 ~ + m
(2)
and
joa Z2Z1 rn ) Z 2 7 Z 1 ( -K
R, = (3) m o o 2 J o o ( a 2 a l ) 1 ~ -I- Z ; - ~ Z 1 ~ + m
Equations (2) and (3) can be further simplified for low frequencies when oa 2 << 4 x / m
.R a - - Z 2 - Z 1
Z2 + Z1 (4)
and
jo: Z2 Z1 rn ) z 5 z, ( (s)
or in a more convenient form
R, j¢o Z 2 Z 1 - - mK - h: Z 2 + Z l (6)
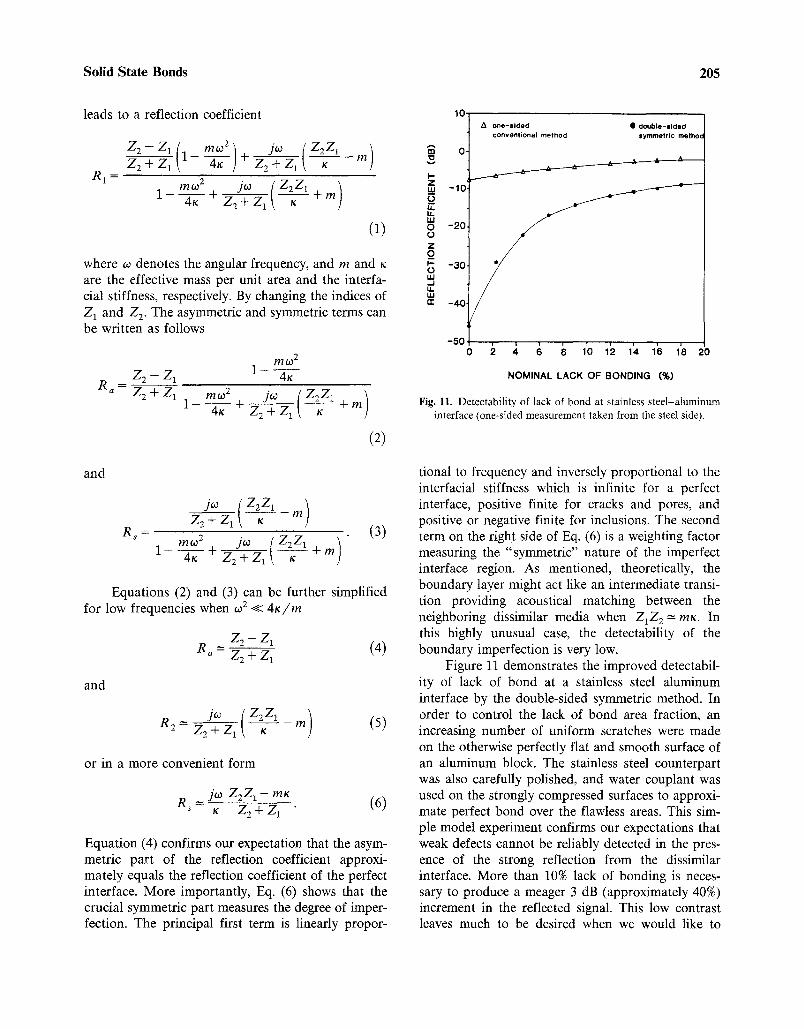
Equation (4) confirms our expectation that the asym- metric part of the reflection coefficient approxi- mately equals the reflection coefficient of the perfect interface. More importantly, Eq. (6) shows that the crucial symmetric part measures the degree of imper- fection. The principal first term is linearly propor-
10.
O. "0
i -101 _o LL. 14. LU - 2 0 oo o_ P" -30 (3 LU .-J U. LU rr - 4 0
-50 0
one -s i ded • double-slded conventional method symmetric methoc
f x
NOMINAL LACK OF BONDING (%)
Fig. l l . Detectability of lack of bond at stainless steel-aluminum interface (one-sided measurement taken from the steel side).
tional to frequency and inversely proportional to the interfacial stiffness which is infinite for a perfect interface, positive finite for cracks and pores, and positive or negative finite for inclusions. The second term on the right side of Eq. (6) is a weighting factor measuring the "symmetric" nature of the imperfect interface region. As mentioned, theoretically, the boundary layer might act like an intermediate transi- tion providing acoustical matching between the neighboring dissimilar media when Z1Z 2 --m~. In this highly unusual case, the detectability of the boundary imperfection is very low.
Figure 11 demonstrates the improved detectabil- ity of lack of bond at a stainless steel-aluminum interface by the double-sided symmetric method. In order to control the lack of bond area fraction, an increasing number of uniform scratches were made on the otherwise perfectly flat and smooth surface of an aluminum block. The stainless steel counterpart was also carefully polished, and water couptant was used on the strongly compressed surfaces to approxi- mate perfect bond over the flawless areas. This sim- ple model experiment confirms our expectations that weak defects cannot be reliably detected in the pres- ence of the strong reflection from the dissimilar interface. More than 10% lack of bonding is neces- sary to produce a meager 3 dB (approximately 40%) increment in the reflected signal. This low contrast leaves much to be desired when we would like to
206 Nagy and Adler
0.6'
0.5.
A
0.4 u. u.
0 0.3. Z _o
0.2.
,,=, ee
0.1.
O' i i i i i
• S y m m e t r i c per t A A s y m m e t r i c
per t
A A A
2 0
NOMINAL LACK OF BONDING (%)
Fig. 12. Symmetric and asymmetric reflection coefficients as a function of lack of bond at a stainless steel-aluminum interface.
detect small lack of bounds as weak as 1-2%. The results of the double-sided symmetric method are also shown in Fig. 11. The relative contrast sharply improved from approximately 0.3 dB/percent to al- most 10 dB/percent in the most important lower range of lack of bonding.
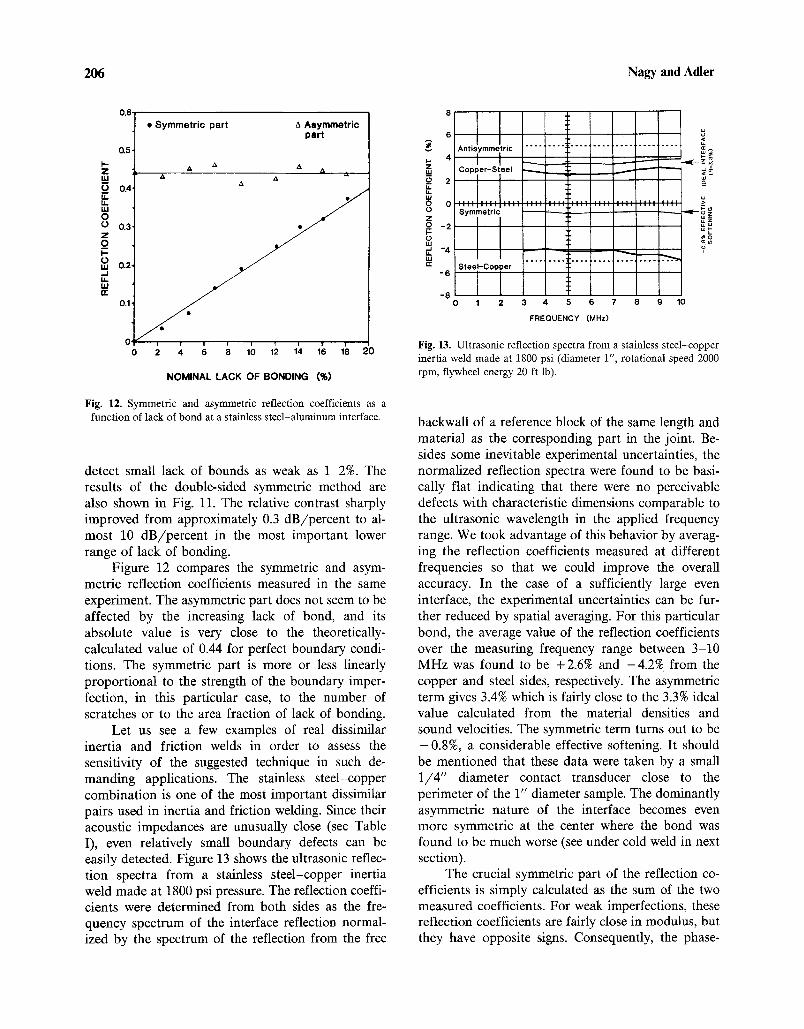
Figure 12 compares the symmetric and asym- metric reflection coefficients measured in the same experiment. The asymmetric part does not seem to be affected by the increasing lack of bond, and its absolute value is very close to the theoretically- calculated value of 0.44 for perfect boundary condi- tions. The symmetric part is more or less linearly proportional to the strength of the boundary imper- fection, in this particular case, to the number of scratches or to the area fraction of lack of bonding.
Let us see a few examples of real dissimilar inertia and friction welds in order to assess the sensitivity of the suggested technique in such de- manding applications. The stainless steel-copper combination is one of the most important dissimilar pairs used in inertia and friction welding. Since their acoustic impedances are unusually close (see Table I), even relatively small boundary defects can be easily detected. Figure 13 shows the ultrasonic reflec- tion spectra from a stainless steel-copper inertia weld made at 1800 psi pressure. The reflection coeffi- cients were determined from both sides as the fre- quency spectrum of the interface reflection normal- ized by the spectrum of the reflection from the free
:]1 ~ Antiiymmeltric
4 -----. Copper-Steel --..._.
_O I 2
o S y m m e t r i c
z I I
o= ,,-J -4 J I
- 8 SteeiC°p[er
-8 0 1 2 3 4 5 6
4 .~¢__._z ~
~ u J
~ o m~ d
i 7 8 9 10
FREQUENCY (MHz)
Fig. 13. Ultrasonic reflection spectra from a stainless steel-copper inertia weld made at 1800 psi (diameter 1", rotational speed 2000 rpm, flywheel energy 20 ft lb).
backwall of a reference block of the same length and material as the corresponding part in the joint. Be- sides some inevitable experimental uncertainties, the normalized reflection spectra were found to be basi- cally flat indicating that there were no perceivable defects with characteristic dimensions comparable to the ultrasonic wavelength in the applied frequency range. We took advantage of this behavior by averag- ing the reflection coefficients measured at different frequencies so that we could improve the overall accuracy. In the case of a sufficiently large even interface, the experimental uncertainties can be fur- ther reduced by spatial averaging. For this particular bond, the average value of the reflection coefficients over the measuring frequency range between 3-10 MHz was found to be + 2.6% and -4.2% from the copper and steel sides, respectively. The asymmetric term gives 3.4% which is fairly close to the 3.3% ideal value calculated from the material densities and sound velocities. The symmetric term turns out to be -0 .8%, a considerable effective softening. It should be mentioned that these data were taken by a small 1 / 4 " diameter contact transducer close to the perimeter of the 1" diameter sample. The dominantly asymmetric nature of the interface becomes even more symmetric at the center where the bond was found to be much worse (see under cold weld in next section).
The crucial symmetric part of the reflection co- efficients is simply calculated as the sum of the two measured coefficients. For weak imperfections, these reflection coefficients are fairly close in modulus, but they have opposite signs. Consequently, the phase-
0 . 8 2.0
0 . 6 . . . . . . . . . . . . . . . . . . . . . . . . . . . . . . . . . . . . . . . . . . . . . . . . . .
~. 0,2 LU 0
0 z _0 t~ -0.2
- 0 . 4
(RAI_St } =0.460
{Rst_AI) = -0.498
-0.6
-0,8 0 1 2 3 4 5 6 7 8 9 10
FREQUENCY (MHz)
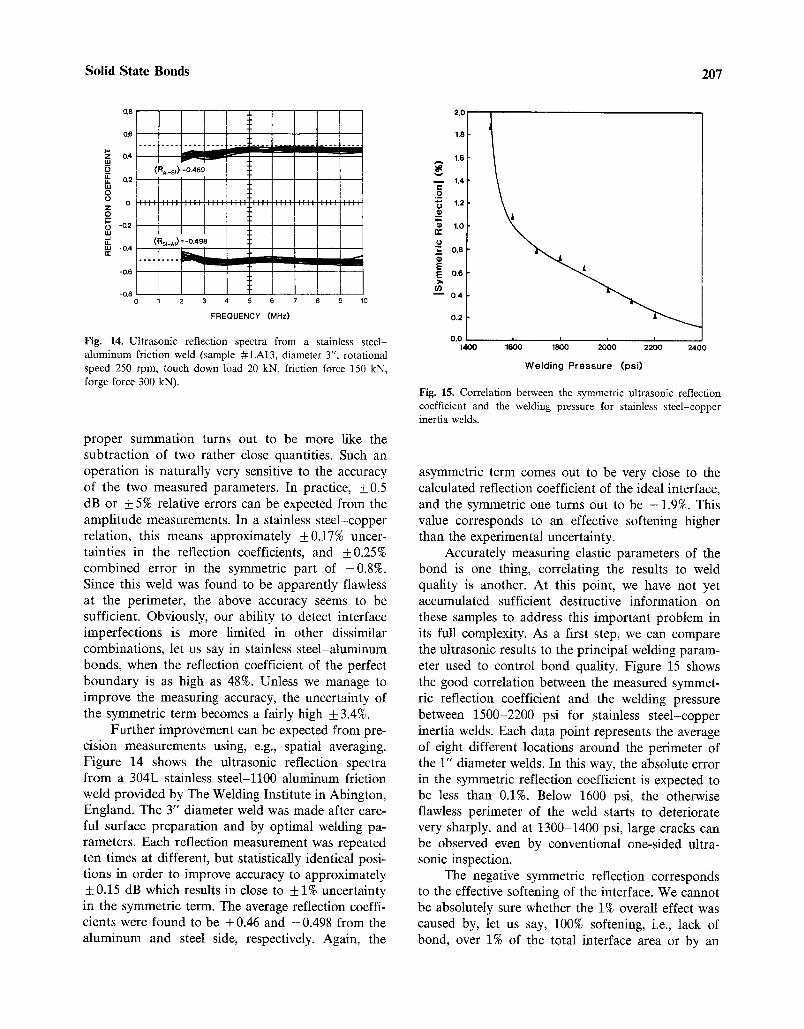
Fig. 14. Ultrasonic reflection spectra from a stainless steel- aluminum friction weld (sample #LA13, diameter 3", rotational speed 250 rpm, touch down load 20 kN, friction force 150 kN, forge force 300 kN).
proper summation turns out to be more like the subtraction of two rather close quantities. Such an operation is naturally very sensitive to the accuracy of the two measured parameters. In practice, _+0.5 dB or + 5% relative errors can be expected from the amplitude measurements. In a stainless steel-copper relation, this means approximately _+0.17% uncer- tainties in the reflection coefficients, and _+0.25% combined error in the symmetric part of -0.8%. Since this weld was found to be apparently flawless at the perimeter, the above accuracy seems to be sufficient. Obviously, our ability to detect interface imperfections is more limited in other dissimilar combinations, let us say in stainless steel-aluminum bonds, when the reflection coefficient of the perfect boundary is as high as 48%. Unless we manage to improve the measuring accuracy, the uncertainty of the symmetric term becomes a fairly high + 3.4%.
Further improvement can be expected from pre- cision measurements using, e.g., spatial averaging. Figure 14 shows the ultrasonic reflection spectra from a 304L stainless steel-ll00 aluminum friction weld provided by The Welding Institute in Abington, England. The 3" diameter weld was made after care- ful surface preparation and by optimal welding pa- rameters. Each reflection measurement was repeated ten times at different, but statistically identical posi- tions in order to improve accuracy to approximately _+_ 0.15 dB which results in close to + 1% uncertainty in the symmetric term. The average reflection coeffi- cients were found to be + 0.46 and -0.498 from the aluminum and steel side, respectively. Again, the
1.8
0.2
1.6
m 1.4
1.2 ¢1
Q) 1.0 n,-
'7- 0,8
E E O.e
0 4
0.0 1400
i i i I
1600 1800 2O0O 2200 2 4 0 0
Welding Pressure (psi)
Solid State Bonds 207
Fig. 15. Correlation between the symmetric ultrasonic reflection coefficient and the welding pressure for stainless steel-copper inertia welds.
asymmetric term comes out to be very close to the calculated reflection coefficient of the ideal interface, and the symmetric one turns out to be -1.9%. This value corresponds to an effective softening higher than the experimental uncertainty.
Accurately measuring elastic parameters of the bond is one thing, correlating the results to weld quality is another. At this point, we have not yet accumulated sufficient destructive information on these samples to address this important problem in its full complexity. As a first step, we can compare the ultrasonic results to the principal welding param- eter used to control bond quality. Figure 15 shows the good correlation between the measured symmet- ric reflection coefficient and the welding pressure between 1500-2200 psi for stainless steel-copper inertia welds. Each data point represents the average of eight different locations around the perimeter of the 1" diameter welds. In this way, the absolute error in the symmetric reflection coefficient is expected to be less than 0.1%. Below 1600 psi, the otherwise flawless perimeter of the weld starts to deteriorate very sharply, and at 1300-1400 psi, large cracks can be observed even by conventional one-sided ultra- sonic inspection.
The negative symmetric reflection corresponds to the effective softening of the interface. We cannot be absolutely sure whether the 1% overall effect was caused by, let us say, 100% softening, i.e., lack of bond, over 1% of the total interface area or by an

208 Nagy and Adler
evenly-distributed 1% softening over the whole cross-section, or by some combination of these limit- ing cases. On the other hand, fracture surfaces of these apparently flawless inertia welds indicate that failure occurs always in the softer (copper) material, but very close to the interface. The presence of this seemingly continuous weak boundary layer indicates that the measured effecting softening is due to a relatively evenly distributed effect rather than to lack of bond at a small fraction of the interface.
3. ULTRASONIC CHARACTERIZATION OF COLD WELDS
This section will focus on the ultrasonic detec- tion and quantitative characterization of cold welds. Cold weld is a fairly common boundary imperfection in inertia and, to a smaller degree, in friction welds, as well as in diffusion bonds or resistance welds. It occurs as a combined result of strong compressive stress and heating at the interface when the elevated temperature is not high enough or the elapsed time is not long enough to produce good bond, but at least one part of the joint is softened enough by the heat to reach plastic deformation at that particular pres- sure. The resulting intimate mechanical contact between the compressed surfaces produces small re- flection and high transmission, therefore the bond appears to be flawless for conventional ultrasonic inspection, but the joint strength is greatly reduced by the lack of proper fusion.
As an example, Fig. 16 shows the reflection and transmission profiles from a 1" diameter stainless steel-copper inertia weld made at 1600 psi axial pressure when the center part of the weld exhibits a weak form of cold weld. The shaded areas indicate the cold-weld location. Figure 17 shows the much stronger effect at 2000 psi, when the reflection from the center part is almost as low as that from the properly welded perimeter, but the fracture surface of the weld indicates no bonding at all within a 10-mm diameter area at the center. This effect can be readily explained by Figs. 2, 3, and 4. The friction heat is generated mainly at the perimeter, while the center part is heated much more slowly by conduc- tion. The copper is a very good heat-conducting soft material with a relatively low melting point around 1080°C, while the stainless steel is a poorer heat-con- ducting, less ductile material with a higher melting point of about 1500°C. At high welding pressures, the hot, softened copper is almost instantly extruded
10 [ A TRANSMISSION • REFLECTION
-15
~>_
-40 0 1 2 3 4 5 6 7 8 9 10 11 12 13
Radius (mm)
Fig. 16. Reflection and transmission profiles from a 1" diameter, 1600 psi stainless steel-copper inertia weld at 10 MHz (striped area is "cold weld").
from the interface region leaving the center part of the stainless steel too cold to form good bond. The common occurrence of this type of defect in stainless steel-copper inertia welds is well known, 02~ and the characteristic ringlike ultrasonic reflection profile can be easily explained by the cold-weld effect. As shown in Fig. 4, the axial pressure has a maximum at the center of the weld and decreases toward the perime-
10 i f Z~ TRANSMISSION • REFLECTION
2 . ~ ,., A .-. ,L ~ & ,x -10
<
¢> 25~ ' e~3~1~ . . " ~- _3o I_ - . .
-40 0 1 2 3 4 5 6 7 8 9 10 11 12 13
Radius (mm)
Fig. 17. Reflection and transmission profiles from a 1" diameter, 2000 psi stainless steel-copper inertia weld at 10 MHz (striped area is "cold weld").

Solid State Bonds 209
ter, therefore the cold-welded area is limited to the center part. Furthermore, the ultrasonic contrast pro- duced by the cold-weld defect becomes weaker at higher pressures when more extensive plastic defor- mation results in a more intimate mechanical contact between the otherwise unbounded surfaces.
From numerous imperfect boundary models, Haines' model for plastic deformation of contacting rough surfaces seems to be the best suited for cold welds. (13) The schematic diagram of plastic contact between flat, rough surfaces is shown in Fig. 18. For any two real surfaces, the initial contact area com- prises a number of isolated islands at the highest points above the mean planes of the rough surfaces. Upon applying a compressive stress s, the apparent contact area A, increases via plastic flow in one or both materials at the contacting peaks. Haines de- rived very simple formulae for the ultrasonic reflec- tion R and transmission T coefficients for interfaces between similar material. Although Haines derived his final formulae for similar interfaces only, his approach can be readily applied to the more general dissimilar case as well.
and
To i~0
1 + ~ - (7)
i(.0 Ro f]
R (s) l + - f f
where R 0 and T o denote the reflection and transmis- sion coefficients of the perfect interface. The fre- quency dependence of both coefficients is given by a single characteristic angular frequency ~2 which in- creases with pressure:
s 14c a = Pm? II (9)
where Pm is the flow pressure, f is the average radius of the contact areas, and c is the sound velocity, f is a function of the normalized applied pressure s / p m and the combined rms roughness h = (hi z + h2) 1/2 of the contacting surfaces. Haines derived the following approximate formula for the mean contact radius f
f -- ~---7(3.48 h+4.69 microns) (10)
••--Mean Separation
Softer Haa~derei;I-~ ~ v ~ ~ r i a l
( ~ ~ Initial Contacts
i ~ ~COMBINED SURFACE ROUGHNESS h'~ ~ , h 2 h=lh~+h221 '/2
\
Applied Stress
t Plastic Flow
at= A t (contact area)
Fig. 18. Plastic contact between flat, rough surfaces.
where t is the mean separation of the rough surfaces normalized to h. For normally-distributed surfaces, t can be determined from the probability function:
, lz [; l Pm ~ e x p - dt (11)
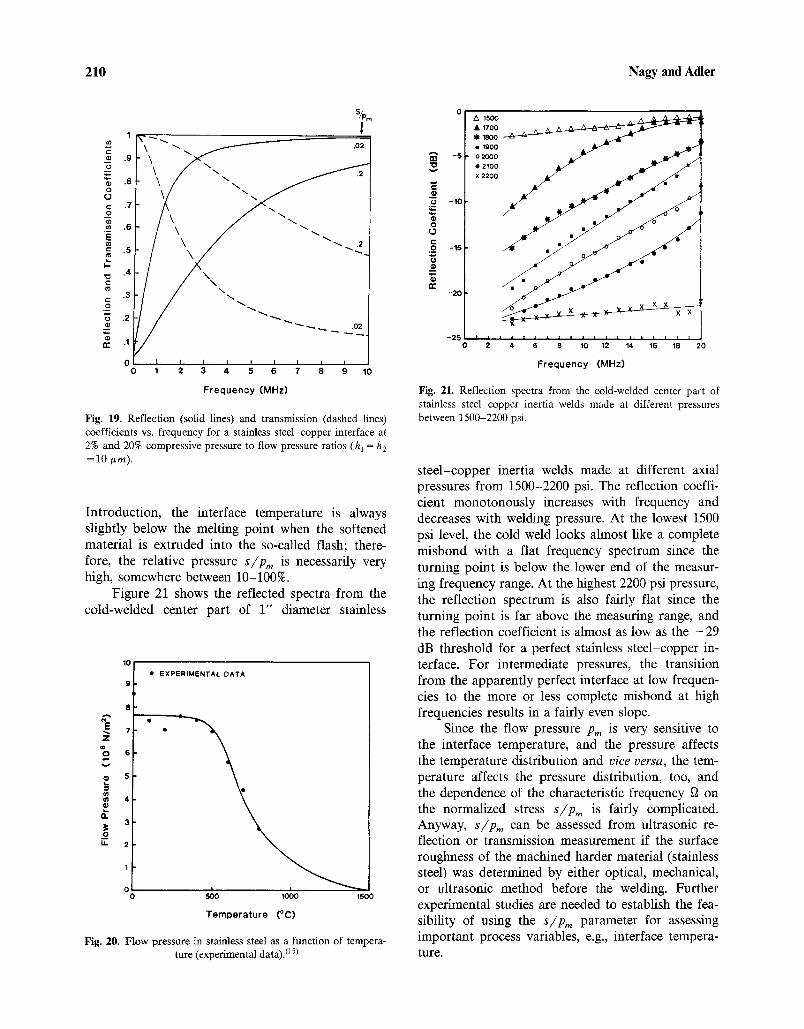
Figure 19 shows the ultrasonic reflection and transmission coefficients of a stainless steel-copper interface as a function of frequency. The reflection increases and the transmission decreases with fre- quency, and the turning point f~ gets higher with increasing compressive stress. These conclusions were experimentally confirmed by Woldridge (13) and by Arakawa. O4) Although Haines' approximations break down at high pressures above 20-30% of the flow stress, it is obvious that only much higher relative stresses can result in the very "strong" cold welds often observed in inertia welds. At the same time, the welding pressure is usually about 2000 psi, roughly 2% of the flow stress in most steels at room tempera- ture. This suggests that the interface temperature plays a principal role in the formation of cold welds. Figure 20 shows the flow pressure of stainless steel as a function of temperature. (15) As pointed out in the
210 Nagy and Adler
m
¢..) .7
"~ .6
~¢ .5
.~ .4
.3
\ ~. ~ ~ .02
/ \, / " '-. / \ / " ' - . 2
/ Y, / / ".. / / " - - - . .
~ _..0_2
0 I I I I I I I I I 0 1 2 3 4 5 6 7 8 9 10
F r e q u e n c y (MHz)
Fig. 19. Reflection (solid lines) and transmission (dashed lines) coefficients vs. frequency for a stainless steel-copper interface at 2% and 20% compressive pressure to flow pressure ratios (h 1 = h E =10/~m).
Introduction, the interface temperature is always slightly below the melting point when the softened material is extruded into the so-called flash; there- fore, the relative pressure s / p m is necessarily very high, somewhere between 10-100%.
Figure 21 shows the reflected spectra from the cold-welded center part of 1" diameter stainless
E
%
==
o~
O
10
9 q
8
7
6
5
4
3
2
1
0
• EXPERIMENTAL DATA
500 1000 1500
T e m p e r a t u r e (°C)
Fig. 20. Flow pressure in stainless steel as a function of tempera- ture (experimental data). 05)
-5
i_~ - l o == 8
-15
-20
-25
A 1500 . . ^ ~
x 2200 ~ ~ ~ • •
F r e q u e n c y (MHz)
Fig. 21. Reflection spectra from the cold-welded center part of stainless steel-copper inertia welds made at different pressures between 1500-2200 psi.
steel-copper inertia welds made at different axial pressures from 1500-2200 psi. The reflection coeffi- cient monotonously increases with frequency and decreases with welding pressure. At the lowest 1500 psi level, the cold weld looks almost like a complete misbond with a flat frequency spectrum since the turning point is below the lower end of the measur- ing frequency range. At the highest 2200 psi pressure, the reflection spectrum is also fairly flat since the turning point is far above the measuring range, and the reflection coefficient is almost as low as the - 2 9 dB threshold for a perfect stainless steel-copper in- terface. For intermediate pressures, the transition from the apparently perfect interface at low frequen- cies to the more or less complete misbond at high frequencies results in a fairly even slope.
Since the flow pressure Pm is very sensitive to the interface temperature, and the pressure affects the temperature distribution and vice versa, the tem- perature affects the pressure distribution, too, and the dependence of the characteristic frequency ~ on the normalized stress s i p m is fairly complicated. Anyway, s,/pm can be assessed from ultrasonic re- flection or transmission measurement if the surface roughness of the machined harder material (stainless steel) was determined by either optical, mechanical, or ultrasonic method before the welding. Further experimental studies are needed to establish the fea- sibility of using the s i p m parameter for assessing important process variables, e.g., interface tempera- ture.

Solid State Bonds 211
BOND LINE
BASE
RECRYSTALLIZED ZONE
_ _ AXIS OF ROTATION
\ BASE METAL
RECRYSTALLIZED ZONE
DYNAMICALLY RECRYSTALLIZED
ZONE
Fig. 22. Schematic picture of the typical grain structure in inertia and friction welds.
4. MACROSTRUCTURE ASSESSMENT
One of the most challenging problems of ultra- sonic NDE of solid-state bonds is the characteriza- tion of the macrostructure (and possible micro- structure, too) of flawless joints. Although the bond quality is not necessarily related to linear elastic parameters which are accessible by ultrasonic tech- niques in the low-MHz frequency range, we can study the resulting grain structure in order to find indirect indications of bond quality. For example, Fig. 22 shows the schematic picture of the typical layered, sandwich-like grain structure of inertia and friction welds. This is, of course, a very rough model since there are no statistically homogeneous layers in the actual welds, although there are more or less separable regions of characteristic grain structures. Furthermore, the thickness of these layers changes with radial position, usually they become thicker closer to the periphery. Another complication is the appearance of a ferrite layer in the vicinity of the bond line at the perimeter where the cooling is slower due to the extruded hot flash material. This ferrite layer moves outward with increasing pressure and even completely disappears at the highest pressures when the welding process is the fastest.
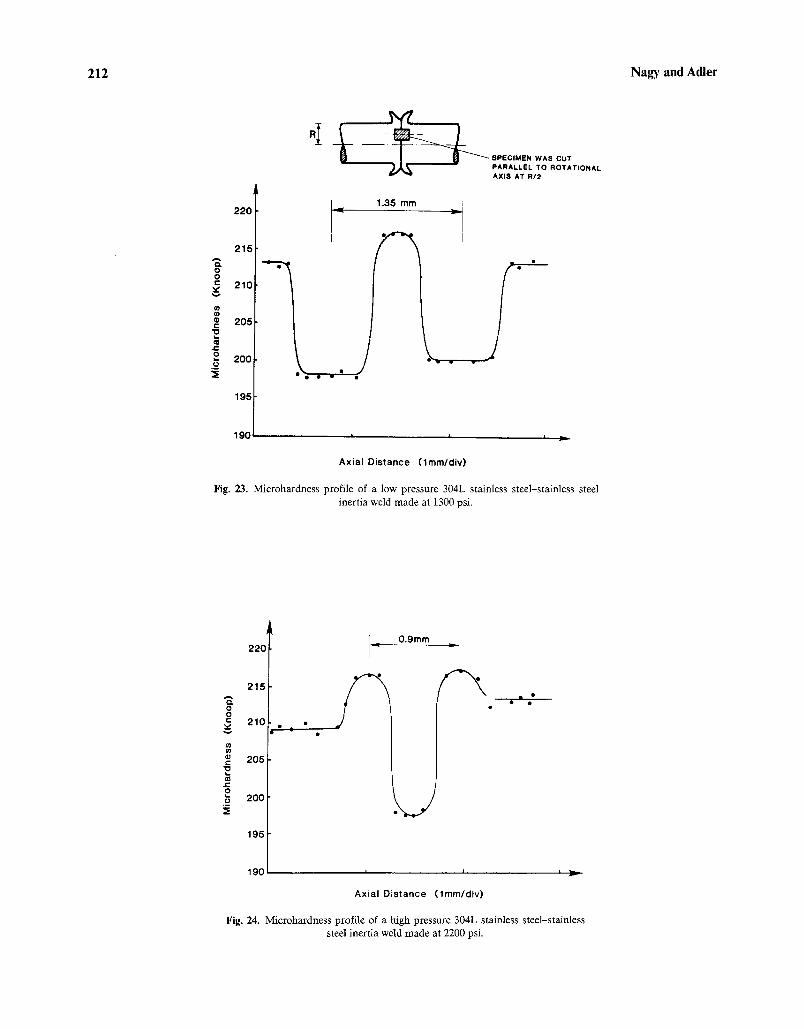
Figure 23 shows the microhardness profile of a relatively low 1300 psi pressure 304L stainless steel- stainless steel inertia weld half way between the axis and the perimeter. The hardness drops deeply in the heat-affected zone where metal flow is significant and slow recrystallization takes place. There is a thin
hardened region around the bond line caused partly by the smaller grain size in the dynamically-recrystal- lized region and partly by deformations associated with the final revolution of the flywheel. As the relative velocity between the parts drops, they form a metallurgical bond and the remaining flywheel en- ergy is dissipated as localized deformation along the weld interface. (16) At higher welding pressures, the microhardness profile becomes quite different. As it is shown in Fig. 24, the schematic picture of Fig. 22 does not hold anymore, although the sandwich struc- ture is apparent. Practically all heated material which would constitute the recrystallized zone is extruded into the flash, while the dynamically recrystallized layer of increased hardness is considerably wider. (iv) At the same time, the abrupt release of the remaining energy of the flywheel apparently damages, tears apart the grains, thereby reducing the microhardness instead of increasing it. As the welding pressure is changed, the microhardness profile changes between these quite opposite limiting cases but always retains some kind of layered structure.
Figure 25 shows the ultrasonic reflection from the interface region of a 304L stainless steel-stainless steel inertia weld and the frequency spectrum of the gated interface burst. A 1/2" diameter broadband contact transducer aligned with the axis of the 1" diameter specimen was used in this experiment, therefore the results correspond to the center and middle part of the interface. There are two principal pulses in the interface burst followed by an artifact signal from the extruded flash. This strong scattering
212 Nagy and Adler
- - T ~ " ~ ~ ' ' ~ :SPECIMEN WAS CUT -- PARALLEL TO ROTATIONAL
AXIS AT R/2
2 2 0
2 1 5
O O " 2 1 0
m
=~ 2 0 5
2
o 2 0 0
O O c
¢-
8
195
I - - 1.35 mm _ ]
e
V
190 , J ,
Ax ia l D i s t a n c e ( l m m / d i v )
Fig. 23. Microhardness profile of a low pressure 304L stainless steel-stainless steel inertia weld made at 1300 psi.
J
2 2 0
2 1 5
2 1 0
2 0 5
2 0 0
195
19C
I
O.9mm
I I I }1.
Axia l D i s t a n c e ( l m m / d i v )
Fig. 24. Microhardness profile of a high pressure 304L stainless steel-stainless steel inertia weld made at 2200 psi.

Solid State Bonds 213
"O
i
E <
I i i I ! i i ! I
LI I~o.3sm (~1mini rf I"
INTERFACE BURST
FLASH SIGNAL-
I I I i I I I i I
Time (1/~s/div)
<
0 10 20
F r e q u e n c y ( M H z )
Fig, 25. Ultrasonic reflection from the interface region of a 304L stainless steel-stainless steel inertia weld made at 1900 psi.
from the flash can be easily eliminated by cutting down the excess material or by time-gating the sig- nal. The frequency spectrum of the interface burst exhibits a characteristic modulation with periodicity related to the delay time between the two pulses within the burst. Sometimes, the weaker interface burst is too deeply submerged in the surrounding grain scattering to make a positive identification or to make an accurate thickness measurement directly from the reflected signal. In such cases, spectrum analysis can help improve detectability. Figure 26 shows the back-scattered spectra from a 304L stain- less steel-stainless steel inertia weld made at 1800 psi welding pressure. Spatial averaging of slightly differ- ent transducer positions smoothes out the disturbing random modulation and recovers the true periodicity of the spectrum. These minima occur at
C f . = n ~ - d , n =1,3,5 .... (12)
where c is the sound velocity in the sample, and d is the average separation between the two principal scatterers.
= ~ o o
n. 80 p- o uJ a. m 60 ,,=, rP uJ h. 40 i.- 0
20 0 ,c w
0
o
I i I I I t I
2 4 6 8 10 FREQUENCY (MHz)
(a)
i 100 L ' ' ' . . . . . . /
0 2 4 6 8 10 FREQUENCY (MHz)
(b)
Fig. 26. Back-scattered power spectra from a 304L/304L inertia weld made at 1800 psi axial axial pressure (a) and the average spectrum (b).
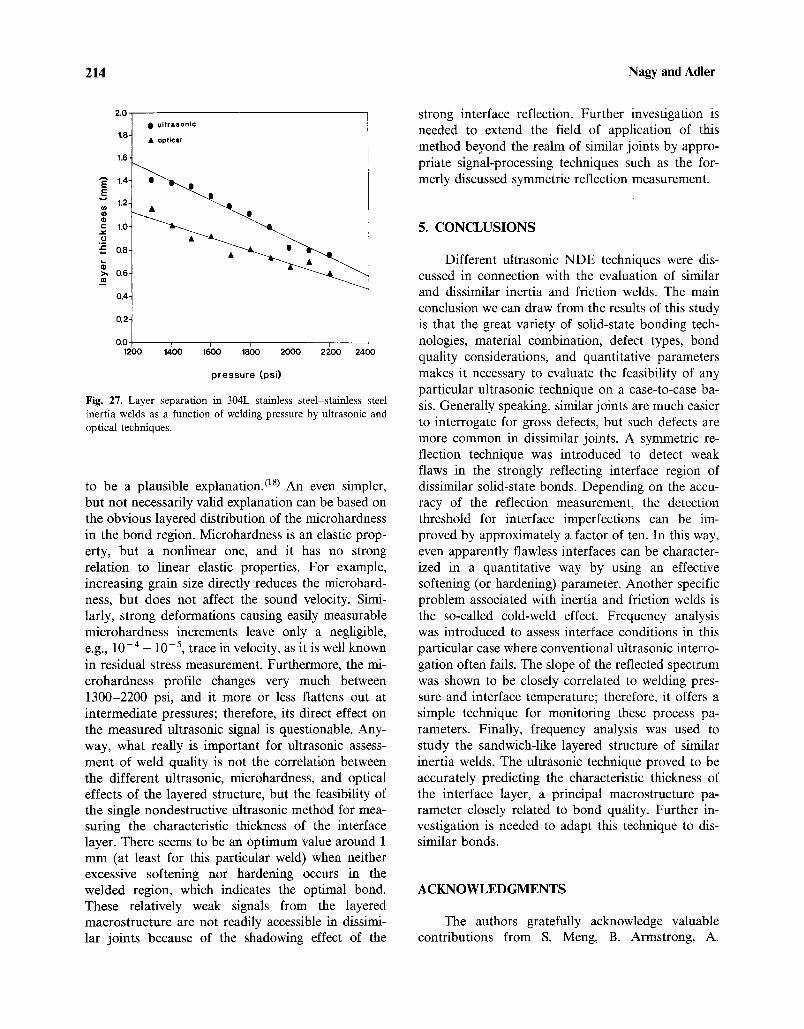
In a series of experiments, ten samples were made at different welding pressures ranging from 1300-2200 psi. The layer separation was determined from the back-scattered signal by using the frequency modulation technique regardless of the actual grain structure. In a control experiment, each sample was cut normal to the interface and subsequently pol- ished and chemically etched to increase optical grain contrast. These pictures showed slight overall darken- ing in the heat-affected regions, and the average separation between the layers was measured by a computer-accessible TV camera. Both ultrasonic and optical results are shown in Fig. 27. There is an apparent correlation between these parameters and the welding pressure, although the actual values are somewhat different, which is natural since they are based on quite .different physical properties of the layered structure.
As for the physical origin of the ultrasonic sig- nal, the coherent nature of the otherwise incoherent back-scattering from a layered grain structure seems
214 Nagy and Adler
2"0 t • ultrasonic
1.8 • optical
1.6
==
1 " 4 ~ 0
0.4-
0.2- J i
0.0 1200 I~M~O 16(10 1800 2000 2200 2400
pressure (psi)
Fig. 27. Layer separation in 304L stainless steel-stainless steel inertia welds as a function of welding pressure by ultrasonic and optical techniques.
to be a plausible explanation. (aS) An even simpler, but not necessarily valid explanation can be based on the obvious layered distribution of the microhardness in the bond region. Microhardness is an elastic prop- erty, but a nonlinear one, and it has no strong relation to linear elastic properties. For example, increasing grain size directly reduces the microhard- ness, but does not affect the sound velocity. Simi- larly, strong deformations causing easily measurable microhardness increments leave only a negligible, e.g., 10 .4 - 10 -5, trace in velocity, as it is well known in residual stress measurement. Furthermore, the mi- crohardness profile changes very much between 1300-2200 psi, and it more or less flattens out at intermediate pressures; therefore, its direct effect on the measured ultrasonic signal is questionable. Any- way, what really is important for ultrasonic assess- ment of weld quality is not the correlation between the different ultrasonic, microhardness, and optical effects of the layered structure, but the feasibility of the single nondestructive ultrasonic method for mea- suring the characteristic thickness of the interface layer. There seems to be an optimum value around 1 mm (at least for this particular weld) when neither excessive softening nor hardening occurs in the welded region, which indicates the optimal bond. These relatively weak signals from the layered macrostructure are not readily accessible in dissimi- lar joints because of the shadowing effect of the
strong interface reflection. Further investigation is needed to extend the field of application of this method beyond the realm of similar joints by appro- priate signal-processing techniques such as the for- merly discussed symmetric reflection measurement.
5. CONCLUSIONS
Different ultrasonic NDE techniques were dis- cussed in connection with the evaluation of similar and dissimilar inertia and friction welds. The main conclusion we can draw from the results of this study is that the great variety of solid-state bonding tech- nologies, material combination, defect types, bond quality considerations, and quantitative parameters makes it necessary to evaluate the feasibility of any particular ultrasonic technique on a case-to-case ba- sis. Generally speaking, similar joints are much easier to interrogate for gross defects, but such defects are more common in dissimilar joints. A symmetric re- flection technique was introduced to detect weak flaws in the strongly reflecting interface region of dissimilar solid-state bonds. Depending on the accu- racy of the reflection measurement, the detection threshold for interface imperfections can be im- proved by approximately a factor of ten. In this way, even apparently flawless interfaces can be character- ized in a quantitative way by using an effective softening (or hardening) parameter. Another specific problem associated with inertia and friction welds is the so-called cold-weld effect. Frequency analysis was introduced to assess interface conditions in this particular case where conventional ultrasonic interro- gation often fails. The slope of the reflected spectrum was shown to be closely correlated to welding pres- sure and interface temperature; therefore, it offers a simple technique for monitoring these process pa- rameters. Finally, frequency analysis was used to study the sandwich-like layered structure of similar inertia welds. The ultrasonic technique proved to be accurately predicting the characteristic thickness of the interface layer, a principal macrostructure pa- rameter closely related to bond quality. Further in- vestigation is needed to adapt this technique to dis- similar bonds.
ACKNOWLEDGMENTS
The authors gratefully acknowledge valuable contributions from S. Meng, B. Armstrong, A.

Solid State Bonds 215
Wexler, I. Adonyi, M. Talmant, and J. F. DeBelleval. This work was partially supported by the Sandia National Laboratories, Livermore, Project No. 99- 6016A and by the Edison Welding Institute, Colum- bus, Project No. J-1104.
REFERENCES
1. K. K. Wang and P. Nagappan, Transient temperature distri- bution in inertia welding of steels, Weld. J. 49:419s-426s (1970).
2. G. E. Dieter, Mechanical Metallurgy (McGraw-Hill, New York, 1976), p. 563.
3. M. Ohsumi, S. Kinyotou, and M. Sakamoto, The application of diffusion welding to aircraft titanium alloys, Trans. Iron Steel Inst. Japan 25:513-520 (1985).
4. J. H. Rose, T. A. Gray, and E. F. Lopes, Near-surface inspec- tion of flaws using bulk ultrasonic waves, in Review of Progress in Quantitative Nondestructive Evaluation (Vol. 3B), D. O. Thompson and D. E. Chimenti, eds. (Plenum Press, New York, 1984), pp. 917-925.
5. L. J. Bond and N. Saffari, Crack characterization in turbine disks, in Review of Progress in Quantitative Nondestructive Evaluation (Vol. 3A), D. O. Thompson and D. E. Chimenti, eds. (Plenum Press, New York, 1984), pp. 251-262.
6. A. N. Mucciardi and R. Shankar, Near-surface defect detec- tion, Mater. Eval. 39:74-77 (1979).
7. R. Lengelle, P. Gaillard, and J. F. deBelleval, Flaw detection close to the interface using ultrasonic echography, J. Nonde- str. Eval. 4:141-148 (1984).
8. S. Rokhlin, M. Hefets, and M. Rosen, An elastic interface
wave guided by a thin film between two solids, J. Appl. Phys. 51:3579-3582 (1980).
9. S. Rokhlin, M. Hefets, and M. Rose, An ultrasonic interface wave method for predicting the strength of adhesive bonds, J. Appl. Phys. 52:2847-2851 (1981).
10. D. A. Lee and D. M. Corbley, Use of interface waves for nondestructive inspection, IEEE Trans. Son. Ultrason. SU- 24:206-212 (1977).
11. J. M. Balk and R. B. Thompson, The elastic Compliance of imperfect interfaces: Review and relationship to ultrasonic scattering, in Review of Progress in Quantitative Nondestructive Evaluation (Vol. 4A), D. O. Thompson and D. E. Chimenti, eds. (Plenum Press, New York, 1985) pp. 133-144.
12. R. A. Bell, J. C. Lippold, and D. R. Adolpson, An evaluation of copper-stainless steel inertia friction welds, Weld. J. 63:325s-332s (1984).
13. N. F. Haines, The theory of sound transmission and reflection at contacting surfaces, Report RD/B/N4744, Central Elec- tricity Generating Board, Berkeley Nuclear Laboratories (1980).
14. T. Arakawa, A study on the transmission and reflection of an ultrasonic beam at machined surfaces pressed against each other, Mater. Eval. 41:714-719 (1983).
15. A. A. Ilyushin and V. S. Lensky, Strength of Materials (Per- gamon Press, Oxford, 1967), p. 228.
16. J. C. Lippotd and B. C. Oldegard, Technical note: Microstruc- tural evolution during inertia friction welding of anstenitic stainless steels, Weld. J. 63:35s-38s (1984).
17. K. K. Wang and W. Lin, Flywheel friction welding research, Weld. J. 53:233s-241s (1974).
18. P. B. Nagy and L. Adler, The role of coherent backscattering in quantitative NDE, in Review of Progress in Quantitative Nondestructive Evaluation (Vol. 7A), D. O. Thompson and D. E. Chimenti, eds. (Plenum Press, New York, 1988) pp. 113-122.