ultrasonic non-destructive evaluation of titanium ...pnagy/publications/milne et al., j. nondestr....
TRANSCRIPT

J Nondestruct Eval (2011) 30:225–236DOI 10.1007/s10921-011-0111-y
Ultrasonic Non-destructive Evaluationof Titanium Diffusion Bonds
K. Milne · P. Cawley · P.B. Nagy · D.C. Wright ·A. Dunhill
Received: 9 April 2011 / Accepted: 4 July 2011 / Published online: 28 July 2011© Springer Science+Business Media, LLC 2011
Abstract Diffusion bonds offer several advantages over al-ternative welding methods, including the ability to producenear-net shapes and achieve almost parent metal strength.However, voids remnant from the joining process can be tensof microns in their lateral dimension, making them difficultto detect with conventional pulse-echo immersion inspec-tion at any significant metal depth. In titanium the inspectionis particularly challenging; the anisotropic microstructure ishighly scattering and the diffusion bond itself forms an in-terface between regions of preferred crystallographic orien-tation (macrozones), which can act as a weak spatially co-herent reflector. A simple interfacial spring model predictsthat, for partial bonds (sub-wavelength voids distributed onthe bond line) and at certain frequencies, the phase of thesignal can be used to separate the component of the signaldue to the change in texture at the interface and the compo-nent due to the flaw. Here it is shown that the phase of thesignal from an interface is also affected by the anisotropicmicrotexture of Ti–6Al–4V. Good separation between well-bonded and partially bonded samples was achieved using asymmetric inspection, where the magnitude and phase of thereflection coefficient were calculated for normal incidencefrom opposite sides of the diffusion bond.
K. Milne (�) · P. Cawley · P.B. NagyRCNDE, Department of Mechanical Engineering, ImperialCollege London, London, SW7 2AZ, UKe-mail: [email protected]
P.B. NagySchool of Aerospace Systems, University of Cincinnati,Cincinnati, OH 45221-0070, USA
K. Milne · D.C. Wright · A. DunhillRolls-Royce plc, PO Box 31, Derby, DE24 8BJ, UK
Keywords Diffusion bond · Partial bond · Titanium ·Imperfect interface · Interfacial stiffness · Ultrasonicreflection coefficient · Phase
1 Introduction
Diffusion bonding can generate joins with almost parentmetal strength in near net shapes [1]. If the bonding pres-sure, temperature or time has been insufficient, voids will beremnant on the diffusion bond line. Their size is related tothe roughness of the joined surfaces [2–4] and so their lat-eral dimension may be in the order of micrometres. A par-tial bond is defined as an array of these voids that are “notresolved individually by the interrogating ultrasonic beam”[5]. For the conventional pulse-echo inspection of forgings,low MHz range frequencies are used to allow inspection upto metal paths of 100 mm [6]. Thus the size of individualdefects is generally smaller than either the ultrasonic beamdiameter or the wavelength. In titanium, the sensitivity of apulse-echo inspection is limited, since noise backscatteredby the anisotropic microstructure can mask reflections fromthe defects. Furthermore, a diffusion bond between pieces oftitanium creates a planar interface between ‘macrozones’—regions where the grains have a preferred crystallographicorientation [7–9]. While a typical grain diameter is ∼50 µmfor forged titanium, a macrozone may be several millime-tres in diameter. This interface acts as a weak but spatiallycoherent reflector, analogous to that between two dissimilarmaterials, which may also mask reflections from defects.
In this paper, both the magnitude and the phase of thefrequency dependent reflection coefficient are measured forlow MHz range ultrasound normally incident on the diffu-sion bond plane in Ti–6Al–4V samples. Theory on the re-flection coefficient for ultrasound normally incident on a

226 J Nondestruct Eval (2011) 30:225–236
partial diffusion bond is discussed in the remainder of thissection. It is suggested that the phase of the reflection coef-ficient can be used to differentiate between the componentof the reflection due to the acoustic impedance change atthe interface and the component of the reflection due to sub-wavelength sized voids distributed across the interface. Theexperimental method for determining the phase and magni-tude of the reflection coefficient is described. Factors affect-ing the measured value of the magnitude and the phase of asignal reflected from an interface are investigated in Sect. 2.Finally, experimental results are presented for the reflectioncoefficient measured for ultrasound normally incident fromboth sides of the diffusion bond plane. These two reflectioncoefficients are combined to obtain a single symmetric re-flection coefficient.
1.1 Diffusion Bond Microtexture and BackscatteredUltrasound
It was recently discovered that optically homogeneous mi-crostructures can have a preferred crystallographic orien-tation over regions or ‘macrozones’ much larger than themean grain diameter [7–9]. Macrozones have been observedby Electron Backscattered Diffraction (EBSD) [7–9] and bymapping the surface wave velocity [10]. Figure 1a showsa surface wave velocity map for a diffusion bonded Ti–6Al–4V sample generated for this study. Regions of similarsurface wave velocity, indicating preferred crystallographicorientation, are apparent. Figure 1b shows a 2 mm thick×20 mm long band obtained by scanning with a finer stepsize. The diffusion bond can be observed as a planar inter-face between macrozones halfway down Fig. 1b.
A 0.7 mm wide ×0.5 mm tall area (see box in Fig. 1b)of the sample was mapped with EBSD. The crystal orien-tation map (Fig. 2) shows that there is a sharp microtextureabove the diffusion bond line; the main axis of the hexago-nal close packed unit cell is strongly aligned with the sample
transverse direction. Below the diffusion bond line the ori-entation appears random. The average acoustic impedancefor wave propagation orthogonal to the diffusion bond planeis different for each macrozone.
An ultrasonic B-scan for the same sample, scanned inpulse-echo immersion with a longitudinal wave probe, isshown in Fig. 3. There is a weak, spatially coherent reflec-tion at the bond depth, which is thought to be due to the pla-nar interface between macrozones. The region highlightedwith the white dashed line corresponds to that highlightedin Fig. 1. The sample was generated by a hot isostatic press,using parameters selected to give a good weld. The samplewas polished and etched to show the microstructure at thesame section as the ultrasonic B-scan in Fig. 3. No defectswere found on the diffusion bond. Figure 4 shows the bond
Fig. 1 Surface wave velocity map of diffusion bonded Ti–6Al–4Vsample #2 obtained using optical-scanning acoustic microscope(O-SAM) at University of Nottingham [11]. (a) The surface wave ve-locity was measured over a length of 100 µm with 100 µm steps in thedirection normal to the diffusion bond line (top-to-bottom of image).Macrozones are apparent either side of the bond line. (b) Enlarged im-age of bond line region with step size of 25 µm. The area scannedusing electron backscatter diffraction to generate the map shown inFig. 2 is indicated. The region highlighted by the white dashed linescorresponds to that highlighted in Fig. 3
Fig. 2 Crystal orientation mapfor 0.7 mm wide by 0.5 mm tallarea of sample #2 (see Fig. 1b)with 1.723 µm resolution withrespect to sample transversedirection (left to right). Thecolour map indicates whichplane is oriented closest to thesample transverse direction forα-phase Ti–6Al–4V

J Nondestruct Eval (2011) 30:225–236 227
Fig. 3 Ultrasonic B-scan (amplitude vs. time of flight and lateral po-sition, x) of sample #2 captured using 10.9 MHz centre frequency,160 mm focal length, 19 mm diameter longitudinal wave probe focusedat the bond line depth. A coherent bond line reflection is apparent. Thescan pitch is 0.25 mm. The greyscale is linear and indicates % of os-cilloscope screen height. The region highlighted by the white dashedlines corresponds to that highlighted in Fig. 1
line at 200× magnification at the position corresponding tox = 30 mm in Fig. 3.
1.2 Reflection of Ultrasound from an Imperfect Interface
The magnitude of the reflection coefficient is commonlyused to evaluate interfaces [3, 12–27]. For low frequencies,where the wavelength is long compared to the defect sizeand separation [15, 25, 27], imperfect interfaces have beenmodelled as a spring layer with an interfacial stiffness, K .For the simple case of a longitudinal or transverse wavenormally incident on a bond line, which is thin relative tothe wavelength so that the mass of defects is negligible, thereflection coefficient R12 can be related to the interfacialspring stiffness by [5, 13–15, 25, 27, 28]:
R12(ω) = −Z1 − Z2 + iω(Z1Z2/K)
Z1 + Z2 + iω(Z1Z2/K), (1)
where ω is the angular frequency, i is√−1 and Z1 and Z2
are the acoustic impedances of the bonded media. For a per-fect interface, the interfacial stiffness is infinite and the fre-quency dependent term disappears. The magnitude of thereflection coefficient is frequency independent and relatedonly to the difference in acoustic impedance between thetwo materials. The reflected wave is either in phase with theincident wave (Z2 > Z1) or π radians out of phase (Z1 >
Z2).For an imperfect interface between two media with the
same acoustic impedance, Z1 = Z2 = Z [5]:
R(ω) = − iω�
1 + iω�
, (2)
Fig. 4 Micrograph at 200× magnification of sample #2. The sec-tion corresponds to the ultrasonic B-scan in Fig. 3. This image cor-responds to x = 30 mm Fig. 3. The black regions between grains arefine platelets of secondary alpha
Fig. 5 (a) Magnitude and (b) phase angle of reflection coefficient,R(ω), for an imperfect interface, calculated using spring model (2) and(3) for an interface between similar materials with acoustic impedance,Z = 27.3 MRayls, which is a typical value for a titanium alloy
where � is the characteristic frequency:
� = 2K
Z. (3)
Figure 5 shows the magnitude and phase of the reflectioncoefficient for an imperfect interface with various interfacialstiffnesses, K , between two pieces of material with the sameacoustic impedance. As the magnitude of the reflection co-efficient increases with frequency towards unity, the phasetends towards −π radians. When ω � �, the magnitude islinearly proportional to frequency and the phase is ∼−π/2radians.
For an imperfect interface between two media with dif-ferent acoustic impedances, if the component of the reflec-tion coefficient, Rbond, due to the flaw, Rbond,flaw, is smallrelative to the component due to the acoustic impedancemismatch, Rbond,imp, detection using the magnitude of thereflection coefficient becomes difficult [12, 26, 29]. How-ever, for the regime ω � � there is a π/2 radian separationin phase between Rbond,imp and Rbond,flaw. It may thereforebe possible to separate well bonded and partially bonded ti-tanium samples by also measuring the phase of the reflectioncoefficient.
228 J Nondestruct Eval (2011) 30:225–236
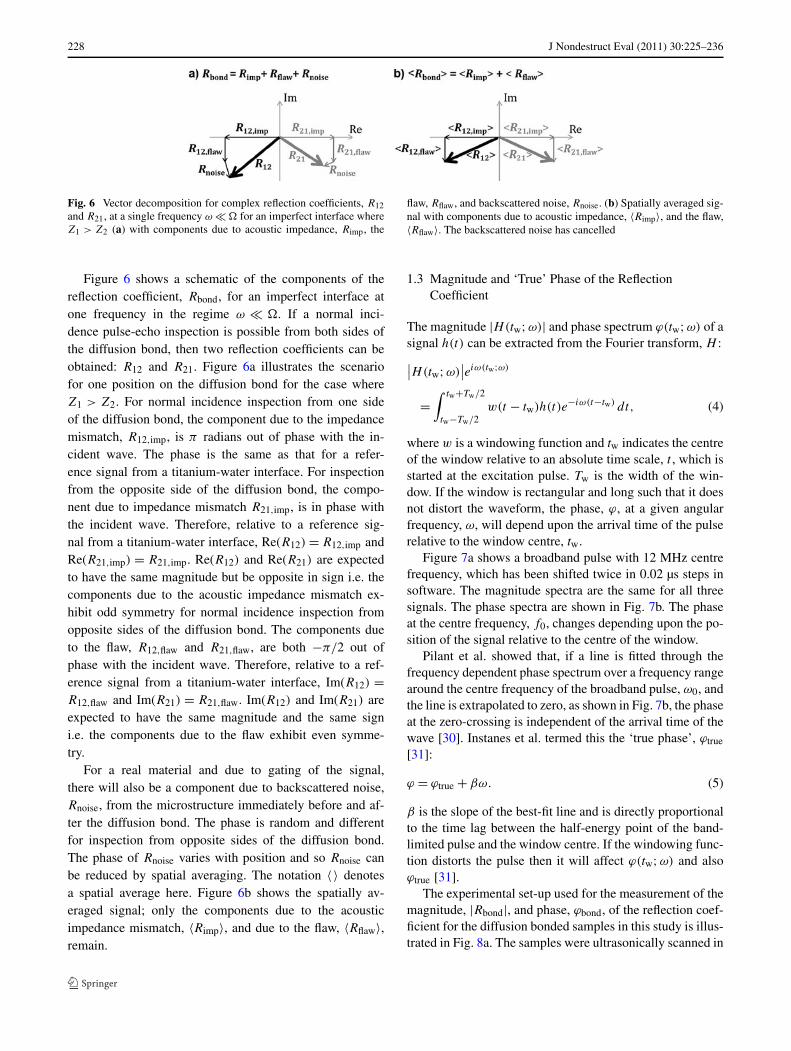
Fig. 6 Vector decomposition for complex reflection coefficients, R12and R21, at a single frequency ω � � for an imperfect interface whereZ1 > Z2 (a) with components due to acoustic impedance, Rimp, the
flaw, Rflaw, and backscattered noise, Rnoise. (b) Spatially averaged sig-nal with components due to acoustic impedance, 〈Rimp〉, and the flaw,〈Rflaw〉. The backscattered noise has cancelled
Figure 6 shows a schematic of the components of thereflection coefficient, Rbond, for an imperfect interface atone frequency in the regime ω � �. If a normal inci-dence pulse-echo inspection is possible from both sides ofthe diffusion bond, then two reflection coefficients can beobtained: R12 and R21. Figure 6a illustrates the scenariofor one position on the diffusion bond for the case whereZ1 > Z2. For normal incidence inspection from one sideof the diffusion bond, the component due to the impedancemismatch, R12,imp, is π radians out of phase with the in-cident wave. The phase is the same as that for a refer-ence signal from a titanium-water interface. For inspectionfrom the opposite side of the diffusion bond, the compo-nent due to impedance mismatch R21,imp, is in phase withthe incident wave. Therefore, relative to a reference sig-nal from a titanium-water interface, Re(R12) = R12,imp andRe(R21,imp) = R21,imp. Re(R12) and Re(R21) are expectedto have the same magnitude but be opposite in sign i.e. thecomponents due to the acoustic impedance mismatch ex-hibit odd symmetry for normal incidence inspection fromopposite sides of the diffusion bond. The components dueto the flaw, R12,flaw and R21,flaw, are both −π/2 out ofphase with the incident wave. Therefore, relative to a ref-erence signal from a titanium-water interface, Im(R12) =R12,flaw and Im(R21) = R21,flaw. Im(R12) and Im(R21) areexpected to have the same magnitude and the same signi.e. the components due to the flaw exhibit even symme-try.
For a real material and due to gating of the signal,there will also be a component due to backscattered noise,Rnoise, from the microstructure immediately before and af-ter the diffusion bond. The phase is random and differentfor inspection from opposite sides of the diffusion bond.The phase of Rnoise varies with position and so Rnoise canbe reduced by spatial averaging. The notation 〈 〉 denotesa spatial average here. Figure 6b shows the spatially av-eraged signal; only the components due to the acousticimpedance mismatch, 〈Rimp〉, and due to the flaw, 〈Rflaw〉,remain.
1.3 Magnitude and ‘True’ Phase of the ReflectionCoefficient
The magnitude |H(tw;ω)| and phase spectrum ϕ(tw;ω) of asignal h(t) can be extracted from the Fourier transform, H :∣∣H(tw;ω)
∣∣eiω(tw;ω)
=∫ tw+Tw/2
tw−Tw/2w(t − tw)h(t)e−iω(t−tw) dt, (4)
where w is a windowing function and tw indicates the centreof the window relative to an absolute time scale, t , which isstarted at the excitation pulse. Tw is the width of the win-dow. If the window is rectangular and long such that it doesnot distort the waveform, the phase, ϕ, at a given angularfrequency, ω, will depend upon the arrival time of the pulserelative to the window centre, tw.
Figure 7a shows a broadband pulse with 12 MHz centrefrequency, which has been shifted twice in 0.02 µs steps insoftware. The magnitude spectra are the same for all threesignals. The phase spectra are shown in Fig. 7b. The phaseat the centre frequency, f0, changes depending upon the po-sition of the signal relative to the centre of the window.
Pilant et al. showed that, if a line is fitted through thefrequency dependent phase spectrum over a frequency rangearound the centre frequency of the broadband pulse, ω0, andthe line is extrapolated to zero, as shown in Fig. 7b, the phaseat the zero-crossing is independent of the arrival time of thewave [30]. Instanes et al. termed this the ‘true phase’, ϕtrue
[31]:
ϕ = ϕtrue + βω. (5)
β is the slope of the best-fit line and is directly proportionalto the time lag between the half-energy point of the band-limited pulse and the window centre. If the windowing func-tion distorts the pulse then it will affect ϕ(tw;ω) and alsoϕtrue [31].
The experimental set-up used for the measurement of themagnitude, |Rbond|, and phase, ϕbond, of the reflection coef-ficient for the diffusion bonded samples in this study is illus-trated in Fig. 8a. The samples were ultrasonically scanned in

J Nondestruct Eval (2011) 30:225–236 229
Fig. 7 (a) Original signal is shifted forward in time by 0.02 µs twiceto create two new signals. (b) Phase spectra for the three signals in (a).The phase angle, ϕ, depends upon the arrival time of the wave relativeto the window centre, tw. A ‘true phase’, ϕtrue, can be obtained that isindependent of pulse arrival time
Fig. 8 Experimental set-up to capture (a) reflection from diffusionbond, hbond(t) (b) reflection from back wall of reference block, href(t)
pulse-echo immersion using a 10.9 MHz centre frequency,160 mm focal length and 19 mm diameter probe, with theprobe axis normal to the diffusion bond plane and the beamfocused at the diffusion bond depth (water path = 79 mm).Full waveform data sampled at 250 MS/s was captured.
In order to determine the magnitude and true phase ofthe reflection coefficient, Rbond, the magnitude and the truephase of the signal from the diffusion bond was determinedrelative to those of a reference signal. The reference signal
was obtained using the same inspection parameters from atitanium-water interface at the same metal path as the diffu-sion bond, as illustrated in Fig. 8b.
A window with finite length, Tw, was used to isolate thediffusion bond signal, hbond(t), and the reference signal,href(t). Some noise backscattered from the microstructureimmediately before and after the interface was therefore in-cluded. The error introduced in the magnitude and phase ofthe reflection coefficient is related to the relative amplitudeof the interface signal and the backscattered noise [33]. Thecentre of the window, tw, was fixed relative to the front wallreflection using an interface gate. The arrival time of the dif-fusion bond signal can vary due to variations in the thicknessof the block and due to crystallographic anisotropy [33]. Forhref(t), the signal to noise ratio is high and therefore a win-dow significantly longer than the pulse length plus any varia-tion in arrival time (Tw = 1.2 µs) could be used. For hbond(t),the window length is a trade-off between a short windowthat would distort the reflection from the diffusion bond anda long window, which would increase the component due tobackscattered noise. Tw = 0.48 µs was used.
The frequency range, �f , that corresponds to a 1 dBdrop in |Href(f )| either side of the centre frequency was de-termined. The average magnitude of the frequency spectra,|H̄ref| and |H̄bond| were determined over the same frequencyrange, �f . The magnitude of the reflection coefficient isthen:
|Rbond| = |H bond||H ref|
. (6)
To find the true phase of the reference signal, ϕref, a straightline was fitted to the phase spectrum, ϕref(f ), across �f
and extrapolated to zero frequency. ϕref will not be −π radi-ans, as would be expected from (1) when Z1 > Z2, since thesystem (filters, amplifiers, transducers, etc.) has a frequencydependent phase delay [31].
To find the true phase of the diffusion bond signal, ϕbond,a straight line was fitted to the phase spectrum, ϕbond(f ),across �f and extrapolated to zero frequency. The truephase of the diffusion bond reflection signal, ϕbond, is thencorrected as follows:
ϕbond = ϕbond − ϕref + π (7)
so that a back wall reflection has a true phase angle of π
radians.In the next section of this paper, it is shown that the refer-
ence true phase, ϕref, also depends upon beam focusing andupon the microtexture of the titanium sample through whichit has propagated.
230 J Nondestruct Eval (2011) 30:225–236
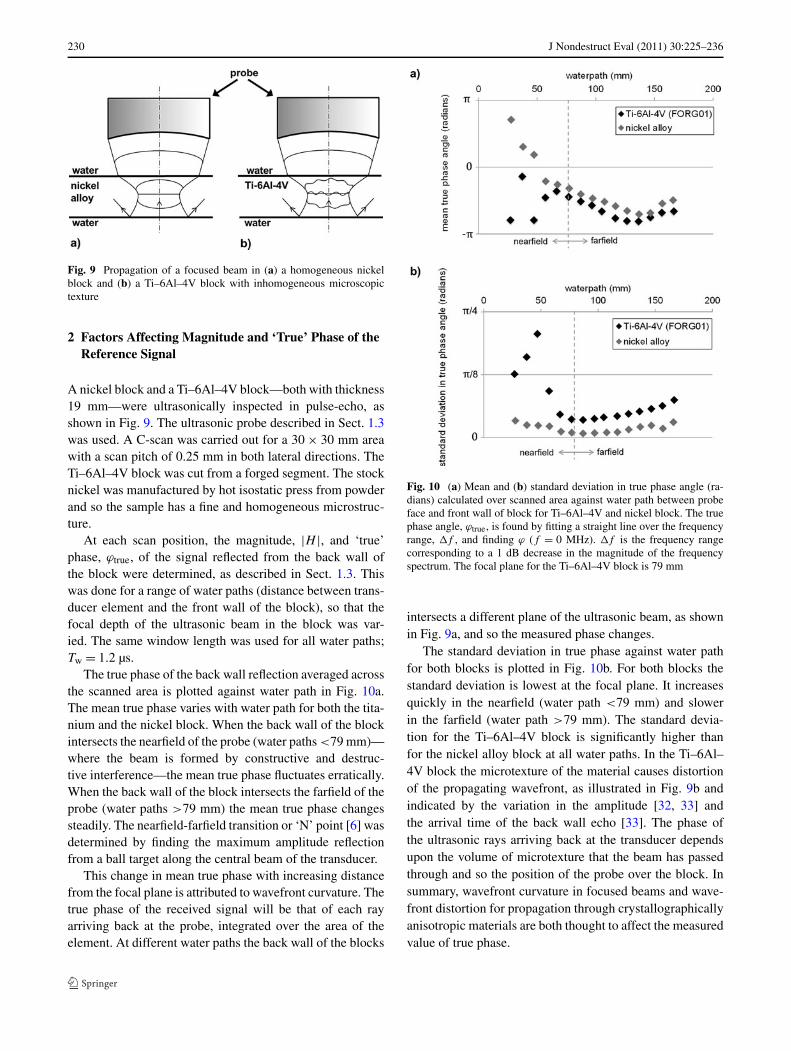
Fig. 9 Propagation of a focused beam in (a) a homogeneous nickelblock and (b) a Ti–6Al–4V block with inhomogeneous microscopictexture
2 Factors Affecting Magnitude and ‘True’ Phase of theReference Signal
A nickel block and a Ti–6Al–4V block—both with thickness19 mm—were ultrasonically inspected in pulse-echo, asshown in Fig. 9. The ultrasonic probe described in Sect. 1.3was used. A C-scan was carried out for a 30 × 30 mm areawith a scan pitch of 0.25 mm in both lateral directions. TheTi–6Al–4V block was cut from a forged segment. The stocknickel was manufactured by hot isostatic press from powderand so the sample has a fine and homogeneous microstruc-ture.
At each scan position, the magnitude, |H |, and ‘true’phase, ϕtrue, of the signal reflected from the back wall ofthe block were determined, as described in Sect. 1.3. Thiswas done for a range of water paths (distance between trans-ducer element and the front wall of the block), so that thefocal depth of the ultrasonic beam in the block was var-ied. The same window length was used for all water paths;Tw = 1.2 µs.
The true phase of the back wall reflection averaged acrossthe scanned area is plotted against water path in Fig. 10a.The mean true phase varies with water path for both the tita-nium and the nickel block. When the back wall of the blockintersects the nearfield of the probe (water paths <79 mm)—where the beam is formed by constructive and destruc-tive interference—the mean true phase fluctuates erratically.When the back wall of the block intersects the farfield of theprobe (water paths >79 mm) the mean true phase changessteadily. The nearfield-farfield transition or ‘N’ point [6] wasdetermined by finding the maximum amplitude reflectionfrom a ball target along the central beam of the transducer.
This change in mean true phase with increasing distancefrom the focal plane is attributed to wavefront curvature. Thetrue phase of the received signal will be that of each rayarriving back at the probe, integrated over the area of theelement. At different water paths the back wall of the blocks
Fig. 10 (a) Mean and (b) standard deviation in true phase angle (ra-dians) calculated over scanned area against water path between probeface and front wall of block for Ti–6Al–4V and nickel block. The truephase angle, ϕtrue, is found by fitting a straight line over the frequencyrange, �f , and finding ϕ (f = 0 MHz). �f is the frequency rangecorresponding to a 1 dB decrease in the magnitude of the frequencyspectrum. The focal plane for the Ti–6Al–4V block is 79 mm
intersects a different plane of the ultrasonic beam, as shownin Fig. 9a, and so the measured phase changes.
The standard deviation in true phase against water pathfor both blocks is plotted in Fig. 10b. For both blocks thestandard deviation is lowest at the focal plane. It increasesquickly in the nearfield (water path <79 mm) and slowerin the farfield (water path >79 mm). The standard devia-tion for the Ti–6Al–4V block is significantly higher thanfor the nickel alloy block at all water paths. In the Ti–6Al–4V block the microtexture of the material causes distortionof the propagating wavefront, as illustrated in Fig. 9b andindicated by the variation in the amplitude [32, 33] andthe arrival time of the back wall echo [33]. The phase ofthe ultrasonic rays arriving back at the transducer dependsupon the volume of microtexture that the beam has passedthrough and so the position of the probe over the block. Insummary, wavefront curvature in focused beams and wave-front distortion for propagation through crystallographicallyanisotropic materials are both thought to affect the measuredvalue of true phase.

J Nondestruct Eval (2011) 30:225–236 231
Table 1 Combination of blankscut from forged (FORG∗∗)Ti–6Al–4V used to makediffusion bonded samples#1–#13
Well bonded Partially bonded
Sample # 1 2 3 4 5 6 7 8 9 10 11 12 13
FORG 05 06 07 03 01 02 02 08 03 04 07 01 02
FORG 05 04 09 09 01 01 02 07 09 03 08 01 01
Fig. 11 Longitudinal wave velocity of forged reference samples,FORG01-09, in through-thickness direction. Acoustic impedance inthrough-thickness direction, Z = ρc, where ρ is the density of the sam-ples (4410 kg/m3) and c is the longitudinal wave velocity (m/s)
The diffusion bonded samples described in the next sec-tion were generated by joining blanks cut at nine radial po-sitions (FORG01-09) from segments of forged Ti–6Al–4V(see Table 1). Blanks cut from the same radial position inthe forged segments were used as reference blocks. It wasassumed that the microtexture, and therefore the attenuationand ultrasonic backscatter, for blocks cut from the same ra-dial position in a forging is similar. However, this is not nec-essarily correct; the microstructure produced in forgings isoften banded; different quadrants of the forging have differ-ent levels of backscattered ultrasonic noise [34].
The longitudinal wave velocity in the through-thicknessdirection was measured using a 0.25′′ diameter contactprobe with nominally 10 MHz centre frequency for eachblock and is plotted in Fig. 11. The time of flight was cal-culated by measuring time between positive maxima of 1stand 2nd backwall reflections. Measurement was made in 5different positions and an average was taken. The standarddeviation in these values is plotted on the graph. The meanand standard deviation of the true phase across the scannedarea are plotted for each block in Fig. 12 for a water pathof 79 mm. The standard deviation in true phase is higher forblocks FORG03-06 than for the others. This is thought tobe related to the various microtextures of the blocks [33],however more work is required to confirm this.
The reference true phase therefore varies with location.To find the magnitude, |Rbond| and the true phase, ϕref, ofthe reflection coefficient for the diffusion bonded samples,a spatially averaged magnitude, 〈|Href|〉 was calculated for
Fig. 12 Mean true phase angle of back wall of forged reference sam-ples, FORG01-09, across the scanned area. Error bars show one stan-dard deviation above and below the mean
each of the blocks FORG01-09 and was substituted into (6).Similarly, the spatially averaged true phase angle, plotted inFig. 12, was used as the reference true phase, 〈ϕref〉.
3 Magnitude and ‘True’ Phase of Reflection Coefficientfor Diffusion Bonded Samples
3.1 Manufacture of Diffusion Bonded Samples
The diffusion bonded samples were made by joining two50×50×19 mm Ti–6Al–4V blanks. The 50×50 mm facesof the blanks were ground to a finish of 0.62 µm Ra. Gaswas evacuated from the interface and the samples underwenta hot isostatic press with parameters selected to achieve agood weld. Samples #1–#9 were generated using this pro-cess.
To generate partial bonds, the surface roughness of thesamples was altered. Samples #10 and #11 were generatedby joining Ti–6Al–4V blanks that had been scratched ran-domly following the grinding process. Samples #12 and #13were generated by joining Ti–6Al–4V blanks that had onlybeen ground to a nominal finish of 1.6 µm Ra prior to join-ing.
3.2 Ultrasonic Inspection and Cut-up
A 30 × 20 mm area of each of the diffusion bonded sampleswas ultrasonically scanned in pulse-echo with the probe fo-cused at the diffusion bond depth (water path = 79 mm), as

232 J Nondestruct Eval (2011) 30:225–236
Fig. 13 Maximum magnitude of the reflection coefficient across en-tire ultrasonic scan for both well-bonded (#1–#9) and voided samples(#10–#13)
described in Sect. 1.3. The samples were scanned from bothsides to obtain two reflection coefficients, R12 and R21.
The magnitude of the diffusion bond reflection coeffi-cient |Rbond| and the true phase ϕbond were calculated ateach scan position, using (6) and (7) respectively, and com-bined to find the complex reflection coefficient Rbond =|Rbond| exp(iϕbond). Finally, the complex reflection coef-ficient was spatially averaged over the scanned area forsamples #1–#13 in order to reduce the contribution of thebackscattered noise.
The maximum magnitude of the reflection coefficientacross the scanned area, |Rbond|, for inspection from eachside of the sample is plotted for all samples in Fig. 13. Thedifference in the measured reflection coefficient from eitherside of the sample, R12 and R21, is due to differences in theapparent attenuation of the signal and error in the measure-ment system.
Following ultrasonic inspection, samples #1–#9 weresectioned normal to the diffusion bond plane and polishedsuch that the polished face intersected the position of thehighest amplitude reflection on the ultrasonic C-scan. Thediffusion bond line was metallurgically examined under abinocular microscope at 200× magnification. No voids wereobserved.
Samples #12 and #13 can be easily separated from thewell bonded samples #1–#9 using the magnitude of the re-flection coefficient, |Rbond|. These samples were sectionedat one plane perpendicular to the bond line. A typical micro-graph is shown in Fig. 14. Isolated voids were distributedalong the bond line, separated by well-bonded regions. Forsamples #12 and #13, images were taken at 200× magnifi-cation under a binocular microscope at 2 mm intervals alongthe bond line. The mean void length and the standard devia-tion for each of the samples #12 and #13 are listed in Table 2.
Samples #10 and #11 were sectioned perpendicular to thediffusion bond plane and then polished incrementally with2 mm steps. 9 sections were examined on each sample. Insample #10, voids were observed ranging from 0.9–92.4 µmin length on 7 out of 9 sections. In sample #11, voids wereobserved that ranged from 1.0–59.6 µm in length, also on7 out of 9 sections. Samples #10 and #11 were defective.
Fig. 14 Typical micrograph at 200× magnification of partially voidedsample #12
However, as shown in Fig. 13, these two samples cannotbe separated from the well-bonded samples #1–#9 using themaximum amplitude of the reflection coefficient, |Rbond|, atthe centre frequency of the probe.
3.3 The Magnitude of the Reflection Coefficient forDetection of Partial Bonds
The interface model described by (1) predicts that for anideal interface the reflection coefficient will be independentof frequency but that for an imperfect interface the mag-nitude of the reflection coefficient will increase with fre-quency (see Fig. 5a). For each sample, the magnitude ofthe reflection coefficient, |Rbond|, was averaged over 1 MHzfrequency ranges from 7–8 MHz, then 8–9 MHz etc., in-creasing to 17–18 MHz. These frequencies cover the work-ing bandwidth of the probe. For each frequency range, themagnitude of the reflection coefficient was calculated at ev-ery scan position. The peak strength of the interface signalS was defined as the maximum value of |Rbond| across thescanned area. Then, over each of the eleven selected fre-quency bands, the signal to ‘noise’ ratio for the ith specimenwas obtained as SNRi = Si/S1. Sample #1 was chosen arbi-trarily from the well bonded samples to represent the levelof inherent material noise. The same trends in SNR are alsoobserved if any of the other well bonded samples is used asa reference.
The signal to noise ratio (SNR) against frequency isplotted for each sample in Fig. 15. The defective samples(#10–#13) have clear frequency dependence while the wellbonded samples (#1–#9) appear flatter across all frequen-cies, as predicted by (1). Below 13 MHz the SNR is <1for both samples #10 and #11. These results confirm thatbetter separation between partially bonded and well bondedsamples can be achieved by moving to a higher frequencyultrasonic inspection; with increasing frequency the spatialresolution improves and, also, the magnitude of the compo-nent of the reflection coefficient due to the defect increaseswhile the magnitude of the component due to the change inacoustic impedance at the interface remains the same.
Figure 15 also suggests that the rate of change of |Rbond|with frequency can be used to assess the quality of dif-fusion bonds. Jamieson had only limited success relating∂|Rbond|/∂ω to bond quality in copper beryllium diffusion

J Nondestruct Eval (2011) 30:225–236 233
Table 2 Mean and standarddeviation in void length forsample #12 and sample #13
Sample # Mean void length (µm) Standard deviation in void length (µm)
12 11.6 9.2
13 10.9 10.8
Fig. 15 Signal to noise ratio(defined as maximum absolutereflection coefficient forfrequency range across scannedarea at each relative to the samevalue for sample #1) againstfrequency range
bonds [26]. More work is required, particularly on samplescontaining low percentage voiding where the contributionof backscatter from the bulk material will be comparable tothat of the defect.
3.4 Magnitude and ‘True’ Phase of the ReflectionCoefficient for Detection of Partial Bonds
The interface model described by (1) predicts that, in theregime ω � �, the component of the reflection due toacoustic impedance mismatch at an interface will either bein phase with the incident wave or π radians out of phase.However, for an imperfect interface the reflection coefficientwill always be −π/2 radians out of phase. For an ultrasonicpulse with centre frequency of 10.9 MHz, this correspondsto interfacial stiffnesses in the order of 1016 N/m and above(see Fig. 5). Voids observed in the partially bonded samples#10–#13 were in the order of tens of microns long (Table 2),which is much less than the acoustic wavelength in titaniumat the centre frequency of the probe used (∼600 µm). Wetherefore assumed that we were working in this long wave-length regime for the partially bonded samples and that thephase could be used to discriminate good and partial bonds.Unlike the separation in magnitude, the separation in phasedoes not decrease as the frequency is decreased. Therefore,measurement of the phase could form the basis for a low fre-quency technique, which could be applied for inspections atgreater metal paths.
Using the convention illustrated in Fig. 6b, the compo-nent of the bond line reflection coefficient due to a changein acoustic impedance at the interface is expected to bereal for both well-bonded and partially bonded samples.For inspection from opposite sides of the diffusion bond,the real parts of the spatially averaged reflection coefficient,
Fig. 16 Real component of spatially averaged complex reflection co-efficient for both well-bonded (#1–#9) and voided samples (#10–#13).The samples were scanned from each side to obtain R12 and R21
〈Re(R12)〉 and 〈Re(R21)〉 are expected to exhibit odd sym-metry i.e. have the same magnitude but be opposite in sign.〈Re(R12)〉 and 〈Re(R21)〉 are plotted in Fig. 16 for samples#1–#13. For samples #1–#9, which are thought to be wellbonded, and samples #10 and #11, which have low percent-age voiding, 〈Re(R12)〉 and 〈Re(R21)〉 exhibit odd symme-try, as expected. 〈Re(R12)〉 and 〈Re(R21)〉 for samples #12and #13 are, however, both positive. For both these samples,the imaginary components 〈Im(R12)〉 and 〈Im(R21)〉 arelarger than the real components 〈Re(R12)〉 and 〈Re(R21)〉(see Fig. 17), due to the dominance of the response from theflaw. Thus a relatively small systematic error in the phasemeasurement could cause this result.
Assuming that (1) is applicable to these distributed mi-crovoids, that ω � � and using the convention illustratedin Fig. 6b, the component of the bond line reflection coeffi-cient due to flaws is expected to be imaginary for partiallybonded samples and zero for well-bonded samples. For in-spection from opposite sides of the diffusion bond the imag-inary parts of the spatially averaged reflection coefficient,〈Im(R12)〉 and 〈Im(R21)〉, are expected to be similar in mag-

234 J Nondestruct Eval (2011) 30:225–236
Fig. 17 Imaginary component of spatially averaged complex reflec-tion coefficient for both well-bonded (#1–#9) and voided samples(#10–#13). The samples were scanned from each side to obtain R12and R21
Fig. 18 (a) Real component of spatially averaged symmetric reflec-tion coefficient for both well-bonded (#1–#9) and voided samples(#10–#13). The samples were scanned from each side to obtain R12and R21
nitude and both negative. 〈Im(R12)〉 and 〈Im(R21)〉 are plot-ted in Fig. 17 for all samples. For partially bonded samples#10–#13, 〈Im(R12)〉 and 〈Im(R21)〉 are similar in magnitudeand both negative as expected.
〈Im(R12)〉 and 〈Im(R21)〉, for the well-bonded samples#1–#9 is expected to be zero, as the backscattered noiseshould cancel. However, the imaginary component for thewell-bonded samples is non-zero. For sample #4, 〈Im(R21)〉is lower than the imaginary component for samples #10 and#11. The outcome is that, while the results for the partiallybonded samples fit with the theory, the imaginary compo-nent of the spatially averaged reflection coefficient cannotbe used to separate the well bonded samples from the par-tially bonded samples as had been hoped.
The difference between theory and the experimental re-sults suggests that either some of the well-bonded samplesare defective or that there is error in the calculated magni-tude or phase of the reflection coefficient. Possible sourcesor error include:
1. Differences between the through-thickness acoustic ve-locity of the diffusion bonded blank and the referenceblock. As discussed in Sect. 2, for a focused beam thetrue phase for an interface depends upon the position ofthe interface along the beam axis due to wavefront cur-vature.
2. The effect of wavefront distortion on the measured am-plitude. The amplitude of the back wall reflection forthe Ti–6Al–4V reference blocks was observed to changewith scan position [33]. Therefore the spatially averagedreference amplitude, |Href|, used in the calculation of thereflection coefficient is not correct for every scan posi-tion.
3. The effect of wavefront distortion during propagationon the measured true phase. The true phase of the backwall reflection for the reference blocks was observed tochange with scan position—particularly for anisotropicTi–6Al–4V (see Fig. 12). Therefore the spatially aver-aged reference true phase, ϕref, used in the calculationof the reflection coefficient is not correct for every scanposition.
4. The contribution of backscattered noise to the measuredmagnitude, |Hbond|, and true phase of the signal, ϕbond.The error is related to the relative amplitude of the inter-face signal to the backscattered noise [33].
More work is required to understand the error introducedby these various factors. If these errors could be reducedthen a low frequency one sided inspection, which uses theimaginary component of the complex reflection coefficientto differentiate between well-bonded and partially bondedsamples, could be possible. It is likely that these factorswould have less effect in the inspection of solid-state weldsbetween materials where the microtexture is not as dominantas in Ti–6Al–4V.
3.5 Symmetric Reflection Technique
Nagy and Adler [12] suggested the use of the symmetric re-flection coefficient, Rs , for the inspection of welds betweendissimilar materials. From (1), the symmetric reflection co-efficient is:
Rs(ω) = R12 + R21
2= −
iωZ1+Z2
(Z1Z2K
)
1 + iωZ1+Z2
(Z1Z2K
). (8)
In Sect. 3.3, it was observed that the real components of thespatially averaged reflection coefficients for inspection fromopposite sides of the diffusion bond exhibit odd symmetry(equal in magnitude and opposite in sign) for 11 of the 13samples. For the well-bonded samples, there was also oddsymmetry in the imaginary component of the spatially aver-aged reflection coefficient. In the symmetric reflection coef-ficient, these components cancel out. In this section, the realand imaginary components of the spatially averaged sym-metric reflection coefficient are calculated for each of theforged diffusion bonded samples #1–#13.
In order to calculate the symmetric reflection coefficient,the same region of the diffusion bond must be inspectedfrom both sides and the complex reflection coefficients for

J Nondestruct Eval (2011) 30:225–236 235
Fig. 19 (a) Imaginary component of spatially averaged symmetric re-flection coefficient for both well-bonded (#1–#9) and voided samples(#10–#13). The samples were scanned from each side to obtain R12and R21
each point summed. An image correlation method was usedto ensure that the reflection coefficient was calculated overan identical area of the diffusion bond for scans from bothsides and to align the points [33].
The real component of the spatially averaged symmet-ric reflection coefficient 〈Re(Rs)〉 is plotted in Fig. 18.〈Re(Rs)〉 is near zero for samples #1–#11, as predicted.More work is required to understand the non-zero value of〈Re(Rs)〉 for samples #12 and #13.
The imaginary component of the spatially averaged sym-metric reflection coefficient, 〈Im(Rs)〉, is plotted in Fig. 19.There is now good separation between the well-bonded sam-ples and all of the partially bonded samples.
4 Conclusion
By testing diffusion bonded blocks of forged Ti–6Al–4V, itwas shown that the interface created between macrozonesacts as a weak reflector that can limit the sensitivity of the ul-trasonic inspection to partial bonding (sub-wavelength voidsdistributed across the bond line). Higher frequencies wereshown to give better separation between well-bonded andpartially bonded samples, or between the component of thereflection due to the interface and the component due to theflaws.
A simple interfacial spring model was used to predict thatthere would be π/2 radians separation in phase between thecomponent of the reflection coefficient due to the interfaceand the component due to the flaw, for partially bonded sam-ples inspected at low frequencies. The ‘true’ phase of thesignal was measured. The measured value was shown to de-pend upon wavefront curvature, due to beam focusing, andwavefront distortion, due to microtexture within the mate-rial.
Separation between well-bonded samples and samplescontaining even low percentage voiding was achieved us-ing the symmetric reflection technique—where the reflec-tion coefficient was calculated for normal incidence from
both sides of the diffusion bond. Separation between well-bonded and partially bonded samples was not possible usingthe reflection coefficient for normal incidence from only oneside of the diffusion bond; the microtexture of Ti–6Al–4Vresulted in significant error in the measured reflection coef-ficient.
If the errors in the single sided technique could be over-come it would become attractive, allowing diffusion bondinspection at lower ultrasonic frequencies and thus at deepermetal paths. The final application drove the choice of Ti–6Al–4V as a material during this investigation. The tech-nique may be more immediately applicable to solid-statewelds between dissimilar materials or materials where mi-crotexture does not have so severe an effect over the metalpath used.
References
1. Ohsumi, M., Kiyotou, S., Sakamoto, M.: The application of dif-fusion welding to aircraft titanium alloys. In: Transactions of theIron and Steel Institute of Japan, vol. 25, pp. 513–520 (1985)
2. Thomas, G.H., Spingarn, J.R.: Ultrasonic non-destructive evalu-ation of solid state welds. In: Thompson, D.O., Chimenti, D.E.(eds.) Review of Progress in Quantitative NDE, vol. 7B, pp. 1319–1325. Plenum Press, New York (1988)
3. Palmer, D.D., Rehbein, D.K., Smith, J.F., Buck, O.: Nondestruc-tive characterization of the mechanical strength of diffusion bonds.I. Experimental results. J. Nondestruct. Eval. 7(3/4), 153–166(1988)
4. Palmer, D.D., Roberts, C.D., Rehbein, D.K., Smith, J.F., Buck,O.: Strength and ultrasonic characterization of metallic interfaces.In: Thompson, D.O., Chimenti, D.E. (eds.) Review of Progress inQuantitative NDE, vol. 7B, pp. 1335–1342. Plenum Press, NewYork (1988)
5. Nagy, P.B.: Ultrasonic classification of imperfect interfaces.J. Nondestruct. Eval. 11(3/4), 127–139 (1992)
6. Rationalised Process Specification 705—Ultrasonic inspection ofdisc forms. Rolls-Royce plc (1997)
7. Germain, L., Gey, N., Humbert, M., Vo, P., Jahazi, M.: Texture andmicrotexture analysis of an IMI 834 alloy after thermo-mechanicalprocessing. In: Lutjering, G., Albrecht, J. (eds.) Ti-2003 Sci.Tech.,pp. 1291–1298. Wiley-VCH, Weinheim (2004)
8. Germain, L., Gey, N., Humbert, M., Vo, P., Jahazi, M., Bocher, P.:Texture heterogeneities induced by subtransus processing of nearalpha titanium alloys. Acta Mater. 26, 4298–4308 (2008)
9. Uta, E., Gey, N., Bocher, P., Humbert, M., Gilgert, J.: Textureheterogeneities in αp/αS titanium forging analysed by EBSD—relation to fatigue crack propagation. J. Microsc. 233(3), 451–459(2009)
10. Sharples, S.D., Clark, M., Somekh, M.G.: Fast noncontact imag-ing of material microstructure using local surface acoustic wavevelocity mapping. In: Yuhas, M.P. (ed.) Ultrasonics Symposium,pp. 886–889. IEEE Press, New York (2005)
11. Sharples, S.D.: All-optical scanning acoustic microscope. PhD,University of Nottingham (2003)
12. Nagy, P.B., Adler, L.: Ultrasonic NDE of solid-state bonds: inertiaand friction welds. J. Nondestruct. Eval. 7(3/4), 199–215 (1988)
13. Tattersall, H.G.: The ultrasonic pulse-echo technique as applied toadhesion testing. J. Phys. D, Appl. Phys. 6, 819–832 (1973)
14. Schoenberg, M.: Elastic wave behaviour across linear slip inter-faces. J. Acoust. Soc. Am. 68(5), 1516–1521 (1980)

236 J Nondestruct Eval (2011) 30:225–236
15. Baik, J.-M., Thompson, R.B.: Ultrasonic scattering from imper-fect interfaces: a quasi-static model. J. Nondestruct. Eval. 4(3/4),177–196 (1984)
16. Margetan, F.J., Thompson, R.B., Gray, T.A.: Interfacial springmodel for ultrasonic interactions with imperfect interfaces: the-ory of oblique incidence and application to diffusion-bonded buttjoints. J. Nondestruct. Eval. 7(3/4), 131–152 (1988)
17. Palmer, D.D., Rehbein, D.K., Smith, J.F., Buck, O.: Nondestruc-tive characterization of the mechanical strength of diffusion bonds.II. Application of a quasi-static spring model. J. Nondestruct. Eval.7(3/4), 167–174 (1988)
18. Buck, O., Rehbein, D.K., Thompson, R.B., Palmer, D.D., Brasche,L.J.H.: Nondestructive characterization and bond strength ofsolid-solid bonds. In: Thompson, D.O., Chimenti, D.E. (eds.) Re-view of Progress in Quantitative NDE, vol. 8B, pp. 1949–1956.Plenum Press, New York (1989)
19. Rose, J.H.: Ultrasonic reflectivity of diffusion bonds. In: Thomp-son, D.O., Chimenti, D.E. (eds.) Review of Progress in Quanti-tative NDE, vol. 8B, pp. 1925–1931. Plenum Press, New York(1989)
20. Sotiropoulos, D.A., Achenbach, J.D.: Ultrasonic reflection by aplanar distribution of cracks. J. Nondestruct. Eval. 7(3/4), 123–129 (1988)
21. Achenbach, J.D., Xu, Y.: Reflection by defective diffusion bonds.In: Ultrasonics Symposium, vol. 2, pp. 1107–1111. IEEE Press,New York (1989)
22. Margetan, F.J., Thompson, R.B., Rose, J.H., Gray, T.A.: The inter-action of ultrasound with imperfect interfaces: experimental stud-ies of model structures. J. Nondestruct. Eval. 11(3/4), 109–126(1992)
23. Yalda-Mooshabad, I., Margetan, F.J., Gray, T.A., Thompson, R.B.:Reflection of ultrasonic waves from imperfect interfaces: a com-bined boundary element method and independent scattering modelapproach. J. Nondestruct. Eval. 11(3/4), 141–149 (1992)
24. Drinkwater, B.W., Dwyer-Joyce, R.S., Cawley, P.: A study of thetransmission of ultrasound across real rough solid-solid interfaces.
In: Ultrasonics Symposium, vol. 2, pp. 1081–1084. IEEE Press,New York (1994)
25. Drinkwater, B.W., Dwyer-Joyce, R.S., Cawley, P.: A study of theinteraction between ultrasound and a partially contacting solid-solid interface. In: Proc. R. Soc. A, vol. 452, pp. 2613–2628. TheRoyal Society, London (1996)
26. Jamieson, E.E.: Ultrasonic evaluation of beryllium-copper diffu-sion bonds, KCP-613-6332, Honeywell (2000)
27. Lavrentyev, A.I., Beals, J.T.: Ultrasonic measurement of the dif-fusion bond strength. Ultrasonics 38, 513–516 (2000)
28. Lavrentyev, A.I., Rokhlin, S.I.: Ultrasonic spectroscopy of imper-fect contact interfaces between a layer and two solids. J. Acoust.Soc. Am. 103(2), 657–664 (1998)
29. Ojard, G.C., Buck, O., Rehbein, D.K.: Bond strength evaluation indissimilar materials. In: Thompson, D.O., Chimenti, D.E. (eds.)Review of Progress in Quantitative NDE, vol. 10B, pp. 1383–1390. Plenum Press, New York (1991)
30. Pilant, W.L., Knopoff, L., Schwab, F.: Transmission and reflectionof surface waves at a corner 3. Rayleigh waves (experimental).J. Geophys. Res. 69(2), 291–296 (1964)
31. Instanes, G., Toppe, M., Lakshminarayan, B., Nagy, P.B.: Corro-sion and erosion monitoring of pipes by an ultrasonic guided wavemethod. In: Kundu, T. (ed.) Advanced Ultrasonic Methods for Ma-terial and Structure Inspection. ISTE, London (2010)
32. Panetta, P.D., Thompson, R.B., Margetan, F.J.: Use of electronbackscatter diffraction in understanding texture and mechanismsof backscattered noise generation in titanium alloys. In: Thomp-son, D.O., Chimenti, D.E. (eds.) Review of Progress in Quantita-tive NDE, vol. 17, pp. 89–96. Plenum Press, New York (1998)
33. Milne, K.A.: Studies into vibro-enhancement of penetrant inspec-tion and ultrasonic inspection of diffusion bond. EngD, ImperialCollege London (2010)
34. Margetan, F.J., Nieters, E., Brasche, L., Yu, L., Degtyar, A.,Wasan, H., Keller, M., Kinney, A.: Fundamental studies of ti-tanium forging materials—engine titanium consortium phase II,DOT/FAA/AR-05/22. Federal Aviation Authority (2005)