ultratech eia part 1 · draft environment impact assessment report on expansion of m/s ultratech...
TRANSCRIPT
DRAFT ENVIRONMENT IMPACT ASSESSMENT REPORT ON
EXPANSION OF M/S ULTRATECH CEMENT LTD UNIT: NARMADA CEMENT MAGDALLA WORKS (FROM 0.72
MMTPA TO 2 MMTPA)‐ MAGDALLA WORKS DUMAS ROAD DIST. SURAT
PREPARED BY

Draft EIA report UltraTech Cement Limited – NCMW- SURAT
Royal environment auditing & Consultancy Services, Rajkot 1
ACKNOWLEDGEMENT
We are very much thankful to M/s UltraTech Cement Ltd (Unit: Narmada
Cement Ltd ), Grinding unit, Magdalla works by assigning the preparation of
Environment Impact Assessment report for proposed expansion project of
grinding unit at Village. Magdalla, Ta. Chorasi, Dist. Surat
We sincerely acknowledge the efforts made by Mr. B.L. Deopura & Mr.
Pinakin Joshi for co- ordination & logistic support during this assignment. We
are very much thankful to Mr. K.Y.P. Kulkarni (Sr. Executive President) for
giving us an opportunity to work with M/s UltraTech Cement Ltd.
Draft EIA report UltraTech Cement Limited – NCMW- SURAT
Royal environment auditing & Consultancy Services, Rajkot 2
TERMS OF REFERENCES
Sr.
No.
Description Reference no.
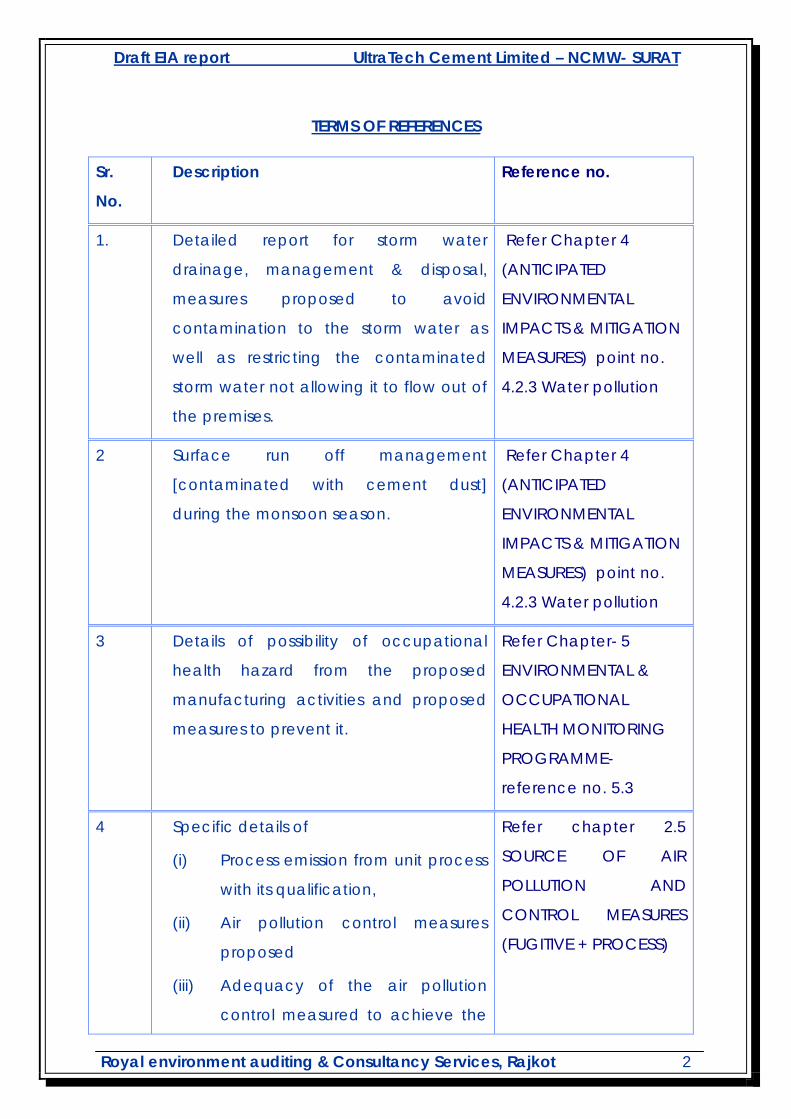
1. Detailed report for storm water
drainage, management & disposal,
measures proposed to avoid
contamination to the storm water as
well as restricting the contaminated
storm water not allowing it to flow out of
the premises.
Refer Chapter 4
(ANTICIPATED
ENVIRONMENTAL
IMPACTS & MITIGATION
MEASURES) point no.
4.2.3 Water pollution
2 Surface run off management
[contaminated with cement dust]
during the monsoon season.
Refer Chapter 4
(ANTICIPATED
ENVIRONMENTAL
IMPACTS & MITIGATION
MEASURES) point no.
4.2.3 Water pollution
3 Details of possibility of occupational
health hazard from the proposed
manufacturing activities and proposed
measures to prevent it.
Refer Chapter- 5
ENVIRONMENTAL &
OCCUPATIONAL
HEALTH MONITORING
PROGRAMME-
reference no. 5.3
4 Specific details of
(i) Process emission from unit process
with its qualification,
(ii) Air pollution control measures
proposed
(iii) Adequacy of the air pollution
control measured to achieve the
Refer chapter 2.5
SOURCE OF AIR
POLLUTION AND
CONTROL MEASURES
(FUGITIVE + PROCESS)
Draft EIA report UltraTech Cement Limited – NCMW- SURAT
Royal environment auditing & Consultancy Services, Rajkot 3
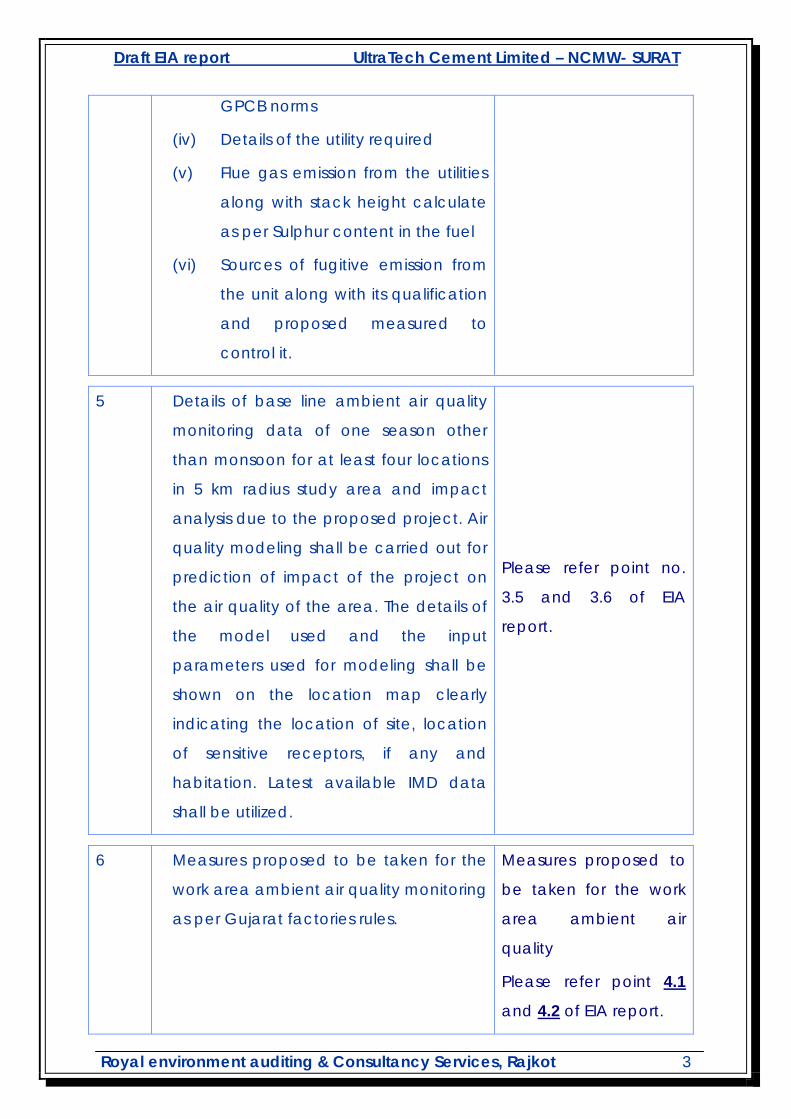
GPCB norms
(iv) Details of the utility required
(v) Flue gas emission from the utilities
along with stack height calculate
as per Sulphur content in the fuel
(vi) Sources of fugitive emission from
the unit along with its qualification
and proposed measured to
control it.
5 Details of base line ambient air quality
monitoring data of one season other
than monsoon for at least four locations
in 5 km radius study area and impact
analysis due to the proposed project. Air
quality modeling shall be carried out for
prediction of impact of the project on
the air quality of the area. The details of
the model used and the input
parameters used for modeling shall be
shown on the location map clearly
indicating the location of site, location
of sensitive receptors, if any and
habitation. Latest available IMD data
shall be utilized.
Please refer point no.
3.5 and 3.6 of EIA
report.
6 Measures proposed to be taken for the
work area ambient air quality monitoring
as per Gujarat factories rules.
Measures proposed to
be taken for the work
area ambient air
quality
Please refer point 4.1
and 4.2 of EIA report.
Draft EIA report UltraTech Cement Limited – NCMW- SURAT
Royal environment auditing & Consultancy Services, Rajkot 4
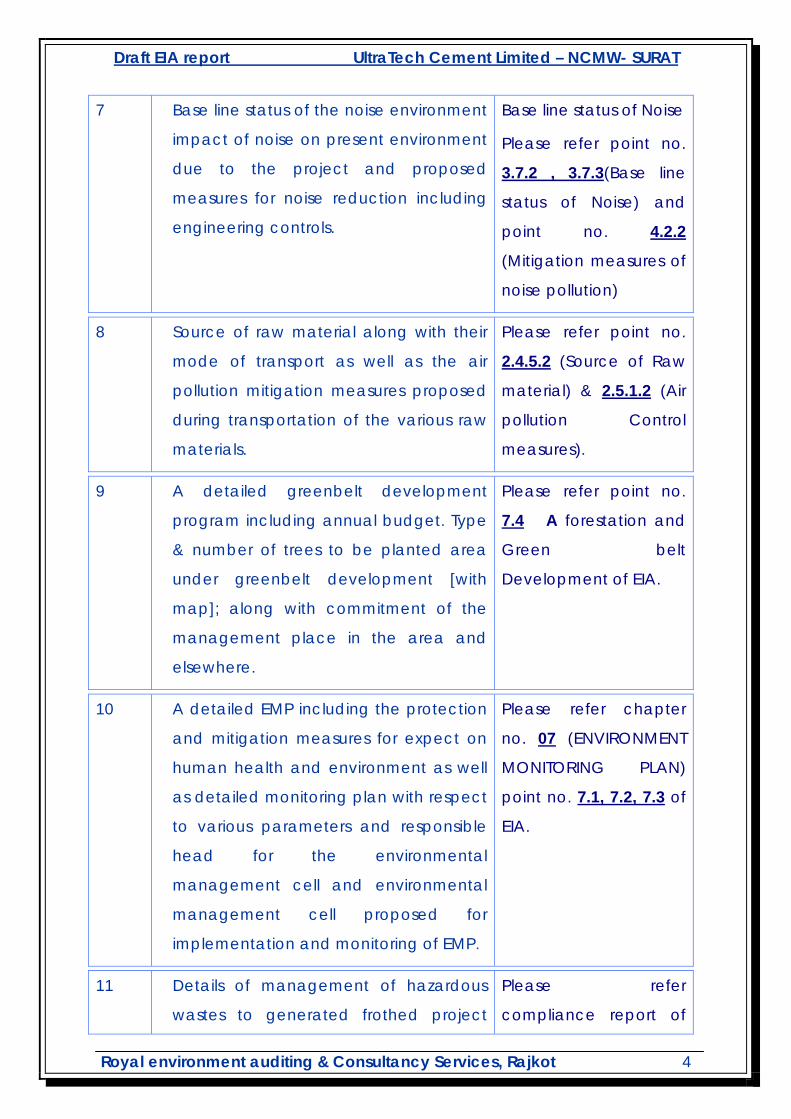
7 Base line status of the noise environment
impact of noise on present environment
due to the project and proposed
measures for noise reduction including
engineering controls.
Base line status of Noise
Please refer point no.
3.7.2 , 3.7.3(Base line
status of Noise) and
point no. 4.2.2
(Mitigation measures of
noise pollution)
8 Source of raw material along with their
mode of transport as well as the air
pollution mitigation measures proposed
during transportation of the various raw
materials.
Please refer point no.
2.4.5.2 (Source of Raw
material) & 2.5.1.2 (Air
pollution Control
measures).
9 A detailed greenbelt development
program including annual budget. Type
& number of trees to be planted area
under greenbelt development [with
map]; along with commitment of the
management place in the area and
elsewhere.
Please refer point no.
7.4 A forestation and
Green belt
Development of EIA.
10 A detailed EMP including the protection
and mitigation measures for expect on
human health and environment as well
as detailed monitoring plan with respect
to various parameters and responsible
head for the environmental
management cell and environmental
management cell proposed for
implementation and monitoring of EMP.
Please refer chapter
no. 07 (ENVIRONMENT
MONITORING PLAN)
point no. 7.1, 7.2, 7.3 of
EIA.
11 Details of management of hazardous
wastes to generated frothed project
Please refer
compliance report of

Draft EIA report UltraTech Cement Limited – NCMW- SURAT
Royal environment auditing & Consultancy Services, Rajkot 5
stating details of storage area for each
type of waste, its handling and its
disposal. How the manual handling of
the hazardous wastes shall be
minimized.
CCA.
(Annexure-I & III)
12 To explore the use of renewable energy
to the maximum extent possible.
We can use solar
energy Street light.
13 Provision of industrial hygienist for work
place monitoring.
Please refer chapter
no. 5.0 ENVIRONMENT
AND OCCUPATION
HEALTH MONITORING
PROGRAME OF EIA
report.
14 A detailed cement dust and silica dust
monitoring plan including the
measurement and control. Plan for
medical examination of the workers
exposed. Report for measurement of
cement dust at workers level as per GFR.
Please refer to chapter
no. 05 ENVIRONMENTAL
MONITORING
PROGRAME OF EIA .
15 Record of medical examination if
workers for the existing plant.
Please refer chapter
no. 5.0 ENVIRONMENT
AND OCCUPATION
HEALTH MONITORING
PROGRAME OF EIA
report.
16 Record of last five years for any legal
breach of environmental and safety
laws, show cause notice, closure etc.
There is no Legal
breach of
environmental and
safety laws, show-
cause notice, closure

Draft EIA report UltraTech Cement Limited – NCMW- SURAT
Royal environment auditing & Consultancy Services, Rajkot 6
etc.
17 Record of last five year of fatal and non
fatal accidents and dangerous
occurrences under the Gujarat Factories
Rules 1963 (GFR) for factories.
There is no fatal or non
fatal accidents and
dangerous occurrence
under Gujarat Factory
act rules 1963
18 Compliance of the existing CC&A of
GPCB.
Compliance of Existing
CC &A
Please refer Annexure-
II
19 Details of qualified safety officer, factory
medical officer employed for hazardous
process.
Please refer chapter
no. 5.0 ENVIRONMENT
AND OCCUPATION
HEALTH MONITORING
PROGRAME OF EIA
report.
20 Details of equipment / instrument to
measured record and analyzed
workplace exposure including air and
water quality, noise , vibration,
ventilation, illumination etc.
Please refer chapter
no. 5.0 ENVIRONMENT
AND OCCUPATION
HEALTH MONITORING
PROGRAME OF EIA
report.
21 Explore possibility of premises floor
sweeping with vacuum cleaner devices
for reducing fugitive dust emission.
The company will
purchase vacuum
cleaner device for floor
cleaning floors to
reduce the fugitive
emission.
22 Detailed cleaner production measure to Refer Chapter No. 2

Draft EIA report UltraTech Cement Limited – NCMW- SURAT
Royal environment auditing & Consultancy Services, Rajkot 7
reduce emission of possible in the
proposed project & commitment of the
management on futuristic development
/ implementation for the same. Type of
ventilation provided/ proposed In the
work area.
(PROJECT
DESCRIPTION) point no.
2.4.5.4
23 Corporate social responsibilities details
including activities carried out so far as
well as the activities proposed and the
financial planning for the financial
planning for the same.
Please refer Chapter 06
(Project Benefits)
Draft EIA report UltraTech Cement Limited – NCMW- SURAT
Royal environment auditing & Consultancy Services, Rajkot 8
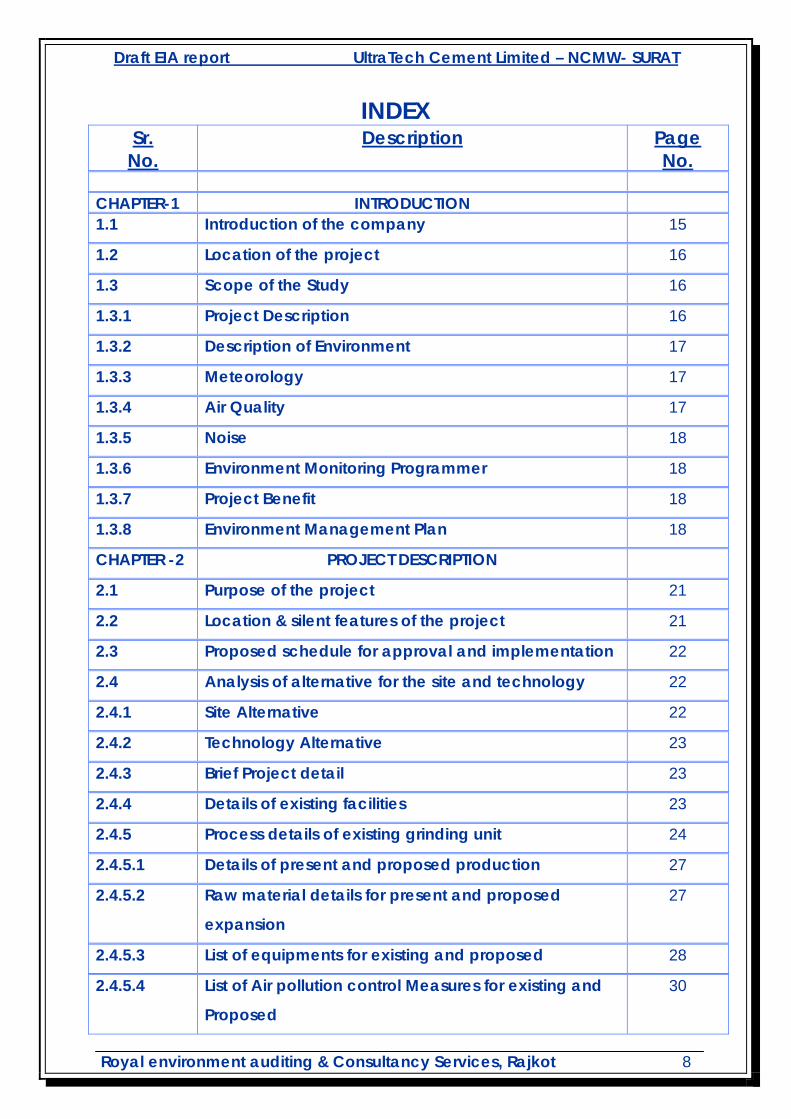
INDEX Sr. No.
Description Page No.
CHAPTER-1 INTRODUCTION 1.1 Introduction of the company 15
1.2 Location of the project 16
1.3 Scope of the Study 16
1.3.1 Project Description 16
1.3.2 Description of Environment 17
1.3.3 Meteorology 17
1.3.4 Air Quality 17
1.3.5 Noise 18
1.3.6 Environment Monitoring Programmer 18
1.3.7 Project Benefit 18
1.3.8 Environment Management Plan 18
CHAPTER -2 PROJECT DESCRIPTION
2.1 Purpose of the project 21
2.2 Location & silent features of the project 21
2.3 Proposed schedule for approval and implementation 22
2.4 Analysis of alternative for the site and technology 22
2.4.1 Site Alternative 22
2.4.2 Technology Alternative 23
2.4.3 Brief Project detail 23
2.4.4 Details of existing facilities 23
2.4.5 Process details of existing grinding unit 24
2.4.5.1 Details of present and proposed production 27
2.4.5.2 Raw material details for present and proposed
expansion
27
2.4.5.3 List of equipments for existing and proposed 28
2.4.5.4 List of Air pollution control Measures for existing and
Proposed
30
Draft EIA report UltraTech Cement Limited – NCMW- SURAT
Royal environment auditing & Consultancy Services, Rajkot 9
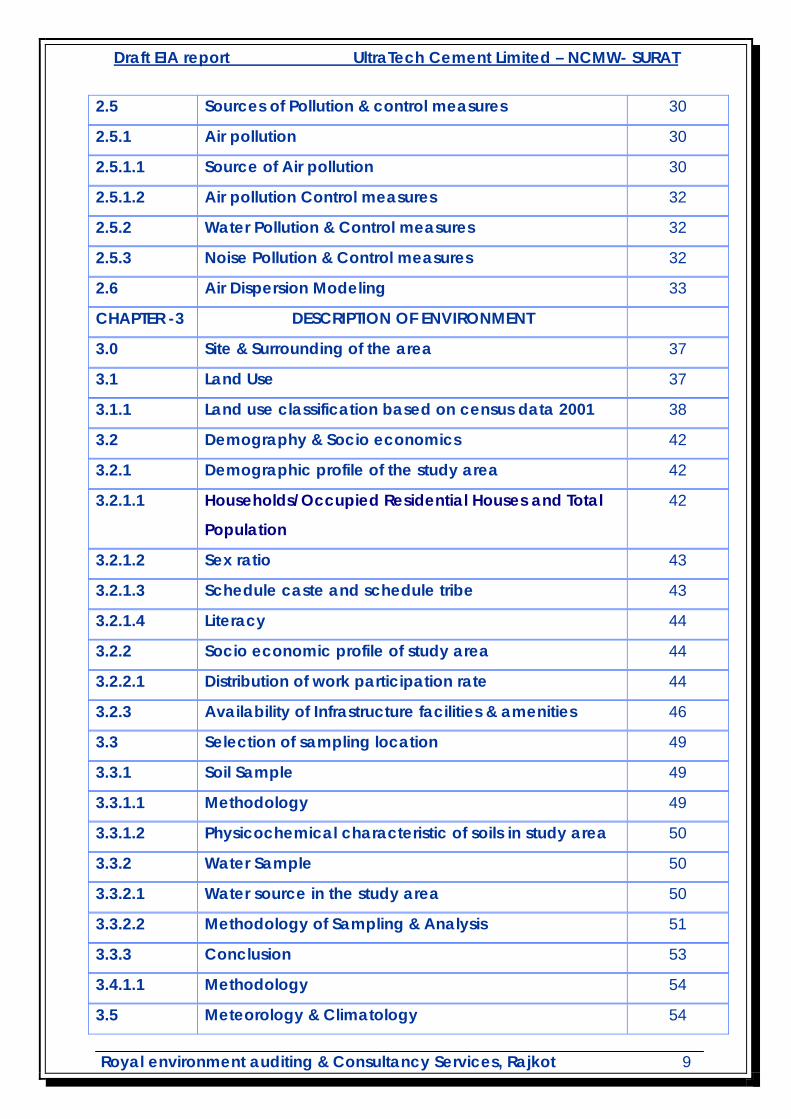
2.5 Sources of Pollution & control measures 30
2.5.1 Air pollution 30
2.5.1.1 Source of Air pollution 30
2.5.1.2 Air pollution Control measures 32
2.5.2 Water Pollution & Control measures 32
2.5.3 Noise Pollution & Control measures 32
2.6 Air Dispersion Modeling 33
CHAPTER -3 DESCRIPTION OF ENVIRONMENT
3.0 Site & Surrounding of the area 37
3.1 Land Use 37
3.1.1 Land use classification based on census data 2001 38
3.2 Demography & Socio economics 42
3.2.1 Demographic profile of the study area 42
3.2.1.1 Households/Occupied Residential Houses and Total
Population
42
3.2.1.2 Sex ratio 43
3.2.1.3 Schedule caste and schedule tribe 43
3.2.1.4 Literacy 44
3.2.2 Socio economic profile of study area 44
3.2.2.1 Distribution of work participation rate 44
3.2.3 Availability of Infrastructure facilities & amenities 46
3.3 Selection of sampling location 49
3.3.1 Soil Sample 49
3.3.1.1 Methodology 49
3.3.1.2 Physicochemical characteristic of soils in study area 50
3.3.2 Water Sample 50
3.3.2.1 Water source in the study area 50
3.3.2.2 Methodology of Sampling & Analysis 51
3.3.3 Conclusion 53
3.4.1.1 Methodology 54
3.5 Meteorology & Climatology 54

Draft EIA report UltraTech Cement Limited – NCMW- SURAT
Royal environment auditing & Consultancy Services, Rajkot 10
3.5.1 Past Records 55
3.5.1.1 Data collected 55
3.5.1.2 Analysis of climatologically Data 55
3.5.1.3 Rainfall 56
3.5.1.4 Temperature 56
3.5.2 On-Site meteorology 56
3.5.2.1 Wind speed and Direction 62
3.5.2.2 Temperature 63
3.5.2.3 Relative Humidity 63
3.5.2.4 Rainfall 63
3.6 Ambient air quality 63
3.6.1 Methodology adopted for the study 63
3.6.2 Criteria for selection of monitoring locations 63
3.6.3 Frequency & Parameter for monitoring 64
3.6.4 Details of monitoring location 65
3.6.5 Instruments used for sampling 65
3.6.6 Sampling & Analytical Technique 65
3.6.7 Presentation of results 66
3.6.8 Observation based on monitoring result 67
3.6.8.1 Suspended particulate Matter(SPM) 68
3.6.8.2 Respirable Particulate Matter(RPM) 68
3.6.8.3 Sulfur dioxide (SO2) 68
3.6.8.4 Oxide of Nitrogen (NOx) 68
3.6.9 Conclusion 69
3.7 Noise 70
3.7.1 Selection of Monitoring Location 70
3.7.2 Parameter Measured 72
3.7.3 Result & Discussion 72
3.7.4 Noise Standard 73
CHAPTER 4
ANTICIPATED ENVIRONMENT IMPACT & MITIGATION
MEASURES
Draft EIA report UltraTech Cement Limited – NCMW- SURAT
Royal environment auditing & Consultancy Services, Rajkot 11
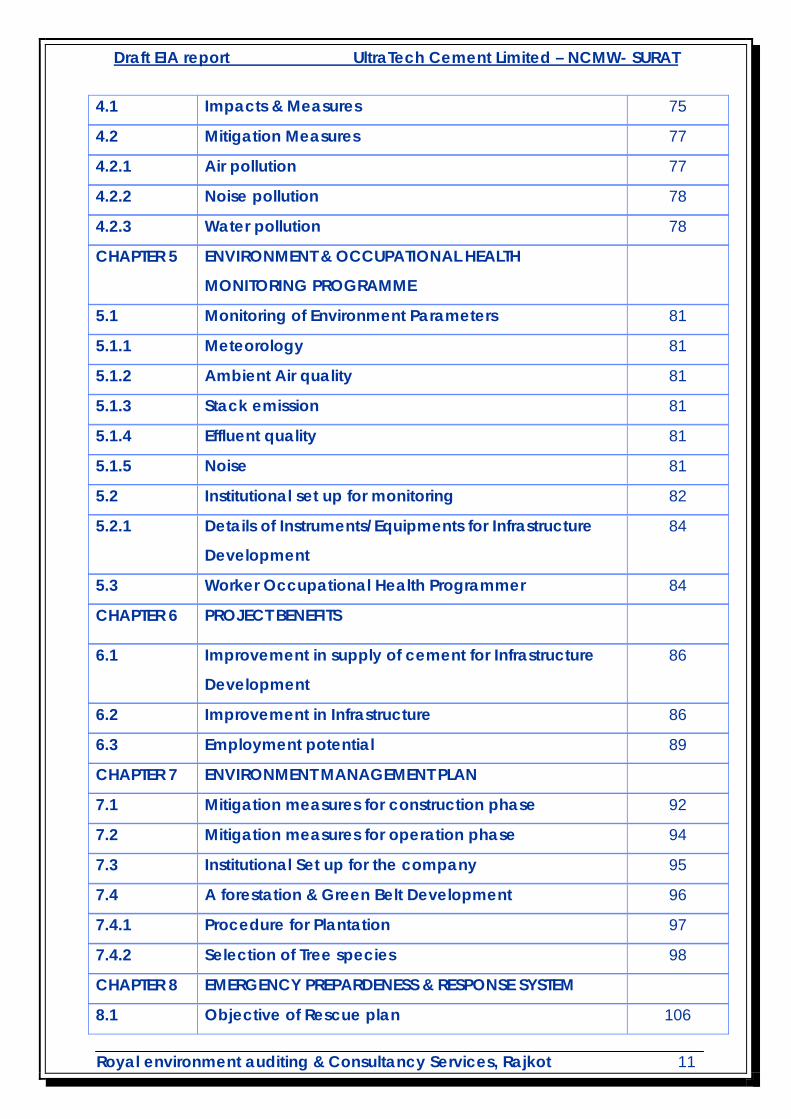
4.1 Impacts & Measures 75
4.2 Mitigation Measures 77
4.2.1 Air pollution 77
4.2.2 Noise pollution 78
4.2.3 Water pollution 78
CHAPTER 5 ENVIRONMENT & OCCUPATIONAL HEALTH
MONITORING PROGRAMME
5.1 Monitoring of Environment Parameters 81
5.1.1 Meteorology 81
5.1.2 Ambient Air quality 81
5.1.3 Stack emission 81
5.1.4 Effluent quality 81
5.1.5 Noise 81
5.2 Institutional set up for monitoring 82
5.2.1 Details of Instruments/Equipments for Infrastructure
Development
84
5.3 Worker Occupational Health Programmer 84
CHAPTER 6
PROJECT BENEFITS
6.1 Improvement in supply of cement for Infrastructure
Development
86
6.2 Improvement in Infrastructure 86
6.3 Employment potential 89
CHAPTER 7 ENVIRONMENT MANAGEMENT PLAN
7.1 Mitigation measures for construction phase 92
7.2 Mitigation measures for operation phase 94
7.3 Institutional Set up for the company 95
7.4 A forestation & Green Belt Development 96
7.4.1 Procedure for Plantation 97
7.4.2 Selection of Tree species 98
CHAPTER 8 EMERGENCY PREPARDENESS & RESPONSE SYSTEM
8.1 Objective of Rescue plan 106
Draft EIA report UltraTech Cement Limited – NCMW- SURAT
Royal environment auditing & Consultancy Services, Rajkot 12
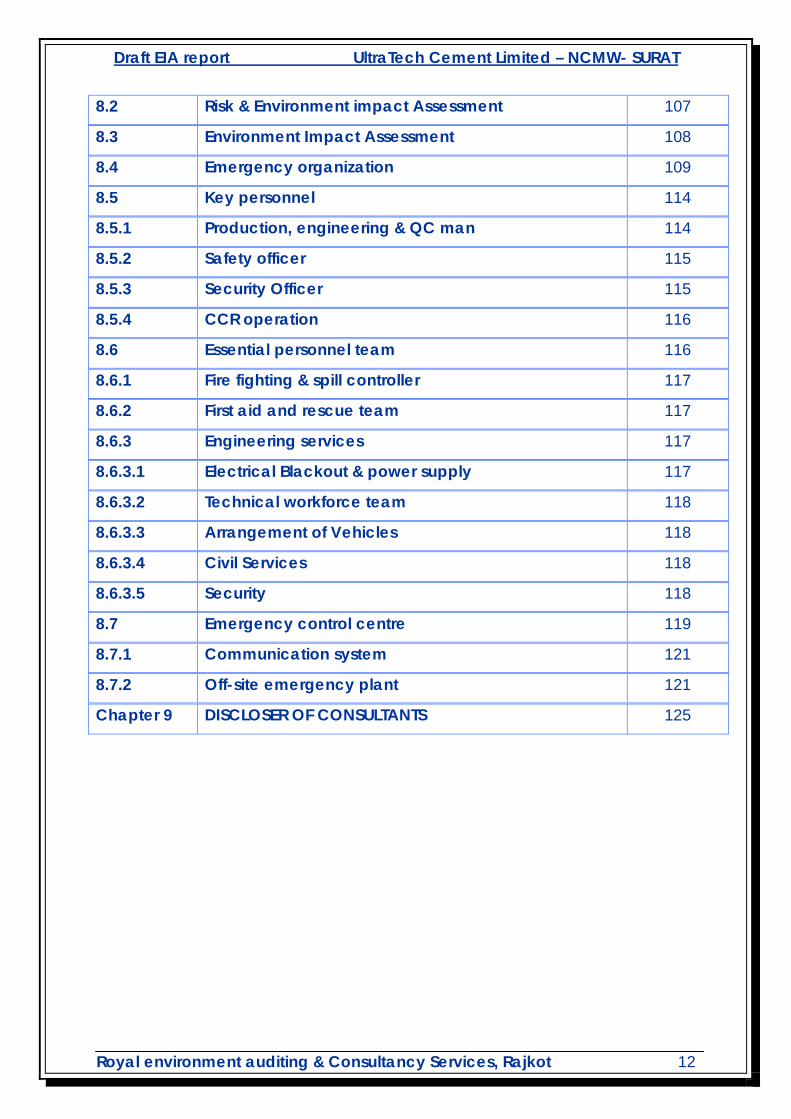
8.2 Risk & Environment impact Assessment 107
8.3 Environment Impact Assessment 108
8.4 Emergency organization 109
8.5 Key personnel 114
8.5.1 Production, engineering & QC man 114
8.5.2 Safety officer 115
8.5.3 Security Officer 115
8.5.4 CCR operation 116
8.6 Essential personnel team 116
8.6.1 Fire fighting & spill controller 117
8.6.2 First aid and rescue team 117
8.6.3 Engineering services 117
8.6.3.1 Electrical Blackout & power supply 117
8.6.3.2 Technical workforce team 118
8.6.3.3 Arrangement of Vehicles 118
8.6.3.4 Civil Services 118
8.6.3.5 Security 118
8.7 Emergency control centre 119
8.7.1 Communication system 121
8.7.2 Off-site emergency plant 121
Chapter 9 DISCLOSER OF CONSULTANTS 125
Draft EIA report UltraTech Cement Limited – NCMW- SURAT
Royal environment auditing & Consultancy Services, Rajkot 13
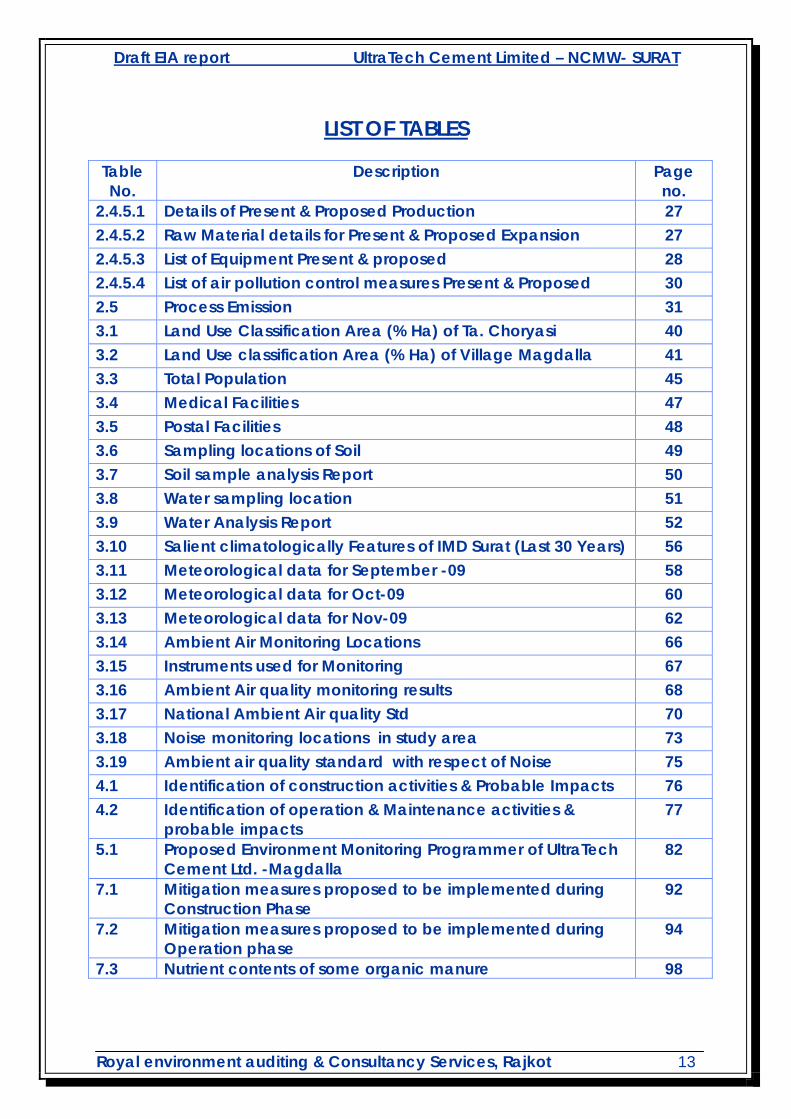
LIST OF TABLES
Table No.
Description Page no.
2.4.5.1 Details of Present & Proposed Production 27 2.4.5.2 Raw Material details for Present & Proposed Expansion 27 2.4.5.3 List of Equipment Present & proposed 28 2.4.5.4 List of air pollution control measures Present & Proposed 30 2.5 Process Emission 31 3.1 Land Use Classification Area (% Ha) of Ta. Choryasi 40 3.2 Land Use classification Area (% Ha) of Village Magdalla 41 3.3 Total Population 45 3.4 Medical Facilities 47 3.5 Postal Facilities 48 3.6 Sampling locations of Soil 49 3.7 Soil sample analysis Report 50 3.8 Water sampling location 51 3.9 Water Analysis Report 52 3.10 Salient climatologically Features of IMD Surat (Last 30 Years) 56 3.11 Meteorological data for September -09 58 3.12 Meteorological data for Oct-09 60 3.13 Meteorological data for Nov-09 62 3.14 Ambient Air Monitoring Locations 66 3.15 Instruments used for Monitoring 67 3.16 Ambient Air quality monitoring results 68 3.17 National Ambient Air quality Std 70 3.18 Noise monitoring locations in study area 73 3.19 Ambient air quality standard with respect of Noise 75 4.1 Identification of construction activities & Probable Impacts 76 4.2 Identification of operation & Maintenance activities &
probable impacts 77
5.1 Proposed Environment Monitoring Programmer of UltraTech Cement Ltd. -Magdalla
82
7.1 Mitigation measures proposed to be implemented during Construction Phase
92
7.2 Mitigation measures proposed to be implemented during Operation phase
94
7.3 Nutrient contents of some organic manure 98

Draft EIA report UltraTech Cement Limited – NCMW- SURAT
Royal environment auditing & Consultancy Services, Rajkot 14
LIST OF FIGURES Figure No. Description Page no.
1.1 Location Map of project Site 19 1.2 Satellite imaginary Map 20 2.1 Flow Diagram of existing Project 25 2.2 Flow Diagram of proposed expansion 26 2.3 Roller press 29 2.4 V-Separator in Cement Mill 29 3.1 Land use classification Area in Choryasi 40 3.2 Land Use classification Area of Village
Magdalla 41
3.3 Sex Ratio 43 3.4 Total population 45 3.5 Locations map for Air, Water and Soil Samples 55 3.6 Wind rose Diagram for Sept-09 59 3.7 Wind rose diagram for Oct-09 61 3.8 Wind rose diagram for Nov-09 63 5.1 & 7.1 Organization Chart of NCCL-Magdalla 85 & 95
LIST OF ANNEXURE
Annexure No. Description Page No. 1 Copy of CC & A 126 2 Compliance report of CC & A 127 3 Details of Hazardous Waster Generation, Storage
& Handing 130
4 Copy of Site Layout Plan 131 5 Copy of TOR 132

Draft EIA report UltraTech Cement Limited – NCMW- SURAT
Royal environment auditing & Consultancy Services, Rajkot 15
CHAPTER 1
INTRODUCTION OF THE COMPANY
1.1 NARMADA CEMENT COMPANY LIMITED (NCCL)
howgules had established Narmada Cement Company Limited
with 1.0 million ton linearization capacity in 1982 having
clinkerization plant at Jafarabad & Grinding unit at Magdalla in Gujarat and
Ratnagiri in Maharashtra. Larsen & Turbo Limited took over Narmada cement
by acquisition from Chowgules in 1999.
Aditya Birla Group taken over the Cement business of L&T along with
Narmada Cement in 2004 and made a separate company named as Ultra
Tech Cement Ltd. Later on Narmada Cement is merged with Ultra Tech
Cement Ltd. in 2006
Narmada Cement Grinding Unit was established in 1982 at Magdalla,
aimed to supply Portland Pozzolana Cement to Narmada Sarovar Dam
Project. Government of Gujarat had given full support in setting up this plant.
The Company has been accredited with ISO 9001:2008 - Quality
Management System Standard, ISO 14001:2004 – Environmental
Management System Standard and OHSAS 18001:2007 – Occupational
Health & Safety Management System Standard by the DNV CERTIFICATION B.
V., The Netherlands.
The Narmada Cement – Magdalla Works have a valid CC & A vide
order No. 7735 dated 07/06/2006, Ref. No. : CCA-SRT-639/18110 dated
08/06/2006 Valid up to 18/1/2011. Present capacity of NARMADA CEMENT
GRINDING UNIT IS 0.72 MMTPA.
C

Draft EIA report UltraTech Cement Limited – NCMW- SURAT
Royal environment auditing & Consultancy Services, Rajkot 16
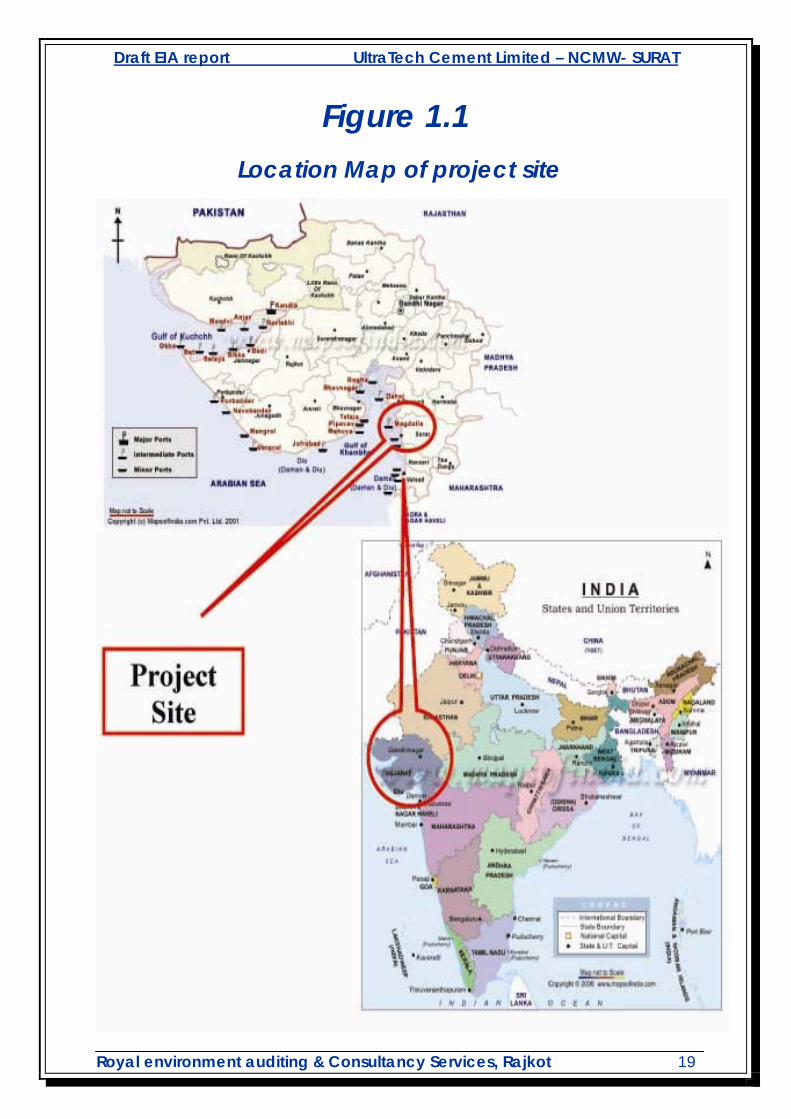
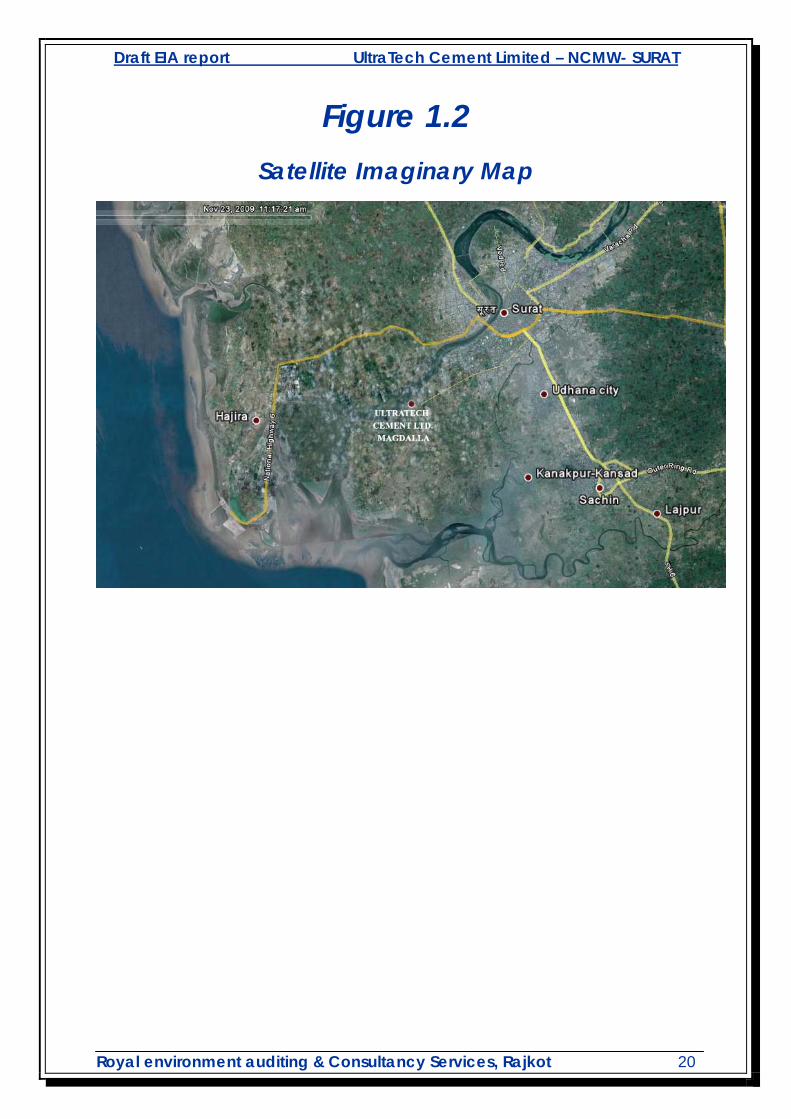
1.2 LOCATION OF THE PROJECT
The proposed expansion is within the existing premises of Narmada
Cement Grinding Unit - Magdalla Works, Surat. The location of the project is
at southern part of Gujarat. It is 20 Km away from well known Surat city.
Located At Latitude 21º 8’ N & On Longitude 72º 44’ E in South Gujarat.
On The Southern Bank of River Tapti 16 kms Upstream of River.
1.3 SCOPE OF THE STUDY
In order to identify the environmental impacts due to proposed
modernization of plant & its associated facilities by installing roller press,
clinker silo and upgrading existing cement mill capacity at Narmada
Grinding Unit - Magdalla & to draw a suitable environmental management
plan to mitigate adverse impacts, if any, an Environmental Impact
Assessment study has been undertaken.
The satellite picture of the location is shown in Figure – 1.
M/s. UltraTech Cement Limited, Unit: Narmada Cement – Magdalla
Works has retained M/s. Royal Environment Auditing & Consultancy Services,
Rajkot to carry out Environmental Impact Assessment for expansion of its
existing grinding Unit – Magdalla works, Surat.
The EIA Study covers baseline data generation, predictions and
evaluation of impact on various environmental components and formulation
of Environmental Management Plan and Disaster Management Plan. The
Scope of the EIA Study is briefly described in the following sections.
1.3.1 PROJECT DESCRIPTION
This includes a concise description of Existing process which is likely to
affect environment. It includes Type of Project, Need for the Project (based
on demand supply position), Location Details, Magnitude of Operation,
Proposed Schedule for Approval and Implementation, Project Description
(Layout, Components etc.), Mitigation Measures to meet environmental
standards, environmental operating conditions etc., presented in Chapter
Draft EIA report UltraTech Cement Limited – NCMW- SURAT
Royal environment auditing & Consultancy Services, Rajkot 17
2.0. As UltraTech Cement Limited, Narmada Cement – Magdalla Works shall
use a well established and well tested technology for Clinker Grinding and
conveying system.
1.3.2 DESCRIPTION OF THE ENVIRONMENT
The baseline environmental scenario has been established through
primary data generated in the study area and secondary data available at
site/ published in literature. The field monitoring started in first week of Sept,
2009 and completed on last week of November 2009.
The EIA Report is based on primary data collected during September
2009 to November 2009 for meteorology, air quality, and noise and
secondary data (for the relevant disciplines). The baseline environmental
scenario has been presented in Chapter 3.0 and methodologies adopted
under various disciplines are briefly described in following sections.
1.3.3 METEOROLOGY
On site meteorological data was generated during the study,
1.3.4 AIR QUALITY
Ambient Air Quality has been characterized with respect to SO2, NOx,
Suspended Particulate Matter (SPM) and Repairable Particulate Matter (RPM)
by field monitoring at eight locations The suspended particulate matter &
RSPM present in the ambient air has been analyzed and incorporated in the
report.
At each location, 24 hour sampling was undertaken twice a week. The
data was analyzed for maximum, minimum and average and compared
with National Ambient Air Quality Standards.
Draft EIA report UltraTech Cement Limited – NCMW- SURAT
Royal environment auditing & Consultancy Services, Rajkot 18
1.3.5 NOISE
A noise survey was undertaken at 6 locations within the study area and
inside the plant to assess the background noise levels in different zones Noise
levels were measured using an Integrating sound level meter and Leq values
have been calculated for 24 hours.
1.3.6 ENVIRONMENTAL MONITORING PROGRAMMER
Based on the finding of impact assessment and recommendation in
the EIA an environmental monitoring programmer has been formulated for
Narmada Cement Grinding unit - Magdalla works.
The monitoring programmer specifies the locations, parameters,
methodologies and frequency of monitoring for emissions and discharges as
well as ambient environment for the major disciplines. It is included in Chapter
5.0, i.e. Environmental Monitoring Programmer.
1.3.7 PROJECT BENEFITS
Due to development of infrastructure across the country as well as
improvement in the growth rate, Market demand for cement is increased
substantially since last 3-4 years.
To bridge the demand and supply gap in southern Gujarat and to tap
the potential of the unit, the company has proposed for expansion of existing
Grinding unit at Magdalla from 0.72 MMTPA to 2.0 MMTPA.
These aspects are summarized in Chapter 6.0.
1.3.8 ENVIRONMENTAL MANAGEMENT PLAN
It includes Environmental Management Plans for expansion of Grinding
unit and its associates facilities of UltraTech Cement Limited, Unit : Narmada
Cement – Magdalla Works. Chapter 7.0. It includes the description of the
institutional set-up for ensuring that meditative measures are implemented
and their effectiveness monitored, after approval of the EIA.
Draft EIA report UltraTech Cement Limited – NCMW- SURAT
Royal environment auditing & Consultancy Services, Rajkot 19
Figure 1.1 Location Map of project site
Draft EIA report UltraTech Cement Limited – NCMW- SURAT
Royal environment auditing & Consultancy Services, Rajkot 20
Figure 1.2 Satellite Imaginary Map

Draft EIA report UltraTech Cement Limited – NCMW- SURAT
Royal environment auditing & Consultancy Services, Rajkot 21
CHAPTER 2
PROJECT DESCRIPTION
2.1 PURPOSE OF THE PROJECT
ue to development of infrastructure across the country as well as
improvement in the growth rate, Market demand for cement is
increased substantially since last 3-4 years.
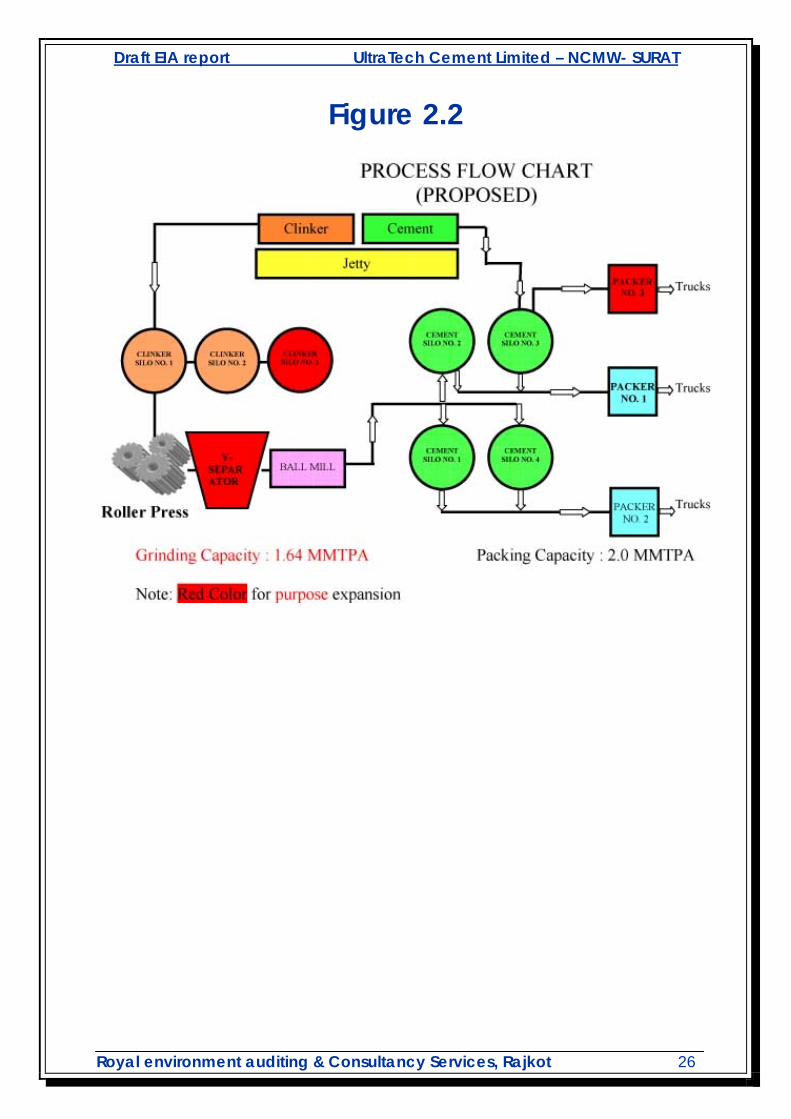
To bridge the demand and supply gap in southern Gujarat and to tap
the potential of the unit, the company has proposed for expansion of existing
Grinding unit at Magdalla from 0.72 MMTPA to 2.0 MMTPA by installing a roller
press, increasing the capacity of existing cement mill and clinker silo within a
company premises.
2.2 LOCATION & SILENT FEATURES OF THE PROJECT
Location of Project Magdalla port, Dumas Road, Surat-395007 Latitude 21º 8’ N & On Longitude 72º 44’ E in South Gujarat
Maximum Temperature
42 Deg C in March -09
Minimum Temperature
14 Deg C in Oct-09
Min Relative Humidity 51% in July-09 Max Relative Humidity 84% in Oct-09 Nearest Highway N. H. No. 8 Nearby Railway station
Surat railway station -20 km
Nearest Airport Surat Airport- 4 km Nearest Town facility Surat 15 kms from plant area Nearest settlement Gavier 2 kms Nearest river River Tapi- Southern Bank -16 kms upstream of river Nearest Forest None within 10 km Nearest Industries Ambuja cement, ABG ship yard Sensitive places None within 10 km
D
Draft EIA report UltraTech Cement Limited – NCMW- SURAT
Royal environment auditing & Consultancy Services, Rajkot 22
2.3 PROPOSED SCHEDULE FOR APPROVAL AND
IMPLEMENTATION
The zero date of the project is reckoned from the date of grant of
“Consent to Establish” (NOC) by the GPCB. The proposed expansion project
will be commissioned within 5 to 6 months from the date of grant of “Consent
to Establish” (NOC) from GPCB & Environmental Clearance from Department
of Environment and Forest, Gandhinagar. .
2.4 ANALYSIS OF ALTERNATIVE FOR SITE AND TECHNOLOGY
UltraTech cement Ltd- unit Nermada Cement ltd- Magdalla works is
proposed for expansion of existing grinding unit from 0.72 MMTPA to 2 MMTPA
at existing site i.e. village magdalla , Dist. Surat. Analysis of alternative based
on based on site and technology are given below.
2.4.1 SITE ALTERNATIVE
To set up cement grinding unit is a site specific project and it is not
possible to choose alternative site due to restriction of raw materials like fly
ash, chemical gypsum and port facilities.
Availability of land within a existing premises of the
company
Proximity to National highway no. 8
Absence of any irrigation canal or drainage channel within
a selected area.
There is no displacement
No Ecological sensitive placed within 10 KM radius
Availability of port located for finished product
transportation and receipt of raw material.
Availability of workers in nearby areas.
Draft EIA report UltraTech Cement Limited – NCMW- SURAT
Royal environment auditing & Consultancy Services, Rajkot 23
2.4.2 TECHNOLOGY ALTERNATIVE
Technical concept and equipment sizing has been
finalized based on determinates and industry norms for Cement
Grinding unit. Emphasis has been given on optimum layout, energy
efficient and environment friendly modern plant considering all project
aspects.
It is proposed to installed roller press, clinker silo and to
increase the existing cement mill capacity by installing a cyclone
separator.
The laboratory is equipped for testing of raw materials, fuel
and sample preparation as well as chemical and physical testing.
2.4.3 BRIEF PROJECT DETAILS
Nermada cement grinding unit – Magdalla works having present
capacity of 0.72 MMTPA. The unit will do expansion from 0.72 MMTPA to 2.0
MMTPA. The unit is situated on the bank of river Tapti in Surat & proposed
expansion project will be done in the existing premises of the company. No
additional land is required for proposed project.
2.4.4 DETAILS OF EXISTING FACILITIES
Jetty Details : Length : 143 Meters, Width : 11 Meters.
Draft : 2.5 – 4.5 Meters.
Jetty belongs to GMB
Built exclusively for Narmada cement operation
Plant Area : Owned:1,76,606 Sq. meter. *Leased: 22,360 Sq.
meter.
Plant Capacity: 0.72 MMTPA Cement Grinding & Packing inclusive of
0.36 MMTPA bulk cement unloading & packing facility.
Power Source : From Dakshin Gujarat Vij Company Limited [DGVCL]
66 KV Double Circuit with 4500 KVA Contract Demand
Draft EIA report UltraTech Cement Limited – NCMW- SURAT
Royal environment auditing & Consultancy Services, Rajkot 24
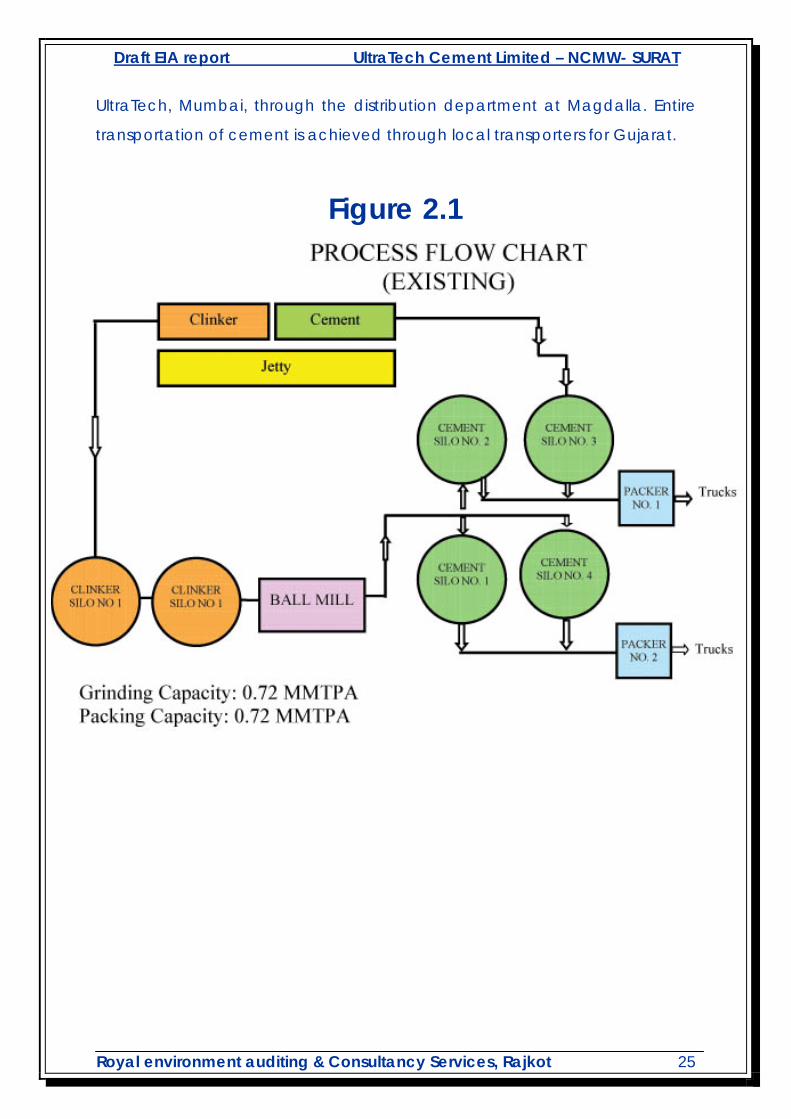
2.4.5 PROCESS DETAILS OF EXISTING GRINDING FACILITIES
Clinker is brought by ships having maximum capacity up to 2600 MT
from our mother unit, Narmada Cement – Jafarabad Works. Clinker is
unloaded with the help of clinker unloader of 300 TPH capacity installed on
river jetty and fed into the clinker silos through belt conveyors. The unloaded
clinker is stored in 2 silos having capacity of 8000 MT each. Gypsum is
procured from nearby chemical factories and fly ash from Thermal Power
Station at Ukai. We have separate storing and feeding facilities for gypsum &
fly ash. Dry chemical gypsum is fed into the gypsum bin through hopper and
belt conveyor.
The clinker and gypsum are extracted from respective storage silos/bin
in desired proportions through weigh feeders and fed to the Cement Ball Mill
having capacity of 100 TPH through belt conveyor for grinding. Ground
cement is taken to O'Sepa for separation into fine and coarse through air
slides and bucket elevators. Fine cement of desired fineness is fed to the
cement silos through air slides and bucket elevators and coarse is fed back
to mill for further grinding along with fresh feed. The cement from cement silos
is extracted and conveyed to the packer bin through air slides and bucket
elevators. The cement is packed in 50 kg HDPP bags with the help of six
spouts Electronic Packer of 90 TPH capacity. Packed cement bag is loaded
into the trucks through belt conveyors for dispatches to destination.
UTCL Magdalla is producing two types of cement namely OPC 53 and
PPC (Fly ash based). The two types of cement are stored in separate silos as
per the requirement. We have 4 nos of silos of 4000 MT capacity.
Packers are separate for OPC & PPC grade cements. We are also
dispatching cement in bulk through bousers and open trucks.
UTCL Magdalla caters market of South Gujarat and Mumbai region at
90% and 10% respectively. All orders are received from CMTG, UltraTech for
trade and non-trade (project) supply & the dispatches are executed through
road transport and logistic for the same is controlled from logistic division of
Draft EIA report UltraTech Cement Limited – NCMW- SURAT
Royal environment auditing & Consultancy Services, Rajkot 25
UltraTech, Mumbai, through the distribution department at Magdalla. Entire
transportation of cement is achieved through local transporters for Gujarat.
Figure 2.1
Draft EIA report UltraTech Cement Limited – NCMW- SURAT
Royal environment auditing & Consultancy Services, Rajkot 26
Figure 2.2
Draft EIA report UltraTech Cement Limited – NCMW- SURAT
Royal environment auditing & Consultancy Services, Rajkot 27
2.4.5 DESCRIPTION OF PROPOSED EXPANSION OF GRINDING UNIT
Now are days due to development of Infrastructure in various parts of country
the demand of Cement is increased dramatically.
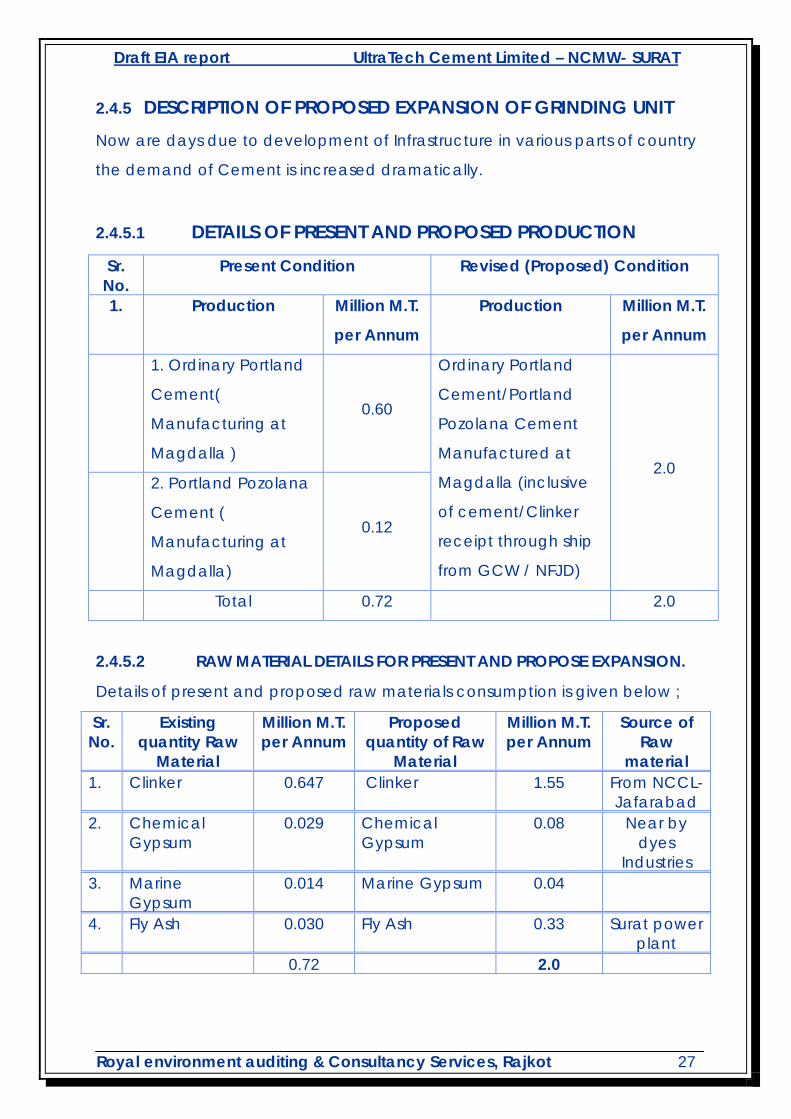
2.4.5.1 DETAILS OF PRESENT AND PROPOSED PRODUCTION
2.4.5.2 RAW MATERIAL DETAILS FOR PRESENT AND PROPOSE EXPANSION.
Details of present and proposed raw materials consumption is given below ;
Sr. No.
Existing quantity Raw
Material
Million M.T. per Annum
Proposed quantity of Raw
Material
Million M.T. per Annum
Source of Raw
material 1. Clinker 0.647 Clinker 1.55 From NCCL-
Jafarabad 2. Chemical
Gypsum 0.029 Chemical
Gypsum 0.08 Near by
dyes Industries
3. Marine Gypsum
0.014 Marine Gypsum 0.04
4. Fly Ash 0.030 Fly Ash 0.33 Surat power plant
0.72 2.0
Sr. No.
Present Condition Revised (Proposed) Condition
1. Production Million M.T.
per Annum
Production Million M.T.
per Annum
1. Ordinary Portland
Cement(
Manufacturing at
Magdalla )
0.60
Ordinary Portland
Cement/Portland
Pozolana Cement
Manufactured at
Magdalla (inclusive
of cement/Clinker
receipt through ship
from GCW / NFJD)
2.0 2. Portland Pozolana
Cement (
Manufacturing at
Magdalla)
0.12
Total 0.72 2.0

Draft EIA report UltraTech Cement Limited – NCMW- SURAT
Royal environment auditing & Consultancy Services, Rajkot 28
2.4.5.3 List of equipments Existing and Proposed: Existing list of
Equipment
Rated Capacity
in TPH
Proposed list of
Equipment
Rated Capacity
in TPH
1. Cement
Unloader 1 x 200
1. Cement
Unloader 1 x 200
2. Clinker
Unloader 1 x 300
2. Clinker
Unloader 2 x 300
3. Cement Mill 1 x 100 3. Cement Mill 1 x 205
4. Packer 2 x 90 4. Packer 3 x 90
5. Clinker
Transport 1 x 300
5. Clinker
Transport 2 x 300
6. Clinker
Storage Silo 2 x 8000 MT
6. Clinker
Storage Silo
2 x 8000 MT &
1 x 50000 MT
7. Roller Press
with V-Separator 400
7. Cement Silo 4000 MT x 4 8.Cement Silo 4000 MT x 4
8. Fly Ash Silo 450 MT x 1 9. Fly Ash Silo 450 MT x 1
450 MT x 1

Draft EIA report UltraTech Cement Limited – NCMW- SURAT
Royal environment auditing & Consultancy Services, Rajkot 29
Figure 2.3
ROLLER PRESS
Figure-2.4
V-SEPERATOR IN CEMENT MILL

Draft EIA report UltraTech Cement Limited – NCMW- SURAT
Royal environment auditing & Consultancy Services, Rajkot 30
2.4.5.4 LIST OF AIR POLLUTION CONTROL MEASURES EXISTING AND
PROPOSED.
Sr. No.
Existing list of Air Pollution control
measures
Name of existing
Equipment
Proposed list of Air Pollution control
measures
Name of Proposed
Equipment
1 Pulse Jet type Bag Filter
1. Ball Mill Pulse Jet type Bag Filter
1. Roller Press
2 -do- 2. Cement Mill -do- 2. Ball Mill
3 -do- 3. Clinker Silo-I -do- 3. Cement Mill
4 -do- 4.Clinker Silo-II -do- 4. Clinker Silo-I
5 -do- 5. Cement Silo -do- 5.Clinker Silo-II
6.Clinker Silo-III
6 -do- 6. Packer-I -do- 7. Cement Silo
7 -do- 7. Packer-II -do- 8. Packer-I
8 -do- 8. Fly Ash Bin -do- 9. Packer-II
9 -do- 9. Clinker Unloader
-do- 10. Packer-III
10 -do- 11. Fly Ash Bin
11 -do- 12. Clinker Unloader
2.5 SOURCES OF POLLUTION AND CONTROL MEASURES
2.5.1 AIR POLLUTION
2.5.1.1 SOURCES OF AIR POLLUTION
Fugitive Emission
The fugitive dust emissions from the proposed Truck loading facility would be
significant and the sources will be as under:
1. loading/Unloading of Clinker and fly ash
2. Transportation of vehicles
3. Transfer of product through belt conveyor
Draft EIA report UltraTech Cement Limited – NCMW- SURAT
Royal environment auditing & Consultancy Services, Rajkot 31
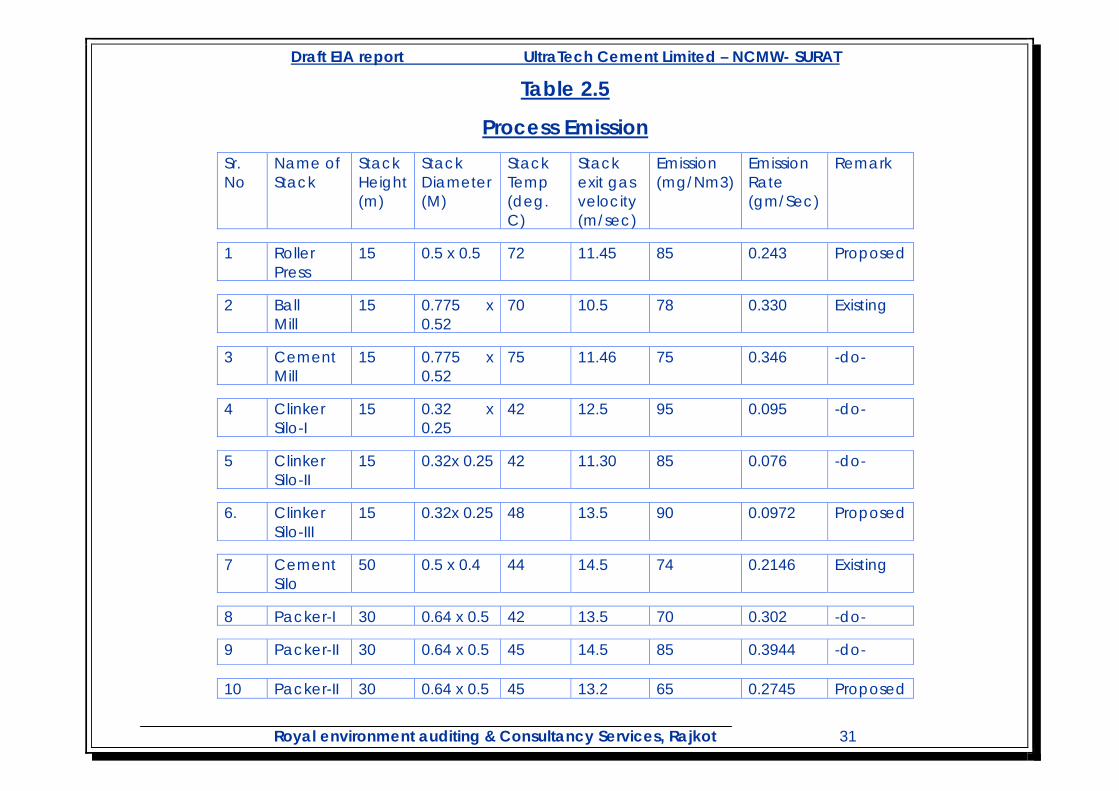
Table 2.5
Process Emission Sr. No
Name of Stack
Stack Height (m)
Stack Diameter (M)
Stack Temp (deg. C)
Stack exit gas velocity (m/sec)
Emission (mg/Nm3)
Emission Rate (gm/Sec)
Remark
1 Roller Press
15 0.5 x 0.5 72 11.45 85 0.243 Proposed
2 Ball Mill
15 0.775 x 0.52
70 10.5 78 0.330 Existing
3 Cement Mill
15 0.775 x 0.52
75 11.46 75 0.346 -do-
4 Clinker Silo-I
15 0.32 x 0.25
42 12.5 95 0.095 -do-
5 Clinker Silo-II
15 0.32x 0.25 42 11.30 85 0.076 -do-
6. Clinker Silo-III
15 0.32x 0.25 48 13.5 90 0.0972 Proposed
7 Cement Silo
50 0.5 x 0.4 44 14.5 74 0.2146 Existing
8 Packer-I 30 0.64 x 0.5 42 13.5 70 0.302 -do-
9 Packer-II 30 0.64 x 0.5 45 14.5 85 0.3944 -do-
10 Packer-II 30 0.64 x 0.5 45 13.2 65 0.2745 Proposed

Draft EIA report UltraTech Cement Limited – NCMW- SURAT
Royal environment auditing & Consultancy Services, Rajkot 32
2.5.1.2 AIR POLLUTION CONTROL MEASURES
To control fugitive emissions, the following measures are proposed.
Raw materials loading and unloading will be done in the covered
area.
Raw materials will be stored in the covered structure.
The sprinkling of water will be done along the internal roads in the
plant in order to control the dust.
All the workers and officers working inside the plant will be provided
with disposable dust masks.
Green belt will be developed around the plant to arrest the fugitive
emissions.
Bag filters & Dust Collectors will be cleaned regularly.
Maintenance of bag filters will be done regularly.
Closed belt conveyor will be used for transfer of raw material/product.
To control process dust emission the following measures are adopted .
The vent is attached to the bag filters of adequate height to disperse the air
pollutants to the satisfactory levels. The vent is regularly monitored for PM.
Bag filters will be cleaned regularly.
2.5.2. WATER POLLUTION & CONTROL MEASURES
No water is used in entire process of grinding. So, there is no waste water
generation and hence no scope of water pollution.
The only use of water i.e. drinking water and the source of effluent i.e.
sewage and hand washing.
For sewage water septic tank system is already provided.
2.5.3. Noise Pollution & Control measures
Main source of Noise pollution is vehicular movement during construction
phase. In order to reduce this following measures to be taken.
1. Speed limit of vehicle shall be restricted by 30 KMPH
Draft EIA report UltraTech Cement Limited – NCMW- SURAT
Royal environment auditing & Consultancy Services, Rajkot 33
2. Regular maintenance of vehicles shall be done
3. Ear plug or Ear muff to be used in high noise prone area.
2.6 AIR MODELLING
Gaussian dispersion Model
Assumption of the Gaussian model Release and sampling times are long compared to the travel time from
source to receptor. This means that the release is effectively steady
state and that diffusion along the mean wind direction is negligible
compared to advection. Measurement time scales of hours rather than
minutes are implied.
The material is chemically stable and is not deposited to the ground.
This means that gases must be uncreative and particles must be <20
um in diameter so that they do not sediment out. The equation of
continuity will then apply- the integral of the concentration over all
space at any time is equal to the total mass of material emitted. In
practice, most gases are deposited to some extent. This can be
allowed for by, for example an additional exponential decay factor in
the concentration with distance from the source.
The lateral and vertical variations of the material concentration can
both be described by Gaussian distributions, which are functions of x
only.
The wind speed is constant with height. This is never true in practice, as
has already been seen. Wind speed variation with height can often be
described by a logarithmic profile. More advanced versions of
Gaussian formulation divide the atmosphere up into layers, each layer
having a specified set of characteristic such as wind speed and
stability.
The wind direction is constant with height. Again this is rarely true. The
most common form of the variation is the Ekman spiral, in which the
Draft EIA report UltraTech Cement Limited – NCMW- SURAT
Royal environment auditing & Consultancy Services, Rajkot 34
direction tends towards the geotropic as height increases, over the first
few hundred meters
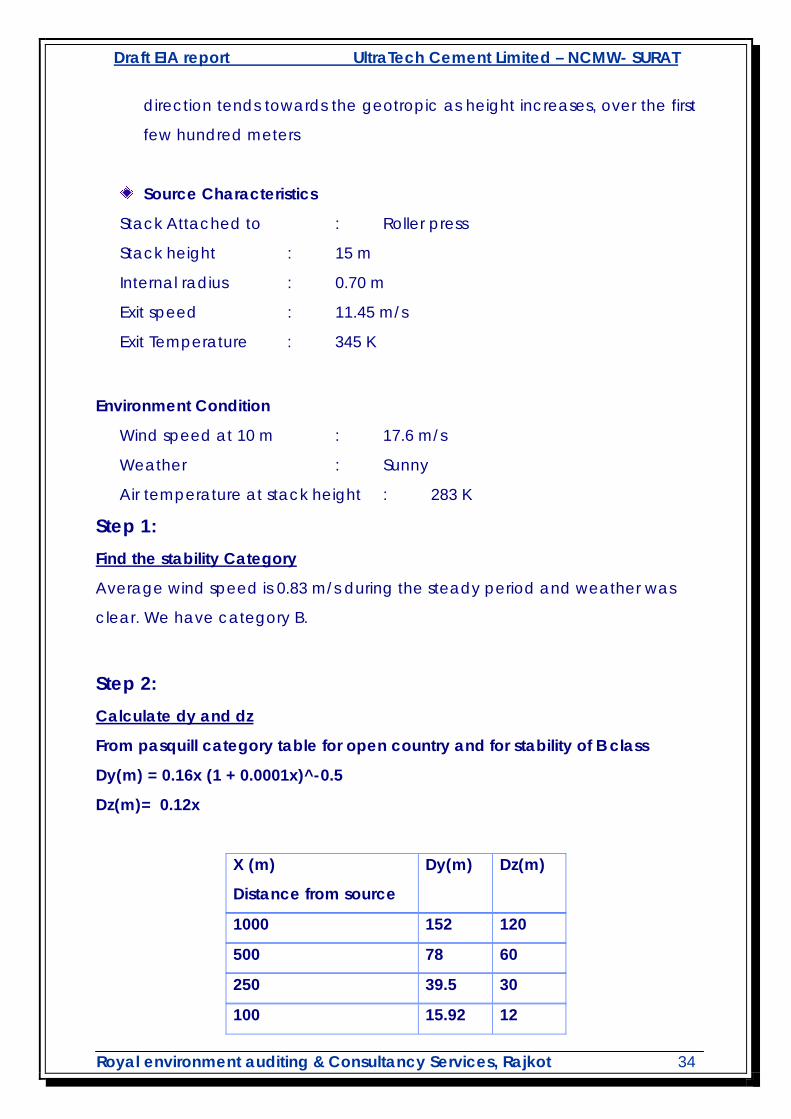
Source Characteristics
Stack Attached to : Roller press
Stack height : 15 m
Internal radius : 0.70 m
Exit speed : 11.45 m/s
Exit Temperature : 345 K
Environment Condition
Wind speed at 10 m : 17.6 m/s
Weather : Sunny
Air temperature at stack height : 283 K
Step 1: Find the stability Category
Average wind speed is 0.83 m/s during the steady period and weather was
clear. We have category B.
Step 2: Calculate dy and dz
From pasquill category table for open country and for stability of B class
Dy(m) = 0.16x (1 + 0.0001x)^-0.5
Dz(m)= 0.12x
X (m)
Distance from source
Dy(m) Dz(m)
1000 152 120
500 78 60
250 39.5 30
100 15.92 12
Draft EIA report UltraTech Cement Limited – NCMW- SURAT
Royal environment auditing & Consultancy Services, Rajkot 35
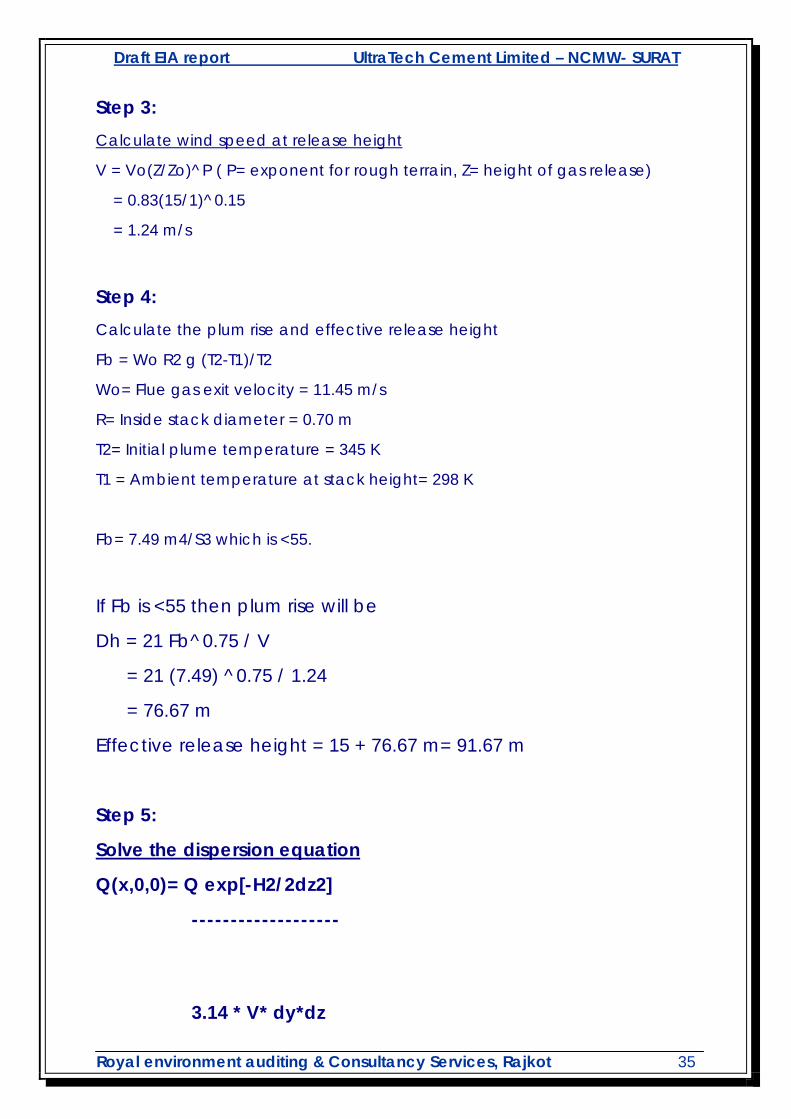
Step 3: Calculate wind speed at release height
V = Vo(Z/Zo)^P ( P= exponent for rough terrain, Z= height of gas release)
= 0.83(15/1)^0.15
= 1.24 m/s
Step 4: Calculate the plum rise and effective release height
Fb = Wo R2 g (T2-T1)/T2
Wo= Flue gas exit velocity = 11.45 m/s
R= Inside stack diameter = 0.70 m
T2= Initial plume temperature = 345 K
T1 = Ambient temperature at stack height= 298 K
Fb= 7.49 m4/S3 which is <55.
If Fb is <55 then plum rise will be
Dh = 21 Fb^0.75 / V
= 21 (7.49) ^0.75 / 1.24
= 76.67 m
Effective release height = 15 + 76.67 m= 91.67 m
Step 5:
Solve the dispersion equation
Q(x,0,0)= Q exp[-H2/2dz2]
-------------------
3.14 * V* dy*dz

Draft EIA report UltraTech Cement Limited – NCMW- SURAT
Royal environment auditing & Consultancy Services, Rajkot 36
X(m) Dy Dz Concentration of SPM at x distance
from source(ug/M3)
1000 152 120 2.651
500 78 60 4.76
250 39.5 30 18.84
Above results are well below the permissible limits.
Draft EIA report UltraTech Cement Limited – NCMW- SURAT
Royal environment auditing & Consultancy Services, Rajkot 37
CHAPTER 3
DESCRIPTION OF ENVIRONMENT 3.0 SITE AND SURROUNDING AREA
his chapter describes the existing environmental conditions of the study
area, which covers an area within 10 km radius around proposed
expansion of Narmada cement limit Grinding Unit- Magdalla works and its
associates facility. The methodology of establishing baseline environmental
scenario has been briefly described in Chapter 1.0 and further details of data
generation/ collection; analysis and interpretation are presented in the
respective sections in this chapter.
The entire study area falls in Surat district Gujarat. The study area shows flat
topography in the vicinity of the project site. The field monitoring started at
site on first week of September 2009. Apart from primary data generated
during the field monitoring, additional data was also collected from
secondary sources like Indian Meteorological Department (IMD)- Surat.
3.1 LAND USE
Land is the most vital resource for sustenance of life and degradations of land
use to industrialization; urbanization and population growth is a matter of
concern. Therefore, it is necessary to establish the existing land use pattern to
optimize the land use as well as minimize degradation due to the
developmental activities.
The basic of land use classification for the purpose of EMP study report is to
define the distribution of the existing land according to its actual use. The
land use pattern indicates the manner in which different parts of land in the
study area is being utilized or un-utilized. It is an important indicator of
environmental health and human activity and a degree of inter-play
between these two.
T
Draft EIA report UltraTech Cement Limited – NCMW- SURAT
Royal environment auditing & Consultancy Services, Rajkot 38
Even though the soil quality, water availability and climatic conditions have
strong influence on agriculture and vegetation, the human activity may alter
the natural environment to a large extent to suit human needs. Unsuitable
land use often triggers rapid environmental deterioration and disturbs
ecological balance.
The objectives of the present study are:
• To map the study area with respect to various land use/land cover
categories
• To identify the sensitive areas within 10 km radius around the project site.
The land use pattern has been established based on Census Data of 2001
and truth verifications. Ground and ancillary information have been used to
identify the sensitive places within 10 km radius of the proposed project.
3.1.1 LAND USE CLASSIFICATION BASED ON CENSUS DATA 2001
In traditional revenue records in India, major land use classifications are; (a)
Hills and rocky land, (b) Forests, (c) Pastures (d) Hebetated areas (e)
Cultivated areas (f) Cultural wasteland (g) Un-cultural wasteland. The land
use classification has varied somewhat from state to state and often
overlaps. Furthermore, combining of two or more categories into a single one
could also be found.
The above classification appears to be partly a land classification and partly
a land use classification. Only large-scale shifts in land use pattern, such as,
forests areas converted in to cultivated area can be observed from revenue
records. The shifting in cropping pattern, on the cultivated areas, is a slightly
better and more sensitive indicator of change in environmental quality but
even this reflects human manipulation due to environmental changes.
Draft EIA report UltraTech Cement Limited – NCMW- SURAT
Royal environment auditing & Consultancy Services, Rajkot 39
As outlined earlier, the study area for this project encompasses areas falling
within a 10 km radius of the plant site. The entire study area falls in Surat
district in one Taluka namely Chorasi in Gujarat. As per the census records -
2001, the area is predominantly rural in character.
The Census records, do not classify land as ‘Hilly and rocky’ or ‘Pastures’ or
‘Hebetated area.’ It appears that, ‘Hilly and rocky’ areas are included in
‘Uncultivable land,’ Pastures are included in ‘Cultivable waste land’ and
‘Hebetated area’ are included in ‘Area not available for cultivation’. In
revenue records total land of a village is classified in two categories (a)
Cultural land (b) Un-cultural land. Cultivable land is further sub-classified into
cultivated area and cultural wasteland. Un-Cultivable land includes
hebetated area, forest and pasture land covered by roads and buildings.
Land use pattern as per the census records of 2001, has been classified in the
following categories:
Forest
Cultivated Land
Irrigated Land
Un-irrigated Land
Cultivable wasteland
Area not available for cultivation
i) The following points are important to be mentioned regarding the land
use pattern described in this chapter :
ii) Taluka has been used as a unit of civic administration as used in the
census records for the state of Gujarat.
iii) Land use classes have been computed on the basis of land use area of
industrial villages, falling totally or partly as the case may be, within the study
area.

Draft EIA report UltraTech Cement Limited – NCMW- SURAT
Royal environment auditing & Consultancy Services, Rajkot 40
iv) Land use area does not always tally with the geographical area, as
there are waterways etc. that may not be included in the land use statistics
of the villages. Summary of land use pattern data has been presented in
Table below.
TABLE 3.1 Land Use Classification Area (Hectare %) of Ta. chorasi
Land Use Classification Area In
Hectare
Irrigated 9891.08
Un irrigated 9551.15
Cultivable Waste land 5725.2
Area Not Available for cultivation 10378.19
Figure: 3.1
Land Use Classification Area of Ta. Chorasi
27.83%
26.87%16.11%
29.20% Irrigated
Unirrigated
Culturable waste land
Area not available forcultivation
Draft EIA report UltraTech Cement Limited – NCMW- SURAT
Royal environment auditing & Consultancy Services, Rajkot 41
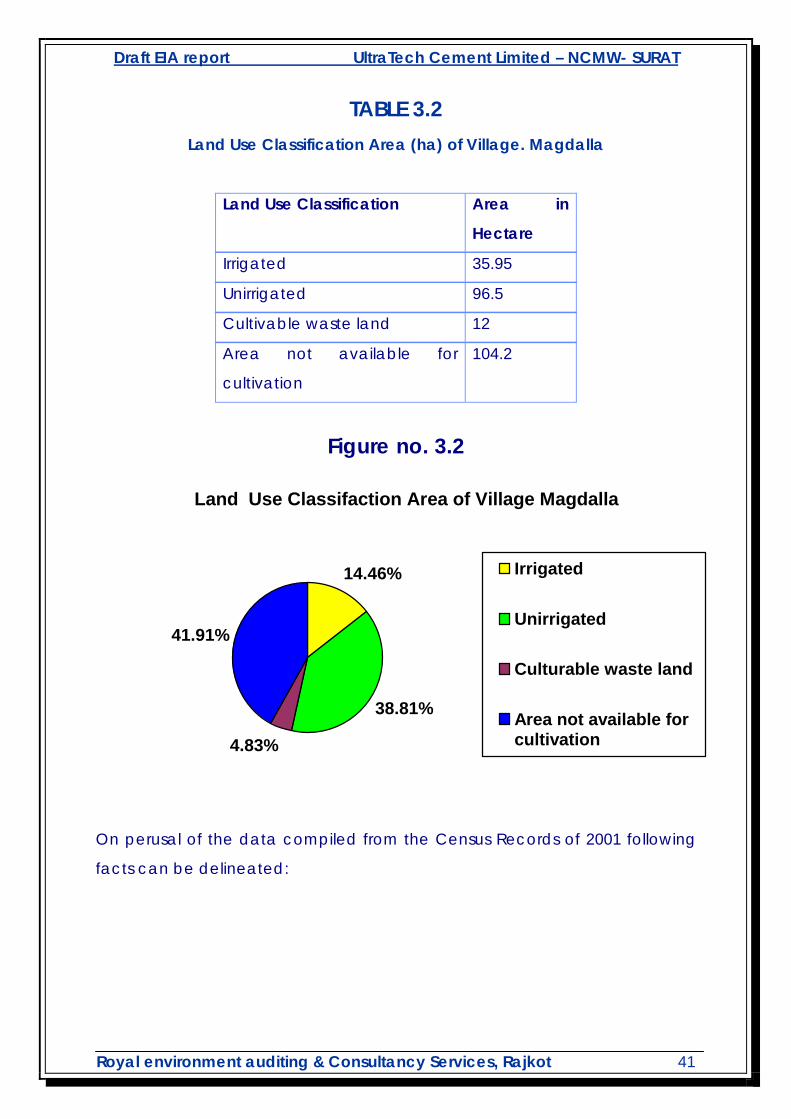
TABLE 3.2 Land Use Classification Area (ha) of Village. Magdalla
Land Use Classification Area in
Hectare
Irrigated 35.95
Unirrigated 96.5
Cultivable waste land 12
Area not available for
cultivation
104.2
Figure no. 3.2
Land Use Classifaction Area of Village Magdalla
14.46%
38.81%
4.83%
41.91%
Irrigated
Unirrigated
Culturable waste land
Area not available forcultivation
On perusal of the data compiled from the Census Records of 2001 following
facts can be delineated:

Draft EIA report UltraTech Cement Limited – NCMW- SURAT
Royal environment auditing & Consultancy Services, Rajkot 42
3.2 DEMOGRAPHY AND SOCIO-ECONOMIC
Demography and socio-economic features include population, number
of houses and households, literacy, population density etc. In order to assess
the demographic features of the study area, census data of Surat District in
Gujarat for the year 2001 have been compiled and analyzed.
3.2.1 DEMOGRAPHIC PROFILE OF THE STUDY AREA
3.2.1.1 HOUSEHOLDS/OCCUPIED RESIDENTIAL HOUSES AND TOTAL
POPULATION
The total 127,093 households in Chorasi Taluka as well as residential houses
distributed over 62 villages as per census record of 2001.
The total 1,234 households in Magdalla village as per census record of 2001.
Total Population:
The\ total population of the village Magdalla stood at 5,257 out of which
Total population of males is 2,831 & Females is 2,426 as per the census record
of 2001.
While total population of Chorasi Taluka stood at 585,733 out of which total
population of males is 340,020 and females are 245,713 as per the census
record of 2001.

Draft EIA report UltraTech Cement Limited – NCMW- SURAT
Royal environment auditing & Consultancy Services, Rajkot 43
Figure 3.3 Sex Ratio
Total Population For Magdalla
Male 53.85%
Female 46.15% Male
Female
Total Population For Taluka : Chorasi
Female41.95%
Male58.05%
MaleFemale
3.2.1.2 Sex Ratio
In the village Magdalla area, there were 857 females for every thousand
males, Whereas in total Chorasi Taluka, there were 723 females for every
thousand males, as per the census records of 2001.
3.2.1.3 Scheduled Castes and Scheduled Tribes
Draft EIA report UltraTech Cement Limited – NCMW- SURAT
Royal environment auditing & Consultancy Services, Rajkot 44
Scheduled Castes & Scheduled Tribes
As per the census data of 2001, scheduled caste population observed was
18111 and scheduled Tribe population was 54811 in the Chorasi Taluka.
The proportion of SC was 3 % and ST was 9 % of total population in the
Chorasi Taluka.
Major scheduled caste recorded in the study area are Mahyavansi, Bhambi
and Mahar etc. and the major scheduled tribes shown in the study area area
Gamit, Bhil and Chaudhari.
3.2.1.4 Literacy
A person who can both read and write with understanding in any language is
taken as literate according to Indian Census.
As per Census of India 2001 total literate population of Taluka Chorasi is
407,445 which is 81 % of the total population.
3.2.2 SOCIO-ECONOMIC PROFILE OF THE STUDY AREA
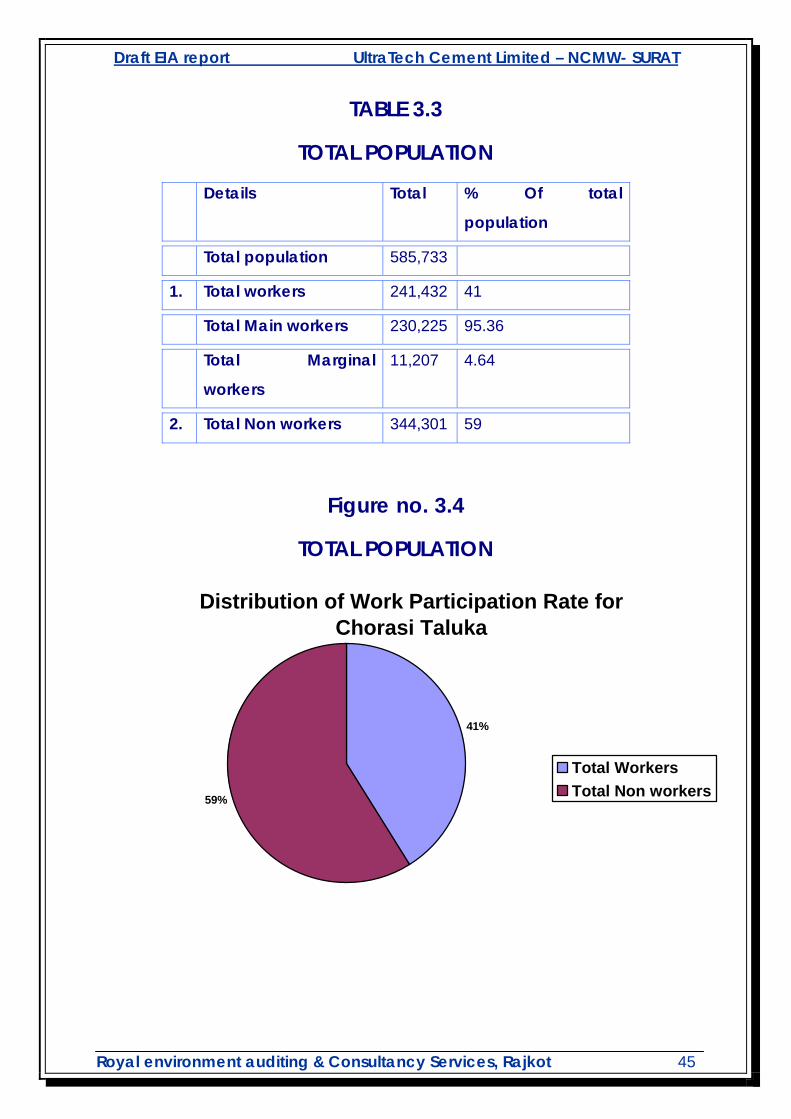
3.2.2.1 Distribution of Work Participation Rate
The work participation rate for total workers is defined as the percentage of
total workers to the total population. In a similar way it is defined for main and
marginal workers.
The work participation rate for total workers is defined as the percentage of
total workers to total population. In a similar way it is defined for main,
marginal and non-workers.
Draft EIA report UltraTech Cement Limited – NCMW- SURAT
Royal environment auditing & Consultancy Services, Rajkot 45
TABLE 3.3
TOTAL POPULATION
Details Total % Of total
population
Total population 585,733
1. Total workers 241,432 41
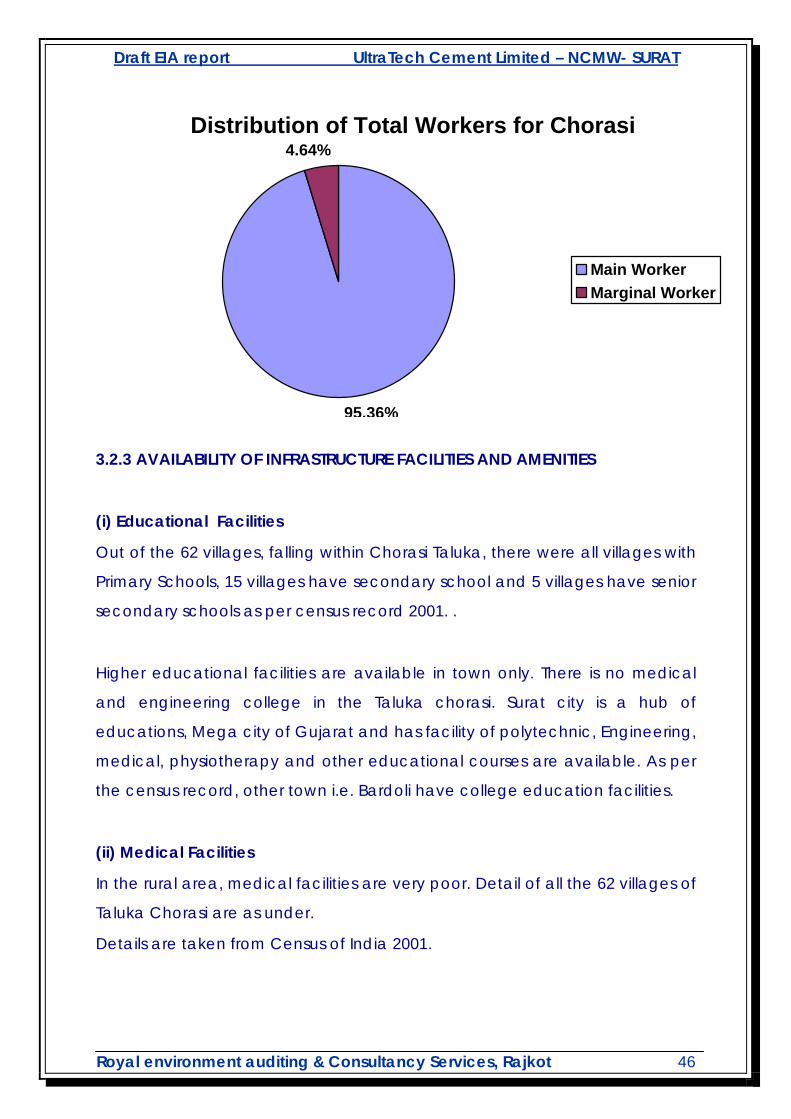
Total Main workers 230,225 95.36
Total Marginal
workers
11,207 4.64
2. Total Non workers 344,301 59
Figure no. 3.4
TOTAL POPULATION
Distribution of Work Participation Rate for Chorasi Taluka
41%
59%
Total WorkersTotal Non workers
Draft EIA report UltraTech Cement Limited – NCMW- SURAT
Royal environment auditing & Consultancy Services, Rajkot 46
Distribution of Total Workers for Chorasi
95.36%
4.64%
Main WorkerMarginal Worker
3.2.3 AVAILABILITY OF INFRASTRUCTURE FACILITIES AND AMENITIES
(i) Educational Facilities
Out of the 62 villages, falling within Chorasi Taluka, there were all villages with
Primary Schools, 15 villages have secondary school and 5 villages have senior
secondary schools as per census record 2001. .
Higher educational facilities are available in town only. There is no medical
and engineering college in the Taluka chorasi. Surat city is a hub of
educations, Mega city of Gujarat and has facility of polytechnic, Engineering,
medical, physiotherapy and other educational courses are available. As per
the census record, other town i.e. Bardoli have college education facilities.
(ii) Medical Facilities
In the rural area, medical facilities are very poor. Detail of all the 62 villages of
Taluka Chorasi are as under.
Details are taken from Census of India 2001.

Draft EIA report UltraTech Cement Limited – NCMW- SURAT
Royal environment auditing & Consultancy Services, Rajkot 47
TABLE 3.4
Medical Facilities
Sr.
No.
Details Total
no
Total no of villages
have facilities
Availabl
e
Not
available
1 Number of Medical facilities 62 42 20
2 Number of Allopathic
Hospitals 62 4 58
3 Number of Family Welfare
Centre 62 6 56
4 Number of Meternity Home 62 4 58
(iii) Drinking Water Facilities
In the rural area, drinking water facility is present in most of the villages. Rivers,
Wells and tube wells are the major sources of drinking water. In the rural part
of the study area, almost all the villages are enjoying tap water facility
provided by the Gram Panchayat its community development
programmer.
(iv) Postal Facilities
In the study area, post and telegraph facility is available in the most of
villages.
Details of postal Facilities as per Census of India 2001 are as under in total 62
villages of Taluka Chorasi.
Draft EIA report UltraTech Cement Limited – NCMW- SURAT
Royal environment auditing & Consultancy Services, Rajkot 48
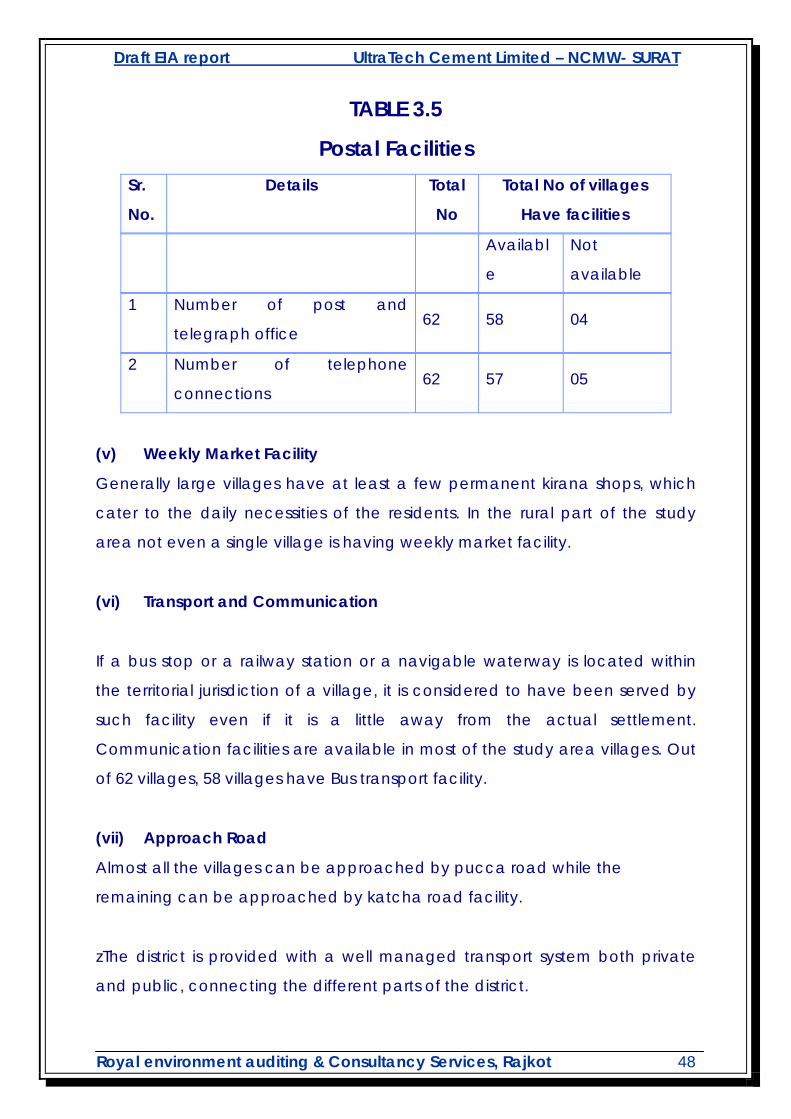
TABLE 3.5
Postal Facilities Sr.
No.
Details Total
No
Total No of villages
Have facilities
Availabl
e
Not
available
1 Number of post and
telegraph office 62 58 04
2 Number of telephone
connections 62 57 05
(v) Weekly Market Facility
Generally large villages have at least a few permanent kirana shops, which
cater to the daily necessities of the residents. In the rural part of the study
area not even a single village is having weekly market facility.
(vi) Transport and Communication
If a bus stop or a railway station or a navigable waterway is located within
the territorial jurisdiction of a village, it is considered to have been served by
such facility even if it is a little away from the actual settlement.
Communication facilities are available in most of the study area villages. Out
of 62 villages, 58 villages have Bus transport facility.
(vii) Approach Road
Almost all the villages can be approached by pucca road while the
remaining can be approached by katcha road facility.
zThe district is provided with a well managed transport system both private
and public, connecting the different parts of the district.
Draft EIA report UltraTech Cement Limited – NCMW- SURAT
Royal environment auditing & Consultancy Services, Rajkot 49
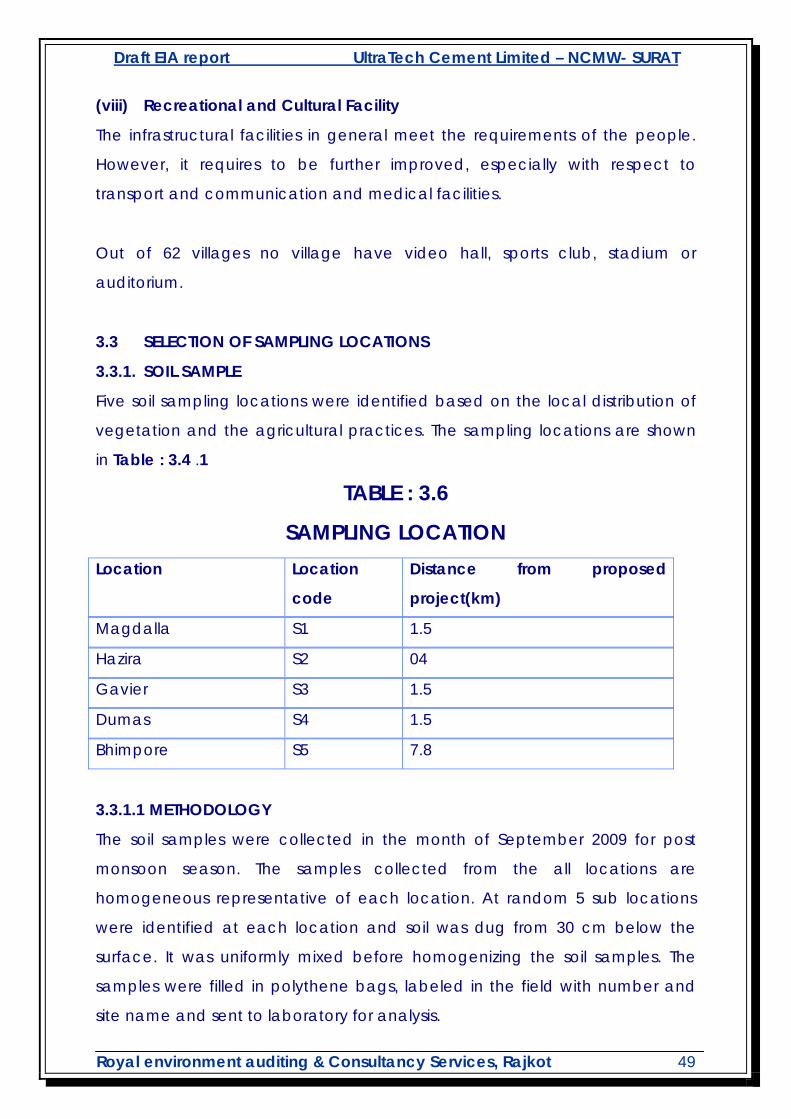
(viii) Recreational and Cultural Facility
The infrastructural facilities in general meet the requirements of the people.
However, it requires to be further improved, especially with respect to
transport and communication and medical facilities.
Out of 62 villages no village have video hall, sports club, stadium or
auditorium.
3.3 SELECTION OF SAMPLING LOCATIONS
3.3.1. SOIL SAMPLE
Five soil sampling locations were identified based on the local distribution of
vegetation and the agricultural practices. The sampling locations are shown
in Table : 3.4 .1
TABLE : 3.6
SAMPLING LOCATION
Location Location
code
Distance from proposed
project(km)
Magdalla S1 1.5
Hazira S2 04
Gavier S3 1.5
Dumas S4 1.5
Bhimpore S5 7.8
3.3.1.1 METHODOLOGY
The soil samples were collected in the month of September 2009 for post
monsoon season. The samples collected from the all locations are
homogeneous representative of each location. At random 5 sub locations
were identified at each location and soil was dug from 30 cm below the
surface. It was uniformly mixed before homogenizing the soil samples. The
samples were filled in polythene bags, labeled in the field with number and
site name and sent to laboratory for analysis.
Draft EIA report UltraTech Cement Limited – NCMW- SURAT
Royal environment auditing & Consultancy Services, Rajkot 50
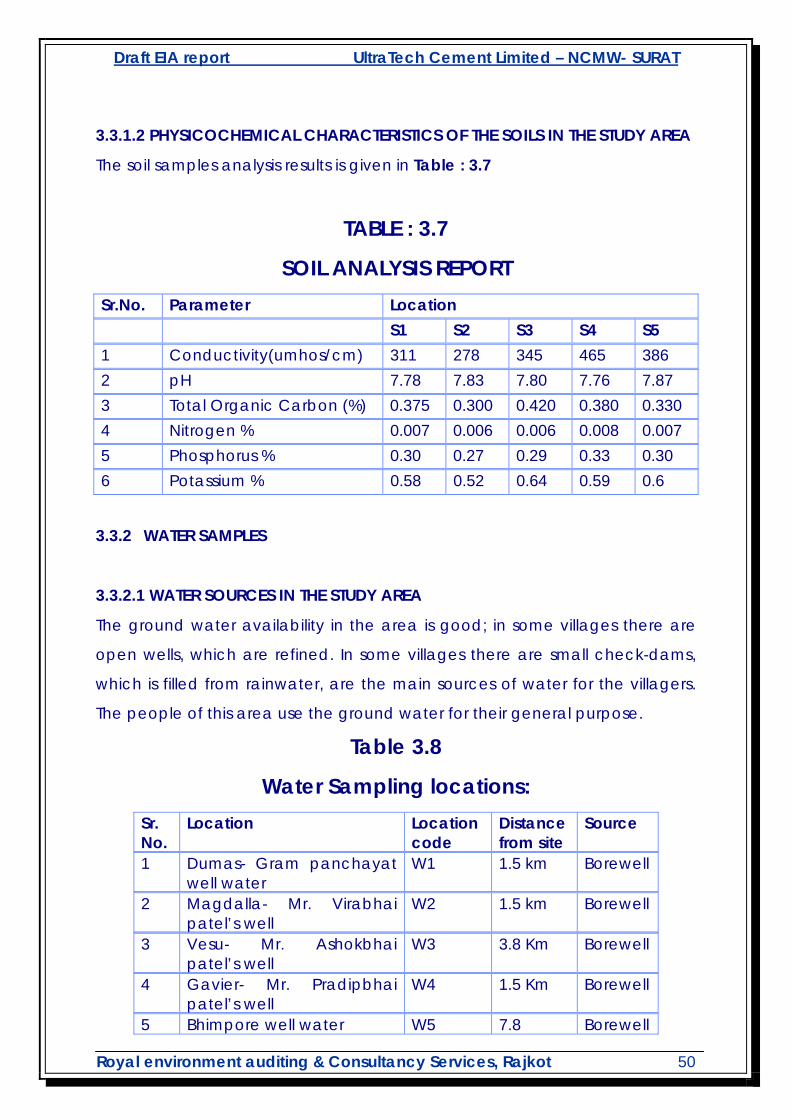
3.3.1.2 PHYSICOCHEMICAL CHARACTERISTICS OF THE SOILS IN THE STUDY AREA
The soil samples analysis results is given in Table : 3.7
TABLE : 3.7
SOIL ANALYSIS REPORT Sr.No. Parameter Location S1 S2 S3 S4 S5 1 Conductivity(umhos/cm) 311 278 345 465 386 2 pH 7.78 7.83 7.80 7.76 7.87 3 Total Organic Carbon (%) 0.375 0.300 0.420 0.380 0.330 4 Nitrogen % 0.007 0.006 0.006 0.008 0.007 5 Phosphorus % 0.30 0.27 0.29 0.33 0.30 6 Potassium % 0.58 0.52 0.64 0.59 0.6
3.3.2 WATER SAMPLES
3.3.2.1 WATER SOURCES IN THE STUDY AREA
The ground water availability in the area is good; in some villages there are
open wells, which are refined. In some villages there are small check-dams,
which is filled from rainwater, are the main sources of water for the villagers.
The people of this area use the ground water for their general purpose.
Table 3.8
Water Sampling locations: Sr. No.
Location Location code
Distance from site
Source
1 Dumas- Gram panchayat well water
W1 1.5 km Borewell
2 Magdalla- Mr. Virabhai patel’s well
W2 1.5 km Borewell
3 Vesu- Mr. Ashokbhai patel’s well
W3 3.8 Km Borewell
4 Gavier- Mr. Pradipbhai patel’s well
W4 1.5 Km Borewell
5 Bhimpore well water W5 7.8 Borewell
Draft EIA report UltraTech Cement Limited – NCMW- SURAT
Royal environment auditing & Consultancy Services, Rajkot 51
3.3.2.2 METHODOLOGY OF SAMPLING AND ANALYSIS
Water samples were collected on monthly basis during the study period and
analyzed for selected physico-chemical and biological parameters. The
parameters such as pH, temperature and DO were analyzed at the site itself
at the time of collection of sample (with the help of water testing kit
developed by CPCB) while for other parameter, samples were preserved and
analysed in laboratory. Samples were collected, preserved and analyzed as
per methods given in Standard Methods for the Examination of Water and
Waste Water (APHA, AWWA and WPCF).
The water quality characteristics of the study area have been established
through monthly monitoring of the following parameters:
a) Physical Parameters – pH, Total Solids, TDS and dissolved oxygen.
b) Chemical parameters – Alkalinity, Total Hardness, NO3, Chloride, Sulfate,
Ca, Mg, Phosphate
c) Heavy Metals – Copper, Iron, Chromium, Cadmium, Lead, Zinc etc.
Map of Sampling location w.r.t. Ambient Air Quality; Soil; Water and Noise is
given Figure – 5.

Draft EIA report UltraTech Cement Limited – NCMW- SURAT
Royal environment auditing & Consultancy Services, Rajkot 52
TABLE 3.9
ANALYSIS OF WATER FROM SURROUDING AREA Sr. No.
Parameters W1 W2 W3 W4 W5 IS-10500 Desirable limit
Permissible limit
01. pH 8.5 8.7 8.6 8.8 7.3 6.5-8.5 02. TDS 560 470 1870 470 1070 03. S.S. 125 135 430 128 238 04. T.S. 685 605 2300 598 1308 05. Chloride 55 90 490 95 225 250 1000 06. Sulfate 7 11 108 11 55 07. Total
Hardness 100 220 440 220 340 300 600
08. Ca Hardness
60 130 300 120 230 75 200
09. Mg Hardness
40 90 140 100 110
10. Alkalinity 130 120 110 90 90 11 Phosphate 0.001 0.008 0.007 0.006 0.001 12 Dissolved
Oxygen 6.9 6.7 6.5 6.3 6.2
13 Oil & grease
<0.2 <0.2 <0.2 <0.2 <0.2 0.01 0.03
14 Arsenic(as As)
<0.02 <0.02 <0.02 <0.02 <0.02 0.05 NR
15 Mercury(as Hg)
<0.0001
<0.0001
<0.0001
<0.0001
<0.0001
0.001 NR
16 Lead(as pb)
<0.002
<0.002
<0.002
<0.002 <0.002
0.05 NR
17 Cadmium(As cd)
<0.002
<0.002
<0.002
<0.002 <0.002
0.01 NR
18 Hexavalent chromium
<0.004
<0.004
<0.004
<0.004 <0.004
0.05 NR
19 Copper(as Cu)
<0.004
<0.004
<0.004
<0.004 <0.004
0.05 1.5
20 Zinc(as Zn) 0.028 0.019 0.015 N.D. N.D. 5 15 21 Selenium(a
s Se) <0.001
<0.001
<0.001
<0.001 <0.001
0.01 NR
22 Iron(as Fe) 0.18 0.14 0.12 0.1 0.1 0.088 1 23 Phenolic
compound <0.005
<0.005
<0.005
<0.005 <0.005
0.001 0.002
* Desirable limit specified in Indian Specifications for Drinking Water (IS: 10500
– 1991)

Draft EIA report UltraTech Cement Limited – NCMW- SURAT
Royal environment auditing & Consultancy Services, Rajkot 53
** Permissible limit, in absence of alternate source specified in IS: 10500 – 1991.
All the units are in mg/l except pH.
3.3.3 Conclusion
pH of drinking water of study area varies from 7.3 to 8.8
Total dissolved solid varies from 470 to 1870 mg/l
Total dissolved oxygen varies from 6.2 to 6.9 mg/l
Chloride varies from 55 to 490 mg/l
Total Hardness varies from 100 to 440 mg/l
Metallic impurities are very less in all the samples.
Water from all the sample point can be use for drinking water.
WATER SAMPLES COLLECTION FROM SURROUNDING AREA
Draft EIA report UltraTech Cement Limited – NCMW- SURAT
Royal environment auditing & Consultancy Services, Rajkot 54
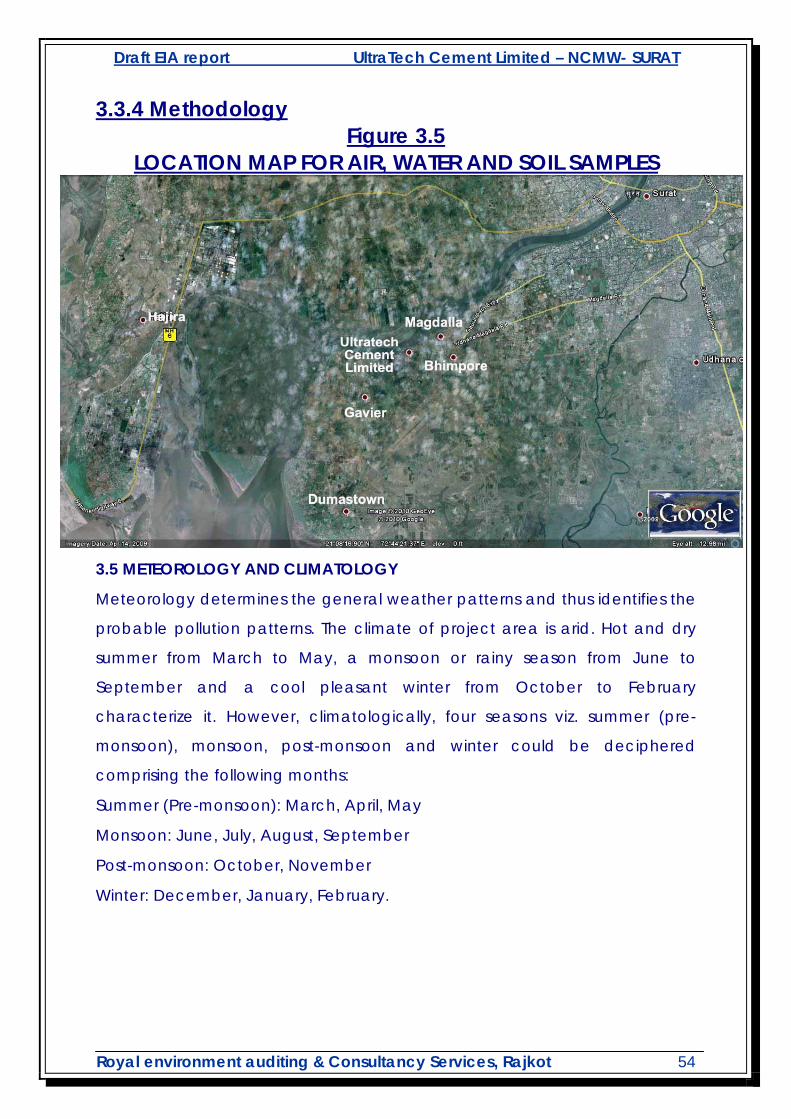
3.3.4 Methodology Figure 3.5
LOCATION MAP FOR AIR, WATER AND SOIL SAMPLES
3.5 METEOROLOGY AND CLIMATOLOGY
Meteorology determines the general weather patterns and thus identifies the
probable pollution patterns. The climate of project area is arid. Hot and dry
summer from March to May, a monsoon or rainy season from June to
September and a cool pleasant winter from October to February
characterize it. However, climatologically, four seasons viz. summer (pre-
monsoon), monsoon, post-monsoon and winter could be deciphered
comprising the following months:
Summer (Pre-monsoon): March, April, May
Monsoon: June, July, August, September
Post-monsoon: October, November
Winter: December, January, February.
Draft EIA report UltraTech Cement Limited – NCMW- SURAT
Royal environment auditing & Consultancy Services, Rajkot 55
3.5.1 Past Records
3.5.1.1 Data Collected
Analysis of past records brings out the synoptic features of the area.
Climatologically data was collected from the nearest meteorological station
operated by Indian Meteorological Department (IMD) at Surat located
about 20 km from the project site and the data recorded at this station has
been used to describe the climatology of the area.
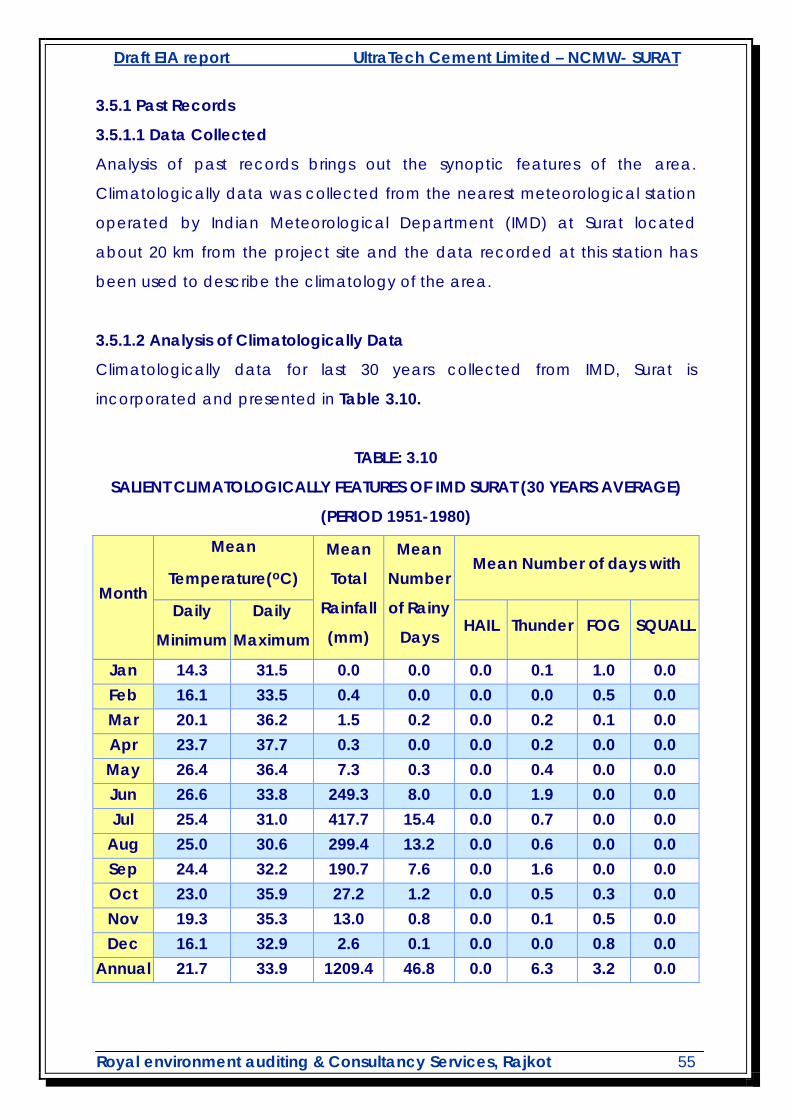
3.5.1.2 Analysis of Climatologically Data
Climatologically data for last 30 years collected from IMD, Surat is
incorporated and presented in Table 3.10.
TABLE: 3.10
SALIENT CLIMATOLOGICALLY FEATURES OF IMD SURAT (30 YEARS AVERAGE)
(PERIOD 1951-1980)
Month
Mean
Temperature(oC)
Mean
Total
Rainfall
(mm)
Mean
Number
of Rainy
Days
Mean Number of days with
Daily
Minimum
Daily
Maximum HAIL Thunder FOG SQUALL
Jan 14.3 31.5 0.0 0.0 0.0 0.1 1.0 0.0 Feb 16.1 33.5 0.4 0.0 0.0 0.0 0.5 0.0 Mar 20.1 36.2 1.5 0.2 0.0 0.2 0.1 0.0 Apr 23.7 37.7 0.3 0.0 0.0 0.2 0.0 0.0 May 26.4 36.4 7.3 0.3 0.0 0.4 0.0 0.0 Jun 26.6 33.8 249.3 8.0 0.0 1.9 0.0 0.0 Jul 25.4 31.0 417.7 15.4 0.0 0.7 0.0 0.0
Aug 25.0 30.6 299.4 13.2 0.0 0.6 0.0 0.0 Sep 24.4 32.2 190.7 7.6 0.0 1.6 0.0 0.0 Oct 23.0 35.9 27.2 1.2 0.0 0.5 0.3 0.0 Nov 19.3 35.3 13.0 0.8 0.0 0.1 0.5 0.0 Dec 16.1 32.9 2.6 0.1 0.0 0.0 0.8 0.0
Annual 21.7 33.9 1209.4 46.8 0.0 6.3 3.2 0.0
Draft EIA report UltraTech Cement Limited – NCMW- SURAT
Royal environment auditing & Consultancy Services, Rajkot 56
3.5.1.3 RAINFALL
The average annual rainfall is about 1209.4 mm. Rainfall peaks during June
(about 249.3 mm) followed by July (about 417.7 mm) with the four monsoon
months (June to September) contributing 96% of the total rainfall.
3.5.1.4 TEMPERATURE
The average annual minimum temperature is 21.7 deg C and average
annual maximum temperature is 33.9 deg C.
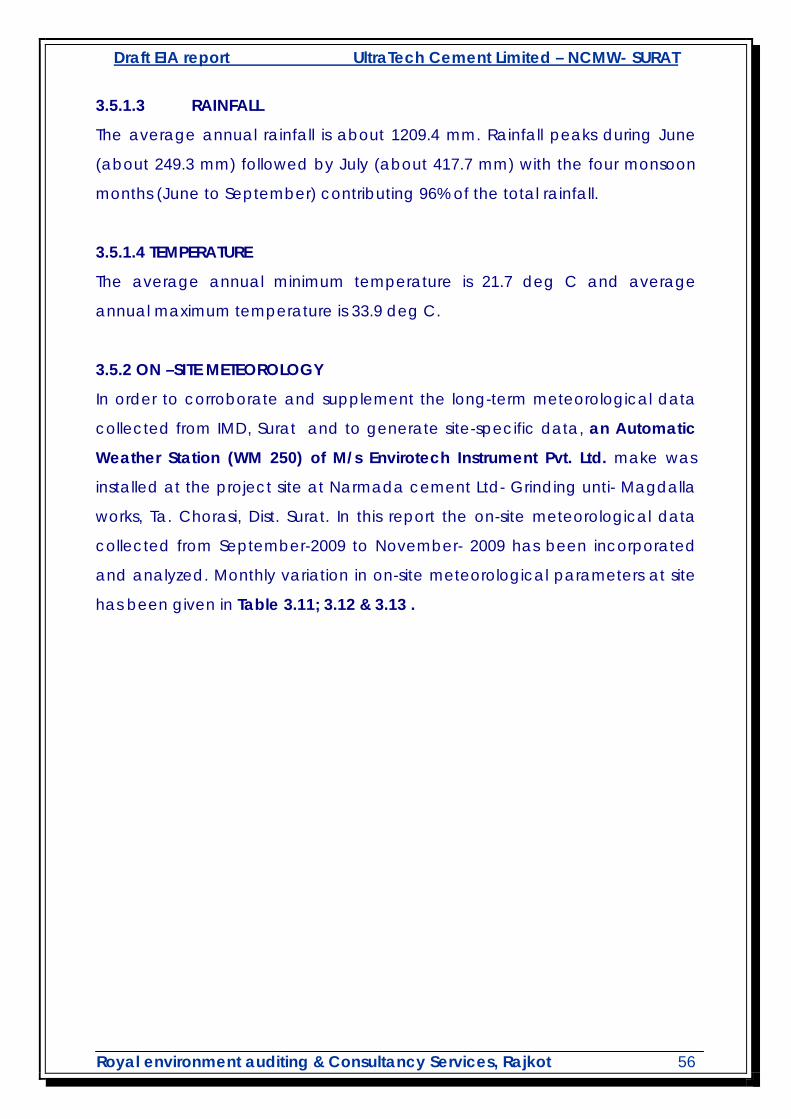
3.5.2 ON –SITE METEOROLOGY
In order to corroborate and supplement the long-term meteorological data
collected from IMD, Surat and to generate site-specific data, an Automatic
Weather Station (WM 250) of M/s Envirotech Instrument Pvt. Ltd. make was
installed at the project site at Narmada cement Ltd- Grinding unti- Magdalla
works, Ta. Chorasi, Dist. Surat. In this report the on-site meteorological data
collected from September-2009 to November- 2009 has been incorporated
and analyzed. Monthly variation in on-site meteorological parameters at site
has been given in Table 3.11; 3.12 & 3.13 .
Draft EIA report UltraTech Cement Limited – NCMW- SURAT
Royal environment auditing & Consultancy Services, Rajkot 57
TABLE: 3.11
METEROLOGICAL DATA FOR SEPTEMBER-09 Date
Date
Temp o C Temp o C Humidity
(%)
Wind
Direction
Wind Speed (km/hr)
Velocity (km/hr) Min Max Dry Wat
1-9-09 17 34 28 26 69 NE SW 2.0
2-9-09 17 33 36 30 63 NE SW 1.0
3-9-09 14 28 28 26 69 NE SW 1.7
4-9-09 14 29 36 30 63 NE SW 3.3
5-9-09 13 33 34 26 51 NE SW 4.0
6-9-09 15 36 34 26 51 NE SW 4.0
7-9-09 18 39 38 26 69 NE SW 1.0
8-9-09 18 39 34 26 51 NE SW 1.0
9-9-09 17 38 38 26 69 NE SW 2.0
10-9-09 18 39 38 26 69 NE SW 1.0
11-9-09 17 39 38 26 69 NE SW 1.0
12-9-09 17 38 32 28 73 NE SW 1.5
13-9-09 16 39 32 28 73 NE SW 2.0
14-9-09 16 38 38 26 69 NE SW 2.5
15-9-09 17 39 38 26 69 NE SW 2.0
16-9-09 18 39 34 26 51 SW NE 1.0
17-9-09 17 38 34 56 51 SW NE 1.2
21-9-09 16 38 34 26 51 NE SW 1.0
22-9-09 19 38 34 26 51 NE SW 1.0
23-9-09 16 37 36 30 63 SW NE 1.3
24-9-09 18 39 34 26 51 SW NE 2.2
25-9-09 16 36 34 26 51 SW NE 2.0
26-9-09 17 38 36 30 63 SW NE 3.5
27-9-09 16 36 36 30 63 SW NE 1.2
28-9-09 17 36 36 30 63 SW NE 3.5
29-9-09 18 37 36 30 63 SW NE 3.0
30-9-09 17 38 32 28 73 SW NE 5.1
Draft EIA report UltraTech Cement Limited – NCMW- SURAT
Royal environment auditing & Consultancy Services, Rajkot 58
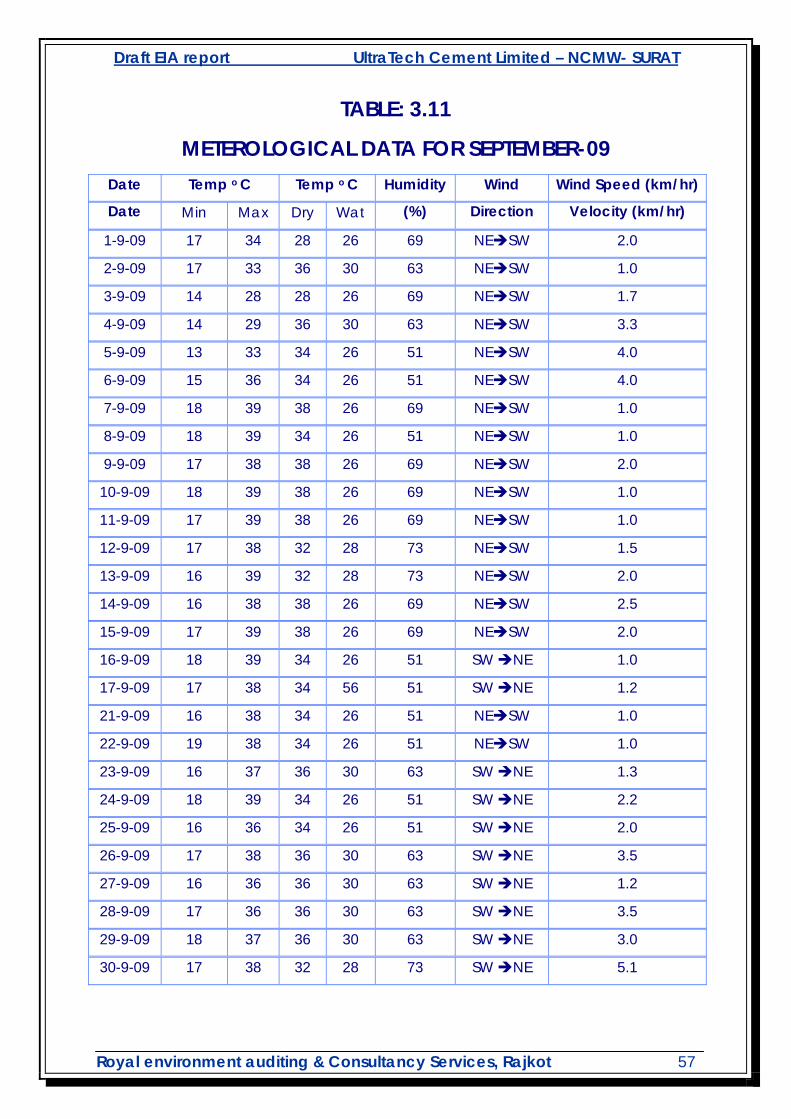
Figure no. 3.6

Draft EIA report UltraTech Cement Limited – NCMW- SURAT
Royal environment auditing & Consultancy Services, Rajkot 59
TABLE: 3.12 METEROLOGICAL DATA FOR OCTOBER-09
Date Temp o C Temp o C Humidity (%)
Wind Direction
Wind Velocity (km/hr)
Min Max Dry Wet
1-10-09 16 36 34 26 51 SW NE 8.1 2-10-09 17 37 34 26 51 SW NE 2.0 3-10-09 16 38 34 26 51 SW NE 3.1 4-10-09 16 34 32 28 73 SW NE 2.0 5-10-09 16 35 36 30 63 NE SW 3.5 6-10-09 15 36 36 30 63 NE SW 1.5 7-10-09 15 37 34 30 74 NE SW 1.6 8-10-09 15 37 32 28 73 SW NE 8.3 9-10-09 15 38 34 30 74 SW NE 9.3
10-10-09 14 39 25 23 84 SW NE 3.3 11-10-09 16 38 32 28 73 NE SW 1.5 12-10-09 17 38 30 26 72 NE SW 1.5 13-10-09 15 40 30 26 72 NE SW 1.0 14-10-09 14 39 30 23 53 NE SW 0.9 15-10-09 15 38 30 23 53 NE SW 1.0 16-10-09 14 37 30 26 72 NE SW 1.0 17-10-09 15 36 30 24 71 NE –SW 1.2 18-10-09 14 37 30 26 72 NE-SW 1.3 19-10-09 15 37 30 26 73 NE-SW 1.3 20-10-09 16 35 30 26 72 NE SW 1.3 21-10-09 17 36 32 28 73 NE SW 2.0 22-10-09 14 37 32 25 73 NE SW 2.0 24-10-09 16 34 32 24 73 SW NE 1.5 25-10-09 15 33 32 28 73 SW NE 2.2 26-10-09 14 34 36 30 63 SW NE 2.0 27-10-09 17 33 30 28 73 SW NE 1.0 28-10-09 19 35 32 28 13 SW NE 2.2 29-10-09 20 39 25 23 84 SE NW 1.0 30-10-09 19 40 25 23 84 SE NW 0.8 31-10-09 20 39 32 28 73 SE NW 0.3

Draft EIA report UltraTech Cement Limited – NCMW- SURAT
Royal environment auditing & Consultancy Services, Rajkot 60
Figure no. 3.7
Draft EIA report UltraTech Cement Limited – NCMW- SURAT
Royal environment auditing & Consultancy Services, Rajkot 61
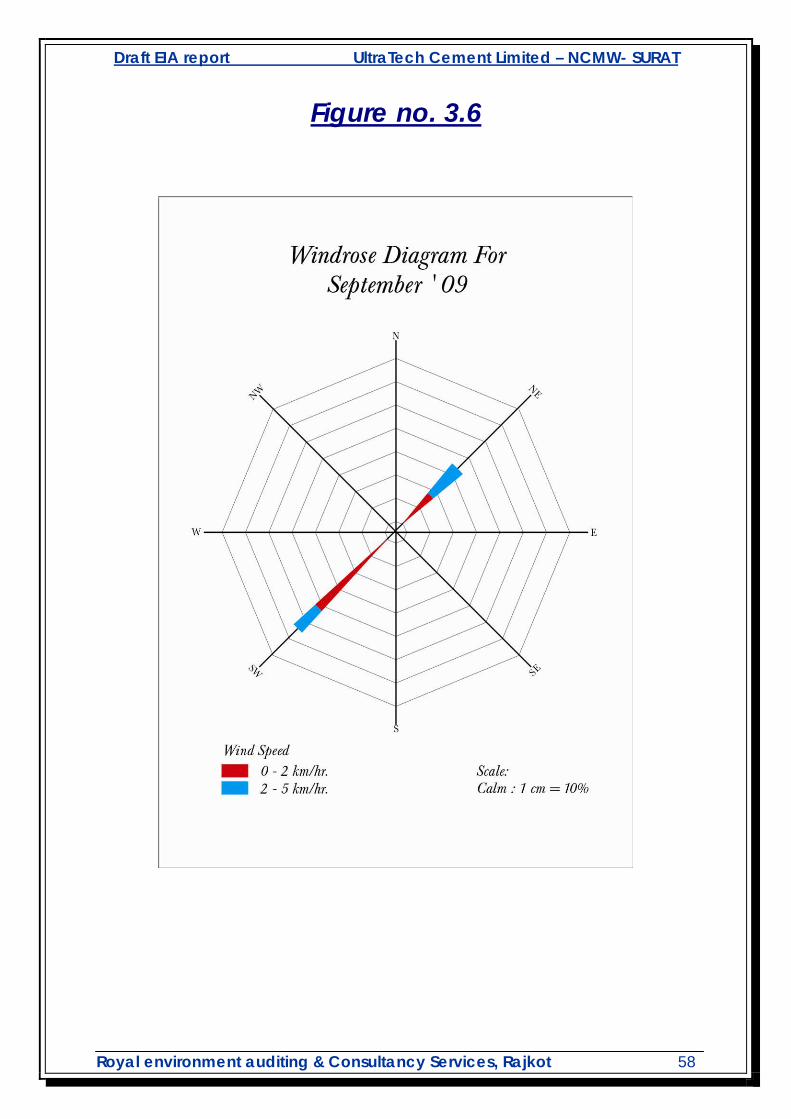
TABLE: 3.13
METEROLOGICAL DATA FOR NOVEMBER-09
Date
Temp o C Temp o C Humidity (%)
Wind Direction
Wind Velocity (km/hr)
Min Max Dry Wat
1-11-09 17 35 30 23 53 SW NE 1.5 2-11-09 16 39 30 26 72 SW NE 1.5 3-11-09 20 41 30 23 53 SW NE 0.8 4-11-09 22 41 32 28 73 NE SW 0.8 5-11-09 20 39 32 28 73 NE SW 0.5 6-11-09 22 40 31 22 44 NE->SW 0.7 7-11-09 21 41 32 28 73 SE->NW 1.5 8-11-09 22 39 30 23 53 SW->NE 2 9-11-09 25 39 30 23 53 SE->NW 3.5
10-11-09 22 28 23 21 83 SE->NW 2.5 11-11-09 21 28 23 21 83 SE->NW 5 12-11-09 20 30 23 21 83 SE->NW 20 13-11-09 20 37 23 21 83 SE->NW 27.7 14-11-09 15 36 23 21 83 SE->NW 1.5 15-11-09 14 36 24 22 83 SE->NW 1 16-11-09 14 37 25 23 84 SE->NW 1 17-11-09 14 37 25 23 84 SE->NW 1 18-11-09 21 36 26 22 69 SE->NW 1 19-11-09 11 38 26 22 69 SE->NW 2.9 20-11-09 21 35 26 22 69 SE->NW 1 21-11-09 20 38 28 22 57 NE->SW 2.4 22-11-09 21 36 28 22 57 NE->SW 1.1 23-11-09 22 37 26 22 57 NE->SW 0.8 24-11-09 23 36 25 21 58 NE->SW 1.1 25-11-09 20 38 23 21 83 SE->NW 0.6 26-11-09 20 38 24 21 83 NE->SW 0.6 27-11-09 20 35 23 22 83 SE->NW 0.5 28-11-09 20 40 26 21 83 SE->NW 0.5 29-11-09 21 39 26 22 69 SE->NW 0.5 30-11-09 20 38 26 22 69 SE->NW 0.5
Draft EIA report UltraTech Cement Limited – NCMW- SURAT
Royal environment auditing & Consultancy Services, Rajkot 62
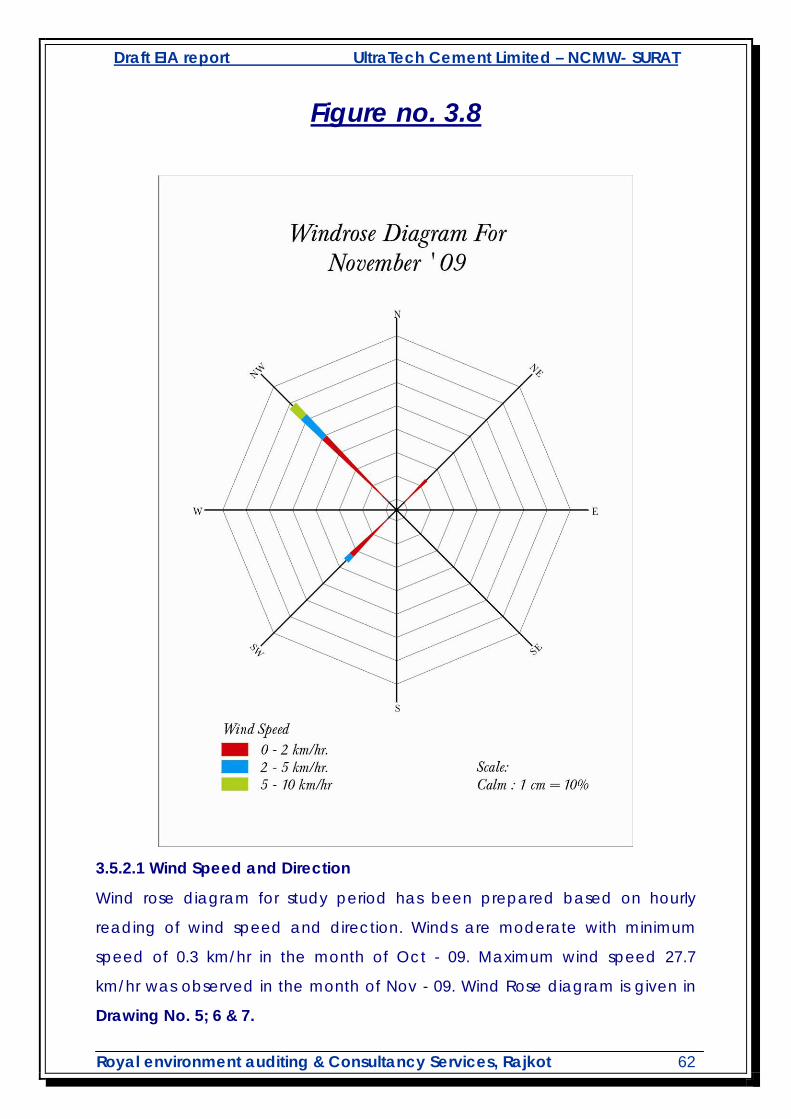
Figure no. 3.8
3.5.2.1 Wind Speed and Direction
Wind rose diagram for study period has been prepared based on hourly
reading of wind speed and direction. Winds are moderate with minimum
speed of 0.3 km/hr in the month of Oct - 09. Maximum wind speed 27.7
km/hr was observed in the month of Nov - 09. Wind Rose diagram is given in
Drawing No. 5; 6 & 7.
Draft EIA report UltraTech Cement Limited – NCMW- SURAT
Royal environment auditing & Consultancy Services, Rajkot 63
3.5.2.2 Temperature
Minimum temperature was recorded as 11 deg C in the month of November-
09 & while the maximum temperature observed was 40 deg 0C in the Oct-
09.
3.5.2.3 Relative Humidity
Minimum relative humidity was observed as 51 % in the month of September-
09 and Octomber-09 and Maximum relative humidity was observed as 84 in
the month of Octomber-09 respectively.
3.5.2.4 Rainfall
During study period no rainfall recorded.
3.6 AMBIENT AIR QUALITY
The prime objective of the baseline study with respect to ambient air quality is
to establish the present air quality and its conformity to ambient air quality
standards. This data has been further used during impact assessment to
predict the resultant ambient air quality during operation of proposed jetty
expansion and its associates facilities, The sources of air pollution at the site
are vehicular traffic, loading and unloading of cements, dust arising from
roads and during transfer of raw materials and product. .
This section describes the identification of monitoring locations; methodology
adopted for monitoring, frequency of monitoring and results of monitoring
during the study period (September 2009 – November-2009).
3.6.1 METHODOLOGY ADOPTED FOR THE STUDY
3.6.2 CRITERIA FOR SELECTION OF MONITORING LOCATIONS
The baseline status of the ambient air quality has been established on the
basis of the following considerations:
Draft EIA report UltraTech Cement Limited – NCMW- SURAT
Royal environment auditing & Consultancy Services, Rajkot 64
1. Meteorological conditions;
2. Representative ness of locations for obtaining baseline status; and
3. Representative ness of likely affected area.
Three ambient air quality monitoring locations were selected on the basis of
likely affected zones during construction and operation of the plant and also
keeping in view the above mentioned points. The location of human
workplace and above features within the study area have been considered
in selection of ambient air quality monitoring locations.
Logistic considerations as easy accessibility, security, availability of reliable
power supply etc were also examined while finalizing the locations.
The Ambient Air Quality Monitoring locations are shown in below table.
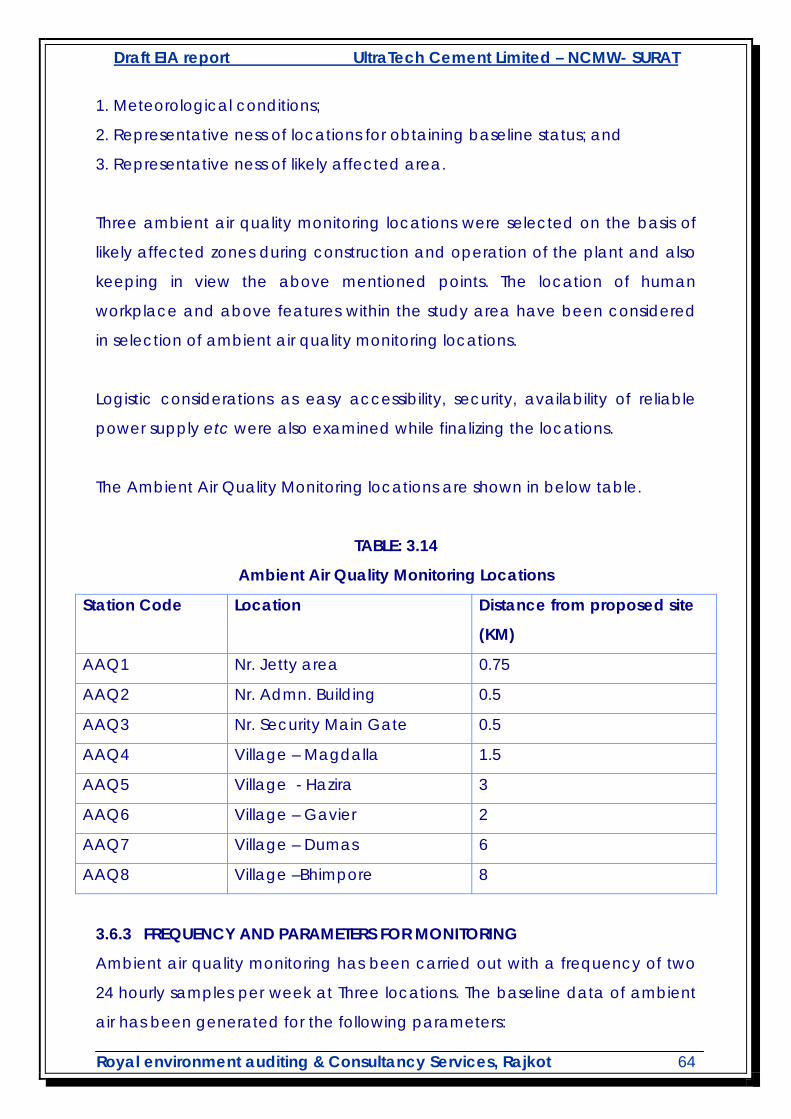
TABLE: 3.14
Ambient Air Quality Monitoring Locations
Station Code Location Distance from proposed site
(KM)
AAQ1 Nr. Jetty area 0.75
AAQ2 Nr. Admn. Building 0.5
AAQ3 Nr. Security Main Gate 0.5
AAQ4 Village – Magdalla 1.5
AAQ5 Village - Hazira 3
AAQ6 Village – Gavier 2
AAQ7 Village – Dumas 6
AAQ8 Village –Bhimpore 8
3.6.3 FREQUENCY AND PARAMETERS FOR MONITORING
Ambient air quality monitoring has been carried out with a frequency of two
24 hourly samples per week at Three locations. The baseline data of ambient
air has been generated for the following parameters:
Draft EIA report UltraTech Cement Limited – NCMW- SURAT
Royal environment auditing & Consultancy Services, Rajkot 65
Suspended Particulate Matter (SPM);
Respirable Particulate Matter (RPM);
Sulphur Dioxide (SO2); and
Oxides of Nitrogen (NOx);
3.6.4 DETAILS OF THE MONITORING LOCATIONS
The monitoring locations represent the areas of maximum deposition,
reference ambient air quality and location characteristics.
3.6.5 INSTRUMENT USED FOR SAMPLING
Repairable Dust Samplers APM – 460 BL, Gaseous Attachment APM-451 of
Envirotech Instruments Pvt. Ltd. make were installed for monitoring Suspended
Particulate Matter (SPM), Respirable fraction (<10 microns) and gaseous
pollutants like SO2 and NOx.
3.6.6 SAMPLING AND ANALYTICAL TECHNIQUE
Suspended Particulate Matter (SPM), RPM, SO2 and NOx
SPM and RSPM present in ambient air is sucked through the cyclone. Coarse
and non repairable dust is separated from the air stream by centrifugal forces
acting on the solid particles matter and RSPM present in these separated
particulates fall through the cyclone’s conical hopper and collected in the
sampling cap placed at the bottom. The fine dust (<10 microns) forming the
repairable fraction of the SPM passes the cyclone and is retained by the filter
paper. A tapping is provided on the suction side of the blower to provide
suction for sampling air through a set of impinges. The techniques used for
ambient air quality monitoring are as under:
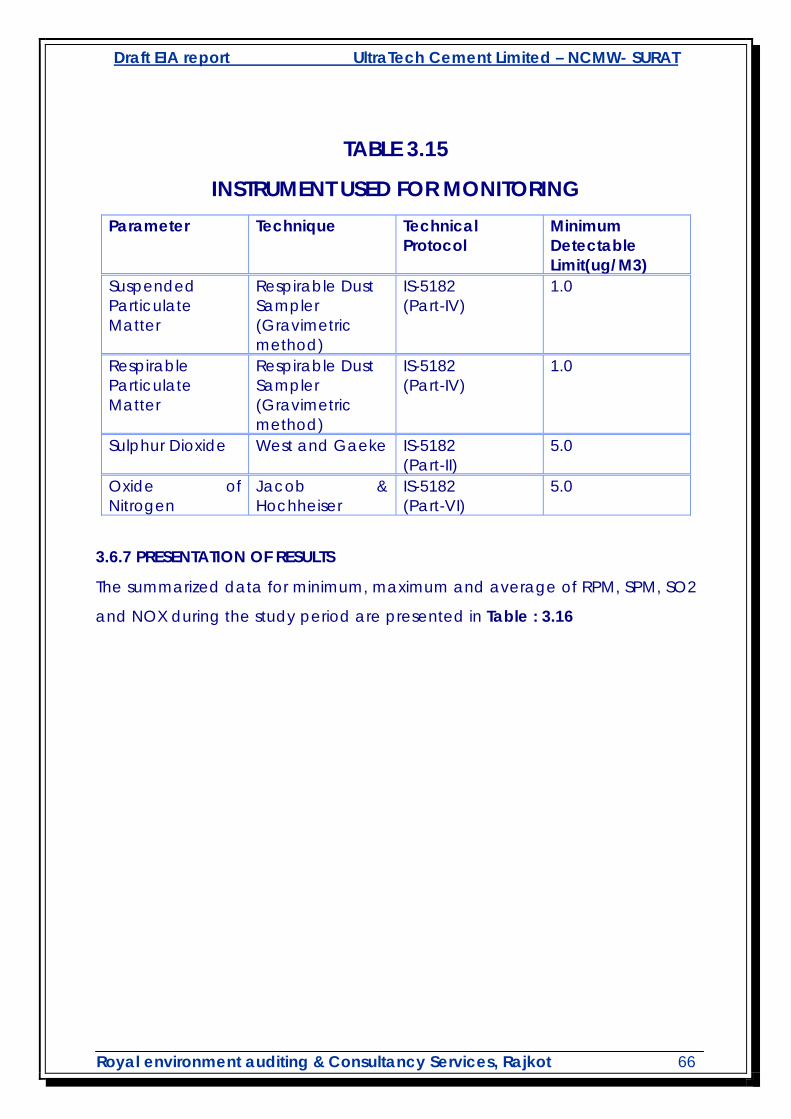
Draft EIA report UltraTech Cement Limited – NCMW- SURAT
Royal environment auditing & Consultancy Services, Rajkot 66
TABLE 3.15
INSTRUMENT USED FOR MONITORING Parameter Technique Technical
Protocol Minimum Detectable Limit(ug/M3)
Suspended Particulate Matter
Respirable Dust Sampler (Gravimetric method)
IS-5182 (Part-IV)
1.0
Respirable Particulate Matter
Respirable Dust Sampler (Gravimetric method)
IS-5182 (Part-IV)
1.0
Sulphur Dioxide West and Gaeke IS-5182 (Part-II)
5.0
Oxide of Nitrogen
Jacob & Hochheiser
IS-5182 (Part-VI)
5.0
3.6.7 PRESENTATION OF RESULTS
The summarized data for minimum, maximum and average of RPM, SPM, SO2
and NOX during the study period are presented in Table : 3.16

Draft EIA report UltraTech Cement Limited – NCMW- SURAT
Royal environment auditing & Consultancy Services, Rajkot 67
TABLE: 3.16
AMBIENT AIR QUALITY MONITORING RESULTS Pollutant Unit Location Min Max Avg SPM Ug/m3 AAQ1
AAQ2 AAQ3 AAQ4 AAQ5 AAQ6 AAQ7 AAQ8
145 120 135 122 120 115 108 100
166 134 176 139 145 130 125 120
155.5 127 155.5 130.5 132.5 122.5 116.5 110
RPM Ug/m3 AAQ1 AAQ2 AAQ3 AAQ4 AAQ5 AAQ6 AAQ7 AAQ8
27 24 33 23 25 27 25 23
36 34 40 37 39 33 38 33
31.5 29 36.5 30 32 30 31.5 28
S02 Ug/m3 AAQ1 AAQ2 AAQ3 AAQ4 AAQ5 AAQ6 AAQ7 AAQ8
7.3 6.4 7.9 7.1 6.2 6.7 6.0 6.3
9.7 9.6 13.7 10.1 9.0 8.9 8.5 8.3
8.5 8.0 10.8 8.6 7.6 7.8 7.25 7.3
N0X Ug/m3 AAQ1 AAQ2 AAQ3 AAQ4 AAQ5 AAQ6 AAQ7 AAQ8
9.8 10.1 10.9 10.2 10.0 9.8 10.5 10.7
10.2 14.4 15.3 16.0 17.5 14.6 13.8 13.0
10 12.25 12.5 13.1 13.75 12.2 12.15 11.85
3.6.8 OBSERVATION BASED ON MONITORING DATA
The observations based on the monitoring results presented in Table have
been summarized below.
Draft EIA report UltraTech Cement Limited – NCMW- SURAT
Royal environment auditing & Consultancy Services, Rajkot 68
3.6.8.1 SUSPENDED PARTICULATE MATTER (SPM)
The maximum value of SPM 176 µg/m3 observed at security main gate &
lowest concentration was observed at village Bhimpore which is 100 µg/m3
during the study period.
The average concentration of SPM varied from 110 µg/m3 to 155.5 µg/m3 at
all monitoring locations during the study period, which is well below the
permissible limit of 200 µg/m3 for residential/ rural area.
3.6.8.2 RESPIRABLE PARTICULATE MATTER (RPM)
The maximum value of RPM was observed at security main gate 40 µg/m3
and lowest 23 µg/m3 at village Bhimpore.
The average concentration of RPM varied from 28 µg/m3 to 36.5 µg/m3. At
all the locations, the concentration of RPM was observed within the
permissible limit of 100 µg/m3 for 24 hourly in a residential area.
3.6.8.3 SULPHUR DIOXIDE (SO2)
The highest concentration of SO2 was observed as 13.7 µg/m3 at security
gate and lowest concentration 6.3 µg/m3 at village Bhimpore.
The average concentration of SO2 varied from 10.8 µg/m3 to 7.3 µg/m3. At
all the locations, the concentrations of SO2 were within the permissible limit of
80.0 µg/m3 in residential /rural area as per National Ambient Air Quality
Standards.
3.6.8.4 OXIDE OF NITROGEN (NOx)
Highest concentration of NOx observed as 17.5 µg/m3 at hazira village &
lowest concentration of 9.8 µg/m3 at village Gavier.

Draft EIA report UltraTech Cement Limited – NCMW- SURAT
Royal environment auditing & Consultancy Services, Rajkot 69
The average concentration of NOx varied from 10 µg/m3 to 13.75 µg/m3. At
all the locations, the concentrations of NOx were within the permissible limit of
80.0 µg/m3 in residential/rural area as per National Ambient Air Quality
Standards.
3.6.9 CONCLUSION
On perusal of the results presented in Table it can be concluded that the
concentration of pollutants like SPM, RPM, SO2, and NOx in ambient air in the
study area are well within the permissible limit of NAAQS. The National
Ambient Air Quality Standard is presented in Table : 3.17
TABLE : 3.17
National Ambient Air Quality Standard (value in µg/m3)
Pollutant Time weighted Average
Industrial Area
Residential Area
Sensitive area
SO2 Annual Average* 24 hr Average**
80 80
60 80
15 30
NOx Annual Average* 24 hr Average**
80 80
60 80
15 30
SPM Annual Average* 24 hr Average**
360 500
140 200
70 100
RPM Annual Average* 24 hr Average**
120 150
60 100
50 75
* Annual Arithmetic mean of minimum 104 measurements in a year taken
twice
a week 24 hourly at uniform interval.
** 24 hourly/8 hourly values should be met 98th percentile of the time in a
year.
However, 2% of the time, it may exceed but not on two consecutive days.
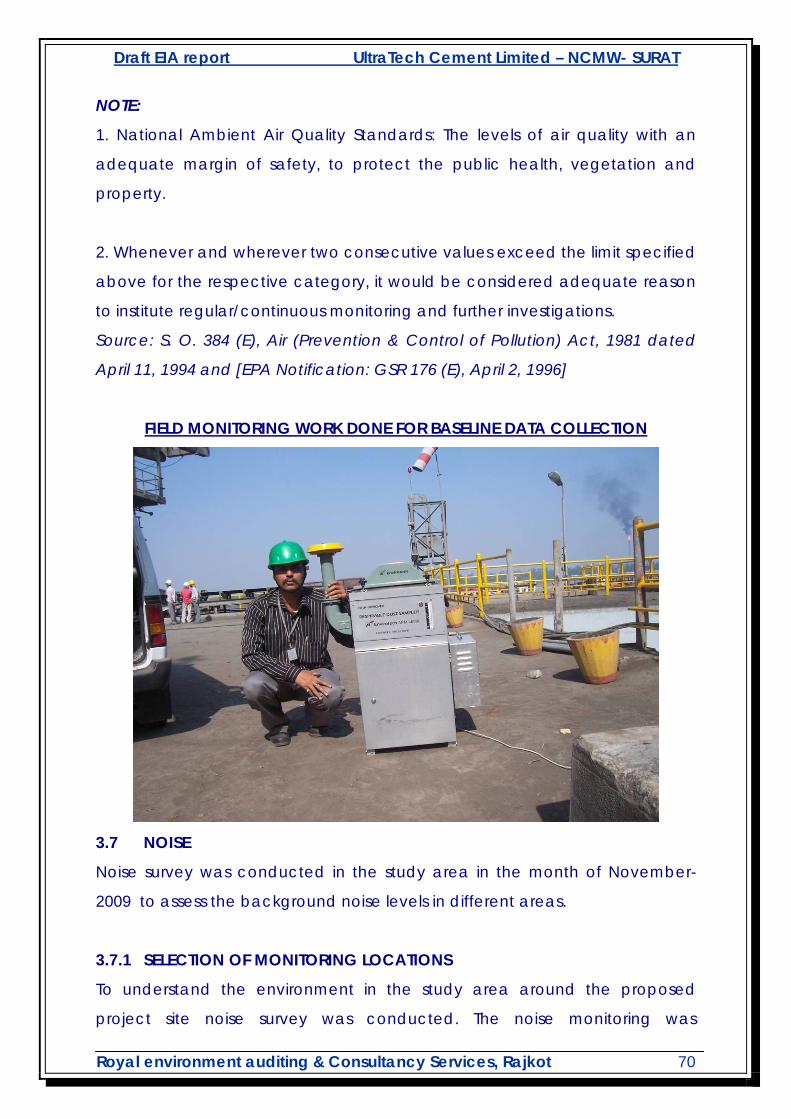
Draft EIA report UltraTech Cement Limited – NCMW- SURAT
Royal environment auditing & Consultancy Services, Rajkot 70
NOTE:
1. National Ambient Air Quality Standards: The levels of air quality with an
adequate margin of safety, to protect the public health, vegetation and
property.
2. Whenever and wherever two consecutive values exceed the limit specified
above for the respective category, it would be considered adequate reason
to institute regular/continuous monitoring and further investigations.
Source: S. O. 384 (E), Air (Prevention & Control of Pollution) Act, 1981 dated
April 11, 1994 and [EPA Notification: GSR 176 (E), April 2, 1996]
FIELD MONITORING WORK DONE FOR BASELINE DATA COLLECTION
3.7 NOISE
Noise survey was conducted in the study area in the month of November-
2009 to assess the background noise levels in different areas.
3.7.1 SELECTION OF MONITORING LOCATIONS
To understand the environment in the study area around the proposed
project site noise survey was conducted. The noise monitoring was
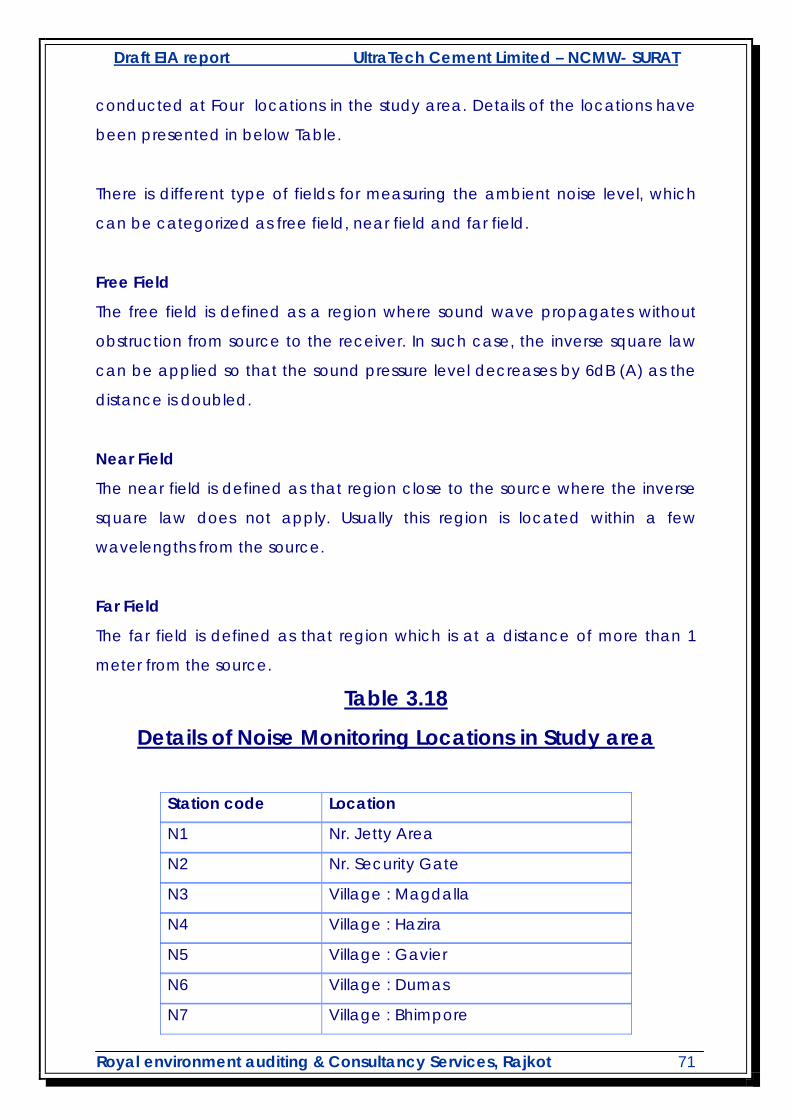
Draft EIA report UltraTech Cement Limited – NCMW- SURAT
Royal environment auditing & Consultancy Services, Rajkot 71
conducted at Four locations in the study area. Details of the locations have
been presented in below Table.
There is different type of fields for measuring the ambient noise level, which
can be categorized as free field, near field and far field.
Free Field
The free field is defined as a region where sound wave propagates without
obstruction from source to the receiver. In such case, the inverse square law
can be applied so that the sound pressure level decreases by 6dB (A) as the
distance is doubled.
Near Field
The near field is defined as that region close to the source where the inverse
square law does not apply. Usually this region is located within a few
wavelengths from the source.
Far Field
The far field is defined as that region which is at a distance of more than 1
meter from the source.
Table 3.18
Details of Noise Monitoring Locations in Study area
Station code Location
N1 Nr. Jetty Area
N2 Nr. Security Gate
N3 Village : Magdalla
N4 Village : Hazira
N5 Village : Gavier
N6 Village : Dumas
N7 Village : Bhimpore
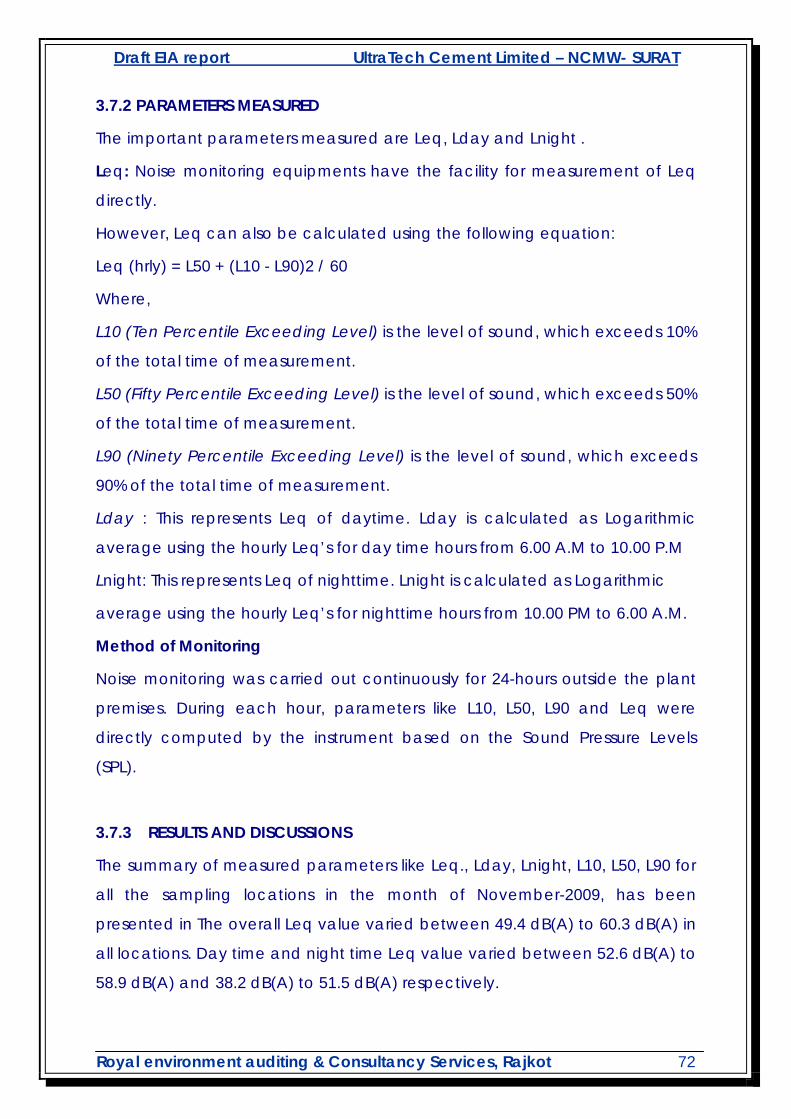
Draft EIA report UltraTech Cement Limited – NCMW- SURAT
Royal environment auditing & Consultancy Services, Rajkot 72
3.7.2 PARAMETERS MEASURED
The important parameters measured are Leq, Lday and Lnight .
Leq: Noise monitoring equipments have the facility for measurement of Leq
directly.
However, Leq can also be calculated using the following equation:
Leq (hrly) = L50 + (L10 - L90)2 / 60
Where,
L10 (Ten Percentile Exceeding Level) is the level of sound, which exceeds 10%
of the total time of measurement.
L50 (Fifty Percentile Exceeding Level) is the level of sound, which exceeds 50%
of the total time of measurement.
L90 (Ninety Percentile Exceeding Level) is the level of sound, which exceeds
90% of the total time of measurement.
Lday : This represents Leq of daytime. Lday is calculated as Logarithmic
average using the hourly Leq’s for day time hours from 6.00 A.M to 10.00 P.M
Lnight: This represents Leq of nighttime. Lnight is calculated as Logarithmic
average using the hourly Leq’s for nighttime hours from 10.00 PM to 6.00 A.M.
Method of Monitoring
Noise monitoring was carried out continuously for 24-hours outside the plant
premises. During each hour, parameters like L10, L50, L90 and Leq were
directly computed by the instrument based on the Sound Pressure Levels
(SPL).
3.7.3 RESULTS AND DISCUSSIONS
The summary of measured parameters like Leq., Lday, Lnight, L10, L50, L90 for
all the sampling locations in the month of November-2009, has been
presented in The overall Leq value varied between 49.4 dB(A) to 60.3 dB(A) in
all locations. Day time and night time Leq value varied between 52.6 dB(A) to
58.9 dB(A) and 38.2 dB(A) to 51.5 dB(A) respectively.
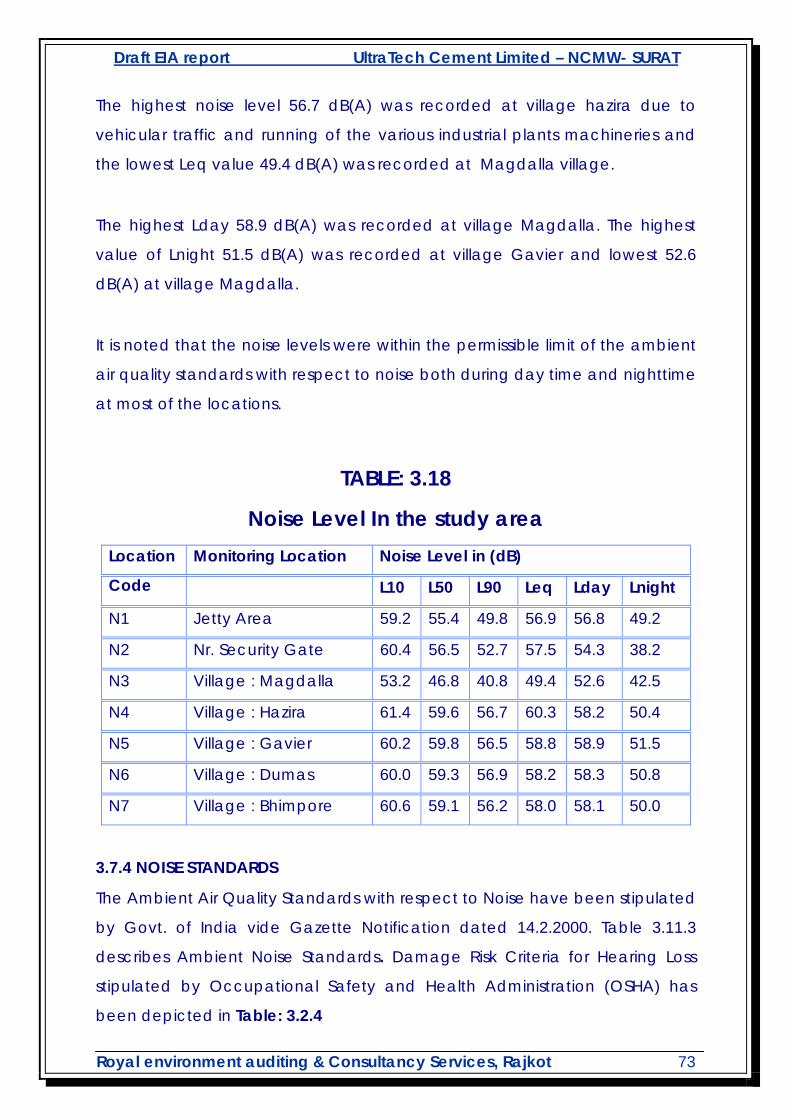
Draft EIA report UltraTech Cement Limited – NCMW- SURAT
Royal environment auditing & Consultancy Services, Rajkot 73
The highest noise level 56.7 dB(A) was recorded at village hazira due to
vehicular traffic and running of the various industrial plants machineries and
the lowest Leq value 49.4 dB(A) was recorded at Magdalla village.
The highest Lday 58.9 dB(A) was recorded at village Magdalla. The highest
value of Lnight 51.5 dB(A) was recorded at village Gavier and lowest 52.6
dB(A) at village Magdalla.
It is noted that the noise levels were within the permissible limit of the ambient
air quality standards with respect to noise both during day time and nighttime
at most of the locations.
TABLE: 3.18
Noise Level In the study area
Location
Code
Monitoring Location Noise Level in (dB)
L10 L50 L90 Leq Lday Lnight
N1 Jetty Area 59.2 55.4 49.8 56.9 56.8 49.2
N2 Nr. Security Gate 60.4 56.5 52.7 57.5 54.3 38.2
N3 Village : Magdalla 53.2 46.8 40.8 49.4 52.6 42.5
N4 Village : Hazira 61.4 59.6 56.7 60.3 58.2 50.4
N5 Village : Gavier 60.2 59.8 56.5 58.8 58.9 51.5
N6 Village : Dumas 60.0 59.3 56.9 58.2 58.3 50.8
N7 Village : Bhimpore 60.6 59.1 56.2 58.0 58.1 50.0
3.7.4 NOISE STANDARDS
The Ambient Air Quality Standards with respect to Noise have been stipulated
by Govt. of India vide Gazette Notification dated 14.2.2000. Table 3.11.3
describes Ambient Noise Standards. Damage Risk Criteria for Hearing Loss
stipulated by Occupational Safety and Health Administration (OSHA) has
been depicted in Table: 3.2.4
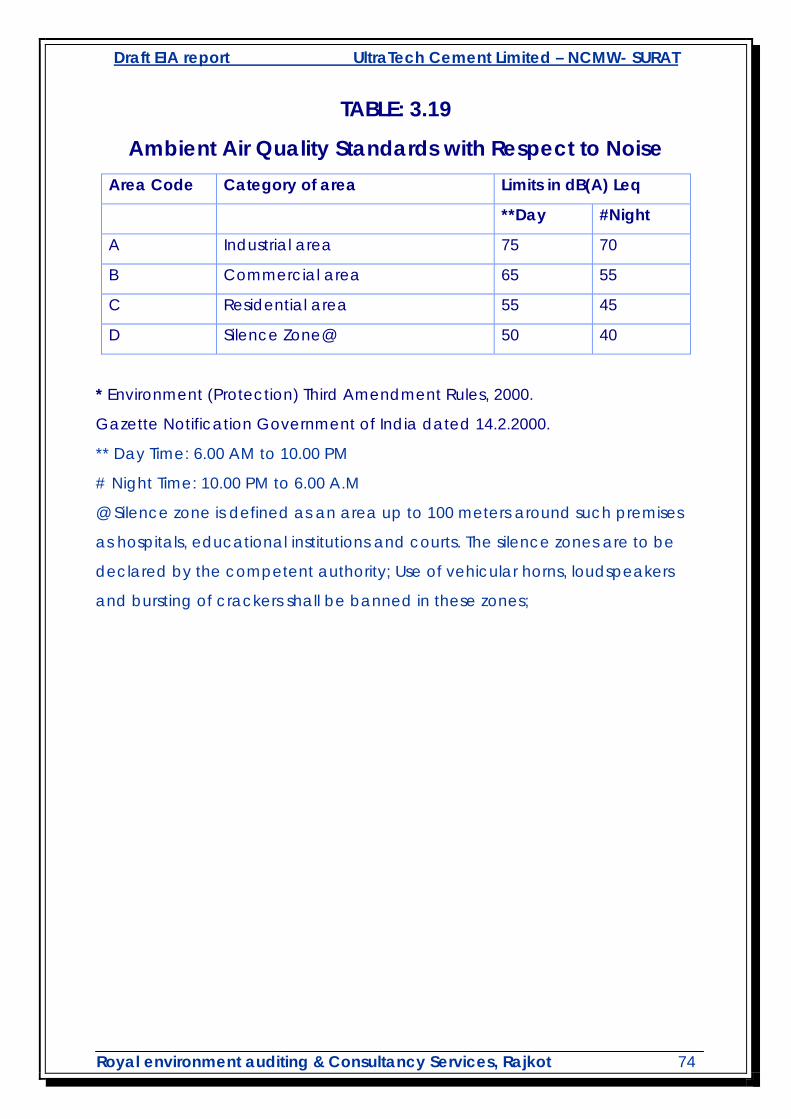
Draft EIA report UltraTech Cement Limited – NCMW- SURAT
Royal environment auditing & Consultancy Services, Rajkot 74
TABLE: 3.19
Ambient Air Quality Standards with Respect to Noise
* Environment (Protection) Third Amendment Rules, 2000.
Gazette Notification Government of India dated 14.2.2000.
** Day Time: 6.00 AM to 10.00 PM
# Night Time: 10.00 PM to 6.00 A.M
@ Silence zone is defined as an area up to 100 meters around such premises
as hospitals, educational institutions and courts. The silence zones are to be
declared by the competent authority; Use of vehicular horns, loudspeakers
and bursting of crackers shall be banned in these zones;
Area Code Category of area Limits in dB(A) Leq
**Day #Night
A Industrial area 75 70
B Commercial area 65 55
C Residential area 55 45
D Silence Zone@ 50 40