ultraviolet absorption spectra at … absorption spectra at reduced temperatures ... low temperature...
TRANSCRIPT

ULTRAVIOLET ABSORPTION SPECTRA AT REDUCED TEMPERATURES
I. PRINCIPLES AND METHODS*
BY R. L. SINSHEIMER,t J. F. SCOTT, AND J. R. LOOFBOUROW WITH THE TECHNICAL ASSISTANCE OF B. BEST, R. HASTINQS, E. VOLLMER, AND
M. WESTERQAABD
(From the Department of Biology and the Spectroscopy Laboratory, Massachusetts Institute of Technology, Cambridge)
(Received for publication, April 24, 1950)
Low temperature absorption and fluorescence spectra of solids, liquids, and solutions often reveal increased spectral detail of use in analytical procedures and molecular structure studies. Nevertheless, while quali- tative observations of the influence of liquid air temperatures upon op- tical properties were undertaken very early (1, Z), investigations of the absorption and fluorescence of organic compounds at the temperature of liquid nitrogen (- 195.6”; 77.4 “K.) and below have appeared only sporadically (3-25). Because of the potential usefulness of the technique we have undertaken a systematic study of the low temperature spectra of substances of biochemical interest. The present paper discusses the methods employed; subsequent papers will deal with the experimental results. In this work, we have emphasized the wave-length location of absorption bands and the accurate determination of relative optical den- sities rather than precision in the determination of absolute optical densi- ties, thus permitting the use of simpler methods than would otherwise be necessary.’
Printiples of Method
Whereas molecules in the vapor state yield complex band spectra (26), the spectra of molecules in the condensed state usually lack any appre- ciable detail attributable to individual vibrational or rotational energy
* Supported in part by a grant from the American Cancer Society, upon recom- mendation of the Committee on Growth of the National Research Council.
t Present address, Iowa State College, Ames, Iowa. 1 It should be noted that infra-red spectroscopy is usually accomplished without
determining absolute densities; somewhat analogously, emission spectroscopy usu- ally involves the absolute determination of line wave-lengths with only relative esti- mates of line intensities. Absolute density measurements are of the greatest use in the quantitative determination of previously identified and characterized pure sub- stances or mixtures thereof, whereas the positions of absorption bands and their rel- ative density values are of much greater use for the identification of unknown sub- stances and molecular structure studies.
a99
by guest on June 24, 2018http://w
ww
.jbc.org/D
ownloaded from

300 ULTRAVIOLET ABSORPTION SPECTRA. I
changes; thus the lines of the benzene vapor spectrum are largely ob- literated in its solution spectrum ((27) chapter 8). Among the factors that contribute to lack of detail in spectra are the following (26, 28-30): (a) the Doppler effect, (b) collision damping, (c) multiplicity of permitted energy transitions, (d) random variation of internal Stark and Zeeman effects, (e) predissociation or dissociation, and (f> natural line breadths. The effects of all but the last, which is relatively unimportant, are de- creased by lowering the temperature of the absorbing substance.
The statistical randomness of the internal Stark and Zeeman effects may be attributed to two causes: (a) random distribution of absorbing groups, polar groups, ions, etc., in space at any particular instant, and (b) thermal motion of these entities during the period of observation. While the former effect may be decreased by examining substances in well ordered states (e.g. crystals), it may in most instances be expected to cause some diffuseness of the condensed state spectra even at the low- est temperatures. Another factor that may limit the appearance of greater spectral detail upon refrigeration is internal damping (8-11). If the structure of the molecule is such that the absorbing chromophore may transfer energy to other parts of the molecule, the life time of the excited states may be reduced and the absorption bands broadened.2 In favora- ble instances, these perturbing effects are insufficient to prevent a marked increase in spectral detail of biochemical substances at reduced tempera- tures, as will be apparent from the experimental results to be reported.
Preparation of Xpecimens
The preparation of suit,able samples is a major technical problem in low temperature absorption spectroscopy and considerable effort has there- fore been devoted to investigating old and new specimen preparation methods.
Ultraviolet absorption spectra of biochemical compounds are usually obtained with solutions in transparent liquid solvents such as water. At low temperatures, freezing, crystallization, and cracking of solvents often lead to the formation of semiopaque masses of high light-scattering power. For satisfactory results, the solvent, solute, cell design, and condition of refrigeration must be such that the cooled solution vitrifies to yield a reasonably transparent glass containing the solute in molecular disper- sion.3 Films of water solutions less than about 0.05 mm. in thickness
2 It ma)- be shown by Fourier analysis (31) that shortening or damping of an oscil- latory wave-train results in the broadening of its corresponding frequency spectrum; only an infinite wave-train of constant amplitude corresponds to a single frequency. Thus damping of molecular oscillations as a result of collisions (collision damping) or energy transfer would be expected to broaden the corresponding spectrum line.
a An alternative is to use solvents that remain liquid at 77 “K., such as equal
by guest on June 24, 2018http://w
ww
.jbc.org/D
ownloaded from

SINSHEIMER, SCOTT, AND LOOFROUROW 301
form vitrified solids when cooled rapidly by immersion in liquid nitrogen, but these have limited use. Special solvent mixtures are better adapted for most low temperature investigations.
A mixture of ether, isopentane, and alcohol (EPA) developed by Lewis and coworkers (9) for spectroscopy in the visible region was found usable in the ultraviolet if the solvents were purified with sufficient care.4 This mixture has satisfactory optical properties at 77 “K. in the proportions Lewis recommended: 5 parts of ether, 5 parts of isopentane, and 2 parts of alcohol. As Lewis suggested, the proportions may be varied somewhat to suit the solubility characteristics of different compounds or for work at different temperatures. To facilitate solution, the solute is first dissolved in the alcohol, and the ether and isopentane are then added. At 77 “K., EPA contracts by about one-third its original volume. In cells of 1 cm.
;J”cELL
FIG. 1, A. Quartz absorption cell used for low temperature spectra of solutions in ether, isopentane, and alcohol (EPA). B, modified type J Hilger quartz absorp- tion cell used for low temperature spectra of solutions in glycerol and water.
thickness or less, the vitrifying solution coheres and contracts toward the side walls, leaving one deep cleft down the center with sufficient clear area at one side for transmission of the light beam. The special quartz cell5 that we have used for EPA is shown in Fig. 1, A. The long stem pre- vents liquid nitrogen from entering when the cell is immersed, and the
parts of propene and propane alone or mixed with 1:lO of n-propyl alcohol, as used by Freed et al. (25, 32).
4 Isopentane is purified by passage through a column of activated silica gel. Al- cohol and ether are purified by the method of Castille and Henri (33), an eleven plate Brunn column being used for the final fractional distillation. When the solvents are thus purified, the mixture can be used to 2200 A with no interfering absorption bands, and with only a gradual rise in absorption toward short wave-lengths, amounting to an optical density of 0.2 at 2200 A for a 1 cm. path.
5 Constructed by the Nieder Fused Quartz Works, Wellesley, Massachusetts.
by guest on June 24, 2018http://w
ww
.jbc.org/D
ownloaded from

302 ULTRAVIOLET ABSORPTION SPECTRA. I
open construction minimizes breakage as a result of expansion and con- traction.
A mixture of 1 part of methylcyclohexane to 3 of isopentane, also used by Lewis (9), is satisfactory for biochemical substances of suitable solu- bility. Low temperature spectra of compounds in this solvent and in EPA showed no differences attributable to the solvents.
The 3: 1 glycerol-water mixture used by Broda and Goodeve (34) was found to be satisfactory for many polar substances insoluble in EPA. This mixture has been used by Haas (22) for low temperature studies of proteins and amino acids, to be described in a later communication. Because of excessive cracking, the mixture is unsatisfactory at 77 “K. in the 5 cm. path length used by Broda and Goodeve. If the path is restricted to about 1 mm. (as in the modified type J Hilger cell6 shown
ASBESTOS-L1 PLATINUM W
HEATING ELEM
TO VACUUM PUMPS
FIG. 2. Vacuum apparatus for preparing evaporated solid films of organic sub- stances for low temperature spectroscopy.
in Fig. 1, B), cracks form perpendicular to the cell windows, leaving suffi- cient clear area for satisfactory use.
At liquid hydrogen temperature (-252.7’; 20.5 “K.), use of vitrifying solvents is considerably more difficult and no suitable mixtures have yet been devised for use at liquid helium temperature (-268.9’; 4.3 OK.). Furthermore, polar constituents in solvent mixtures (essential when highly polar biochemical substances are to be dissolved) may result in undesira- ble masking of spectrum detail. To overcome these difficulties, thin solid films cf pure substances may be used.
Homogeneous films of substances of sufficiently low molecular weight may be prepared by molecular sublimation onto quartz slides in a vacuum
6 Obtained from the American Inst,rument Company, Silver Spring, Maryland.
by guest on June 24, 2018http://w
ww
.jbc.org/D
ownloaded from

SINSHEIMER, SCOTT, AND LOOF’ROUROW 303
chamber (about 10m5 mm. pressure) of the type used for shadow-casting electron microscope specimens. The material to be sublimed is placed in a small asbestos cup (capacity about 20 mg. of powdered material) inside a conical helix of platinum wire suspended between terminal posts (Fig. 2). The lining is built up by filling the helix with an aqueous as- bestos suspension and gradually vaporizing the water by passage of cur- rent through the helix. The quartz slide is held in a copper template that masks all but a square central area, 1.4 f 0.04 cm. on a side, and is suspended directly above the evaporating cup at a distance of about 10 cm. To reduce the possibility of thermal decomposition, sublimations are carried out at the lowest temperature (lowest filament current) prac- ticable. For the polar substances of high melting point to which this technique has been primarily applied, currents of 1 to 2 amperes are neces- sary, corresponding to power inputs of 0.1 to 0.5 watt. As the current is increased cautiously, small particles begin to stand on edge or to bounce about in the molecular stream; additional evidence of sublimation is soon obtained from deposits on the chamber walls and the slide.
At a thickness corresponding to an optical path length of X/4 for visi- ble light, the sample begins to exhibit interference colors. With increasing thickness, the regular sequence of Newton’s colors is seen, passing even- tually into higher orders, and the deposition of material on the slide can be followed quantitatively by observing these colors. After a few films had been made, it proved possible to estimate accurately the interference color corresponding to a thickness that would yield a usable optical density (0.5 to 1.5) for a film of a new material from knowledge of its absorption coefficient in solution.
If absolute solid state absorption coefficients, (Y, are to be determined with films, it is essential to know the film thickness, 2, for substitution in the Bouguer-Lambert law expression, ux = log10 (10/1J, where loglo (lo/l,) is the optical density .‘I For comparison with solution spectra, however, it is more useful to know the weight per sq. cm., 6; this cor- responds to the product cx in the Bouguer-Lambert-Beer equation, Kcx =
7 The film thickness may be determined precisely from interference colors if the refractive index is known. Measurement of the index is possible but may be incon- venient unless appropriate facilities are available. If a reasonable value of index such as 1.5 is assumed, a close approximation to the film thickness may be obtained. Thus, for thymine, a film with an optical density of 0.9 at 2800 A showed a first order interference color of light yellow, indicating an optical thickness of about 1200 A and therefore a physical thickness of about 800 A. Suitable films of other pyrimi- dines and of purines are of similar thickness. Films of tyrosine, which has a consid- erably lower absorption coefficient, are necessarily thicker; a tyrosine film of optical density 0.8 showed a third order interference color of red, indicating an optical path length of about 7000 A and a physical thickness of about 4700 A.
by guest on June 24, 2018http://w
ww
.jbc.org/D
ownloaded from

304 ULTRAVIOLET ABSORPTION SPECTRA. I
log,0 (IO/I%), where K is the absorption coefficient, c the concentration (gm., moles, etc., per ml.), and z the path length (cm.). The value of 6 may be determined easily by washing off a known area of film into a known volume of suitably buffered solvent and measuring the optical density by usual methods. Thus a film of cytosine of area 2.023 sq. cm. had a density of 0.595 at 2670 A (Beckman determination) in 1 cm. path length when dissolved in 4 ml. of water buffered at pH 6.5. A separate solution of cytosine made up in the same buffer at a concentration of 15.8 X
1O-6 gm. per ml. had a density of 0.895 at 2670 A. Hence the weight per sq. cm. of the original film was (4/2.023) X 15.8 X 1P X (0.595/0.895) = 20.7 X lo-6 gm. per sq. cm. The film itself had an optical density of 0.900 at 2580 A, and since 6 = 20.7 X UIP, the film absorption coefficient was 0.900 per 20.7 X DIP6 = 4.35 X 10⁴, in terms equivalent to those of a solution of 1 gm. per ml. of concentration and 1 cm. path length. The above coefficient can, of course, be converted into terms equivalent to gm. per liter or moles per liter of concentration, by multiplication by suitable constants (KP and 111.1 X lO+ respectively, since the molecular weight of cytosine is 111.1; the latter yields a-result of 4.83 X 10³).
The quartz slides used for evaporated films are carefully cleaned and rendered hydrophilic by thorough scouring with Shamva.8 At the 10 cm. filament to slide distance employed, the copper template restricts the film to an area within which the film thickness is uniform to within 1 per cent or less. With such a uniform film, spectra taken at various temperatures may be compared directly, even though different portions of the film may have been used for the different spectrograms.
The evaporated film technique is suitable for the study of purines, pyrimidines, and amino acids, but it cannot be applied to highly polar substances of high molecular weight that decompose before developing even a small vapor pressure. For instance, it was possible to sublime adenosine in a high vacuum, but not adenylic acid. Non-polar sub- stances of low or moderate molecular weight sublime readily, but, instead of depositing as clear homogeneous films, they tend to form crystals that scatter too much light to permit absorption measurements. Similar phe- nomena had been noted by Hausser et al. (35). No improvement was obtained by treating the slides with siloxane to render them hydrophobic, and it has not been possible thus far to apply the evaporated film tech- nique to non-polar compounds.
The absorption spectra of some evaporated film preparations (e.g. uracil) are observed to undergo marked changes as a function of age when the films are stored in an atmosphere containing water vapor (36). This effect must be taken into account in interpretations of spectra.
* A metallographic polishing agent obtained from the Golwynne Magnesite and Magnesia Corporation, 420 Lexington Avenue, New York.
by guest on June 24, 2018http://w
ww
.jbc.org/D
ownloaded from
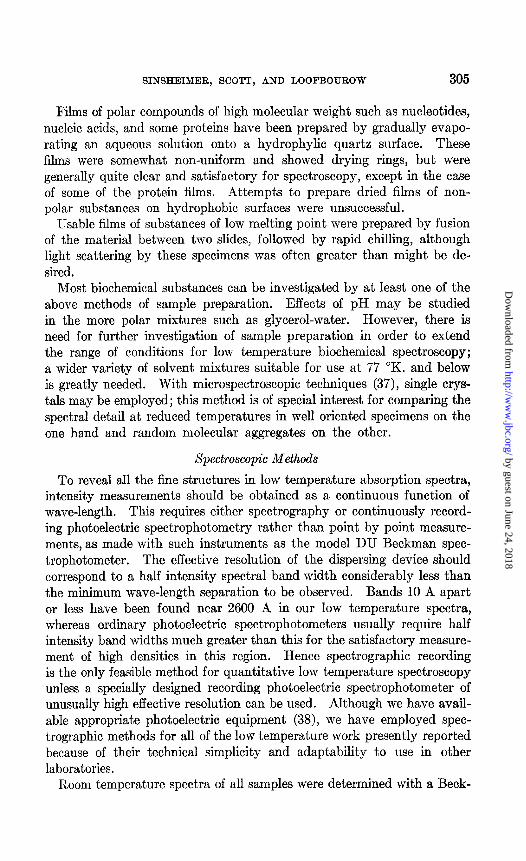
SINSHEIMER, SCOTT, AND LOOFBOUROW 305
Films of polar compounds of high molecular weight such as nucleotides, nucleic acids, and some proteins have been prepared by gradually evapo- rating an aqueous solution onto a hydrophylic quartz surface. These films were somewhat non-uniform and showed drying rings, but were generally quite clear and satisfactory for spectroscopy, except in the case of some of the protein films. Attempts to prepare dried films of non- polar substances on hydrophobic surfaces were unsuccessful.
Usable films of substances of low melting point were prepared by fusion of the material between two slides, followed by rapid chilling, although light scattering by these specimens was often greater than might be de- sired.
Most biochemical substances can be investigated by at least one of the above methods of sample preparation. Effects of pH may be studied in the more polar mixtures such as glycerol-water. However, there is need for further investigation of sample preparation in order to extend the range of conditions for low temperature biochemical spectroscopy; a wider variety of solvent mixtures suitable for use at 77 “K. and below is greatly needed. With microspectroscopic techniques (37), single crys- tals may be employed; this method is of special interest for comparing the spectral detail at reduced temperatures in well oriented specimens on the one hand and random molecular aggregates on the other.
Spectroscopic Methods
To reveal all the fine structures in low temperature absorption spectra, intensity measurements should be obtained as a continuous function of wave-length. This requires either spectrography or continuously record- ing photoelectric spectrophotometry rather than point by point measure- ments, as made with such instruments as the model DU Beckman spec- trophotometer. The effective resolution of the dispersing device should correspond to a half intensity spectral band width considerably less than the minimum wave-length separation to be observed. Bands 10 A apart or less have been found near 2600 A in our low temperature spectra, whereas ordinary photoelectric spectrophotometers usually require half intensity band widths much greater than this for the satisfactory measure- ment of high densities in this region. Hence spectrographic recording is the only feasible method for quantitative low temperature spectroscopy unless a specially designed recording photoelectric spectrophotometer of unusually high effective resolution can be used. Although we have avail- able appropriate photoelectric equipment (38), we have employed spec- trographic methods for all of the low temperature work presently reported because of their technical simplicity and adaptability to use in other laboratories.
Room temperature spectra of all samples were determined with a Beck-
by guest on June 24, 2018http://w
ww
.jbc.org/D
ownloaded from

306 ULTRAVIOLET ABSORPTION SPECTRA. I
man model DU spectrophotometer as well as spectrographically, as a preliminary step both to insure that the optical densities of the specimens were appropriate and to verify the spectrophotographic results.
Three spectrographs were used: the 35 foot Wadsworth-mounted con- cave grating of the Massachusetts Institute of Technology Spectroscopy Laboratory, a Bausch and Lomb medium quartz spectrograph, and a Hilger quartz spectrograph model E-l. The latter, which has an ef- fective resolution of approximately 1 A at 2500 A with the slit widths employed (20 to 30 P), was found entirely adequate for survey work and has been used routinely for this purpose, but spectrographs of higher dis- persion, such as the others mentioned, are preferable when the greatest accuracy of wave-length determinations is desired. Eastman spectrum analysis type II plates were the most generally useful of those tested for low temperature work and permitted measurements to about 2250 A with the usual exposure conditions; spectrum analysis type I and East- man contrast lantern slide plates were also satisfactory.
It is essential to use a light source that yields a continuous spectrum. We have used Hanovia capillary hydrogen discharge tubes, which afford sufficient intensity for reasonable exposure times in most low temperature work when operated at 2500 volts, 100 to 250 ma. A higher powered hydrogen arc (approximately 1 kilowatt discharge through a 3 mm. cylindrical orifice 5.0 mm. long) developed in our laboratory (39) is better suited for applications such as microspectroscopy in which greater total radiant power and larger angular aperture are desirable.
The positions of bands in low temperature spectra may be located by visual examination of spectrograms, as in the work of Bawden, Lavin, and others (see, for example, (14-17)) or by direct visual observation of spectra in the visible region, as in the work of Keilin and Hartree (24). For more precise wave-length determinations and semiquantitative in- dications of relative densities, the spectrophotographic recording technique of Holiday (40), used also by Brown and Randall (23), is convenient. In this method, the photographic plate is moved across the spectrum during exposure by means of a logarithmic cam that varies the time of exposure, so that the developed plate exhibits a pattern of blackening that cor- responds roughly to a plot of the absorption spectrum.
If density values as well as wave-length positions are to be determined quantitatively in low temperature spectrography, the plates must be calibrated by suitable comparison exposures (e.g., with a solvent cell or blank slide in the beam). Mayneord and Roe (18) used a Spekker pho- tometer for this purpose, determining densities from the plates by visual matching of the comparison and specimen spectra. We have calibrated our plates by varying the exposure time, after the method of Henri (29, 41), and have measured the plate blackening objectively with a Sinclair
by guest on June 24, 2018http://w
ww
.jbc.org/D
ownloaded from

SINSHEIMER, SCOTT, AND LOOFBOUROW 307
Smith recording microdensitometer. Normally, fourteen comparison spec- tra (exposure times 5 to 50 seconds) are photographed on the same plate to permit ease of interpolation and multiple checks in determining densi- ties. Exposures are either controlled manually and timed by a stop- watch or controlled automatically by means of an integrating photoelectric circuit that operates the shutter. Fig. 3 shows a portion of a spectrum plate and Fig. 4 shows a typical microdensitometer record.
FIG. 3. Portion of a typical low temperature spectrogram (77 “K.) of solid film preparation. A, p-methoxyphenylalanine; B, p-hydroxyphenylalanine; C, cytosine. Most of the comparison spectra arc not shown. The numbers on the wave-length scale represent angstroms in hundreds.
In computing densities from the microdensitometer traces, it is assumed that, for equal blackening by two exposures at a particular wave-length, the intensities are inversely proportional to the exposure times; i.e., it is assumed that the reciprocity law holds. As normally used, all emulsions deviate more or less from this law. Under our experimental conditions, the reciprocity error was found to be of the same order of magnitude as other errors, and the use of other means of controlling exposure (e.g., a rotating sector) was therefore not thought to be warranted.
Relative values of optical density at different wave-lengths may be
by guest on June 24, 2018http://w
ww
.jbc.org/D
ownloaded from

308 IXTR.4VIOLET ARSORPTION SPECTRS. I
determined by the above method with an over-all average error of 2 or 3 per cent (22). Repeated measurements and comparisons with data obtained with the Beckman spectrophotometer indicate that the shapes of absorption curves are quite accurately and reproducibly determined. The over-all error in the determination of absolute densities may be con- siderably greater, averaging perhaps 5 per cent and ranging up to 15 per cent in unfavorable instances, especially if there is appreciable light scat- tering by the sample. Fig. 5 illustrates density Dersus wave-length plots for spectra determined at 298” and 77 “K. by this met,hod.
, , I
30bO 2600 26’00 2400 A FIG. 4. Typical microdensitomcter record. A, traces of control spect,ra; R, traces
of absorption spectra; C, trace of wave-length scale.
Handling of Specimens
At room temperature, the quartz slide or cell is placed in front of the spectrograph slit and is set back some distance if the specimen is non- uniform, so that the defects will not be imaged in the spectrum. Col- limated light is obtained by placing a diaphragm immediat.ely in front of the long, t,hin hydrogen discharge tube and using the center hole of the Hartmann diaphragm over the spectrograph slit.
At reduced temperatures, a quartz Dewar vessel wit’h two set,s of op- posing plane fused quartz windows (Fig. 6) is used (42). For work at 77 OK., the slide or cell is placed directly in the liquid nitrogen and the light beam is sent through the Dewar windows, liquid nitrogen, and
by guest on June 24, 2018http://w
ww
.jbc.org/D
ownloaded from

SINSHEIMER, SCOTT, AND LOOFBOUROW
I 1 I I ’ I ’ I
ISOMETHADONE
2no- ISOMETHAOONE - NITRILE
309
C-C: N
;H - CH,-N!CH3
_ -.- t- a r\fir t
AT 29W’K,IN EPA ” I , I , t I I
2300 1 2500 1 2700 2400 2600
WAVELE
2400 1 2600 1 2500 2700
‘NGTH, A
Fro. 5. Absorption spectra of methadone nitrile and isomethadone nitrile deter- mined by photographic spectrophotometry at 298” and 77 “K. in EPA solvent. The actual measured densities are shown for solutions of the same molar concentration since relative densities are determined more accurately by the method than are abso- lute absorption coefficients. As illustrated, there is marked difference in the effects of low temperatures on the spectra of these two isomers.
LIQUID NITROGEN OR
HYDROGEN \
-QUARTZ DEWAR
FIQ. 6. Set-up for absorption spectroscopy at 77 “K.
specimen. Special plastic or cork holders that rest on the bottom of the Dewar vessel are used for slides, whereas cells are suspended from above. After temperature equilibrium has been attained, no serious difficulty is
by guest on June 24, 2018http://w
ww
.jbc.org/D
ownloaded from

310 ULTRAVIOLET ABSORPTION SPECTRA. I
encountered from the formation of gas bubbles in the nitrogen. In the case of isopentane mixtures, about 7 minutes immersion time is required for complete vitrification and attainment of liquid nitrogen temperature with the cells we have employed. Since liquid oxygen has strong absorp- tion bands in the near ultraviolet, it is essential that only very pure liquid nitrogen be used in the light path; Linde Air Products “high purity” nitrogen is satisfactory, provided it is not allowed to stand in contact with air.
For work at 21 “K. with liquid hydrogen appropriate precautions must be taken to prevent explosions. Furthermore, air must not be allowed to enter the Dewar vessel; otherwise, the oxygen and nitrogen will freeze and fall through the liquid hydrogen, frosting the windows and specimens. To prevent this difficulty, a special glass cap was fitted snugly into the top of the Dewar flask against a cushion of glass wool. One of the two inlet tubes of the cap was stuffed with glass wool and served for the gradual release of hydrogen. The cap contained four slides in thin plastic holders that could be lowered through the liquid into the light beam and raised again, after the manner of a puppet show, by means of silk threads that passed through holes in a brass plug on the second inlet tube. The slide holders were prevented from twisting by small, soft iron bars attached to their bottoms, which responded to the field of an external aligning magnet. With one blank slide and three specimens, it was possible to obtain three spectra with one charge of hydrogen. Air present at the time of filling was completely flushed out by the hydrogen vaporized in cooling the Dewar walls. As a result of small leaks, it was impossible to prevent gradual internal frosting of the windows while the spectra were being taken. Consequently, we have not attempted to determine absolute op- tical densities at liquid hydrogen temperature; the relative densities and absorption curve shapes are accurate and reproducible, as in the case of spectra taken at liquid nitrogen temperature.
We have designed and tested a double Dewar vessel for use at 4 “K. However, we have encountered such difficulty from internal frosting as a result of air leaks during the spectrum exposures as to require redesigning of the equipment before satisfactory spectra can be taken at liquid helium temperature.
It is necessary to use greater light beam intensities for equivalent ex- posure times in low temperature as compared with room temperature spectrography because of light losses at the Dewar windows, and light scattering by bubbles in the cooling solution (especially in liquid hydro- gen), etc. On humid days, moisture condensation on the outer windows of the Dewar flask may be prevented by directing an air blast against them.
by guest on June 24, 2018http://w
ww
.jbc.org/D
ownloaded from

SINSHEIMER, SCOTT, AND LOOFBOUROW 311
If the quartz slides bearing film preparations are removed from the Dewar vessel directly into the laboratory atmosphere, moisture conden- ses on them and dissolves the films. The slides are therefore plunged into a non-polar solvent of low boiling point (anhydrous ether or hexane) immediately upon withdrawal from the flask. After the slides have come to room temperature, they are gradually removed from the liquid, which rapidly evaporates from their surfaces; the slides may then be preserved for further use.
SUMMARY
1. Theoretical considerations and limited experimental evidence sug- gest that at greatly reduced temperatures (77-74 “K.) it should be possible to observe spectroscopic fine structure in visible and ultraviolet absorp- tion spectra. This fine structure represents vibrat’ional and rotational transitions associated with the primary electronic transitions giving rise to absorption bands. Such increased detail in spectra should be useful for the identification and analysis of complex substances and for molecu- lar structure studies. Other phenomena associated with low tempera- ture spectroscopy are of interest in studying energy transfer between molecular groupings.
2. Various techniques for the preparation of specimens for low tem- perature spectroscopy are described. In two methods vitrified solvents are used, ether-isopentane-alcohol mixtures or glycerol-water mixtures. In a third method, thin films are prepared by sublimation in a high vacuum. Thin films may also be prepared in some instances by precipitation from an evaporating solvent or by melting of the desired substance, followed by rapid chilling.
3. Spectrophotometric techniques that have been found useful for low temperature spectroscopy are described in detail.
BIBLIOGRAPHY
1. Dewar, J., Proc. Chem. Sot., 10, 171 (1894). 2. Ley, H., and Dreisch, T., Handb. Physik, 21, 39, 184 (1929). 3. Kronenberger, A., and Pringsheim, P., 2. Phys., 40, 75 (1927). 4. Kronenberger, A., 2. Phys., 63, 494 (1930). 5. Arnold, L. B., and Kistiakowsky, G. B., J. Am. Chem. Sot., 54, 1713 (1932). 6. Obreimov, I. W., and Prikhotjko, A., Phys. 2. Sowjetunion, 9,34 (1936). 7. Prikhotjko, A., J. Phys., U. S. S. R., 8, 257 (1944). 8. Lewis, G. N., and Bigeleisen, J., J. Am. Chem. Sot., 65, 2102 (1943). 9. Lewis, G. N., and Lipkin, D., J. Am. Chem. Sot., 64, 2801 (1942).
10. Lewis, G. N., Magel, T. T., and Lipkin, D., J. Am. Chem. Sot., 64, 1774 (1942). 11. Lewis, G. N., and Kasha, M., J. Am. Chem. Sot., 66, 2100 (1944). 12. Hartridge, H., J. Physiol., 54, p. cxxviii (1921). 13. Conant, J. B., and Kamerling, S. E., J. Am. Chem. Sot., 53,3522 (1931).
by guest on June 24, 2018http://w
ww
.jbc.org/D
ownloaded from

312 ULTRAVIOLET ABSORPTION SPECTRA. I
14. Bawden, F. P., Morris, S. D. D., and Snow, C. P., Nature, 131, 582 (1933). 15. Bawden, F. P., and Morris, S. D. D., Proc. Roy. Sot. London, Series B, 116, 274
(1934). 16. Lavin, G. I., Northrup, J. H., and Taylor, H. S., J. Am. Chem. Sot., 66, 3496
(1933). 17. Lavin, G. I., and Northrup, J. H., J. Am. Chem. Sot., 67,874 (1935). 18. Mayneord, W. V., and Roe, E. M. F., Proc. Roy. Sot. London, Series A, 168, 634
(1937). 19. Scott, J. F., Sinsheimer, R. L., and Loofbourow, J. R., Science, 107,302 (1948). 20. Sinsheimer, R. L., Scott, J. F., and Loofbourow, J. R., Tech. Rep. No. 4, Massa-
chusetts Institute of Technology Spectroscopy Laboratory, Cambridge (1949). 21. Sinsheimer, R. L., Thesis, Massachusetts Institute of Technology (1948). 22. Haas, W. J., Thesis, Massachusetts Institute of Technology (1949). 23. Brown, G. L., and Randall, J. T., Nature, 136, 505 (1949). 24. Keilin, D., and Hartree, E. F., Nature, 164,254 (1949). 26. Freed, S., and Hochanadel, C. J., Science, 110,298 (1949). 26. Hereberg, G., Molecular spectra and molecular structure; Diatomic molecules,
New York (1939). 27. Brode, W. R., Chemical spectroscopy, New York, 2nd edition (1943). 28. White, H. E., Introduction to atomic spectra, New York (1934). 29. Harrison, G. R., Lord, R. C., and Loofbourow, J. R., Practical spectroscopy,
New York (1948). 30. Finkelnberg, W., 2. Phys., 70, 376 (1930). 31. Goldman, S., Frequency analysis, modulation, and noise, New York (1948). 32. Freed, S., and Hochanadel, C. J., J. Chem. Phys., 17, 669 (1949). 33. Castille, A., and Henri, V., Bull. Sot. chim. biol., 6,299 (1924). 34. Broda, E. E., and Goodeve, C. F., Proc. Roy. Sot. London, Series A, 179, 161
(1941). 35. Hausser, K. W., Kuhn, R., and Seitz, C., 2. physik. Chem., Abt. B, 29,391 (1936). 36. Sinsheimer, R. L., Scott, J. F., and Loofbourow, J. R., Nature, 164, 796 (1949). 37. Loofbourow, J. R., J. Optical Sot. America, 40, 317 (1960). 38. Harrison, G. R., and Bentley, E. P., J. Optical Sot. America, 30,290 (1940). 39. Wyckoff, H. W., Massachusetts Institute of Technology Laboratory of Elec-
tronics Quarterly Progress Report, Cambridge (1949). 40. Holiday, E. R., J. Scient. Instruments, 11, 166 (1937). 41. Henri, V., Phys. Z., 14, 515 (1913). 42. Haynes, J. S., and Scott, J. F., Science, 107, 301 (1948).
by guest on June 24, 2018http://w
ww
.jbc.org/D
ownloaded from
Hastings, E. Vollmer, and M. WestergaardR.and With the technical assistance of B. Best,
R. L. Sinsheimer, J. F. Scott, J. R. LoofbourowMETHODS
TEMPERATURES: I. PRINCIPLES ANDSPECTRA AT REDUCED
ULTRAVIOLET ABSORPTION
1950, 187:299-312.J. Biol. Chem.
http://www.jbc.org/content/187/1/299.citation
Access the most updated version of this article at
Alerts:
When a correction for this article is posted•
When this article is cited•
alerts to choose from all of JBC's e-mailClick here
tml#ref-list-1
http://www.jbc.org/content/187/1/299.citation.full.haccessed free atThis article cites 0 references, 0 of which can be
by guest on June 24, 2018http://w
ww
.jbc.org/D
ownloaded from