umts master · · 2016-03-18the mt8220a umts master wcdma/hsdpa analyzer provides four wcdma...
TRANSCRIPT
High Performance Node B Analyzer
UMTS Master™
MT8220A
User’s GuideMS2712S331C Site Master SiteMaster MS2712MT8212A Cell Master CellMaster
New UMTS UG cover.qxd 12/14/05 9:09 AM Page 1

WARRANTYThe Anritsu product(s) listed on the title page is (are) warranted against defects inmaterials and workmanship for one year from the date of shipment.
Anritsu's obligation covers repairing or replacing products which prove to be defec-tive during the warranty period. Buyers shall prepay transportation charges forequipment returned to Anritsu for warranty repairs. Obligation is limited to the origi-nal purchaser. Anritsu is not liable for consequential damages.
LIMITATION OF WARRANTYThe foregoing warranty does not apply to Anritsu connectors that have failed due tonormal wear. Also, the warranty does not apply to defects resulting from improperor inadequate maintenance by the Buyer, unauthorized modification or misuse, oroperation outside the environmental specifications of the product. No other war-ranty is expressed or implied, and the remedies provided herein are the Buyer'ssole and exclusive remedies.
TRADEMARK ACKNOWLEDGMENTSWindows, Windows 2000 and Windows XP are registered trademarks of theMicrosoft Corporation. Intel Pentium is a trademark of Intel Corporation. VxWorks isa registered trademark, and WindML is a trademark of Wind River Systems, Inc.UMTS Master is a trademark of Anritsu Company.
NOTICEAnritsu Company has prepared this manual for use by Anritsu Company personneland customers as a guide for the proper installation, operation and maintenance ofAnritsu Company equipment and computer programs. The drawings, specifications,and information contained herein are the property of Anritsu Company, and anyunauthorized use or disclosure of these drawings, specifications, and information isprohibited; they shall not be reproduced, copied, or used in whole or in part as thebasis for manufacture or sale of the equipment or software programs without theprior written consent of Anritsu Company. All other trademarks contained herein arethe property of their respective owners.
UPDATESUpdates to this manual, if any, may be downloaded from the Anritsu internet site at:http://www.us.anritsu.com.
VxWorks Runtime License 2000-1189 WindML Target License 2000-1372
NI Device License 2000-1486
October 2006 10580-00125Copyright 2005-2006 Anritsu Company Revision: E
Table of Contents
Chapter 1 - General InformationIntroduction. . . . . . . . . . . . . . . . . . . . . . . . . . . . . . . . . . . . . . . . . . . . 1-1Description . . . . . . . . . . . . . . . . . . . . . . . . . . . . . . . . . . . . . . . . . . . . 1-1Options . . . . . . . . . . . . . . . . . . . . . . . . . . . . . . . . . . . . . . . . . . . . . . . 1-2Accessories . . . . . . . . . . . . . . . . . . . . . . . . . . . . . . . . . . . . . . . . . . . . 1-2Performance Specifications . . . . . . . . . . . . . . . . . . . . . . . . . . . . . . . 1-6Preventive Maintenance . . . . . . . . . . . . . . . . . . . . . . . . . . . . . . . . . 1-11Calibration Requirements . . . . . . . . . . . . . . . . . . . . . . . . . . . . . . . . 1-11ESD Cautions . . . . . . . . . . . . . . . . . . . . . . . . . . . . . . . . . . . . . . . . . 1-11Battery Replacement. . . . . . . . . . . . . . . . . . . . . . . . . . . . . . . . . . . . 1-12Soft Carrying Case . . . . . . . . . . . . . . . . . . . . . . . . . . . . . . . . . . . . . 1-13Tilt Bail Stand Installation . . . . . . . . . . . . . . . . . . . . . . . . . . . . . . . 1-15Anritsu Service Centers . . . . . . . . . . . . . . . . . . . . . . . . . . . . . . . . . 1-16
Chapter 2 - Quick Start GuideIntroduction. . . . . . . . . . . . . . . . . . . . . . . . . . . . . . . . . . . . . . . . . . . . 2-1Turning the MT8220A On for the First Time. . . . . . . . . . . . . . . . . . 2-1Front Panel Overview . . . . . . . . . . . . . . . . . . . . . . . . . . . . . . . . . . . . 2-2Display Overviews . . . . . . . . . . . . . . . . . . . . . . . . . . . . . . . . . . . . . . 2-3Test Panel Connectors . . . . . . . . . . . . . . . . . . . . . . . . . . . . . . . . . . . 2-7Making Spectrum Analyzer Measurements . . . . . . . . . . . . . . . . . . 2-11
Chapter 3 - Spectrum Analyzer MeasurementsIntroduction. . . . . . . . . . . . . . . . . . . . . . . . . . . . . . . . . . . . . . . . . . . . 3-1Amplitude . . . . . . . . . . . . . . . . . . . . . . . . . . . . . . . . . . . . . . . . . . . . . 3-1BW (Bandwidth). . . . . . . . . . . . . . . . . . . . . . . . . . . . . . . . . . . . . . . . 3-4File . . . . . . . . . . . . . . . . . . . . . . . . . . . . . . . . . . . . . . . . . . . . . . . . . . 3-5Freq (Frequency). . . . . . . . . . . . . . . . . . . . . . . . . . . . . . . . . . . . . . . 3-10Limit . . . . . . . . . . . . . . . . . . . . . . . . . . . . . . . . . . . . . . . . . . . . . . . . 3-12Marker. . . . . . . . . . . . . . . . . . . . . . . . . . . . . . . . . . . . . . . . . . . . . . . 3-15Measure. . . . . . . . . . . . . . . . . . . . . . . . . . . . . . . . . . . . . . . . . . . . . . 3-18Mode . . . . . . . . . . . . . . . . . . . . . . . . . . . . . . . . . . . . . . . . . . . . . . . . 3-22Preset. . . . . . . . . . . . . . . . . . . . . . . . . . . . . . . . . . . . . . . . . . . . . . . . 3-22Span . . . . . . . . . . . . . . . . . . . . . . . . . . . . . . . . . . . . . . . . . . . . . . . . 3-23Sweep . . . . . . . . . . . . . . . . . . . . . . . . . . . . . . . . . . . . . . . . . . . . . . . 3-24System. . . . . . . . . . . . . . . . . . . . . . . . . . . . . . . . . . . . . . . . . . . . . . . 3-27Trace . . . . . . . . . . . . . . . . . . . . . . . . . . . . . . . . . . . . . . . . . . . . . . . . 3-30Resolution Bandwidth. . . . . . . . . . . . . . . . . . . . . . . . . . . . . . . . . . . 3-33Video Bandwidth . . . . . . . . . . . . . . . . . . . . . . . . . . . . . . . . . . . . . . 3-33Sweep Limitations . . . . . . . . . . . . . . . . . . . . . . . . . . . . . . . . . . . . . 3-33Attenuator Functions. . . . . . . . . . . . . . . . . . . . . . . . . . . . . . . . . . . . 3-34Preamplifier Operation . . . . . . . . . . . . . . . . . . . . . . . . . . . . . . . . . . 3-35Field Measurements . . . . . . . . . . . . . . . . . . . . . . . . . . . . . . . . . . . . 3-37Occupied Bandwidth Measurement . . . . . . . . . . . . . . . . . . . . . . . . 3-37
i
Channel Power Measurement . . . . . . . . . . . . . . . . . . . . . . . . . . . . . 3-38GSM Channel Power Measurement . . . . . . . . . . . . . . . . . . . . . . . . 3-38GSM Adjacent Channel Power Measurement . . . . . . . . . . . . . . . . 3-39Out-of-Band Spurious Emission Measurement . . . . . . . . . . . . . . . 3-40In-band/Out-of-Channel Measurements . . . . . . . . . . . . . . . . . . . . . 3-42In-band Spurious Measurement . . . . . . . . . . . . . . . . . . . . . . . . . . . 3-42Field Strength . . . . . . . . . . . . . . . . . . . . . . . . . . . . . . . . . . . . . . . . . 3-44AM/FM/SSB Demodulation . . . . . . . . . . . . . . . . . . . . . . . . . . . . . . 3-45Carrier to Interference Ratio Measurement . . . . . . . . . . . . . . . . . . 3-45
Chapter 4 - WCDMA/HSDPA MeasurementsIntroduction. . . . . . . . . . . . . . . . . . . . . . . . . . . . . . . . . . . . . . . . . . . . 4-1WCDMA/HSDPA Signal Analyzer Mode . . . . . . . . . . . . . . . . . . . . 4-1Amplitude . . . . . . . . . . . . . . . . . . . . . . . . . . . . . . . . . . . . . . . . . . . . . 4-1File . . . . . . . . . . . . . . . . . . . . . . . . . . . . . . . . . . . . . . . . . . . . . . . . . . 4-3Freq (Frequency). . . . . . . . . . . . . . . . . . . . . . . . . . . . . . . . . . . . . . . . 4-8Measurements . . . . . . . . . . . . . . . . . . . . . . . . . . . . . . . . . . . . . . . . . . 4-9Mode . . . . . . . . . . . . . . . . . . . . . . . . . . . . . . . . . . . . . . . . . . . . . . . . 4-14Preset. . . . . . . . . . . . . . . . . . . . . . . . . . . . . . . . . . . . . . . . . . . . . . . . 4-14Setup . . . . . . . . . . . . . . . . . . . . . . . . . . . . . . . . . . . . . . . . . . . . . . . 4-15System. . . . . . . . . . . . . . . . . . . . . . . . . . . . . . . . . . . . . . . . . . . . . . . 4-17WCDMA/HSDPA Measurements . . . . . . . . . . . . . . . . . . . . . . . . . 4-20Measurement Setup. . . . . . . . . . . . . . . . . . . . . . . . . . . . . . . . . . . . . 4-22WCDMA/HSDPA RF Measurements . . . . . . . . . . . . . . . . . . . . . . 4-26Demodulator . . . . . . . . . . . . . . . . . . . . . . . . . . . . . . . . . . . . . . . . . . 4-33Over The Air Measurements. . . . . . . . . . . . . . . . . . . . . . . . . . . . . . 4-39Pass/Fail Mode . . . . . . . . . . . . . . . . . . . . . . . . . . . . . . . . . . . . . . . . 4-42
Chapter 5 - GSM/GPRS/EDGE MeasurementsIntroduction. . . . . . . . . . . . . . . . . . . . . . . . . . . . . . . . . . . . . . . . . . . . 5-1Amplitude . . . . . . . . . . . . . . . . . . . . . . . . . . . . . . . . . . . . . . . . . . . . . 5-2Freq (Frequency). . . . . . . . . . . . . . . . . . . . . . . . . . . . . . . . . . . . . . . . 5-3Setup . . . . . . . . . . . . . . . . . . . . . . . . . . . . . . . . . . . . . . . . . . . . . . . . . 5-4Measurements . . . . . . . . . . . . . . . . . . . . . . . . . . . . . . . . . . . . . . . . . . 5-5External Reference Frequency Setup . . . . . . . . . . . . . . . . . . . . . . . . 5-7GSM/GPRS/EDGE RF Measurements. . . . . . . . . . . . . . . . . . . . . . . 5-7Demodulator . . . . . . . . . . . . . . . . . . . . . . . . . . . . . . . . . . . . . . . . . . 5-11GSM/GPRS/EDGE Mode Pass/Fail Mode. . . . . . . . . . . . . . . . . . . 5-14Measurement Results . . . . . . . . . . . . . . . . . . . . . . . . . . . . . . . . . . . 5-15
Chapter 6 - Interference Analysis MeasurementsIntroduction. . . . . . . . . . . . . . . . . . . . . . . . . . . . . . . . . . . . . . . . . . . . 6-1Freq . . . . . . . . . . . . . . . . . . . . . . . . . . . . . . . . . . . . . . . . . . . . . . . . . . 6-1Amplitude . . . . . . . . . . . . . . . . . . . . . . . . . . . . . . . . . . . . . . . . . . . . . 6-3BW (Bandwidth). . . . . . . . . . . . . . . . . . . . . . . . . . . . . . . . . . . . . . . . 6-5Measurements . . . . . . . . . . . . . . . . . . . . . . . . . . . . . . . . . . . . . . . . . . 6-6
ii
Spectrum . . . . . . . . . . . . . . . . . . . . . . . . . . . . . . . . . . . . . . . . . . . . . . 6-7Spectrogram . . . . . . . . . . . . . . . . . . . . . . . . . . . . . . . . . . . . . . . . . . 6-11Signal Strength . . . . . . . . . . . . . . . . . . . . . . . . . . . . . . . . . . . . . . . . 6-12RSSI . . . . . . . . . . . . . . . . . . . . . . . . . . . . . . . . . . . . . . . . . . . . . . . . 6-13Marker. . . . . . . . . . . . . . . . . . . . . . . . . . . . . . . . . . . . . . . . . . . . . . . 6-14Spectrogram . . . . . . . . . . . . . . . . . . . . . . . . . . . . . . . . . . . . . . . . . . 6-17Signal Strength . . . . . . . . . . . . . . . . . . . . . . . . . . . . . . . . . . . . . . . . 6-19RSSI . . . . . . . . . . . . . . . . . . . . . . . . . . . . . . . . . . . . . . . . . . . . . . . . 6-20
Chapter 7 - Channel Scanner MeasurementsIntroduction. . . . . . . . . . . . . . . . . . . . . . . . . . . . . . . . . . . . . . . . . . . . 7-1Scanner: . . . . . . . . . . . . . . . . . . . . . . . . . . . . . . . . . . . . . . . . . . . . . . 7-1Amplitude . . . . . . . . . . . . . . . . . . . . . . . . . . . . . . . . . . . . . . . . . . . . . 7-3Custom Setup . . . . . . . . . . . . . . . . . . . . . . . . . . . . . . . . . . . . . . . . . . 7-3Measurements . . . . . . . . . . . . . . . . . . . . . . . . . . . . . . . . . . . . . . . . . . 7-4Sample Procedure . . . . . . . . . . . . . . . . . . . . . . . . . . . . . . . . . . . . . . . 7-6Custom Setup . . . . . . . . . . . . . . . . . . . . . . . . . . . . . . . . . . . . . . . . . . 7-6
Chapter 8 - GPS OptionIntroduction. . . . . . . . . . . . . . . . . . . . . . . . . . . . . . . . . . . . . . . . . . . . 8-1
Chapter 9 - Master Software ToolsIntroduction. . . . . . . . . . . . . . . . . . . . . . . . . . . . . . . . . . . . . . . . . . . . 9-1Features . . . . . . . . . . . . . . . . . . . . . . . . . . . . . . . . . . . . . . . . . . . . . . . 9-1System Requirements . . . . . . . . . . . . . . . . . . . . . . . . . . . . . . . . . . . . 9-2Installation . . . . . . . . . . . . . . . . . . . . . . . . . . . . . . . . . . . . . . . . . . . . 9-2Connection . . . . . . . . . . . . . . . . . . . . . . . . . . . . . . . . . . . . . . . . . . . . 9-2Using Master Software Tools . . . . . . . . . . . . . . . . . . . . . . . . . . . . . . 9-4Language Editor . . . . . . . . . . . . . . . . . . . . . . . . . . . . . . . . . . . . . . . 9-11Signal Standards Editor . . . . . . . . . . . . . . . . . . . . . . . . . . . . . . . . . 9-13Pass/Fail Mode . . . . . . . . . . . . . . . . . . . . . . . . . . . . . . . . . . . . . . . . 9-15Integration with Microsoft MapPoint“ . . . . . . . . . . . . . . . . . . . . . . 9-17Dat Conversion Utility . . . . . . . . . . . . . . . . . . . . . . . . . . . . . . . . . . 9-18Automatic Firmware Updates . . . . . . . . . . . . . . . . . . . . . . . . . . . . . 9-19
Appendix A - Signal StandardsIntroduction. . . . . . . . . . . . . . . . . . . . . . . . . . . . . . . . . . . . . . . . . . . . A-1
Appendix B - Error MessagesIntroduction. . . . . . . . . . . . . . . . . . . . . . . . . . . . . . . . . . . . . . . . . . . . B-1Self Test or Application Self Test Error Messages. . . . . . . . . . . . . . B-1Operation Error Messages. . . . . . . . . . . . . . . . . . . . . . . . . . . . . . . . . B-2GSM/WCDMA Messages . . . . . . . . . . . . . . . . . . . . . . . . . . . . . . . . B-7 Interference Analyzer Messages . . . . . . . . . . . . . . . . . . . . . . . . . . . B-8Channel Scanner Messages. . . . . . . . . . . . . . . . . . . . . . . . . . . . . . . B-10
iii

iv
Chapter 1General Information
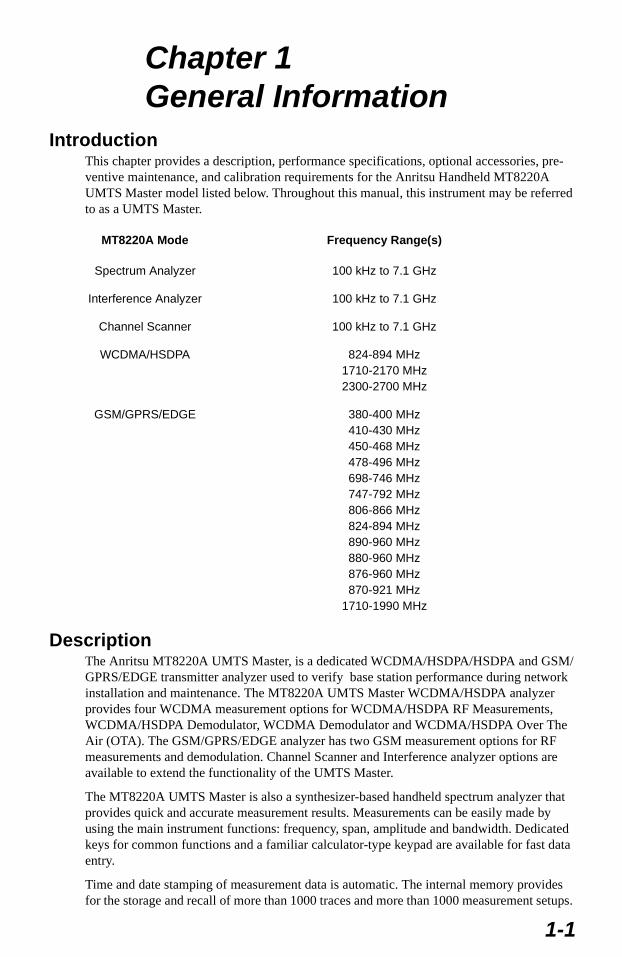
IntroductionThis chapter provides a description, performance specifications, optional accessories, pre-ventive maintenance, and calibration requirements for the Anritsu Handheld MT8220A UMTS Master model listed below. Throughout this manual, this instrument may be referred to as a UMTS Master.
DescriptionThe Anritsu MT8220A UMTS Master, is a dedicated WCDMA/HSDPA/HSDPA and GSM/GPRS/EDGE transmitter analyzer used to verify base station performance during network installation and maintenance. The MT8220A UMTS Master WCDMA/HSDPA analyzer provides four WCDMA measurement options for WCDMA/HSDPA RF Measurements, WCDMA/HSDPA Demodulator, WCDMA Demodulator and WCDMA/HSDPA Over The Air (OTA). The GSM/GPRS/EDGE analyzer has two GSM measurement options for RF measurements and demodulation. Channel Scanner and Interference analyzer options are available to extend the functionality of the UMTS Master.
The MT8220A UMTS Master is also a synthesizer-based handheld spectrum analyzer that provides quick and accurate measurement results. Measurements can be easily made by using the main instrument functions: frequency, span, amplitude and bandwidth. Dedicated keys for common functions and a familiar calculator-type keypad are available for fast data entry.
Time and date stamping of measurement data is automatic. The internal memory provides for the storage and recall of more than 1000 traces and more than 1000 measurement setups.
MT8220A Mode Frequency Range(s)
Spectrum Analyzer 100 kHz to 7.1 GHz
Interference Analyzer 100 kHz to 7.1 GHz
Channel Scanner 100 kHz to 7.1 GHz
WCDMA/HSDPA 824-894 MHz1710-2170 MHz2300-2700 MHz
GSM/GPRS/EDGE 380-400 MHz410-430 MHz450-468 MHz478-496 MHz698-746 MHz747-792 MHz806-866 MHz824-894 MHz890-960 MHz880-960 MHz876-960 MHz870-921 MHz
1710-1990 MHz
1-1
The bright daylight-viewable, high-resolution color liquid crystal display (LCD) provides easy viewing in a variety of lighting conditions. UMTS Master is capable of approximately three hours of continuous operation from a fully charged battery and can be operated from a 12 Vdc source, which also simultaneously charges the battery.
The MT8220A UMTS Master in transmitter analyzer mode displays six markers and the marker table in Code Domain Power, HSDPA, and Codogram displays. In Spectrum Ana-lyzer mode a full range of marker capabilities such as peak, center and delta functions are provided for faster, more comprehensive analysis of displayed signals. Upper and lower multi-segmented limit lines are available to create quick, simple pass/fail measurements. A menu option provides for an audible alert when the limit value is exceeded. Markers are not available in GSM mode.
Anritsu Master Software Tools, a PC-based software program, provides for storing measure-ment data. Master Software Tools can also convert the UMTS Master display into several graphic formats. Master software tools supports WCDMA/HSDPA RF measurements, WCDMA/HSDPA demodulator and WCDMA/HSDPA Over The Air measurements and GSM/GPRS/EDGE RF measurements and demodulator measurements.
Measurements may be stored in either internal memory or the Compact Flash. Stored mea-surements can be downloaded to a PC using the included USB and Ethernet cables. Once stored, the graphic trace can then be displayed, scaled, or enhanced with markers and limit lines. Historical graphs can be overlaid with current data using the PC mouse in a drag-and-drop fashion. The underlying data can be extracted and used in spreadsheets or for other ana-lytical tasks.
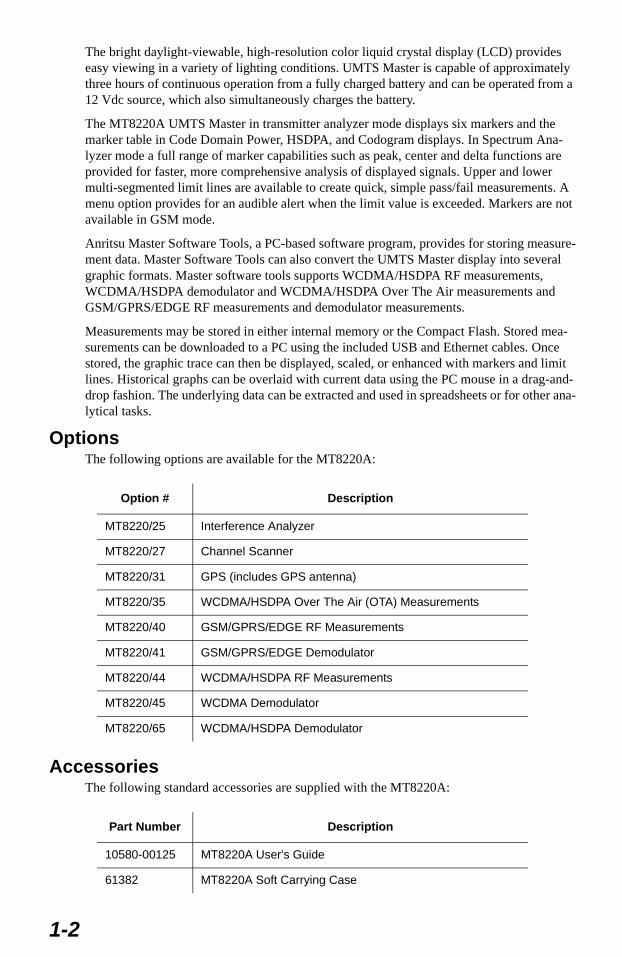
OptionsThe following options are available for the MT8220A:
AccessoriesThe following standard accessories are supplied with the MT8220A:
Option # Description
MT8220/25 Interference Analyzer
MT8220/27 Channel Scanner
MT8220/31 GPS (includes GPS antenna)
MT8220/35 WCDMA/HSDPA Over The Air (OTA) Measurements
MT8220/40 GSM/GPRS/EDGE RF Measurements
MT8220/41 GSM/GPRS/EDGE Demodulator
MT8220/44 WCDMA/HSDPA RF Measurements
MT8220/45 WCDMA Demodulator
MT8220/65 WCDMA/HSDPA Demodulator
Part Number Description
10580-00125 MT8220A User's Guide
61382 MT8220A Soft Carrying Case
1-2
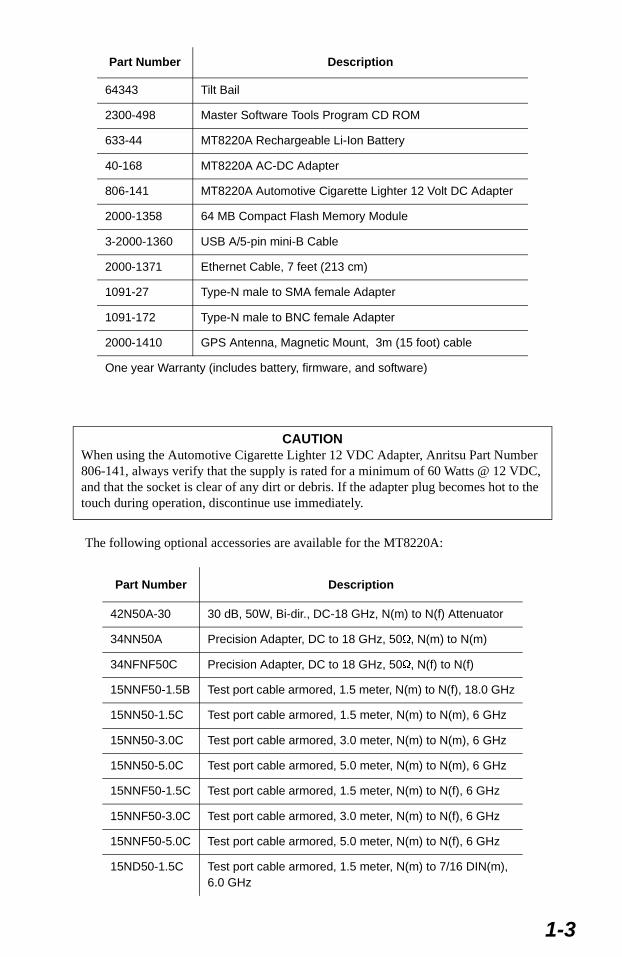
The following optional accessories are available for the MT8220A:
64343 Tilt Bail
2300-498 Master Software Tools Program CD ROM
633-44 MT8220A Rechargeable Li-Ion Battery
40-168 MT8220A AC-DC Adapter
806-141 MT8220A Automotive Cigarette Lighter 12 Volt DC Adapter
2000-1358 64 MB Compact Flash Memory Module
3-2000-1360 USB A/5-pin mini-B Cable
2000-1371 Ethernet Cable, 7 feet (213 cm)
1091-27 Type-N male to SMA female Adapter
1091-172 Type-N male to BNC female Adapter
2000-1410 GPS Antenna, Magnetic Mount, 3m (15 foot) cable
One year Warranty (includes battery, firmware, and software)
CAUTIONWhen using the Automotive Cigarette Lighter 12 VDC Adapter, Anritsu Part Number 806-141, always verify that the supply is rated for a minimum of 60 Watts @ 12 VDC, and that the socket is clear of any dirt or debris. If the adapter plug becomes hot to the touch during operation, discontinue use immediately.
Part Number Description
42N50A-30 30 dB, 50W, Bi-dir., DC-18 GHz, N(m) to N(f) Attenuator
34NN50A Precision Adapter, DC to 18 GHz, 50Ω, N(m) to N(m)
34NFNF50C Precision Adapter, DC to 18 GHz, 50Ω, N(f) to N(f)
15NNF50-1.5B Test port cable armored, 1.5 meter, N(m) to N(f), 18.0 GHz
15NN50-1.5C Test port cable armored, 1.5 meter, N(m) to N(m), 6 GHz
15NN50-3.0C Test port cable armored, 3.0 meter, N(m) to N(m), 6 GHz
15NN50-5.0C Test port cable armored, 5.0 meter, N(m) to N(m), 6 GHz
15NNF50-1.5C Test port cable armored, 1.5 meter, N(m) to N(f), 6 GHz
15NNF50-3.0C Test port cable armored, 3.0 meter, N(m) to N(f), 6 GHz
15NNF50-5.0C Test port cable armored, 5.0 meter, N(m) to N(f), 6 GHz
15ND50-1.5C Test port cable armored, 1.5 meter, N(m) to 7/16 DIN(m), 6.0 GHz
Part Number Description
1-3
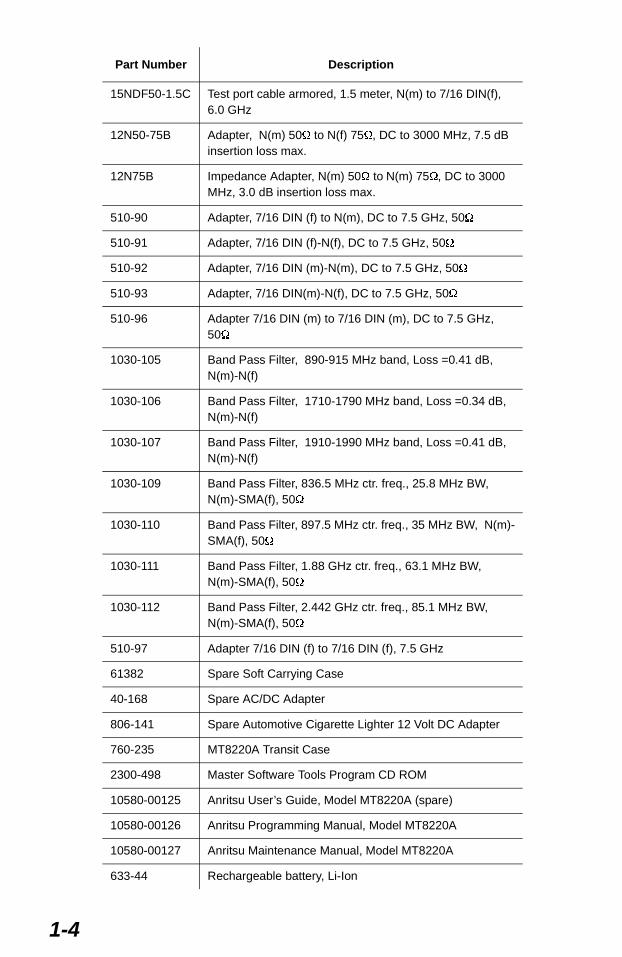
15NDF50-1.5C Test port cable armored, 1.5 meter, N(m) to 7/16 DIN(f), 6.0 GHz
12N50-75B Adapter, N(m) 50Ω to N(f) 75Ω, DC to 3000 MHz, 7.5 dB insertion loss max.
12N75B Impedance Adapter, N(m) 50Ω to N(m) 75Ω, DC to 3000 MHz, 3.0 dB insertion loss max.
510-90 Adapter, 7/16 DIN (f) to N(m), DC to 7.5 GHz, 50Ω
510-91 Adapter, 7/16 DIN (f)-N(f), DC to 7.5 GHz, 50Ω
510-92 Adapter, 7/16 DIN (m)-N(m), DC to 7.5 GHz, 50Ω
510-93 Adapter, 7/16 DIN(m)-N(f), DC to 7.5 GHz, 50Ω
510-96 Adapter 7/16 DIN (m) to 7/16 DIN (m), DC to 7.5 GHz, 50Ω
1030-105 Band Pass Filter, 890-915 MHz band, Loss =0.41 dB, N(m)-N(f)
1030-106 Band Pass Filter, 1710-1790 MHz band, Loss =0.34 dB, N(m)-N(f)
1030-107 Band Pass Filter, 1910-1990 MHz band, Loss =0.41 dB, N(m)-N(f)
1030-109 Band Pass Filter, 836.5 MHz ctr. freq., 25.8 MHz BW, N(m)-SMA(f), 50Ω
1030-110 Band Pass Filter, 897.5 MHz ctr. freq., 35 MHz BW, N(m)-SMA(f), 50Ω
1030-111 Band Pass Filter, 1.88 GHz ctr. freq., 63.1 MHz BW, N(m)-SMA(f), 50Ω
1030-112 Band Pass Filter, 2.442 GHz ctr. freq., 85.1 MHz BW, N(m)-SMA(f), 50Ω
510-97 Adapter 7/16 DIN (f) to 7/16 DIN (f), 7.5 GHz
61382 Spare Soft Carrying Case
40-168 Spare AC/DC Adapter
806-141 Spare Automotive Cigarette Lighter 12 Volt DC Adapter
760-235 MT8220A Transit Case
2300-498 Master Software Tools Program CD ROM
10580-00125 Anritsu User’s Guide, Model MT8220A (spare)
10580-00126 Anritsu Programming Manual, Model MT8220A
10580-00127 Anritsu Maintenance Manual, Model MT8220A
633-44 Rechargeable battery, Li-Ion
Part Number Description
1-4
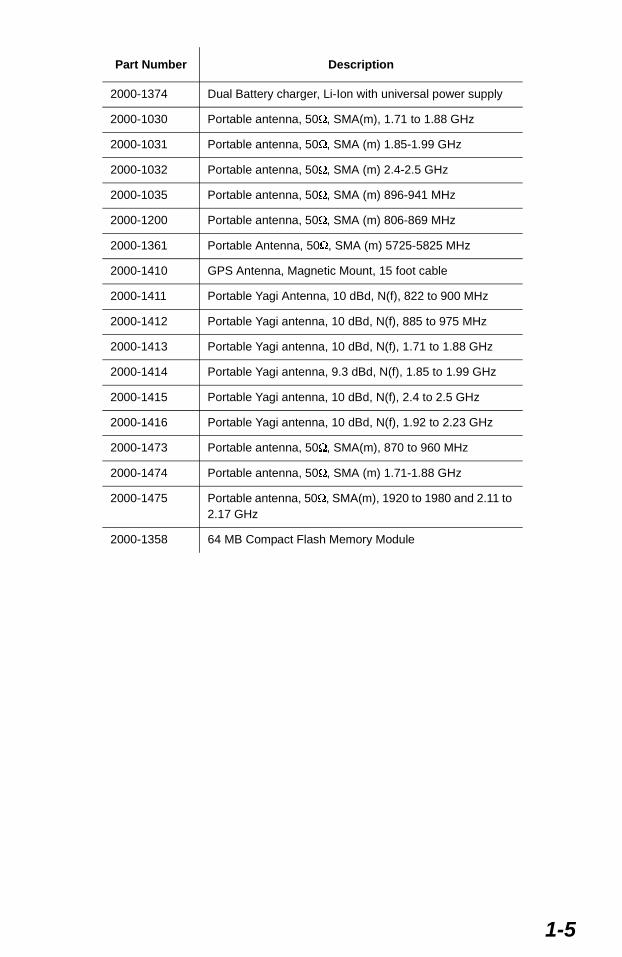
2000-1374 Dual Battery charger, Li-Ion with universal power supply
2000-1030 Portable antenna, 50Ω, SMA(m), 1.71 to 1.88 GHz
2000-1031 Portable antenna, 50Ω, SMA (m) 1.85-1.99 GHz
2000-1032 Portable antenna, 50Ω, SMA (m) 2.4-2.5 GHz
2000-1035 Portable antenna, 50Ω, SMA (m) 896-941 MHz
2000-1200 Portable antenna, 50Ω, SMA (m) 806-869 MHz
2000-1361 Portable Antenna, 50Ω, SMA (m) 5725-5825 MHz
2000-1410 GPS Antenna, Magnetic Mount, 15 foot cable
2000-1411 Portable Yagi Antenna, 10 dBd, N(f), 822 to 900 MHz
2000-1412 Portable Yagi antenna, 10 dBd, N(f), 885 to 975 MHz
2000-1413 Portable Yagi antenna, 10 dBd, N(f), 1.71 to 1.88 GHz
2000-1414 Portable Yagi antenna, 9.3 dBd, N(f), 1.85 to 1.99 GHz
2000-1415 Portable Yagi antenna, 10 dBd, N(f), 2.4 to 2.5 GHz
2000-1416 Portable Yagi antenna, 10 dBd, N(f), 1.92 to 2.23 GHz
2000-1473 Portable antenna, 50Ω, SMA(m), 870 to 960 MHz
2000-1474 Portable antenna, 50Ω, SMA (m) 1.71-1.88 GHz
2000-1475 Portable antenna, 50Ω, SMA(m), 1920 to 1980 and 2.11 to 2.17 GHz
2000-1358 64 MB Compact Flash Memory Module
Part Number Description
1-5
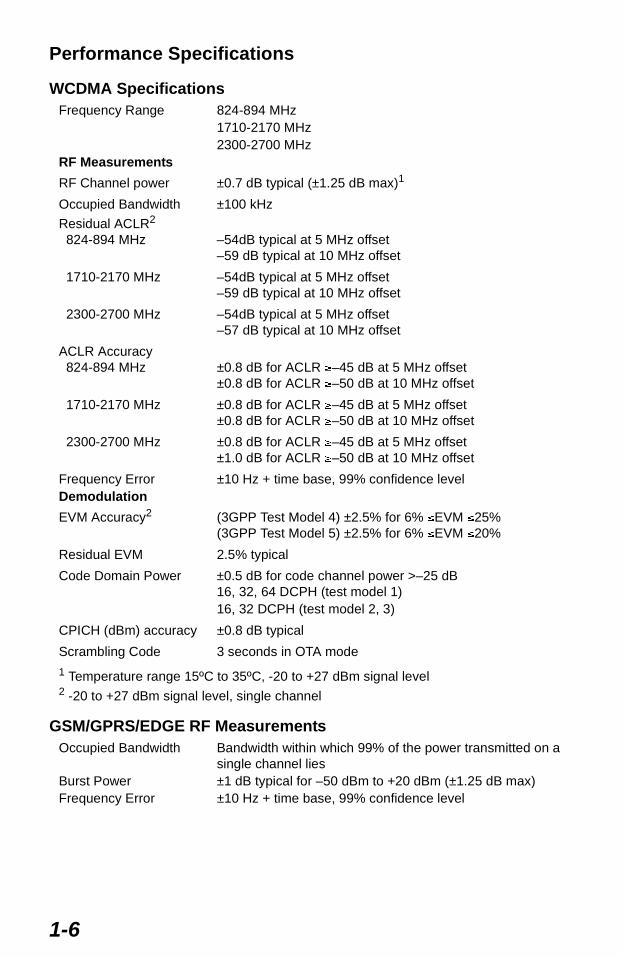
Performance Specifications
WCDMA SpecificationsFrequency Range 824-894 MHz
1710-2170 MHz2300-2700 MHz
RF Measurements
RF Channel power ±0.7 dB typical (±1.25 dB max)1
Occupied Bandwidth ±100 kHz
Residual ACLR2 824-894 MHz –54dB typical at 5 MHz offset
–59 dB typical at 10 MHz offset
1710-2170 MHz –54dB typical at 5 MHz offset–59 dB typical at 10 MHz offset
2300-2700 MHz –54dB typical at 5 MHz offset–57 dB typical at 10 MHz offset
ACLR Accuracy 824-894 MHz ±0.8 dB for ACLR ≥–45 dB at 5 MHz offset
±0.8 dB for ACLR ≥–50 dB at 10 MHz offset
1710-2170 MHz ±0.8 dB for ACLR ≥–45 dB at 5 MHz offset±0.8 dB for ACLR ≥–50 dB at 10 MHz offset
2300-2700 MHz ±0.8 dB for ACLR ≥–45 dB at 5 MHz offset±1.0 dB for ACLR ≥–50 dB at 10 MHz offset
Frequency Error ±10 Hz + time base, 99% confidence levelDemodulation
EVM Accuracy2 (3GPP Test Model 4) ±2.5% for 6% ≤EVM ≤25%(3GPP Test Model 5) ±2.5% for 6% ≤EVM ≤20%
Residual EVM 2.5% typical
Code Domain Power ±0.5 dB for code channel power >–25 dB16, 32, 64 DCPH (test model 1)16, 32 DCPH (test model 2, 3)
CPICH (dBm) accuracy ±0.8 dB typical
Scrambling Code 3 seconds in OTA mode
1 Temperature range 15ºC to 35ºC, -20 to +27 dBm signal level2 -20 to +27 dBm signal level, single channel
GSM/GPRS/EDGE RF MeasurementsOccupied Bandwidth Bandwidth within which 99% of the power transmitted on a
single channel liesBurst Power ±1 dB typical for –50 dBm to +20 dBm (±1.25 dB max)Frequency Error ±10 Hz + time base, 99% confidence level
1-6
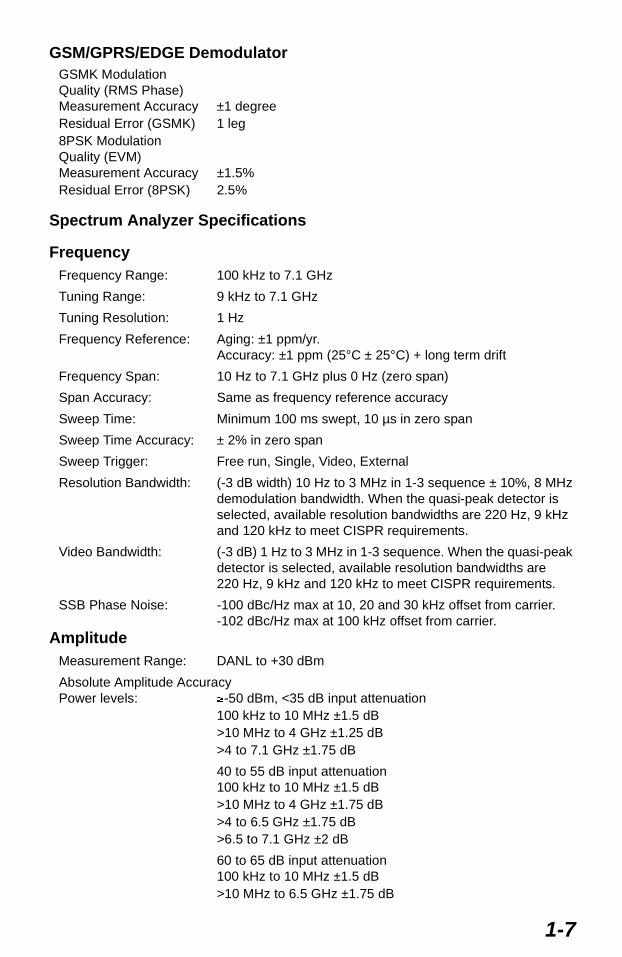
GSM/GPRS/EDGE DemodulatorGSMK Modulation Quality (RMS Phase) Measurement Accuracy ±1 degreeResidual Error (GSMK) 1 leg8PSK Modulation Quality (EVM) Measurement Accuracy ±1.5%Residual Error (8PSK) 2.5%
Spectrum Analyzer Specifications
FrequencyFrequency Range: 100 kHz to 7.1 GHz
Tuning Range: 9 kHz to 7.1 GHz
Tuning Resolution: 1 Hz
Frequency Reference: Aging: ±1 ppm/yr.Accuracy: ±1 ppm (25°C ± 25°C) + long term drift
Frequency Span: 10 Hz to 7.1 GHz plus 0 Hz (zero span)
Span Accuracy: Same as frequency reference accuracy
Sweep Time: Minimum 100 ms swept, 10 µs in zero span
Sweep Time Accuracy: ± 2% in zero span
Sweep Trigger: Free run, Single, Video, External
Resolution Bandwidth: (-3 dB width) 10 Hz to 3 MHz in 1-3 sequence ± 10%, 8 MHzdemodulation bandwidth. When the quasi-peak detector is selected, available resolution bandwidths are 220 Hz, 9 kHz and 120 kHz to meet CISPR requirements.
Video Bandwidth: (-3 dB) 1 Hz to 3 MHz in 1-3 sequence. When the quasi-peak detector is selected, available resolution bandwidths are 220 Hz, 9 kHz and 120 kHz to meet CISPR requirements.
SSB Phase Noise: -100 dBc/Hz max at 10, 20 and 30 kHz offset from carrier.-102 dBc/Hz max at 100 kHz offset from carrier.
AmplitudeMeasurement Range: DANL to +30 dBm
Absolute Amplitude AccuracyPower levels: ≥-50 dBm, <35 dB input attenuation
100 kHz to 10 MHz ±1.5 dB>10 MHz to 4 GHz ±1.25 dB>4 to 7.1 GHz ±1.75 dB
40 to 55 dB input attenuation100 kHz to 10 MHz ±1.5 dB>10 MHz to 4 GHz ±1.75 dB>4 to 6.5 GHz ±1.75 dB>6.5 to 7.1 GHz ±2 dB
60 to 65 dB input attenuation100 kHz to 10 MHz ±1.5 dB>10 MHz to 6.5 GHz ±1.75 dB
1-7
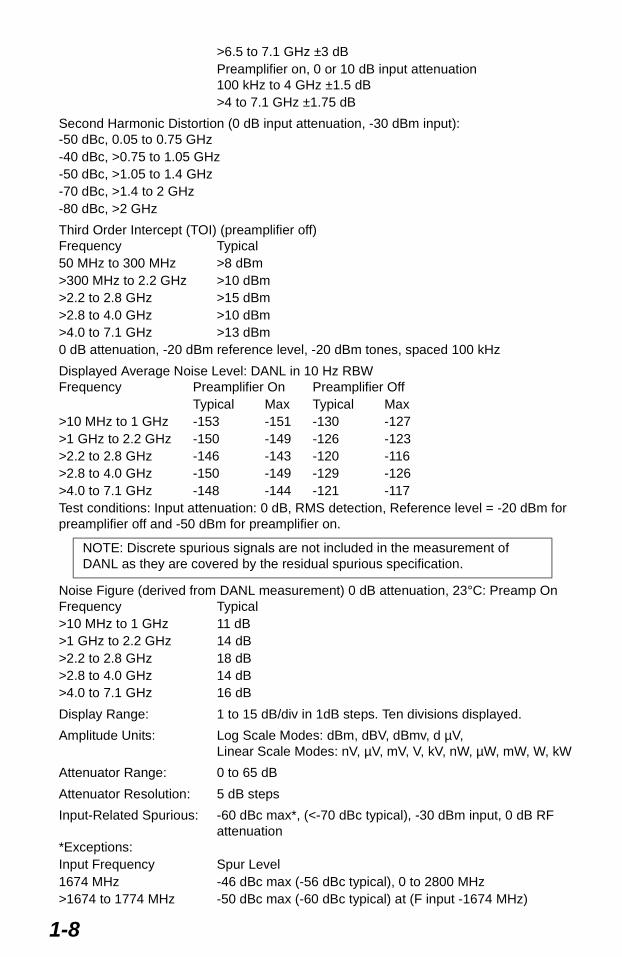
>6.5 to 7.1 GHz ±3 dBPreamplifier on, 0 or 10 dB input attenuation100 kHz to 4 GHz ±1.5 dB>4 to 7.1 GHz ±1.75 dB
Second Harmonic Distortion (0 dB input attenuation, -30 dBm input):-50 dBc, 0.05 to 0.75 GHz-40 dBc, >0.75 to 1.05 GHz-50 dBc, >1.05 to 1.4 GHz-70 dBc, >1.4 to 2 GHz-80 dBc, >2 GHz
Third Order Intercept (TOI) (preamplifier off)Frequency Typical50 MHz to 300 MHz >8 dBm>300 MHz to 2.2 GHz >10 dBm>2.2 to 2.8 GHz >15 dBm>2.8 to 4.0 GHz >10 dBm>4.0 to 7.1 GHz >13 dBm0 dB attenuation, -20 dBm reference level, -20 dBm tones, spaced 100 kHz
Displayed Average Noise Level: DANL in 10 Hz RBWFrequency Preamplifier On Preamplifier Off
Typical Max Typical Max>10 MHz to 1 GHz -153 -151 -130 -127>1 GHz to 2.2 GHz -150 -149 -126 -123>2.2 to 2.8 GHz -146 -143 -120 -116>2.8 to 4.0 GHz -150 -149 -129 -126>4.0 to 7.1 GHz -148 -144 -121 -117Test conditions: Input attenuation: 0 dB, RMS detection, Reference level = -20 dBm for preamplifier off and -50 dBm for preamplifier on.
Noise Figure (derived from DANL measurement) 0 dB attenuation, 23°C: Preamp OnFrequency Typical>10 MHz to 1 GHz 11 dB>1 GHz to 2.2 GHz 14 dB>2.2 to 2.8 GHz 18 dB>2.8 to 4.0 GHz 14 dB>4.0 to 7.1 GHz 16 dB
Display Range: 1 to 15 dB/div in 1dB steps. Ten divisions displayed.
Amplitude Units: Log Scale Modes: dBm, dBV, dBmv, d µV,Linear Scale Modes: nV, µV, mV, V, kV, nW, µW, mW, W, kW
Attenuator Range: 0 to 65 dB
Attenuator Resolution: 5 dB steps
Input-Related Spurious: -60 dBc max*, (<-70 dBc typical), -30 dBm input, 0 dB RFattenuation
*Exceptions:Input Frequency Spur Level1674 MHz -46 dBc max (-56 dBc typical), 0 to 2800 MHz>1674 to 1774 MHz -50 dBc max (-60 dBc typical) at (F input -1674 MHz)
NOTE: Discrete spurious signals are not included in the measurement of DANL as they are covered by the residual spurious specification.
1-8
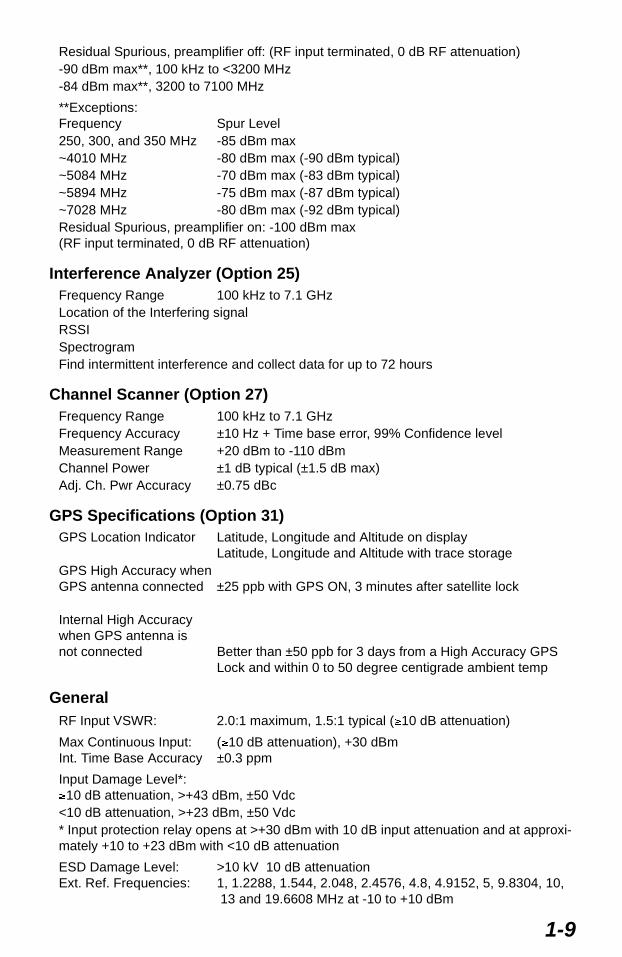
Residual Spurious, preamplifier off: (RF input terminated, 0 dB RF attenuation)-90 dBm max**, 100 kHz to <3200 MHz-84 dBm max**, 3200 to 7100 MHz
**Exceptions:Frequency Spur Level250, 300, and 350 MHz -85 dBm max~4010 MHz -80 dBm max (-90 dBm typical)~5084 MHz -70 dBm max (-83 dBm typical)~5894 MHz -75 dBm max (-87 dBm typical)~7028 MHz -80 dBm max (-92 dBm typical)Residual Spurious, preamplifier on: -100 dBm max (RF input terminated, 0 dB RF attenuation)
Interference Analyzer (Option 25)Frequency Range 100 kHz to 7.1 GHzLocation of the Interfering signalRSSISpectrogramFind intermittent interference and collect data for up to 72 hours
Channel Scanner (Option 27)Frequency Range 100 kHz to 7.1 GHzFrequency Accuracy ±10 Hz + Time base error, 99% Confidence levelMeasurement Range +20 dBm to -110 dBmChannel Power ±1 dB typical (±1.5 dB max)Adj. Ch. Pwr Accuracy ±0.75 dBc
GPS Specifications (Option 31)GPS Location Indicator Latitude, Longitude and Altitude on display
Latitude, Longitude and Altitude with trace storageGPS High Accuracy when GPS antenna connected ±25 ppb with GPS ON, 3 minutes after satellite lock
Internal High Accuracy when GPS antenna is not connected Better than ±50 ppb for 3 days from a High Accuracy GPS
Lock and within 0 to 50 degree centigrade ambient temp
GeneralRF Input VSWR: 2.0:1 maximum, 1.5:1 typical (≥10 dB attenuation)
Max Continuous Input: (≥10 dB attenuation), +30 dBmInt. Time Base Accuracy ±0.3 ppm
Input Damage Level*:≥10 dB attenuation, >+43 dBm, ±50 Vdc<10 dB attenuation, >+23 dBm, ±50 Vdc* Input protection relay opens at >+30 dBm with 10 dB input attenuation and at approxi-mately +10 to +23 dBm with <10 dB attenuation
ESD Damage Level: >10 kV 10 dB attenuationExt. Ref. Frequencies: 1, 1.2288, 1.544, 2.048, 2.4576, 4.8, 4.9152, 5, 9.8304, 10,
13 and 19.6608 MHz at -10 to +10 dBm
1-9
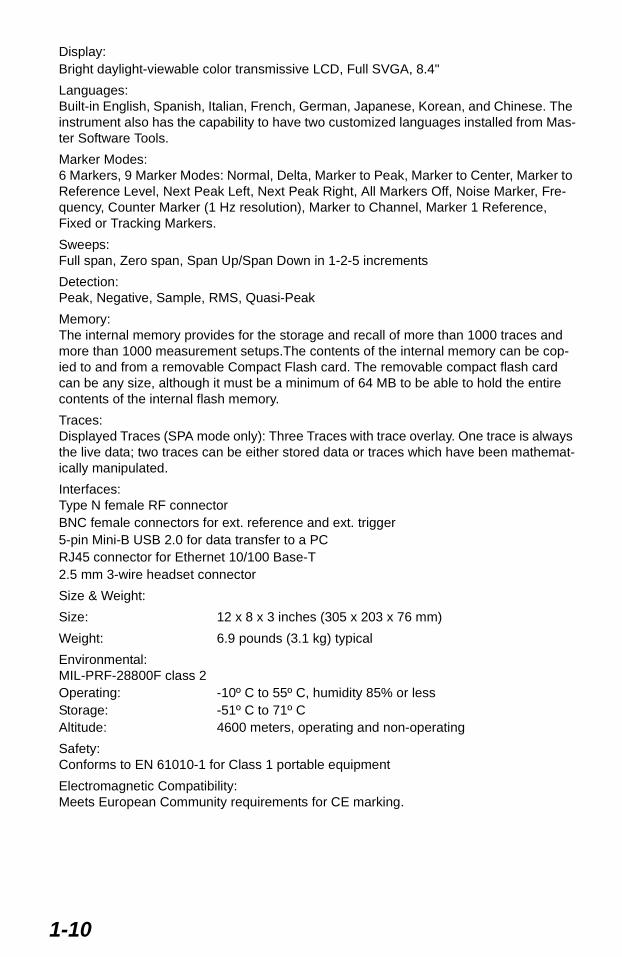
Display:Bright daylight-viewable color transmissive LCD, Full SVGA, 8.4"
Languages:Built-in English, Spanish, Italian, French, German, Japanese, Korean, and Chinese. The instrument also has the capability to have two customized languages installed from Mas-ter Software Tools.
Marker Modes:6 Markers, 9 Marker Modes: Normal, Delta, Marker to Peak, Marker to Center, Marker to Reference Level, Next Peak Left, Next Peak Right, All Markers Off, Noise Marker, Fre-quency, Counter Marker (1 Hz resolution), Marker to Channel, Marker 1 Reference, Fixed or Tracking Markers.
Sweeps:Full span, Zero span, Span Up/Span Down in 1-2-5 increments
Detection:Peak, Negative, Sample, RMS, Quasi-Peak
Memory:The internal memory provides for the storage and recall of more than 1000 traces and more than 1000 measurement setups.The contents of the internal memory can be cop-ied to and from a removable Compact Flash card. The removable compact flash card can be any size, although it must be a minimum of 64 MB to be able to hold the entire contents of the internal flash memory.
Traces:Displayed Traces (SPA mode only): Three Traces with trace overlay. One trace is always the live data; two traces can be either stored data or traces which have been mathemat-ically manipulated.
Interfaces:Type N female RF connectorBNC female connectors for ext. reference and ext. trigger5-pin Mini-B USB 2.0 for data transfer to a PCRJ45 connector for Ethernet 10/100 Base-T2.5 mm 3-wire headset connector
Size & Weight:
Size: 12 x 8 x 3 inches (305 x 203 x 76 mm)
Weight: 6.9 pounds (3.1 kg) typical
Environmental:MIL-PRF-28800F class 2Operating: -10º C to 55º C, humidity 85% or lessStorage: -51º C to 71º CAltitude: 4600 meters, operating and non-operating
Safety:Conforms to EN 61010-1 for Class 1 portable equipment
Electromagnetic Compatibility:Meets European Community requirements for CE marking.
1-10

Preventive MaintenanceUMTS Master preventive maintenance consists of cleaning the unit and inspecting and cleaning the RF connectors on the instrument and all accessories. Clean the UMTS Master with a soft, lint-free cloth dampened with water or water and a mild cleaning solution.
CAUTION: To avoid damaging the display or case, do not use solvents or abrasive cleaners.
Clean the RF connectors and center pins with a cotton swab dampened with denatured alco-hol. Visually inspect the connectors. The fingers of N(f) connectors and the pins of N(m) connectors should be unbroken and uniform in appearance. If you are unsure whether the connectors are good, gauge the connectors to confirm that their dimensions are correct.
Visually inspect the test port cable(s). The test port cable should be uniform in appearance, not stretched, kinked, dented, or broken.
Calibration RequirementsThe UMTS Master loads factory calibration data during start-up, eliminating the need for daily calibration checks. In WCDMA modes, an additional automatic calibration is done as the internal temperature of the unit changes to insure the best possible measurement results.
Although UMTS Master does not require daily field calibration, Anritsu recommends annual calibration and performance verification by local Anritsu service centers. Anritsu service centers are listed in this chapter.
ESD CautionsThe MT8220A, like other high performance instruments, is susceptible to ESD damage. Very often, coaxial cables and antennas build up a static charge, which, if allowed to dis-charge by connecting directly to the MT8220A without discharging the static charge, may damage the MT8220A input circuitry. MT8220A operators should be aware of the potential for ESD damage and take all necessary precautions.
Operators should exercise practices outlined within industry standards such as JEDEC-625 (EIA-625), MIL-HDBK-263, and MIL-STD-1686, which pertain to ESD and ESDS devices, equipment, and practices. As these apply to the MT8220A, it is recommended that any static charges that may be present be dissipated before connecting coaxial cables or antennas to the MT8220A. This may be as simple as temporarily attaching a short or load device to the cable or antenna prior to attaching to the MT8220A. It is important to remember that the operator may also carry a static charge that can cause damage. Following the practices outlined in the above standards will ensure a safe environment for both personnel and equipment.
1-11
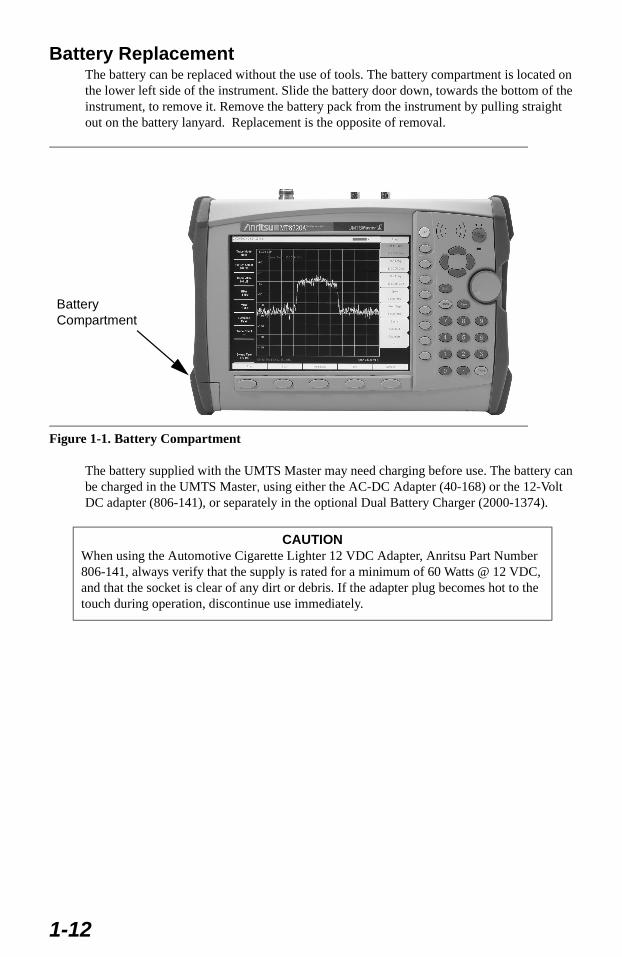
Battery Replacement The battery can be replaced without the use of tools. The battery compartment is located on the lower left side of the instrument. Slide the battery door down, towards the bottom of the instrument, to remove it. Remove the battery pack from the instrument by pulling straight out on the battery lanyard. Replacement is the opposite of removal.
The battery supplied with the UMTS Master may need charging before use. The battery can be charged in the UMTS Master, using either the AC-DC Adapter (40-168) or the 12-Volt DC adapter (806-141), or separately in the optional Dual Battery Charger (2000-1374).
Figure 1-1. Battery Compartment
CAUTIONWhen using the Automotive Cigarette Lighter 12 VDC Adapter, Anritsu Part Number 806-141, always verify that the supply is rated for a minimum of 60 Watts @ 12 VDC, and that the socket is clear of any dirt or debris. If the adapter plug becomes hot to the touch during operation, discontinue use immediately.
BatteryCompartment
1-12
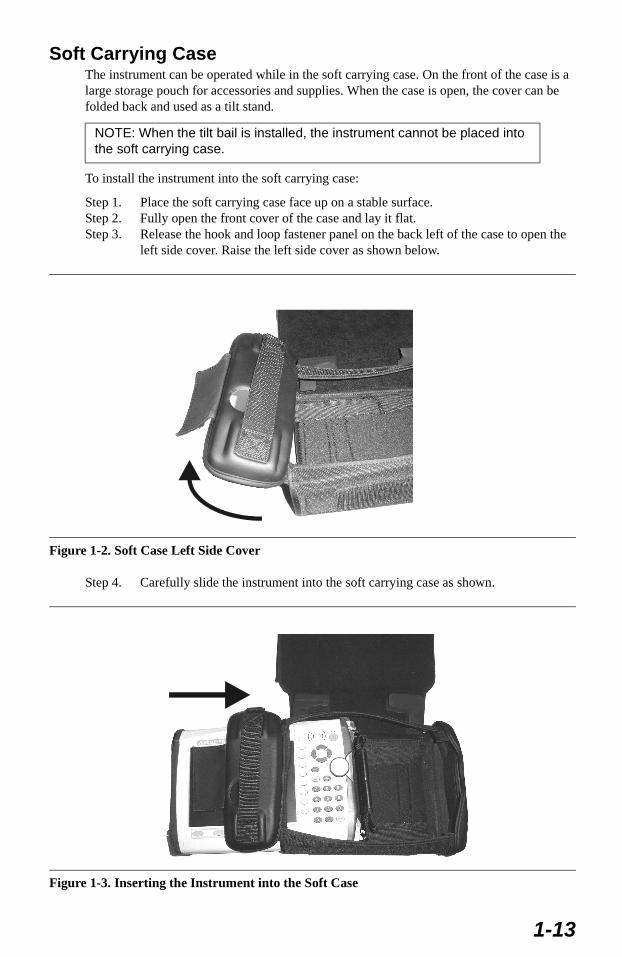
Soft Carrying CaseThe instrument can be operated while in the soft carrying case. On the front of the case is a large storage pouch for accessories and supplies. When the case is open, the cover can be folded back and used as a tilt stand.
To install the instrument into the soft carrying case:
Step 1. Place the soft carrying case face up on a stable surface.Step 2. Fully open the front cover of the case and lay it flat.Step 3. Release the hook and loop fastener panel on the back left of the case to open the
left side cover. Raise the left side cover as shown below.
Step 4. Carefully slide the instrument into the soft carrying case as shown.
NOTE: When the tilt bail is installed, the instrument cannot be placed into the soft carrying case.
Figure 1-2. Soft Case Left Side Cover
Figure 1-3. Inserting the Instrument into the Soft Case
1-13
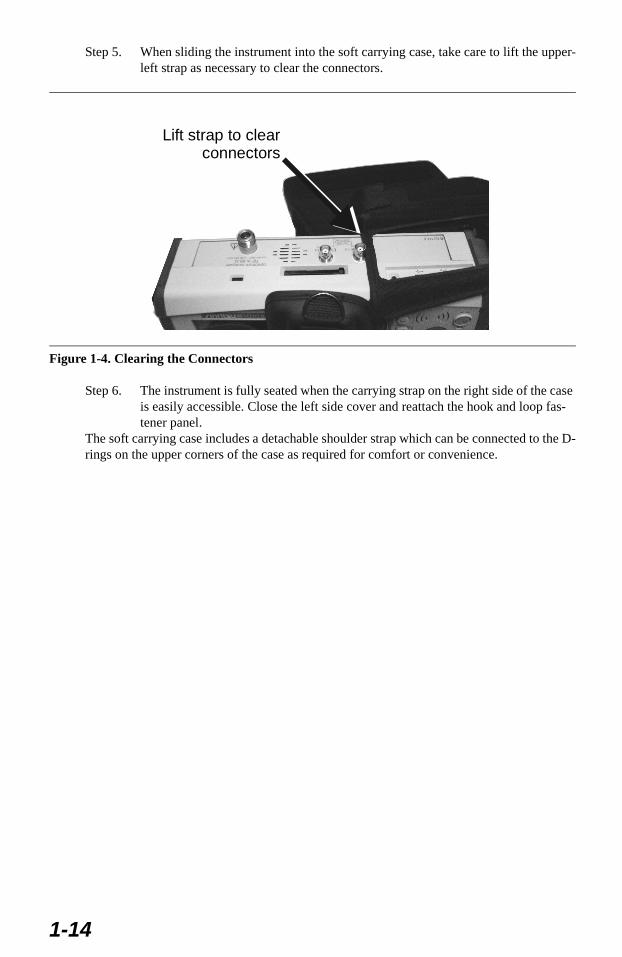
Step 5. When sliding the instrument into the soft carrying case, take care to lift the upper-left strap as necessary to clear the connectors.
Step 6. The instrument is fully seated when the carrying strap on the right side of the case is easily accessible. Close the left side cover and reattach the hook and loop fas-tener panel.
The soft carrying case includes a detachable shoulder strap which can be connected to the D-rings on the upper corners of the case as required for comfort or convenience.
Figure 1-4. Clearing the Connectors
Lift strap to clear connectors
1-14
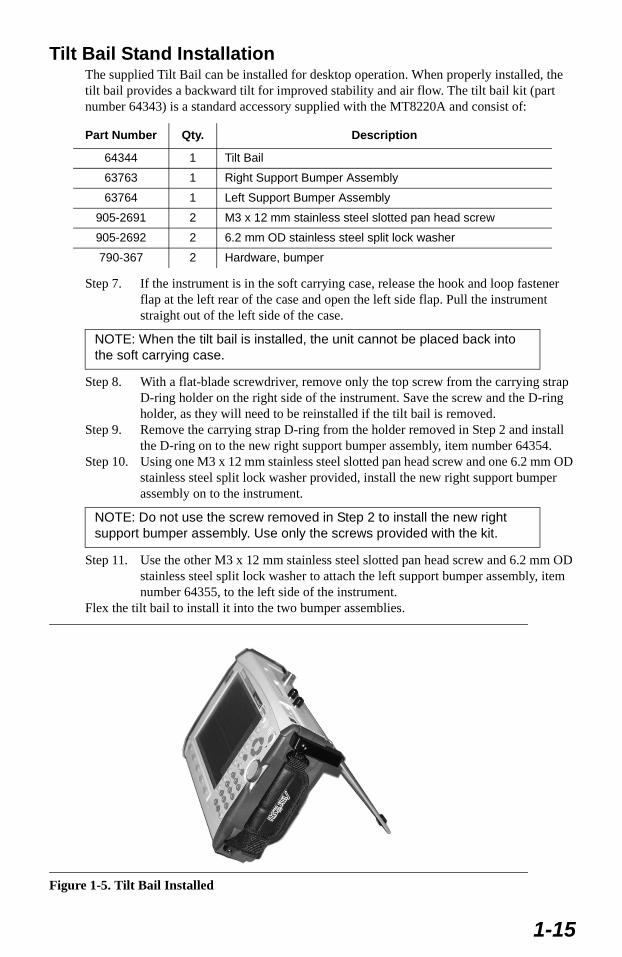
Tilt Bail Stand InstallationThe supplied Tilt Bail can be installed for desktop operation. When properly installed, the tilt bail provides a backward tilt for improved stability and air flow. The tilt bail kit (part number 64343) is a standard accessory supplied with the MT8220A and consist of:
Step 7. If the instrument is in the soft carrying case, release the hook and loop fastener flap at the left rear of the case and open the left side flap. Pull the instrument straight out of the left side of the case.
Step 8. With a flat-blade screwdriver, remove only the top screw from the carrying strap D-ring holder on the right side of the instrument. Save the screw and the D-ring holder, as they will need to be reinstalled if the tilt bail is removed.
Step 9. Remove the carrying strap D-ring from the holder removed in Step 2 and install the D-ring on to the new right support bumper assembly, item number 64354.
Step 10. Using one M3 x 12 mm stainless steel slotted pan head screw and one 6.2 mm OD stainless steel split lock washer provided, install the new right support bumper assembly on to the instrument.
Step 11. Use the other M3 x 12 mm stainless steel slotted pan head screw and 6.2 mm OD stainless steel split lock washer to attach the left support bumper assembly, item number 64355, to the left side of the instrument.
Flex the tilt bail to install it into the two bumper assemblies.
Part Number Qty. Description
64344 1 Tilt Bail
63763 1 Right Support Bumper Assembly
63764 1 Left Support Bumper Assembly
905-2691 2 M3 x 12 mm stainless steel slotted pan head screw
905-2692 2 6.2 mm OD stainless steel split lock washer
790-367 2 Hardware, bumper
NOTE: When the tilt bail is installed, the unit cannot be placed back into the soft carrying case.
NOTE: Do not use the screw removed in Step 2 to install the new right support bumper assembly. Use only the screws provided with the kit.
Figure 1-5. Tilt Bail Installed
1-15
Anritsu Service Centers
UNITED STATESANRITSU COMPANY490 Jarvis DriveMorgan Hill, CA 95037-2809Telephone: (408) 776-83001-800-ANRITSUFAX: 408-776-1744
FRANCEANRITSU S.A9 Avenue du QuebecZone de Courtaboeuf91951 Les Ulis CedexTelephone: 016-09-21-550FAX: 016-44-61-065
SINGAPOREANRITSU (SINGAPORE) PTE LTD.10, Hoe Chiang Road#07-01/02 Keppel TowersSingapore 089315Telephone: 6282-2400FAX: 6282-2533
ANRITSU COMPANY10 New Maple Ave., Unit 305Pine Brook, NJ 07058Telephone: (973) 227-89991-800-ANRITSUFAX: 973-575-0092
GERMANYANRITSU GmbHKonrad-Zuse-Platz 181829 Muenchen, GermanyTelephone: +49 89 4423080FAX: +49 89 44230855
SOUTH AFRICAETECSA12 Surrey Square Office Park330 Surrey AvenueFerndale, Randburg, 2194South AfricaTelephone: 27-11-787-7200FAX: 27-11-787-0446
ANRITSU COMPANY1155 E. Collins BlvdRichardson, TX 75081Telephone: 1-800-ANRITSUFAX: 972-671-1877
INDIAMEERA AGENCIES PVT. LTD.23 Community CentreZamroodpur, Kailash Colony Extension,New Delhi, India 110 048Phone: 011-2-6442700/6442800FAX : 011-2-6442500
SWEDENANRITSU ABBorgafjordsgatan 13164 40 Kista Telephone: (08) 534-707-00FAX: (08) 534-707-30
AUSTRALIAANRITSU PTY. LTD.Unit 21, Ferntree Gully RoadNotting Hill, VIC 3168AustraliaTelephone: 03-9558-8177FAX: 03-9558-8255
ISRAELTECH-CENT, LTD.4 Raul Valenberg StTel-Aviv 69719Telephone: (03) 64-78-563FAX: (03) 64-78-334
TAIWANANRITSU CO., INC.7F, No. 316, Section 1NeiHu RoadTaipei, Taiwan, R.O.C.Telephone: 886-2-8751-1816FAX: 886-2-8751-2126
BRAZILANRITSU ELECTRONICA LTDA.Praça Amadeu Amaral 27, 1º andar.Bela Vista, São Paulo, SP, Brasil.CEP: 01327-010Telephone: 55-11-3283-2511Fax: 55-11-3288-6940
ITALYANRITSU Sp.ARoma OfficeVia E. Vittorini, 12900144 Roma EURTelephone: (06) 50-99-711FAX: (06) 50-22-4252
UNITED KINGDOMANRITSU LTD.200 Capability GreenLuton, BedfordshireLU1 3LU, EnglandTelephone: 015-82-433200FAX: 015-82-731303
CANADAANRITSU INSTRUMENTS LTD.700 Silver Seven Road, Suite 120Kanata, Ontario K2V 1C3Telephone: (613) 591-2003FAX: (613) 591-1006
JAPANANRITSU CUSTOMER SER-VICES CO. LTD.5-1-1 Onna Atsugi-shiKanagawa-Prf. 243-0032 JapanTelephone: 046-296-6688FAX: 046-225-8379
CHINAANRITSU ELECTRONICS (SHANGHAI) CO. LTD.2F, Rm B, 52 Section Factory BuildingNo. 516 Fu Te Rd (N)Shanghai 200131 P.R. ChinaTelephone:21-58680226, 58680227, 58680228FAX: 21-58680588
KOREAANRITSU CORPORATION LTD.Service Center:8F Hyunjuk Building832-41, Yeoksam DongKangnam-KuSeoul, South Korea 135-080Telephone: 82-2-553-6603FAX: 82-2-553-6605
1-16
Chapter 2Quick Start Guide
IntroductionThis chapter provides a brief overview of the Anritsu MT8220A UMTS Master. The intent of this chapter is to provide the user with a starting point for making basic measurements. For more detailed information, refer to the specific measurement mode chapters later in this manual.
Turning the MT8220A On for the First TimeThe Anritsu MT8220A UMTS Master is capable of approximately three hours of continuous operation from a fully charged, field-replaceable battery (see Chapter 1). The MT8220A can also be operated from a 12 Vdc source (which will also simultaneously charge the battery). This can be achieved with either the Anritsu AC-DC Adapter (Anritsu part number 40-168) or 12 Vdc Automotive Cigarette Lighter Adapter (Anritsu part number 806-141). Both items are included as standard accessories (see the list of accessories in Chapter 1).
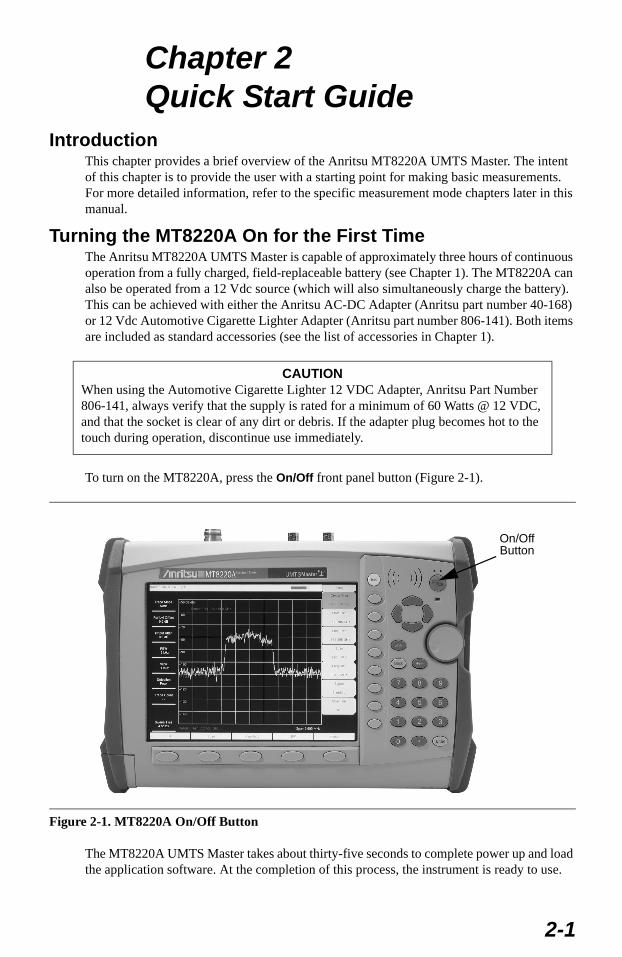
To turn on the MT8220A, press the On/Off front panel button (Figure 2-1).
The MT8220A UMTS Master takes about thirty-five seconds to complete power up and load the application software. At the completion of this process, the instrument is ready to use.
CAUTIONWhen using the Automotive Cigarette Lighter 12 VDC Adapter, Anritsu Part Number 806-141, always verify that the supply is rated for a minimum of 60 Watts @ 12 VDC, and that the socket is clear of any dirt or debris. If the adapter plug becomes hot to the touch during operation, discontinue use immediately.
Figure 2-1. MT8220A On/Off Button
On/Off Button
2-1
For information on making spectrum analyzer measurements with the UMTS Master, refer to “Making a Spectrum Analyzer Measurement,” later in this chapter, and Chapter 4, Spec-trum Analyzer Measurements. For information on making WCDMA/HSDPA measurements with the UMTS Master, refer to Chapter 5, WCDMA/HSDPA Measurements. For informa-tion on making GSM/GPRS/EDGE measurements, see Chapter 5, GSM/GPRS/EDGE Mea-surements.
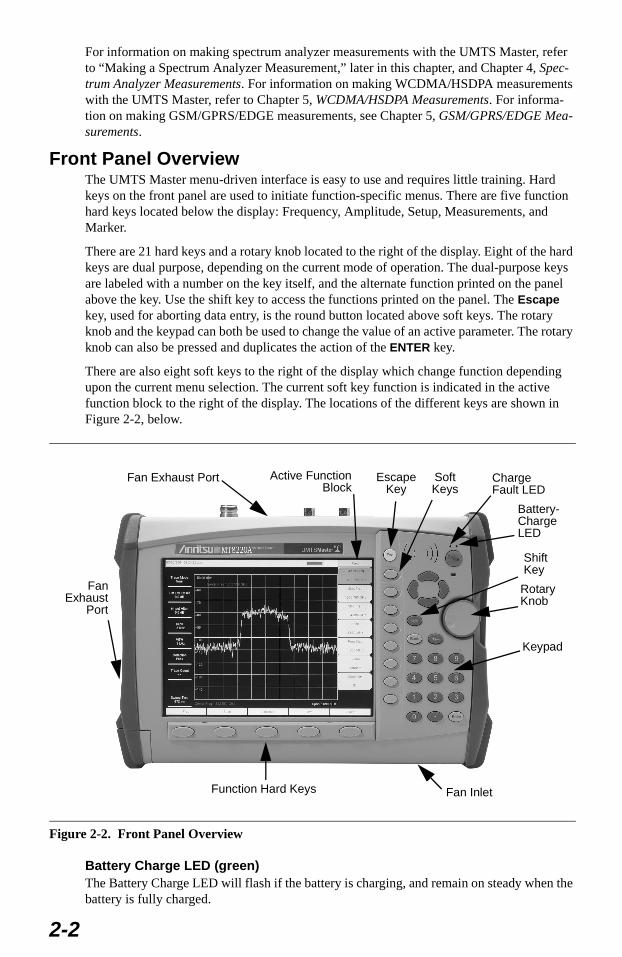
Front Panel OverviewThe UMTS Master menu-driven interface is easy to use and requires little training. Hard keys on the front panel are used to initiate function-specific menus. There are five function hard keys located below the display: Frequency, Amplitude, Setup, Measurements, and Marker.
There are 21 hard keys and a rotary knob located to the right of the display. Eight of the hard keys are dual purpose, depending on the current mode of operation. The dual-purpose keys are labeled with a number on the key itself, and the alternate function printed on the panel above the key. Use the shift key to access the functions printed on the panel. The Escape key, used for aborting data entry, is the round button located above soft keys. The rotary knob and the keypad can both be used to change the value of an active parameter. The rotary knob can also be pressed and duplicates the action of the ENTER key.
There are also eight soft keys to the right of the display which change function depending upon the current menu selection. The current soft key function is indicated in the active function block to the right of the display. The locations of the different keys are shown in Figure 2-2, below.
Battery Charge LED (green)The Battery Charge LED will flash if the battery is charging, and remain on steady when the battery is fully charged.
Figure 2-2. Front Panel Overview
Function Hard Keys
Active FunctionBlock
Escape Key
Soft Keys
Shift Key
Charge Fault LED
Battery-ChargeLED
Keypad
Fan Inlet
Fan Exhaust Port
FanExhaust
Port
Rotary Knob
2-2
Charge Fault LED (red)The Charge Fault LED will remain on steady under a battery charger fault condition. Fault conditions include a battery cell voltage that is too low to charge, or a battery temperature outside the temperature range (-5º C to +50º C) to charge.
Fan Inlet and Exhaust PortsIt is important to keep the fan inlet and exhaust ports clear of obstructions at all times for proper ventilation and cooling of the instrument.
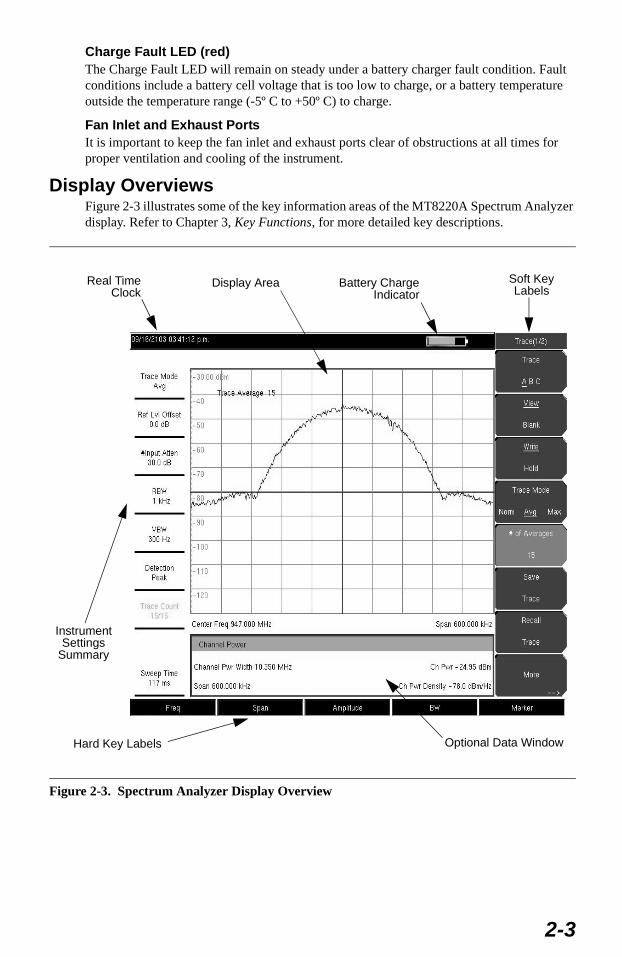
Display OverviewsFigure 2-3 illustrates some of the key information areas of the MT8220A Spectrum Analyzer display. Refer to Chapter 3, Key Functions, for more detailed key descriptions.
Figure 2-3. Spectrum Analyzer Display Overview
Soft KeyLabels
Battery ChargeIndicator
Display AreaReal TimeClock
InstrumentSettings
Summary
Hard Key Labels Optional Data Window
2-3
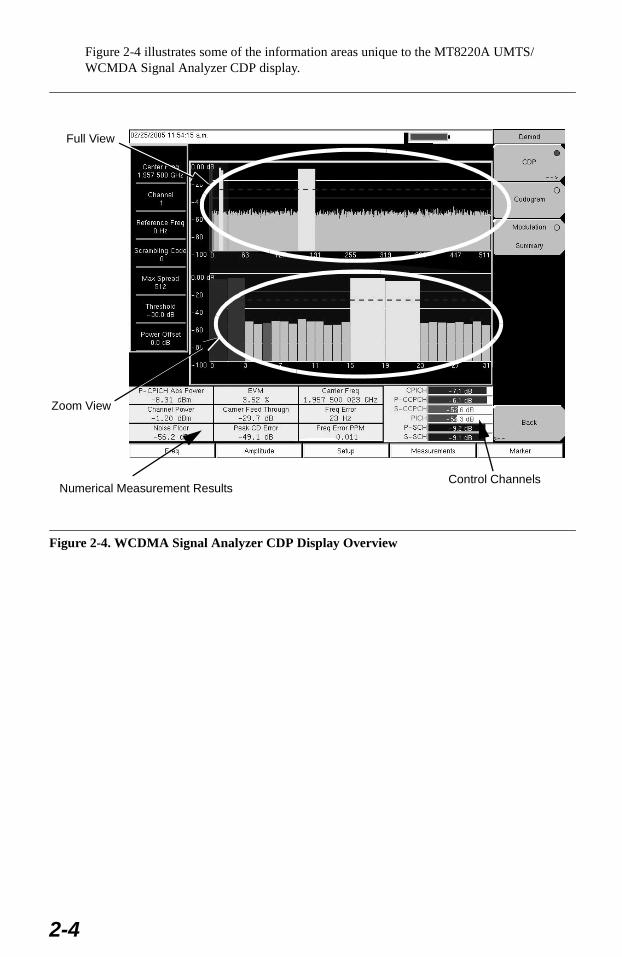
Figure 2-4 illustrates some of the information areas unique to the MT8220A UMTS/WCMDA Signal Analyzer CDP display.
Figure 2-4. WCDMA Signal Analyzer CDP Display Overview
Zoom View
Numerical Measurement ResultsControl Channels
Full View
2-4
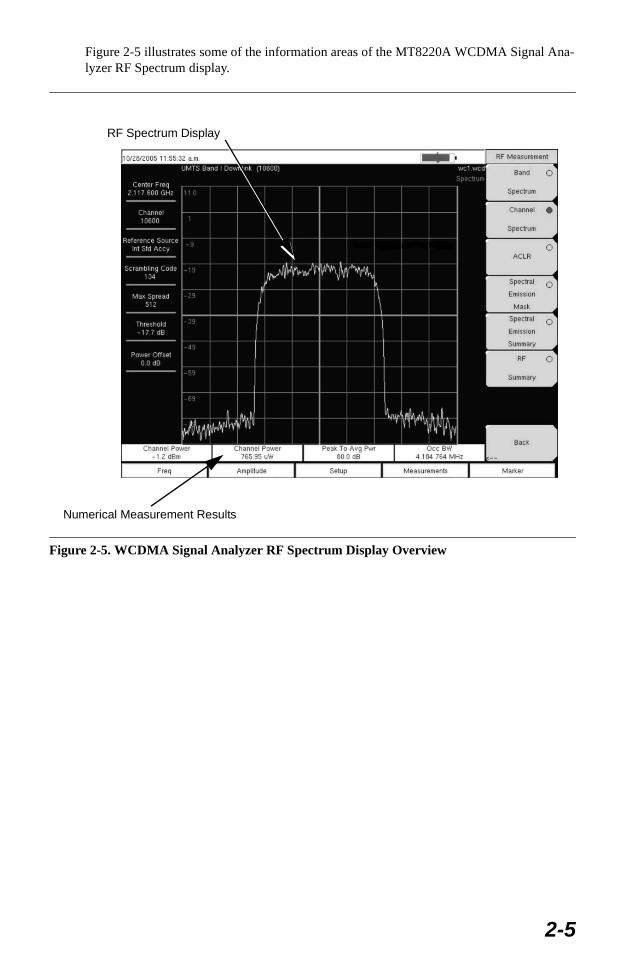
Figure 2-5 illustrates some of the information areas of the MT8220A WCDMA Signal Ana-lyzer RF Spectrum display.
Figure 2-5. WCDMA Signal Analyzer RF Spectrum Display Overview
RF Spectrum Display
Numerical Measurement Results
2-5
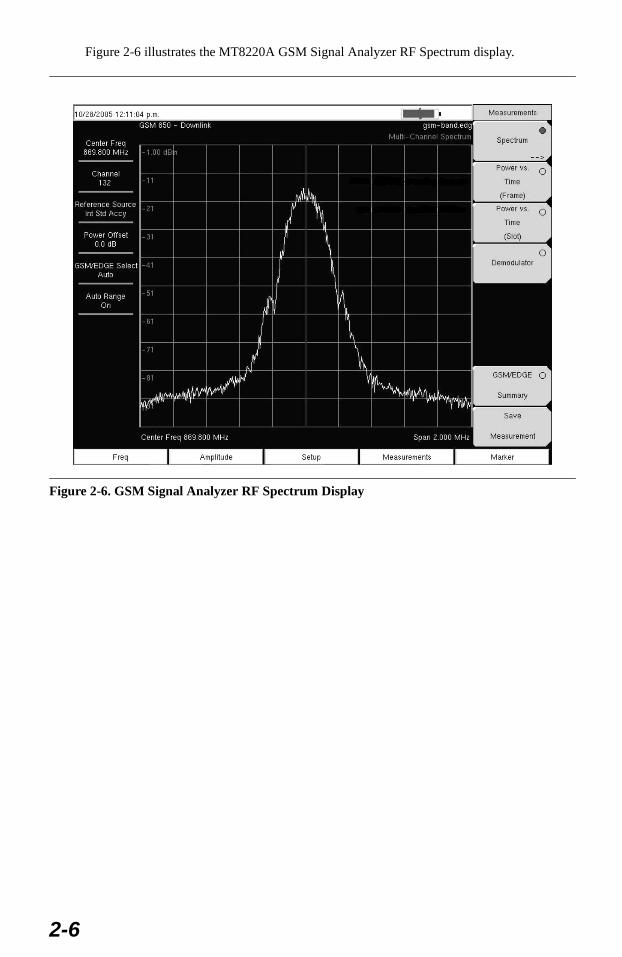
Figure 2-6 illustrates the MT8220A GSM Signal Analyzer RF Spectrum display.
Figure 2-6. GSM Signal Analyzer RF Spectrum Display
2-6
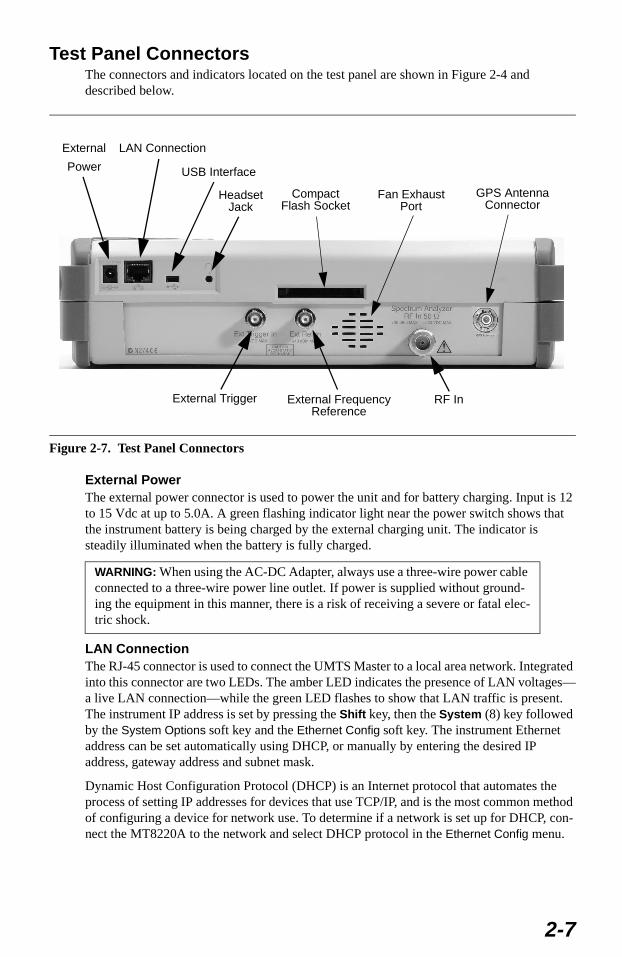
Test Panel ConnectorsThe connectors and indicators located on the test panel are shown in Figure 2-4 and described below.
External PowerThe external power connector is used to power the unit and for battery charging. Input is 12 to 15 Vdc at up to 5.0A. A green flashing indicator light near the power switch shows that the instrument battery is being charged by the external charging unit. The indicator is steadily illuminated when the battery is fully charged.
LAN ConnectionThe RJ-45 connector is used to connect the UMTS Master to a local area network. Integrated into this connector are two LEDs. The amber LED indicates the presence of LAN voltages—a live LAN connection—while the green LED flashes to show that LAN traffic is present. The instrument IP address is set by pressing the Shift key, then the System (8) key followed by the System Options soft key and the Ethernet Config soft key. The instrument Ethernet address can be set automatically using DHCP, or manually by entering the desired IP address, gateway address and subnet mask.
Dynamic Host Configuration Protocol (DHCP) is an Internet protocol that automates the process of setting IP addresses for devices that use TCP/IP, and is the most common method of configuring a device for network use. To determine if a network is set up for DHCP, con-nect the MT8220A to the network and select DHCP protocol in the Ethernet Config menu.
Figure 2-7. Test Panel Connectors
WARNING: When using the AC-DC Adapter, always use a three-wire power cable connected to a three-wire power line outlet. If power is supplied without ground-ing the equipment in this manner, there is a risk of receiving a severe or fatal elec-tric shock.
External
Power
LAN Connection
USB Interface
Headset Jack
External Trigger External Frequency Reference
RF In
GPS Antenna Connector
Compact Flash Socket
Fan Exhaust Port
2-7
Turn the UMTS Master off, and then on. If the network is set up for DHCP, the assigned IP address should be displayed briefly after the power up sequence.
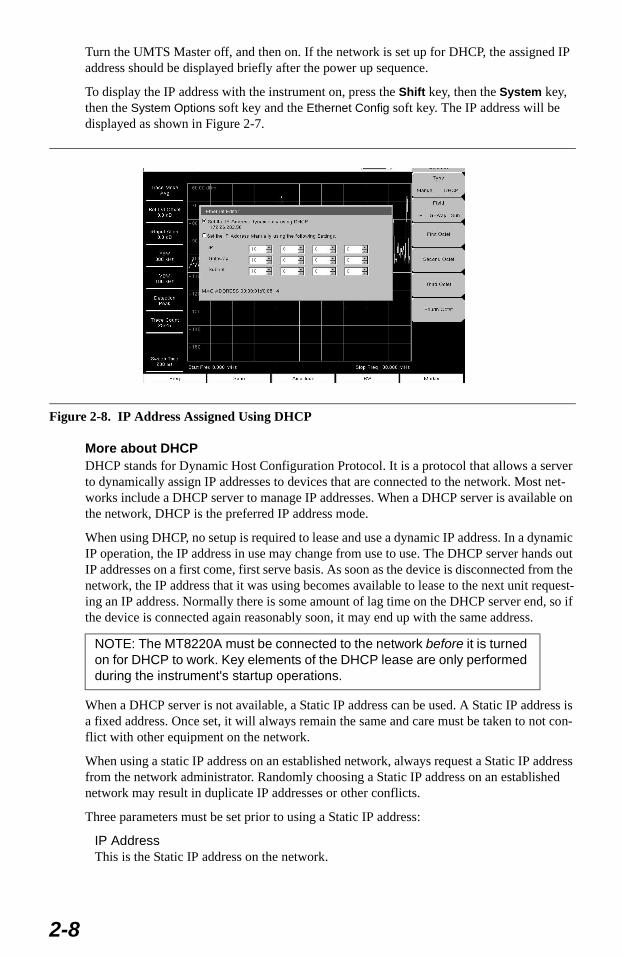
To display the IP address with the instrument on, press the Shift key, then the System key, then the System Options soft key and the Ethernet Config soft key. The IP address will be displayed as shown in Figure 2-7.
More about DHCPDHCP stands for Dynamic Host Configuration Protocol. It is a protocol that allows a server to dynamically assign IP addresses to devices that are connected to the network. Most net-works include a DHCP server to manage IP addresses. When a DHCP server is available on the network, DHCP is the preferred IP address mode.
When using DHCP, no setup is required to lease and use a dynamic IP address. In a dynamic IP operation, the IP address in use may change from use to use. The DHCP server hands out IP addresses on a first come, first serve basis. As soon as the device is disconnected from the network, the IP address that it was using becomes available to lease to the next unit request-ing an IP address. Normally there is some amount of lag time on the DHCP server end, so if the device is connected again reasonably soon, it may end up with the same address.
When a DHCP server is not available, a Static IP address can be used. A Static IP address is a fixed address. Once set, it will always remain the same and care must be taken to not con-flict with other equipment on the network.
When using a static IP address on an established network, always request a Static IP address from the network administrator. Randomly choosing a Static IP address on an established network may result in duplicate IP addresses or other conflicts.
Three parameters must be set prior to using a Static IP address:
IP AddressThis is the Static IP address on the network.
Figure 2-8. IP Address Assigned Using DHCP
NOTE: The MT8220A must be connected to the network before it is turned on for DHCP to work. Key elements of the DHCP lease are only performed during the instrument's startup operations.
2-8
Default GatewayOften when a static IP address is assigned, a default gateway is also identified. If the default gateway is unknown, type in the Static IP address so that the Static IP address and Default Gateway are the same number.
Subnet MaskThis parameter is usually extracted from the Static IP address based on the class of the address and determines the destination of any broadcast messages that might be sent from the instrument. It can be customized if necessary. The subnet mask may also be provided with the Static IP address.
Example 1
In this example, a Static IP address has been chosen because there is no network available. The instrument is connected to the network port on the PC with a crossover Ethernet cable (not included). This is also referred to as Direct Connect:
IP Address: 10.0.0.2Default Gateway: 10.0.0.2Subnet Mask: 255.255.0.0
Example 2
In this example, the Static IP address has been assigned with an associated gateway and sub-net mask:
IP Address: 153.56.100.42Default Gateway: 153.56.100.1Subnet Mask: 255.255.252.0
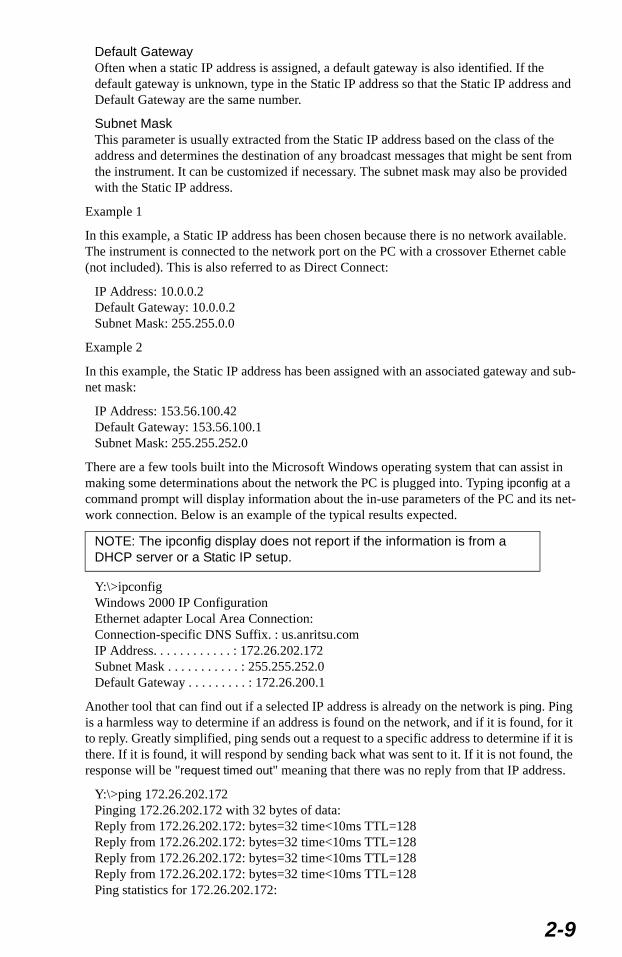
There are a few tools built into the Microsoft Windows operating system that can assist in making some determinations about the network the PC is plugged into. Typing ipconfig at a command prompt will display information about the in-use parameters of the PC and its net-work connection. Below is an example of the typical results expected.
Y:\>ipconfigWindows 2000 IP ConfigurationEthernet adapter Local Area Connection:Connection-specific DNS Suffix. : us.anritsu.comIP Address. . . . . . . . . . . . : 172.26.202.172Subnet Mask . . . . . . . . . . . : 255.255.252.0Default Gateway . . . . . . . . . : 172.26.200.1
Another tool that can find out if a selected IP address is already on the network is ping. Ping is a harmless way to determine if an address is found on the network, and if it is found, for it to reply. Greatly simplified, ping sends out a request to a specific address to determine if it is there. If it is found, it will respond by sending back what was sent to it. If it is not found, the response will be "request timed out" meaning that there was no reply from that IP address.
Y:\>ping 172.26.202.172Pinging 172.26.202.172 with 32 bytes of data:Reply from 172.26.202.172: bytes=32 time<10ms TTL=128Reply from 172.26.202.172: bytes=32 time<10ms TTL=128Reply from 172.26.202.172: bytes=32 time<10ms TTL=128Reply from 172.26.202.172: bytes=32 time<10ms TTL=128Ping statistics for 172.26.202.172:
NOTE: The ipconfig display does not report if the information is from a DHCP server or a Static IP setup.
2-9
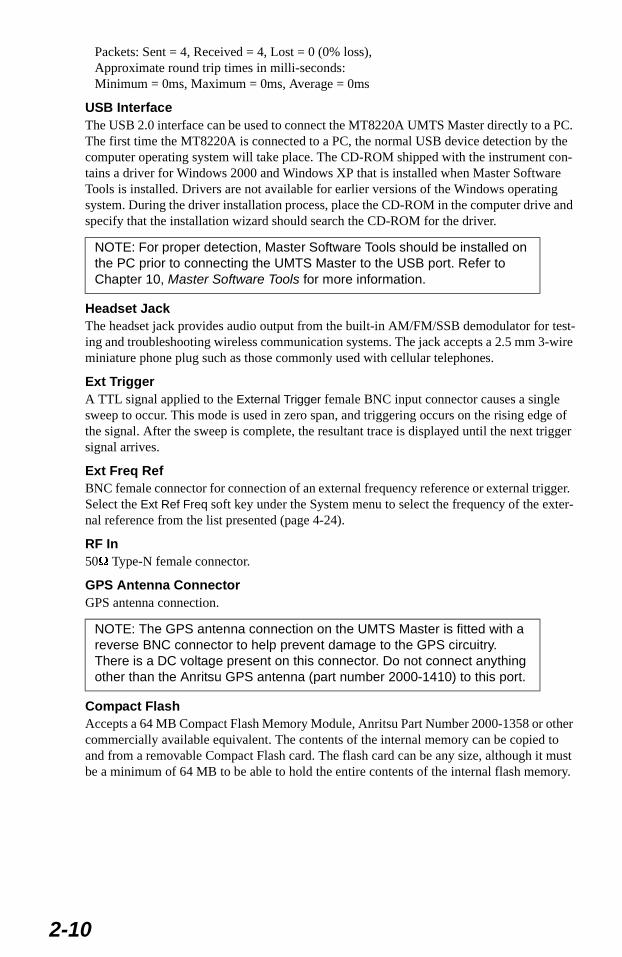
Packets: Sent = 4, Received = 4, Lost = 0 (0% loss),Approximate round trip times in milli-seconds:Minimum = 0ms, Maximum = 0ms, Average = 0ms
USB InterfaceThe USB 2.0 interface can be used to connect the MT8220A UMTS Master directly to a PC. The first time the MT8220A is connected to a PC, the normal USB device detection by the computer operating system will take place. The CD-ROM shipped with the instrument con-tains a driver for Windows 2000 and Windows XP that is installed when Master Software Tools is installed. Drivers are not available for earlier versions of the Windows operating system. During the driver installation process, place the CD-ROM in the computer drive and specify that the installation wizard should search the CD-ROM for the driver.
Headset JackThe headset jack provides audio output from the built-in AM/FM/SSB demodulator for test-ing and troubleshooting wireless communication systems. The jack accepts a 2.5 mm 3-wire miniature phone plug such as those commonly used with cellular telephones.
Ext TriggerA TTL signal applied to the External Trigger female BNC input connector causes a single sweep to occur. This mode is used in zero span, and triggering occurs on the rising edge of the signal. After the sweep is complete, the resultant trace is displayed until the next trigger signal arrives.
Ext Freq Ref BNC female connector for connection of an external frequency reference or external trigger. Select the Ext Ref Freq soft key under the System menu to select the frequency of the exter-nal reference from the list presented (page 4-24).
RF In 50Ω Type-N female connector.
GPS Antenna ConnectorGPS antenna connection.
Compact FlashAccepts a 64 MB Compact Flash Memory Module, Anritsu Part Number 2000-1358 or other commercially available equivalent. The contents of the internal memory can be copied to and from a removable Compact Flash card. The flash card can be any size, although it must be a minimum of 64 MB to be able to hold the entire contents of the internal flash memory.
NOTE: For proper detection, Master Software Tools should be installed on the PC prior to connecting the UMTS Master to the USB port. Refer to Chapter 10, Master Software Tools for more information.
NOTE: The GPS antenna connection on the UMTS Master is fitted with a reverse BNC connector to help prevent damage to the GPS circuitry. There is a DC voltage present on this connector. Do not connect anything other than the Anritsu GPS antenna (part number 2000-1410) to this port.
2-10
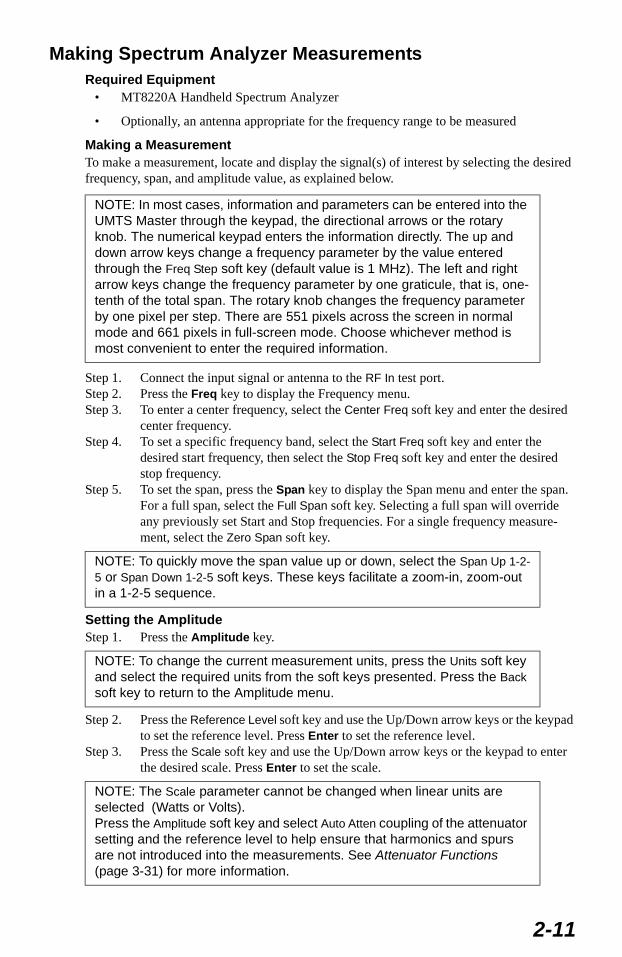
Making Spectrum Analyzer MeasurementsRequired Equipment
• MT8220A Handheld Spectrum Analyzer
• Optionally, an antenna appropriate for the frequency range to be measured
Making a MeasurementTo make a measurement, locate and display the signal(s) of interest by selecting the desired frequency, span, and amplitude value, as explained below.
Step 1. Connect the input signal or antenna to the RF In test port.Step 2. Press the Freq key to display the Frequency menu.Step 3. To enter a center frequency, select the Center Freq soft key and enter the desired
center frequency. Step 4. To set a specific frequency band, select the Start Freq soft key and enter the
desired start frequency, then select the Stop Freq soft key and enter the desired stop frequency.
Step 5. To set the span, press the Span key to display the Span menu and enter the span. For a full span, select the Full Span soft key. Selecting a full span will override any previously set Start and Stop frequencies. For a single frequency measure-ment, select the Zero Span soft key.
Setting the AmplitudeStep 1. Press the Amplitude key.
Step 2. Press the Reference Level soft key and use the Up/Down arrow keys or the keypad to set the reference level. Press Enter to set the reference level.
Step 3. Press the Scale soft key and use the Up/Down arrow keys or the keypad to enter the desired scale. Press Enter to set the scale.
NOTE: In most cases, information and parameters can be entered into the UMTS Master through the keypad, the directional arrows or the rotary knob. The numerical keypad enters the information directly. The up and down arrow keys change a frequency parameter by the value entered through the Freq Step soft key (default value is 1 MHz). The left and right arrow keys change the frequency parameter by one graticule, that is, one-tenth of the total span. The rotary knob changes the frequency parameter by one pixel per step. There are 551 pixels across the screen in normal mode and 661 pixels in full-screen mode. Choose whichever method is most convenient to enter the required information.
NOTE: To quickly move the span value up or down, select the Span Up 1-2-5 or Span Down 1-2-5 soft keys. These keys facilitate a zoom-in, zoom-out in a 1-2-5 sequence.
NOTE: To change the current measurement units, press the Units soft key and select the required units from the soft keys presented. Press the Back soft key to return to the Amplitude menu.
NOTE: The Scale parameter cannot be changed when linear units are selected (Watts or Volts).Press the Amplitude soft key and select Auto Atten coupling of the attenuator setting and the reference level to help ensure that harmonics and spurs are not introduced into the measurements. See Attenuator Functions (page 3-31) for more information.
2-11
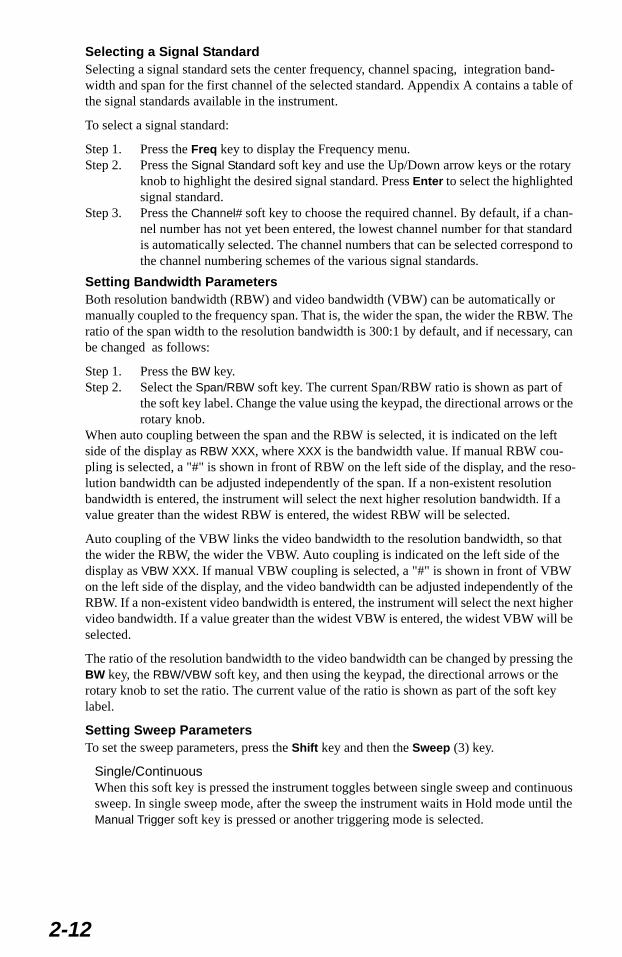
Selecting a Signal StandardSelecting a signal standard sets the center frequency, channel spacing, integration band-width and span for the first channel of the selected standard. Appendix A contains a table of the signal standards available in the instrument.
To select a signal standard:
Step 1. Press the Freq key to display the Frequency menu.Step 2. Press the Signal Standard soft key and use the Up/Down arrow keys or the rotary
knob to highlight the desired signal standard. Press Enter to select the highlighted signal standard.
Step 3. Press the Channel# soft key to choose the required channel. By default, if a chan-nel number has not yet been entered, the lowest channel number for that standard is automatically selected. The channel numbers that can be selected correspond to the channel numbering schemes of the various signal standards.
Setting Bandwidth ParametersBoth resolution bandwidth (RBW) and video bandwidth (VBW) can be automatically or manually coupled to the frequency span. That is, the wider the span, the wider the RBW. The ratio of the span width to the resolution bandwidth is 300:1 by default, and if necessary, can be changed as follows:
Step 1. Press the BW key.Step 2. Select the Span/RBW soft key. The current Span/RBW ratio is shown as part of
the soft key label. Change the value using the keypad, the directional arrows or the rotary knob.
When auto coupling between the span and the RBW is selected, it is indicated on the left side of the display as RBW XXX, where XXX is the bandwidth value. If manual RBW cou-pling is selected, a "#" is shown in front of RBW on the left side of the display, and the reso-lution bandwidth can be adjusted independently of the span. If a non-existent resolution bandwidth is entered, the instrument will select the next higher resolution bandwidth. If a value greater than the widest RBW is entered, the widest RBW will be selected.
Auto coupling of the VBW links the video bandwidth to the resolution bandwidth, so that the wider the RBW, the wider the VBW. Auto coupling is indicated on the left side of the display as VBW XXX. If manual VBW coupling is selected, a "#" is shown in front of VBW on the left side of the display, and the video bandwidth can be adjusted independently of the RBW. If a non-existent video bandwidth is entered, the instrument will select the next higher video bandwidth. If a value greater than the widest VBW is entered, the widest VBW will be selected.
The ratio of the resolution bandwidth to the video bandwidth can be changed by pressing the BW key, the RBW/VBW soft key, and then using the keypad, the directional arrows or the rotary knob to set the ratio. The current value of the ratio is shown as part of the soft key label.
Setting Sweep ParametersTo set the sweep parameters, press the Shift key and then the Sweep (3) key.
Single/ContinuousWhen this soft key is pressed the instrument toggles between single sweep and continuous sweep. In single sweep mode, after the sweep the instrument waits in Hold mode until the Manual Trigger soft key is pressed or another triggering mode is selected.
2-12
Trigger TypeTo select a specific type of triggering, press the Trigger Type soft key. Selections are:
Free RunThe default trigger type is "Free Run" in which the instrument begins another sweep as soon as one is finished.
ExternalA TTL signal applied to the External Trigger BNC input connector causes a single sweep to occur. This mode is used in zero span, and triggering occurs on the rising edge of the signal. After the sweep is complete, the resultant trace is displayed until the next trigger signal arrives.
VideoThis mode is used in zero span to set the power level at which a sweep is initiated. The power level can be set from -120 dBm to +20 dBm. Trigger is based on the measured signal level. If no signal reaches or exceeds the trigger level, there will be no trace on the screen.
Change Trigger Position This soft key is used in conjunction with video triggering to set the horizontal position on the display where a signal that meets the video triggering criterion will be placed. The value can be from 0% to 100%. Zero percent places the triggering event at the left edge of the screen while 100% places the triggering at the right edge of the screen. When the trigger position is any value other than 0%, the portion of the trace before the trigger event is displayed very quickly since the trace data is stored in memory. The portion of the trace after the trigger point is painted on the screen at the normal rate as the signal is swept.
Manual TriggerThis soft key can be used in zero span to immediately trigger a sweep when the trigger type is set to External or Video.
2-13

2-14
Chapter 3Spectrum AnalyzerMeasurements
IntroductionSpectrum analyzer measurements include the use of additional spectrum analyzer functions beyond frequency, span, amplitude and marker functions. This chapter presents the softkey menus available in Spectrum Analyzer mode, as well as information on resolution band-width, video bandwidth, sweep, and attenuator functions. The Field Measurements section presents brief examples demonstrating field strength, occupied bandwidth, channel power, adjacent channel power ratio, and carrier to interference ratio (C/I) tests. The following menus are available in Spectrum Analyzer mode:
Amplitude
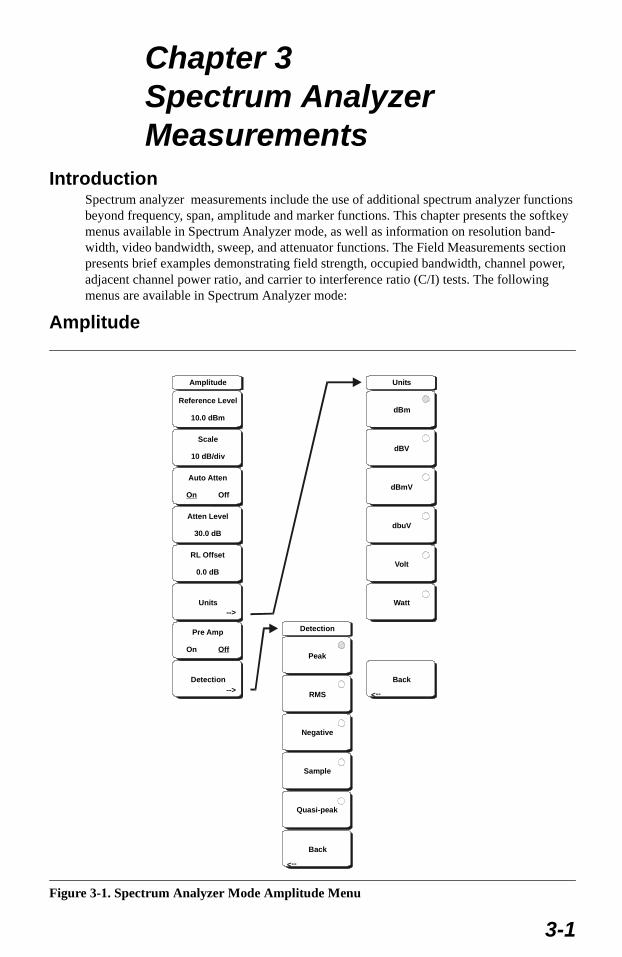
Figure 3-1. Spectrum Analyzer Mode Amplitude Menu
Amplitude
Reference Level
10.0 dBm
Scale
10 dB/div
Auto Atten
OffOn
Atten Level
30.0 dB
RL Offset
0.0 dB
Units-->
Units
Watt
Back
dBm
dBV
dBmV
dbuV
Volt
-->
Detection
Detection
Back
Peak
RMS
Negative
Sample
Quasi-peak
-->
Pre Amp
On Off
-->
3-1
Reference LevelThe reference level is the top graticule line on the display, and can be set from +30 dBm to -150 dBm. A value may be entered from the key pad, using the ± key as the minus sign. After entering the value press the dBm soft key or the Enter key. The Up/Down arrow keys change the reference level in 10 dB steps, and the Left/Right arrow keys change the value by 1 dB. The rotary knob changes the value by 0.1 dB per detent.
The reference level value may be modified by the reference level offset value to compen-sate for an external attenuator, as discussed later in this chapter.
Scale The scale can be set in 1 dB steps from 1 dB per division to 15 dB per division. The value can be changed using the keypad, the rotary knob or the Up/Down arrow keys.
Auto Atten On/OffInput attenuation can be either tied to the reference level (On) or manually selected (Off). When input attenuation is tied to the reference level, attenuation is increased as higher ref-erence levels are selected to make sure the instrument input circuits are not saturated by large signals that are likely to be present when high reference levels are required.
Atten LvlInput attenuation can be set from 0 to 65 dB, in 5 dB steps. Select this soft key and use the keypad, the rotary knob or the Up/Down arrow keys to change the attenuation value. When the Preamplifier is turned on, the allowed attenuation settings are 0 and 10 dB.
RL OffsetReference Level Offset compensates for the presence of input attenuation or gain external to the instrument. Enter a positive value to compensate for an external amplifier or a nega-tive value to compensate for an external attenuator. Use the ± key to enter the negative sign when a negative attenuation value is being entered.
UnitsSelect the display units from this soft key menu:
dBmdBVdBmVdBµVVoltWatt
Press the Back soft key to return to the Amplitude menu.
Pre Amp On/OffThis soft key turns the low-noise front-end preamplifier on or off. The preamplifier lowers the noise floor by approximately 25 dB. To assure accurate measurement results, the larg-est signal into the instrument input when the preamplifier is turned on should be <-50 dBm.
DetectionSeveral detection methods tailor the performance of the instrument to meet specific mea-surement requirements. In general, there are more measurement points across the screen than display points. The various detection methods select which measurement point will be shown at each display point.
PeakThis method causes the largest measurement point to be shown for each display point, and assures that a narrow peak is not missed.
3-2
RMSThis method performs a root-mean-square calculation of all the measurement points in each display point, and is particularly useful in displaying the average value of noise.
NegativeThis method causes the smallest measurement point to be shown for each display point. Typically this mode is used to help detect small discrete signals in the presence of nearly equal values of noise. The display points that contain only noise will tend to show lower amplitudes than those that contain discrete signals.
SampleThis is the fastest detection method since for each display point only one frequency point is measured. Use this method when speed is of paramount importance and the possibility of missing a narrow peak is not important.
Quasi-peakWhen this selection is made resolution bandwidths and video bandwidths of 220 Hz, 9 kHz and 120 kHz are available. This detection method is designed to meet CISPR requirements.
BackReturns to the previous menu.
3-3
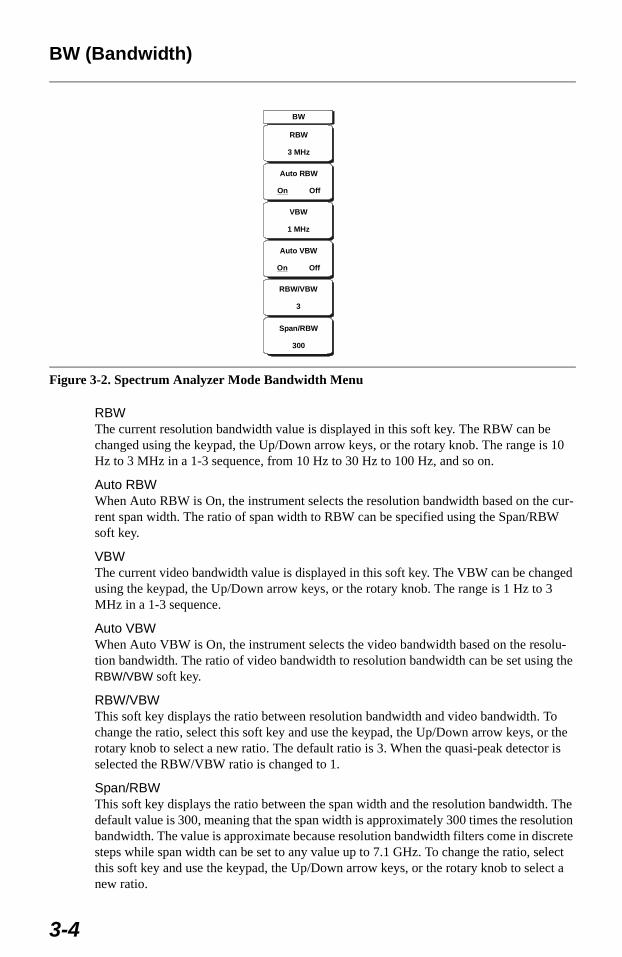
BW (Bandwidth)
RBWThe current resolution bandwidth value is displayed in this soft key. The RBW can be changed using the keypad, the Up/Down arrow keys, or the rotary knob. The range is 10 Hz to 3 MHz in a 1-3 sequence, from 10 Hz to 30 Hz to 100 Hz, and so on.
Auto RBWWhen Auto RBW is On, the instrument selects the resolution bandwidth based on the cur-rent span width. The ratio of span width to RBW can be specified using the Span/RBW soft key.
VBWThe current video bandwidth value is displayed in this soft key. The VBW can be changed using the keypad, the Up/Down arrow keys, or the rotary knob. The range is 1 Hz to 3 MHz in a 1-3 sequence.
Auto VBWWhen Auto VBW is On, the instrument selects the video bandwidth based on the resolu-tion bandwidth. The ratio of video bandwidth to resolution bandwidth can be set using the RBW/VBW soft key.
RBW/VBWThis soft key displays the ratio between resolution bandwidth and video bandwidth. To change the ratio, select this soft key and use the keypad, the Up/Down arrow keys, or the rotary knob to select a new ratio. The default ratio is 3. When the quasi-peak detector is selected the RBW/VBW ratio is changed to 1.
Span/RBWThis soft key displays the ratio between the span width and the resolution bandwidth. The default value is 300, meaning that the span width is approximately 300 times the resolution bandwidth. The value is approximate because resolution bandwidth filters come in discrete steps while span width can be set to any value up to 7.1 GHz. To change the ratio, select this soft key and use the keypad, the Up/Down arrow keys, or the rotary knob to select a new ratio.
Figure 3-2. Spectrum Analyzer Mode Bandwidth Menu
BW
RBW
3 MHz
Auto RBW
OffOn
Auto VBW
OffOn
VBW
1 MHz
Span/RBW
300
RBW/VBW
3
3-4
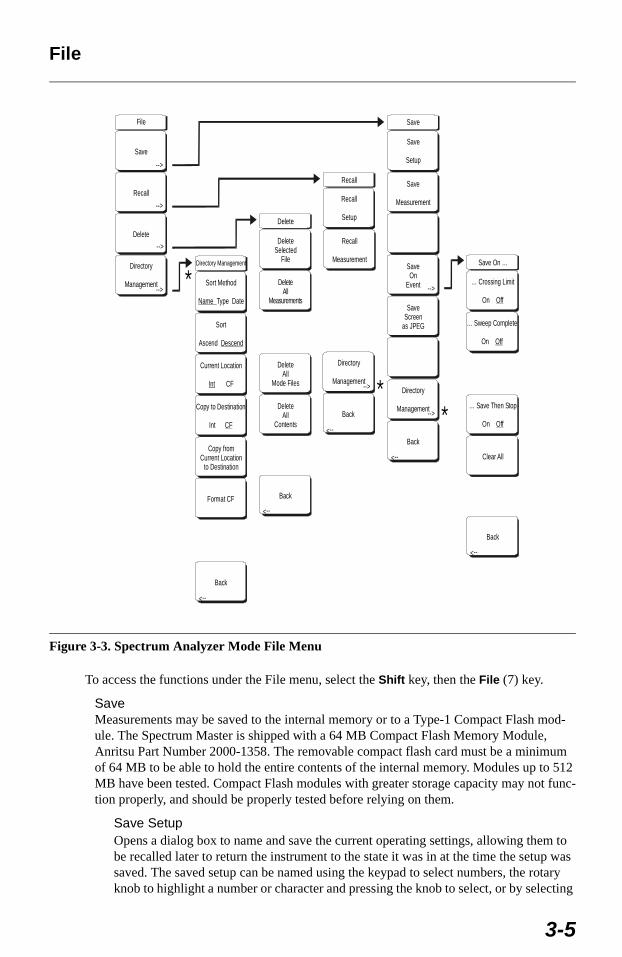
File
To access the functions under the File menu, select the Shift key, then the File (7) key.
SaveMeasurements may be saved to the internal memory or to a Type-1 Compact Flash mod-ule. The Spectrum Master is shipped with a 64 MB Compact Flash Memory Module, Anritsu Part Number 2000-1358. The removable compact flash card must be a minimum of 64 MB to be able to hold the entire contents of the internal memory. Modules up to 512 MB have been tested. Compact Flash modules with greater storage capacity may not func-tion properly, and should be properly tested before relying on them.
Save SetupOpens a dialog box to name and save the current operating settings, allowing them to be recalled later to return the instrument to the state it was in at the time the setup was saved. The saved setup can be named using the keypad to select numbers, the rotary knob to highlight a number or character and pressing the knob to select, or by selecting
Figure 3-3. Spectrum Analyzer Mode File Menu
File
Save
Recall
Recall
-->
-->
Back
Back
Back
-->
-->
-->
Back
-->
Save
Save
Setup
Sort Method
Type DateName
Save
Measurement
Sort
Ascend Descend
Current Location
CFInt
Format CF
Copy to Destination
Int CF
Copy fromCurrent Location
to Destination
SaveOn
Event
Directory
Management
Directory
Management
Directory
Management
SaveScreen
as JPEG
DeleteSelected
File
DeleteAll
Measurements
DeleteAll
Mode Files
DeleteAll
Contents
-->
-->
-->
-->
-->
Delete
Delete
Back
-->
… Crossing Limit
On Off
… Sweep Complete
On Off
… Save Then Stop
On Off
Clear All
Save On …
Recall
Setup
Recall
MeasurementDirectory Management
*
*
*
3-5
the soft key for each letter. Use the Shift key to select an upper case letter. Use the Left/ Right directional arrows to move the cursor position. Press Enter to save the setup.
Save MeasurementInitiates a dialog box to name and save the current active trace A. The saved measure-ment trace can be named using the keypad to select numbers, the rotary knob to high-light a number or character and pressing the knob to select, or by selecting the soft key for each letter. Use the Shift key to select an upper case letter. Use the Left/Right direc-tional arrows to move the cursor position. Press Enter to save the measurement trace. Measurements are saved in a directory called /usr on the Compact Flash memory mod-ule.
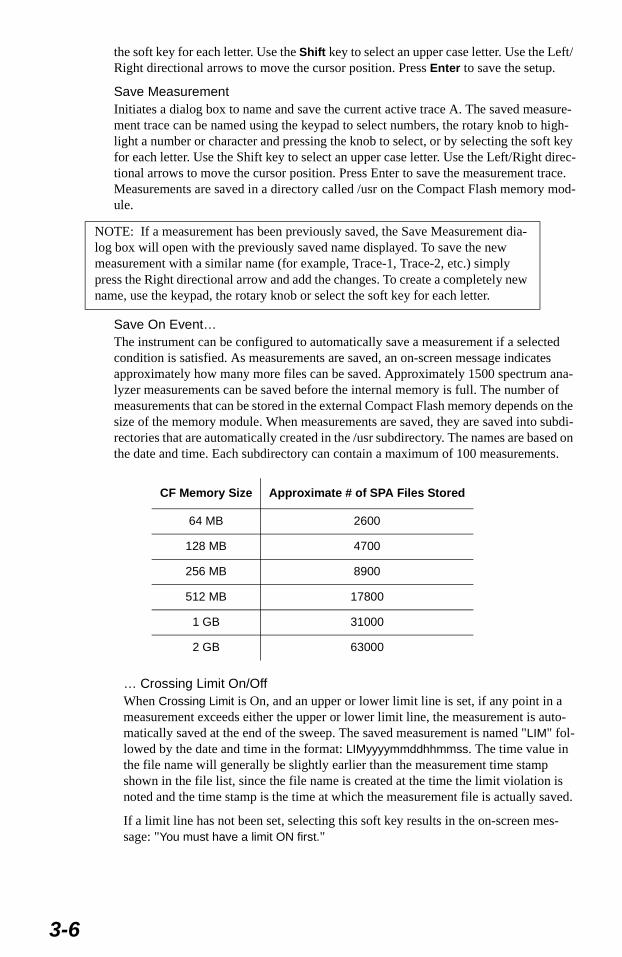
Save On Event…The instrument can be configured to automatically save a measurement if a selected condition is satisfied. As measurements are saved, an on-screen message indicates approximately how many more files can be saved. Approximately 1500 spectrum ana-lyzer measurements can be saved before the internal memory is full. The number of measurements that can be stored in the external Compact Flash memory depends on the size of the memory module. When measurements are saved, they are saved into subdi-rectories that are automatically created in the /usr subdirectory. The names are based on the date and time. Each subdirectory can contain a maximum of 100 measurements.
… Crossing Limit On/OffWhen Crossing Limit is On, and an upper or lower limit line is set, if any point in a measurement exceeds either the upper or lower limit line, the measurement is auto-matically saved at the end of the sweep. The saved measurement is named "LIM" fol-lowed by the date and time in the format: LIMyyyymmddhhmmss. The time value in the file name will generally be slightly earlier than the measurement time stamp shown in the file list, since the file name is created at the time the limit violation is noted and the time stamp is the time at which the measurement file is actually saved.
If a limit line has not been set, selecting this soft key results in the on-screen mes-sage: "You must have a limit ON first."
NOTE: If a measurement has been previously saved, the Save Measurement dia-log box will open with the previously saved name displayed. To save the new measurement with a similar name (for example, Trace-1, Trace-2, etc.) simply press the Right directional arrow and add the changes. To create a completely new name, use the keypad, the rotary knob or select the soft key for each letter.
CF Memory Size Approximate # of SPA Files Stored
64 MB 2600
128 MB 4700
256 MB 8900
512 MB 17800
1 GB 31000
2 GB 63000
3-6
… Sweep Complete On/OffWhen Sweep Complete is On, the measurement is automatically saved at the end of a sweep. This is particularly useful for very slow sweeps. The saved measurement is named "EOS" with a file name in the format: EOSyyyymmddhhmmss.
Save Then Stop On/OffWhen the Save Then Stop soft key is set to On, the instrument will save just one measurement when the Crossing Limit or Sweep Complete soft keys are set to On, and the qualifying event occurs. Sweeping stops after a measurement is saved. If it is set to Off, sweeping continues after a measurement is saved and more measurements may be saved. The default for this selection is Off.
Clear AllPressing this soft key turns off both save on event conditions and sets Save then Stop to Off, the default state.
BackReturns to the top-level file menu.
Save Screen as JPEGThis function saves a measurement trace as a graphics file. The saved measurement can be named using the keypad to select numbers, the rotary knob to highlight a number or character and pressing the knob to select, or by selecting the soft key for each letter. Use the Shift key to select an upper case letter. Use the Left/Right directional arrows to move the cursor position. Press Enter to save the measurement after entering the file name. The file is saved in the internal memory with the specified name, with .jpg appended.
Directory ManagementSort Method Name Type DateFile lists can be sorted by the name of the file, the type of file (SPA file, STP file, etc.) or by the date that the file was saved.
Sort Ascending DescendingSelects whether the selected sort is sorted from lowest to highest (ascending) or highest to lowest (descending). When sorting by name, the sort will place file names that start with numbers before file names that start with letters (an ASCII sort).
Current Location Int CFThis choice lets you select where measurements and setups will be saved. Pressing the soft key toggles between storing files on the internal memory or a Compact Flash memory module. The "current location" and the "copy to destination" will never be the same. Changing the current location to save files causes the "copy to destination" to be automatically changed if the selected storage location is the same as the selected cur-rent location.
NOTE: If a measurement has been previously saved, the Save Measurement dia-log box will open with the previously saved name displayed. To save the new measurement with a similar name (for example, Trace-1, Trace-2, etc.) simply press the Right directional arrow and add the changes. To create a completely new name, use the keypad, the rotary knob or select the soft key for each letter.
3-7
Copy to Destination Int CFThis choice lets you select where measurements and setups in the "current location" will be copied. The "current location" and the "copy to destination" may not be the same. If you change the destination to which the instrument will copy files, the current location is automatically changed if the current location is the same as the selected copy to destination..
Copy From Current Location To DestinationPressing this soft key causes all measurements, setups and jpg files stored in the user selected "current location" to be copied to the "copy to destination". If no storage mod-ule installed in the instrument an error message is displayed.
Format CFThis selection erases all files on an installed Compact Flash module. A message is dis-played warning that all files will be erased. Press Enter to confirm that you want to erase and Esc to quit without erasing. In addition to erasing all files stored on the Com-pact Flash, the /usr directory is created for storage of measurements, setups and jpg files.
BackThe Back key returns to the previous menu.
RecallRecall SetupThis soft key brings up a selection box that allows selection and recall of a previously stored instrument setup in the current storage location. Use the rotary knob or the Up/Down arrow keys to highlight the saved setup, and press Enter, the rotary knob, or the Recall soft key to select. All current instrument settings are replaced by the stored setup information. Press the Esc key to cancel the recall.
Recall MeasurementBrings up a selection box that allows recall of a previously stored measurement trace from the currently selected storage location. Use the rotary knob or the Up/Down arrow keys to highlight the saved measurement trace, and press Enter, the rotary knob, or the Recall soft key to select. A recalled trace may be displayed as trace A, in place of the live trace, or as trace B or C along with the live trace. Use the rotary knob or the Up/Down arrow keys to highlight the recalled trace option, and press the Enter key to select. Press the Esc key to cancel the recall.
To remove a recalled measurement trace from the screen, select the Shift key and the Trace (5) key to open the Trace menu. Use the Trace soft key to select the trace to be removed from the screen and use the View/Blank soft key to view or blank the trace. Use the Trace key to select an active trace after blanking a recalled trace.
Directory ManagementSee page 3-7.
BackReturns to the previous menu.
3-8
DeleteBrings up a selection box that shows all stored setups and traces in the currently selected location (see Directory Management, page 3-7). The list shows the setup and measurement names, the type (stp for a saved setup, spa for a saved trace, jpg for a JPEG file) and the date and time the information was saved. Use the rotary knob or the Up/Down arrow keys to highlight the file to be deleted, and press Enter, or the Delete soft key to delete. Press the Esc key to cancel the operation. Note that there is no mechanism to retrieve deleted files.
Delete Selected FileUse the up and down arrow buttons or the rotary knob to select the file that is to be deleted. Press Enter to confirm that you want to delete the file or Esc to exit without deleting.
Delete ALL MeasurementsDeletes all measurements of the current mode in the currently selected storage location. The memory from which measurements will be deleted is set in the Directory Manage-ment menu and is the Current Location.
Delete ALL Mode FilesDeletes all measurements of the type saved in the current operating mode of the instru-ment. In addition all jpg and setup files (regardless of the mode) are deleted.
Delete ALL ContentsDeletes all measurements, jpg files and setup files of ALL measurement types.
BackThe Back key returns to the previous menu.
PrintThe Print key can be used to save a measurement trace as a graphics file. This file can then be downloaded to a PC using Master Software Tools and printed.
Save Screen as JPEGThis function saves a measurement trace as a graphics file. The saved measurement can be named using the keypad to select numbers, the rotary knob to highlight a number or character and pressing the knob to select, or by selecting the soft key for each letter. Use the Shift key to select an upper case letter. Use the Left/Right directional arrows to move the cursor position. Press Enter to save the measurement after entering the file name. The file is saved in the internal memory with the specified name, with .jpg appended.
Save on Event Save on Event allows the automatic saving of measurements based on either exceeding the upper or lower limit line, completing a sweep, or both. Files are named LIM followed by the date and time (LIMyyyymmddhhmmss) or,. EOS followed by the date and time (EOSyyyymmddhhmmss), depending on which choice caused the measurement to be saved.
… Crossing Limit On/OffSelecting On causes a measurement to be automatically saved if it exceeds either the upper or lower limit line.
If no limit line is turned on, pressing this soft key causes the instrument to beep and delivers an on-screen message that says “You must have a limit on first.” The message goes away after approximately 3 seconds.
3-9
The file name is created at the time the sweep completes and will be time-stamped by the instrument as the file is saved internally, within about 3 seconds after the time in the file name.
… Sweep Complete On/OffSelecting On causes a measurement to be automatically saved when the sweep is fin-ished. This is very useful for slow sweeps since it frees the operator from having to wait at the instrument for the proper time to save a measurement.
The file name is created at the time that sweep completes and will be internally time-stamped about 2 seconds later.
Save Then Stop On/OffThis soft key selects the choice of saving once, or continually saving measurements that meet the criteria for saving. If the instrument is sweeping quickly, and automatic saving on sweep complete is turned on, a large number of files can be saved. The instrument is able to save more than 1000 measurements. However, the time delay when preparing to recall a saved measurement can be significant - almost a minute to bring up the list when there are 600 saved measurements.
Clear AllPressing this soft key turns off Crossing Limit, Sweep Complete and Save Then Stop.
BackReturns to the previous menu.
3-10
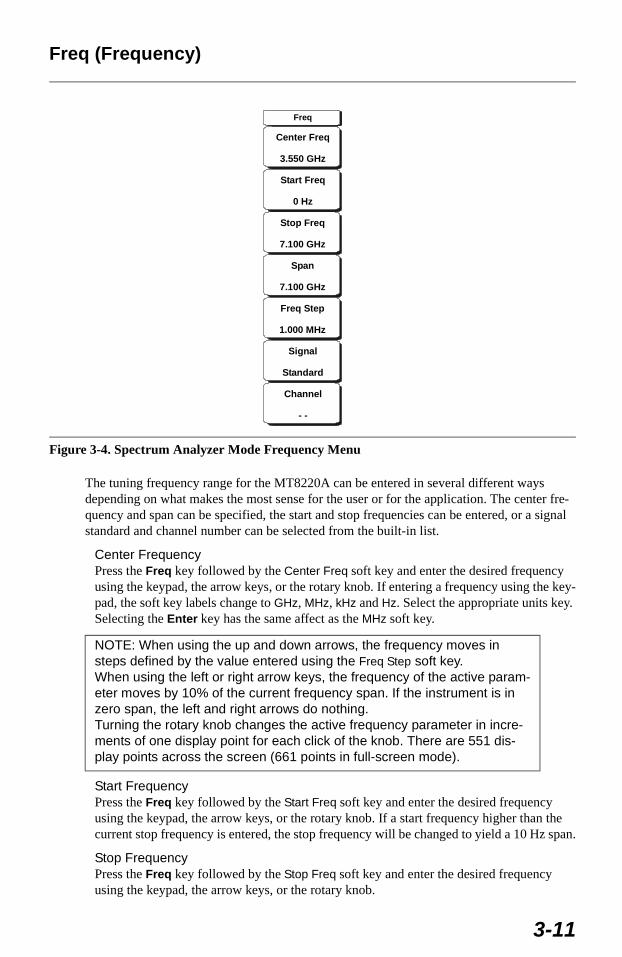
Freq (Frequency)
The tuning frequency range for the MT8220A can be entered in several different ways depending on what makes the most sense for the user or for the application. The center fre-quency and span can be specified, the start and stop frequencies can be entered, or a signal standard and channel number can be selected from the built-in list.
Center FrequencyPress the Freq key followed by the Center Freq soft key and enter the desired frequency using the keypad, the arrow keys, or the rotary knob. If entering a frequency using the key-pad, the soft key labels change to GHz, MHz, kHz and Hz. Select the appropriate units key. Selecting the Enter key has the same affect as the MHz soft key.
Start FrequencyPress the Freq key followed by the Start Freq soft key and enter the desired frequency using the keypad, the arrow keys, or the rotary knob. If a start frequency higher than the current stop frequency is entered, the stop frequency will be changed to yield a 10 Hz span.
Stop FrequencyPress the Freq key followed by the Stop Freq soft key and enter the desired frequency using the keypad, the arrow keys, or the rotary knob.
Figure 3-4. Spectrum Analyzer Mode Frequency Menu
NOTE: When using the up and down arrows, the frequency moves in steps defined by the value entered using the Freq Step soft key.When using the left or right arrow keys, the frequency of the active param-eter moves by 10% of the current frequency span. If the instrument is in zero span, the left and right arrows do nothing.Turning the rotary knob changes the active frequency parameter in incre-ments of one display point for each click of the knob. There are 551 dis-play points across the screen (661 points in full-screen mode).
Freq
Center Freq
3.550 GHz
Start Freq
0 Hz
Stop Freq
7.100 GHz
Span
7.100 GHz
Freq Step
1.000 MHz
Signal
Standard
Channel
- -
3-11
If a stop frequency lower than the current start frequency is entered, the start frequency will be changed to yield a 10 Hz span.
SpanPress the Freq key followed by the Span soft key and enter the desired span. The Span menu is used to set the frequency range over which the instrument will sweep. For the MT8220A, the span can be set from 10 Hz to 7.1 GHz. Span can also be set to zero span.
The soft key shows the current value for span in units of GHz, MHz, kHz or Hz. When the Span button is pressed, span becomes the active parameter and may be changed. Use the keypad, the directional arrow keys or the rotary knob to increase or decrease the span fre-quency. If the span is changed using the Up/Down arrow keys, the span changes by the value of the Frequency Step for each key press.
Freq StepPress the Freq key followed by the Freq Step soft key to enter the desired frequency step size. The frequency step specifies the amount by which a frequency will change when the Up/Down arrow keys pressed. The center frequency, start frequency, and stop frequency values can be changed using Freq Step. The active parameter will be changed by the fre-quency step when the Up/Down arrow keys are pressed. If Freq Step is the active parame-ter, nothing happens when the arrow keys are pressed. The frequency step size can be any value from 1 Hz to 7.1 GHz with a resolution of 1 Hz.
Use the keypad or the rotary knob to change the Frequency Step size.
Signal StandardUse the Up/Down arrow keys or the rotary knob to highlight a signal standard and press Enter to select.
When a signal standard is selected, the center frequency and span for the first channel of the particular standard is automatically tuned. Other settings, such as channel spacing and integration bandwidth, are also automatically entered. Appendix A contains a table of the signal standards that are in the instrument firmware.
Channel #Use the Up/Down arrow keys, the keypad, or the rotary knob to select a channel number for the selected signal standard. The center of the channel is tuned to the center of the spec-trum analyzer display.
3-12
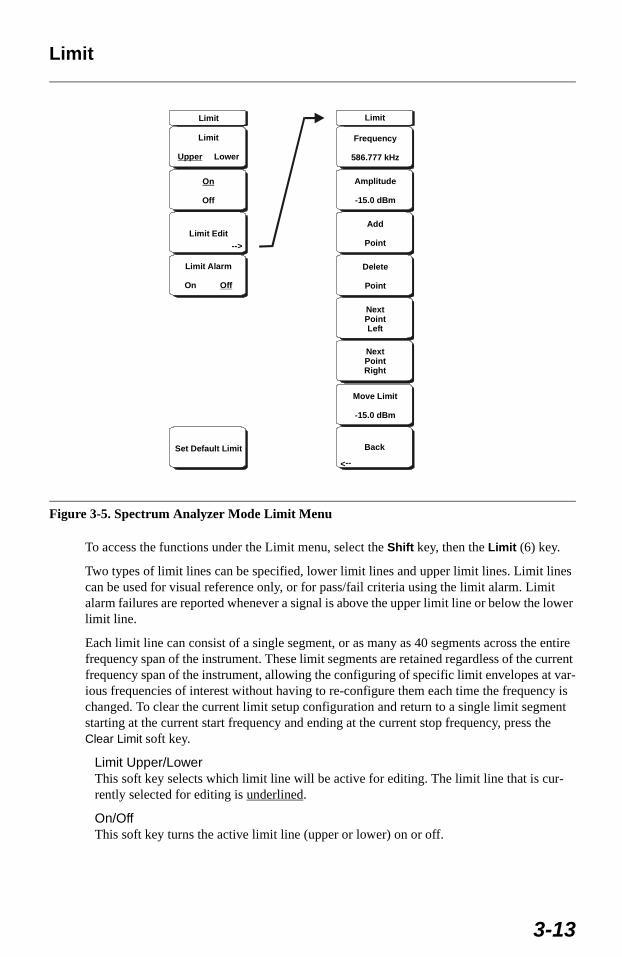
Limit
To access the functions under the Limit menu, select the Shift key, then the Limit (6) key.
Two types of limit lines can be specified, lower limit lines and upper limit lines. Limit lines can be used for visual reference only, or for pass/fail criteria using the limit alarm. Limit alarm failures are reported whenever a signal is above the upper limit line or below the lower limit line.
Each limit line can consist of a single segment, or as many as 40 segments across the entire frequency span of the instrument. These limit segments are retained regardless of the current frequency span of the instrument, allowing the configuring of specific limit envelopes at var-ious frequencies of interest without having to re-configure them each time the frequency is changed. To clear the current limit setup configuration and return to a single limit segment starting at the current start frequency and ending at the current stop frequency, press the Clear Limit soft key.
Limit Upper/LowerThis soft key selects which limit line will be active for editing. The limit line that is cur-rently selected for editing is underlined.
On/OffThis soft key turns the active limit line (upper or lower) on or off.
Figure 3-5. Spectrum Analyzer Mode Limit Menu
Limit
Frequency
586.777 kHz
Amplitude
-15.0 dBm
Delete
Point
Add
Point
NextPointRight
NextPointLeft
Move Limit
-15.0 dBm
Back
-->
Limit
Limit
LowerUpper
Limit Alarm
On Off
Limit Edit
Set Default Limit
On
Off
-->
3-13
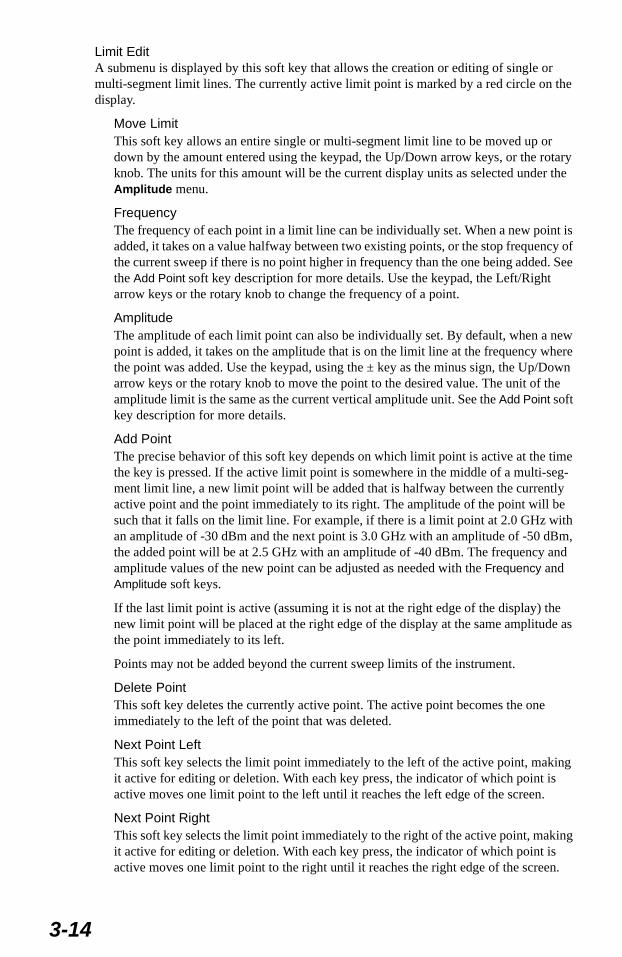
Limit EditA submenu is displayed by this soft key that allows the creation or editing of single or multi-segment limit lines. The currently active limit point is marked by a red circle on the display.
Move LimitThis soft key allows an entire single or multi-segment limit line to be moved up or down by the amount entered using the keypad, the Up/Down arrow keys, or the rotary knob. The units for this amount will be the current display units as selected under the Amplitude menu.
FrequencyThe frequency of each point in a limit line can be individually set. When a new point is added, it takes on a value halfway between two existing points, or the stop frequency of the current sweep if there is no point higher in frequency than the one being added. See the Add Point soft key description for more details. Use the keypad, the Left/Right arrow keys or the rotary knob to change the frequency of a point.
AmplitudeThe amplitude of each limit point can also be individually set. By default, when a new point is added, it takes on the amplitude that is on the limit line at the frequency where the point was added. Use the keypad, using the ± key as the minus sign, the Up/Down arrow keys or the rotary knob to move the point to the desired value. The unit of the amplitude limit is the same as the current vertical amplitude unit. See the Add Point soft key description for more details.
Add PointThe precise behavior of this soft key depends on which limit point is active at the time the key is pressed. If the active limit point is somewhere in the middle of a multi-seg-ment limit line, a new limit point will be added that is halfway between the currently active point and the point immediately to its right. The amplitude of the point will be such that it falls on the limit line. For example, if there is a limit point at 2.0 GHz with an amplitude of -30 dBm and the next point is 3.0 GHz with an amplitude of -50 dBm, the added point will be at 2.5 GHz with an amplitude of -40 dBm. The frequency and amplitude values of the new point can be adjusted as needed with the Frequency and Amplitude soft keys.
If the last limit point is active (assuming it is not at the right edge of the display) the new limit point will be placed at the right edge of the display at the same amplitude as the point immediately to its left.
Points may not be added beyond the current sweep limits of the instrument.
Delete PointThis soft key deletes the currently active point. The active point becomes the one immediately to the left of the point that was deleted.
Next Point LeftThis soft key selects the limit point immediately to the left of the active point, making it active for editing or deletion. With each key press, the indicator of which point is active moves one limit point to the left until it reaches the left edge of the screen.
Next Point RightThis soft key selects the limit point immediately to the right of the active point, making it active for editing or deletion. With each key press, the indicator of which point is active moves one limit point to the right until it reaches the right edge of the screen.
3-14

BackReturns to the higher-level Limit menu.
Limit AlarmThis soft key selects, for the currently active limit line, if an alarm beep will occur when a data point exceeds the limit.
Clear LimitThis soft key deletes all limit points for the currently active limit line and defaults to a sin-gle limit whose amplitude value will be selected to make it visible on the screen. The other limit line is not altered.
3-15
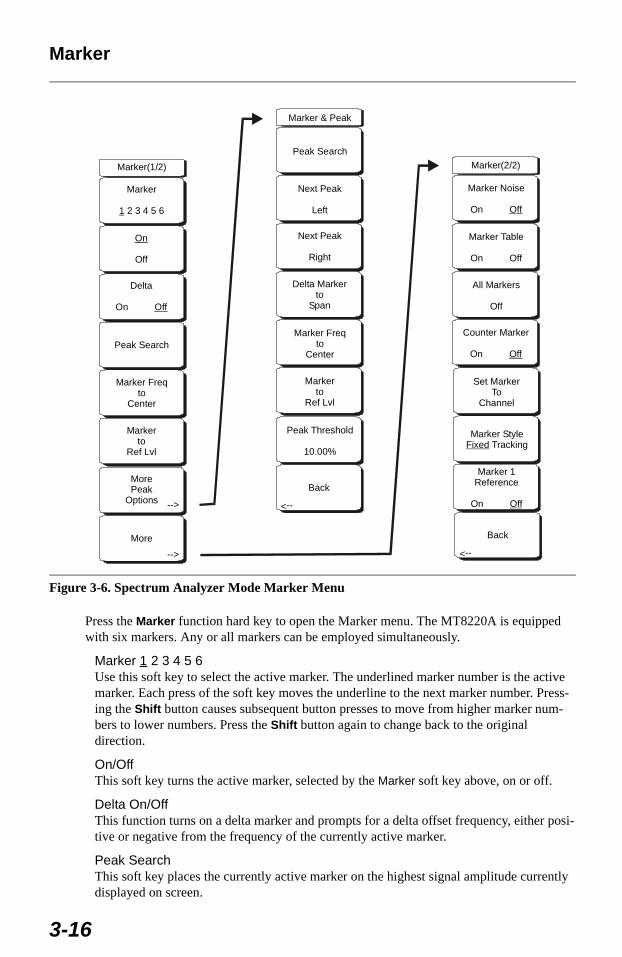
Marker
Press the Marker function hard key to open the Marker menu. The MT8220A is equipped with six markers. Any or all markers can be employed simultaneously.
Marker 1 2 3 4 5 6Use this soft key to select the active marker. The underlined marker number is the active marker. Each press of the soft key moves the underline to the next marker number. Press-ing the Shift button causes subsequent button presses to move from higher marker num-bers to lower numbers. Press the Shift button again to change back to the original direction.
On/OffThis soft key turns the active marker, selected by the Marker soft key above, on or off.
Delta On/OffThis function turns on a delta marker and prompts for a delta offset frequency, either posi-tive or negative from the frequency of the currently active marker.
Peak SearchThis soft key places the currently active marker on the highest signal amplitude currently displayed on screen.
Figure 3-6. Spectrum Analyzer Mode Marker Menu-->
Marker(1/2)
Marker
2 3 4 5 61
On
Off
Peak Search
Delta
On Off
Markerto
Ref Lvl
Marker Freqto
Center
MorePeak
Options
More
-->
-->
Recall
Measurement
Copy Allto
External Card
Delete
SaveScreen
as JPEG
Copy Allfrom
External Card
-->
Marker & Peak
Peak Search
Next Peak
Left
Delta Markerto
Span
Next Peak
Right
Peak Threshold
10.00%
Back
-->
Markerto
Ref Lvl
Marker Freqto
Center
Marker(2/2)
Marker Noise
On Off
Marker Table
On Off
Counter Marker
On Off
All Markers
Off
Back
-->
Marker 1Reference
On Off
Set MarkerTo
Channel
Marker Style TrackingFixed
3-16
Marker Freq to CenterThis soft key changes the center frequency to place the currently active marker at the cen-ter of the display.
Marker to Ref LevelThis soft key causes the amplitude of the currently active marker to become the reference level, which is the top horizontal line of the display.
More Peak OptionsThis soft key brings up a secondary menu of soft keys for more peak searching options.
Peak SearchThis soft key places the currently active marker on the highest amplitude signal cur-rently on screen.
Next Peak LeftFrom the current position of the active marker, the instrument searches to the left (toward lower frequencies) for a peak signal that rises at least a certain amount above the average noise level. If no such peak is found, the marker is placed at the left end of the trace. The Peak Threshold soft key allows the user to specify the performance of peak searching.
Next Peak RightFrom the current position of the active marker, the instrument searches to the right (toward higher frequencies) for a peak signal that rises at least a certain above the aver-age noise level. If no such peak is found, the marker is placed at the right end of the trace. The Peak Threshold soft key allows the user to specify the performance of peak searching.
Delta Marker to SpanSets the total span width to the value of the delta marker. If the delta marker is zero, the span is set to 10 Hz. If there is no delta marker, or the delta marker value is set to less than 10 Hz, then the span will be set to 10 Hz.
Marker Freq to CenterSets the center frequency to the frequency of the currently active marker.
Marker to Ref Lvl.Sets the reference level, top graticule line, to the amplitude of the currently active marker.
Peak ThresholdThis soft key allows the user to specify how far above the average noise floor a signal must rise before it is considered a peak.
BackReturns to the higher-level menu.
MoreOpens a submenu of further Marker options.
Marker NoiseThis marker option turns the markers into noise markers with units of dBm/Hz. When this option is selected, the detection method is automatically changed to RMS and the displayed value is compensated for the noise bandwidth of resolution bandwidth filter.
Marker TablePressing this soft key causes a table to be displayed below the sweep window. The table is automatically sized to display all markers that are turned on. In addition to the
3-17
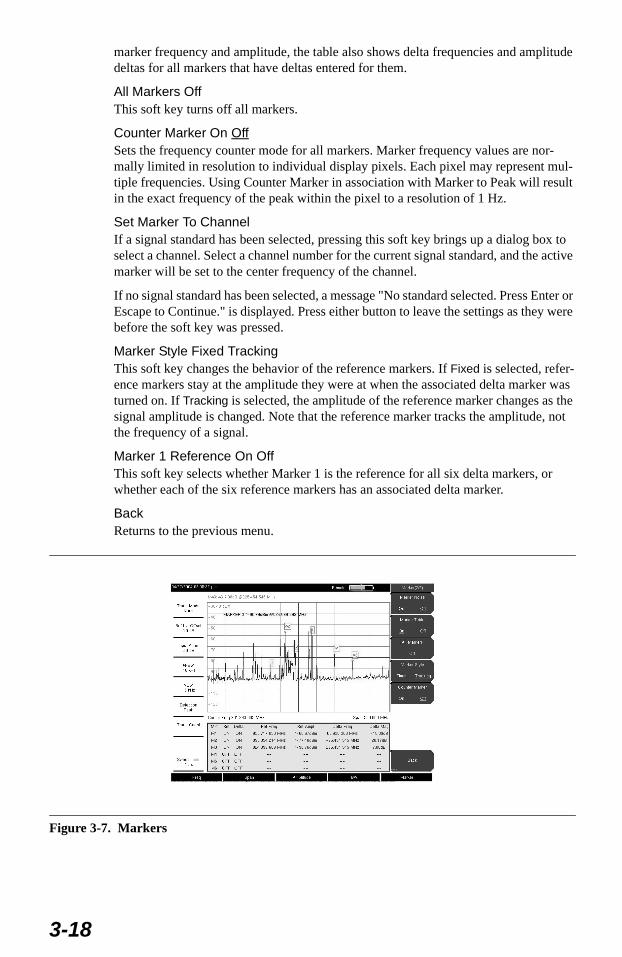
marker frequency and amplitude, the table also shows delta frequencies and amplitude deltas for all markers that have deltas entered for them.
All Markers OffThis soft key turns off all markers.
Counter Marker On OffSets the frequency counter mode for all markers. Marker frequency values are nor-mally limited in resolution to individual display pixels. Each pixel may represent mul-tiple frequencies. Using Counter Marker in association with Marker to Peak will result in the exact frequency of the peak within the pixel to a resolution of 1 Hz.
Set Marker To ChannelIf a signal standard has been selected, pressing this soft key brings up a dialog box to select a channel. Select a channel number for the current signal standard, and the active marker will be set to the center frequency of the channel.
If no signal standard has been selected, a message "No standard selected. Press Enter or Escape to Continue." is displayed. Press either button to leave the settings as they were before the soft key was pressed.
Marker Style Fixed TrackingThis soft key changes the behavior of the reference markers. If Fixed is selected, refer-ence markers stay at the amplitude they were at when the associated delta marker was turned on. If Tracking is selected, the amplitude of the reference marker changes as the signal amplitude is changed. Note that the reference marker tracks the amplitude, not the frequency of a signal.
Marker 1 Reference On OffThis soft key selects whether Marker 1 is the reference for all six delta markers, or whether each of the six reference markers has an associated delta marker.
BackReturns to the previous menu.
Figure 3-7. Markers
3-18
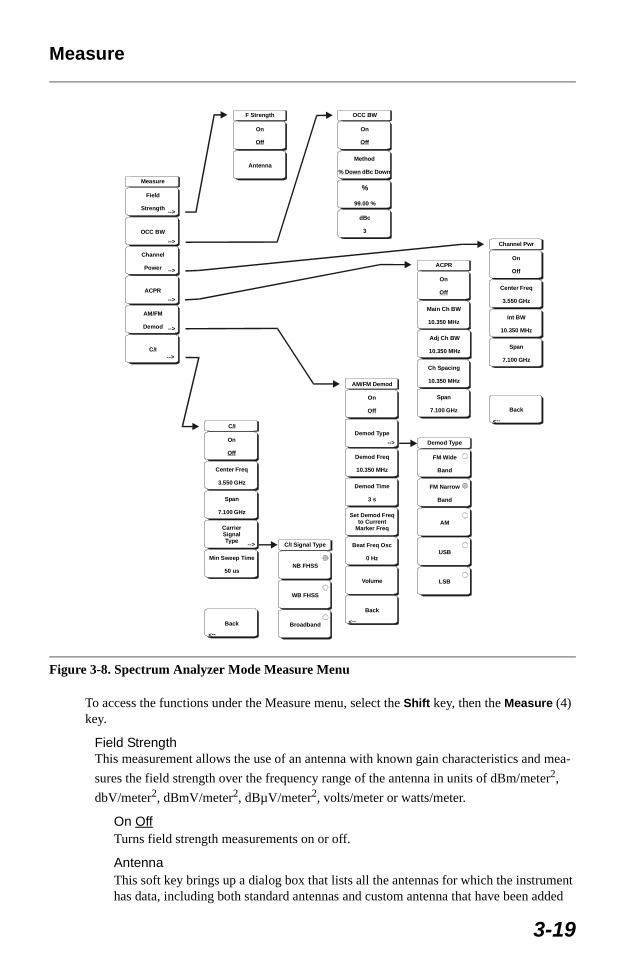
Measure
To access the functions under the Measure menu, select the Shift key, then the Measure (4) key.
Field StrengthThis measurement allows the use of an antenna with known gain characteristics and mea-
sures the field strength over the frequency range of the antenna in units of dBm/meter2,
dbV/meter2, dBmV/meter2, dBµV/meter2, volts/meter or watts/meter.
On OffTurns field strength measurements on or off.
AntennaThis soft key brings up a dialog box that lists all the antennas for which the instrument has data, including both standard antennas and custom antenna that have been added
Figure 3-8. Spectrum Analyzer Mode Measure Menu
Measure
Field
Strength
OCC BW
Channel
Power
ACPR
AM/FM
Demod
C/I-->
-->
-->
-->
-->
-->
F Strength
On
Off
Antenna
OCC BW
On
Off
Method
dBc Down% Down
%
99.00 %
dBc
3
Channel Pwr
On
Off
Center Freq
3.550 GHz
Int BW
10.350 MHz
Span
7.100 GHz
ACPR
Main Ch BW
10.350 MHz
Ch Spacing
10.350 MHz
Adj Ch BW
10.350 MHz
Span
7.100 GHz
On
Off
C/I
On
Off
Center Freq
3.550 GHz
Span
7.100 GHz
CarrierSignalType
Min Sweep Time
50 us
--> C/I Signal Type
NB FHSS
WB FHSS
Broadband
AM/FM Demod
Beat Freq Osc
0 Hz
Volume
Back
On
Off
Demod Type
Demod Freq
10.350 MHz
Demod Time
3 s
Set Demod Freqto Current
Marker Freq
-->
-->
Back
-->
Back
-->
Demod Type
FM Wide
Band
FM Narrow
Band
AM
USB
LSB
3-19
using Master Software Tools. Use the Up/Down arrow keys or the rotary knob to select the desired antenna and press Enter.
BackReturns to the previous menu.
OCC BWActivates the occupied bandwidth menu. Select either % or dBc method of occupied band-width measurement.
Method % Down/dBc Down Select either the % of Power (default) or dB Down measurement method as displayed in the message area.
%Use the keypad, the directional arrow keys or the rotary knob to enter the percent of power, from 0 to 99%.
dBcUse the keypad, the directional arrow keys or the rotary knob to enter the dBc value (0 to 120 dB).
BackReturns to the previous menu.
Channel PowerActivates the Channel Power measurement function. Channel Power and Channel Power Density are measured based on the selection in the Units menu.
On OffBegins or ends the channel power measurement. When the measurement is on, Ch Pwr will appear below the display. The detection method will automatically be changed to RMS Average when the measurement is started. The detection method can be modified by pressing the Shift and the Sweep keys and selecting the Detection soft key.
Center FreqActivates the center frequency function, and sets the center frequency of the UMTS Master for the channel power measurement. Use the keypad, the directional arrow keys or the rotary knob to enter the center frequency.
Int BWSets the integration bandwidth for channel power measurement. Modifying this value automatically adjusts the channel span to maintain the same ratio. Use the keypad, the directional arrow keys or the rotary knob to enter the integration bandwidth.
SpanSets the channel span for channel power measurement. Use the keypad, the directional arrow keys or the rotary knob to enter the channel span.
BackReturns to the previous menu.
ACPRAccesses a menu of Adjacent Channel Power Ratio measurement options:
On OffBegins or ends the ACPR measurement.
3-20
Main Ch BWSets the bandwidth of the main channel for ACPR measurement. Use the keypad, the directional arrow keys or the rotary knob to enter the a specific frequency. When using the keypad, select the GHz, MHz, kHz, or Hz soft key to accept the frequency input. Changing this value automatically changes the adjacent channel bandwidth and chan-nel spacing.
Adj Ch BWSets the bandwidth of the adjacent channels for ACPR measurement. Use the keypad, the directional arrow keys or the rotary knob to enter the a specific frequency. When using the keypad, select the GHz, MHz, kHz, or Hz soft key to accept the frequency input.
Ch SpacingSets the channel spacing between the main and adjacent channels. Use the keypad, the directional arrow keys or the rotary knob to enter the a specific frequency. When using the keypad, select the GHz, MHz, kHz, or Hz soft key to accept the frequency input. This value must be greater than or equal to half of the main channel bandwidth, plus half of the adjacent channel bandwidth.
BackReturns to the previous menu.
AM/FM Demod The user can select AM, Narrow Band FM (300 µs de-emphasis), Wide Band FM (50 µs de-emphasis), Upper Sideband or Lower Sideband.
On OffTurns AM/FM Demodulation on or off.
Demod TypeProvides soft keys to select the type of signal to be demodulated:
FM Wide BandFM Narrow BandAMUSBLSB
Demod FreqUse the keypad, the directional arrow keys or the rotary knob to enter the center fre-quency of the signal to be demodulated. This frequency does not have to be within the current frequency sweep range to which the instrument is set.
Demod TimeUse the keypad, the directional arrow keys or the rotary knob to increase or decrease the demodulation time, and press the Enter key to select. The demodulation time can be set from 100 milliseconds to 200 seconds. The instrument sweeps one time for every demodulation period. Sweeping pauses during the demodulation time.
Set Demod Freq to Current Marker FreqSets the demodulation frequency to the frequency of the current marker.
Beat Freq OscSets the beat frequency of the oscillator to exactly set the demodulation frequency of USB and LSB signals.
3-21
VolumeThe current volume setting is displayed on the screen. Use the Up/Down arrow keys or rotary knob to change the volume, and press the Enter key to select.
BackReturns to the previous menu.
C/IThe Carrier to Interference ratio is a two-step measurement sequence that first measures the amplitude of a carrier, then, with the carrier turned off, measures the amplitude of all other interfering signals within the channel bandwidth.
On OffStarts and stops the carrier to interference measurement.
Center FreqUse the keypad, the directional arrow keys or the rotary knob to enter the center fre-quency.
SpanUse the keypad, the directional arrow keys or the rotary knob to enter the frequency span.
Carrier Signal TypeOpens a menu to select the carrier signal type.
NB FHSS (Narrow Band Frequency Hopping Spread Spectrum)Use this setting when the signal being measured is 802.11b.
WB FHSS (Wide Band Frequency Hopping Spread Spectrum)Use this setting when the signal being measured is 802.11a or 802.11g.
BroadbandUse this setting when the signal being measured is a digital modulation format such as CDMA, GSM, etc.
BackReturns to the previous menu.
Min Sweep TimeSet the minimum sweep time for the measurement.
BackReturns to the previous menu.
3-22
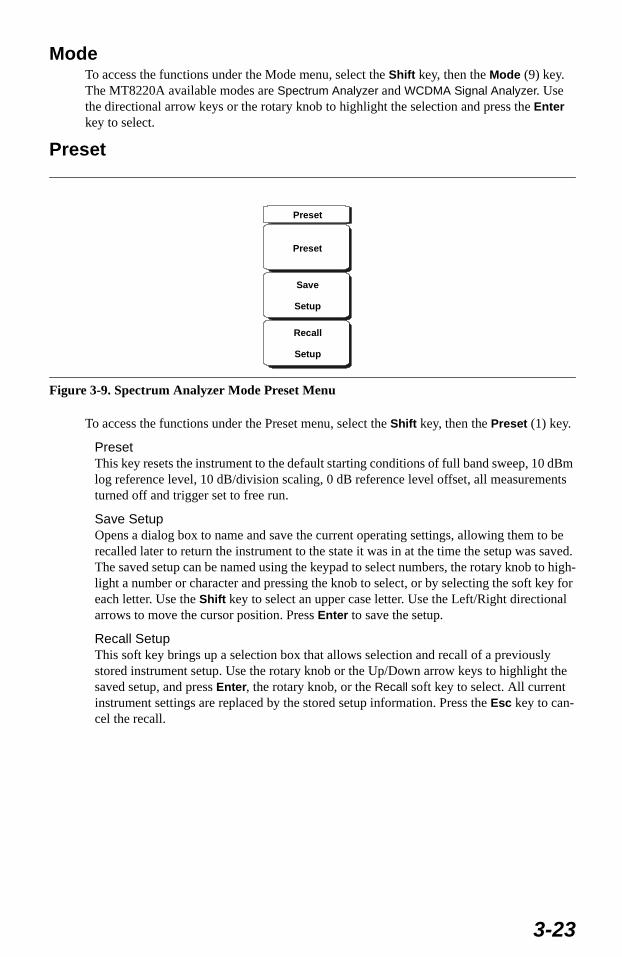
ModeTo access the functions under the Mode menu, select the Shift key, then the Mode (9) key. The MT8220A available modes are Spectrum Analyzer and WCDMA Signal Analyzer. Use the directional arrow keys or the rotary knob to highlight the selection and press the Enter key to select.
Preset
To access the functions under the Preset menu, select the Shift key, then the Preset (1) key.
PresetThis key resets the instrument to the default starting conditions of full band sweep, 10 dBm log reference level, 10 dB/division scaling, 0 dB reference level offset, all measurements turned off and trigger set to free run.
Save SetupOpens a dialog box to name and save the current operating settings, allowing them to be recalled later to return the instrument to the state it was in at the time the setup was saved. The saved setup can be named using the keypad to select numbers, the rotary knob to high-light a number or character and pressing the knob to select, or by selecting the soft key for each letter. Use the Shift key to select an upper case letter. Use the Left/Right directional arrows to move the cursor position. Press Enter to save the setup.
Recall SetupThis soft key brings up a selection box that allows selection and recall of a previously stored instrument setup. Use the rotary knob or the Up/Down arrow keys to highlight the saved setup, and press Enter, the rotary knob, or the Recall soft key to select. All current instrument settings are replaced by the stored setup information. Press the Esc key to can-cel the recall.
Figure 3-9. Spectrum Analyzer Mode Preset Menu
Preset
Preset
Save
Setup
Recall
Setup
3-23
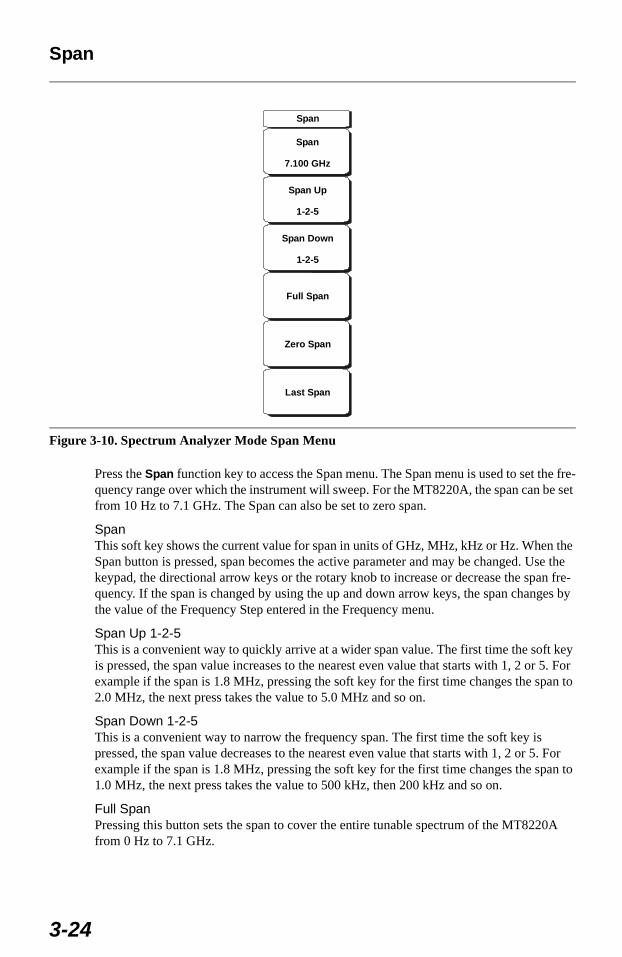
Span
Press the Span function key to access the Span menu. The Span menu is used to set the fre-quency range over which the instrument will sweep. For the MT8220A, the span can be set from 10 Hz to 7.1 GHz. The Span can also be set to zero span.
SpanThis soft key shows the current value for span in units of GHz, MHz, kHz or Hz. When the Span button is pressed, span becomes the active parameter and may be changed. Use the keypad, the directional arrow keys or the rotary knob to increase or decrease the span fre-quency. If the span is changed by using the up and down arrow keys, the span changes by the value of the Frequency Step entered in the Frequency menu.
Span Up 1-2-5 This is a convenient way to quickly arrive at a wider span value. The first time the soft key is pressed, the span value increases to the nearest even value that starts with 1, 2 or 5. For example if the span is 1.8 MHz, pressing the soft key for the first time changes the span to 2.0 MHz, the next press takes the value to 5.0 MHz and so on.
Span Down 1-2-5 This is a convenient way to narrow the frequency span. The first time the soft key is pressed, the span value decreases to the nearest even value that starts with 1, 2 or 5. For example if the span is 1.8 MHz, pressing the soft key for the first time changes the span to 1.0 MHz, the next press takes the value to 500 kHz, then 200 kHz and so on.
Full SpanPressing this button sets the span to cover the entire tunable spectrum of the MT8220A from 0 Hz to 7.1 GHz.
Figure 3-10. Spectrum Analyzer Mode Span Menu
Span
Span
7.100 GHz
Span Up
1-2-5
Span Down
1-2-5
Full Span
Zero Span
Last Span
3-24
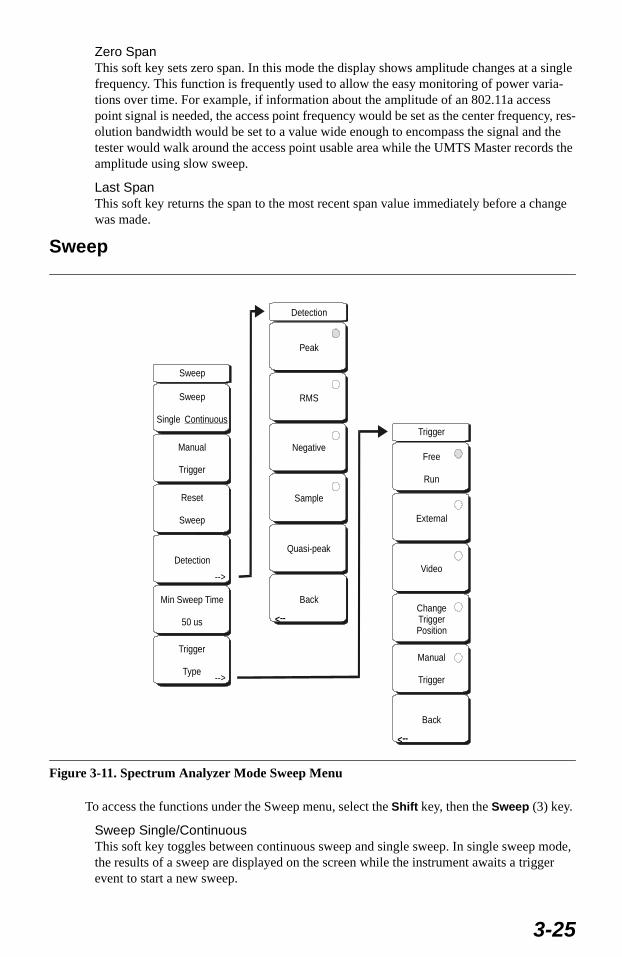
Zero SpanThis soft key sets zero span. In this mode the display shows amplitude changes at a single frequency. This function is frequently used to allow the easy monitoring of power varia-tions over time. For example, if information about the amplitude of an 802.11a access point signal is needed, the access point frequency would be set as the center frequency, res-olution bandwidth would be set to a value wide enough to encompass the signal and the tester would walk around the access point usable area while the UMTS Master records the amplitude using slow sweep.
Last Span This soft key returns the span to the most recent span value immediately before a change was made.
Sweep
To access the functions under the Sweep menu, select the Shift key, then the Sweep (3) key.
Sweep Single/ContinuousThis soft key toggles between continuous sweep and single sweep. In single sweep mode, the results of a sweep are displayed on the screen while the instrument awaits a trigger event to start a new sweep.
Figure 3-11. Spectrum Analyzer Mode Sweep Menu
Sweep
Sweep
Single Continuous
Manual
Trigger
Reset
Sweep
Detection
Min Sweep Time
50 us
Trigger
Type-->
-->
Trigger
Free
Run
External
Video
ChangeTriggerPosition
Manual
Trigger
Back
-->
Detection
Peak
RMS
Negative
Sample
Quasi-peak
Back
-->
3-25
Manual TriggerPressing this soft key causes the instrument to make a single sweep when the instrument is in single sweep mode. This key has no function when the instrument is in continuous sweep mode.
Reset SweepThis soft key stops the current sweep, clears trace averaging results, clears the maximum hold results, if selected, and restarts the sweep at the left side of the screen.
Detection Several detection methods tailor the performance of the instrument to meet specific mea-surement requirements. In general, there are more measurement points across the screen than display points. The various detection methods are different ways of dealing with selecting which measurement point will be shown at each display point.
Peak This method causes the largest measurement point to be shown for each display point, and assures that a narrow peak is not missed.
RMSThis method performs a root-mean-square calculation of all the measurement points in each display point, and is particularly useful in displaying the average value of noise.
Negative This method causes the smallest measurement point to be shown for each display point. Typically this mode is used to help detect small discrete signals in the presence of nearly equal values of noise. The display points that contain only noise will tend to show lower amplitudes than those that contain discrete signals.
SampleThis is the fastest detection method since for each display point only one frequency point is measured. Use this method when speed is of paramount importance and the possibility of missing a narrow peak is not important.
Quasi-peakSelects the quasi-peak detector. When the quasi-peak detector is selected, the allowed resolution bandwidths are 200 Hz, 9 kHz and 120 kHz. Also, the RBW/VBW ratio is set to 1 so the video bandwidth is the same as the resolution bandwidth.
BackReturns to the previous menu.
Min Sweep TimeThis function allows a minimum sweep time to be specified. Use the keypad, the direc-tional arrow keys or the rotary knob to set the minimum sweep time from 50 microseconds to 600 seconds. When using the keypad, the available time units are minutes, seconds, mil-liseconds and microseconds.
If the required sweep time for accurate measurement is longer than the specified minimum, then the time required for accurate measurements will prevail.
Trigger TypeSets the type of trigger to be used.
Free RunIn this mode, a new sweep is started immediately upon completion of an old sweep. No trigger event is required to initiate a sweep.
3-26
ExternalA TTL signal applied to the External Trigger BNC input connector causes a single sweep to occur. This mode is used in zero span, and triggering occurs on the rising edge of the signal. After the sweep is complete, the resultant trace is displayed until the next trigger signal arrives.
VideoThis mode is used in zero span to set the power level at which a sweep is initiated. The power level can be set from -120 dBm to +20 dBm. The trigger is based on the mea-sured signal level. If no signal reaches or exceeds the trigger level, there will be no trace on the screen. This mode is used in Zero Span.
Change Trigger PositionThis soft key is used in conjunction with video triggering to set the horizontal position on the display where a signal that meets the video triggering criterion will be placed. The value can be from 0% to 100%. Zero percent places the triggering event at the left edge of the screen while 100% places the triggering at the right edge of the screen. When the trigger position is any value other than 0%, the portion of the trace before the trigger event is displayed very quickly since the trace data is stored in memory. The portion of the trace after the trigger point is displayed on the screen at the normal rate as the signal is swept. This mode is used in Zero Span.
BackReturns to the previous menu.
3-27
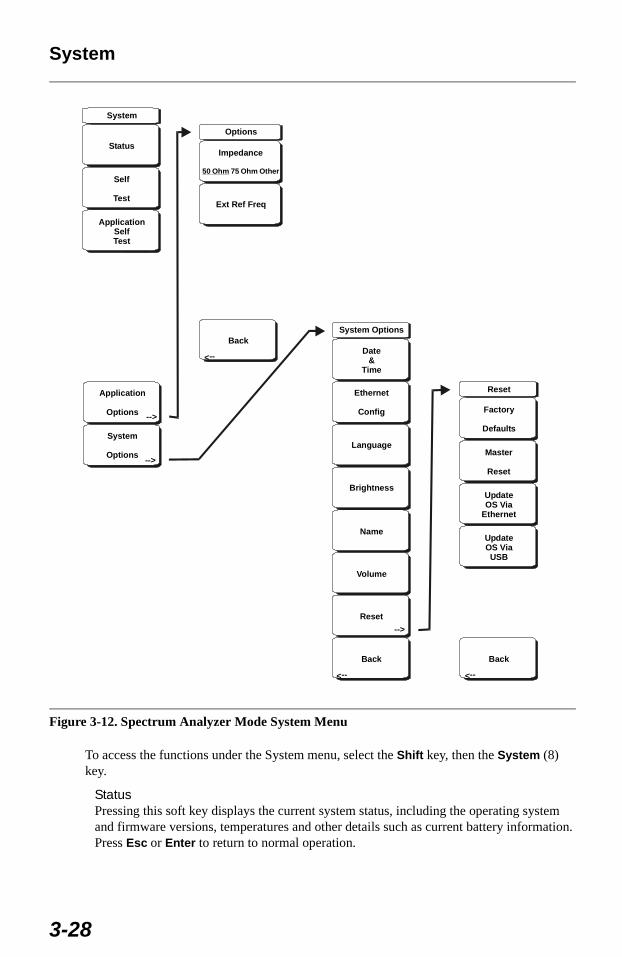
System
To access the functions under the System menu, select the Shift key, then the System (8) key.
StatusPressing this soft key displays the current system status, including the operating system and firmware versions, temperatures and other details such as current battery information. Press Esc or Enter to return to normal operation.
Figure 3-12. Spectrum Analyzer Mode System Menu
System
Status
Self
Test
ApplicationSelfTest
Application
Options
System
Options-->
-->
Back
-->
Back
-->
Options
Impedance
50 Ohm 75 Ohm Other
Ext Ref Freq
Reset
Factory
Defaults
Master
Reset
UpdateOS Via
Ethernet
UpdateOS ViaUSB
System Options
Date&
Time
Ethernet
Config
Language
Brightness
Name
Volume
Reset
Back
-->
-->
3-28
Self Test This soft key initiates a series of diagnostic tests that test the components of the instru-ment. A display will list the individual tests with a pass or fail indication. Press Esc or Enter to return to normal operation.
Application Self TestThis soft key initiates a series of diagnostic tests related to the performance of the spec-trum analyzer. A display will list the individual tests with a pass or fail indication. Press Esc or Enter to return to normal operation.
Application OptionsThis soft key presents a menu to select application options.
Impedance 50 Ohm/75 Ohm/OtherSelect either 50 ohm, 75 ohm, or other impedance value. Selecting 75 ohm selects the 7.5 dB loss of the Anritsu 12N50-75B adapter. For other adapters, select Other and enter the appropriate loss.
Ext Ref FreqSelect the frequency of the external reference from the list presented. Valid frequencies are 1 MHz, 1.2288 MHz, 1.544 MHz, 2.048 MHz, 2.4576 MHz, 4.8 MHz, 4.9152 MHz, 5 MHz, 9.8304 MHz, 10 MHz, 13 MHz and 19.6608 MHz at amplitude from -10 dBm to +10 dBm.
BackReturns to the previous menu.
System OptionsThis key opens a selection of system option soft keys.
Date and TimeThis soft key brings up a dialog box for setting the current date and time. Use the soft keys or the Left/Right arrow keys to select the field to be modified. Use the keypad, the Up/Down arrow keys or the rotary knob to select the date and time. Select Enter to accept the changes, or press the Esc key to return to normal operation without chang-ing anything.
Ethernet ConfigurationThis soft key brings up a dialog box to set the IP address of the instrument.
Type Manual/DHCPThis softkey selects whether the address will be entered manually, or supplied auto-matically by a network DHCP server. If Manual is selected, use the soft keys or the Left/Right arrow keys to select the field to be modified. Use the keypad, the Up/Down arrow keys or the rotary knob to enter the input. Select Enter to accept the changes, or press the Esc key to return to normal operation without changing any-thing.
LanguageThis soft key brings up a selection box allowing selection from a list of built-in lan-guages for the UMTS Master displays. The languages currently available are English, French, German, Spanish, Japanese, Chinese, Korean, and Italian. In addition, up to two custom languages may be selected if they have been defined using the Master Soft-ware Tools software and loaded into the MT8220A. The only limit regarding the num-ber of languages that may be loaded into the instrument is the amount of space available in the memory. Select Enter to accept the change, or press the Esc key to return to normal operation without changing anything.
3-29
BrightnessThe brightness of the display can be adjusted to optimize viewing under a wide variety of lighting conditions. Use the keypad, the Up/Down arrow keys or the rotary knob to select a brightness level from 1 to 10, 10 being the brightest. Select Enter to accept the change.
NameOpens a dialog box to name the instrument. The unit can be named using the keypad to select numbers, the rotary knob to highlight a number or character and pressing the knob to select, or by selecting the soft key for each letter. Use the Shift key to select an upper case letter. Use the Left/Right directional arrows to move the cursor position. Press Enter to save the name.
VolumeThe current volume setting is displayed on the screen. Use the keypad, the Up/Down arrow keys or the rotary knob to change the volume and press the Enter key to accept the change.
ResetOpens a menu of reset and update options.
Factory DefaultsRestores the instrument to the factory default values, including Ethernet, language and brightness settings. Press the Enter key to initiate the reset, and turn the unit off, then on again to complete. Press Esc to return to normal operation without resetting.
Master ResetThis will restore factory setting to all system parameters, including Time/Date, Ether-net, language and brightness settings. Also, all user files in the internal memory are deleted, and the original language and antenna files are restored. Press the Enter key to initiate the reset, and turn the unit off, then on again to complete. Press Esc to return to normal operation without resetting.
Update OS Via EthernetSelect this soft key to update the instrument operating system via the Ethernet con-nection. Press Enter to begin the update, or press Esc to return to normal operation without updating.
Update OS Via USBSelect this soft key to update the instrument operating system via the USB connec-tion. Press Enter to begin the update, or press Esc to return to normal operation with-out updating.
BackReturns to the previous menu.
3-30

Trace
To access the functions under the Trace menu, select the Shift key, then the Trace (5) key. The MT8220A is capable of displaying up to three traces, one with live data, and the other two either with stored data or trace math data.
Trace A, B, CThis soft key selects which trace is the active trace. The active trace is the one that is underlined. As the key is pressed, the underline advances from A to B to C and back to A.
View BlankThis soft key toggles the currently active trace to be either visible or hidden.
Figure 3-13. Spectrum Analyzer Mode Trace Menu
Save/Recall
Save
Setup
Recall
Setup
Save
Measurement
Recall
Measurement
Delete
Copy Allto
External Card
Copy Allfrom
External Card
SaveScreen
as JPEG
-->
Trace
Trace
A B C
View
Blank
Trace A
Operations
Trace B
Operations
Trace C
Operations
Write
Hold
-->
-->
-->
-->
Trace C Ops
A->C
B<->C
Min Hold->C
Max Hold->C
B-A->C
A-B->C
Trace B Ops
A->B
B<->C
Save/Recall
Full Screen
On Off
Trace A Ops
Normal ->A
Max Hold->A
Min Hold->A
Average->A
# of Averages
10
3-31
Write/HoldSelects if the currently active trace will continue to sweep and be updated or to hold the current trace on screen. This is not applicable to traces B or C unless trace math involving trace A is active.
Trace Mode Norm/Avg/MaxWith this soft key the function of the active trace can be modified:
Normal - the trace shows current data
Avg - the trace shows a running average of a number of traces. The number is deter-mined by the next soft key, # of Averages.
Max - the trace shows the cumulative maximum value of each display point over many traces.
# of AveragesSets the number of traces that are used for the calculation of the average display value from 1 to 65535.
Save/RecallSelecting this soft key opens a list of save and recall function soft keys, as explained in the File menu section.
DetectionSeveral detection methods tailor the performance of the instrument to meet specific mea-surement requirements. In general, there are more measurement points across the screen than display points. The various detection methods are different ways of dealing with selecting which measurement point will be shown at each display point.
Peak This method causes the largest measurement point to be shown for each display point, and assures that a narrow peak is not missed.
RMSThis method performs a root-mean-square calculation of all the signals in each display, and is particularly useful in displaying the average value of noise.
Negative This method causes the smallest measurement point to be shown for each display point. Typically this mode is used to help detect small discrete signals in the presence of nearly equal values of noise. The display points that contain only noise will tend to show lower amplitudes than those that contain discrete signals.
SampleThis is the fastest detection method since for each display point only one frequency point is measured. Use this method when speed is of paramount importance and the possibility of missing a narrow peak is not important.
Quasi-peakSelects the quasi-peak detector. When the quasi-peak detector is selected, the allowed resolution bandwidths are 200 Hz, 9 kHz and 120 kHz. Also, the RBW/VBW ratio is set to 1 so the video bandwidth is the same as the resolution bandwidth.
BackReturns to the previous menu.
3-32
MoreA->BCopies the contents of trace A into trace B. Doing so overwrites the previous contents of trace B.
A->CCopies the contents of trace A into trace C. Doing so overwrites the previous contents of trace C.
B<->CSwaps the contents of traces B and C.
A - B->CSubtracts the value of trace B from trace A and places the results in trace C. This func-tion is very useful for observing the changes in values of live trace A compared to a trace stored in trace B. Display scaling can be set to a value that makes the differences easy to see.
B - A->CSubtracts the value of trace A from trace B and places the results in trace C. This func-tion is very useful for observing the changes in values of live trace A compared to a trace stored in trace B. Display scaling can be set to a value that makes the differences easy to see.
Full ScreenIncreases size of the X-Y display by hiding the data labels on the left side of the dis-play.
BackReturns to the previous menu.
3-33
Resolution BandwidthResolution Bandwidth is determined by the intermediate frequency (IF) filter bandwidth. The spectrum analyzer traces the shape of the IF filter as it tunes past a signal. If more than one IF filter is used in a spectrum analyzer, the narrowest one dominates and is considered the resolution bandwidth. The choice of resolution bandwidth depends on several factors. Filters take time to settle. That is, when a signal first appears at the input of the filter, it will take a while before the signal appears at the output. Additionally, the output of the filter will take some time to settle to the correct value, so that it can be measured. The narrower the fil-ter bandwidth (resolution bandwidth) the longer the settling time needs to be and so the slower the sweep speed.
The choice of resolution bandwidth will depend on the signal being measured. If two closely-spaced signals are to be measured individually, then a narrow bandwidth is required. If a wider bandwidth is used, then the energy of both signals will be included in the measure-ment. Thus, the wider bandwidth does not have the ability to look at frequencies selectively but instead simultaneously measures all signals falling within the resolution bandwidth. Therefore, a broadband measurement would include all signals and noise within the mea-surement bandwidth into a single measurement.
On the other hand, a narrow-band measurement will separate the frequency components, resulting in a measurement that includes separate peaks for each signal. There are advan-tages to each. The ultimate decision will depend on the type of measurement required by the user.
There is always some amount of noise present in a measurement. Noise is often broadband in nature; that is, it exists at a broad range of frequencies. If the noise is included in the mea-surement, the measured value could be in error (too large) depending on the noise level. With a wide bandwidth, more noise is included in the measurement. With a narrow band-width, less noise enters the resolution bandwidth filter, and the measurement is more accu-rate. If the resolution bandwidth is narrower, the noise floor will drop on the spectrum analyzer display. This is because the IF filter of the analyzer has been made narrower in bandwidth, which lets in less noise. As the measured noise level drops, smaller signals that were previously obscured by the noise can now be measured.
Video BandwidthSpectrum analyzers typically use another type of filtering after the detector called video fil-tering. This filter also affects the noise on the display but in a different manner than the reso-lution bandwidth. In video filtering, the average level of the noise remains the same but the variation in the noise is reduced. Hence, the effect of video filtering is a "smoothing" of the signal noise. The resultant effect on the analyzer's display is that the noise floor compresses into a thinner trace, while the position of the trace remains the same.
Changing the video bandwidth (VBW) does not improve sensitivity, but it does improve dis-cernability and repeatability when making low-level measurements. As a general rule of thumb, most field spectrum analyzer measurements are made at a video bandwidth that is a factor of 10 to 100 less than the resolution bandwidth. In the MT8220A UMTS Master, this ratio can be specified in the BW menu. For a resolution bandwidth of 30 kHz, the typical video bandwidth setting options are either 3 kHz or 300 Hz.
Sweep LimitationsWith some spectrum analyzers, the user has control over sweep time (the elapsed time of each sweep, sometimes called scan time). An analyzer cannot be swept arbitrarily fast while maintaining its specified accuracy, but will have a sweep rate limitation depending on the resolution bandwidth, video bandwidth, and frequency range selected. The sweep rate is not usually chosen by the user but is determined by the frequency range swept divided by the
3-34
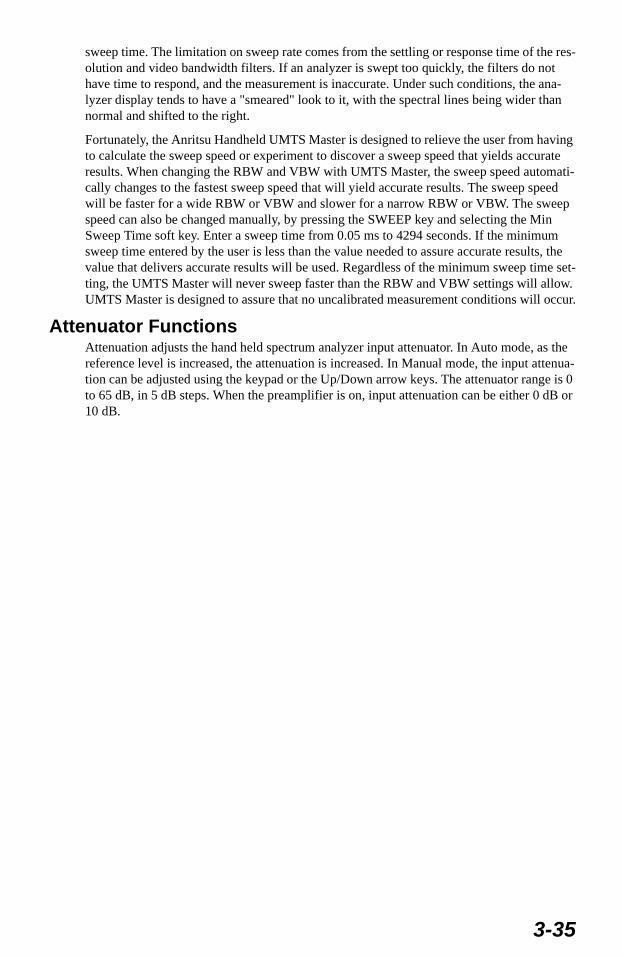
sweep time. The limitation on sweep rate comes from the settling or response time of the res-olution and video bandwidth filters. If an analyzer is swept too quickly, the filters do not have time to respond, and the measurement is inaccurate. Under such conditions, the ana-lyzer display tends to have a "smeared" look to it, with the spectral lines being wider than normal and shifted to the right.
Fortunately, the Anritsu Handheld UMTS Master is designed to relieve the user from having to calculate the sweep speed or experiment to discover a sweep speed that yields accurate results. When changing the RBW and VBW with UMTS Master, the sweep speed automati-cally changes to the fastest sweep speed that will yield accurate results. The sweep speed will be faster for a wide RBW or VBW and slower for a narrow RBW or VBW. The sweep speed can also be changed manually, by pressing the SWEEP key and selecting the Min Sweep Time soft key. Enter a sweep time from 0.05 ms to 4294 seconds. If the minimum sweep time entered by the user is less than the value needed to assure accurate results, the value that delivers accurate results will be used. Regardless of the minimum sweep time set-ting, the UMTS Master will never sweep faster than the RBW and VBW settings will allow. UMTS Master is designed to assure that no uncalibrated measurement conditions will occur.
Attenuator FunctionsAttenuation adjusts the hand held spectrum analyzer input attenuator. In Auto mode, as the reference level is increased, the attenuation is increased. In Manual mode, the input attenua-tion can be adjusted using the keypad or the Up/Down arrow keys. The attenuator range is 0 to 65 dB, in 5 dB steps. When the preamplifier is on, input attenuation can be either 0 dB or 10 dB.
3-35
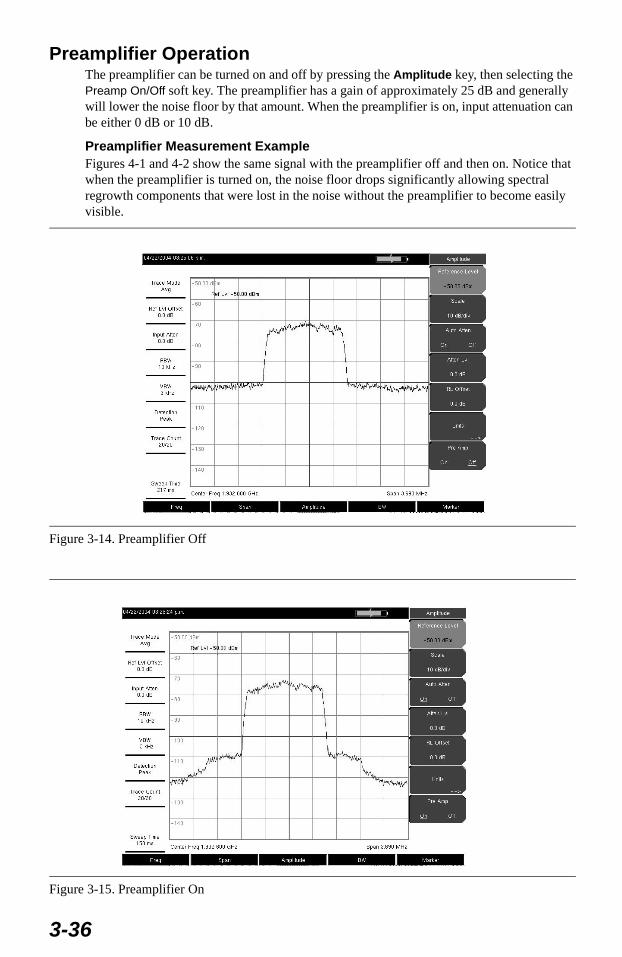
Preamplifier OperationThe preamplifier can be turned on and off by pressing the Amplitude key, then selecting the Preamp On/Off soft key. The preamplifier has a gain of approximately 25 dB and generally will lower the noise floor by that amount. When the preamplifier is on, input attenuation can be either 0 dB or 10 dB.
Preamplifier Measurement ExampleFigures 4-1 and 4-2 show the same signal with the preamplifier off and then on. Notice that when the preamplifier is turned on, the noise floor drops significantly allowing spectral regrowth components that were lost in the noise without the preamplifier to become easily visible.
Figure 3-14. Preamplifier Off
Figure 3-15. Preamplifier On
3-36
Field MeasurementsIn Spectrum Analyzer mode, there are smart one-button measurements built into the UMTS Master MT8220A for field strength, occupied bandwidth, channel power, adjacent channel power ratio, and carrier to interference ratio (C/I) tests. In addition, AM/FM/SSB demodula-tion is available to aid in the identification of interfering signals. This section presents brief examples demonstrating the use of these measurements.
Occupied Bandwidth MeasurementOccupied bandwidth (OBW) is a common measurement performed on radio transmitters. This measurement calculates the bandwidth containing the total integrated power occupied in a given signal bandwidth. There are two different methods of calculation depending on the technique used to modulate the carrier.
% Down MethodThe occupied frequency bandwidth is calculated as the bandwidth containing the specified percentage of the transmitted power.
dBc Down MethodThe occupied frequency bandwidth is defined as the bandwidth between the upper and lower frequency points at which the signal level is a desired number of dB below the peak carrier level.
Required Equipment• Anritsu MT8220A Handheld Spectrum Analyzer
• Test Port Extension Cable, Anritsu part number 15NNF50 - 1.5C
• 30 dB, 50 Watt, bi-directional, DC -18 GHz, N(m) - N(f), Attenuator, Anritsu 42N50A-30 (required if the power level being measured is >+30 dBm)
ProcedureStep 1. Using the test port extension cable and the 30 dB, 50 watt, bi-directional attenua-
tor (if needed) connect the MT8220A to the appropriate transmitter test port or signal source.
Step 2. Press the Freq key followed by the Center Freq soft key and enter the center fre-quency using the keypad, the arrow keys, or the rotary knob. If entering a fre-quency using the keypad, the soft key labels change to GHz, MHz, kHz and Hz. Select the appropriate units key. Selecting the Enter key has the same affect as the MHz soft key.
Step 3. If the attenuator was connected in Step 1, press the Amplitude key and select the RL Offset soft key and set the reference level offset to -30 dB to compensate for the loss in the attenuator.
Step 4. Press the Amplitude key then press the Reference Level soft key to set the appro-priate reference level.
Step 5. Press the Atten Lvl soft key to set the input attenuation level or leave Auto Atten set to On.
Step 6. Press the BW key to set the resolution bandwidth and video bandwidth if desired.Step 7. Press the Shift key then the Measure (4) key followed by the OCC BW soft key.
Choose the measurement method (dBc Down or % Down) by pressing the Method soft key. The selected method is underlined.
Step 8. Press the dBc or % soft keys to adjust the settings as needed. Common values are 99% and 30 dBc.
3-37
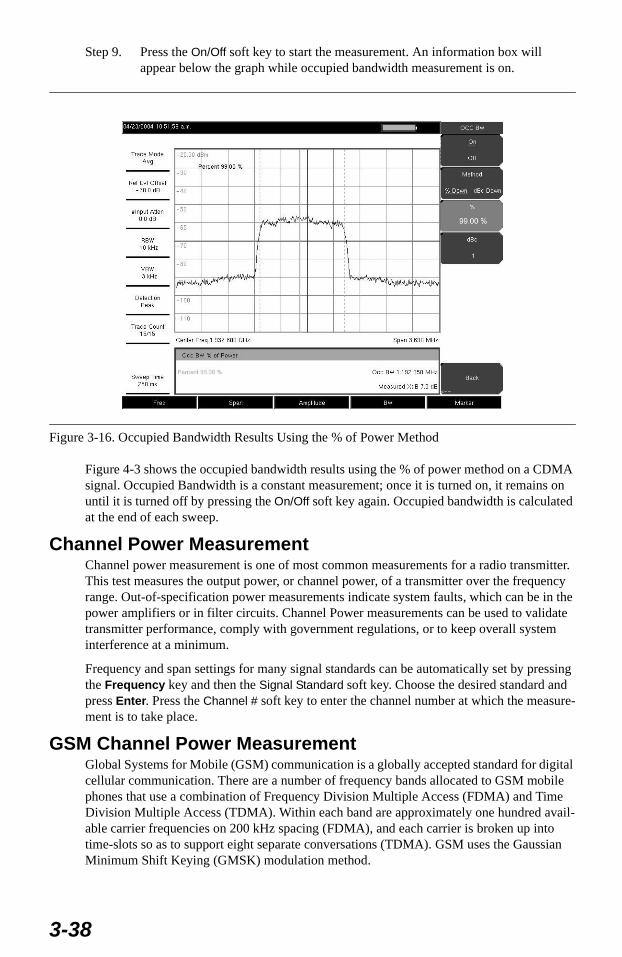
Step 9. Press the On/Off soft key to start the measurement. An information box will appear below the graph while occupied bandwidth measurement is on.
Figure 4-3 shows the occupied bandwidth results using the % of power method on a CDMA signal. Occupied Bandwidth is a constant measurement; once it is turned on, it remains on until it is turned off by pressing the On/Off soft key again. Occupied bandwidth is calculated at the end of each sweep.
Channel Power MeasurementChannel power measurement is one of most common measurements for a radio transmitter. This test measures the output power, or channel power, of a transmitter over the frequency range. Out-of-specification power measurements indicate system faults, which can be in the power amplifiers or in filter circuits. Channel Power measurements can be used to validate transmitter performance, comply with government regulations, or to keep overall system interference at a minimum.
Frequency and span settings for many signal standards can be automatically set by pressing the Frequency key and then the Signal Standard soft key. Choose the desired standard and press Enter. Press the Channel # soft key to enter the channel number at which the measure-ment is to take place.
GSM Channel Power MeasurementGlobal Systems for Mobile (GSM) communication is a globally accepted standard for digital cellular communication. There are a number of frequency bands allocated to GSM mobile phones that use a combination of Frequency Division Multiple Access (FDMA) and Time Division Multiple Access (TDMA). Within each band are approximately one hundred avail-able carrier frequencies on 200 kHz spacing (FDMA), and each carrier is broken up into time-slots so as to support eight separate conversations (TDMA). GSM uses the Gaussian Minimum Shift Keying (GMSK) modulation method.
Figure 3-16. Occupied Bandwidth Results Using the % of Power Method
3-38
Required Equipment• MT8220A Handheld UMTS Master
• Test Port extension cable, Anritsu 15NNF50 - 1.5C
ProcedureStep 1. Using the test port extension cable, connect the signal source to the RF In test port
of the MT8220A.Step 2. Press the Amplitude key and select the Reference Level soft key to set the refer-
ence level to -20 dBm. Adjust the values given in this procedure to match your measurement conditions.
Step 3. Press the Scale soft key and set the scale to 10 dB/division.Step 4. Press the BW key and verify that RBW Auto and VBW Auto are On.Step 5. Press the Freq key followed by the Signal Standard soft key. Scroll through the
dialog box using the rotary knob or Up/Down arrow keys to highlight the GSM900 standard for the measurement and press Enter.
Step 6. Press the Channel# soft key and enter the channel number using the keypad, the arrow keys, or the rotary knob. For this example, select Channel 60.
Step 7. Press the Shift key then the Measure (4) key and press the Channel Power soft key.
Step 8. Select the Center Freq soft key and verify that the center frequency of the UMTS Master is set to that of the GSM signal, in this case 947.0 MHz.
Step 9. Select the Int BW soft key and enter 200 kHz for the integration bandwidth, or set the integration bandwidth appropriate for the particular application.
Step 10. Select the Span soft key and enter 800 kHz as the channel span, or set the channel span to a value appropriate for the particular application.
Step 11. Make the measurement by pressing the Measure soft key. The MT8220A displays the measurement results in the message area.
GSM Adjacent Channel Power MeasurementRequired Equipment
• MT8220A Handheld Spectrum Analyzer
• 30 dB, 50 watt, Bi-Directional, DC - 18 GHz, N(m) - N(f), Attenuator, Anritsu 42N50A-30 (if required for the power level being measured)
• Test Port extension cable, Anritsu 15NNF50 - 1.5C
ProcedureStep 1. Using the test port extension cable and 30 dB attenuator, connect the signal source
to the input of the attenuator, and connect the output of the attenuator to the RF In test port of the MT8220A.
Step 2. If the attenuator was connected in Step 1, press the RL Offset soft key and set the reference level offset to -30 dB to compensate for the loss of the attenuator.
Step 3. Press the Amplitude key and select the Reference Level soft key to set the refer-ence level to 60 dBm.
Step 4. Press the Atten Lvl soft key to set the input attenuation level needed for the mea-surement. This value depends on the input power level and any external attenua-tor. Enter an attenuation level to achieve roughly -40 dBm at the input mixer.
Step 5. Press the BW key and verify that RBW Auto and VBW Auto are On.Step 6. There are two ways to set the measurement parameters. If the signal standard and
channel are known, press the Freq key and set the Signal Standard and Select Channel soft keys for the signal to be measured then skip to Step 12.
NOTE: Channel Power is a constant measurement. Once it is turned on, it will remain on until it is turned off by pressing the On/Off soft key again.
3-39
If the signal standard and channel are not known, follow the procedure in Steps 7 through 12 below.
Step 7. Press the Freq key, select the Center Freq soft key, and enter the desired center frequency.
Step 8. Press the Shift key then the Measure key and select the ACPR soft key.Step 9. Select the Main Ch BW soft key, and enter the main channel bandwidth.Step 10. Select the Adj Ch BW soft key, and enter the adjacent channel bandwidth.Step 11. Select the Ch Spacing soft key, and enter the channel spacing.Step 12. Make the measurement by pressing the On/Off soft key. The detection method is
automatically changed to RMS Average. Solid vertical lines are drawn on the display to indicate the main channel. Dashed vertical lines define the adjacent channels. The MT8220A will display the measurement results in the message area.
Out-of-Band Spurious Emission MeasurementRequired Equipment
• MT8220A Handheld Spectrum Analyzer
• Test Port extension cable, Anritsu 15NNF50 - 1.5C
ProcedureStep 1. Using the test port extension cable, connect the signal source to the RF In test port
of the MT8220A.Step 2. Press the Freq key, select the Center Freq soft key, and enter the center frequency.Step 3. Press the Span key. Set the span wide enough to include the primary channel
bandwidth and upper and lower channel bandwidths.Step 4. Press the Amplitude key, then press the Reference Level soft key and set the refer-
ence level to -20 dBm.Step 5. Press the Auto Atten soft key set the attenuation to On.Step 6. Press the BW key and use the RBW and VBW soft keys to set the resolution band-
width to 3 kHz and the video bandwidth to 300 Hz.Step 7. Press the Marker key and press the Marker 1 2 3 4 5 6 soft key to select marker 1.
The underlined number indicates the active marker.Step 8. Press the On/Off soft key and use the arrow keys, the keypad and the knob to move
the marker over one of the spurs. Step 9. Compare the value of the marker to the specified allowable level of out-of-band
spurious emissions for the corresponding channel transmit frequency.
NOTE: Adjacent Channel Power Ratio is a constant measurement. Once it is turned on, it will remain on until it is turned off by pressing the On/Off soft key again.
3-40
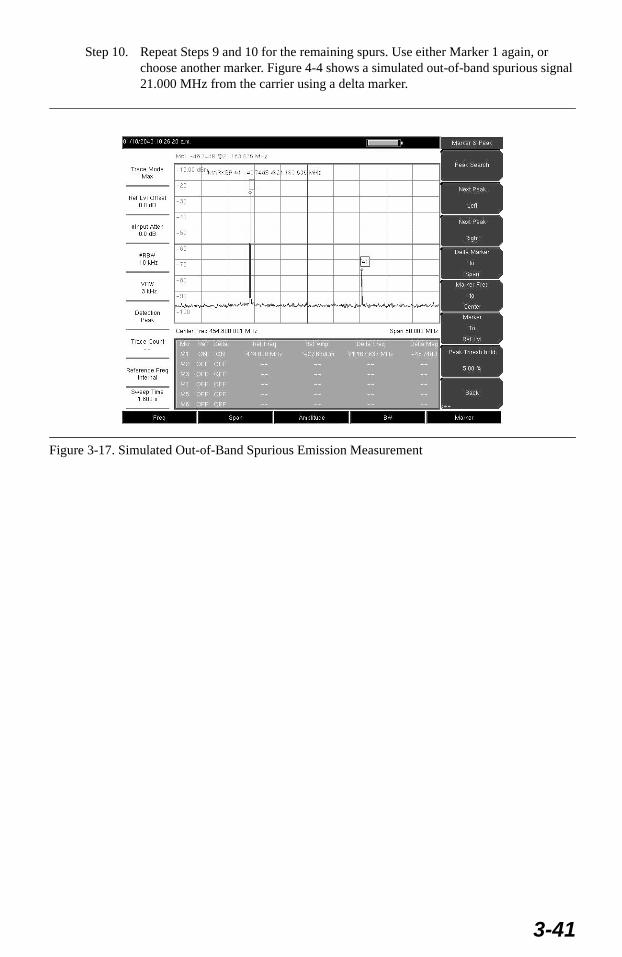
Step 10. Repeat Steps 9 and 10 for the remaining spurs. Use either Marker 1 again, or choose another marker. Figure 4-4 shows a simulated out-of-band spurious signal 21.000 MHz from the carrier using a delta marker.
Figure 3-17. Simulated Out-of-Band Spurious Emission Measurement
3-41
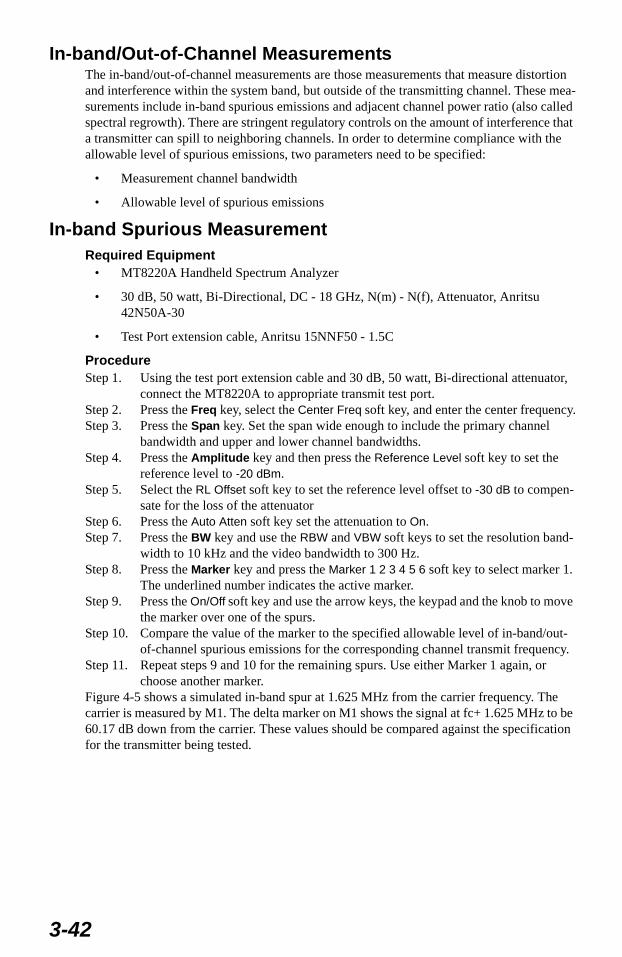
In-band/Out-of-Channel MeasurementsThe in-band/out-of-channel measurements are those measurements that measure distortion and interference within the system band, but outside of the transmitting channel. These mea-surements include in-band spurious emissions and adjacent channel power ratio (also called spectral regrowth). There are stringent regulatory controls on the amount of interference that a transmitter can spill to neighboring channels. In order to determine compliance with the allowable level of spurious emissions, two parameters need to be specified:
• Measurement channel bandwidth
• Allowable level of spurious emissions
In-band Spurious MeasurementRequired Equipment
• MT8220A Handheld Spectrum Analyzer
• 30 dB, 50 watt, Bi-Directional, DC - 18 GHz, N(m) - N(f), Attenuator, Anritsu 42N50A-30
• Test Port extension cable, Anritsu 15NNF50 - 1.5C
ProcedureStep 1. Using the test port extension cable and 30 dB, 50 watt, Bi-directional attenuator,
connect the MT8220A to appropriate transmit test port.Step 2. Press the Freq key, select the Center Freq soft key, and enter the center frequency.Step 3. Press the Span key. Set the span wide enough to include the primary channel
bandwidth and upper and lower channel bandwidths.Step 4. Press the Amplitude key and then press the Reference Level soft key to set the
reference level to -20 dBm.Step 5. Select the RL Offset soft key to set the reference level offset to -30 dB to compen-
sate for the loss of the attenuator Step 6. Press the Auto Atten soft key set the attenuation to On.Step 7. Press the BW key and use the RBW and VBW soft keys to set the resolution band-
width to 10 kHz and the video bandwidth to 300 Hz.Step 8. Press the Marker key and press the Marker 1 2 3 4 5 6 soft key to select marker 1.
The underlined number indicates the active marker.Step 9. Press the On/Off soft key and use the arrow keys, the keypad and the knob to move
the marker over one of the spurs. Step 10. Compare the value of the marker to the specified allowable level of in-band/out-
of-channel spurious emissions for the corresponding channel transmit frequency.Step 11. Repeat steps 9 and 10 for the remaining spurs. Use either Marker 1 again, or
choose another marker. Figure 4-5 shows a simulated in-band spur at 1.625 MHz from the carrier frequency. The carrier is measured by M1. The delta marker on M1 shows the signal at fc+ 1.625 MHz to be 60.17 dB down from the carrier. These values should be compared against the specification for the transmitter being tested.
3-42
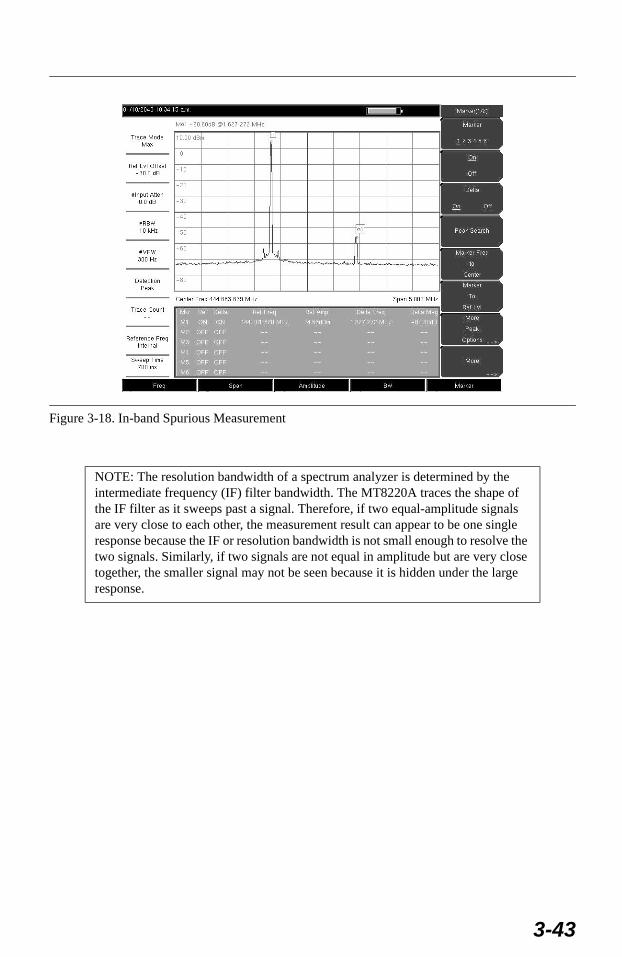
Figure 3-18. In-band Spurious Measurement
NOTE: The resolution bandwidth of a spectrum analyzer is determined by the intermediate frequency (IF) filter bandwidth. The MT8220A traces the shape of the IF filter as it sweeps past a signal. Therefore, if two equal-amplitude signals are very close to each other, the measurement result can appear to be one single response because the IF or resolution bandwidth is not small enough to resolve the two signals. Similarly, if two signals are not equal in amplitude but are very close together, the smaller signal may not be seen because it is hidden under the large response.
3-43
Field StrengthRequired Equipment
• MT8220A Handheld Spectrum Analyzer
• Portable Antenna for which antenna factors or antenna gain and bandwidth data are available.
ProcedureStep 1. Press the Shift key then the Measure key and press the Field Strength soft key.Step 2. Press the Antenna soft key and use the Up/Down arrow keys or the rotary knob to
select the desired antenna. Press the Enter key to select.
Step 3. Connect the antenna to the MT8220A.Step 4. Press the Freq key, select the Center Freq soft key, and enter the center frequency.Step 5. Press the Span key. Set the span wide enough to include the primary channel
bandwidth and upper and lower channel bandwidths.Step 6. Press the BW key and verify that RBW Auto and VBW Auto are On.Step 7. To change the units of measurement, press the Amplitude hard key, then press the
Units soft key and select dBm, dBV, dBmV or dBµV. Step 8. Select either the Volts or Watts soft key, as required. The MT8220A automatically
adjusts the measurement by the antenna factors selected. Marker values will be displayed in the same units as selected for the amplitude.
Antenna CalculationsThe following is a list of various antenna calculations should you find it necessary to convert from one to another:
Conversion of signal levels from W to V in a 50 ohm system:
P=V2/R
where:
P = power in WattsV = voltage level in VoltsR = resistance in Ohms
Note that 1 mW = 10-3 W and 1µV = 10-6V.
For power in dBm, and voltage in dB(µV).
VdB(µV) = P (dBm) + 107 dB
Power density to field strength. An alternate measure of field strength to electric field is power density:
Pd=E2/120π
where:
E = field strength in V/mP = Power density in W/m
NOTE: Select an antenna from the standard list available in the MT8220A, or use the Antenna Editor feature of Anritsu Master Software Tools (see Chapter 9) to define a custom antenna and upload the antenna information to the MT8220A antenna list.
3-44
Power density at a point:
Pd=PtGt/(4 πr2)
In the far field, where electric and magnetic fields are related by the impedance of free space:
Where Pd = power density in W/mPt= power transmitted in Watts
Gr = gain of transmitting antennar = distance from the antenna in meters
AM/FM/SSB DemodulationThe UMTS Master built-in demodulator for AM, narrowband FM, wideband FM and single sideband (selectable USB and LSB) allows a technician to hear an interfering signal to ease identification. The demodulated signal can be heard using either the built-in speaker, or through a monaural headset connected to the 2.5-mm jack on the test panel.
Demodulation ProcedureStep 1. Press the Shift key followed by the Measure (4) key and the AM/FM Demod soft
key.Step 2. Press the Demod Type soft key and select FM Wide Band, FM Narrow Band, AM,
USB, or LSB to match the modulation format of the signal.Step 3. Press the Back soft key.Step 4. Press the Demod Freq soft key and use the keypad or rotary knob to enter the cen-
ter frequency of the signal to be demodulated. For USB and LSB signals, fine tune the signal by adjusting the Beat Freq Osc. By default the BFO frequency is set to zero, meaning that the re-injected carrier is exactly at the demodulation frequency. The Beat Freq Osc soft key allows adjustment of the beat frequency oscillator to fine tune the signal through a span of ±10000 Hz.
Step 5. Press the On/Off soft key to enable the measurement. Step 6. Press the Volume soft key and use the Up/Down arrow keys or rotary knob to
change the audio volume from 0% to 100%. For most headsets a volume of 40% is adequate.
Step 7. The Demod Time soft key sets the time the UMTS Master will demodulate the sig-nal. Enter a value from 100 ms to 500 seconds.
Carrier to Interference Ratio MeasurementCarrier to Interference Ratio (C/I) Measurement is a two-step process, first measuring the carrier level and then, with the carrier turned off, measuring the remaining signals and noise in the band of interest. After the two measurements are complete, the ratio of the carrier level to the noise plus interference is displayed using three assumptions:
• The interferer is a narrowband frequency hopping signal (NB FHSS)
• The interferer is a wideband frequency hopping signal (WB FHSS)
• The interferer is a broadband signal (BB).
The primary application for this type of measurement is determining the magnitude of inter-ference problems for 802.11b, 802.11g and 802.11a access points (hot spots).
ProcedureStep 1. Press the Frequency key followed by the Signal Standard soft key. Select the
appropriate signal standard based on the signal to be measured and press Enter.Step 2. Press the Select Channel soft key, select the operating channel of the access point
being measured and press Enter.
3-45
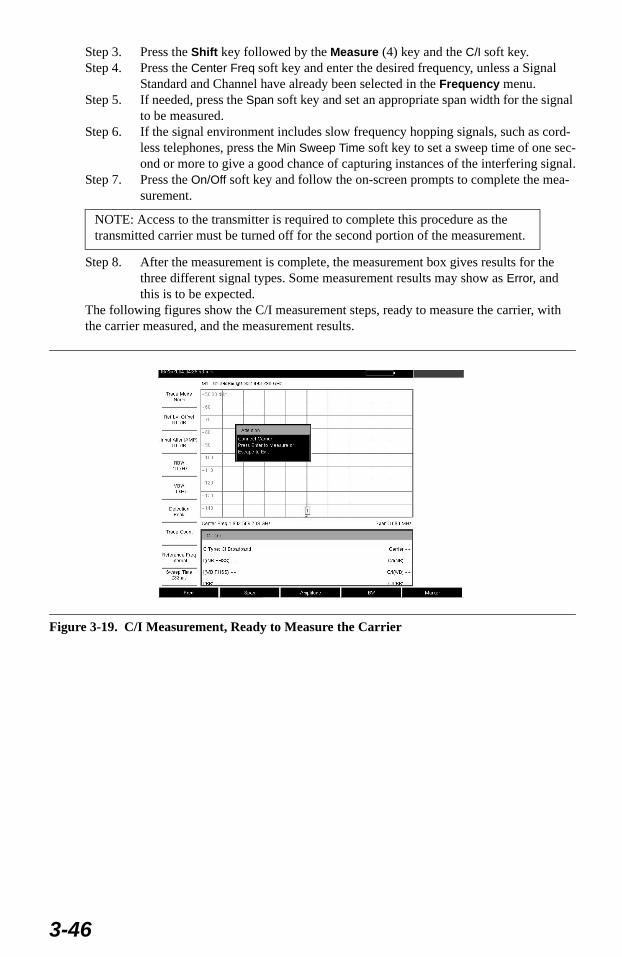
Step 3. Press the Shift key followed by the Measure (4) key and the C/I soft key.Step 4. Press the Center Freq soft key and enter the desired frequency, unless a Signal
Standard and Channel have already been selected in the Frequency menu.Step 5. If needed, press the Span soft key and set an appropriate span width for the signal
to be measured.Step 6. If the signal environment includes slow frequency hopping signals, such as cord-
less telephones, press the Min Sweep Time soft key to set a sweep time of one sec-ond or more to give a good chance of capturing instances of the interfering signal.
Step 7. Press the On/Off soft key and follow the on-screen prompts to complete the mea-surement.
Step 8. After the measurement is complete, the measurement box gives results for the three different signal types. Some measurement results may show as Error, and this is to be expected.
The following figures show the C/I measurement steps, ready to measure the carrier, with the carrier measured, and the measurement results.
NOTE: Access to the transmitter is required to complete this procedure as the transmitted carrier must be turned off for the second portion of the measurement.
Figure 3-19. C/I Measurement, Ready to Measure the Carrier
3-46
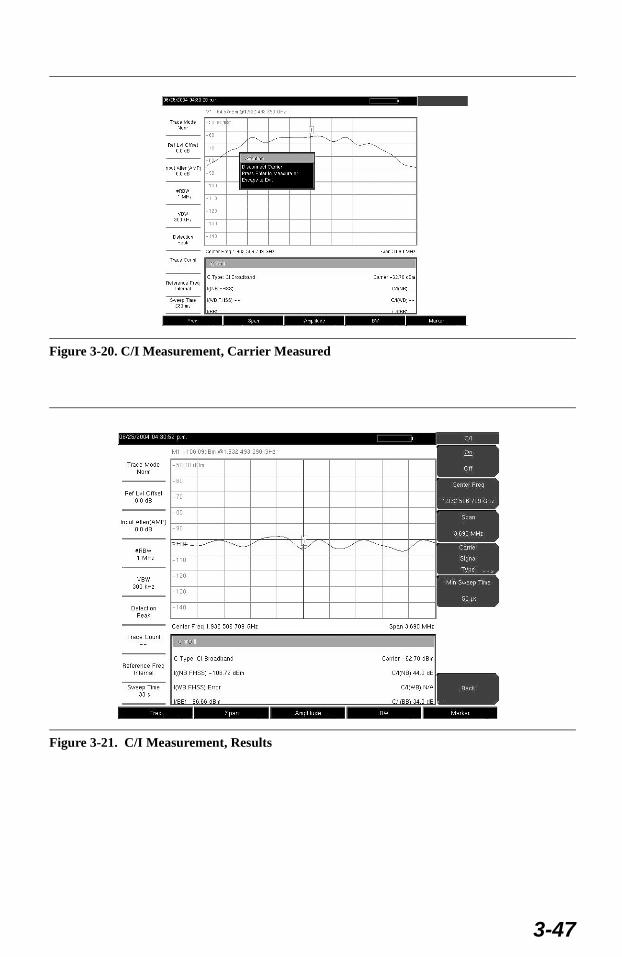
Figure 3-20. C/I Measurement, Carrier Measured
Figure 3-21. C/I Measurement, Results
3-47

3-48
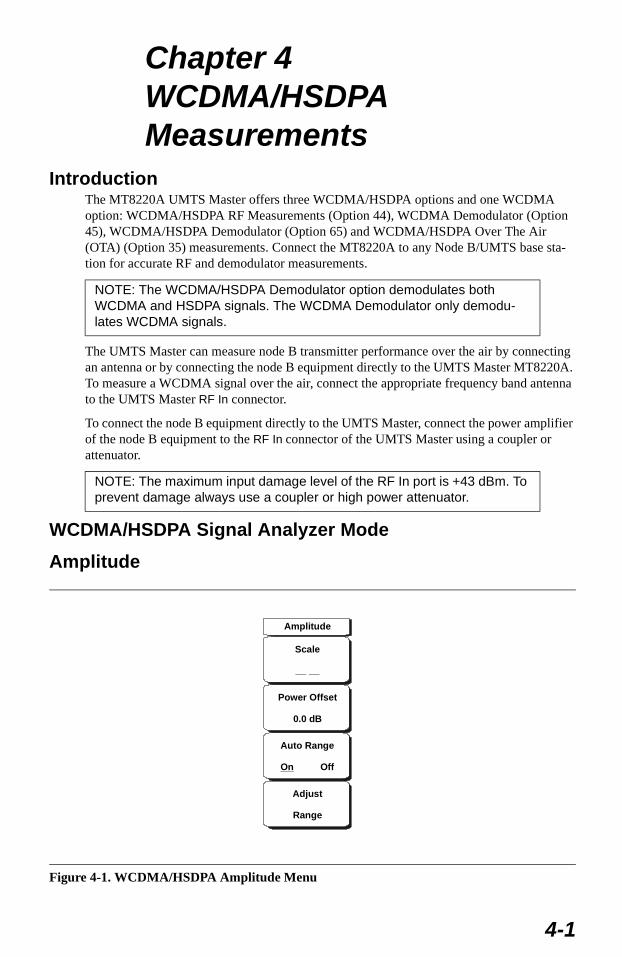
Chapter 4WCDMA/HSDPAMeasurements
IntroductionThe MT8220A UMTS Master offers three WCDMA/HSDPA options and one WCDMA option: WCDMA/HSDPA RF Measurements (Option 44), WCDMA Demodulator (Option 45), WCDMA/HSDPA Demodulator (Option 65) and WCDMA/HSDPA Over The Air (OTA) (Option 35) measurements. Connect the MT8220A to any Node B/UMTS base sta-tion for accurate RF and demodulator measurements.
The UMTS Master can measure node B transmitter performance over the air by connecting an antenna or by connecting the node B equipment directly to the UMTS Master MT8220A. To measure a WCDMA signal over the air, connect the appropriate frequency band antenna to the UMTS Master RF In connector.
To connect the node B equipment directly to the UMTS Master, connect the power amplifier of the node B equipment to the RF In connector of the UMTS Master using a coupler or attenuator.
WCDMA/HSDPA Signal Analyzer Mode
Amplitude
NOTE: The WCDMA/HSDPA Demodulator option demodulates both WCDMA and HSDPA signals. The WCDMA Demodulator only demodu-lates WCDMA signals.
NOTE: The maximum input damage level of the RF In port is +43 dBm. To prevent damage always use a coupler or high power attenuator.
Figure 4-1. WCDMA/HSDPA Amplitude Menu
Amplitude
Scale
__ __
Power Offset
0.0 dB
Auto Range
OffOn
Adjust
Range
4-1

ScaleThe scale can be set in 1 dB steps from 1 dB per division to 15 dB per division. The value can be changed using the keypad, the rotary knob or the Up/Down arrow keys.
Power Offset Choose power offset to have the UMTS Master automatically adjust for the loss through any external cables, attenuators and couplers. The power can be offset from 0-100 dB. Press the Power Offset key, enter the values and press the dB softkey.
Auto RangeAdjusts the reference level automatically when Auto Range is activated. Toggles between On and Off.
Adjust RangeAdjust the range adjusts the reference level to be optimal based on the measured signal.
4-2
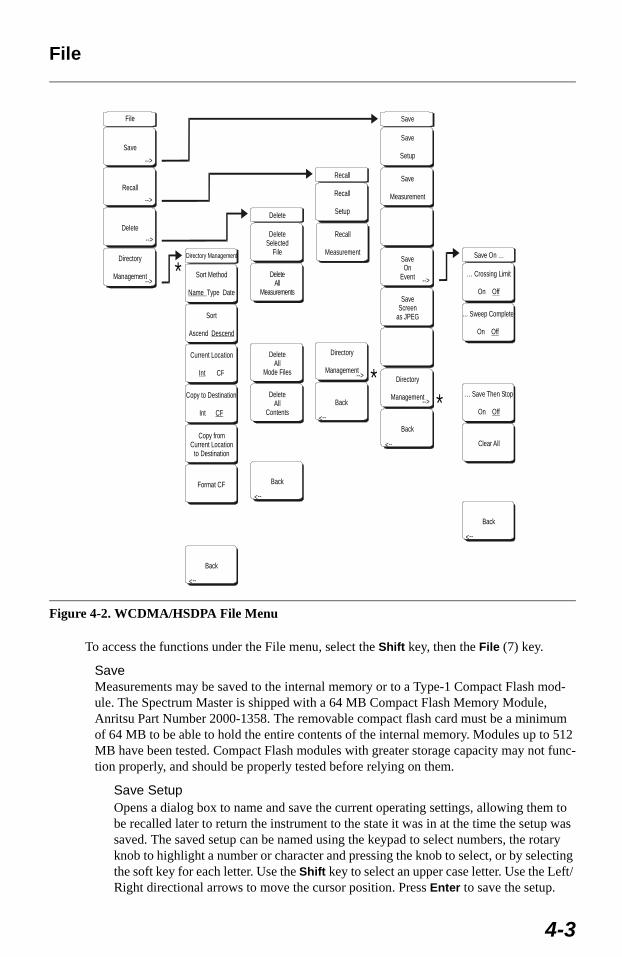
File
To access the functions under the File menu, select the Shift key, then the File (7) key.
SaveMeasurements may be saved to the internal memory or to a Type-1 Compact Flash mod-ule. The Spectrum Master is shipped with a 64 MB Compact Flash Memory Module, Anritsu Part Number 2000-1358. The removable compact flash card must be a minimum of 64 MB to be able to hold the entire contents of the internal memory. Modules up to 512 MB have been tested. Compact Flash modules with greater storage capacity may not func-tion properly, and should be properly tested before relying on them.
Save SetupOpens a dialog box to name and save the current operating settings, allowing them to be recalled later to return the instrument to the state it was in at the time the setup was saved. The saved setup can be named using the keypad to select numbers, the rotary knob to highlight a number or character and pressing the knob to select, or by selecting the soft key for each letter. Use the Shift key to select an upper case letter. Use the Left/ Right directional arrows to move the cursor position. Press Enter to save the setup.
Figure 4-2. WCDMA/HSDPA File Menu
File
Save
Recall
Recall
-->
-->
Back
Back
Back
-->
-->
-->
Back
-->
Save
Save
Setup
Sort Method
Type DateName
Save
Measurement
Sort
Ascend Descend
Current Location
CFInt
Format CF
Copy to Destination
Int CF
Copy fromCurrent Location
to Destination
SaveOn
Event
Directory
Management
Directory
Management
Directory
Management
SaveScreen
as JPEG
DeleteSelected
File
DeleteAll
Measurements
DeleteAll
Mode Files
DeleteAll
Contents
-->
-->
-->
-->
-->
Delete
Delete
Back
-->
… Crossing Limit
On Off
… Sweep Complete
On Off
… Save Then Stop
On Off
Clear All
Save On …
Recall
Setup
Recall
MeasurementDirectory Management
*
*
*
4-3
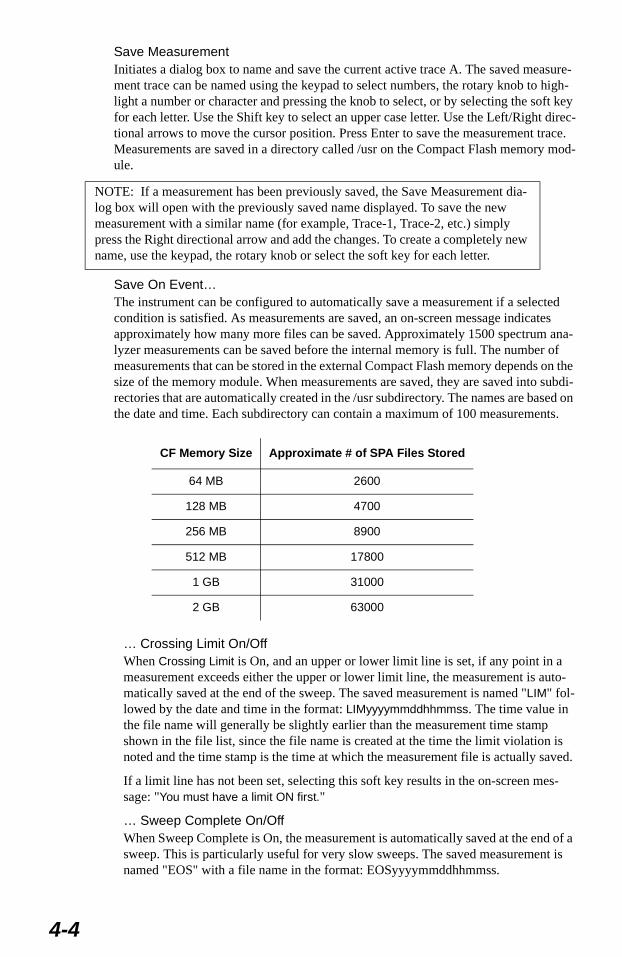
Save MeasurementInitiates a dialog box to name and save the current active trace A. The saved measure-ment trace can be named using the keypad to select numbers, the rotary knob to high-light a number or character and pressing the knob to select, or by selecting the soft key for each letter. Use the Shift key to select an upper case letter. Use the Left/Right direc-tional arrows to move the cursor position. Press Enter to save the measurement trace. Measurements are saved in a directory called /usr on the Compact Flash memory mod-ule.
Save On Event…The instrument can be configured to automatically save a measurement if a selected condition is satisfied. As measurements are saved, an on-screen message indicates approximately how many more files can be saved. Approximately 1500 spectrum ana-lyzer measurements can be saved before the internal memory is full. The number of measurements that can be stored in the external Compact Flash memory depends on the size of the memory module. When measurements are saved, they are saved into subdi-rectories that are automatically created in the /usr subdirectory. The names are based on the date and time. Each subdirectory can contain a maximum of 100 measurements.
… Crossing Limit On/OffWhen Crossing Limit is On, and an upper or lower limit line is set, if any point in a measurement exceeds either the upper or lower limit line, the measurement is auto-matically saved at the end of the sweep. The saved measurement is named "LIM" fol-lowed by the date and time in the format: LIMyyyymmddhhmmss. The time value in the file name will generally be slightly earlier than the measurement time stamp shown in the file list, since the file name is created at the time the limit violation is noted and the time stamp is the time at which the measurement file is actually saved.
If a limit line has not been set, selecting this soft key results in the on-screen mes-sage: "You must have a limit ON first."
… Sweep Complete On/OffWhen Sweep Complete is On, the measurement is automatically saved at the end of a sweep. This is particularly useful for very slow sweeps. The saved measurement is named "EOS" with a file name in the format: EOSyyyymmddhhmmss.
NOTE: If a measurement has been previously saved, the Save Measurement dia-log box will open with the previously saved name displayed. To save the new measurement with a similar name (for example, Trace-1, Trace-2, etc.) simply press the Right directional arrow and add the changes. To create a completely new name, use the keypad, the rotary knob or select the soft key for each letter.
CF Memory Size Approximate # of SPA Files Stored
64 MB 2600
128 MB 4700
256 MB 8900
512 MB 17800
1 GB 31000
2 GB 63000
4-4
Save Then Stop On/OffWhen the Save Then Stop soft key is set to On, the instrument will save just one measurement when the Crossing Limit or Sweep Complete soft keys are set to On, and the qualifying event occurs. Sweeping stops after a measurement is saved. If it is set to Off, sweeping continues after a measurement is saved and more measurements may be saved. The default for this selection is Off.
Clear AllPressing this soft key turns off both save on event conditions and sets Save then Stop to Off, the default state.
BackReturns to the top-level file menu.
Save Screen as JPEGThis function saves a measurement trace as a graphics file. The saved measurement can be named using the keypad to select numbers, the rotary knob to highlight a number or character and pressing the knob to select, or by selecting the soft key for each letter. Use the Shift key to select an upper case letter. Use the Left/Right directional arrows to move the cursor position. Press Enter to save the measurement after entering the file name. The file is saved in the internal memory with the specified name, with .jpg appended.
Directory ManagementSort Method Name Type DateFile lists can be sorted by the name of the file, the type of file (SPA file, STP file, etc.) or by the date that the file was saved.
Sort Ascending DescendingSelects whether the selected sort is sorted from lowest to highest (ascending) or highest to lowest (descending). When sorting by name, the sort will place file names that start with numbers before file names that start with letters (an ASCII sort).
Current Location Int CFThis choice lets you select where measurements and setups will be saved. Pressing the soft key toggles between storing files on the internal memory or a Compact Flash memory module. The "current location" and the "copy to destination" will never be the same. Changing the current location to save files causes the "copy to destination" to be automatically changed if the selected storage location is the same as the selected cur-rent location.
Copy to Destination Int CFThis choice lets you select where measurements and setups in the "current location" will be copied. The "current location" and the "copy to destination" may not be the same. If you change the destination to which the instrument will copy files, the current
NOTE: If a measurement has been previously saved, the Save Measurement dia-log box will open with the previously saved name displayed. To save the new measurement with a similar name (for example, Trace-1, Trace-2, etc.) simply press the Right directional arrow and add the changes. To create a completely new name, use the keypad, the rotary knob or select the soft key for each letter.
4-5
location is automatically changed if the current location is the same as the selected copy to destination..
Copy From Current Location To DestinationPressing this soft key causes all measurements, setups and jpg files stored in the user selected "current location" to be copied to the "copy to destination". If no storage mod-ule installed in the instrument an error message is displayed.
Format CFThis selection erases all files on an installed Compact Flash module. A message is dis-played warning that all files will be erased. Press Enter to confirm that you want to erase and Esc to quit without erasing. In addition to erasing all files stored on the Com-pact Flash, the /usr directory is created for storage of measurements, setups and jpg files.
BackThe Back key returns to the previous menu.
RecallRecall SetupThis soft key brings up a selection box that allows selection and recall of a previously stored instrument setup in the current storage location. Use the rotary knob or the Up/Down arrow keys to highlight the saved setup, and press Enter, the rotary knob, or the Recall soft key to select. All current instrument settings are replaced by the stored setup information. Press the Esc key to cancel the recall.
Recall MeasurementBrings up a selection box that allows recall of a previously stored measurement trace from the currently selected storage location. Use the rotary knob or the Up/Down arrow keys to highlight the saved measurement trace, and press Enter, the rotary knob, or the Recall soft key to select. A recalled trace may be displayed as trace A, in place of the live trace, or as trace B or C along with the live trace. Use the rotary knob or the Up/Down arrow keys to highlight the recalled trace option, and press the Enter key to select. Press the Esc key to cancel the recall.
To remove a recalled measurement trace from the screen, select the Shift key and the Trace (5) key to open the Trace menu. Use the Trace soft key to select the trace to be removed from the screen and use the View/Blank soft key to view or blank the trace. Use the Trace key to select an active trace after blanking a recalled trace.
Directory Management 'See page 4-5.
BackReturns to the previous menu.
4-6
DeleteBrings up a selection box that shows all stored setups and traces in the currently selected location (see Directory Management, page 4-5). The list shows the setup and measurement names, the type (stp for a saved setup, spa for a saved trace, jpg for a JPEG file) and the date and time the information was saved. Use the rotary knob or the Up/Down arrow keys to highlight the file to be deleted, and press Enter, or the Delete soft key to delete. Press the Esc key to cancel the operation. Note that there is no mechanism to retrieve deleted files.
Delete Selected FileUse the up and down arrow buttons or the rotary knob to select the file that is to be deleted. Press Enter to confirm that you want to delete the file or Esc to exit without deleting.
Delete ALL MeasurementsDeletes all measurements of the current mode in the currently selected storage location. The memory from which measurements will be deleted is set in the Directory Manage-ment menu and is the Current Location.
Delete ALL Mode FilesDeletes all measurements of the type saved in the current operating mode of the instru-ment. In addition all jpg and setup files (regardless of the mode) are deleted.
Delete ALL ContentsDeletes all measurements, jpg files and setup files of ALL measurement types.
BackThe Back key returns to the previous menu.
PrintThe Print key can be used to save a measurement trace as a graphics file. This file can then be downloaded to a PC using Master Software Tools and printed.
Save Screen as JPEGThis function saves a measurement trace as a graphics file. The saved measurement can be named using the keypad to select numbers, the rotary knob to highlight a number or character and pressing the knob to select, or by selecting the soft key for each letter. Use the Shift key to select an upper case letter. Use the Left/Right directional arrows to move the cursor position. Press Enter to save the measurement after entering the file name. The file is saved in the internal memory with the specified name, with .jpg appended.
Save On EventNot applicable in WCDMA/HSDPA Signal Analyzer Mode.
4-7
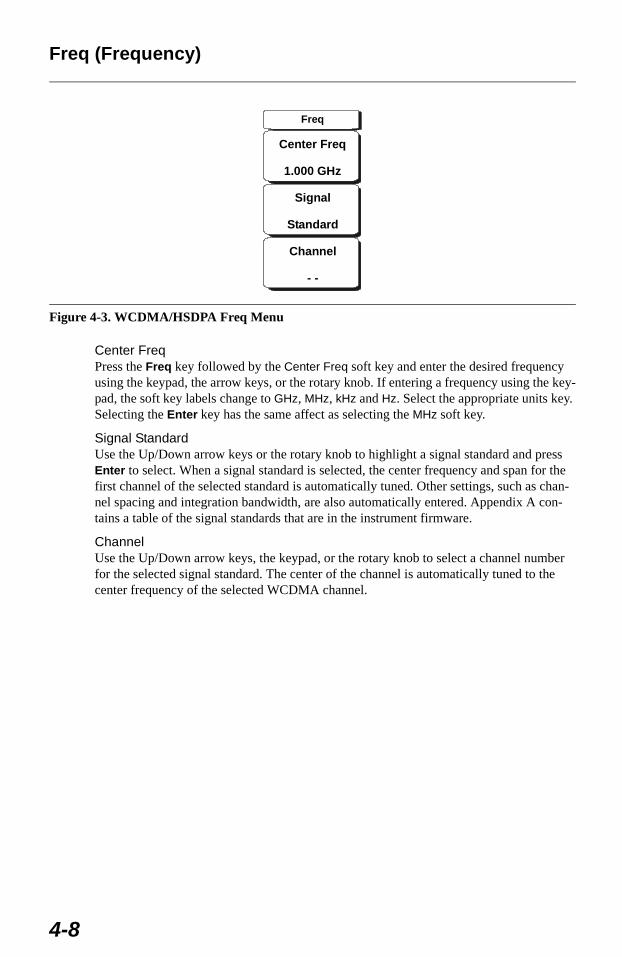
Freq (Frequency)
Center FreqPress the Freq key followed by the Center Freq soft key and enter the desired frequency using the keypad, the arrow keys, or the rotary knob. If entering a frequency using the key-pad, the soft key labels change to GHz, MHz, kHz and Hz. Select the appropriate units key. Selecting the Enter key has the same affect as selecting the MHz soft key.
Signal StandardUse the Up/Down arrow keys or the rotary knob to highlight a signal standard and press Enter to select. When a signal standard is selected, the center frequency and span for the first channel of the selected standard is automatically tuned. Other settings, such as chan-nel spacing and integration bandwidth, are also automatically entered. Appendix A con-tains a table of the signal standards that are in the instrument firmware.
ChannelUse the Up/Down arrow keys, the keypad, or the rotary knob to select a channel number for the selected signal standard. The center of the channel is automatically tuned to the center frequency of the selected WCDMA channel.
Figure 4-3. WCDMA/HSDPA Freq Menu
Freq
Center Freq
1.000 GHz
Signal
Standard
Channel
- -
4-8
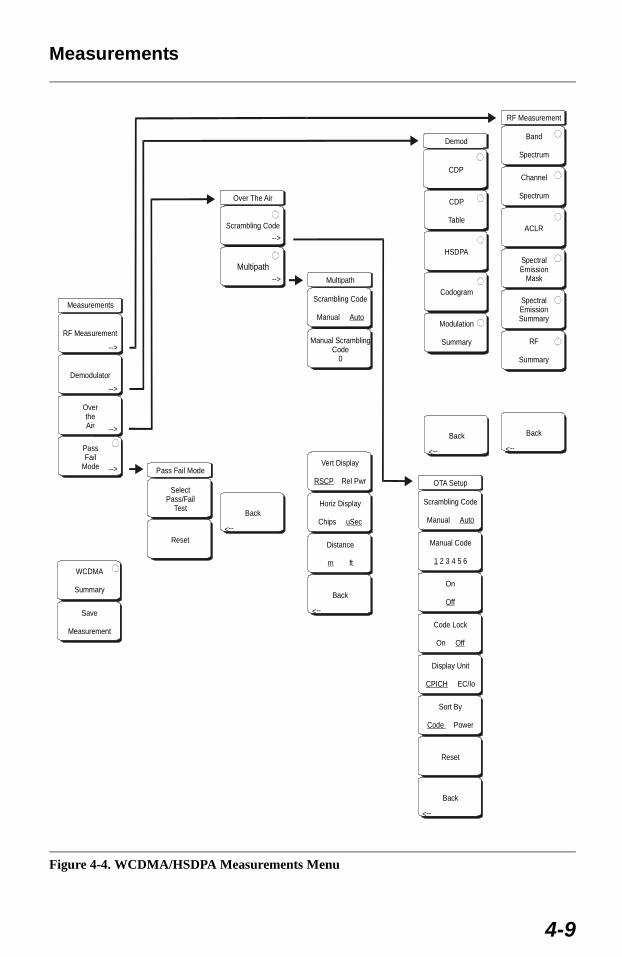
Measurements
Figure 4-4. WCDMA/HSDPA Measurements Menu
OTA Setup
Sort By
PowerCode
Reset
Back
Scrambling Code
Manual Auto
Manual Code
2 3 4 5 61
On
Off
Code Lock
On Off
Display Unit
EC/IoCPICH
-->
Multipath
Horiz Display
Chips uSec
Distance
ftm
Back
Scrambling Code
Manual Auto
Manual ScramblingCode
0
Vert Display
Rel PwrRSCP
-->
WCDMA
Summary
Save
Measurement
Measurements
RF Measurement
Demodulator
OvertheAir
PassFail
Mode
-->
-->
RF Measurement
RF
Summary
BackBack
Band
Spectrum
Channel
Spectrum
ACLR
SpectralEmission
Mask
SpectralEmissionSummary
-->-->
Demod
Pass Fail Mode
CDP
CDP
Table
SelectPass/Fail
Test
HSDPA
Reset
Codogram
Modulation
Summary
Over The Air
Back
Scrambling Code
Multipath
-->
-->
-->
-->
-->
4-9
RF Measurement Opens the RF measurement menu.
Band SpectrumDisplays the spectrum of the selected band.
Ref LevelSets the required reference level.
Scale Change the scale.
Band ChannelUse the cursor to select the required channel and the unit analyzes the selected chan-nel signal.
Previous BandThe unit automatically selects the previous band.
Next BandThe unit automatically selects the next band.
BackReturns to the previous menu.
Channel SpectrumDisplays the spectrum of the selected channel. The screen also displays Channel Power in dBm and watts, Peak to Average power and Occupied Bandwidth.
ACLRDisplays the Adjacent Channel Leakage Ratio (ACLR). The user can set the main channels and adjacent channels from 1-4 channels. This screen can display up to 12 channels total.
Display TraceSelect ON to display the trace.
Select # of Main ChannelsSet the main channels from 1-4 channels.
Select # of Adjacent ChannelsSet the adjacent channels from 1-4 channels.
Channel WidthChange the WCDMA Channel width setting by pressing More in the setup menu and selecting the Channel Width soft key. Enter the desired value and press the Enter soft key. Use the Up/Down arrow keys, or the rotary knob to to set the desired value and press the Enter soft key. The default value is 5 MHz.
Spectral Emission MaskDisplays the received signal and the mask based on received signal strength.
Spectral Emission SummaryDisplays the spectral emission mask in table format and whether the received signal passed in each frequency range.
RF Summary Displays the RF measurements in table form.
Back Returns to the previous menu.
4-10
DemodulatorUMTS Master in demodulator mode demodulates the received WCDMA signal. The demodulator has three displays, CDP, Codogram and Modulation Summary.
CDPWhen Code Domain Power (CDP) is selected the screen displays all the selected OVSF codes and selected OVSF zoom codes in the graphical format. The display also dis-plays P-CPICH Abs power, EVM, Carrier Frequency, Channel Power, Carrier Feedthrough, Frequency Error in Hz and PPM, Noise Floor and Peak CD Error. The screen also displays CPICH, P-CCPCH, S-CCPCH, PICH, P-SCH and S-SCH powers in the table format. If the marker is set on the code, the marker will display the code number, power and Symbol EVM.
ZoomSelect a zoom function of 32, 64 or 128 codes.
Zoom Start Enter the required zoom start code. For example, to start at code 2, enter 2.
CDP TableWhen Code Domain Power Table (CDP Table) is selected, the screen displays a list of all the active OVSF codes in a tabular format. The display show the Spreading Factor, Code Number, Status, EVM, Modulation type, Relative Power in dB, and Absolute Power in dBm for each active OVSF code. Use the rotary knob to scroll up and down the CDP Table when there are more codes then a single page can display.
HSDPA When HSDPA is selected the screen displays all the selected OVSF including high speed data channel codes and selected OVSF with high speed codes in the graphical format. The selected code Power versus time and Constellation diagram will be dis-played. The display also displays P-CPICH Abs power, EVM, Carrier Frequency, Channel Power, Carrier Feedthrough, Frequency Error in Hz and PPM, Noise Floor and Peak CD Error. The screen also displays CPICH, P-CCPCH, S-CCPCH, PICH, P-SCH and S-SCH powers in the table format.
Next Active Code LeftSelect the next active code left.
Next Active Code RightSelect the right side active code.
Total TimeSet the time for the power versus time screen. The maximum total time is 72 hours.
Single Sweep TimeSet the single sweep time. The unit automatically calculates the total time.
IQ PersistenceSet the number of samples before displaying the screen (maximum 48).
NOTE: For the WCDMA/HSDPA demodulator option, the CDP screen dis-plays HSDPA and WCDMA signals. P-CPICH Abs power, EVM, Carrier Frequency, Channel Power, Carrier Feedthrough, Frequency Error in Hz and PPM, Noise Floor and Peak CD Error are also displayed. The screen displays CPICH, P-CCPCH, S-CCPCH, PICH, P-SCH and S-SCH powers in the table format. If the marker is set on the code, the marker will display the code number, power and Symbol EVM.
4-11
BackReturns to the previous menu.
CodogramWhen Codogram is selected the screen displays the changes in code power levels over time. Two graphs are displayed on the screen, the top one displays all the selected OVSF codes and the bottom one displays the selected OVSF zoom codes.
ZoomSelect a zoom function of 32, 64 or 128 codes.
Zoom Start Enter the required zoom start code. For example, to start at code 2, enter 2.
Total TimeUse the keypad, the Up/Down arrow keys, or the rotary knob to enter the total time to display the changes in code power levels. The maximum total time for Codogram is 72 hours.
Single Sweep TimeSingle sweep time is related to total time. Use the keypad, the Up/Down arrow keys, or the rotary knob to set the single sweep time.
Modulation SummaryDisplays the demodulation parameters in the table format.
Back Returns to the previous menu.
Over the AirScrambling CodeDisplays the WCDMA Over The Air Measurements, six scrambling codes, CPICH, Ec/Io, Ec, Pilot Dominance and OTA total power.
Scrambling CodeSet the scrambling codes manually or auto.
Manual CodeSet the manual codes manually.
On/OffSwitch On/Off the manual codes.
Code LockLock the measured codes.
Display UnitDisplay the codes by CPICH or Ec/Io.
Sort BySort the measured codes by code numbers or power.
ResetReset the measurement screen.
BackReturns to the previous menu.
4-12
MultipathDisplays up to 6 multi-path components of the Strongest Scrambling Code, measuring Tau in Sec, Tau in Chips, Distance in feet or meters, Received Signal Code Power (RSCP), Relative Power.
Scrambling CodeSet the scrambling codes manually or auto.
Manual CodeSet the manual codes manually.
On/OffTurns Multipath on or off.
Vertical DisplaySet vertical scale to RSCP (Absolute Power) or Relative Power
Horizontal DisplaySet Horizontal scale to Chips or Sec.
DistanceSet distance units to meters or feet.
Back Returns to the previous menu.
Pass/Fail ModeThe UMTS Master saves the five test model conditions specified in the 3GPP specification to test the base station. After the selected test model, the unit displays whether the base sta-tion passed or failed the test. Using Master Software Tools, a custom test list can be created and downloaded into the unit. All critical measurements can be selected for pass fail test-ing including each individual code power, spreading factor and symbol EVM. The results are displayed in table format with clear identification of pass/fail results including min/max thresholds and measured results.
Select Pass/Fail TestSelect the parameters file from the list.
Reset Restart the measurement.
BackReturns to the previous menu
WCDMA SummaryDisplays the critical WCDMA measurements in a table format.
Save MeasurementInitiates a dialog box to name and save the current measurement. The saved measurement can be named using the keypad to select numbers, the rotary knob to highlight a number or character and pressing the knob to select, or by selecting the soft key for each letter. Use the Shift key to select an upper case letter. Use the Left/Right directional arrows to move the cursor position. Press Enter to save the measurement WCDMA measurements are saved with a .wcd extension.
4-13
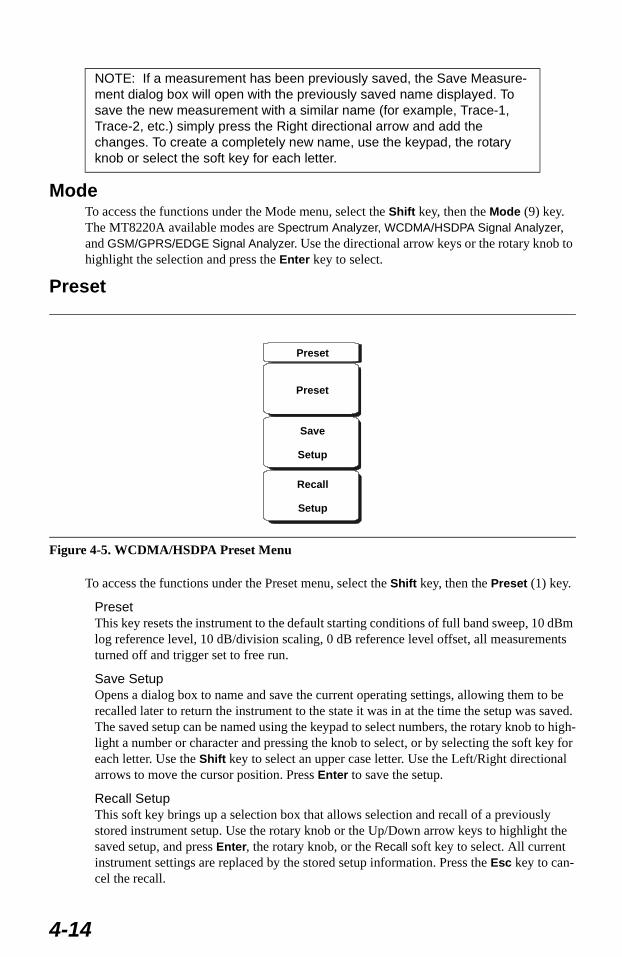
ModeTo access the functions under the Mode menu, select the Shift key, then the Mode (9) key. The MT8220A available modes are Spectrum Analyzer, WCDMA/HSDPA Signal Analyzer, and GSM/GPRS/EDGE Signal Analyzer. Use the directional arrow keys or the rotary knob to highlight the selection and press the Enter key to select.
Preset
To access the functions under the Preset menu, select the Shift key, then the Preset (1) key.
PresetThis key resets the instrument to the default starting conditions of full band sweep, 10 dBm log reference level, 10 dB/division scaling, 0 dB reference level offset, all measurements turned off and trigger set to free run.
Save SetupOpens a dialog box to name and save the current operating settings, allowing them to be recalled later to return the instrument to the state it was in at the time the setup was saved. The saved setup can be named using the keypad to select numbers, the rotary knob to high-light a number or character and pressing the knob to select, or by selecting the soft key for each letter. Use the Shift key to select an upper case letter. Use the Left/Right directional arrows to move the cursor position. Press Enter to save the setup.
Recall SetupThis soft key brings up a selection box that allows selection and recall of a previously stored instrument setup. Use the rotary knob or the Up/Down arrow keys to highlight the saved setup, and press Enter, the rotary knob, or the Recall soft key to select. All current instrument settings are replaced by the stored setup information. Press the Esc key to can-cel the recall.
NOTE: If a measurement has been previously saved, the Save Measure-ment dialog box will open with the previously saved name displayed. To save the new measurement with a similar name (for example, Trace-1, Trace-2, etc.) simply press the Right directional arrow and add the changes. To create a completely new name, use the keypad, the rotary knob or select the soft key for each letter.
Figure 4-5. WCDMA/HSDPA Preset Menu
Preset
Preset
Save
Setup
Recall
Setup
4-14
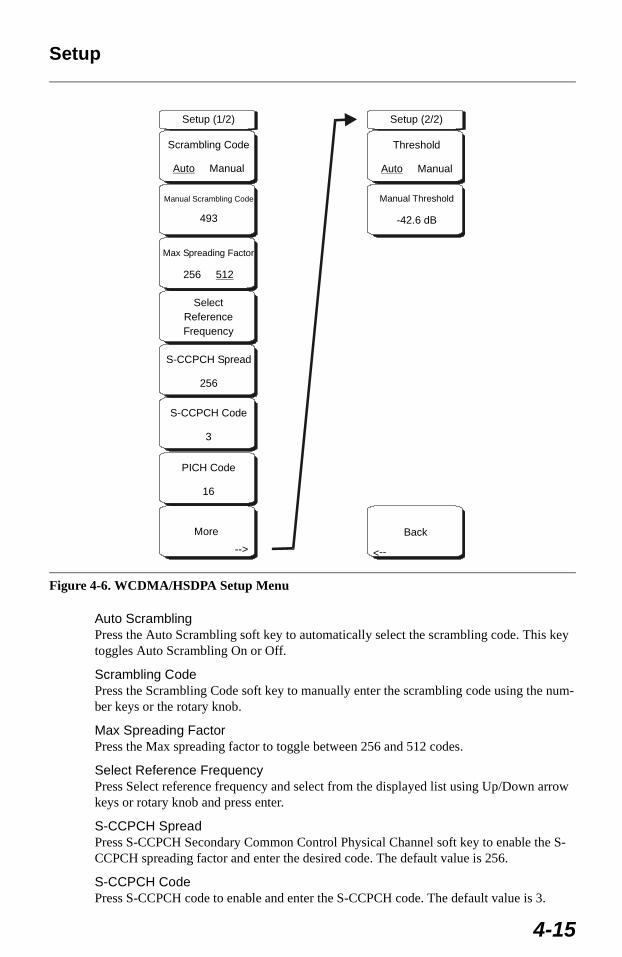
Setup
Auto ScramblingPress the Auto Scrambling soft key to automatically select the scrambling code. This key toggles Auto Scrambling On or Off.
Scrambling Code Press the Scrambling Code soft key to manually enter the scrambling code using the num-ber keys or the rotary knob.
Max Spreading FactorPress the Max spreading factor to toggle between 256 and 512 codes.
Select Reference Frequency Press Select reference frequency and select from the displayed list using Up/Down arrow keys or rotary knob and press enter.
S-CCPCH SpreadPress S-CCPCH Secondary Common Control Physical Channel soft key to enable the S-CCPCH spreading factor and enter the desired code. The default value is 256.
S-CCPCH CodePress S-CCPCH code to enable and enter the S-CCPCH code. The default value is 3.
Figure 4-6. WCDMA/HSDPA Setup Menu
Setup (1/2)
Scrambling Code
ManualAuto
Manual Scrambling Code
493
Max Spreading Factor
256 512
SelectReferenceFrequency
S-CCPCH Spread
256
S-CCPCH Code
3
PICH Code
16
Threshold
ManualAuto
Setup (2/2)
Manual Threshold
-42.6 dB
Back
-->
More
-->
4-15

PICH CodePress PICH to activate Paging Indicator Channel and enter the desired code. The default value is 16.
MoreOpens the second Setup menu (2/2).
Threshold Auto/ManualPress the Threshold Auto/Manual soft key to toggle from Auto to Manual.
Manual ThresholdChange the measurement threshold by pressing More in the setup menu and then press-ing the threshold then press the Manual threshold soft key and enter the desired value, and then press enter soft key. The default value is -30 dB.
BackReturns to the previous menu
4-16
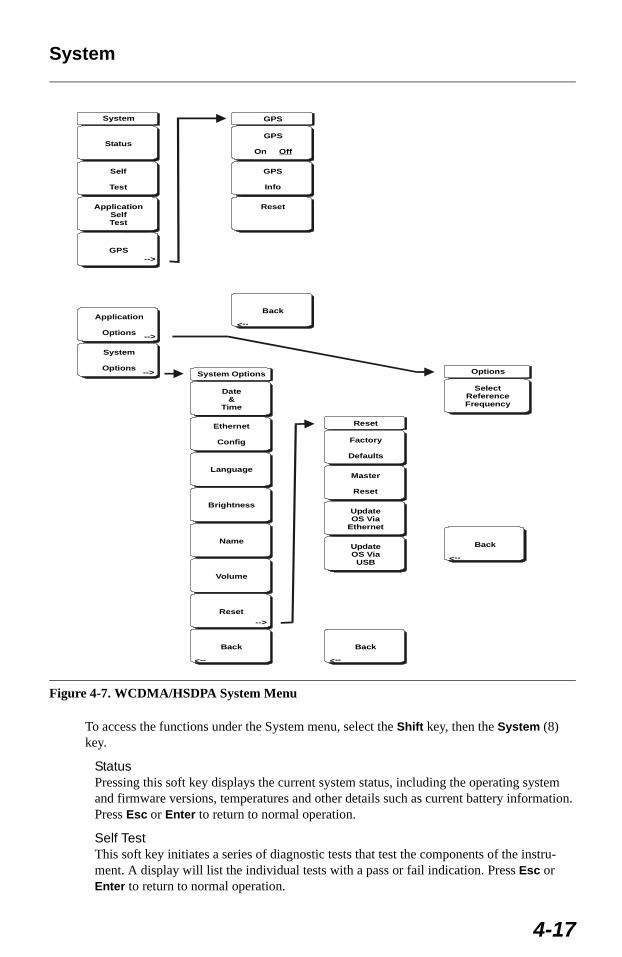
System
To access the functions under the System menu, select the Shift key, then the System (8) key.
StatusPressing this soft key displays the current system status, including the operating system and firmware versions, temperatures and other details such as current battery information. Press Esc or Enter to return to normal operation.
Self Test This soft key initiates a series of diagnostic tests that test the components of the instru-ment. A display will list the individual tests with a pass or fail indication. Press Esc or Enter to return to normal operation.
Figure 4-7. WCDMA/HSDPA System Menu
System
Status
Self
Test
ApplicationSelfTest
GPS
Application
Options
System
Options-->
-->
-->
Back
-->
Options
SelectReferenceFrequency
Back
-->
GPS
GPS
On Off
GPS
Info
Reset
Back
-->
Reset
Factory
Defaults
Master
Reset
UpdateOS Via
Ethernet
UpdateOS ViaUSB
System Options
Date&
Time
Ethernet
Config
Language
Brightness
Name
Volume
Reset
Back
-->
-->
4-17
Application Self TestThis soft key initiates a series of diagnostic tests related to the performance of the UMTS Master in WCMDA mode. A display will list the individual tests with a pass or fail indica-tion. Press Esc or Enter to return to normal operation.
GPSIf the GPS option is installed, the GPS menu will be displayed.
GPS On/OffTurns the GPS on or off.
GPS InfoDisplays the current GPS information.
ResetResets the GPS for a new location.
BackReturns to the previous menu.
Application OptionsThis soft key presents a menu to select application options.
Select Reference FrequencyThis soft key brings up a dialog box for selecting the Reference Frequency. Use the rotary knob or the Up/Down arrow keys to highlight the Reference Frequency and press Enter to select, or press the Esc key to cancel.
BackReturns to the previous menu.
System OptionsThis key opens a selection of system option soft keys.
Date and TimeThis soft key brings up a dialog box for setting the current date and time. Use the soft keys or the Left/Right arrow keys to select the field to be modified. Use the keypad, the Up/Down arrow keys or the rotary knob to select the date and time. Select Enter to accept the changes, or press the Esc key to return to normal operation without chang-ing anything.
Ethernet ConfigurationThis soft key brings up a dialog box to set the IP address of the instrument.
Type Manual/DHCPThis softkey selects whether the address will be entered manually, or supplied auto-matically by a network DHCP server. If Manual is selected, use the soft keys or the Left/Right arrow keys to select the field to be modified. Use the keypad, the Up/Down arrow keys or the rotary knob to enter the input. Select Enter to accept the changes, or press the Esc key to return to normal operation without changing any-thing.
LanguageThis soft key brings up a selection box allowing selection from a list of built-in lan-guages for the UMTS Master displays. The languages currently available are English, French, German, Spanish, Japanese, Chinese, Korean, and Italian.
In addition, a custom language may be selected if it has been defined using the Master Software Tools software and loaded into the MT8220A. Two custom languages may be
4-18
loaded into the instrument using Master Software Tools. Select Enter to accept the change, or press the Esc key to return to normal operation without changing anything.
BrightnessThe brightness of the display can be adjusted to optimize viewing under a wide variety of lighting conditions. Use the keypad, the Up/Down arrow keys or the rotary knob to select a brightness level from 1 to 9, 9 being the brightest. Select Enter to accept the change.
NameOpens a dialog box to name the instrument. The unit can be named using the keypad to select numbers, the rotary knob to highlight a number or character and pressing the knob to select, or by selecting the soft key for each letter. Use the Shift key to select an upper case letter. Use the Left/Right directional arrows to move the cursor position. Press Enter to save the name.
VolumeThe current volume setting is displayed on the screen. Use the keypad, the Up/Down arrow keys or the rotary knob to change the volume and press the Enter key to accept the change.
ResetOpens a menu of reset and update options.
Factory DefaultsRestores the instrument to the factory default values, including Ethernet, language and brightness settings. Press the Enter key to initiate the reset, and turn the unit off, then on again to complete. Press Esc to return to normal operation without resetting.
Master ResetThis will restore factory setting to all system parameters, including Time/Date, Ether-net, language and brightness settings. Also, all user files in the internal memory are deleted, and the original language and antenna files are restored.
Press the Enter key to initiate the reset, and turn the unit off, then on again to com-plete. Press Esc to return to normal operation without resetting.
Update OS Via EthernetSelect this soft key to update the instrument operating system via the Ethernet con-nection. Press Enter to begin the update, or press Esc to return to normal operation without updating.
Update OS Via USBSelect this soft key to update the instrument operating system via the USB connec-tion. Press Enter to begin the update, or press Esc to return to normal operation with-out updating.
BackReturns to the previous menu.
NOTE: The Update OS via Ethernet and Update OS via USB selections are accomplished in conjunction with the Master CodeLoader program, supplied with the Master Software Tools suite. Improper use of the Master CodeLoader program could render the system unusable.
4-19
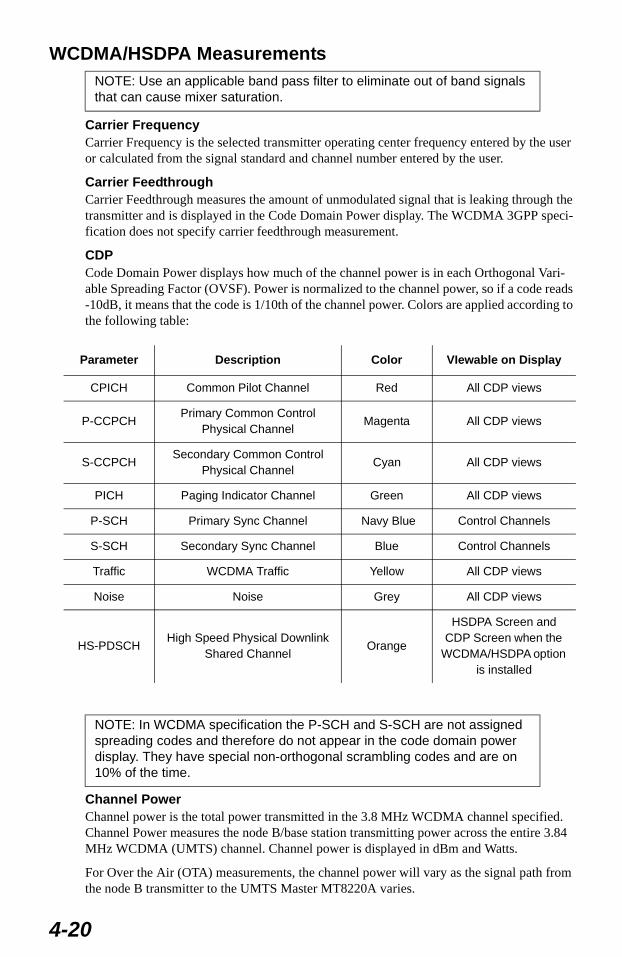
WCDMA/HSDPA Measurements
Carrier Frequency Carrier Frequency is the selected transmitter operating center frequency entered by the user or calculated from the signal standard and channel number entered by the user.
Carrier FeedthroughCarrier Feedthrough measures the amount of unmodulated signal that is leaking through the transmitter and is displayed in the Code Domain Power display. The WCDMA 3GPP speci-fication does not specify carrier feedthrough measurement.
CDP Code Domain Power displays how much of the channel power is in each Orthogonal Vari-able Spreading Factor (OVSF). Power is normalized to the channel power, so if a code reads -10dB, it means that the code is 1/10th of the channel power. Colors are applied according to the following table:
Channel Power Channel power is the total power transmitted in the 3.8 MHz WCDMA channel specified. Channel Power measures the node B/base station transmitting power across the entire 3.84 MHz WCDMA (UMTS) channel. Channel power is displayed in dBm and Watts.
For Over the Air (OTA) measurements, the channel power will vary as the signal path from the node B transmitter to the UMTS Master MT8220A varies.
NOTE: Use an applicable band pass filter to eliminate out of band signals that can cause mixer saturation.
Parameter Description Color VIewable on Display
CPICH Common Pilot Channel Red All CDP views
P-CCPCHPrimary Common Control
Physical ChannelMagenta All CDP views
S-CCPCHSecondary Common Control
Physical ChannelCyan All CDP views
PICH Paging Indicator Channel Green All CDP views
P-SCH Primary Sync Channel Navy Blue Control Channels
S-SCH Secondary Sync Channel Blue Control Channels
Traffic WCDMA Traffic Yellow All CDP views
Noise Noise Grey All CDP views
HS-PDSCHHigh Speed Physical Downlink
Shared Channel Orange
HSDPA Screen and CDP Screen when the
WCDMA/HSDPA option is installed
NOTE: In WCDMA specification the P-SCH and S-SCH are not assigned spreading codes and therefore do not appear in the code domain power display. They have special non-orthogonal scrambling codes and are on 10% of the time.
4-20
Scrambling CodeIn the WCDMA specification the scrambling code can be from 0 to 511. If the scrambling code is known, its value can be entered and the test set can decode and display the code domain power of the signal. If the scrambling code is unknown, the UMTS Master can be set to auto scrambling so that the test set can lock on to the strongest code to decode and display the code domain power of the signal.
Spreading Factor (also called OVSF codes)According to the 3GPP standard the spreading factor can be from 4 to 512, and the UMTS Master can be set to a maximum spreading factor of 256 or 512.
Freq ErrorFrequency error is the difference between the received center frequency and the specified center frequency. This is tied to the external frequency reference accuracy and is typically only useful with a good external frequency reference.
CodogramWhen Codogram is selected the screen displays the changes in code power levels over time.
Noise FloorThe average power of inactive codes in the code domain, displayed in the CDP measurement display.
ThresholdThe Active Channel Threshold Level can be set to indicate which code channels are consid-ered active. Any code channels exceeding this power level are considered active traffic channels and any code channels below this power level are considered inactive (or noise). A horizontal red line on the screen represents the threshold level. The UMTS Master can set this level automatically based on the received signal, or the user can manually enter a value in the Threshold setup menu.
Occupied Bandwidth The measured occupied bandwidth is calculated as the bandwidth containing 99% of the total integrated power within the transmitted spectrum around the selected center frequency.
EVM (Error Vector Magnitude)The Error Vector Magnitude is the ratio in percent of the difference between the reference waveform and the measured waveform. EVM metrics are used to measure the modulation quality of a transmitter. The 3GPP standard requires the EVM not to exceed 17.5%.
Symbol EVM (@EVM)Symbol EVM is defined as the EVM for a single code channel.
Peak to Average Power Peak to Average power is the ratio of the peak power and the RMS power of the signal calcu-lated over one frame interval and is displayed in dB.
Peak CD Error (Peak Code Domain Error)PCDE takes the noise and projects the maximum impact it will have on all OVSF codes. PCDE is the maximum value for the code domain error for all codes (both active and inac-tive).
In the 3GPP standard to address the possibility of uneven error power distribution in WCDMA, the EVM measurement has been supplemented with PCDE. The 3GPP standard requires the PCDE not to exceed -33dB at a spreading factor of 256.
EcEc is a measurement of energy. Ec is determined by multiplying CPICH by the chip time.
4-21
Ec/IoThe pilot power compared to the total channel power. Ec/Io is displayed in text only and OTA measurement displays.
Pilot Dominance The strength of the strongest pilot compared to the next strongest pilot in the same channel. This should be >10 dB to make good measurements.
Total Power The total power of all the scrambling codes, also called (Io) and displayed in dBm.
CPICH Abs Power CPICH Abs power is the energy over one chip of the Common Pilot Channel power dis-played in dBm.
P-CCPCH Abs PowerP-CCPCH Abs power is the absolute Primary Common Control Physical Channel power displayed in dBm.
S-CCPCH Abs PowerS-CCPCH Abs power is the absolute Secondary Common Control Physical Channel power displayed in dBm.
P-SCH Abs PowerP-SCH Abs power is the absolute Primary Sync Channel power displayed in dBm.
S-SCH Abs Power S-SCH Abs power is the absolute Secondary Sync Channel Power displayed in dBm.
PICHPICH is the paging indicator channel power.
HSDPA Power versus Time DisplaySelect the code and set the time to display how the code is varying over time. In CDP view HSDPA signals are displayed in orange.
ConstellationIn the HSDPA view, the symbol constellation for the selected code is displayed (16QAM or QPSK).
Measurement SetupWCDMA/HSDPA Mode
To prepare for WCDMA measurements, the MT8220A must be configured for WCDMA mode, as follows:
Step 1. Select the Shift key, then the Mode (9) key. The available modes are Spectrum Analyzer, UMTS/WCDMA Signal Analyzer, and GSM/GPRS/EDGE Signal Ana-lyzer.
Step 2. Use the directional arrow keys or the rotary knob to highlight WCDMA/HSDPA Signal Analyzer and press the Enter key to select.
NOTE: UMTS/WCDMA mode supports HSDPA measurements when Option 65, WCDMA/HSDPA Demod, Option 44, WCDMA/HSDPA RF Meas, Option 35, WCDMA/HSDPA OTA are installed and the name of the mode is labeled as WCDMA/HSDPA Signal Analyzer. When Option 45, WCDMA Demod is installed, the mode is labeled as WCDMA Signal Ana-lyzer.
4-22
Setting up the Measurement Frequency The measurement frequency can be set by entering the center frequency or by selecting the applicable signal standard and channel, which allows the UMTS Master MT8220A to auto-matically set the frequency.
To enter the center frequency:
Step 1. Press the Freq function hard key.Step 2. Press the Center Freq soft key.Step 3. Enter the desired frequency using the keypad, the arrow keys, or the rotary knob.
If entering a frequency using the keypad, the soft key labels change to GHz, MHz, kHz and Hz. Select the appropriate units key. Selecting the Enter key has the same affect as selecting the MHz soft key.
Step 4. Press the Enter key to set the Center Frequency. The current setting is shown on the left side of the display.
To select a signal standard:
Step 5. Press the Freq function hard key.Step 6. Select the Signal Standard soft key.Step 7. Use the Up/Down arrow keys or the rotary knob to highlight a signal standard and
press Enter to select. When a signal standard is selected, the center frequency for the first channel of the selected standard is automatically tuned.
Step 8. Select the Channel soft key and use the Up/Down arrow keys, the keypad, or the rotary knob to select a channel number for the selected signal standard. The center of the channel is tuned to the center of the display.
The current settings are displayed on the left side of the screen.
Power Offset for Compensating External LossTo get accurate results the external attenuation should be compensated using power offset. In power offset mode the compensation factor is in dB. The external attenuation is caused by using an external cable or external high power attenuator.
Step 1. Press the Amplitude function hard key.Step 2. Press the Power Offset soft key and use the keypad, the arrow keys, or the rotary
knob to enter the desired offset value. Press the Enter key to set the Power Offset. The value entered is displayed on the left side of the screen.
Scrambling Code Setup The UMTS Master MT8220A can set up a scrambling code automatically or manually.
In Auto mode the unit automatically locks on to the strongest scrambling code in the signal. In Manual mode the desired code is manually entered and the unit looks only for that spe-cific scrambling code.
To set up auto scrambling:
Step 1. Press the Setup function hard key.Step 2. Press the Scrambling Code soft key to select Auto
To manually set up a Scrambling Code:
Step 3. Press the Setup function hard key.Step 4. Press the Scrambling Code soft key to select Manual and use the keypad, the arrow
keys, or the rotary knob to enter the desired Scrambling Code, as shown on the left side of the screen. Press the Enter key to set the scrambling code.
4-23
Maximum Spreading Factor SetupIn a WCDMA system, the number of chips per data symbol is called the Spreading Factor. The lower the spreading factor the higher the data rate. According to the 3GPP standard, the spreading factor can vary from 4 to 512 and the maximum spreading factor is either 256 or 512. The UMTS Master MT8220A can be set to 256 or 512 maximum spreading factors. To set up the maximum spreading factor:
Step 1. Press the Setup function hard key.Step 2. Press the Max Spreading Factor soft key to select either 256 or 512.
External Reference Frequency Setup In order to get the best frequency accuracy measurements, it is important to use an external reference frequency attached to the UMTS Master Ext Ref In connector. Most node B equip-ment has a reference frequency available on a BNC connector. To configure the UMTS Mas-ter to use an external reference frequency:
Step 1. Press the Setup function hard key.Step 2. Press the Select Reference Frequency soft key to display a list of the available ref-
erence frequencies:
Step 3. Use the Up/Down arrow keys or the rotary knob to highlight the applicable refer-ence frequency on the list and press the Enter key to set the reference frequency.
As the UMTS Master locks to the source, the Reference Freq value is displayed in the user settable parameters to the left of the display.
S-CCPCH Spreading Factor, S-CCPCH Code and PICH Code setup In the 3GPP specification, two optional control channels are provided for S-CCPCH and PICH. These codes can have different spreading codes and spreading factors. In the UMTS Master the S-CCPCH spreading factor and S-CCPCH and PICH codes can be manually entered.
Step 1. Press the Setup function hard key.Step 2. Select the S-CCPCH Spread soft key and manually enter the desired spreading
factor.
1 MHz
1.2288 MHz
1.544 MHz
2.048 MHz
2.4576 MHz
4.8 MHz
4.9152 MHz
5 MHz
9.8304 MHz
10 MHz
13 MHz
19.6608 MHz
NOTE: For the most accurate results, manually enter the S-CCPCH spreading and S-CCPCH and PICH codes before taking the measure-ment.
4-24
Step 3. Select the S-CCPCH Code soft key and manually enter the desired spreading code.
Step 4. Select the PICH Code soft key and manually enter the desired spreading code.
Threshold SetupThe threshold level is an advanced setting that can be set to indicate which codes are consid-ered active. In the Code Domain Power screen the threshold level is indicated by a horizon-tal dotted red line. Any code channels exceeding this power level are considered active traffic channels and any code channels below this power level are considered inactive or noise. The threshold level can be manually set by:
Step 1. Press the Setup function hard key.Step 2. Select the Threshold soft key and select either On or Off.
Filtered versus Unfiltered Power In the UMTS Master MT8220A the ACLR measurement uses the filtered channel power to determine the ACLR values and it is listed as filtered on the display. In all other screens the unfiltered channel power is displayed as channel power.
NOTE: The S-CCPCH spreading factor default value is 256. The default S-CCPCH Code is 3 and the default PICH code is 16.
NOTE: Threshold can only be set in Codogram or Code Domain Power modes. The default threshold level is -30 dB.
4-25
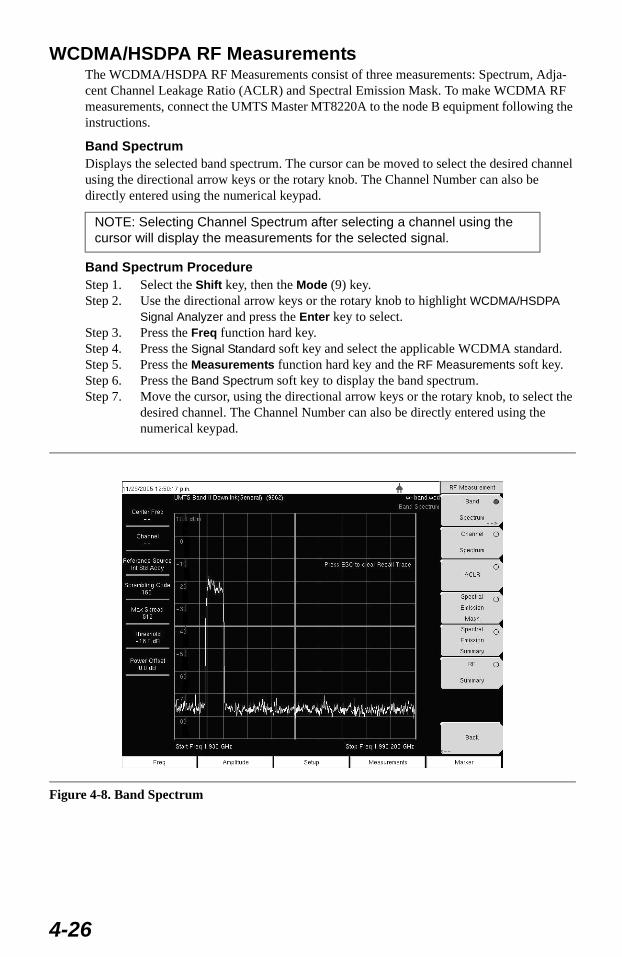
WCDMA/HSDPA RF MeasurementsThe WCDMA/HSDPA RF Measurements consist of three measurements: Spectrum, Adja-cent Channel Leakage Ratio (ACLR) and Spectral Emission Mask. To make WCDMA RF measurements, connect the UMTS Master MT8220A to the node B equipment following the instructions.
Band SpectrumDisplays the selected band spectrum. The cursor can be moved to select the desired channel using the directional arrow keys or the rotary knob. The Channel Number can also be directly entered using the numerical keypad.
Band Spectrum ProcedureStep 1. Select the Shift key, then the Mode (9) key. Step 2. Use the directional arrow keys or the rotary knob to highlight WCDMA/HSDPA
Signal Analyzer and press the Enter key to select. Step 3. Press the Freq function hard key.Step 4. Press the Signal Standard soft key and select the applicable WCDMA standard.Step 5. Press the Measurements function hard key and the RF Measurements soft key.Step 6. Press the Band Spectrum soft key to display the band spectrum.Step 7. Move the cursor, using the directional arrow keys or the rotary knob, to select the
desired channel. The Channel Number can also be directly entered using the numerical keypad.
NOTE: Selecting Channel Spectrum after selecting a channel using the cursor will display the measurements for the selected signal.
Figure 4-8. Band Spectrum
4-26
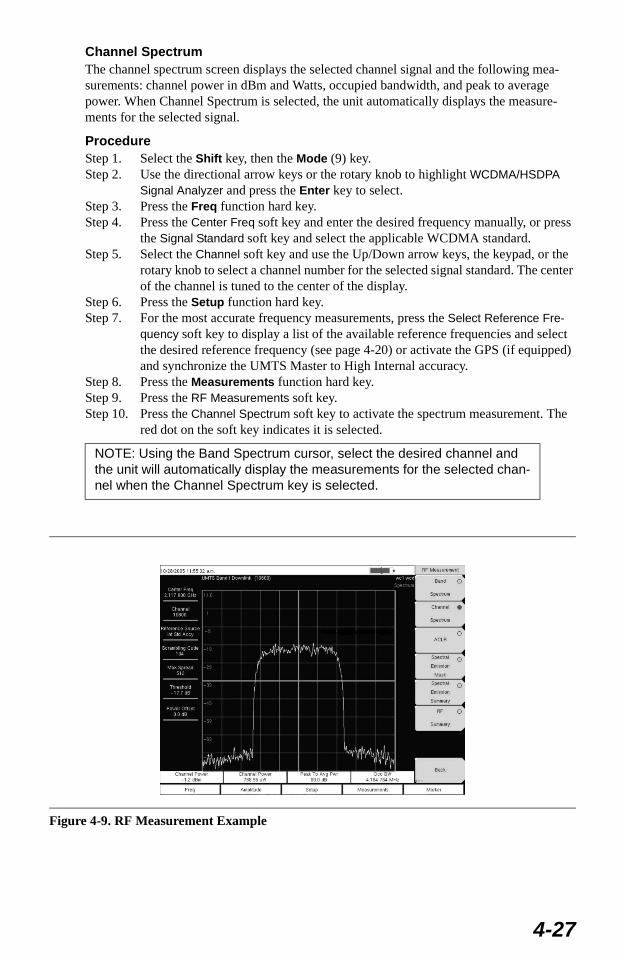
Channel SpectrumThe channel spectrum screen displays the selected channel signal and the following mea-surements: channel power in dBm and Watts, occupied bandwidth, and peak to average power. When Channel Spectrum is selected, the unit automatically displays the measure-ments for the selected signal.
Procedure Step 1. Select the Shift key, then the Mode (9) key. Step 2. Use the directional arrow keys or the rotary knob to highlight WCDMA/HSDPA
Signal Analyzer and press the Enter key to select. Step 3. Press the Freq function hard key.Step 4. Press the Center Freq soft key and enter the desired frequency manually, or press
the Signal Standard soft key and select the applicable WCDMA standard.Step 5. Select the Channel soft key and use the Up/Down arrow keys, the keypad, or the
rotary knob to select a channel number for the selected signal standard. The center of the channel is tuned to the center of the display.
Step 6. Press the Setup function hard key.Step 7. For the most accurate frequency measurements, press the Select Reference Fre-
quency soft key to display a list of the available reference frequencies and select the desired reference frequency (see page 4-20) or activate the GPS (if equipped) and synchronize the UMTS Master to High Internal accuracy.
Step 8. Press the Measurements function hard key.Step 9. Press the RF Measurements soft key.Step 10. Press the Channel Spectrum soft key to activate the spectrum measurement. The
red dot on the soft key indicates it is selected.
NOTE: Using the Band Spectrum cursor, select the desired channel and the unit will automatically display the measurements for the selected chan-nel when the Channel Spectrum key is selected.
Figure 4-9. RF Measurement Example
4-27
ACLR Measurement ScreenACLR (Adjacent Channel Leakage Ratio) is defined as the ratio of the amount of leakage power in an adjacent channel to the total transmitted power in the main channel and is dis-played in table format under the bar graph. The 3GPP standard specifies one main channel and two adjacent channels. The ACLR screen displays the main channel power and the power of two adjacent channels on each side as a bar graph.
The channel spacing is -10 MHz, -5 MHz, +5 MHz and +10 MHz and the channels are color coded. The 3GPP standard requires the adjacent channel power leakage ratio to be better than 45 dB at 5MHz offset and 50 dB at 10MHz offset.
The UMTS Master can also make ACLR measurements for multi-channel systems by mea-suring the main channels and the adjacent channels, from one to four channels. The ACLR screen can display up to 12 channels total.
In the ACLR measurement mode the filtered channel power is used to determine ACLR val-ues and is listed as filtered on the display.
The following procedure is for one main channel two adjacent channels.
ProcedureStep 1. Select the Shift key, then the Mode (9) key. Step 2. Use the directional arrow keys or the rotary knob to highlight WCDMA/HSDPA
Signal Analyzer and press the Enter key to select. Step 3. Press the Freq function hard key.Step 4. Press the Center Freq soft key and enter the desired frequency manually, or press
the Signal Standard soft key and select the applicable WCDMA standard.Step 5. Select the Channel soft key and use the Up/Down arrow keys, the keypad, or the
rotary knob to select a channel number for the selected signal standard. The center of the channel is tuned to the center of the display.
Step 6. Press the Measurements function hard key.Step 7. Press the RF Measurement soft key.
Step 8. Press the ACLR soft key to activate the ACLR measurement. The red dot on the soft key indicates it is selected.
NOTE: In the UMTS Master MT8220A the ACLR measurement uses the filtered channel power to determine the ACLR values and it is listed as fil-tered on the display. In all other screens the unfiltered channel power is displayed as channel power.
NOTE: Using the Band Spectrum cursor, select the required channel and press the ACLR soft key. The UMTS Master will display the measurement.
4-28
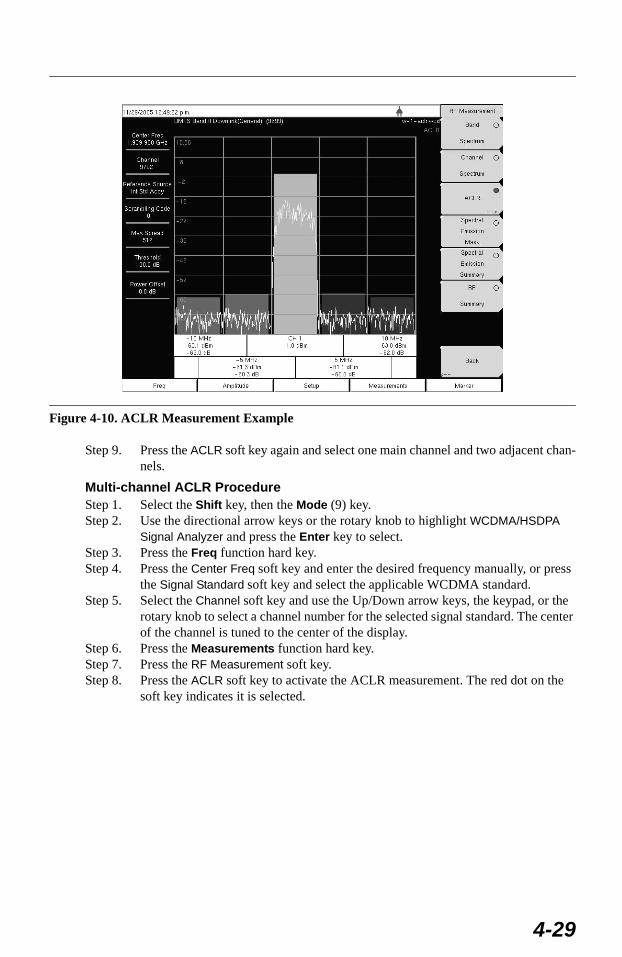
Step 9. Press the ACLR soft key again and select one main channel and two adjacent chan-nels.
Multi-channel ACLR Procedure Step 1. Select the Shift key, then the Mode (9) key. Step 2. Use the directional arrow keys or the rotary knob to highlight WCDMA/HSDPA
Signal Analyzer and press the Enter key to select. Step 3. Press the Freq function hard key.Step 4. Press the Center Freq soft key and enter the desired frequency manually, or press
the Signal Standard soft key and select the applicable WCDMA standard.Step 5. Select the Channel soft key and use the Up/Down arrow keys, the keypad, or the
rotary knob to select a channel number for the selected signal standard. The center of the channel is tuned to the center of the display.
Step 6. Press the Measurements function hard key.Step 7. Press the RF Measurement soft key.Step 8. Press the ACLR soft key to activate the ACLR measurement. The red dot on the
soft key indicates it is selected.
Figure 4-10. ACLR Measurement Example
4-29
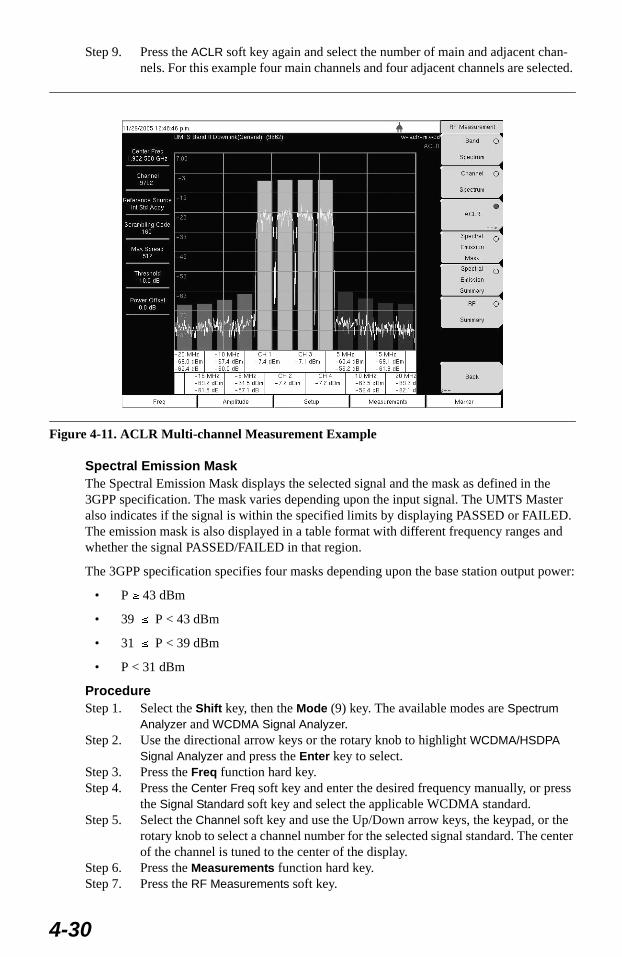
Step 9. Press the ACLR soft key again and select the number of main and adjacent chan-nels. For this example four main channels and four adjacent channels are selected.
Spectral Emission MaskThe Spectral Emission Mask displays the selected signal and the mask as defined in the 3GPP specification. The mask varies depending upon the input signal. The UMTS Master also indicates if the signal is within the specified limits by displaying PASSED or FAILED. The emission mask is also displayed in a table format with different frequency ranges and whether the signal PASSED/FAILED in that region.
The 3GPP specification specifies four masks depending upon the base station output power:
• P ≥ 43 dBm
• 39 ≤ P < 43 dBm
• 31 ≤ P < 39 dBm
• P < 31 dBm
Procedure Step 1. Select the Shift key, then the Mode (9) key. The available modes are Spectrum
Analyzer and WCDMA Signal Analyzer. Step 2. Use the directional arrow keys or the rotary knob to highlight WCDMA/HSDPA
Signal Analyzer and press the Enter key to select. Step 3. Press the Freq function hard key.Step 4. Press the Center Freq soft key and enter the desired frequency manually, or press
the Signal Standard soft key and select the applicable WCDMA standard.Step 5. Select the Channel soft key and use the Up/Down arrow keys, the keypad, or the
rotary knob to select a channel number for the selected signal standard. The center of the channel is tuned to the center of the display.
Step 6. Press the Measurements function hard key.Step 7. Press the RF Measurements soft key.
Figure 4-11. ACLR Multi-channel Measurement Example
4-30
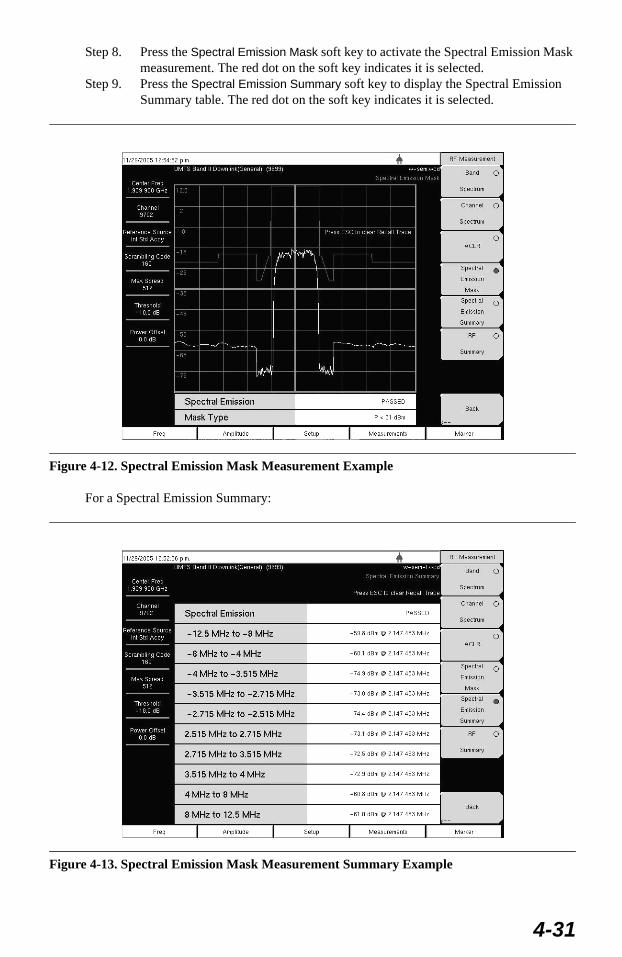
Step 8. Press the Spectral Emission Mask soft key to activate the Spectral Emission Mask measurement. The red dot on the soft key indicates it is selected.
Step 9. Press the Spectral Emission Summary soft key to display the Spectral Emission Summary table. The red dot on the soft key indicates it is selected.
For a Spectral Emission Summary:
Figure 4-12. Spectral Emission Mask Measurement Example
Figure 4-13. Spectral Emission Mask Measurement Summary Example
4-31
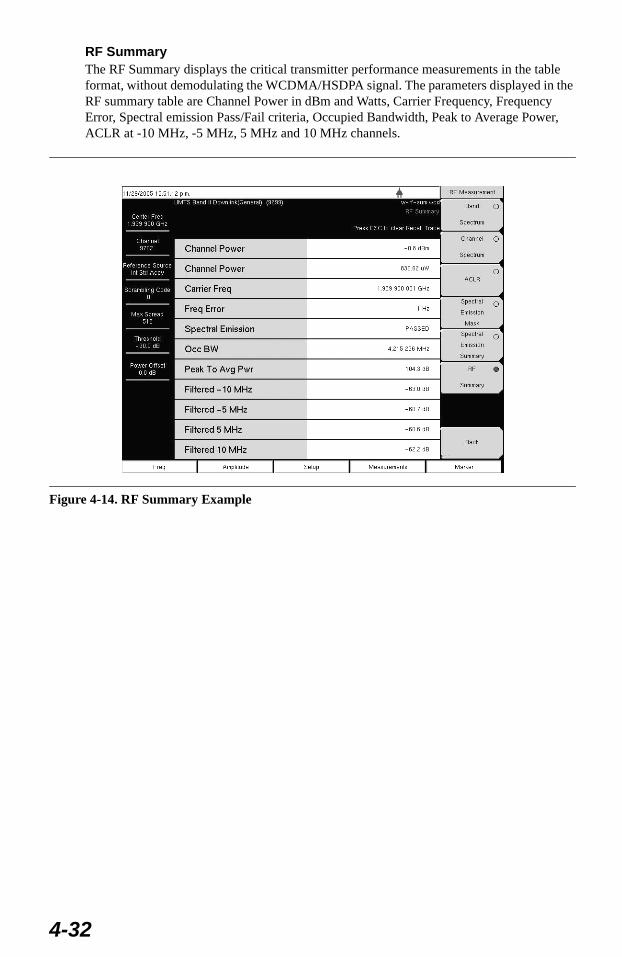
RF SummaryThe RF Summary displays the critical transmitter performance measurements in the table format, without demodulating the WCDMA/HSDPA signal. The parameters displayed in the RF summary table are Channel Power in dBm and Watts, Carrier Frequency, Frequency Error, Spectral emission Pass/Fail criteria, Occupied Bandwidth, Peak to Average Power, ACLR at -10 MHz, -5 MHz, 5 MHz and 10 MHz channels.
Figure 4-14. RF Summary Example
4-32
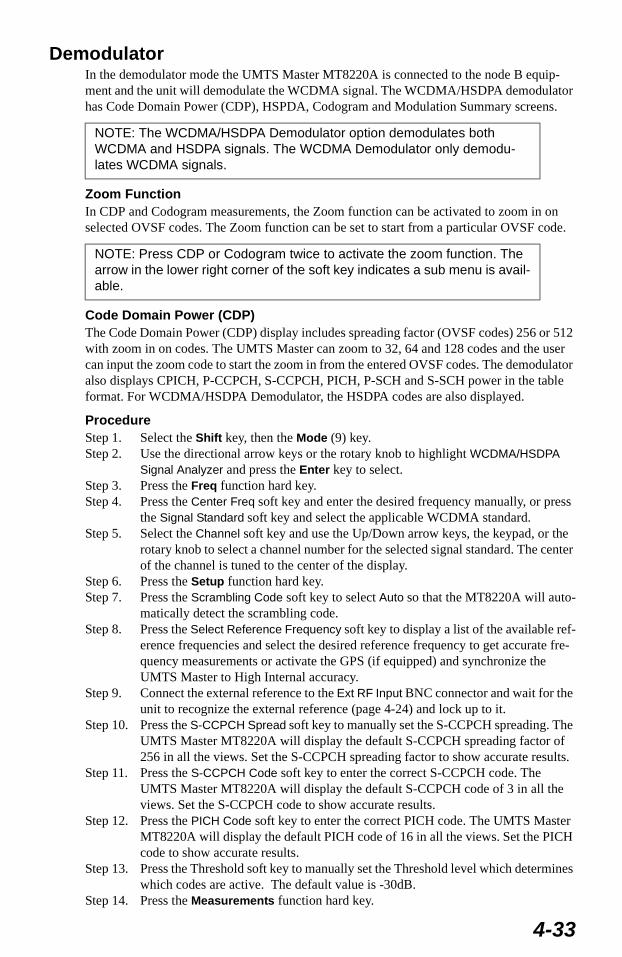
Demodulator In the demodulator mode the UMTS Master MT8220A is connected to the node B equip-ment and the unit will demodulate the WCDMA signal. The WCDMA/HSDPA demodulator has Code Domain Power (CDP), HSPDA, Codogram and Modulation Summary screens.
Zoom Function In CDP and Codogram measurements, the Zoom function can be activated to zoom in on selected OVSF codes. The Zoom function can be set to start from a particular OVSF code.
Code Domain Power (CDP)The Code Domain Power (CDP) display includes spreading factor (OVSF codes) 256 or 512 with zoom in on codes. The UMTS Master can zoom to 32, 64 and 128 codes and the user can input the zoom code to start the zoom in from the entered OVSF codes. The demodulator also displays CPICH, P-CCPCH, S-CCPCH, PICH, P-SCH and S-SCH power in the table format. For WCDMA/HSDPA Demodulator, the HSDPA codes are also displayed.
Procedure Step 1. Select the Shift key, then the Mode (9) key. Step 2. Use the directional arrow keys or the rotary knob to highlight WCDMA/HSDPA
Signal Analyzer and press the Enter key to select. Step 3. Press the Freq function hard key.Step 4. Press the Center Freq soft key and enter the desired frequency manually, or press
the Signal Standard soft key and select the applicable WCDMA standard.Step 5. Select the Channel soft key and use the Up/Down arrow keys, the keypad, or the
rotary knob to select a channel number for the selected signal standard. The center of the channel is tuned to the center of the display.
Step 6. Press the Setup function hard key.Step 7. Press the Scrambling Code soft key to select Auto so that the MT8220A will auto-
matically detect the scrambling code. Step 8. Press the Select Reference Frequency soft key to display a list of the available ref-
erence frequencies and select the desired reference frequency to get accurate fre-quency measurements or activate the GPS (if equipped) and synchronize the UMTS Master to High Internal accuracy.
Step 9. Connect the external reference to the Ext RF Input BNC connector and wait for the unit to recognize the external reference (page 4-24) and lock up to it.
Step 10. Press the S-CCPCH Spread soft key to manually set the S-CCPCH spreading. The UMTS Master MT8220A will display the default S-CCPCH spreading factor of 256 in all the views. Set the S-CCPCH spreading factor to show accurate results.
Step 11. Press the S-CCPCH Code soft key to enter the correct S-CCPCH code. The UMTS Master MT8220A will display the default S-CCPCH code of 3 in all the views. Set the S-CCPCH code to show accurate results.
Step 12. Press the PICH Code soft key to enter the correct PICH code. The UMTS Master MT8220A will display the default PICH code of 16 in all the views. Set the PICH code to show accurate results.
Step 13. Press the Threshold soft key to manually set the Threshold level which determines which codes are active. The default value is -30dB.
Step 14. Press the Measurements function hard key.
NOTE: The WCDMA/HSDPA Demodulator option demodulates both WCDMA and HSDPA signals. The WCDMA Demodulator only demodu-lates WCDMA signals.
NOTE: Press CDP or Codogram twice to activate the zoom function. The arrow in the lower right corner of the soft key indicates a sub menu is avail-able.
4-33
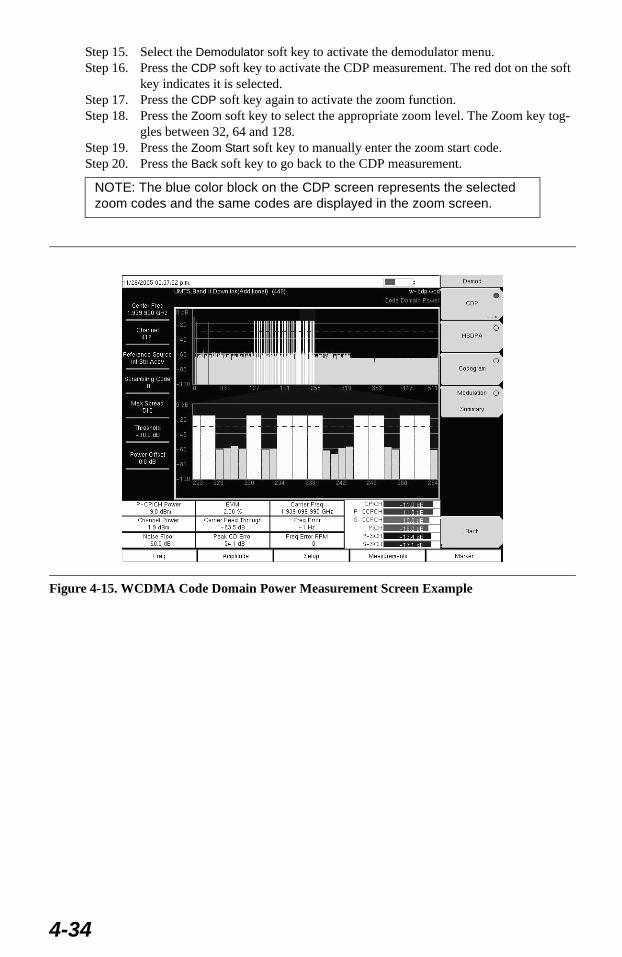
Step 15. Select the Demodulator soft key to activate the demodulator menu.Step 16. Press the CDP soft key to activate the CDP measurement. The red dot on the soft
key indicates it is selected. Step 17. Press the CDP soft key again to activate the zoom function. Step 18. Press the Zoom soft key to select the appropriate zoom level. The Zoom key tog-
gles between 32, 64 and 128.Step 19. Press the Zoom Start soft key to manually enter the zoom start code. Step 20. Press the Back soft key to go back to the CDP measurement.
NOTE: The blue color block on the CDP screen represents the selected zoom codes and the same codes are displayed in the zoom screen.
Figure 4-15. WCDMA Code Domain Power Measurement Screen Example
4-34
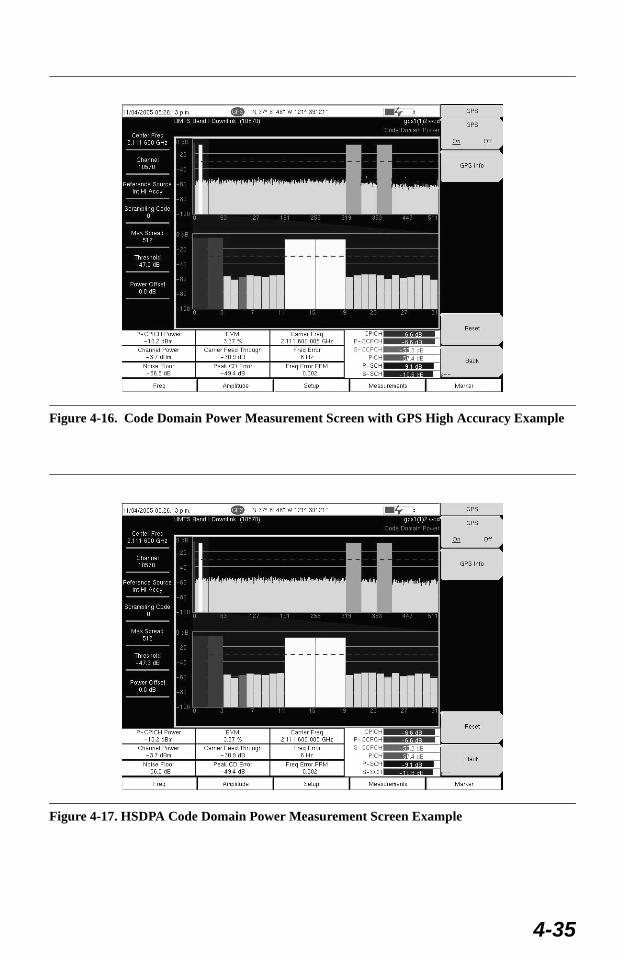
Figure 4-16. Code Domain Power Measurement Screen with GPS High Accuracy Example
Figure 4-17. HSDPA Code Domain Power Measurement Screen Example
4-35
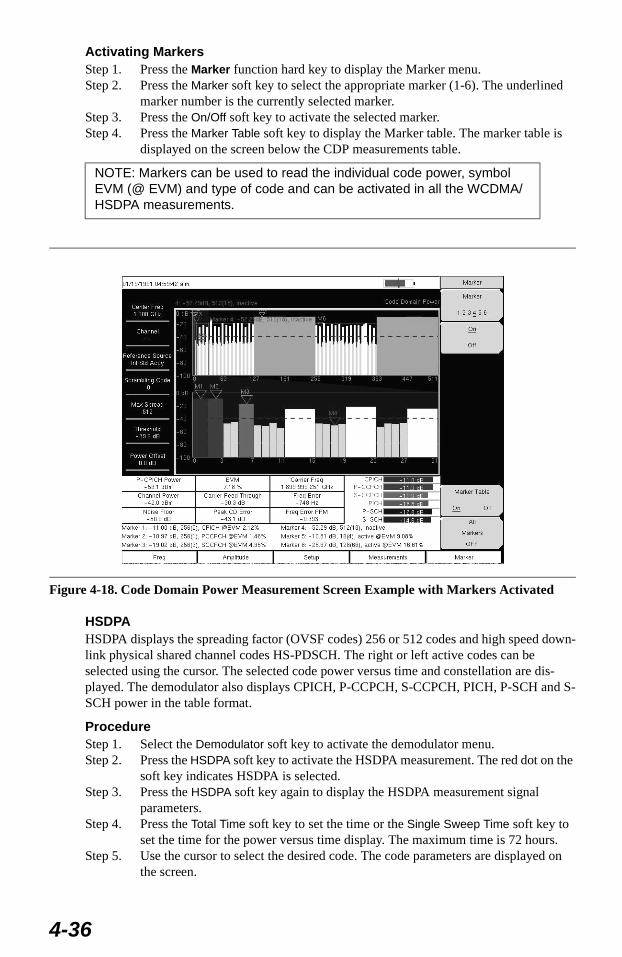
Activating Markers Step 1. Press the Marker function hard key to display the Marker menu.Step 2. Press the Marker soft key to select the appropriate marker (1-6). The underlined
marker number is the currently selected marker.Step 3. Press the On/Off soft key to activate the selected marker.Step 4. Press the Marker Table soft key to display the Marker table. The marker table is
displayed on the screen below the CDP measurements table.
HSDPAHSDPA displays the spreading factor (OVSF codes) 256 or 512 codes and high speed down-link physical shared channel codes HS-PDSCH. The right or left active codes can be selected using the cursor. The selected code power versus time and constellation are dis-played. The demodulator also displays CPICH, P-CCPCH, S-CCPCH, PICH, P-SCH and S-SCH power in the table format.
Procedure Step 1. Select the Demodulator soft key to activate the demodulator menu.Step 2. Press the HSDPA soft key to activate the HSDPA measurement. The red dot on the
soft key indicates HSDPA is selected. Step 3. Press the HSDPA soft key again to display the HSDPA measurement signal
parameters. Step 4. Press the Total Time soft key to set the time or the Single Sweep Time soft key to
set the time for the power versus time display. The maximum time is 72 hours.Step 5. Use the cursor to select the desired code. The code parameters are displayed on
the screen.
NOTE: Markers can be used to read the individual code power, symbol EVM (@ EVM) and type of code and can be activated in all the WCDMA/HSDPA measurements.
Figure 4-18. Code Domain Power Measurement Screen Example with Markers Activated
4-36
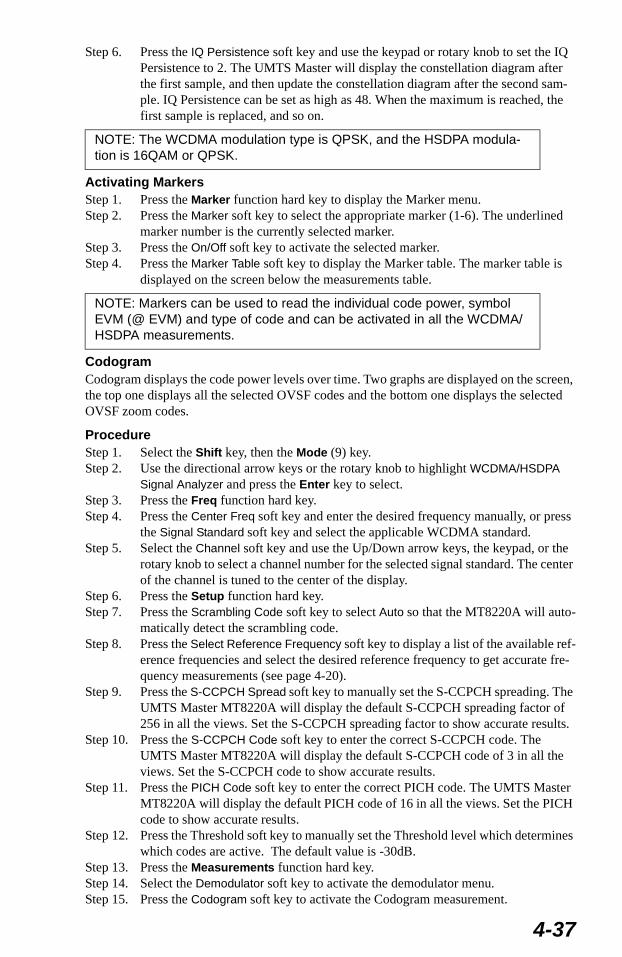
Step 6. Press the IQ Persistence soft key and use the keypad or rotary knob to set the IQ Persistence to 2. The UMTS Master will display the constellation diagram after the first sample, and then update the constellation diagram after the second sam-ple. IQ Persistence can be set as high as 48. When the maximum is reached, the first sample is replaced, and so on.
Activating Markers Step 1. Press the Marker function hard key to display the Marker menu.Step 2. Press the Marker soft key to select the appropriate marker (1-6). The underlined
marker number is the currently selected marker.Step 3. Press the On/Off soft key to activate the selected marker.Step 4. Press the Marker Table soft key to display the Marker table. The marker table is
displayed on the screen below the measurements table.
CodogramCodogram displays the code power levels over time. Two graphs are displayed on the screen, the top one displays all the selected OVSF codes and the bottom one displays the selected OVSF zoom codes.
ProcedureStep 1. Select the Shift key, then the Mode (9) key. Step 2. Use the directional arrow keys or the rotary knob to highlight WCDMA/HSDPA
Signal Analyzer and press the Enter key to select. Step 3. Press the Freq function hard key.Step 4. Press the Center Freq soft key and enter the desired frequency manually, or press
the Signal Standard soft key and select the applicable WCDMA standard.Step 5. Select the Channel soft key and use the Up/Down arrow keys, the keypad, or the
rotary knob to select a channel number for the selected signal standard. The center of the channel is tuned to the center of the display.
Step 6. Press the Setup function hard key.Step 7. Press the Scrambling Code soft key to select Auto so that the MT8220A will auto-
matically detect the scrambling code.Step 8. Press the Select Reference Frequency soft key to display a list of the available ref-
erence frequencies and select the desired reference frequency to get accurate fre-quency measurements (see page 4-20).
Step 9. Press the S-CCPCH Spread soft key to manually set the S-CCPCH spreading. The UMTS Master MT8220A will display the default S-CCPCH spreading factor of 256 in all the views. Set the S-CCPCH spreading factor to show accurate results.
Step 10. Press the S-CCPCH Code soft key to enter the correct S-CCPCH code. The UMTS Master MT8220A will display the default S-CCPCH code of 3 in all the views. Set the S-CCPCH code to show accurate results.
Step 11. Press the PICH Code soft key to enter the correct PICH code. The UMTS Master MT8220A will display the default PICH code of 16 in all the views. Set the PICH code to show accurate results.
Step 12. Press the Threshold soft key to manually set the Threshold level which determines which codes are active. The default value is -30dB.
Step 13. Press the Measurements function hard key.Step 14. Select the Demodulator soft key to activate the demodulator menu.Step 15. Press the Codogram soft key to activate the Codogram measurement.
NOTE: The WCDMA modulation type is QPSK, and the HSDPA modula-tion is 16QAM or QPSK.
NOTE: Markers can be used to read the individual code power, symbol EVM (@ EVM) and type of code and can be activated in all the WCDMA/HSDPA measurements.
4-37
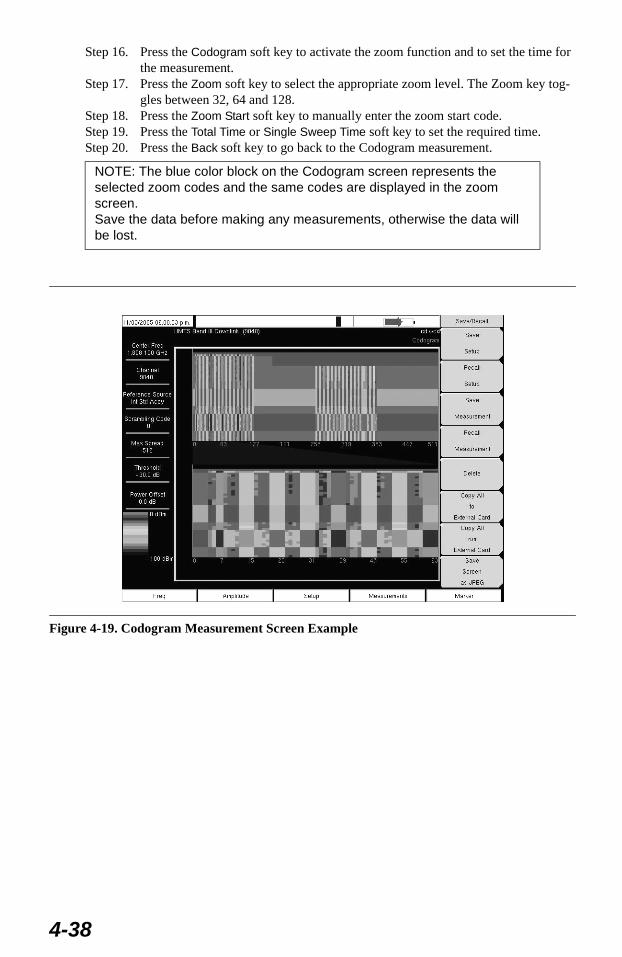
Step 16. Press the Codogram soft key to activate the zoom function and to set the time for the measurement.
Step 17. Press the Zoom soft key to select the appropriate zoom level. The Zoom key tog-gles between 32, 64 and 128.
Step 18. Press the Zoom Start soft key to manually enter the zoom start code. Step 19. Press the Total Time or Single Sweep Time soft key to set the required time.Step 20. Press the Back soft key to go back to the Codogram measurement.
NOTE: The blue color block on the Codogram screen represents the selected zoom codes and the same codes are displayed in the zoom screen.Save the data before making any measurements, otherwise the data will be lost.
Figure 4-19. Codogram Measurement Screen Example
4-38
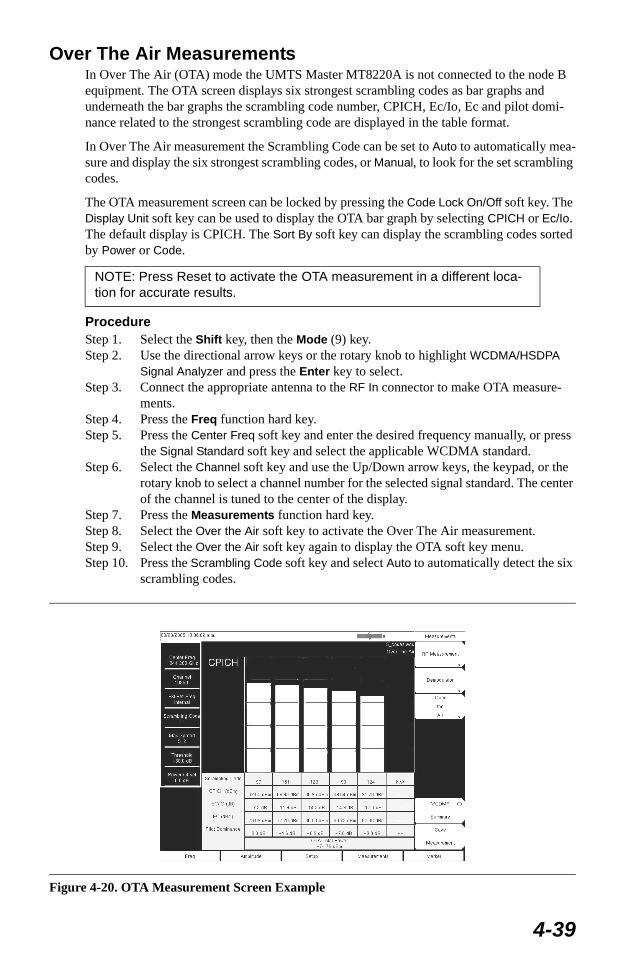
Over The Air Measurements In Over The Air (OTA) mode the UMTS Master MT8220A is not connected to the node B equipment. The OTA screen displays six strongest scrambling codes as bar graphs and underneath the bar graphs the scrambling code number, CPICH, Ec/Io, Ec and pilot domi-nance related to the strongest scrambling code are displayed in the table format.
In Over The Air measurement the Scrambling Code can be set to Auto to automatically mea-sure and display the six strongest scrambling codes, or Manual, to look for the set scrambling codes.
The OTA measurement screen can be locked by pressing the Code Lock On/Off soft key. The Display Unit soft key can be used to display the OTA bar graph by selecting CPICH or Ec/Io. The default display is CPICH. The Sort By soft key can display the scrambling codes sorted by Power or Code.
ProcedureStep 1. Select the Shift key, then the Mode (9) key. Step 2. Use the directional arrow keys or the rotary knob to highlight WCDMA/HSDPA
Signal Analyzer and press the Enter key to select. Step 3. Connect the appropriate antenna to the RF In connector to make OTA measure-
ments. Step 4. Press the Freq function hard key.Step 5. Press the Center Freq soft key and enter the desired frequency manually, or press
the Signal Standard soft key and select the applicable WCDMA standard.Step 6. Select the Channel soft key and use the Up/Down arrow keys, the keypad, or the
rotary knob to select a channel number for the selected signal standard. The center of the channel is tuned to the center of the display.
Step 7. Press the Measurements function hard key.Step 8. Select the Over the Air soft key to activate the Over The Air measurement. Step 9. Select the Over the Air soft key again to display the OTA soft key menu.Step 10. Press the Scrambling Code soft key and select Auto to automatically detect the six
scrambling codes.
NOTE: Press Reset to activate the OTA measurement in a different loca-tion for accurate results.
Figure 4-20. OTA Measurement Screen Example
4-39
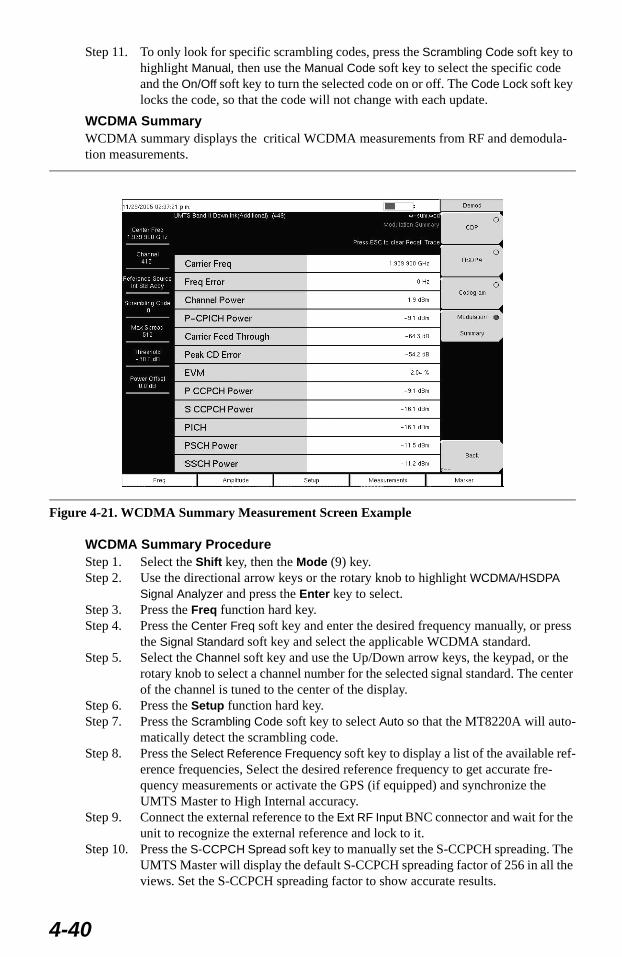
Step 11. To only look for specific scrambling codes, press the Scrambling Code soft key to highlight Manual, then use the Manual Code soft key to select the specific code and the On/Off soft key to turn the selected code on or off. The Code Lock soft key locks the code, so that the code will not change with each update.
WCDMA SummaryWCDMA summary displays the critical WCDMA measurements from RF and demodula-tion measurements.
WCDMA Summary ProcedureStep 1. Select the Shift key, then the Mode (9) key. Step 2. Use the directional arrow keys or the rotary knob to highlight WCDMA/HSDPA
Signal Analyzer and press the Enter key to select. Step 3. Press the Freq function hard key.Step 4. Press the Center Freq soft key and enter the desired frequency manually, or press
the Signal Standard soft key and select the applicable WCDMA standard.Step 5. Select the Channel soft key and use the Up/Down arrow keys, the keypad, or the
rotary knob to select a channel number for the selected signal standard. The center of the channel is tuned to the center of the display.
Step 6. Press the Setup function hard key.Step 7. Press the Scrambling Code soft key to select Auto so that the MT8220A will auto-
matically detect the scrambling code.Step 8. Press the Select Reference Frequency soft key to display a list of the available ref-
erence frequencies, Select the desired reference frequency to get accurate fre-quency measurements or activate the GPS (if equipped) and synchronize the UMTS Master to High Internal accuracy.
Step 9. Connect the external reference to the Ext RF Input BNC connector and wait for the unit to recognize the external reference and lock to it.
Step 10. Press the S-CCPCH Spread soft key to manually set the S-CCPCH spreading. The UMTS Master will display the default S-CCPCH spreading factor of 256 in all the views. Set the S-CCPCH spreading factor to show accurate results.
Figure 4-21. WCDMA Summary Measurement Screen Example
4-40
Step 11. Press the S-CCPCH Code soft key to enter the correct S-CCPCH code. The UMTS Master will display the default S-CCPCH code of 3 in all the views. Set the S-CCPCH code to show accurate results.
Step 12. Press the PICH Code soft key to enter the correct PICH code. The UMTS Master will display the default PICH code of 16 in all the views. Set the PICH code to show accurate results.
Step 13. Press the Threshold soft key to manually set the Threshold level which determines which codes are active. The default value is -30dB.
Step 14. Press the Measurements function hard key.Step 15. Press the WCDMA Summary soft key.
4-41
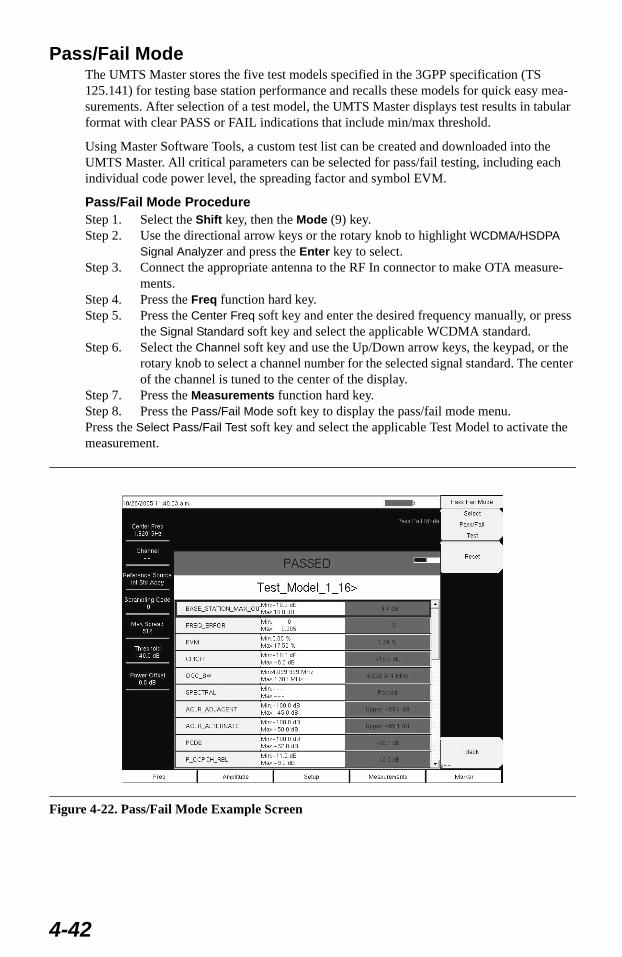
Pass/Fail Mode The UMTS Master stores the five test models specified in the 3GPP specification (TS 125.141) for testing base station performance and recalls these models for quick easy mea-surements. After selection of a test model, the UMTS Master displays test results in tabular format with clear PASS or FAIL indications that include min/max threshold.
Using Master Software Tools, a custom test list can be created and downloaded into the UMTS Master. All critical parameters can be selected for pass/fail testing, including each individual code power level, the spreading factor and symbol EVM.
Pass/Fail Mode ProcedureStep 1. Select the Shift key, then the Mode (9) key. Step 2. Use the directional arrow keys or the rotary knob to highlight WCDMA/HSDPA
Signal Analyzer and press the Enter key to select.Step 3. Connect the appropriate antenna to the RF In connector to make OTA measure-
ments.Step 4. Press the Freq function hard key.Step 5. Press the Center Freq soft key and enter the desired frequency manually, or press
the Signal Standard soft key and select the applicable WCDMA standard.Step 6. Select the Channel soft key and use the Up/Down arrow keys, the keypad, or the
rotary knob to select a channel number for the selected signal standard. The center of the channel is tuned to the center of the display.
Step 7. Press the Measurements function hard key.Step 8. Press the Pass/Fail Mode soft key to display the pass/fail mode menu.Press the Select Pass/Fail Test soft key and select the applicable Test Model to activate the measurement.
Figure 4-22. Pass/Fail Mode Example Screen
4-42
Chapter 5GSM/GPRS/EDGEMeasurements
IntroductionGlobal Systems for Mobile (GSM) communication is a globally accepted standard for digital cellular communication. GSM uses a combination of Frequency Division Multiple Access (FDMA) and Time Division Multiple Access (TDMA). Within each band are approximately one hundred available carrier frequencies on 200 kHz spacing (FDMA), and each carrier is broken up into time-slots so as to support eight separate conversations (TDMA). Each chan-nel has an uplink and a downlink. GSM uses the Gaussian Minimum Shift Keying (GMSK) modulation method.
GPRS/EDGE is an extension of GSM technology and is applicable to data services. GSM/GPRS uses Gaussian Minimum Shift Keying (GMSK) modulation and EGDE uses 8PSK Phase Shift Keying modulation.
The GSM/GPRS/EDGE frequency ranges are 380-400 MHz, 410-430 MHz, 450-468 MHz, 478-496 MHz, 698-746 MHz, 747-792 MHz, 806-866 MHz, 824-894 MHz, 890-960 MHz, 880-960 MHz, 876-960 MHz, 870-921 MHz and 1710-1990 MHz.
The MT8220A UMTS Master features two GSM/GPRS/EDGE measurement modes: RF Measurements and Demodulator. The MT8220A can be directly connected to any GSM/GPRS/EDGE base station for accurate measurements. When a physical connection is not available or required, the MT8220A can receive and demodulate GSM/GPRS/EDGE signals over the air.
GSM/GPRS/EDGE RF measurements (Option 40) provide views of spectrum, power versus time (frame), power versus time (slot) with mask and summary screens.
The spectrum view displays channel spectrum and multichannel spectrum. The channel spectrum screen includes channel power, burst power, average burst power, frequency error, modulation type and Training Sequence Code (TSC). The multichannel spectrum displays as many as ten channels and, using the cursor to select a channel, can display the measurements for just the selected channel.
GSM/GPRS/EDGE Demodulator (Option 41) demodulates GSM/GPRS/EDGE signals and displays the results of detailed measurements to analyze transmitter modulation perfor-mance. Results are shown for phase error (rms), phase error peak, EVM (rms), EVM (peak), origin offset, C/I, modulation type and magnitude error (rms) and a vector diagram of the signal.
This chapter describes the MT8220A UMTS Master keys in GSM/GPRS/EDGE Signal Analyzer mode. The major sections are arranged in alphabetical order with soft key menus listed in the order they appear from top to bottom.
5-1
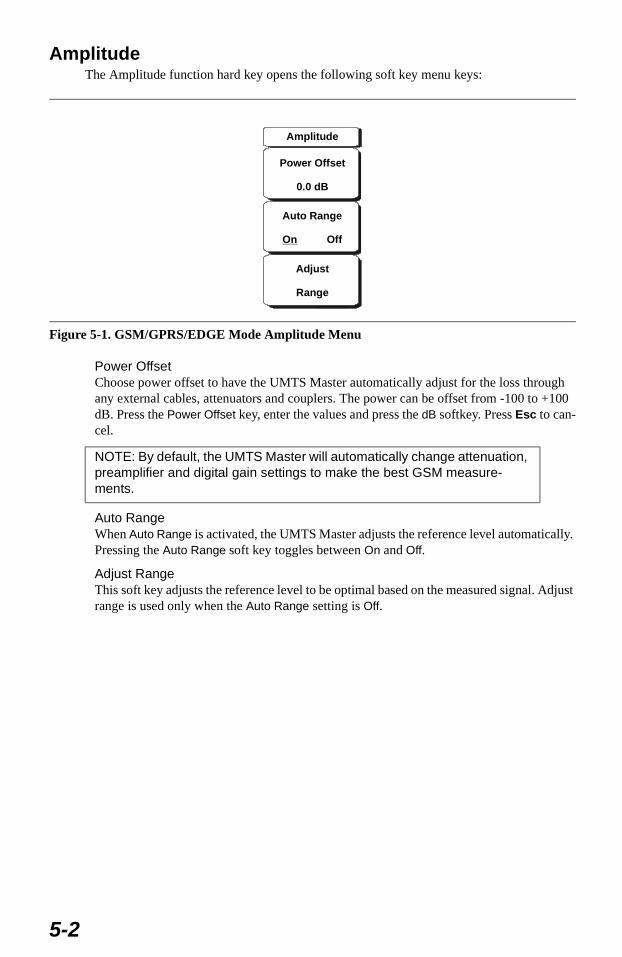
AmplitudeThe Amplitude function hard key opens the following soft key menu keys:
Power Offset Choose power offset to have the UMTS Master automatically adjust for the loss through any external cables, attenuators and couplers. The power can be offset from -100 to +100 dB. Press the Power Offset key, enter the values and press the dB softkey. Press Esc to can-cel.
Auto RangeWhen Auto Range is activated, the UMTS Master adjusts the reference level automatically. Pressing the Auto Range soft key toggles between On and Off.
Adjust RangeThis soft key adjusts the reference level to be optimal based on the measured signal. Adjust range is used only when the Auto Range setting is Off.
Figure 5-1. GSM/GPRS/EDGE Mode Amplitude Menu
NOTE: By default, the UMTS Master will automatically change attenuation, preamplifier and digital gain settings to make the best GSM measure-ments.
Amplitude
Power Offset
0.0 dB
Auto Range
OffOn
Adjust
Range
5-2
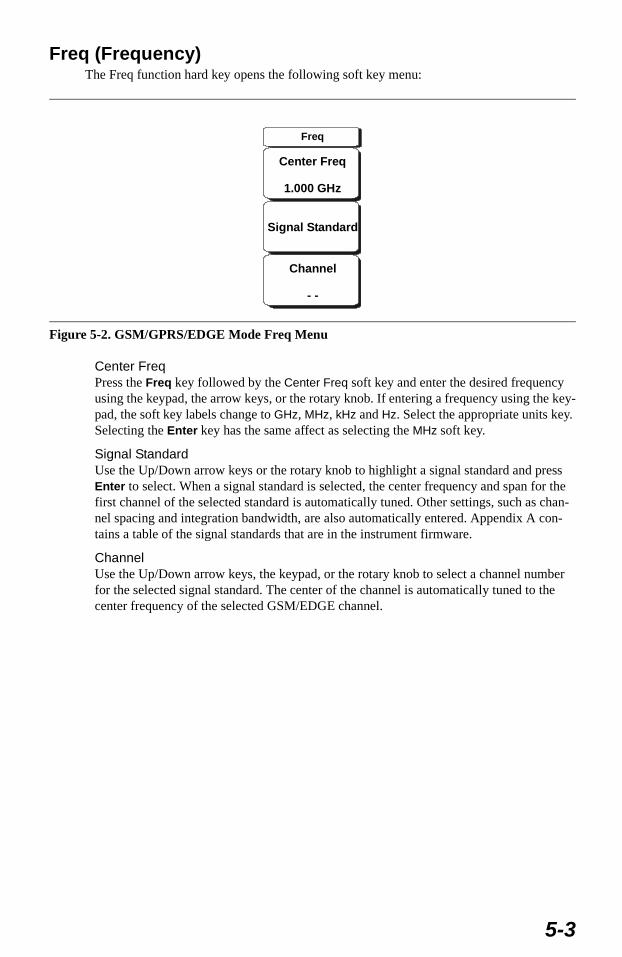
Freq (Frequency)The Freq function hard key opens the following soft key menu:
Center FreqPress the Freq key followed by the Center Freq soft key and enter the desired frequency using the keypad, the arrow keys, or the rotary knob. If entering a frequency using the key-pad, the soft key labels change to GHz, MHz, kHz and Hz. Select the appropriate units key. Selecting the Enter key has the same affect as selecting the MHz soft key.
Signal StandardUse the Up/Down arrow keys or the rotary knob to highlight a signal standard and press Enter to select. When a signal standard is selected, the center frequency and span for the first channel of the selected standard is automatically tuned. Other settings, such as chan-nel spacing and integration bandwidth, are also automatically entered. Appendix A con-tains a table of the signal standards that are in the instrument firmware.
ChannelUse the Up/Down arrow keys, the keypad, or the rotary knob to select a channel number for the selected signal standard. The center of the channel is automatically tuned to the center frequency of the selected GSM/EDGE channel.
Figure 5-2. GSM/GPRS/EDGE Mode Freq Menu
Freq
Center Freq
1.000 GHz
Signal Standard
Channel
- -
5-3
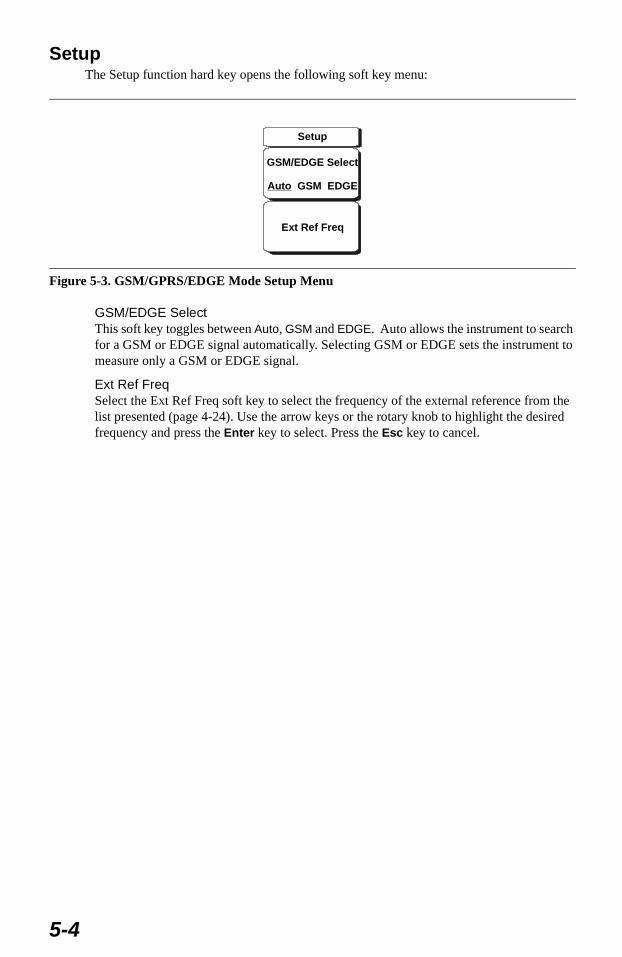
SetupThe Setup function hard key opens the following soft key menu:
GSM/EDGE SelectThis soft key toggles between Auto, GSM and EDGE. Auto allows the instrument to search for a GSM or EDGE signal automatically. Selecting GSM or EDGE sets the instrument to measure only a GSM or EDGE signal.
Ext Ref FreqSelect the Ext Ref Freq soft key to select the frequency of the external reference from the list presented (page 4-24). Use the arrow keys or the rotary knob to highlight the desired frequency and press the Enter key to select. Press the Esc key to cancel.
Figure 5-3. GSM/GPRS/EDGE Mode Setup Menu
Setup
GSM/EDGE Select
GSM EDGEAuto
Ext Ref Freq
5-4
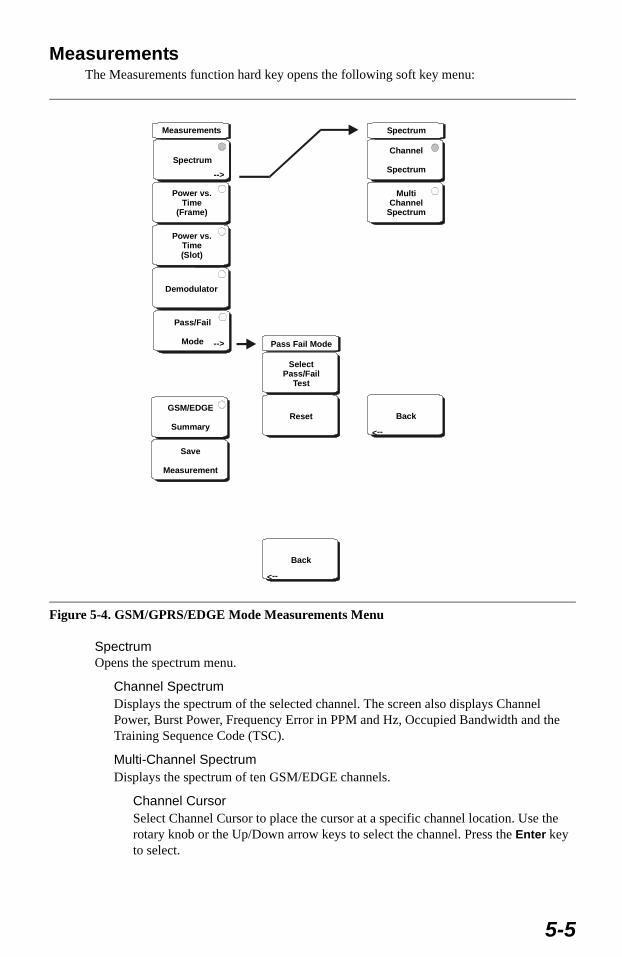
Measurements The Measurements function hard key opens the following soft key menu:
Spectrum Opens the spectrum menu.
Channel Spectrum Displays the spectrum of the selected channel. The screen also displays Channel Power, Burst Power, Frequency Error in PPM and Hz, Occupied Bandwidth and the Training Sequence Code (TSC).
Multi-Channel Spectrum Displays the spectrum of ten GSM/EDGE channels.
Channel CursorSelect Channel Cursor to place the cursor at a specific channel location. Use the rotary knob or the Up/Down arrow keys to select the channel. Press the Enter key to select.
Figure 5-4. GSM/GPRS/EDGE Mode Measurements Menu
GSM/EDGE
Summary
Save
Measurement
Measurements
Power vs.Time
(Frame)
Power vs.Time(Slot)
Spectrum
Demodulator
Pass/Fail
Mode -->
-->
Pass Fail Mode
SelectPass/Fail
Test
Reset
Back
-->
Spectrum
Channel
Spectrum
MultiChannel
Spectrum
Back
-->
5-5
Freq CursorSelect Freq Cursor to place the cursor at a specific frequency. Use the rotary knob or the Up/Down arrow keys to select the frequency. Press the Enter key to select.
Power vs. Time (Frame)Displays approximately eight and a half slots of the GSM/EDGE signal frame starting from the first active slot found. The screen also displays Channel Power, Burst Power, Fre-quency Error in PPM and Hz, Occupied Bandwidth and Training Sequence Code (TSC).
Power vs. Time (Slot)Displays the first active slot of the GSM/EDGE signal capture. The mask is as specified in 3GPP TS 05.05. The screen also displays Channel Power, Burst Power, Frequency Error in PPM and Hz, Occupied Bandwidth and Training Sequence Code (TSC).
DemodulatorDisplays the IQ vector of the GSM/EDGE signal. The screen also displays Phase Err RMS, Phase Err Pk, EVM (rms), EVM (pk), Origin Offset (dBc), C/I (dB), Modulation Type and Magnitude Error (rms).
Pass/Fail ModeDisplays the Pass/Fail Mode menu.
Select Pass/Fail Test Display the available test sets.
ResetResets the Pass/Fail Mode test.
BackReturns to the previous menu.
GSM/EDGE Summary Displays the measurement results in a table format.
GSM/GPRS/EDGE Pass/Fail modeDisplays the Pass/Fail measurements in a table format with clear pass or fail indicators that include min/max thresholds and actual measured results.
Save MeasurementInitiates a dialog box to name and save the current measurement. The saved measurement trace can be named using the keypad to select numbers, the rotary knob to highlight a num-ber or character and pressing the knob to select, or by selecting the soft key for each letter. Use the Shift key to select an upper case letter. Use the Left/Right directional arrows to move the cursor position. Press Enter to save the measurement trace.
NOTE: GSM uses GMSK modulation and EDGE uses 8 PSK modulation. EVM (rms), EVM(pk), Orgin Offset, C/I are not measured for GSM signals (shows N/A on the display).
NOTE: If a measurement has been previously saved, the Save Measure-ment dialog box will open with the previously saved name displayed. To save the new measurement with a similar name (for example, Trace-1, Trace-2, etc.) simply press the Right directional arrow and add the changes. To create a completely new name, use the keypad, the rotary knob or select the soft key for each letter. GSM measurements are saved with a .gsm file extension, and EDGE measurements are saved with a .edg extension.
5-6
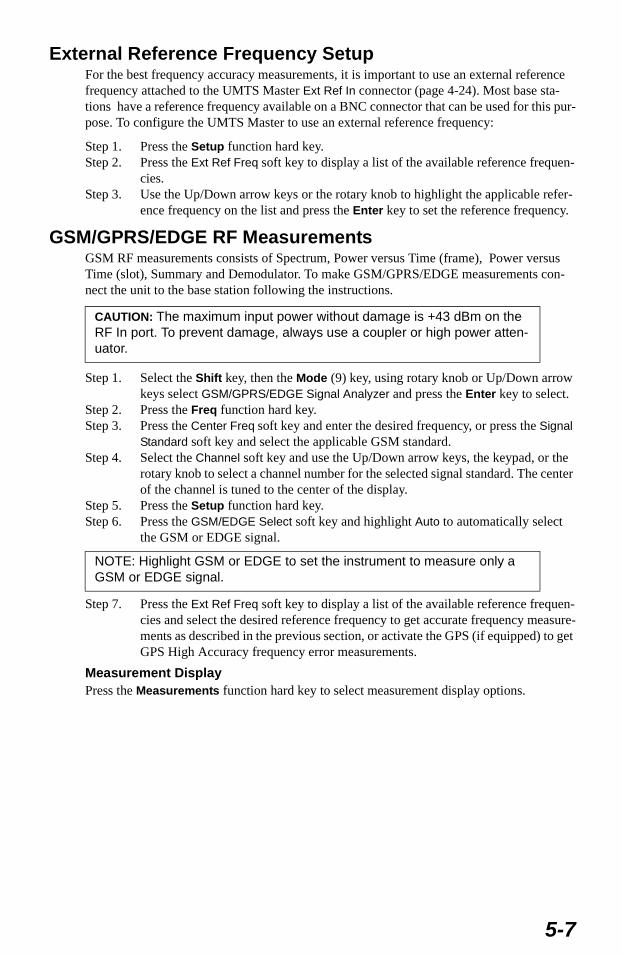
External Reference Frequency SetupFor the best frequency accuracy measurements, it is important to use an external reference frequency attached to the UMTS Master Ext Ref In connector (page 4-24). Most base sta-tions have a reference frequency available on a BNC connector that can be used for this pur-pose. To configure the UMTS Master to use an external reference frequency:
Step 1. Press the Setup function hard key.Step 2. Press the Ext Ref Freq soft key to display a list of the available reference frequen-
cies.Step 3. Use the Up/Down arrow keys or the rotary knob to highlight the applicable refer-
ence frequency on the list and press the Enter key to set the reference frequency.
GSM/GPRS/EDGE RF Measurements GSM RF measurements consists of Spectrum, Power versus Time (frame), Power versus Time (slot), Summary and Demodulator. To make GSM/GPRS/EDGE measurements con-nect the unit to the base station following the instructions.
Step 1. Select the Shift key, then the Mode (9) key, using rotary knob or Up/Down arrow keys select GSM/GPRS/EDGE Signal Analyzer and press the Enter key to select.
Step 2. Press the Freq function hard key.Step 3. Press the Center Freq soft key and enter the desired frequency, or press the Signal
Standard soft key and select the applicable GSM standard.Step 4. Select the Channel soft key and use the Up/Down arrow keys, the keypad, or the
rotary knob to select a channel number for the selected signal standard. The center of the channel is tuned to the center of the display.
Step 5. Press the Setup function hard key. Step 6. Press the GSM/EDGE Select soft key and highlight Auto to automatically select
the GSM or EDGE signal.
Step 7. Press the Ext Ref Freq soft key to display a list of the available reference frequen-cies and select the desired reference frequency to get accurate frequency measure-ments as described in the previous section, or activate the GPS (if equipped) to get GPS High Accuracy frequency error measurements.
Measurement DisplayPress the Measurements function hard key to select measurement display options.
CAUTION: The maximum input power without damage is +43 dBm on the RF In port. To prevent damage, always use a coupler or high power atten-uator.
NOTE: Highlight GSM or EDGE to set the instrument to measure only a GSM or EDGE signal.
5-7
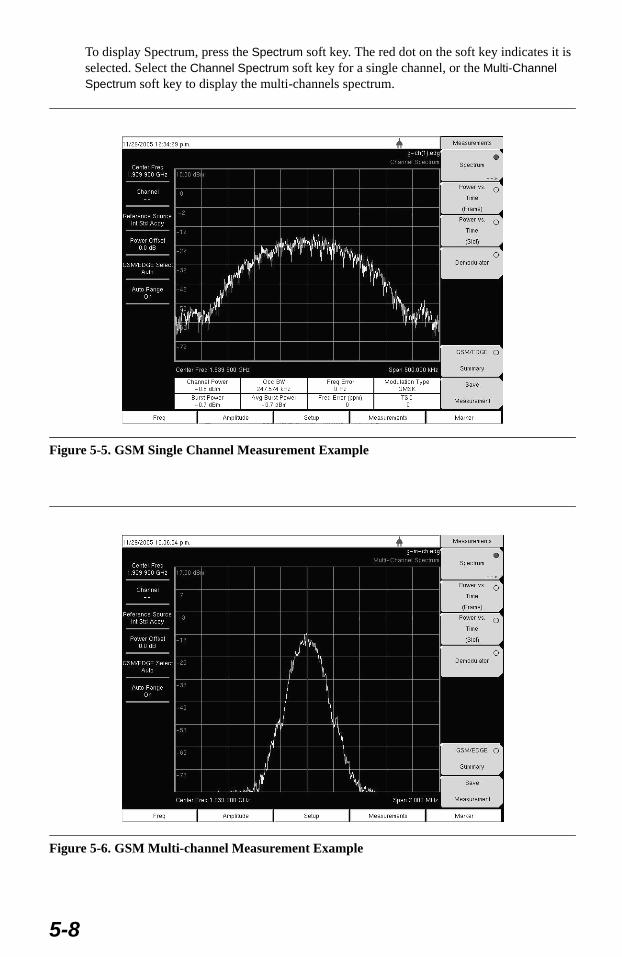
To display Spectrum, press the Spectrum soft key. The red dot on the soft key indicates it is selected. Select the Channel Spectrum soft key for a single channel, or the Multi-Channel Spectrum soft key to display the multi-channels spectrum.
Figure 5-5. GSM Single Channel Measurement Example
Figure 5-6. GSM Multi-channel Measurement Example
5-8
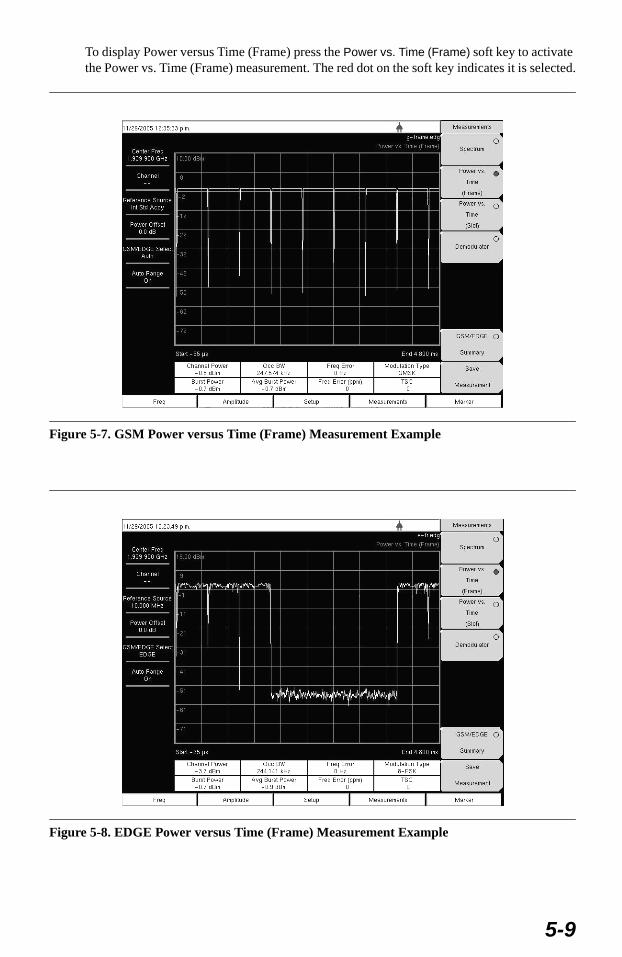
To display Power versus Time (Frame) press the Power vs. Time (Frame) soft key to activate the Power vs. Time (Frame) measurement. The red dot on the soft key indicates it is selected.
Figure 5-7. GSM Power versus Time (Frame) Measurement Example
Figure 5-8. EDGE Power versus Time (Frame) Measurement Example
5-9
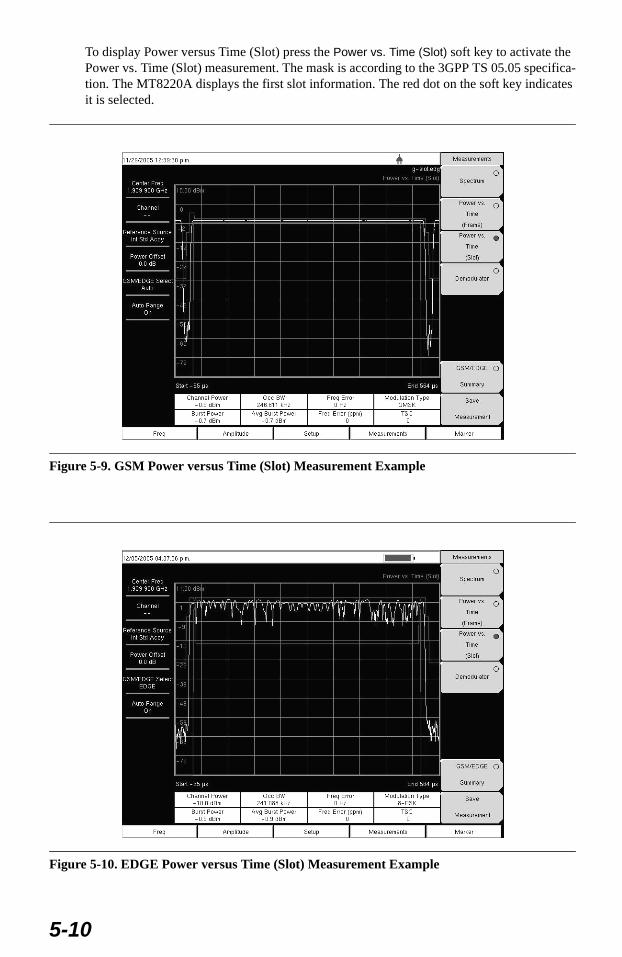
To display Power versus Time (Slot) press the Power vs. Time (Slot) soft key to activate the Power vs. Time (Slot) measurement. The mask is according to the 3GPP TS 05.05 specifica-tion. The MT8220A displays the first slot information. The red dot on the soft key indicates it is selected.
Figure 5-9. GSM Power versus Time (Slot) Measurement Example
Figure 5-10. EDGE Power versus Time (Slot) Measurement Example
5-10
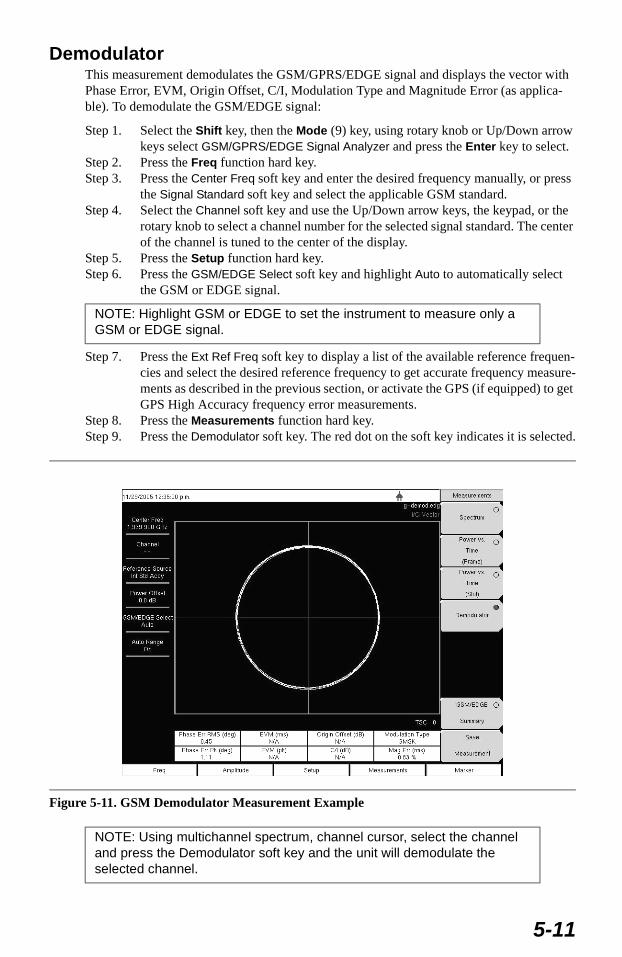
Demodulator This measurement demodulates the GSM/GPRS/EDGE signal and displays the vector with Phase Error, EVM, Origin Offset, C/I, Modulation Type and Magnitude Error (as applica-ble). To demodulate the GSM/EDGE signal:
Step 1. Select the Shift key, then the Mode (9) key, using rotary knob or Up/Down arrow keys select GSM/GPRS/EDGE Signal Analyzer and press the Enter key to select.
Step 2. Press the Freq function hard key.Step 3. Press the Center Freq soft key and enter the desired frequency manually, or press
the Signal Standard soft key and select the applicable GSM standard.Step 4. Select the Channel soft key and use the Up/Down arrow keys, the keypad, or the
rotary knob to select a channel number for the selected signal standard. The center of the channel is tuned to the center of the display.
Step 5. Press the Setup function hard key. Step 6. Press the GSM/EDGE Select soft key and highlight Auto to automatically select
the GSM or EDGE signal.
Step 7. Press the Ext Ref Freq soft key to display a list of the available reference frequen-cies and select the desired reference frequency to get accurate frequency measure-ments as described in the previous section, or activate the GPS (if equipped) to get GPS High Accuracy frequency error measurements.
Step 8. Press the Measurements function hard key.Step 9. Press the Demodulator soft key. The red dot on the soft key indicates it is selected.
NOTE: Highlight GSM or EDGE to set the instrument to measure only a GSM or EDGE signal.
Figure 5-11. GSM Demodulator Measurement Example
NOTE: Using multichannel spectrum, channel cursor, select the channel and press the Demodulator soft key and the unit will demodulate the selected channel.
5-11
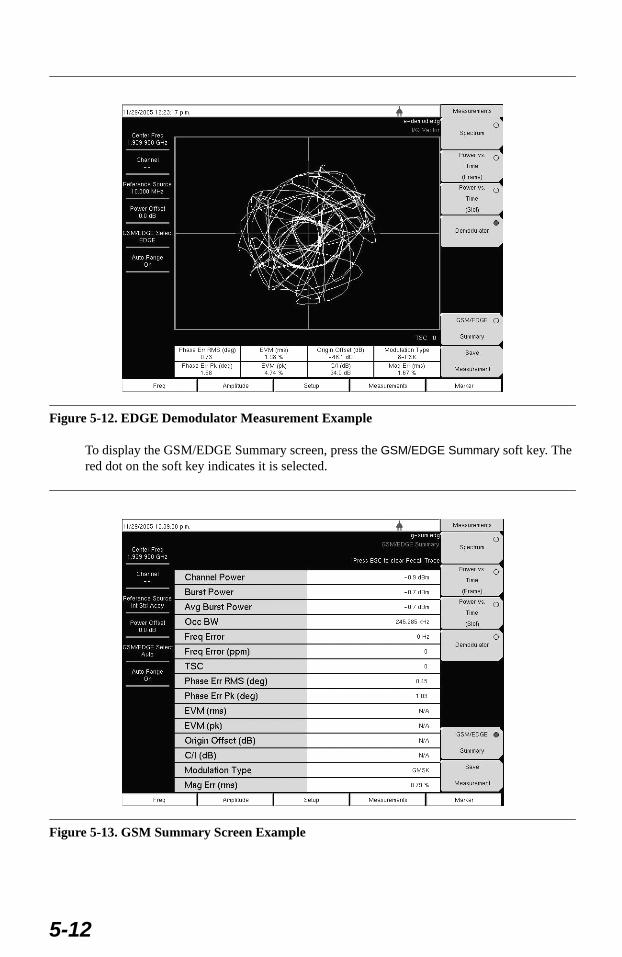
To display the GSM/EDGE Summary screen, press the GSM/EDGE Summary soft key. The red dot on the soft key indicates it is selected.
Figure 5-12. EDGE Demodulator Measurement Example
Figure 5-13. GSM Summary Screen Example
5-12
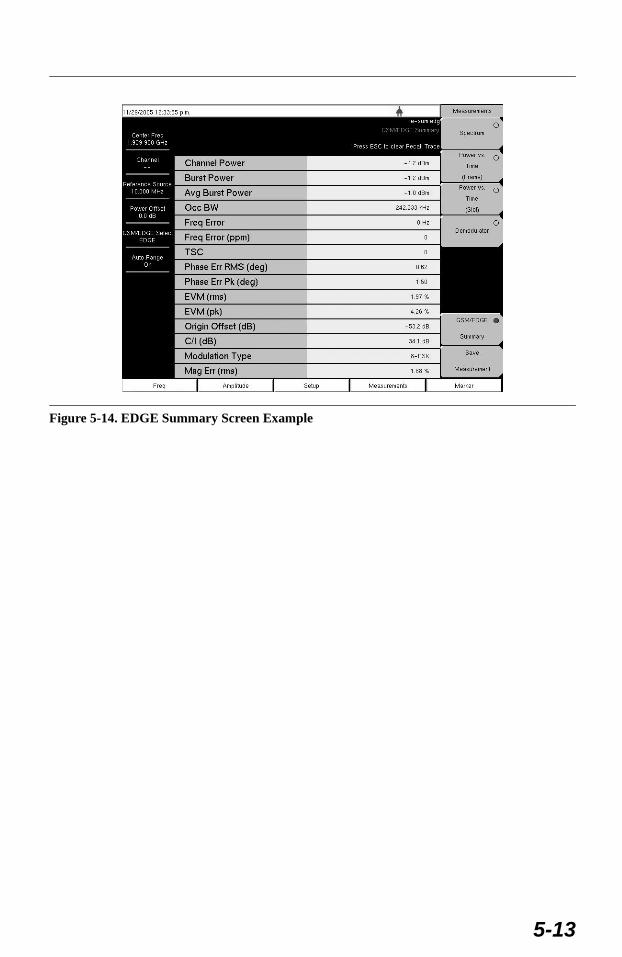
Figure 5-14. EDGE Summary Screen Example
5-13
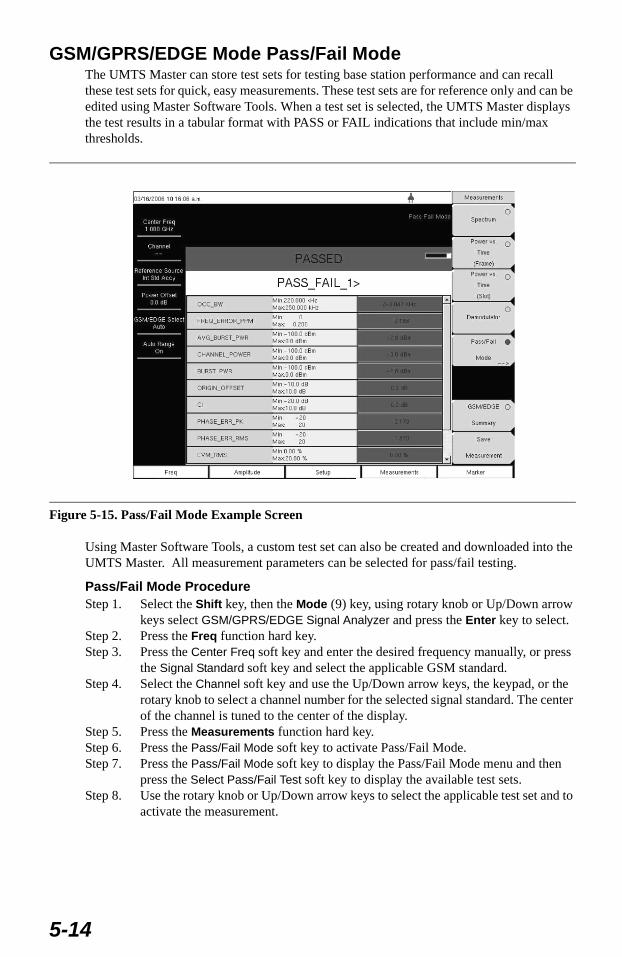
GSM/GPRS/EDGE Mode Pass/Fail ModeThe UMTS Master can store test sets for testing base station performance and can recall these test sets for quick, easy measurements. These test sets are for reference only and can be edited using Master Software Tools. When a test set is selected, the UMTS Master displays the test results in a tabular format with PASS or FAIL indications that include min/max thresholds.
Using Master Software Tools, a custom test set can also be created and downloaded into the UMTS Master. All measurement parameters can be selected for pass/fail testing.
Pass/Fail Mode ProcedureStep 1. Select the Shift key, then the Mode (9) key, using rotary knob or Up/Down arrow
keys select GSM/GPRS/EDGE Signal Analyzer and press the Enter key to select.Step 2. Press the Freq function hard key.Step 3. Press the Center Freq soft key and enter the desired frequency manually, or press
the Signal Standard soft key and select the applicable GSM standard.Step 4. Select the Channel soft key and use the Up/Down arrow keys, the keypad, or the
rotary knob to select a channel number for the selected signal standard. The center of the channel is tuned to the center of the display.
Step 5. Press the Measurements function hard key.Step 6. Press the Pass/Fail Mode soft key to activate Pass/Fail Mode.Step 7. Press the Pass/Fail Mode soft key to display the Pass/Fail Mode menu and then
press the Select Pass/Fail Test soft key to display the available test sets. Step 8. Use the rotary knob or Up/Down arrow keys to select the applicable test set and to
activate the measurement.
Figure 5-15. Pass/Fail Mode Example Screen
5-14
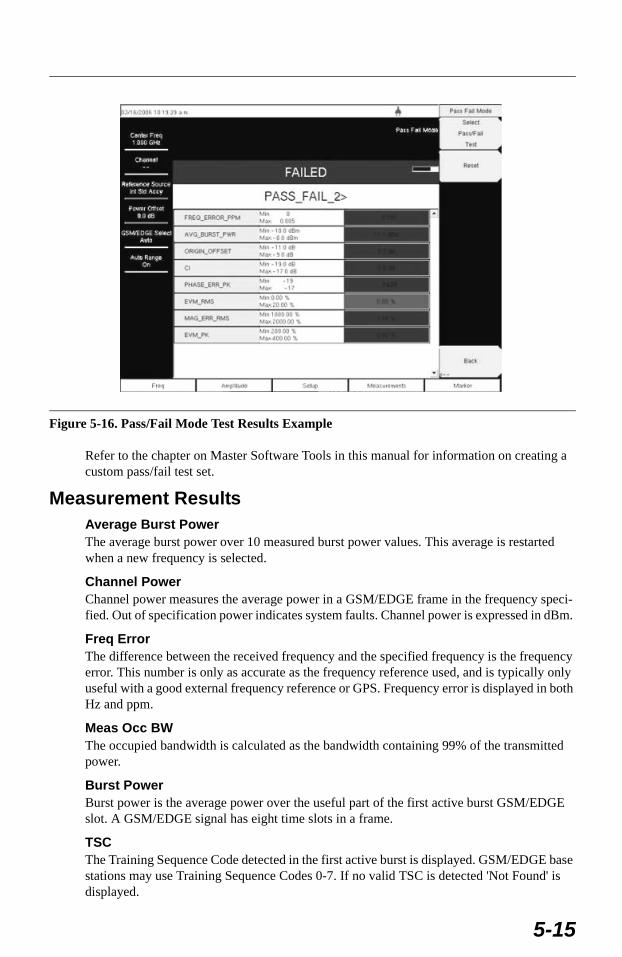
Refer to the chapter on Master Software Tools in this manual for information on creating a custom pass/fail test set.
Measurement ResultsAverage Burst PowerThe average burst power over 10 measured burst power values. This average is restarted when a new frequency is selected.
Channel PowerChannel power measures the average power in a GSM/EDGE frame in the frequency speci-fied. Out of specification power indicates system faults. Channel power is expressed in dBm.
Freq Error The difference between the received frequency and the specified frequency is the frequency error. This number is only as accurate as the frequency reference used, and is typically only useful with a good external frequency reference or GPS. Frequency error is displayed in both Hz and ppm.
Meas Occ BW The occupied bandwidth is calculated as the bandwidth containing 99% of the transmitted power.
Burst Power Burst power is the average power over the useful part of the first active burst GSM/EDGE slot. A GSM/EDGE signal has eight time slots in a frame.
TSCThe Training Sequence Code detected in the first active burst is displayed. GSM/EDGE base stations may use Training Sequence Codes 0-7. If no valid TSC is detected 'Not Found' is displayed.
Figure 5-16. Pass/Fail Mode Test Results Example
5-15
Phase Err RMS (deg)The RMS phase error in degrees between the received signal and an ideal reconstructed ref-erence signal of the first active slot.
Phase Err Pk (deg)The peak phase error in degrees between the received signal and an ideal reconstructed refer-ence signal of the first active slot.
EVM (rms)The RMS (%) of all the error vectors between the ideal reconstructed reference symbol points and the received symbol points divided by the RMS value of the signal present in the first active slot. This measurement is performed for 8PSK modulated signals (EDGE) only.
EVM (pk)The peak (%) of all the error vectors between the ideal reconstructed reference symbol points and the received symbol points divided by the RMS value of the signal present in the first active slot. This measurement is performed for 8PSK modulated signals (EDGE) only.
Origin Offset (dB)Origin Offset is the carrier leakage component of the measured signal in dB and this mea-surement is applicable to EDGE signal only.
Carrier to Interference Ratio - C/I (dB)Carrier to Interference Ratio is the ratio of the desired carrier power to the undesired signal power (interferer) in dB. This value is an estimate that is derived from the measured RMS EVM value. This measurement is applicable to an EDGE signal only.
Modulation typeThe modulation type can be GMSK (for GSM signals) or 8PSK (for EDGE signals).
Mag Err (rms) The RMS of the magnitude error between the received signal and an ideal reconstructed ref-erence signal of the first active slot in %.
5-16
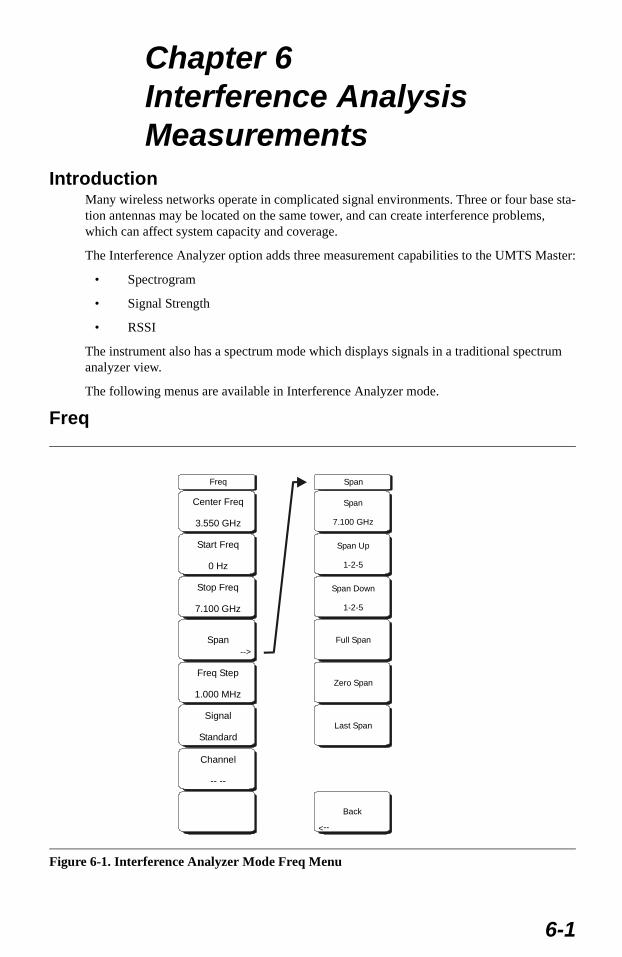
Chapter 6Interference AnalysisMeasurements
IntroductionMany wireless networks operate in complicated signal environments. Three or four base sta-tion antennas may be located on the same tower, and can create interference problems, which can affect system capacity and coverage.
The Interference Analyzer option adds three measurement capabilities to the UMTS Master:
• Spectrogram
• Signal Strength
• RSSI
The instrument also has a spectrum mode which displays signals in a traditional spectrum analyzer view.
The following menus are available in Interference Analyzer mode.
Freq
Figure 6-1. Interference Analyzer Mode Freq Menu
Back
-->
Freq Span
Span
7.100 GHz
Span Up
1-2-5
Span Down
1-2-5
Full Span
Zero Span
Last Span
Center Freq
3.550 GHz
Start Freq
0 Hz
Stop Freq
7.100 GHz
Span
Freq Step
1.000 MHz
Signal
Standard
Channel
-- --
-->
6-1
The tuning frequency range for the MT8220A can be entered in several different ways depending on what makes the most sense for the user or for the application. The center fre-quency and span can be specified, the start and stop frequencies can be entered, or a signal standard and channel number can be selected from the built-in list.
Center FreqPress the Freq key followed by the Center Freq soft key and enter the desired frequency using the keypad, the arrow keys, or the rotary knob. If entering a frequency using the key-pad, the soft key labels change to GHz, MHz, kHz and Hz. Select the appropriate units key. Selecting the Enter key has the same affect as the MHz soft key.
Start FreqPress the Freq key followed by the Start Freq soft key and enter the desired frequency using the keypad, the arrow keys, or the rotary knob. If a start frequency higher than the current stop frequency is entered, the stop frequency will be changed to yield a 10 Hz span.
Stop FreqPress the Freq key followed by the Stop Freq soft key and enter the desired frequency using the keypad, the arrow keys, or the rotary knob. If a stop frequency lower than the current start frequency is entered, the start frequency will be changed to yield a 10 Hz span.
SpanPress the Freq key followed by the Span soft key and enter the desired span. The Span menu is used to set the frequency range over which the instrument will sweep. For the MT8220A, the span can be set from 10 Hz to 7.1 GHz. The span can also be set to zero.
The soft key shows the current value for span in units of GHz, MHz, kHz or Hz. When the Span button is pressed, span becomes the active parameter and may be changed. Use the keypad, the directional arrow keys or the rotary knob to increase or decrease the span fre-quency. If the span is changed using the Up/Down arrow keys, the span changes by the value of the Frequency Step for each key press.
Freq StepPress the Freq key followed by the Freq Step soft key to enter the desired frequency step size. The frequency step specifies the amount by which a frequency will change when the Up/Down arrow key is pressed. The center frequency, start frequency, and stop frequency values can be changed using Freq Step. The active parameter will be changed by the fre-quency step when the Up/Down arrow keys are pressed. If Freq Step is the active parame-ter, nothing happens when the arrow keys are pressed. The frequency step size can be any value from 1 Hz to 7.1 GHz with a resolution of 1 Hz.
Use the keypad or the rotary knob to change the Frequency Step size.
Signal StandardUse the Up/Down arrow keys or the rotary knob to highlight a signal standard and press Enter to select.
NOTE: When using the up and down arrows, the frequency moves in steps defined by the value entered using the Freq Step soft key.When using the left or right arrow keys, the frequency of the active param-eter moves by 10% of the current frequency span. If the instrument is in zero span, the left and right arrows do nothing.Turning the rotary knob changes the active frequency parameter in incre-ments of one display point for each click of the knob. There are 551 dis-play points across the screen (661 points in full-screen mode).
6-2
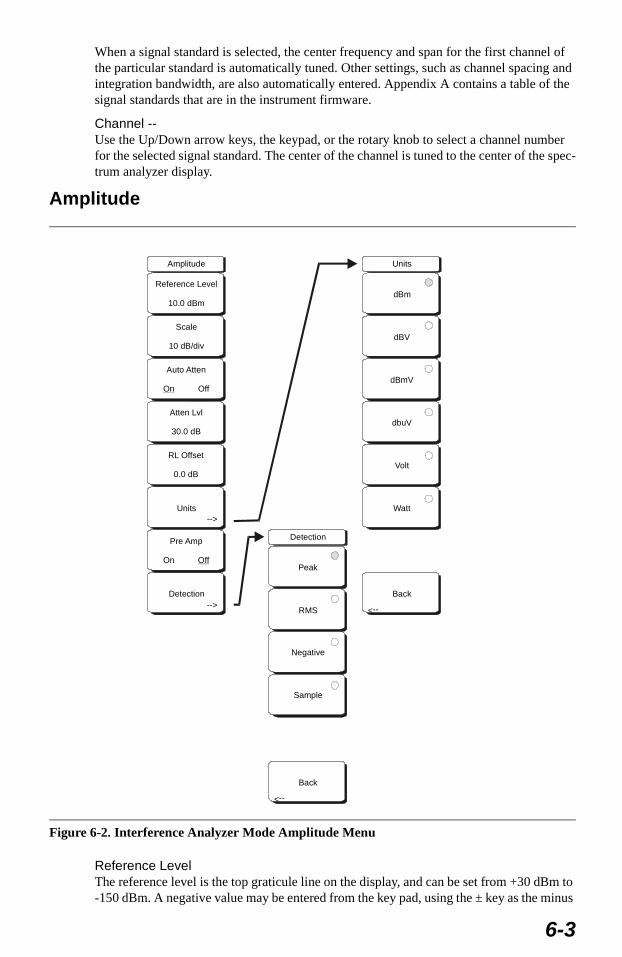
When a signal standard is selected, the center frequency and span for the first channel of the particular standard is automatically tuned. Other settings, such as channel spacing and integration bandwidth, are also automatically entered. Appendix A contains a table of the signal standards that are in the instrument firmware.
Channel --Use the Up/Down arrow keys, the keypad, or the rotary knob to select a channel number for the selected signal standard. The center of the channel is tuned to the center of the spec-trum analyzer display.
Amplitude
Reference LevelThe reference level is the top graticule line on the display, and can be set from +30 dBm to -150 dBm. A negative value may be entered from the key pad, using the ± key as the minus
Figure 6-2. Interference Analyzer Mode Amplitude Menu
Amplitude
Reference Level
10.0 dBm
Scale
10 dB/div
Auto Atten
OffOn
Atten Lvl
30.0 dB
RL Offset
0.0 dB
Units-->
Units
Watt
Back
dBm
dBV
dBmV
dbuV
Volt
-->
Detection
Detection
Back
Peak
RMS
Negative
Sample
-->
Pre Amp
On Off
-->
6-3
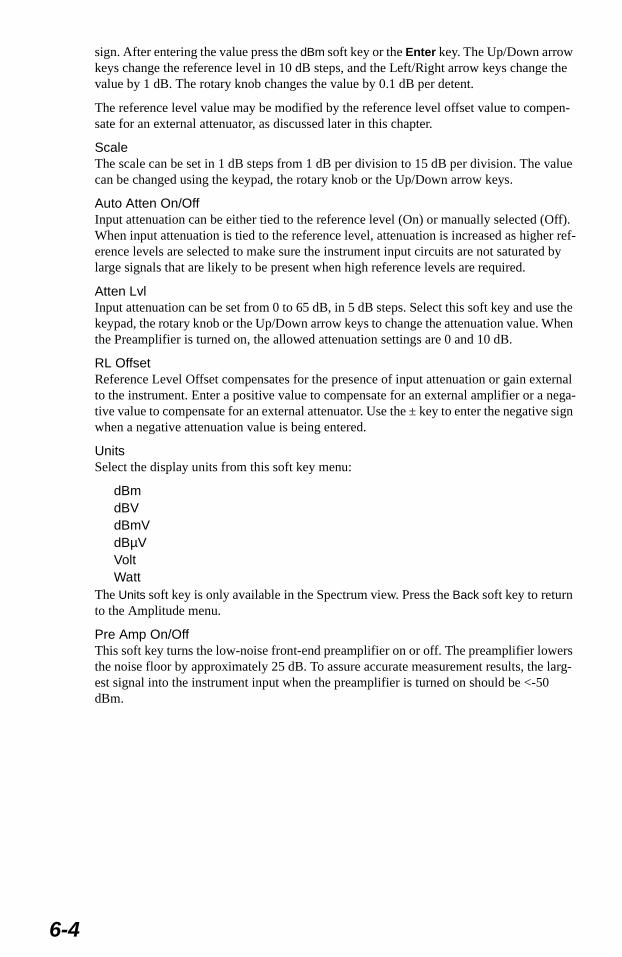
sign. After entering the value press the dBm soft key or the Enter key. The Up/Down arrow keys change the reference level in 10 dB steps, and the Left/Right arrow keys change the value by 1 dB. The rotary knob changes the value by 0.1 dB per detent.
The reference level value may be modified by the reference level offset value to compen-sate for an external attenuator, as discussed later in this chapter.
Scale The scale can be set in 1 dB steps from 1 dB per division to 15 dB per division. The value can be changed using the keypad, the rotary knob or the Up/Down arrow keys.
Auto Atten On/OffInput attenuation can be either tied to the reference level (On) or manually selected (Off). When input attenuation is tied to the reference level, attenuation is increased as higher ref-erence levels are selected to make sure the instrument input circuits are not saturated by large signals that are likely to be present when high reference levels are required.
Atten LvlInput attenuation can be set from 0 to 65 dB, in 5 dB steps. Select this soft key and use the keypad, the rotary knob or the Up/Down arrow keys to change the attenuation value. When the Preamplifier is turned on, the allowed attenuation settings are 0 and 10 dB.
RL OffsetReference Level Offset compensates for the presence of input attenuation or gain external to the instrument. Enter a positive value to compensate for an external amplifier or a nega-tive value to compensate for an external attenuator. Use the ± key to enter the negative sign when a negative attenuation value is being entered.
UnitsSelect the display units from this soft key menu:
dBmdBVdBmVdBµVVoltWatt
The Units soft key is only available in the Spectrum view. Press the Back soft key to return to the Amplitude menu.
Pre Amp On/OffThis soft key turns the low-noise front-end preamplifier on or off. The preamplifier lowers the noise floor by approximately 25 dB. To assure accurate measurement results, the larg-est signal into the instrument input when the preamplifier is turned on should be <-50 dBm.
6-4
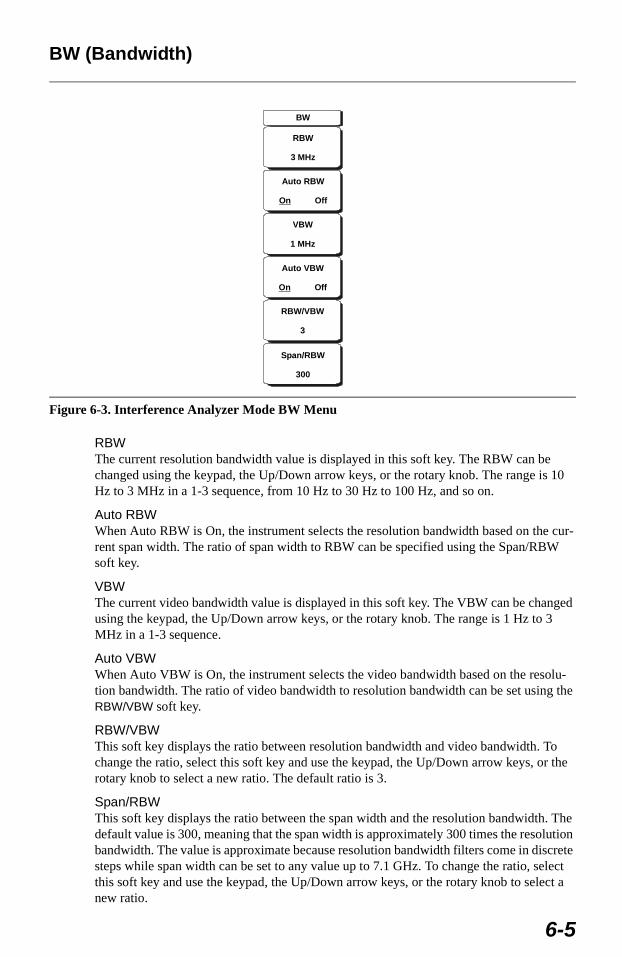
BW (Bandwidth)
RBWThe current resolution bandwidth value is displayed in this soft key. The RBW can be changed using the keypad, the Up/Down arrow keys, or the rotary knob. The range is 10 Hz to 3 MHz in a 1-3 sequence, from 10 Hz to 30 Hz to 100 Hz, and so on.
Auto RBWWhen Auto RBW is On, the instrument selects the resolution bandwidth based on the cur-rent span width. The ratio of span width to RBW can be specified using the Span/RBW soft key.
VBWThe current video bandwidth value is displayed in this soft key. The VBW can be changed using the keypad, the Up/Down arrow keys, or the rotary knob. The range is 1 Hz to 3 MHz in a 1-3 sequence.
Auto VBWWhen Auto VBW is On, the instrument selects the video bandwidth based on the resolu-tion bandwidth. The ratio of video bandwidth to resolution bandwidth can be set using the RBW/VBW soft key.
RBW/VBWThis soft key displays the ratio between resolution bandwidth and video bandwidth. To change the ratio, select this soft key and use the keypad, the Up/Down arrow keys, or the rotary knob to select a new ratio. The default ratio is 3.
Span/RBWThis soft key displays the ratio between the span width and the resolution bandwidth. The default value is 300, meaning that the span width is approximately 300 times the resolution bandwidth. The value is approximate because resolution bandwidth filters come in discrete steps while span width can be set to any value up to 7.1 GHz. To change the ratio, select this soft key and use the keypad, the Up/Down arrow keys, or the rotary knob to select a new ratio.
Figure 6-3. Interference Analyzer Mode BW Menu
BW
RBW
3 MHz
Auto RBW
OffOn
Auto VBW
OffOn
VBW
1 MHz
Span/RBW
300
RBW/VBW
3
6-5
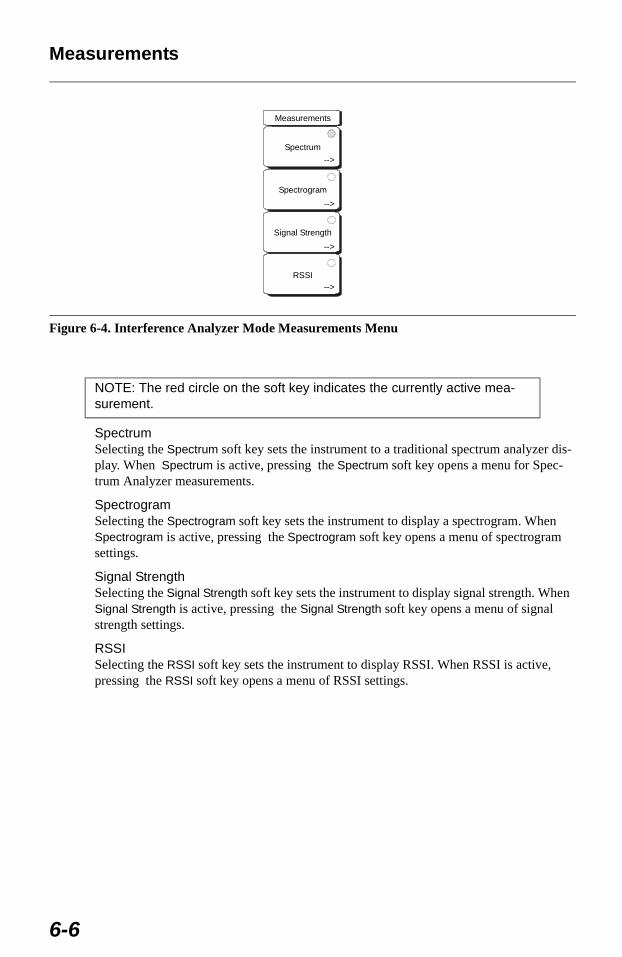
Measurements
SpectrumSelecting the Spectrum soft key sets the instrument to a traditional spectrum analyzer dis-play. When Spectrum is active, pressing the Spectrum soft key opens a menu for Spec-trum Analyzer measurements.
SpectrogramSelecting the Spectrogram soft key sets the instrument to display a spectrogram. When Spectrogram is active, pressing the Spectrogram soft key opens a menu of spectrogram settings.
Signal StrengthSelecting the Signal Strength soft key sets the instrument to display signal strength. When Signal Strength is active, pressing the Signal Strength soft key opens a menu of signal strength settings.
RSSISelecting the RSSI soft key sets the instrument to display RSSI. When RSSI is active, pressing the RSSI soft key opens a menu of RSSI settings.
Figure 6-4. Interference Analyzer Mode Measurements Menu
NOTE: The red circle on the soft key indicates the currently active mea-surement.
Measurements
Spectrum
Spectrogram
Signal Strength
RSSI
-->
-->
-->
-->
6-6
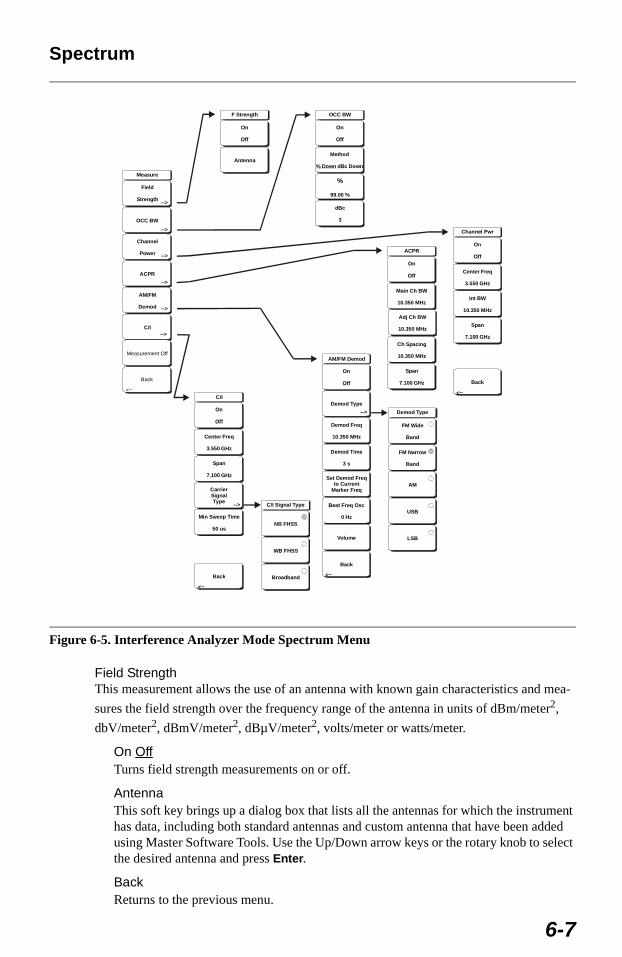
Spectrum
Field StrengthThis measurement allows the use of an antenna with known gain characteristics and mea-
sures the field strength over the frequency range of the antenna in units of dBm/meter2,
dbV/meter2, dBmV/meter2, dBµV/meter2, volts/meter or watts/meter.
On OffTurns field strength measurements on or off.
AntennaThis soft key brings up a dialog box that lists all the antennas for which the instrument has data, including both standard antennas and custom antenna that have been added using Master Software Tools. Use the Up/Down arrow keys or the rotary knob to select the desired antenna and press Enter.
BackReturns to the previous menu.
Figure 6-5. Interference Analyzer Mode Spectrum Menu
Back
-->
Measure
Field
Strength
OCC BW
Channel
Power
ACPR
AM/FM
Demod
C/I-->
-->
-->
-->
-->
-->
F Strength
On
Off
Antenna
OCC BW
On
Off
Method
dBc Down% Down
%
99.00 %
dBc
3
Channel Pwr
On
Off
Center Freq
3.550 GHz
Int BW
10.350 MHz
Span
7.100 GHz
ACPR
Main Ch BW
10.350 MHz
Ch Spacing
10.350 MHz
Adj Ch BW
10.350 MHz
Span
7.100 GHz
On
Off
C/I
On
Off
Center Freq
3.550 GHz
Span
7.100 GHz
CarrierSignalType
Min Sweep Time
50 us
--> C/I Signal Type
NB FHSS
WB FHSS
Broadband
AM/FM Demod
Beat Freq Osc
0 Hz
Volume
Back
On
Off
Demod Type
Demod Freq
10.350 MHz
Demod Time
3 s
Set Demod Freqto Current
Marker Freq
-->
-->Back
-->
Back
-->
Demod Type
FM Wide
Band
FM Narrow
Band
AM
USB
LSB
Measurement Off
6-7
OCC BWActivates the occupied bandwidth menu. Select either % or dBc method of occupied band-width measurement.
Method % Down/dBc Down Select either the % of Power (default) or dB Down measurement method as displayed in the message area.
%Use the keypad, the directional arrow keys or the rotary knob to enter the percent of power, from 0 to 99%.
dBcUse the keypad, the directional arrow keys or the rotary knob to enter the dBc value (0 to 120 dB).
BackReturns to the previous menu.
Channel PowerActivates the Channel Power measurement function. Channel Power and Channel Power Density are measured based on the selection in the Units menu.
On OffBegins or ends the channel power measurement. When the measurement is on, Ch Pwr will appear below the display. The detection method will automatically be changed to RMS Average when the measurement is started. The detection method can be modified by pressing the Shift and the Sweep keys and selecting the Detection soft key.
Center FreqActivates the center frequency function, and sets the center frequency of the UMTS Master for the channel power measurement. Use the keypad, the directional arrow keys or the rotary knob to enter the center frequency.
Int BWSets the integration bandwidth for channel power measurement. Modifying this value automatically adjusts the channel span to maintain the same ratio. Use the keypad, the directional arrow keys or the rotary knob to enter the integration bandwidth.
SpanSets the channel span for channel power measurement. Use the keypad, the directional arrow keys or the rotary knob to enter the channel span.
BackReturns to the previous menu.
ACPRAccesses a menu of Adjacent Channel Power Ratio measurement options:
On OffBegins or ends the ACPR measurement.
Main Ch BWSets the bandwidth of the main channel for ACPR measurement. Use the keypad, the directional arrow keys or the rotary knob to enter the a specific frequency. When using the keypad, select the GHz, MHz, kHz, or Hz soft key to accept the frequency input. Changing this value automatically changes the adjacent channel bandwidth and chan-nel spacing.
6-8
Adj Ch BWSets the bandwidth of the adjacent channels for ACPR measurement. Use the keypad, the directional arrow keys or the rotary knob to enter the a specific frequency. When using the keypad, select the GHz, MHz, kHz, or Hz soft key to accept the frequency input.
Ch SpacingSets the channel spacing between the main and adjacent channels. Use the keypad, the directional arrow keys or the rotary knob to enter the a specific frequency. When using the keypad, select the GHz, MHz, kHz, or Hz soft key to accept the frequency input. This value must be greater than or equal to half of the main channel bandwidth, plus half of the adjacent channel bandwidth.
BackReturns to the previous menu.
AM/FM Demod The user can select AM, Narrow Band FM (300 µs de-emphasis), Wide Band FM (50 µs de-emphasis), Upper Sideband or Lower Sideband.
On OffTurns AM/FM Demodulation on or off.
Demod TypeProvides soft keys to select the type of signal to be demodulated:
FM Wide BandFM Narrow BandAMUSBLSB
Demod FreqUse the keypad, the directional arrow keys or the rotary knob to enter the center fre-quency of the signal to be demodulated. This frequency does not have to be within the current frequency sweep range to which the instrument is set.
Demod TimeUse the keypad, the directional arrow keys or the rotary knob to increase or decrease the demodulation time, and press the Enter key to select. The demodulation time can be set from 100 milliseconds to 200 seconds. The instrument sweeps one time for every demodulation period. Sweeping pauses during the demodulation time.
Set Demod Freq to Current Marker FreqSets the demodulation frequency to the frequency of the current marker.
Beat Freq OscSets the beat frequency of the oscillator to exactly set the demodulation frequency of USB and LSB signals.
VolumeThe current volume setting is displayed on the screen. Use the Up/Down arrow keys or rotary knob to change the volume, and press the Enter key to select.
BackReturns to the previous menu.
6-9
C/IThe Carrier to Interference ratio is a two-step measurement sequence that first measures the amplitude of a carrier, then, with the carrier turned off, measures the amplitude of all other interfering signals within the channel bandwidth.
On OffStarts and stops the carrier to interference measurement.
Center FreqUse the keypad, the directional arrow keys or the rotary knob to enter the center fre-quency.
SpanUse the keypad, the directional arrow keys or the rotary knob to enter the frequency span.
Carrier Signal TypeOpens a menu to select the carrier signal type.
NB FHSS (Narrow Band Frequency Hopping Spread Spectrum)Use this setting when the signal being measured is 802.11b.
WB FHSS (Wide Band Frequency Hopping Spread Spectrum)Use this setting when the signal being measured is 802.11a or 802.11g.
BroadbandUse this setting when the signal being measured is a digital modulation format such as CDMA, GSM, etc.
BackReturns to the previous menu.
Min Sweep TimeSet the minimum sweep time for the measurement.
BackReturns to the previous menu.
6-10
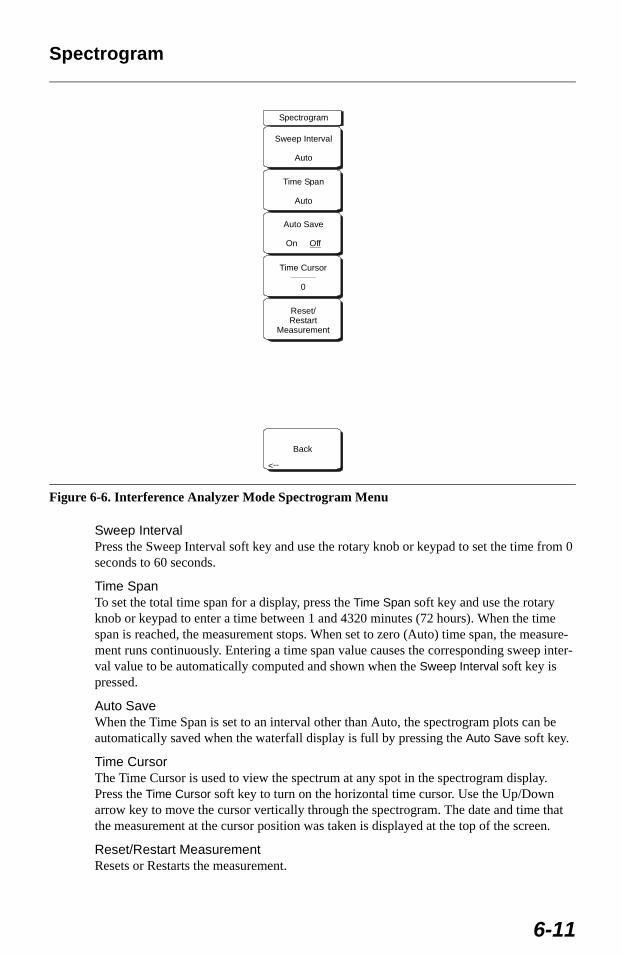
Spectrogram
Sweep Interval Press the Sweep Interval soft key and use the rotary knob or keypad to set the time from 0 seconds to 60 seconds.
Time SpanTo set the total time span for a display, press the Time Span soft key and use the rotary knob or keypad to enter a time between 1 and 4320 minutes (72 hours). When the time span is reached, the measurement stops. When set to zero (Auto) time span, the measure-ment runs continuously. Entering a time span value causes the corresponding sweep inter-val value to be automatically computed and shown when the Sweep Interval soft key is pressed.
Auto SaveWhen the Time Span is set to an interval other than Auto, the spectrogram plots can be automatically saved when the waterfall display is full by pressing the Auto Save soft key.
Time CursorThe Time Cursor is used to view the spectrum at any spot in the spectrogram display. Press the Time Cursor soft key to turn on the horizontal time cursor. Use the Up/Down arrow key to move the cursor vertically through the spectrogram. The date and time that the measurement at the cursor position was taken is displayed at the top of the screen.
Reset/Restart MeasurementResets or Restarts the measurement.
Figure 6-6. Interference Analyzer Mode Spectrogram Menu
Back
-->
Spectrogram
Sweep Interval
Auto
Time Span
Auto
Auto Save
On Off
Time Cursor
0
Reset/Restart
Measurement
6-11
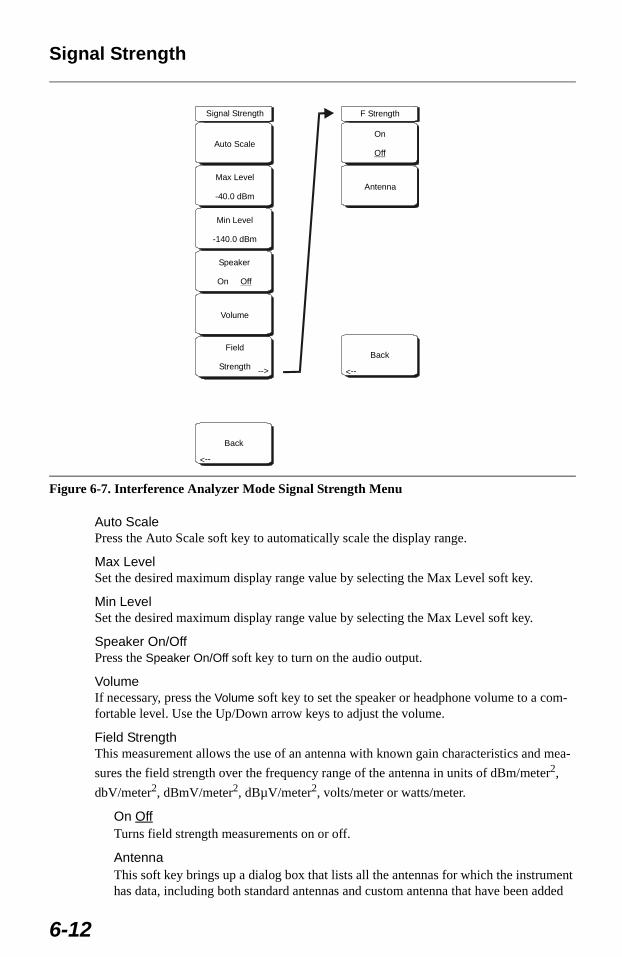
Signal Strength
Auto ScalePress the Auto Scale soft key to automatically scale the display range.
Max Level Set the desired maximum display range value by selecting the Max Level soft key.
Min LevelSet the desired maximum display range value by selecting the Max Level soft key.
Speaker On/Off Press the Speaker On/Off soft key to turn on the audio output.
VolumeIf necessary, press the Volume soft key to set the speaker or headphone volume to a com-fortable level. Use the Up/Down arrow keys to adjust the volume.
Field StrengthThis measurement allows the use of an antenna with known gain characteristics and mea-
sures the field strength over the frequency range of the antenna in units of dBm/meter2,
dbV/meter2, dBmV/meter2, dBµV/meter2, volts/meter or watts/meter.
On OffTurns field strength measurements on or off.
AntennaThis soft key brings up a dialog box that lists all the antennas for which the instrument has data, including both standard antennas and custom antenna that have been added
Figure 6-7. Interference Analyzer Mode Signal Strength Menu
Field
Strength
F Strength
On
Off
Antenna
Back
-->
Back
-->
Signal Strength
Auto Scale
Max Level
-40.0 dBm
Speaker
On Off
Min Level
-140.0 dBm
Volume
-->
6-12
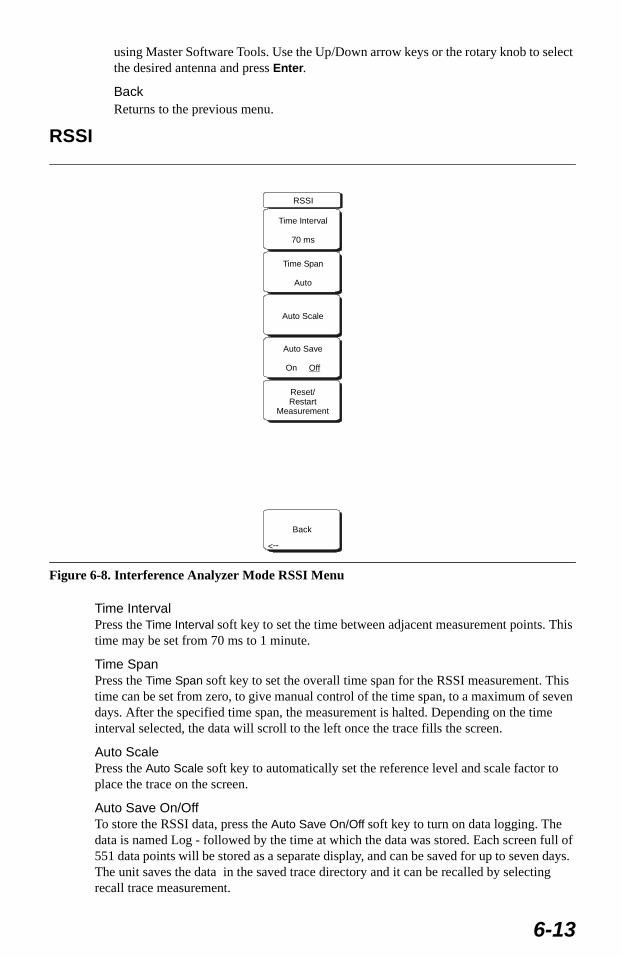
using Master Software Tools. Use the Up/Down arrow keys or the rotary knob to select the desired antenna and press Enter.
BackReturns to the previous menu.
RSSI
Time IntervalPress the Time Interval soft key to set the time between adjacent measurement points. This time may be set from 70 ms to 1 minute.
Time SpanPress the Time Span soft key to set the overall time span for the RSSI measurement. This time can be set from zero, to give manual control of the time span, to a maximum of seven days. After the specified time span, the measurement is halted. Depending on the time interval selected, the data will scroll to the left once the trace fills the screen.
Auto ScalePress the Auto Scale soft key to automatically set the reference level and scale factor to place the trace on the screen.
Auto Save On/OffTo store the RSSI data, press the Auto Save On/Off soft key to turn on data logging. The data is named Log - followed by the time at which the data was stored. Each screen full of 551 data points will be stored as a separate display, and can be saved for up to seven days. The unit saves the data in the saved trace directory and it can be recalled by selecting recall trace measurement.
Figure 6-8. Interference Analyzer Mode RSSI Menu
Back
-->
RSSI
Auto Scale
Time Interval
70 ms
Auto Save
On Off
Time Span
Auto
Reset/Restart
Measurement
6-13
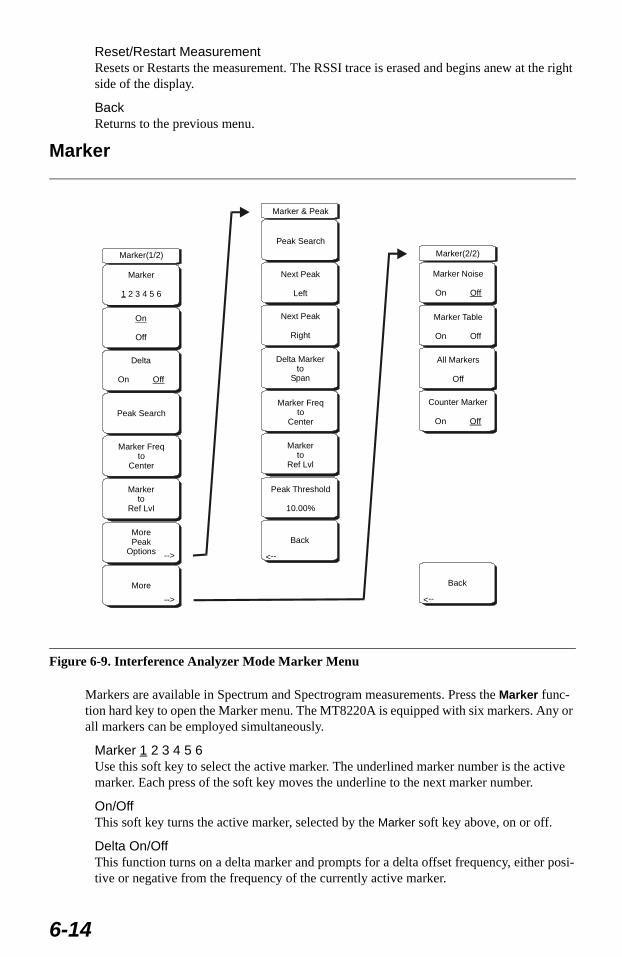
Reset/Restart MeasurementResets or Restarts the measurement. The RSSI trace is erased and begins anew at the right side of the display.
BackReturns to the previous menu.
Marker
Markers are available in Spectrum and Spectrogram measurements. Press the Marker func-tion hard key to open the Marker menu. The MT8220A is equipped with six markers. Any or all markers can be employed simultaneously.
Marker 1 2 3 4 5 6Use this soft key to select the active marker. The underlined marker number is the active marker. Each press of the soft key moves the underline to the next marker number.
On/OffThis soft key turns the active marker, selected by the Marker soft key above, on or off.
Delta On/OffThis function turns on a delta marker and prompts for a delta offset frequency, either posi-tive or negative from the frequency of the currently active marker.
Figure 6-9. Interference Analyzer Mode Marker Menu
-->
Marker(1/2)
Marker
2 3 4 5 61
On
Off
Peak Search
Delta
On Off
Markerto
Ref Lvl
Marker Freqto
Center
MorePeak
Options
More
-->
-->
Recall
Measurement
Copy Allto
External Card
Delete
SaveScreen
as JPEG
Copy Allfrom
External Card
-->
Marker & Peak
Peak Search
Next Peak
Left
Delta Markerto
Span
Next Peak
Right
Peak Threshold
10.00%
Back
-->
Markerto
Ref Lvl
Marker Freqto
Center
Marker(2/2)
Marker Noise
On Off
Marker Table
On Off
Counter Marker
On Off
All Markers
Off
Back
-->
6-14
Peak SearchThis soft key places the currently active marker on the highest signal amplitude currently displayed on screen.
Marker Freq to CenterThis soft key changes the center frequency to place the currently active marker at the cen-ter of the display.
Marker to Ref LevelThis soft key causes the amplitude of the currently active marker to become the reference level, which is the top horizontal line of the display.
More Peak OptionsThis soft key brings up a secondary menu of soft keys for more peak searching options.
Peak SearchThis soft key places the currently active marker on the highest amplitude signal cur-rently on screen.
Next Peak LeftFrom the current position of the active marker, the instrument searches to the left (toward lower frequencies) for a peak signal that rises at least a certain amount above the average noise level. If no such peak is found, the marker is placed at the left end of the trace. The Peak Threshold soft key allows the user to specify the performance of peak searching.
Next Peak RightFrom the current position of the active marker, the instrument searches to the right (toward higher frequencies) for a peak signal that rises at least a certain above the aver-age noise level. If no such peak is found, the marker is placed at the right end of the trace. The Peak Threshold soft key allows the user to specify the performance of peak searching.
Delta Marker to SpanSets the total span width to the value of the delta marker. If the delta marker is zero, the span is set to 10 Hz. If there is no delta marker, or the delta marker value is set to less than 10 Hz, then the span will be set to 10 Hz.
Marker Freq to CenterSets the center frequency to the frequency of the currently active marker.
Marker to Ref LvlSets the reference level, top graticule line, to the amplitude of the currently active marker.
Peak ThresholdThis soft key allows the user to specify how far above the average noise floor a signal must rise before it is considered a peak. This feature can be especially useful in noisy environments, where there are a lot of small noise spikes. The default peak threshold is 10%. In noisy environments, increase the peak threshold to avoid stopping on noise spikes or small signals.
BackReturns to the higher-level menu.
MoreOpens a submenu of further Marker options.
6-15
Marker NoiseThis marker option turns the markers into noise markers with units of dBm/Hz. When this option is selected, the detection method is automatically changed to RMS and the displayed value is compensated for the noise bandwidth of resolution bandwidth filter.
Marker TableAvailable only in Spectrum view, pressing this soft key causes a table to be displayed below the sweep window. The table is automatically sized for all possible markers and delta markers. In addition to the marker frequency and amplitude, the table also shows delta frequencies and amplitude deltas for all markers that have deltas entered for them.
All Markers OffThis soft key turns off all markers and the marker table, if it is on.
Counter Marker On OffSets the frequency counter mode for all markers. Marker frequency values are nor-mally limited in resolution to individual display pixels. Each pixel may represent mul-tiple frequencies. Using Counter Marker in association with Marker to Peak will result in the exact frequency of the peak within the pixel to a resolution of 1 Hz.
BackReturns to the previous menu.
6-16
SpectrogramA Spectrogram is a three dimensional representation of frequency, time and power useful for identifying intermittent interference. Color is used to represent power levels.
ProcedureThe following procedure demonstrates one example of an Interference Analyzer Spectro-gram setup.
Step 1. Select the Shift key, then the Mode (9) key, using rotary knob or Up/Down arrow keys select Interference Analyzer and press the Enter key to select.
Step 2. Press the Freq function hard key. Step 3. Select the Signal Standard soft key and select the desired air interface standard
from the dialog box displayed. Alternatively, choose the appropriate soft keys and enter the center, start and stop frequencies and the span.
Step 4. For the most effective spectrogram display, press the Amplitude key, select the Reference Level soft key and set the reference level such that the largest signal to be displayed will be near the top of the spectrum analyzer area of the screen. The reference value required can be determined by observing the color of the highest signal and changing the reference level to place that value near the top of the spec-trum analyzer area.
Step 5. Select the Scale soft key and set the scale value to place the lowest signal near the bottom of the screen. In general, 4 or 5 dB/division will be good starting values.
Step 6. Select the BW function hard key and set Auto RBW and Auto VBW On, or set the applicable RBW and VBW values by selecting the RBW and VBW soft keys.
Step 7. Press the Measurements function hard key and the Spectrogram soft key. Step 8. Set the time between sweeps by selecting the Sweep Interval soft key, or set the
total time for a full spectrogram by selecting the Time Span soft key. Step 9. To change the time between sweeps, press the Sweep Interval soft key and use the
rotary knob or keypad to set the time from 0 seconds to 660 seconds. Entering the time interval value causes the corresponding time span value to be automatically computed. The time span can be viewed or changed by selecting the Time Span soft key and using the rotary knob or keypad to set the span. As expected, chang-ing the time span will automatically change the sweep interval.
Step 10. To set the total time span for a complete display, press the Time Span soft key and use the rotary knob or keypad to enter a time between 1 and 4320 minutes (72 hours). Entering a time span value causes the corresponding sweep interval value to be automatically computed and shown when the Sweep Interval soft key is pressed.
Step 11. The instrument can be set so that spectrogram plots can be automatically saved when the display is full. Press the Auto Save soft key to toggle auto save On or Off.
Step 12. The Time Cursor soft key is used to turn on the horizontal time cursor. Use the Up/Down arrow key to move the cursor vertically through the spectrogram. The date and time that the measurement at the cursor position was taken is displayed at the top of the screen.
NOTE: Setting a Sweep Interval value >0 will change the detection method to Max Hold, so that any event within the time interval will be cap-tured to the screen. This allows for extended measurement times to be set.
NOTE: When the Time Cursor is activated and not on the zero trace posi-tion, the unit will automatically stop making measurements.
6-17
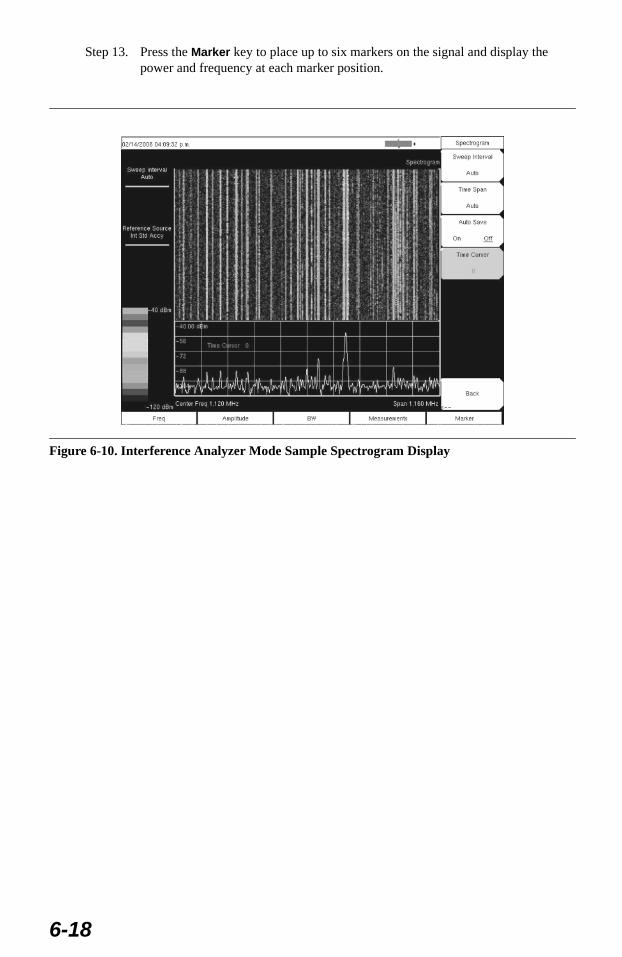
Step 13. Press the Marker key to place up to six markers on the signal and display the power and frequency at each marker position.
Figure 6-10. Interference Analyzer Mode Sample Spectrogram Display
6-18
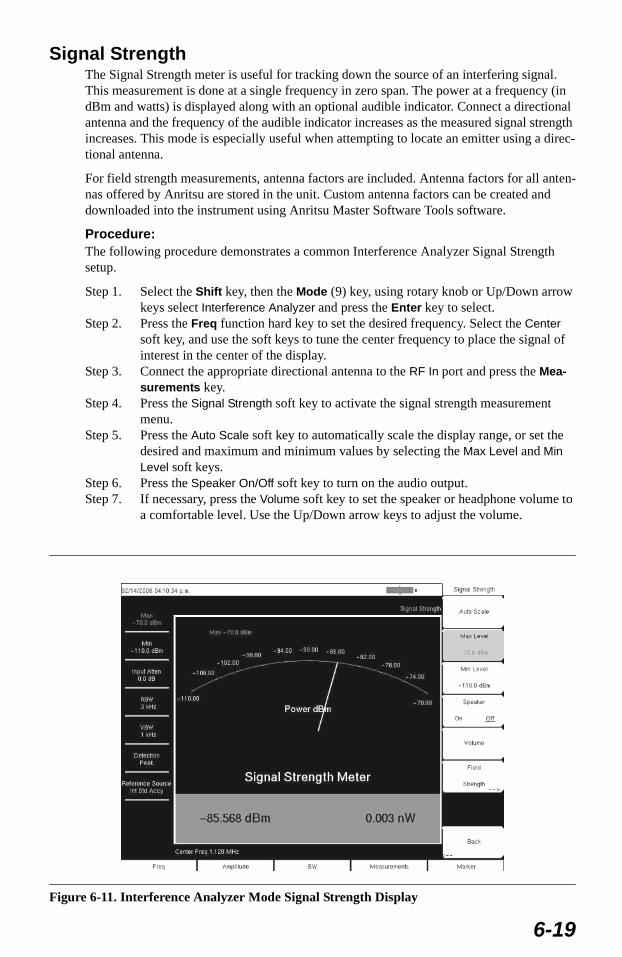
Signal StrengthThe Signal Strength meter is useful for tracking down the source of an interfering signal. This measurement is done at a single frequency in zero span. The power at a frequency (in dBm and watts) is displayed along with an optional audible indicator. Connect a directional antenna and the frequency of the audible indicator increases as the measured signal strength increases. This mode is especially useful when attempting to locate an emitter using a direc-tional antenna.
For field strength measurements, antenna factors are included. Antenna factors for all anten-nas offered by Anritsu are stored in the unit. Custom antenna factors can be created and downloaded into the instrument using Anritsu Master Software Tools software.
Procedure:The following procedure demonstrates a common Interference Analyzer Signal Strength setup.
Step 1. Select the Shift key, then the Mode (9) key, using rotary knob or Up/Down arrow keys select Interference Analyzer and press the Enter key to select.
Step 2. Press the Freq function hard key to set the desired frequency. Select the Center soft key, and use the soft keys to tune the center frequency to place the signal of interest in the center of the display.
Step 3. Connect the appropriate directional antenna to the RF In port and press the Mea-surements key.
Step 4. Press the Signal Strength soft key to activate the signal strength measurement menu.
Step 5. Press the Auto Scale soft key to automatically scale the display range, or set the desired and maximum and minimum values by selecting the Max Level and Min Level soft keys.
Step 6. Press the Speaker On/Off soft key to turn on the audio output.Step 7. If necessary, press the Volume soft key to set the speaker or headphone volume to
a comfortable level. Use the Up/Down arrow keys to adjust the volume.
Figure 6-11. Interference Analyzer Mode Signal Strength Display
6-19
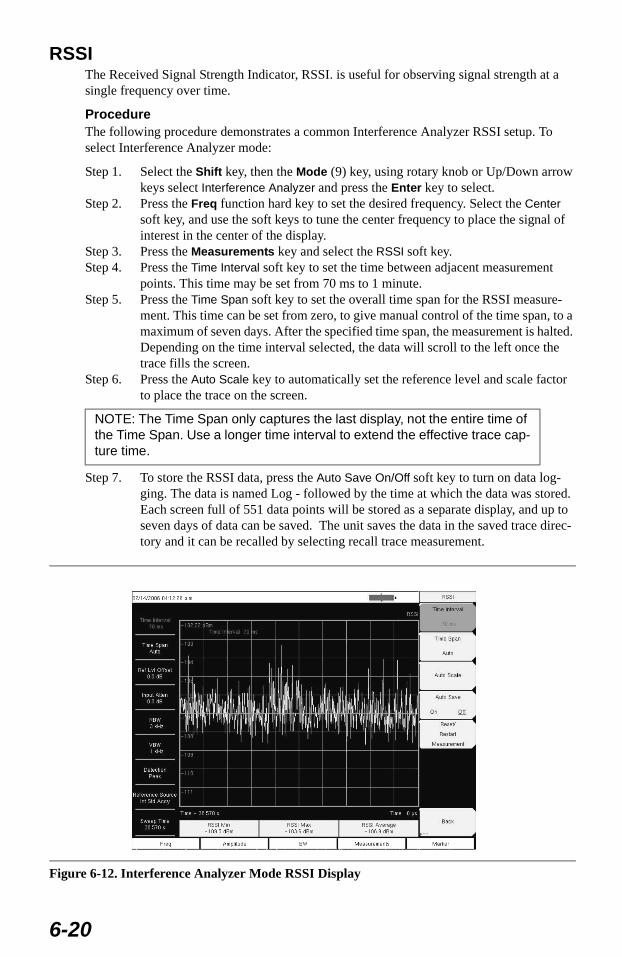
RSSIThe Received Signal Strength Indicator, RSSI. is useful for observing signal strength at a single frequency over time.
ProcedureThe following procedure demonstrates a common Interference Analyzer RSSI setup. To select Interference Analyzer mode:
Step 1. Select the Shift key, then the Mode (9) key, using rotary knob or Up/Down arrow keys select Interference Analyzer and press the Enter key to select.
Step 2. Press the Freq function hard key to set the desired frequency. Select the Center soft key, and use the soft keys to tune the center frequency to place the signal of interest in the center of the display.
Step 3. Press the Measurements key and select the RSSI soft key.Step 4. Press the Time Interval soft key to set the time between adjacent measurement
points. This time may be set from 70 ms to 1 minute.Step 5. Press the Time Span soft key to set the overall time span for the RSSI measure-
ment. This time can be set from zero, to give manual control of the time span, to a maximum of seven days. After the specified time span, the measurement is halted. Depending on the time interval selected, the data will scroll to the left once the trace fills the screen.
Step 6. Press the Auto Scale key to automatically set the reference level and scale factor to place the trace on the screen.
Step 7. To store the RSSI data, press the Auto Save On/Off soft key to turn on data log-ging. The data is named Log - followed by the time at which the data was stored. Each screen full of 551 data points will be stored as a separate display, and up to seven days of data can be saved. The unit saves the data in the saved trace direc-tory and it can be recalled by selecting recall trace measurement.
NOTE: The Time Span only captures the last display, not the entire time of the Time Span. Use a longer time interval to extend the effective trace cap-ture time.
Figure 6-12. Interference Analyzer Mode RSSI Display
6-20
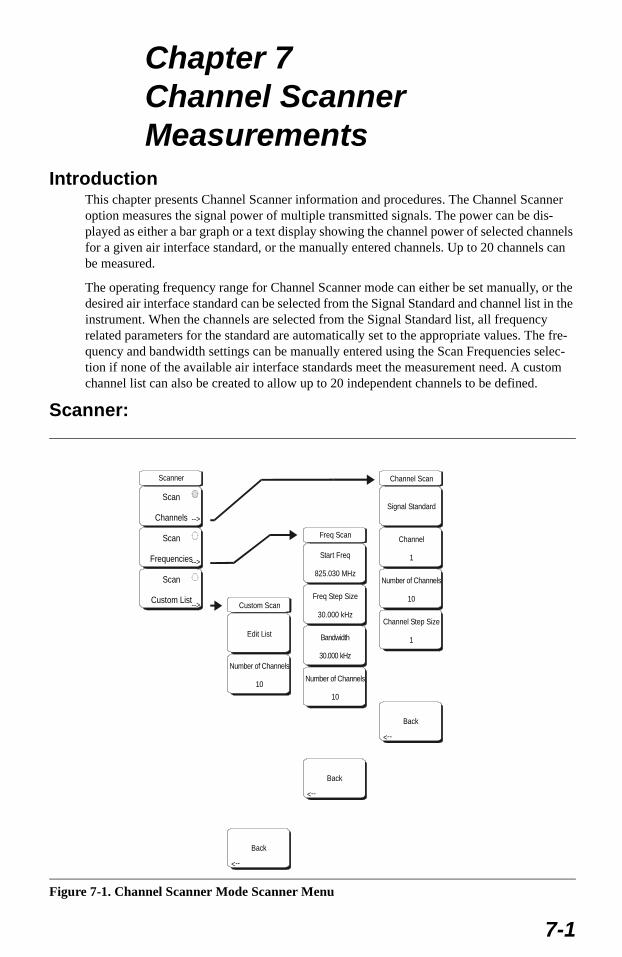
Chapter 7Channel Scanner Measurements
IntroductionThis chapter presents Channel Scanner information and procedures. The Channel Scanner option measures the signal power of multiple transmitted signals. The power can be dis-played as either a bar graph or a text display showing the channel power of selected channels for a given air interface standard, or the manually entered channels. Up to 20 channels can be measured.
The operating frequency range for Channel Scanner mode can either be set manually, or the desired air interface standard can be selected from the Signal Standard and channel list in the instrument. When the channels are selected from the Signal Standard list, all frequency related parameters for the standard are automatically set to the appropriate values. The fre-quency and bandwidth settings can be manually entered using the Scan Frequencies selec-tion if none of the available air interface standards meet the measurement need. A custom channel list can also be created to allow up to 20 independent channels to be defined.
Scanner:
Figure 7-1. Channel Scanner Mode Scanner Menu
Scanner
Scan
Channels
Scan
Frequencies
Scan
Custom List
-->
-->
-->
Recall
Measurement
Copy Allto
External Card
Delete
Copy Allfrom
External Card
-->
Channel Scan
Signal Standard
Channel
1
Channel Step Size
1
Number of Channels
10
Back
-->
Recall
Measurement
Copy Allto
External Card
Delete
Copy Allfrom
External Card
-->
Freq Scan
Start Freq
825.030 MHz
Freq Step Size
30.000 kHz
Number of Channels
10
Bandwidth
30.000 kHz
Back
-->
Recall
Measurement
Delete
-->
Custom Scan
Edit List
Number of Channels
10
Back
-->
7-1
Scan ChannelsSelect scan channels to activate the scan channel menus:
Signal StandardSets the signal standard.
Channel Sets the starting channel on the display.
Number of ChannelsSets the number of channels to be displayed. From 1 to 20 channels can be displayed.
Channel Step SizeSets the number of channels to skip between displayed channels.
BackReturns to the previous menu.
Scan FrequenciesSelect scan frequencies to activate the scan frequencies menu:
Start FreqSets the center frequency of the first channel to be displayed.
Freq Step SizeSets the spacing between frequencies on the display.
Bandwidth The channel bandwidth can be manually entered in GHz, MHz, kHz or Hz.
Number of ChannelsSets the number of channels to be displayed (1 to 20).
BackReturns to the previous menu.
Scan Custom ListEdit ListEdit the Signal Standard, Channel, Frequency and Bandwidth for a selected standard.
Number of ChannelsSets the number of channels to be displayed (1 to 20).
BackReturns to the previous menu.
7-2
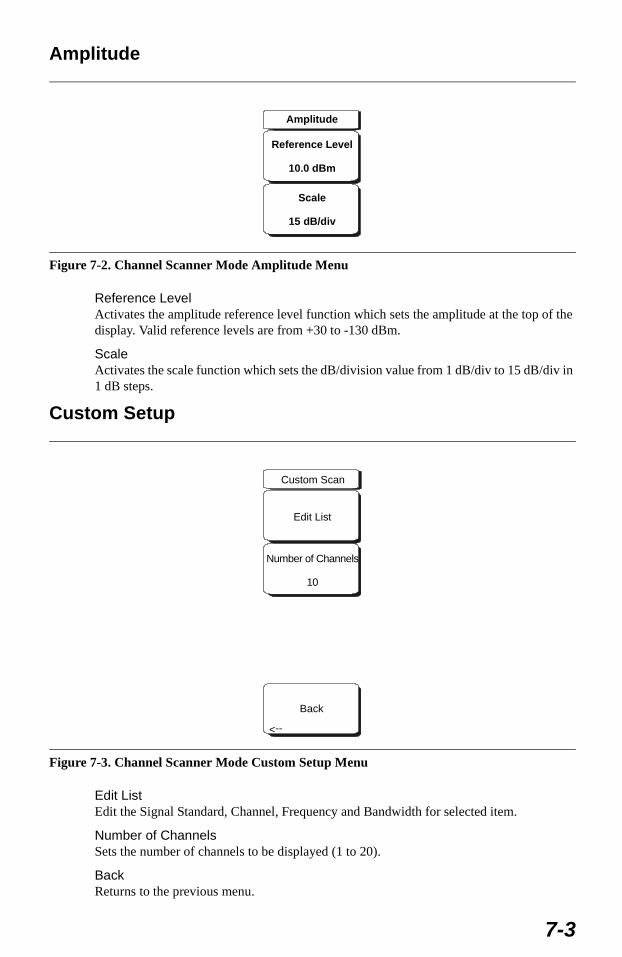
Amplitude
Reference LevelActivates the amplitude reference level function which sets the amplitude at the top of the display. Valid reference levels are from +30 to -130 dBm.
ScaleActivates the scale function which sets the dB/division value from 1 dB/div to 15 dB/div in 1 dB steps.
Custom Setup
Edit ListEdit the Signal Standard, Channel, Frequency and Bandwidth for selected item.
Number of ChannelsSets the number of channels to be displayed (1 to 20).
BackReturns to the previous menu.
Figure 7-2. Channel Scanner Mode Amplitude Menu
Figure 7-3. Channel Scanner Mode Custom Setup Menu
Amplitude
Reference Level
10.0 dBm
Scale
15 dB/div
Recall
Measurement
Delete
-->
Custom Scan
Edit List
Number of Channels
10
Back
-->
7-3
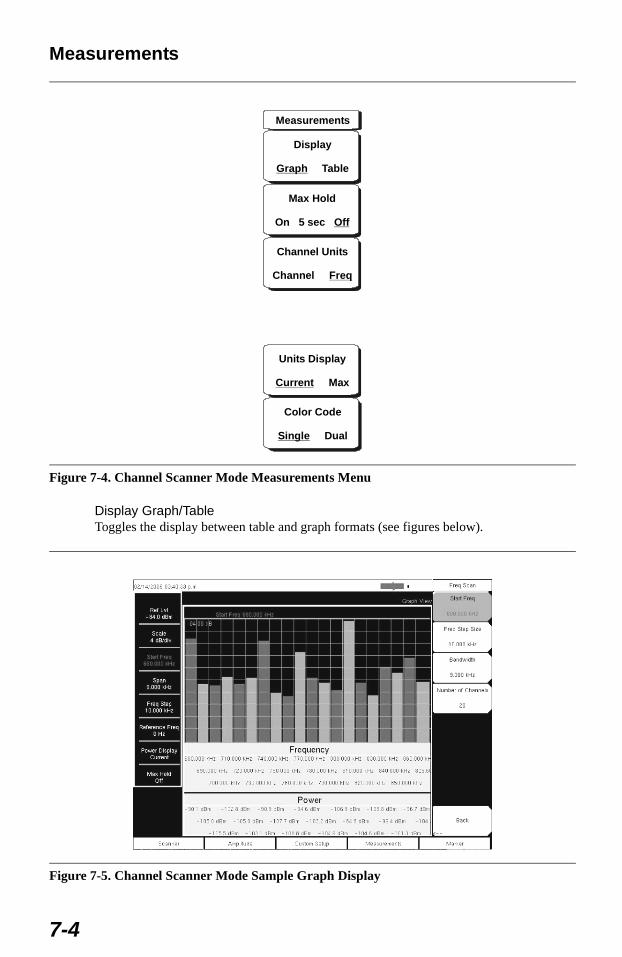
Measurements
Display Graph/TableToggles the display between table and graph formats (see figures below).
Figure 7-4. Channel Scanner Mode Measurements Menu
Figure 7-5. Channel Scanner Mode Sample Graph Display
Measurements
Display
TableGraph
Max Hold
On 5 sec Off
Channel Units
Channel Freq
Units Display
MaxCurrent
Color Code
DualSingle
7-4
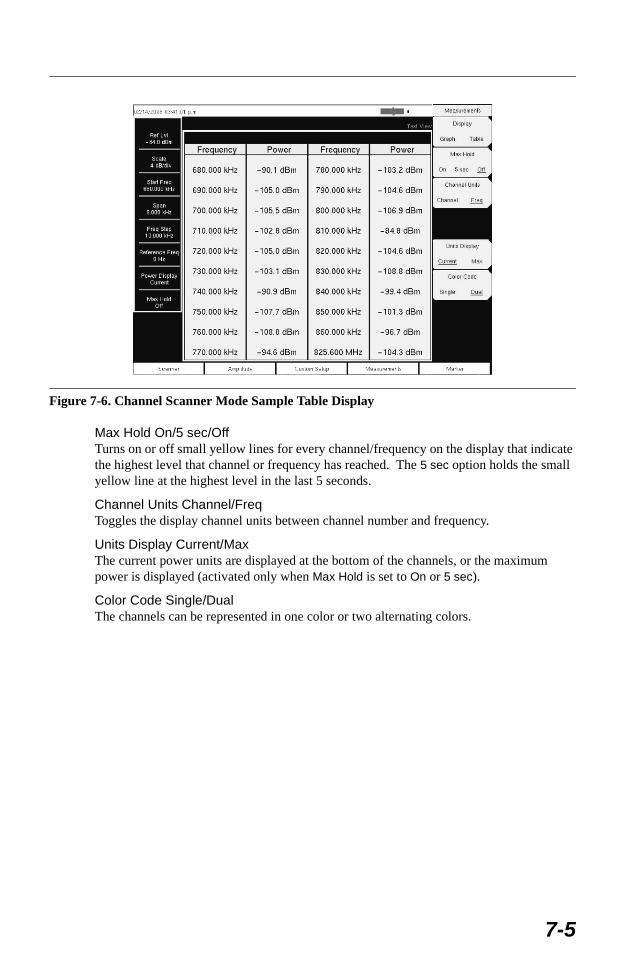
Max Hold On/5 sec/OffTurns on or off small yellow lines for every channel/frequency on the display that indicate the highest level that channel or frequency has reached. The 5 sec option holds the small yellow line at the highest level in the last 5 seconds.
Channel Units Channel/FreqToggles the display channel units between channel number and frequency.
Units Display Current/MaxThe current power units are displayed at the bottom of the channels, or the maximum power is displayed (activated only when Max Hold is set to On or 5 sec).
Color Code Single/DualThe channels can be represented in one color or two alternating colors.
Figure 7-6. Channel Scanner Mode Sample Table Display
7-5
Sample ProcedureThe following procedure demonstrates a common channel scanner setup.
Step 1. On the UMTS Master, select the Shift key, then the Mode (9) key.Step 2. Use the directional arrow keys or the rotary knob to highlight Channel Scanner
and press the Enter key to select.Step 3. Press the Scanner key to activate the Scanner menu. The power can be scanned
using a signal standard and channel numbers or by entering a start frequency, fre-quency step size and bandwidth. The channels can be customized using the Scan Custom List or Custom Setup. For this example, select the channels by pressing the Scan Channels soft key, then the Signal Standard soft key. Select the CDMA US PCS signal standard.
Step 4. Select the Number of Channels soft key and enter 20. Step 5. Select the Amplitude key and set the Reference Level and Scale so that the power
of all the channels is displayed on the screen.Step 6. Select the Measurements key to activate the Measurement menu. Step 7. Press the Display soft key and select Graph display to display the measurements in
the graph format. Step 8. Press the Channel Units soft key and select Channel to display the measurements
in channel format. Step 9. Press the Units Display soft key and choose Max to display the maximum mea-
sured power for each channel.Step 10. Press the Color Code soft key and select Dual to display the measurements in dual
colors.
Custom SetupProcedureStep 1. On the UMTS Master, select the Shift key, then the Mode (9) key.Step 2. Use the directional arrow keys or the rotary knob to highlight Channel Scanner
and press the Enter key to select.Step 3. Press the Custom Setup key.Step 4. Press the Number of Channels soft key to define how many channels to include in
the custom list. This choice can be changed later if needed.Step 5. Press the Edit List soft key to bring up the list of channels. The channel highlighted
in blue is the channel active for editing. Use the up and down arrows to select the channel to edit. Each channel can be set up differently.
Step 6. Press either the Select Signal Standard soft key or the Set Freq soft key. If the Select Signal Standard soft key was selected, select the desired air interface stan-dard from the dialog box displayed. When a standard is selected, the usual band-width for that standard is automatically set. The bandwidth can be changed if desired. After the air interface standard is selected, press the Set Channel soft key to enter the desired channel number.If the Set Freq soft key was selected, the frequency value of the active channel will be highlighted in a red box. Use the rotary knob or the numeric key pad to enter the desired center frequency in Hz, kHz, MHz or GHz.
Step 7. Press the Set Bandwidth soft key and use the rotary knob or numeric keypad to enter the desired value in Hz, kHz, MHz or GHz.
Step 8. Repeat steps 5 through 9 for all channels.
NOTE: Measurements can be made when the base station is in service, out of service, or over the air.
7-6
Custom Setup ExampleThis example explains how to monitor several signals, plus a potential intermodulation prod-uct, to see if there is a correlation between the nearby signals and an intermittent interference problem.
The signals on or near the rooftop are:
• An FM broadcast station at 106.5 MHz
• A paging transmitter at 157.86 MHz
• Three cellular sites:US CDMA PCS channel 50 (1932.5 MHz)AMP/EIA 553 channel 525 (885.750 MHz)GSM 1800 channel 512 (1805.2 MHz)
• A Ham repeater at 147.36 MHz
• A Ham repeater at 446.5 MHz
• A land mobile repeater at 451.7875 MHz
• A public safety repeater at 485.5625 MHz
• In addition, the site is near the flight path of an airport. The approach frequency is 121.4 MHz.
Set up a measurement channel for each of the signals to be observed plus extra channels for any intermodulation products to be observed.
After the channels are set up, press | Shift | File | Save, Recall, Delete, & Copy | Save Setup| and name the setup for easy recall later.
7-7

7-8
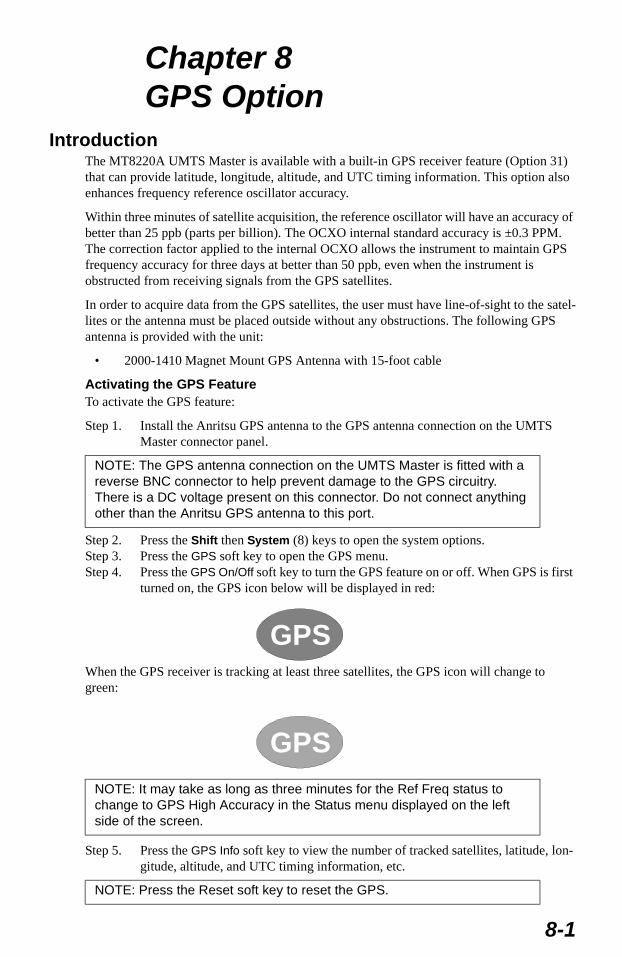
Chapter 8GPS Option
IntroductionThe MT8220A UMTS Master is available with a built-in GPS receiver feature (Option 31) that can provide latitude, longitude, altitude, and UTC timing information. This option also enhances frequency reference oscillator accuracy.
Within three minutes of satellite acquisition, the reference oscillator will have an accuracy of better than 25 ppb (parts per billion). The OCXO internal standard accuracy is ±0.3 PPM. The correction factor applied to the internal OCXO allows the instrument to maintain GPS frequency accuracy for three days at better than 50 ppb, even when the instrument is obstructed from receiving signals from the GPS satellites.
In order to acquire data from the GPS satellites, the user must have line-of-sight to the satel-lites or the antenna must be placed outside without any obstructions. The following GPS antenna is provided with the unit:
• 2000-1410 Magnet Mount GPS Antenna with 15-foot cable
Activating the GPS FeatureTo activate the GPS feature:
Step 1. Install the Anritsu GPS antenna to the GPS antenna connection on the UMTS Master connector panel.
Step 2. Press the Shift then System (8) keys to open the system options.Step 3. Press the GPS soft key to open the GPS menu. Step 4. Press the GPS On/Off soft key to turn the GPS feature on or off. When GPS is first
turned on, the GPS icon below will be displayed in red:
When the GPS receiver is tracking at least three satellites, the GPS icon will change to green:
Step 5. Press the GPS Info soft key to view the number of tracked satellites, latitude, lon-gitude, altitude, and UTC timing information, etc.
NOTE: The GPS antenna connection on the UMTS Master is fitted with a reverse BNC connector to help prevent damage to the GPS circuitry. There is a DC voltage present on this connector. Do not connect anything other than the Anritsu GPS antenna to this port.
NOTE: It may take as long as three minutes for the Ref Freq status to change to GPS High Accuracy in the Status menu displayed on the left side of the screen.
NOTE: Press the Reset soft key to reset the GPS.
GPS
GPS
8-1
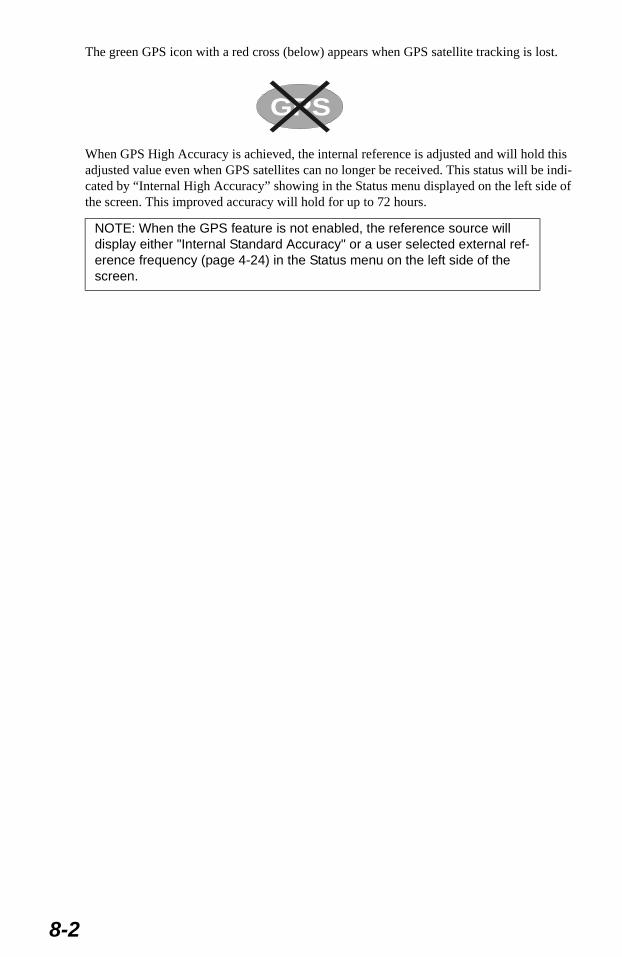
The green GPS icon with a red cross (below) appears when GPS satellite tracking is lost.
When GPS High Accuracy is achieved, the internal reference is adjusted and will hold this adjusted value even when GPS satellites can no longer be received. This status will be indi-cated by “Internal High Accuracy” showing in the Status menu displayed on the left side of the screen. This improved accuracy will hold for up to 72 hours.
NOTE: When the GPS feature is not enabled, the reference source will display either "Internal Standard Accuracy" or a user selected external ref-erence frequency (page 4-24) in the Status menu on the left side of the screen.
GPS
8-2
Chapter 9Master Software Tools
IntroductionThis chapter provides a description of the Anritsu Master Software Tools program. Master Software Tools is a suite of Microsoft Windows programs for transferring saved measure-ments, along with markers and limit lines, to a PC display. The programs provide the ability to modify display parameters, overlay multiple traces (Spectrum Analyzer mode), upload and download traces, print traces using local or networked printers, create or modify lan-guage files, edit the cable and signal standard lists, and convert .dat files to the new .vna for-mat.
Master Software Tools requires Windows 2000 or Windows XP, and will not function on earlier versions of the Microsoft Windows operating system, as the program relies on the Windows 2000 and Windows XP .NET Framework.
FeaturesThe Master Software Tools Suite provides the following features and capabilities:
• Download measurements saved in the instrument memory to the PC for storage and analysis
• Capture live traces from the instrument and view them on the PC
• Upload measurements from the PC to the instrument memory
• Compare multiple traces using drag, drop, and trace overlay features (SPA mode)
• Add or modify Limit Lines (Spectrum Analyzer mode only) and Markers
• Modify the Signal Standard List and new lists to the instruments using the Cable and Signal Editors
• Display power level, calibration status, and GPS Information along with a trace in one professional report
• Create custom language files that can be uploaded to the instrument
• Export measurement data as text files for use in a spreadsheet (.txt and .dat file for-mats)
• Export measurements as graphic files (.jpg, .wmf, .bmp, and .png file formats)
• Automatically update the instrument with the latest firmware available from the Anritsu web site
• Handle long file names for easy, descriptive data labeling
• Store an unlimited number of data traces to a PC easing the task of analyzing and monitoring historical performance
• Create and download new signal standards, Pass/Fail Mode custom lists and antenna factors to existing lists into the unit
• Establish a connection to a PC using USB, Ethernet LAN, or Direct Ethernet
• Coordinate cell site locations using Map Point and GPS location mapping
9-1
System RequirementsMinimum requirements and recommendations are:
• Microsoft Windows 2000 or Windows XP
• Intel Pentium 233 MHz microprocessor minimum (Pentium II 350 MHz or better rec-ommended)
• 128 MB of RAM minimum (256 MB or above recommended)
• Hard disk drive with approximately 80 MB of available space (An additional 80 MB free space for storage of captured plots is recommended.)
• A USB port (USB 1.2 required, USB 2.0 recommended) or an Ethernet 10/100 T con-nection for communication with the instrument
InstallationTo install the Master Software Tools program, insert the Anritsu Master Software Tools disk in the CDROM drive. Follow the instructions in the installation program to install the soft-ware. If the autorun feature is disabled in your computer, click on the Windows Start menu, and select Run. Type: X:\Setup.exe, where X is the drive letter of the CDROM drive, and fol-low the instructions in the installation program.
The readme.doc file on the disk provides updated information about the program, and the Help function provides detailed operating information from within the program.
To start the Master Software Tools program, double-click on the Master Software Tools desktop icon, or select Programs from the Windows Start menu and select Anritsu, then Mas-ter Software Tools to launch the program.
ConnectionThe instrument can be connected to the PC using a USB connection, an Ethernet LAN con-nection, or a Direct Ethernet connection.
USB ConnectionThe instrument can be connected to the PC using the included USB cable (3-2000-1360). Con-nect the cable to the USB port on the computer and to the USB port on the instrument.
When using the USB cable to connect to the instrument, select Connection from the menu bar, and then Connect: USB to establish a connection.
If a USB connection was already established in a previous session, the Connect: USB icon will be displayed on the tool bar. Click on the icon to connect to the instrument.
The Connect: USB icon will change from red to green when communication is established. If the status bar is turned on (View Status Bar), a message at the bottom will display Connected to device using USB when communication is established.
Ethernet LAN ConnectionThe RJ-45 connector is used to connect the VNA Master to a local area network using the provided Ethernet cable (2000-1371). Integrated into the connector on the instrument are two LEDs. The amber LED indicates the presence of LAN voltages—a live LAN connec-tion—while the green LED flashes to show that LAN traffic is present. The instrument IP address is set by pressing the Shift key, then the System (8) key followed by the System Options soft key and the Ethernet Config soft key. The instrument Ethernet address can be set
NOTE: Master Software Tools requires Windows 2000 or Windows XP. Master Software Tools will not function on earlier versions of the Microsoft Windows operating system, as the program relies on the Windows 2000 and Windows XP .NET Framework.
9-2
automatically using DHCP, or manually by entering the desired IP address, gateway address and subnet mask. Refer to Chapter 2 for more information on using DHCP.
The Network Connection window can be used to search the local subnet (hub) for connected instruments. Double click on the matching IP address of the instrument to establish a con-nection to the instrument.
The Connect: Ethernet icon will change from red to green when communication is estab-lished. If the status bar is turned on, a message at the bottom will display Connected to Ethernet when communication is established.
To set or view the IP address of the instrument:
Step 1. On the instrument, press the Shift key, then the System (8) key.Step 2. Select the System Options soft key, and then the Ethernet Config soft key.
The Ethernet Editor will display the present IP information of the unit. When using DHCP, the Ethernet cable must be connected before the instrument is turned on.
Step 3. Press the Esc key to close the Ethernet Editor dialog box.Step 4. On the PC, open the Connection window and select Enter IP Address.Step 5. Enter the IP address of the instrument as shown in the Ethernet Editor dialog box.Step 6. Click on the Connect: Ethernet icon to establish the connection. The icon will
change from red to green when communication is established.
Direct Ethernet ConnectionWhen using a direct Ethernet connection, the instrument address must be set as follows:
Step 1. On the instrument, press the Shift key, then the System (8) key.Step 2. Select the System Options soft key, and then the Ethernet Config soft key.Step 3. Press the Type soft key to select Manual.Step 4. Set the IP address to 10.0.0.2 using the soft keys or the Left/Right arrow keys to
select the field to be modified. Use the keypad, the Up/Down arrow keys or the rotary knob to enter the input. Press Enter to accept the changes.
Step 5. Press the Field soft key and set the Subnet mask to 255.255.255.0. Press Enter.Step 6. On the computer, open Anritsu Master Software Tools.Step 7. Open the Connection menu and select Enter IP Address. Enter the IP address and
press Ok. The IP address will be displayed in the toolbar at the top of the screen.Step 8. Click on the red icon just to the left of the IP address. The icon will turn green
when a connection is established with the instrument.
After the connection is established, the message Connected to 10.0.0.2 will be displayed at the bottom of the Connection Manager window.
NOTE: The network cable must be connected to the network before pow-ering on the UMTS Master.
9-3
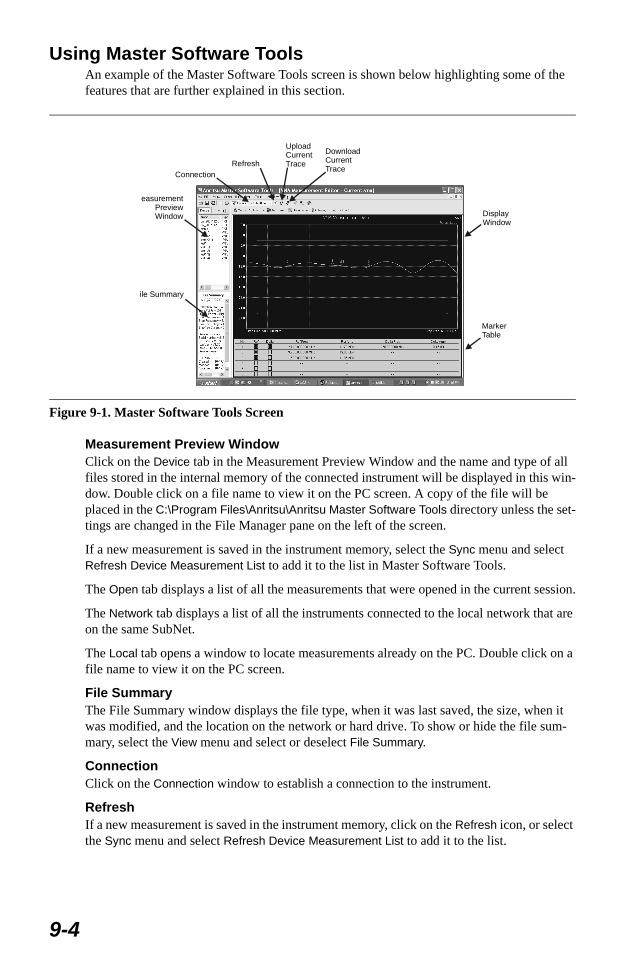
Using Master Software ToolsAn example of the Master Software Tools screen is shown below highlighting some of the features that are further explained in this section.
Measurement Preview WindowClick on the Device tab in the Measurement Preview Window and the name and type of all files stored in the internal memory of the connected instrument will be displayed in this win-dow. Double click on a file name to view it on the PC screen. A copy of the file will be placed in the C:\Program Files\Anritsu\Anritsu Master Software Tools directory unless the set-tings are changed in the File Manager pane on the left of the screen.
If a new measurement is saved in the instrument memory, select the Sync menu and select Refresh Device Measurement List to add it to the list in Master Software Tools.
The Open tab displays a list of all the measurements that were opened in the current session.
The Network tab displays a list of all the instruments connected to the local network that are on the same SubNet.
The Local tab opens a window to locate measurements already on the PC. Double click on a file name to view it on the PC screen.
File SummaryThe File Summary window displays the file type, when it was last saved, the size, when it was modified, and the location on the network or hard drive. To show or hide the file sum-mary, select the View menu and select or deselect File Summary.
ConnectionClick on the Connection window to establish a connection to the instrument.
Refresh If a new measurement is saved in the instrument memory, click on the Refresh icon, or select the Sync menu and select Refresh Device Measurement List to add it to the list.
Figure 9-1. Master Software Tools Screen
easurementPreviewWindow
ile Summary
DownloadCurrentTrace
UploadCurrentTraceRefresh
Connection
MarkerTable
DisplayWindow
9-4
Download the Current Trace to the PCTo download the current trace on the instrument display to the PC, select the Sync menu and select Capture Current Measurement or click on the down arrow icon. The current measure-ment on the instrument screen will be displayed on the PC screen.
Upload the Current Trace From the PC to the InstrumentTo upload a trace file from the PC to the instrument, select the Sync menu and select Upload Active Window or click on the up arrow icon to upload the currently selected file from the PC to the instrument.
Download Stored Files From the Instrument to the PCSelect the Sync menu and select Download all Measurements. Select the location on the PC to store the measurements and select OK.
Plot PropertiesRight clicking on the display window will bring up the Plot Properties window. All the func-tions needed to add or edit markers, limit lines, display modes, amplitude scaling, and trace math can be found in this window.
MarkersIn Spectrum Analyzer mode, up to six reference and delta markers can be turned on and edited as needed using Master Software Tools. The Marker Table displays the amplitude and frequency values for all reference and delta markers simultaneously. To access the marker functions, right click on the Display Window and select Data Markers, then Marker Table, or right click on the Display Window and select Data Display Mode... then Data Display Option, then Marker Table.
Add MarkerTo add a new Marker, display the Marker Table and mark the selection box for the desired reference or delta marker. Up to six markers and delta markers can be displayed at the same time.
Edit MarkerTo edit a Marker, place the cursor on the marker, press the left mouse button and drag the marker to the new position. The markers can be turned on and off by selecting or deselect-ing the selection box in the Marker Table. The value of one marker is always displayed in the upper right part of the display. If more than one marker is turned on, and the Marker Table is turned off, click on the marker to display its value.
The marker can also be moved by rolling the scroll button on the mouse up or down to move the marker to the right or left, respectively.
9-5
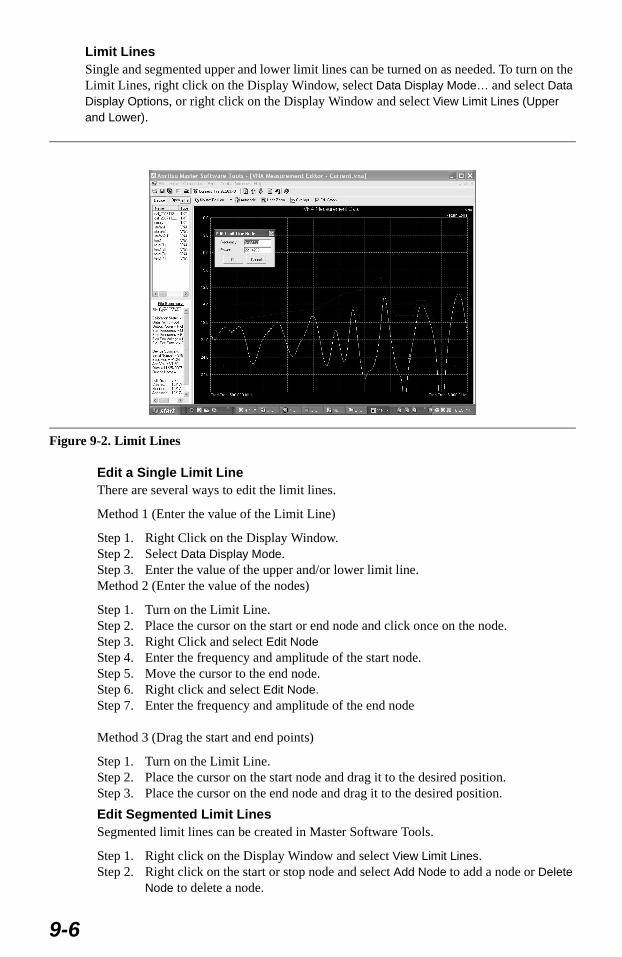
Limit LinesSingle and segmented upper and lower limit lines can be turned on as needed. To turn on the Limit Lines, right click on the Display Window, select Data Display Mode… and select Data Display Options, or right click on the Display Window and select View Limit Lines (Upper and Lower).
Edit a Single Limit LineThere are several ways to edit the limit lines.
Method 1 (Enter the value of the Limit Line)
Step 1. Right Click on the Display Window.Step 2. Select Data Display Mode.Step 3. Enter the value of the upper and/or lower limit line.Method 2 (Enter the value of the nodes)
Step 1. Turn on the Limit Line.Step 2. Place the cursor on the start or end node and click once on the node.Step 3. Right Click and select Edit NodeStep 4. Enter the frequency and amplitude of the start node.Step 5. Move the cursor to the end node.Step 6. Right click and select Edit Node.Step 7. Enter the frequency and amplitude of the end node
Method 3 (Drag the start and end points)
Step 1. Turn on the Limit Line.Step 2. Place the cursor on the start node and drag it to the desired position.Step 3. Place the cursor on the end node and drag it to the desired position.
Edit Segmented Limit LinesSegmented limit lines can be created in Master Software Tools.
Step 1. Right click on the Display Window and select View Limit Lines. Step 2. Right click on the start or stop node and select Add Node to add a node or Delete
Node to delete a node.
Figure 9-2. Limit Lines
9-6
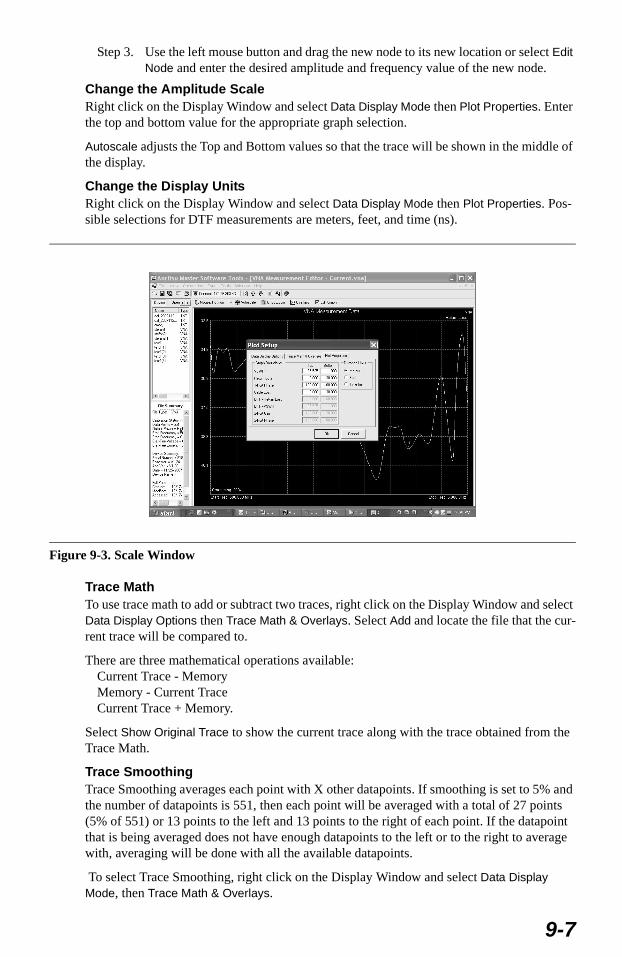
Step 3. Use the left mouse button and drag the new node to its new location or select Edit Node and enter the desired amplitude and frequency value of the new node.
Change the Amplitude ScaleRight click on the Display Window and select Data Display Mode then Plot Properties. Enter the top and bottom value for the appropriate graph selection.
Autoscale adjusts the Top and Bottom values so that the trace will be shown in the middle of the display.
Change the Display Units Right click on the Display Window and select Data Display Mode then Plot Properties. Pos-sible selections for DTF measurements are meters, feet, and time (ns).
Trace MathTo use trace math to add or subtract two traces, right click on the Display Window and select Data Display Options then Trace Math & Overlays. Select Add and locate the file that the cur-rent trace will be compared to.
There are three mathematical operations available: Current Trace - MemoryMemory - Current TraceCurrent Trace + Memory.
Select Show Original Trace to show the current trace along with the trace obtained from the Trace Math.
Trace SmoothingTrace Smoothing averages each point with X other datapoints. If smoothing is set to 5% and the number of datapoints is 551, then each point will be averaged with a total of 27 points (5% of 551) or 13 points to the left and 13 points to the right of each point. If the datapoint that is being averaged does not have enough datapoints to the left or to the right to average with, averaging will be done with all the available datapoints.
To select Trace Smoothing, right click on the Display Window and select Data Display Mode, then Trace Math & Overlays.
Figure 9-3. Scale Window
9-7
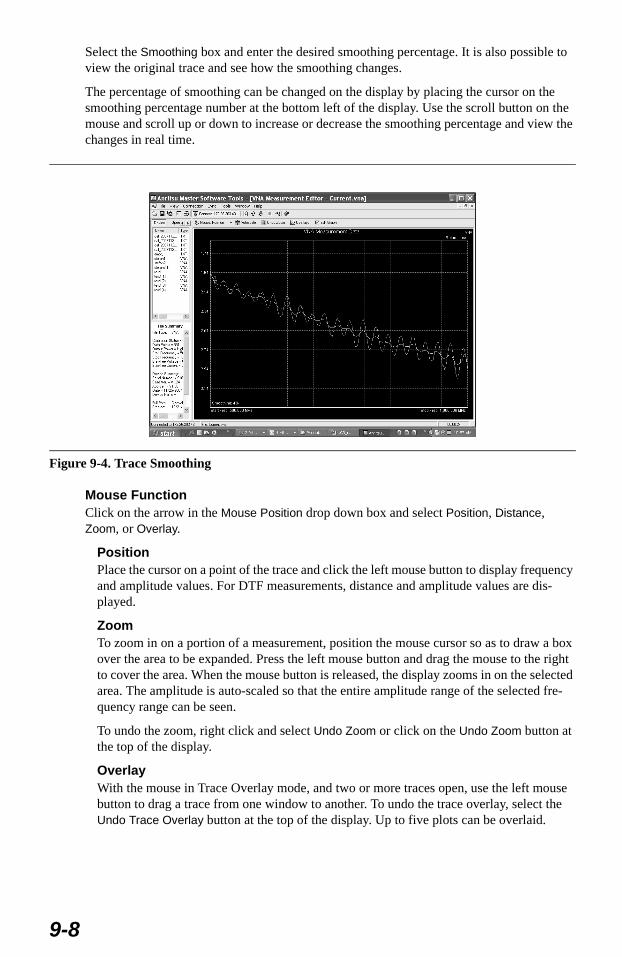
Select the Smoothing box and enter the desired smoothing percentage. It is also possible to view the original trace and see how the smoothing changes.
The percentage of smoothing can be changed on the display by placing the cursor on the smoothing percentage number at the bottom left of the display. Use the scroll button on the mouse and scroll up or down to increase or decrease the smoothing percentage and view the changes in real time.
Mouse FunctionClick on the arrow in the Mouse Position drop down box and select Position, Distance, Zoom, or Overlay.
PositionPlace the cursor on a point of the trace and click the left mouse button to display frequency and amplitude values. For DTF measurements, distance and amplitude values are dis-played.
ZoomTo zoom in on a portion of a measurement, position the mouse cursor so as to draw a box over the area to be expanded. Press the left mouse button and drag the mouse to the right to cover the area. When the mouse button is released, the display zooms in on the selected area. The amplitude is auto-scaled so that the entire amplitude range of the selected fre-quency range can be seen.
To undo the zoom, right click and select Undo Zoom or click on the Undo Zoom button at the top of the display.
OverlayWith the mouse in Trace Overlay mode, and two or more traces open, use the left mouse button to drag a trace from one window to another. To undo the trace overlay, select the Undo Trace Overlay button at the top of the display. Up to five plots can be overlaid.
Figure 9-4. Trace Smoothing
9-8
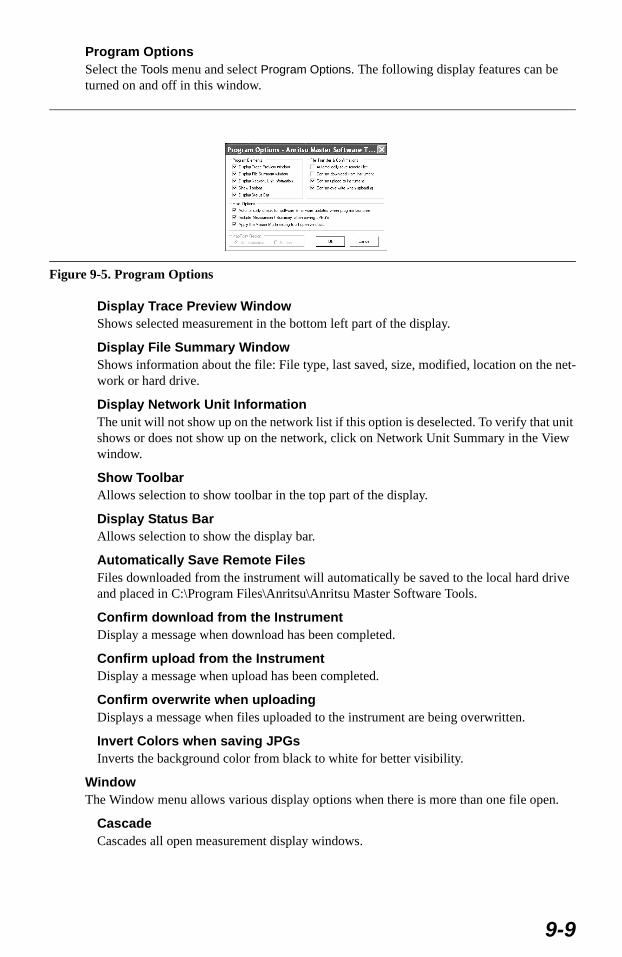
Program OptionsSelect the Tools menu and select Program Options. The following display features can be turned on and off in this window.
Display Trace Preview WindowShows selected measurement in the bottom left part of the display.
Display File Summary WindowShows information about the file: File type, last saved, size, modified, location on the net-work or hard drive.
Display Network Unit InformationThe unit will not show up on the network list if this option is deselected. To verify that unit shows or does not show up on the network, click on Network Unit Summary in the View window.
Show ToolbarAllows selection to show toolbar in the top part of the display.
Display Status BarAllows selection to show the display bar.
Automatically Save Remote FilesFiles downloaded from the instrument will automatically be saved to the local hard drive and placed in C:\Program Files\Anritsu\Anritsu Master Software Tools.
Confirm download from the InstrumentDisplay a message when download has been completed.
Confirm upload from the InstrumentDisplay a message when upload has been completed.
Confirm overwrite when uploadingDisplays a message when files uploaded to the instrument are being overwritten.
Invert Colors when saving JPGsInverts the background color from black to white for better visibility.
WindowThe Window menu allows various display options when there is more than one file open.
CascadeCascades all open measurement display windows.
Figure 9-5. Program Options
9-9
Tile HorizontalTiles all open measurement display windows horizontally.
Tile VerticalTiles all open measurement display windows vertically.
Close All Closes all open measurement display windows.
FileThe File Menu allows the creation of new files and the saving of files.
NewCreate new Signal Standard List.
OpenOpens a measurement file that has been saved in the local computer.
SaveSaves the currently open measurement to the PC hard disk or other selected PC storage device (floppy disk drive, etc.).
Save asSaves the currently open measurement with a new file name
Save AllSave all open measurements
Export CSVExports measurements in .csv format.
Save JPGSaves the file in jpg format.
HelpThe Help menu provides access to the Help files and other documentation.
Help ContentsShows the email and phone number for Anritsu support.
Anritsu on the webOpens up the URL for the Anritsu homepage.
App Notes and Instruments DocumentationDownload frequently used application notes and users guides.
NOTE: File saving options can also be accessed by right clicking on an open measurement file.
9-10
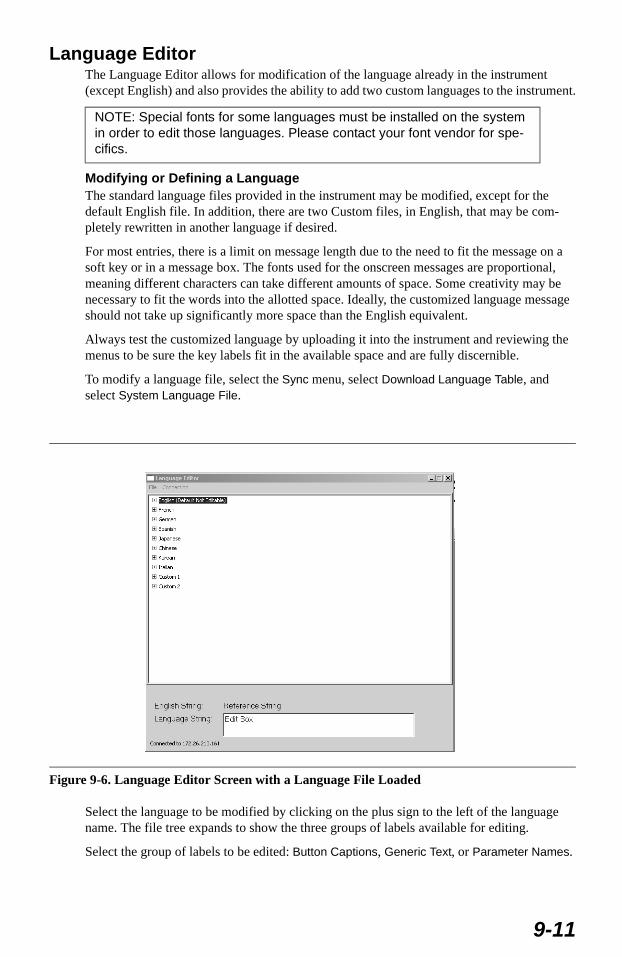
Language EditorThe Language Editor allows for modification of the language already in the instrument (except English) and also provides the ability to add two custom languages to the instrument.
Modifying or Defining a LanguageThe standard language files provided in the instrument may be modified, except for the default English file. In addition, there are two Custom files, in English, that may be com-pletely rewritten in another language if desired.
For most entries, there is a limit on message length due to the need to fit the message on a soft key or in a message box. The fonts used for the onscreen messages are proportional, meaning different characters can take different amounts of space. Some creativity may be necessary to fit the words into the allotted space. Ideally, the customized language message should not take up significantly more space than the English equivalent.
Always test the customized language by uploading it into the instrument and reviewing the menus to be sure the key labels fit in the available space and are fully discernible.
To modify a language file, select the Sync menu, select Download Language Table, and select System Language File.
Select the language to be modified by clicking on the plus sign to the left of the language name. The file tree expands to show the three groups of labels available for editing.
Select the group of labels to be edited: Button Captions, Generic Text, or Parameter Names.
NOTE: Special fonts for some languages must be installed on the system in order to edit those languages. Please contact your font vendor for spe-cifics.
Figure 9-6. Language Editor Screen with a Language File Loaded
9-11
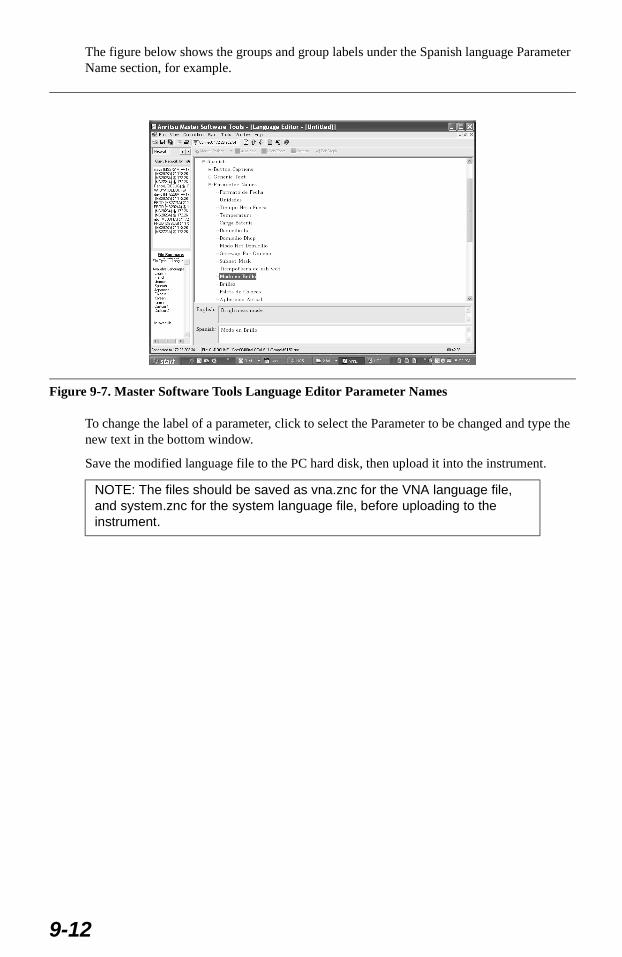
The figure below shows the groups and group labels under the Spanish language Parameter Name section, for example.
To change the label of a parameter, click to select the Parameter to be changed and type the new text in the bottom window.
Save the modified language file to the PC hard disk, then upload it into the instrument.
Figure 9-7. Master Software Tools Language Editor Parameter Names
NOTE: The files should be saved as vna.znc for the VNA language file, and system.znc for the system language file, before uploading to the instrument.
9-12
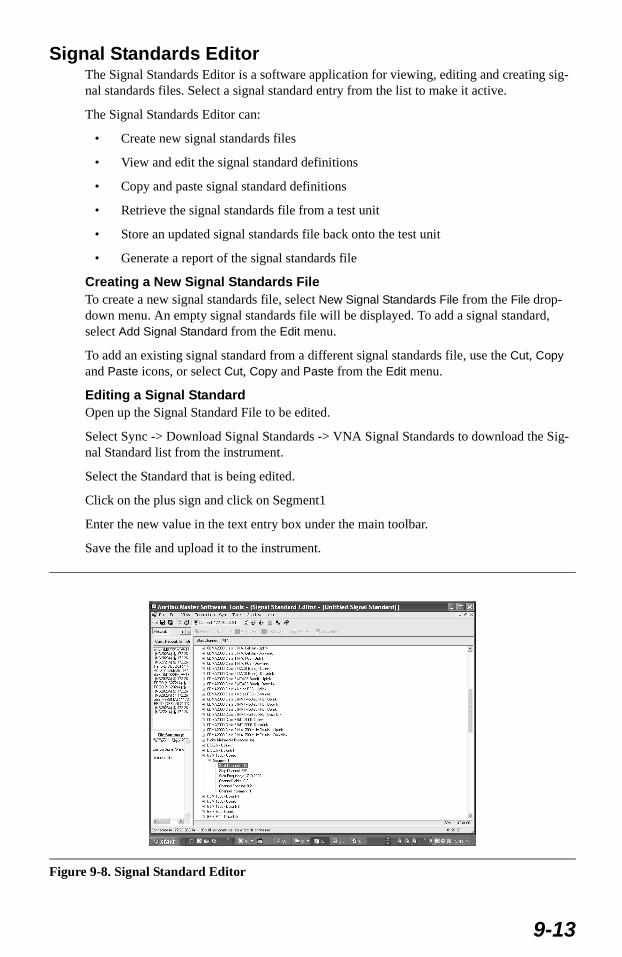
Signal Standards Editor The Signal Standards Editor is a software application for viewing, editing and creating sig-nal standards files. Select a signal standard entry from the list to make it active.
The Signal Standards Editor can:
• Create new signal standards files
• View and edit the signal standard definitions
• Copy and paste signal standard definitions
• Retrieve the signal standards file from a test unit
• Store an updated signal standards file back onto the test unit
• Generate a report of the signal standards file
Creating a New Signal Standards FileTo create a new signal standards file, select New Signal Standards File from the File drop-down menu. An empty signal standards file will be displayed. To add a signal standard, select Add Signal Standard from the Edit menu.
To add an existing signal standard from a different signal standards file, use the Cut, Copy and Paste icons, or select Cut, Copy and Paste from the Edit menu.
Editing a Signal StandardOpen up the Signal Standard File to be edited.
Select Sync -> Download Signal Standards -> VNA Signal Standards to download the Sig-nal Standard list from the instrument.
Select the Standard that is being edited.
Click on the plus sign and click on Segment1
Enter the new value in the text entry box under the main toolbar.
Save the file and upload it to the instrument.
Figure 9-8. Signal Standard Editor
9-13

Cut, Copy and PasteUse the Cut, Copy and Paste icons, or select Cut, Copy and Paste from the Edit menu to add, copy or remove signal standards. Cut moves the currently selected signal standard onto the clipboard and the signal standard is deleted from the Signal Standards list. If the signal stan-dards file is saved, the cut signal standard will be permanently deleted from that list.
Copy puts a copy of the signal standard on the clipboard, but does not delete it from the cur-rent Signal Standards list.
Paste copies a signal standard from the clipboard into the current Signal Standards list.
9-14
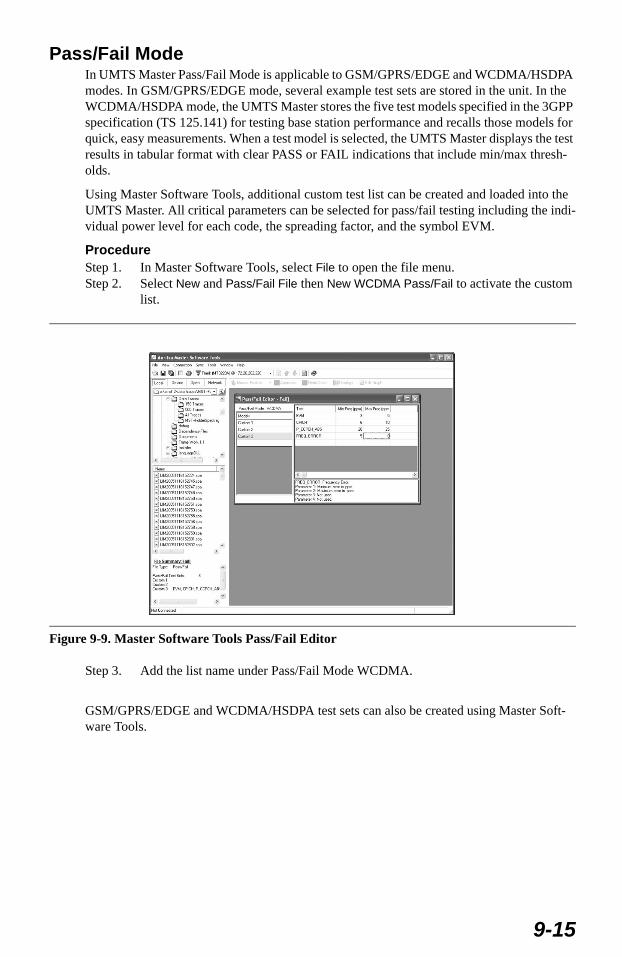
Pass/Fail ModeIn UMTS Master Pass/Fail Mode is applicable to GSM/GPRS/EDGE and WCDMA/HSDPA modes. In GSM/GPRS/EDGE mode, several example test sets are stored in the unit. In the WCDMA/HSDPA mode, the UMTS Master stores the five test models specified in the 3GPP specification (TS 125.141) for testing base station performance and recalls those models for quick, easy measurements. When a test model is selected, the UMTS Master displays the test results in tabular format with clear PASS or FAIL indications that include min/max thresh-olds.
Using Master Software Tools, additional custom test list can be created and loaded into the UMTS Master. All critical parameters can be selected for pass/fail testing including the indi-vidual power level for each code, the spreading factor, and the symbol EVM.
ProcedureStep 1. In Master Software Tools, select File to open the file menu. Step 2. Select New and Pass/Fail File then New WCDMA Pass/Fail to activate the custom
list.
Step 3. Add the list name under Pass/Fail Mode WCDMA.
GSM/GPRS/EDGE and WCDMA/HSDPA test sets can also be created using Master Soft-ware Tools.
Figure 9-9. Master Software Tools Pass/Fail Editor
9-15
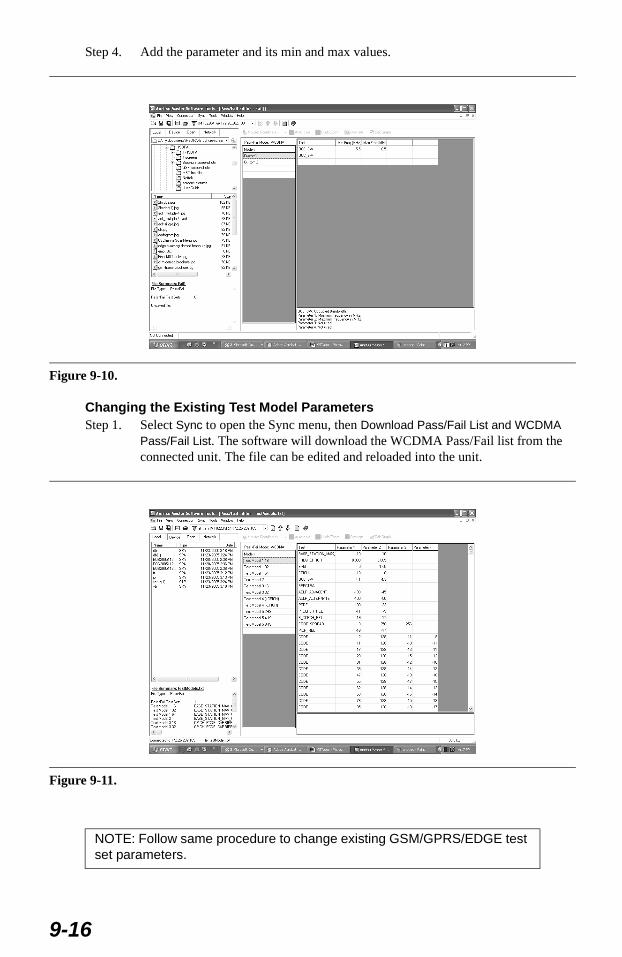
Step 4. Add the parameter and its min and max values.
Changing the Existing Test Model ParametersStep 1. Select Sync to open the Sync menu, then Download Pass/Fail List and WCDMA
Pass/Fail List. The software will download the WCDMA Pass/Fail list from the connected unit. The file can be edited and reloaded into the unit.
Figure 9-10.
Figure 9-11.
NOTE: Follow same procedure to change existing GSM/GPRS/EDGE test set parameters.
9-16
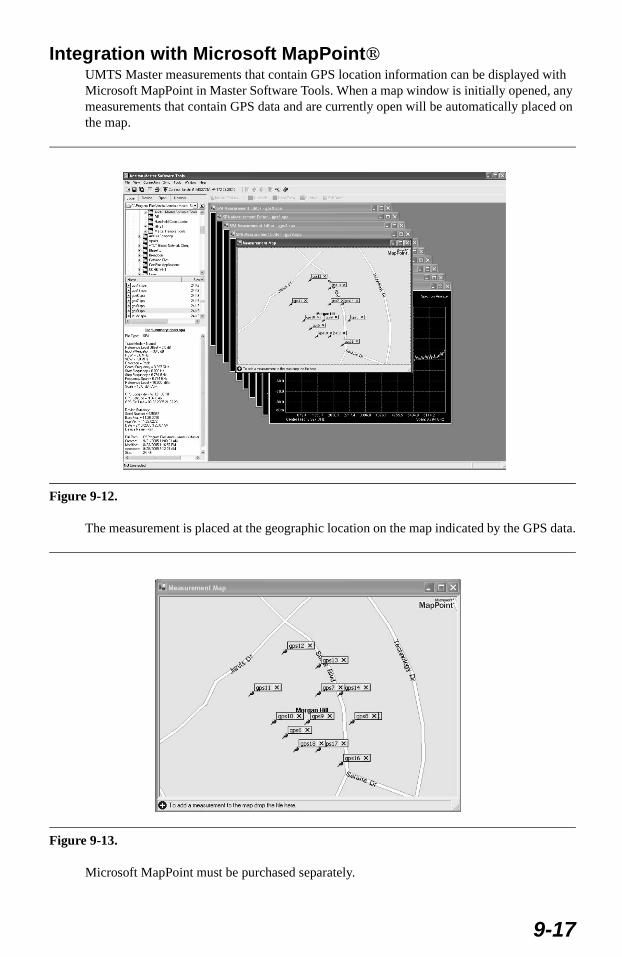
Integration with Microsoft MapPointUMTS Master measurements that contain GPS location information can be displayed with Microsoft MapPoint in Master Software Tools. When a map window is initially opened, any measurements that contain GPS data and are currently open will be automatically placed on the map.
The measurement is placed at the geographic location on the map indicated by the GPS data.
Microsoft MapPoint must be purchased separately.
Figure 9-12.
Figure 9-13.
9-17
Dat Conversion UtilityIntroductionThis utility is used to convert saved traces (.dat files) from an Anritsu MS2711D, MS2711B, MT8212A, MT8212B, S332D, S332C, or S114C to the format used by Master Software Tools. This conversion is a one-way process as there is no equivalent utility to convert newer traces to the older format. The trace files in the old format are not deleted, and the new for-mat uses a different file name extension, .vna instead of .dat. If necessary the old traces can still be used directly with the Handheld Software Tools program.
ProcedureStep 1. Open the Tools menu in Master Software Tools and select DAT File Conversion
Tool.Step 2. Start the Measurement Conversion Utility from the Master Software Suite menu. Step 3. In the Source area at the top area of the window, navigate to the directory that con-
tains the traces to be converted.Step 4. In the Destination area, select the directory into which the converted traces are to
be placed. Step 5. Select the Conflicting Filenames option to be used – to keep existing, overwrite,
prompt for a decision or skip the conversion of the file for which there is a con-flict.
Step 6. Select the measurement or measurements to be converted.Step 7. Click the Convert File button. Note that the new traces appear in the destination
window.
NOTE: Before the conversion, select View to preview the file in the new format if desired.
9-18
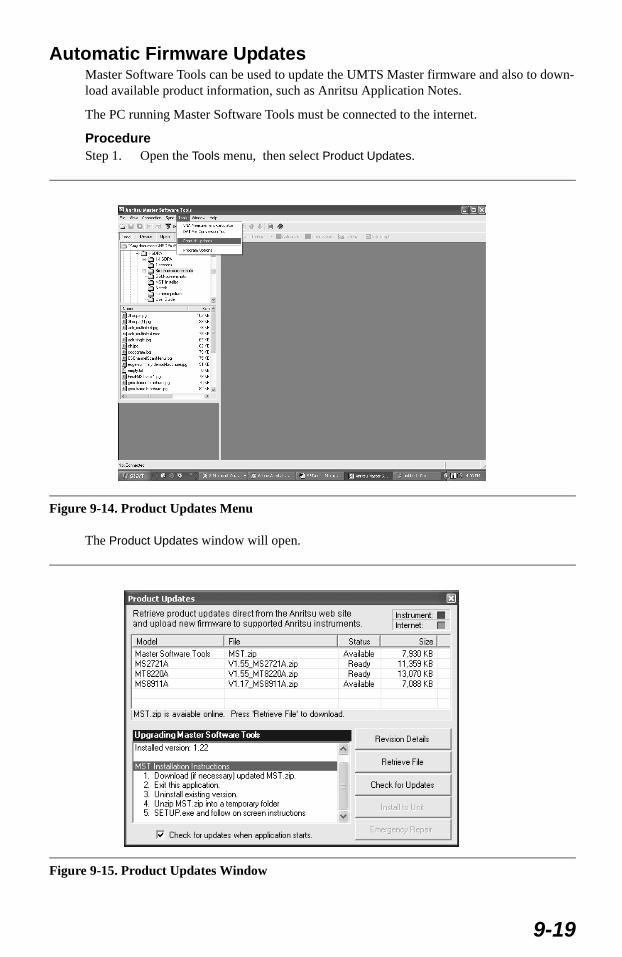
Automatic Firmware UpdatesMaster Software Tools can be used to update the UMTS Master firmware and also to down-load available product information, such as Anritsu Application Notes.
The PC running Master Software Tools must be connected to the internet.
ProcedureStep 1. Open the Tools menu, then select Product Updates.
The Product Updates window will open.
Figure 9-14. Product Updates Menu
Figure 9-15. Product Updates Window
9-19
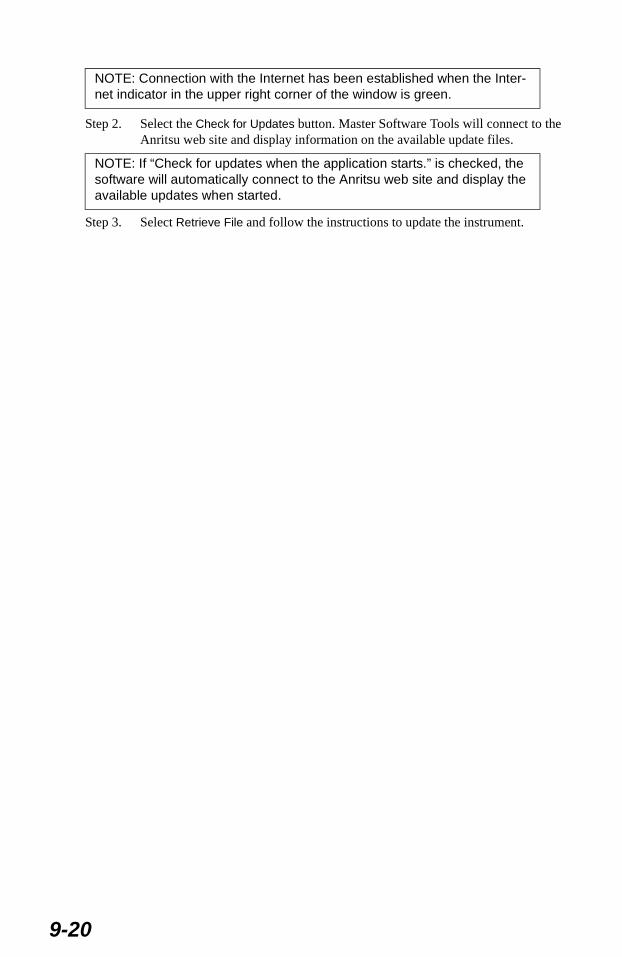
Step 2. Select the Check for Updates button. Master Software Tools will connect to the Anritsu web site and display information on the available update files.
Step 3. Select Retrieve File and follow the instructions to update the instrument.
NOTE: Connection with the Internet has been established when the Inter-net indicator in the upper right corner of the window is green.
NOTE: If “Check for updates when the application starts.” is checked, the software will automatically connect to the Anritsu web site and display the available updates when started.
9-20
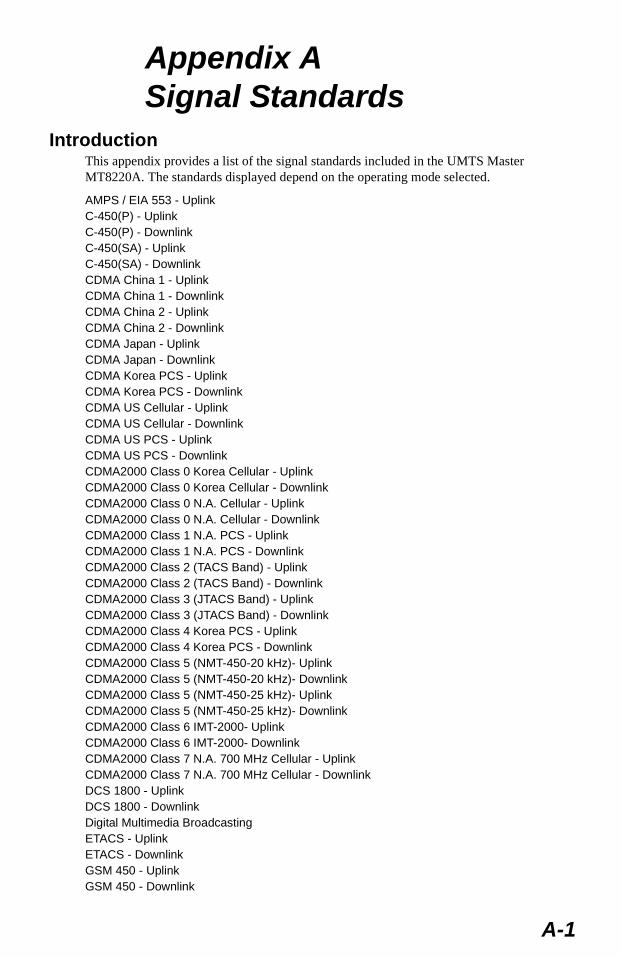
Appendix ASignal Standards
IntroductionThis appendix provides a list of the signal standards included in the UMTS Master MT8220A. The standards displayed depend on the operating mode selected.
AMPS / EIA 553 - UplinkC-450(P) - UplinkC-450(P) - DownlinkC-450(SA) - UplinkC-450(SA) - DownlinkCDMA China 1 - UplinkCDMA China 1 - DownlinkCDMA China 2 - UplinkCDMA China 2 - DownlinkCDMA Japan - UplinkCDMA Japan - DownlinkCDMA Korea PCS - UplinkCDMA Korea PCS - DownlinkCDMA US Cellular - UplinkCDMA US Cellular - DownlinkCDMA US PCS - UplinkCDMA US PCS - DownlinkCDMA2000 Class 0 Korea Cellular - UplinkCDMA2000 Class 0 Korea Cellular - DownlinkCDMA2000 Class 0 N.A. Cellular - UplinkCDMA2000 Class 0 N.A. Cellular - DownlinkCDMA2000 Class 1 N.A. PCS - UplinkCDMA2000 Class 1 N.A. PCS - DownlinkCDMA2000 Class 2 (TACS Band) - UplinkCDMA2000 Class 2 (TACS Band) - DownlinkCDMA2000 Class 3 (JTACS Band) - UplinkCDMA2000 Class 3 (JTACS Band) - DownlinkCDMA2000 Class 4 Korea PCS - UplinkCDMA2000 Class 4 Korea PCS - DownlinkCDMA2000 Class 5 (NMT-450-20 kHz)- UplinkCDMA2000 Class 5 (NMT-450-20 kHz)- DownlinkCDMA2000 Class 5 (NMT-450-25 kHz)- UplinkCDMA2000 Class 5 (NMT-450-25 kHz)- DownlinkCDMA2000 Class 6 IMT-2000- UplinkCDMA2000 Class 6 IMT-2000- DownlinkCDMA2000 Class 7 N.A. 700 MHz Cellular - UplinkCDMA2000 Class 7 N.A. 700 MHz Cellular - DownlinkDCS 1800 - UplinkDCS 1800 - DownlinkDigital Multimedia BroadcastingETACS - UplinkETACS - DownlinkGSM 450 - UplinkGSM 450 - Downlink
A-1
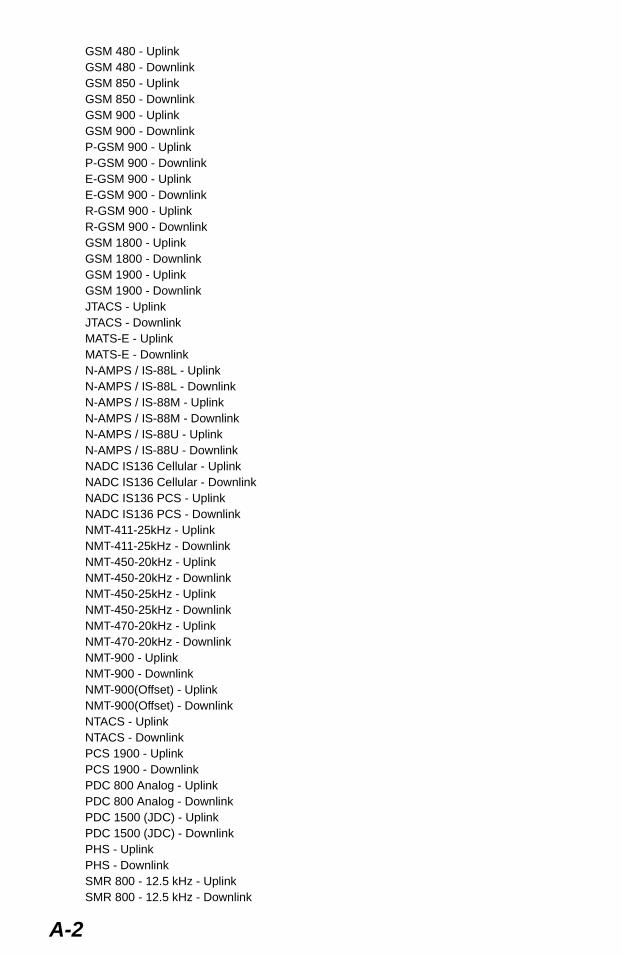
GSM 480 - UplinkGSM 480 - DownlinkGSM 850 - UplinkGSM 850 - DownlinkGSM 900 - UplinkGSM 900 - DownlinkP-GSM 900 - UplinkP-GSM 900 - DownlinkE-GSM 900 - UplinkE-GSM 900 - DownlinkR-GSM 900 - UplinkR-GSM 900 - DownlinkGSM 1800 - UplinkGSM 1800 - DownlinkGSM 1900 - UplinkGSM 1900 - DownlinkJTACS - UplinkJTACS - DownlinkMATS-E - UplinkMATS-E - DownlinkN-AMPS / IS-88L - UplinkN-AMPS / IS-88L - DownlinkN-AMPS / IS-88M - UplinkN-AMPS / IS-88M - DownlinkN-AMPS / IS-88U - UplinkN-AMPS / IS-88U - DownlinkNADC IS136 Cellular - UplinkNADC IS136 Cellular - DownlinkNADC IS136 PCS - UplinkNADC IS136 PCS - DownlinkNMT-411-25kHz - UplinkNMT-411-25kHz - DownlinkNMT-450-20kHz - UplinkNMT-450-20kHz - DownlinkNMT-450-25kHz - UplinkNMT-450-25kHz - DownlinkNMT-470-20kHz - UplinkNMT-470-20kHz - DownlinkNMT-900 - UplinkNMT-900 - DownlinkNMT-900(Offset) - UplinkNMT-900(Offset) - DownlinkNTACS - UplinkNTACS - DownlinkPCS 1900 - UplinkPCS 1900 - DownlinkPDC 800 Analog - UplinkPDC 800 Analog - DownlinkPDC 1500 (JDC) - UplinkPDC 1500 (JDC) - DownlinkPHS - UplinkPHS - DownlinkSMR 800 - 12.5 kHz - UplinkSMR 800 - 12.5 kHz - Downlink
A-2
SMR 800 - 25 kHz - UplinkSMR 800 - 25 kHz - DownlinkSMR 1500 - UplinkSMR 1500 - DownlinkTACS - UplinkTACS - DownlinkDigital Terrestrial TV JapanTerrestrial TV JapanTerrestrial TV USATerrestrial TV Eur. UHF-8MHzUMTS Band I Uplink 9612-9888 EuropeUMTS Band I Downlink 10562-10838 EuropeUMTS Band II Uplink(General) 9262-9538 USUMTS Band II Uplink(Additional) 12-287 USUMTS Band II Downlink(General) 9662-9938 USUMTS Band II Downlink(Additional) 412-687 USUMTS Band III Uplink 8562-8913 EuropeUMTS Band III Downlink 9037-9388 EuropeUMTS Band IV Uplink(General) 8562-8763UMTS Band IV Uplink(Additional) 1162-1362UMTS Band IV Downlink(General) 10562-10763UMTS Band IV Downlink(Additional) 1462-1662UMTS Band V Uplink(General) 4132-4233 USUMTS Band V Uplink(Additional) 782-782 USUMTS Band V Downlink(General) 4357-4458 USUMTS Band V Downlink(Additional) 1007-1007 USUMTS Band VI Uplink(General) 4162-4188 JapanUMTS Band VI Uplink(Additional) 812-837 JapanUMTS Band VI Downlink(General) 4387-4413 JapanUMTS Band VI Downlink(Additional) 1037-1062 Japan802.11a802.11b802.11 FH802.11 DS802.11g
A-3

A-4
Appendix BError Messages
IntroductionThis chapter provides a list of information and error messages that could be displayed on the UMTS Master MT8220A. If any error condition persists, contact your local Anritsu Service Center (page 1-11).
Self Test or Application Self Test Error MessagesOverall Status FAILED One or more elements of the System or Application Self Test has failed. Refer to the other pass fail tests listed below to determine which specific test failed.
ADC Self Test FAILEDThe Analog to Digital converter failed to return an answer. Insure that the battery level is adequate for operation or that the temperature is within acceptable limits. Reset to factory defaults with either Factory Defaults, ESC+ON, or MASTER RESET, System+ON. Cau-tion: Use of MASTER RESET, System+ON, will erase all user saved setups and measure-ment traces and return the unit to a fully Factory Default condition. If the error persists, contact your Anritsu Service Center.
DDC FAILED The Digital Down Converter failed to return a value. Insure that the battery level is adequate for operation or that temperature is within acceptable limits. Reset to factory defaults with either Factory Defaults, ESC+ON, or MASTER RESET, System+ON. Caution: Use of MASTER RESET, System+ON, will erase all user saved setups and measurement traces and return the unit to a fully Factory Default condition. If the error persists, contact your Anritsu Service Center.
Lock Test FAILEDOne or more Phase Lock Loops Failed to properly achieve Lock Status. Insure that the bat-tery level is adequate for operation or that temperature is within acceptable limits. Reset to factory defaults with either Factory Defaults, ESC+ON, or MASTER RESET, System+ON. Caution: Use of MASTER RESET, System+ON, will erase all user saved setups and mea-surement traces and return the unit to a fully Factory Default condition. If the error persists, contact your Anritsu Service Center.
Over Power FAILEDRF Power applied to the input connector is too high. Remove or reduce the input power or add additional attenuation. Sometimes out of band frequencies may be present that can cause an Over Power Error. In highly rich RF environments it may be necessary to add an external band pass filter to reduce unwanted interference. See the accessories section for a list of available band pass filters from Anritsu. Out of band frequencies can often be detected by increasing the Span to maximum in the peak detect mode of operation. Another resolution may be to reset to factory defaults with either Factory Defaults, ESC+ON, or MASTER RESET, System+ON. Caution: Use of MASTER RESET, System+ON, will erase all user saved setups and measurement traces and return the unit to a fully Factory Default condition. If the error persists, contact your Anritsu Service Center.
Over Power Start FAILEDRF Power applied to the input connector is too high at turn on. See Over Power FAILED error above.
B-1
Mixer Saturation: Increase Attenuationor
Mixer Overdrive FAILEDToo much power applied with too little Attenuation. Increase attenuation. Sometimes even out of band frequencies may be present that would cause a Mixer Overdrive Error. In highly rich RF environments it may be necessary to add an external band pass filter to reduce unwanted interference. See the accessories section for a list available band pass filters from Anritsu. Out of band frequencies can often be detected by increasing the SPAN to maximum in peak detect mode of operation. Another resolution may be to Reset to factory defaults with either Factory Defaults, ESC+ON, or MASTER RESET, System+ON. Caution: Use of MASTER RESET, System+ON, will erase all user saved setups and measurement traces and return the unit to a fully Factory Default condition. If the error persists, contact your Anritsu Service Center.
Operation Error MessagesADC Over range: Increase Reference LevelInput signal is too large for the Analog to Digital converter to process. Increase the internal or external attenuation or, if using Auto attenuation, increasing the Reference Level should resolve the error. See also the Mixer Overdrive error above for information on Out of band RF power.
Calibrator Reading ErrorCalibration reference source is not providing quality signal. Insure that the battery level is adequate for operation or that temperature is within acceptable limits. Reset to factory defaults with either Factory Defaults, ESC+ON, or MASTER RESET, System+ON. Cau-tion: Use of MASTER RESET, System+ON, will erase all user saved setups and measure-ment traces and return the unit to a fully Factory Default condition. If the error persists, contact your Anritsu Service Center.
Fatal ErrorUsually caused by a failure to communicate with one section or another. Sometimes resolved by restarting the unit or by Factory Defaults, ESC+ON, resetting of the unit. Under extreme cases the use of MASTER RESET, System+ON, may resolve the issue. Caution: Use of MASTER RESET, System+ON, will erase all user saved setups and measurement traces and return the unit to a fully Factory Default condition. If the error persists, contact your Anritsu Service Center.
Trace not saved. Please wait for complete sweep and try again.Attempted to save a measurement trace before the sweep had completed at least once. Wait for at least one complete sweep and try to save again.
Measurement not valid in Zero SpanAttempt was made to make an automated measurement that requires more than ZERO SPAN to accomplish. An example would be Occupied Bandwidth measurement.
The Freq range of the Antenna is invalid for this setup. Please select another AntennaChoose a start and stop frequency that is within the defined frequency range for the selected antenna compensation table. See also Master Software Tools for creation and Upload of Antenna correction files.
Minimum permitted Sweep time is 50µsAn attempt was made to set the minimum Sweep time to less than 50us.
B-2
Invalid Attenuation for PreampThe only valid attenuation settings while the Preamp is operational are 0dB and 10dB. All other settings attempted by the user will result in this message. Select 0dB or 10dB or select AUTO Attenuation to let the system determine the correct setting based on the reference level selected.
Valid Attenuations with Preamp on are 0dB and 10dBSame as above
Unable to add additional limit points. %d is the maximum.Attempted to add an additional limit line point beyond the maximum number of allowed points.
Use Demod type USB or LSB to use Beat Frequency OscAn attempt to use the Beat Frequency Oscillator while not in Upper or Lower Sideband Demodulation mode.
Trace A/B/C has no data to viewAttempt to turn on or VIEW a trace that has never had data recalled into this trace location. Refer to RECALL TRACE section for instructions on how to recall stored measurement traces into either Trace A, B or C.
DSP Memory Failure, Address, Ext High, Ext Middle, Ext low, Ext1, Ext2One of the DSP memory locations has failed. The DSP will attempt to resolve the memory Failure location and Byte. There are two external memory banks (Ext1 = bank one, Ext2 = Bank 2) with three bytes wide (Ext High, Ext Middle and Ext Low. Byte)
Locking to Internal Ref failedSwitching from an external frequency reference to the internal reference has failed. Some additional warm up time may be needed if the unit has been on external reference for a long time or the unit is not warmed up enough.
Locking to External Ref failed; Lock attempt FailedSwitching from an internal frequency reference to the external reference has failed. Verify that the correct external reference frequency value has been selected from the list of valid external reference frequencies (page 4-24). Verify that the level of the external reference fre-quency is at least 1vp-p.
EEPROM TEST: FAILHardware communications between modules has failed. Insure that the battery level is ade-quate for operation or that temperature is within acceptable limits. Reset to factory defaults with either Factory Defaults, ESC+ON, or MASTER RESET, System+ON. Caution: Use of MASTER RESET, System+ON, will erase all user saved setups and measurement traces and return the unit to a fully Factory Default condition. If the error persists, contact your Anritsu Service Center.
EEPROM TEST: UNKNOWN ERRORHardware communications between modules has failed. Insure that the battery level is ade-quate for operation or that temperature is within acceptable limits. Reset to factory defaults with either Factory Defaults, ESC+ON, or MASTER RESET, System+ON. Caution: Use of MASTER RESET, System+ON, will erase all user saved setups and measurement traces and return the unit to a fully Factory Default condition. If the error persists, contact your Anritsu Service Center.
Fatal error, UnknownHardware communications between modules has failed. Insure that the battery level is ade-quate for operation or that temperature is within acceptable limits. Reset to factory defaults with either Factory Defaults, ESC+ON, or MASTER RESET, System+ON. Caution: Use of
B-3
MASTER RESET, System+ON, will erase all user saved setups and measurement traces and return the unit to a fully Factory Default condition. If the error persists, contact your Anritsu Service Center.
Fatal error, EEPROM failedHardware communications between modules has failed. Insure that the battery level is ade-quate for operation or that temperature is within acceptable limits. Reset to factory defaults with either Factory Defaults, ESC+ON, or MASTER RESET, System+ON. Caution: Use of MASTER RESET, System+ON, will erase all user saved setups and measurement traces and return the unit to a fully Factory Default condition. If the error persists, contact your Anritsu Service Center.
Fatal error, no SPA board connectedHardware communications between modules has failed. Insure that the battery level is ade-quate for operation or that temperature is within acceptable limits. Reset to factory defaults with either Factory Defaults, ESC+ON, or MASTER RESET, System+ON. Caution: Use of MASTER RESET, System+ON, will erase all user saved setups and measurement traces and return the unit to a fully Factory Default condition. If the error persists, contact your Anritsu Service Center.
Fatal error not decoded by DSPHardware communications between modules has failed. Insure that the battery level is ade-quate for operation or that temperature is within acceptable limits. Reset to factory defaults with either Factory Defaults, ESC+ON, or MASTER RESET, System+ON. Caution: Use of MASTER RESET, System+ON, will erase all user saved setups and measurement traces and return the unit to a fully Factory Default condition. If the error persists, contact your Anritsu Service Center.
UNKNOWN ERROR In SPAHardware communications between modules has failed. Insure that the battery level is ade-quate for operation or that temperature is within acceptable limits. Reset to factory defaults with either Factory Defaults, ESC+ON, or MASTER RESET, System+ON. Caution: Use of MASTER RESET, System+ON, will erase all user saved setups and measurement traces and return the unit to a fully Factory Default condition. If the error persists, contact your Anritsu Service Center.
DSP version different from released versionMay occur during firmware update. Likely cause is incomplete firmware package installa-tion. Finish complete firmware update with Master Code Loader.
Operation not Permitted in Recall ModeAttempted to perform an operation on a recalled trace. Many operations are valid only on a live or active trace.
Cannot change scale in Linear modeLinear display mode of operation does not support a scaling change like the Log display mode.
Cannot turn on delta marker because Ref Marker is invalidDelta markers cannot be enabled unless the primary marker is within the displayed span.
Cannot turn on delta marker because Ref Marker is a counter MarkerDelta markers cannot be enabled unless the primary marker is NOT a counter Marker. Turn off the Counter Marker mode of marker operation to use Delta Marker.
Current Marker is not ONAttempted to use a marker mode or feature for a marker that is not enabled. Turn on the appropriate marker to use this function or switch to a marker that is already enabled.
B-4
Marker must be ON to Use the featureAttempted to use a marker mode or feature for a marker that is not enabled. Turn on the appropriate marker to use this function or switch to a marker that is already enabled.
Triggering valid only in Zero SpanExternal triggering can only be used while the SPAN is set to 0 (zero)
Cannot change Modes for Recalled/Inactive TracesDetection modes or other elements like RBW/VBW, averaging etc. cannot be altered on a recalled trace. The trace is displayed with the same parameters in which it was saved.
Cannot change average for Recalled/Inactive Traces Cannot set Delta Detection modes or other elements like RBW/VBW, averaging etc. cannot be altered on a recalled trace. The trace is displayed with the same parameters in which it was saved.
Pretune Calibration Table fault. Insure that the battery level is adequate for operation or that temperature is within acceptable limits. Reset to factory defaults with either Factory Defaults, ESC+ON, or MASTER RESET, System+ON. Caution: Use of MASTER RESET, System+ON, will erase all user saved setups and measurement traces and return the unit to a fully Factory Default condition. If the error persists, contact your Anritsu Service Center.
Lock failed during initializationOne or more of the Phase Lock Loops failed to achieve lock status during startup. Insure that the battery level is adequate for operation or that temperature is within acceptable limits. Reset to factory defaults with either Factory Defaults, ESC+ON, or MASTER RESET, Sys-tem+ON. Caution: Use of MASTER RESET, System+ON, will erase all user saved setups and measurement traces and return the unit to a fully Factory Default condition. If the error persists, contact your Anritsu Service Center.
Reference LVL Cal is OFFFactory Calibration is OFF. Insure that the battery level is adequate for operation or that the temperature is within acceptable limits. Reset to factory defaults with either Factory Defaults, ESC+ON, or MASTER RESET, System+ON. Caution: Use of MASTER RESET, System+ON, will erase all user saved setups and measurement traces and return the unit to a fully Factory Default condition. If the error persists, contact your Anritsu Service Center.
IF Cal is OFFFactory Calibration is OFF. Insure that the battery level is adequate for operation or that the temperature is within acceptable limits. Reset to factory defaults with either Factory Defaults, ESC+ON, or MASTER RESET, System+ON. Caution: Use of MASTER RESET, System+ON, will erase all user saved setups and measurement traces and return the unit to a fully Factory Default condition. If the error persists, contact your Anritsu Service Center.
Lock failureOne or more of the Phase Lock Loops cannot keep the frequency controlled accurately. Insure that the battery level is adequate for operation and that the temperature is within acceptable limits. Reset to factory defaults with either Factory Defaults, ESC+ON, or MAS-TER RESET, System+ON. Caution: Use of MASTER RESET, System+ON, will erase all user saved setups and measurement traces and return the unit to a fully Factory Default con-dition. If the error persists, contact your Anritsu Service Center.
Cannot set Delta Mkr Freq to Demod FreqMarker to Demod frequency is only available with a primary marker as the selected marker.
B-5
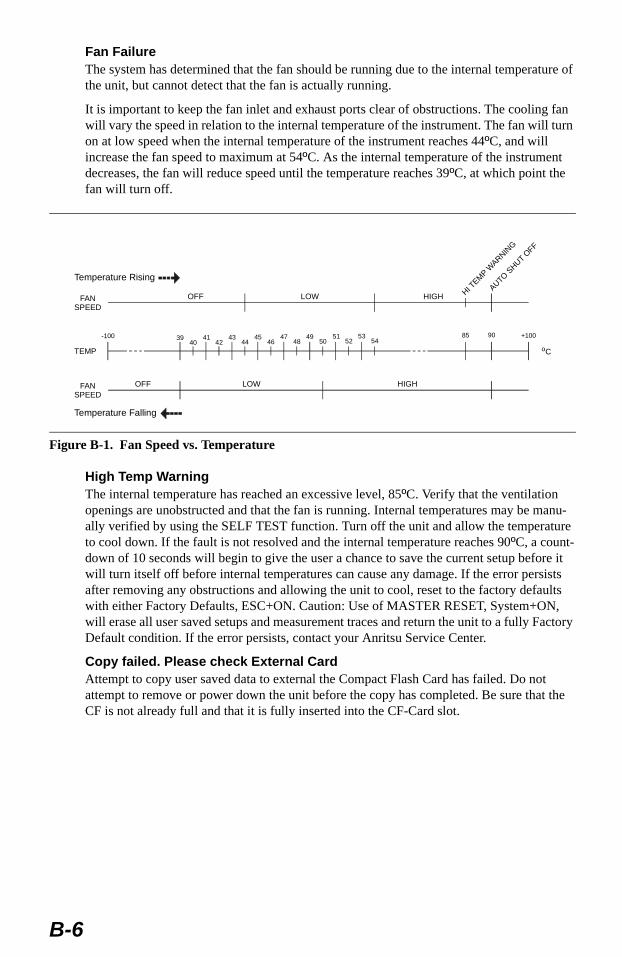
Fan FailureThe system has determined that the fan should be running due to the internal temperature of the unit, but cannot detect that the fan is actually running.
It is important to keep the fan inlet and exhaust ports clear of obstructions. The cooling fan will vary the speed in relation to the internal temperature of the instrument. The fan will turn on at low speed when the internal temperature of the instrument reaches 44ºC, and will increase the fan speed to maximum at 54ºC. As the internal temperature of the instrument decreases, the fan will reduce speed until the temperature reaches 39ºC, at which point the fan will turn off.
High Temp WarningThe internal temperature has reached an excessive level, 85ºC. Verify that the ventilation openings are unobstructed and that the fan is running. Internal temperatures may be manu-ally verified by using the SELF TEST function. Turn off the unit and allow the temperature to cool down. If the fault is not resolved and the internal temperature reaches 90ºC, a count-down of 10 seconds will begin to give the user a chance to save the current setup before it will turn itself off before internal temperatures can cause any damage. If the error persists after removing any obstructions and allowing the unit to cool, reset to the factory defaults with either Factory Defaults, ESC+ON. Caution: Use of MASTER RESET, System+ON, will erase all user saved setups and measurement traces and return the unit to a fully Factory Default condition. If the error persists, contact your Anritsu Service Center.
Copy failed. Please check External CardAttempt to copy user saved data to external the Compact Flash Card has failed. Do not attempt to remove or power down the unit before the copy has completed. Be sure that the CF is not already full and that it is fully inserted into the CF-Card slot.
Figure B-1. Fan Speed vs. Temperature
FANSPEED
OFF LOW HIGH HI TEM
P WARNIN
G
AUTO SHUT O
FF
Temperature Rising
FANSPEED
OFF LOW HIGH
Temperature Falling
TEMP
39 41 43 45 47 49 51 53-100 85 90 +100
oC40 42 44 46 48 50 52 54
B-6
GSM/WCDMA MessagesWarning Messages 1. External Reference not found. Internal reference Locked successfully
2. External Reference Locked Successfully
Notifications 1. RF Over Power
2. ADC over range
a. If Auto Range is ON - ADC over range: Decrease input power.
b. If Auto Range is Off and if Atten = 65 then ADC over range: Decrease input power.
c. If Auto Range is Off and Atten is < 65 then ADC over range: Adjust range.
3. Level Under
a. If Auto Range is ON - No signal detected: Increase input power.
b. If Auto Range is Off and if Atten = 0 & Preamp is On then no signal detected: Increase input power.
c. If Auto Range is Off and not (b) then no signal detected: Adjust range.
4. Out of band saturation
5. Poor Range
a. If Auto Range is ON - Weak signal: Increase input power.
b. If Auto Range is Off and if Atten = 0 & Preamp is On then Weak signal: Increase input power.
c. If Auto Range is Off and not (b) then Weak signal: Adjust range
6. Lock Failure
7. Attempting to lock to Internal ref.
8. Attempting to lock to External ref.
B-7
Interference Analyzer MessagesInformation MessagesAttenuation has been changedReference Level has been changedMinimum permitted Sweep time is 10µsPreamp has been turned offPreamp has been turned onUnits has been changed to dBmReference Locked SuccessfullyStartup Selftest successfulStartup DSP Memory test successfulReference LVL Cal is OFFIF Cal is OFFSuccessfully lockedAttempting to lock to Internal refAttempting to lock to External refAttempting to lock to ext refPress ESC to clear Recall TraceSweep Stopped After Saving On EventConnect Carrier\nPress Enter to Measure or Escape to ExitDisconnect Carrier\nPress Enter to Measure or Escape to ExitPress Escape to keep old settings, or Enter to use Recalled ValuesChanging Active trace to AUse Min/Max buttons under the Signal Strength Sub-Menu to change measure rangeCannot change scale in Linear modeUse Min/Max buttons under the Signal Strength Sub-Menu to change display rangeValid Attenuations with Preamp on are 0dB and 10dBCannot turn on delta marker because Ref Marker is a counter MarkerCurrent Marker is not ONTurning off Delta MarkerADC Over range: Increase Reference LevelMixer Saturation: Increase Attenuation
Error Messages Trace not saved. Please wait for complete sweep and try again.Measurement has been turned OFFMeasurement not valid in Zero SpanMeasurements can not be displayed in Full Screen modeThe Freq range of the Antenna is invalid for this setup. Please select another AntennaDDC FailureLock failed during initializationInvalid Attenuation for PreAmp SettingUnable to add additional limit points. %d is the maximum.Hidden inflection points prevent this action. Decrease Span to reveal hidden points.Trace A has no data to viewTrace B has no data to viewTrace C has no data to viewTurning off Trace OverlayOnly HOLD is valid for Trace C when trace C is not being updated from AAuto Save not available when Time Span is AutoThe specified Time span is too big to save all measurments. Automatically adjusted Time Span to a valid numberDSP Memory Failure
B-8
Pretune Calibration FailureLock failure %xLocking to Internal Ref failedLocking to External Ref failedLock attempt FailedTimed Measurement Done. Press Reset/Restart Meas to continue measuringCurrent measurement is stopped when Cursor is not zeroOVER POWER ERRORFatal error, UnknownFatal error, EEPROM failedFatal error, no IA board connectedFatal error not decoded by DSPUNKNOWN ERROR In IAOperation not Permitted in Recall ModeOperation not Permitted in this ModeMarker must be ON to Use the featureTriggering valid only in Zero SpanOnly HOLD is valid for Trace BCannot change average for Recalled/Inactive TracesCannot set Delta Mkr Freq to Demod Freq
B-9

Channel Scanner MessagesInformation MessagesReference Locked SuccessfullyStartup Selftest successfulStartup DSP Memory test successfulAttempting to lock to Internal refAttempting to lock to External refAttempting to lock to ext refPress ESC to clear Recall Trace
Error Messages Error Recalling MeasurementNot Available when Max Hold is OFFOperation not Permitted in Recall ModeADC Over range: Increase Reference LevelMixer Saturation: Increase Attenuation
B-10
Index
Aaccessories
optional . . . . . . . . . . . . . . . . 1-3supplied . . . . . . . . . . . .1-2, 1-15
ACLR . . . . . . . . . . . . . . . . . . . . 4-26ACPR . . . . . . . . . . . . . . . . .3-19, 6-8adapter . . . . . . . . . . . . . . . . . . . . 1-3
12 Volt . . . . . . . . . . . . . . . . . 1-3AC-DC . . . . . . . . . 1-3, 1-12, 2-1
adjacent channels . . . . . . . . . . . . 6-9AM/FM . . . . . 3-20, 3-37, 3-45, 6-9amplitude . . . . . . . . . . . . . . .7-3, 9-5
scale . . . . . . . . . . . . . . . . . . . 9-7antenna . . . . . . . . . . . . . . . . . . . . 1-5
calculations . . . . . . . . . . . . 3-44attenuation . . . . . . . . . 3-2, 3-34, 6-4auto range . . . . . . . . . . . . . . . . . . 5-2autoscale . . . . . . . . . . . . . . . . . . . 9-7
Bband pass filter . . . . . . . . . . . . . . 1-4bandwidth . . . . . . . . . . . . . . . . . . 7-2brightness . . . . . . . . . . . . .3-29, 4-19burst power . . . . . . . . . . . . . . . 5-15
CC/I . . . . .3-1, 3-21, 3-37, 3-45, 6-10cable . . . . . . . . . . . . . . . . . . . . . . 1-3calibration . . . . . . . . . . . . . . . . 1-11
status . . . . . . . . . . . . . . . . . . 9-1CDP . . . . . . . . . . . . . . . . .4-20, 4-33channel power . 3-19, 3-38, 6-8, 7-1channel spacing . . . . . . . . . . . . . 6-9Code Domain Power . . . . . . . . 4-20Codogram . . . . . . . . . . . . .4-21, 4-37compact flash . . . . . . . . . . . . . . 2-10connectors . . . . . . . . . . . . . . . . . 2-7CPICH . . . . . . . . . . . . . . . . . . . 4-22current
trace . . . . . . . . . . . . . . . . . . . 9-5custom setup . . . . . . . . . . . . . . . 7-6
Ddat conversion . . . . . . . . . . . . . 9-18
deletenode . . . . . . . . . . . . . . . . . . . . 9-6
deltamarker . . . . . . . . . . . . . . . . . . 9-5
demodfrequency . . . . . . . . . . . 6-9, B-5time . . . . . . . . . . . . . . . . . . . . 6-9
demodulator . . . . . . . . . . . . . . . 4-33detection . . . . . . . . . . . . . 3-25, 3-31DHCP . . . . . . . . 2-7, 3-28, 4-18, 9-3
EEc . . . . . . . . . . . . . . . . . . . . . . . 4-21Ec/Io . . . . . . . . . . . . . . . . . . . . . 4-22ESD . . . . . . . . . . . . . . . . . . . . . . 1-11Ethernet . . . 1-3, 2-7, 3-28, 4-18, 9-2EVM . . . . . . . . . . . . . . . . 4-21, 5-16export . . . . . . . . . . . . . . . . . . . . . 9-1external reference . . . . . . . . . . . 3-28
FFDMA . . . . . . . . . . . . . . . . 3-38, 5-1FHSS . . . . . . . . . . . . . . . . 3-21, 6-10field strength . . 3-18, 3-44, 6-7, 6-12file summary . . . . . . . . . . . . . . . . 9-4filter
band pass . . . . . . . . . . . . . . . . 1-4filtered . . . . . . . . . . . . . . . . . . . . 4-25firmware . . . . . . . . . . . . . . . . . . 9-19frequency . . . . . . . . . . . . . . . . . . 1-7
center . . . . . . . . . .2-12, 3-11, 6-3error . . . . . . . . . . . . . . . . . . . 5-15range . . . . . . . . . . .1-1, 3-10, 6-2reference . . . . . . . . . . . . . . . 2-10start . . . . . . . . . . . . . . . . . . . 2-11stop . . . . . . . . . . . . . . . . . . . 2-11
full screen . . . . . . . . . . . . . . . . . 3-32
Ggateway . . . . . . . . . . . . . . . . 2-7, 9-3GMSK . . . . . . . . . . . .3-38, 5-1, 5-16GPS . . . . . . . . . . . . . . . . . . . . . . . 9-1GSM . . . . . . . . . . . . . . . . . 3-38, 5-1
Hheadset . . . . . . . . . . . . . . . . . . . 2-10
Index -1
HSDPA . . . . . . . . . . . . . . . . . . . 4-1
Iimpedance . . . . . . . . . . . . . . . . 3-28integration bandwidth . . . .3-19, 6-8intermodulation product . . . . . . . 7-7IP address . . . . . 2-7, 3-28, 4-18, 9-2
Jjpeg . . . . . . . . . . . . 3-9, 4-7, 9-1, 9-9
LLAN . . . . . . . . . . . . . . . . . . .2-7, 9-2language . . . . . . . . . 3-28, 4-18, 9-11LCD . . . . . . . . . . . . . . . . . . . . . . 1-2limit . . . . . . . . . . . . . . . . . . . . . 3-12
alarm . . . . . . . . . . . . . . . . . 3-14lines . . . . . . . . . . . . . . . . . . . 9-6
Mmagnitude error . . . . . . . . . . . . 5-16maintenance . . . . . . . . . . . . . . . 1-11marker . . . . . 3-15, 4-36, 4-37, 6-14
noise . . . . . . . . . . . . . .3-16, 6-16table . . . . . . . . . . . . . .3-16, 6-16
markers . . . . . . . . . . . . . . . .6-14, 9-5mask . . . . . . . . . . . . . . . . . . . . . 4-30memory
internal . . . . . . . . . . . . . . . . . 9-4trace math . . . . . . . . . . . . . . . 9-7
mode . . . . . . . . . . . . . . . . . . . . . 3-22
Ooccupied bandwidth 3-19, 3-37, 5-15, 6-8OCXO . . . . . . . . . . . . . . . . . . . . 8-1option
system . . . . . . . . . . . .3-28, 4-18origin offset . . . . . . . . . . . . . . . 5-16oscillator . . . . . . . . . . . . . . .3-20, 6-9OTA . . . . . . . . . . . . . . . . . . . . . 4-39overlay . . . . . . . . . . . . . . . . . . . . 9-8OVSF . . . . . . . . . . . . . . . . . . . . 4-20
Ppaging . . . . . . . . . . . . . . . . . . . . 4-22
pass/fail . . . . . 4-13, 4-42, 5-14, 9-15P-CCPCH . . . . . . . . . . . . . . . . . 4-22PCDE . . . . . . . . . . . . . . . . . . . . 4-21phase error . . . . . . . . . . . . . . . . . 5-16PICH . . . . . . . . . . . . . . . . . . . . . 4-22pilot . . . . . . . . . . . . . . . . . . . . . . 4-22power . . . . . . . . . . . . . . . . . . . . . 2-7preamplifier . . . . . . . . .3-2, 3-35, 6-4preset . . . . . . . . . . . . . . . . 3-22, 4-14print . . . . . . . . . . . . . . . . . . . 3-9, 4-7P-SCH . . . . . . . . . . . . . . . . . . . . 4-20
RRBW . . . . . . . . . . . . . . . . 2-12, 3-34reference level . . . . . . . . . . . 3-2, 6-3resolution bandwidth 3-4, 3-33, 3-43, 6-5RMS . . . . . . . . . . . . . . . . 3-31, 4-21RSSI . . . . . . . . . . . . .6-1, 6-13, 6-20
Ssave . . . . . . . . . . . . . . . . . . . . . . 9-10
remote files . . . . . . . . . . . . . . 9-9scale . . . . . . . . . . . . . . . . . . . . . . 7-3S-CCPCH . . . . . . . . . . . . . . . . . 4-22scrambling code . . . . . . . 4-21, 4-23service centers . . . . . . . . . . . . . . 1-16setup
recall . . . . . . 3-8, 3-22, 4-6, 4-14save . . . . . . . . . . . . . . 3-22, 4-14
signal standard . . . . . .2-12, 6-2, 7-2signal strength . . . . . . . . . . 6-1, 6-12span . . . . . . . . . . . . . . . . . . 3-23, 6-2specifications
environmental . . . . . . . . . . . 1-10performance . . . . . . . . . . . . . 1-6
spectrogram . . . . . . . .6-1, 6-11, 6-17spreading factor . . . . . . . . . . . . . 4-21SSB . . . . . . . . . . . . . . . . . . . . . . 3-45S-SCH . . . . . . . . . . . . . . . . . . . . 4-20Start . . . . . . . . . . . . . . . . . . . . . . 2-11start frequency . . . . . . . . . . . . . . 2-11stop frequency . . . . . . . . . . . . . . 2-11subnet . . . . . . . . . . . . . . . . . 2-7, 9-3sweep . . . . . . 2-12, 3-24, 3-33, 4-11sync . . . . . . . . . . . . . . . . . . . . . . . 9-4
Index -2
systemoptions . . . . . . . . . . . . . . . . . 9-2requirements . . . . . . . . . . . . . 9-2
system options . . . . . . . . .3-28, 4-18
TTDMA . . . . . . . . . . . . . . . .3-38, 5-1test panel . . . . . . . . . . . . . . . . . . 2-7test set . . . . . . . . . . . . . . . . . . . 5-14threshold . . . . . . . . . . . . . .4-21, 4-25time cursor . . . . . . . . . . . . . . . . 6-11time span . . . . . . . . . . . . . . . . . 6-11trace math . . . . . . . . . . . . . . . . . . 9-7trace smoothing . . . . . . . . . . . . . 9-7trigger
external . . . . . . . 2-10, 2-13, 3-26manual . . . . . . . . . . . . . . . . 3-25position . . . . . . . . . . . .2-13, 3-26
TSC . . . . . . . . . . . . . . . . . . . . . 5-15TTL . . . . . . . . . . . . . . . . . . . . . 2-13
Uunfiltered . . . . . . . . . . . . . . . . . 4-25units . . . . . . . . . . . . . . . . . . . . . . 9-7
display . . . . . . . . . . . . . .3-2, 6-4linear . . . . . . . . . . . . . . . . . 2-11
USB . . . . . . . . . . . . . . 1-3, 2-10, 9-2UTC . . . . . . . . . . . . . . . . . . . . . . 8-1
VVBW . . . . . . . . . . . . . . . .2-12, 3-33video bandwidth . . . . . . . . . . . . 3-33volume 3-21, 3-29, 4-19, 6-9, 6-12, 6-19
WWCDMA . . . . . . . . . . . . . . . . . . 4-1
Zzoom . . . . . . . . . . . . . . . . . .4-33, 9-8
Index -3

NOTES
Index -4