unaudited results for the six months ended 30 …
TRANSCRIPT

Hong Kong Exchanges and Clearing Limited and The Stock Exchange of Hong Kong Limited take no responsibility for the contents of this document, make no representation as to its accuracy or completeness and expressly disclaim any liability whatsoever for any loss howsoever arising from or in reliance upon the whole or any part of the contents of this document.
UNAUDITED RESULTS FOR THE SIX MONTHS ENDED 30 JUNE 2021 HIGHLIGHTS
Post-IFRS 16 (1) Basis Six months ended 30 June 2021 2020 2021 2020 Change
HK$ million
HK$ million
HK$ per share
HK$ per share
Total Revenue (2) 212,386 189,942 Total EBITDA (2) 68,167 59,341 Total EBIT (2) 34,809 28,619 Reported earnings (3) 18,300 13,000 4.75 3.37 +41%
Interim dividend per share 0.800 0.614 +30%
Pre-IFRS 16 (1) Basis Six months ended 30 June 2021 2020
HK$ million
HK$ million
Total Revenue (2) 212,386 189,942
Total EBITDA (2) 55,590 46,946
Total EBIT (2) 32,773 26,677
Reported earnings (3) 18,443 13,168
(1) As Hong Kong Financial Reporting Standards are fully converged with International Financial Reporting Standards in the accounting forleases, for ease of reference, International Financial Reporting Standard 16 “Leases” (“IFRS 16”) and the precedent lease accounting standardInternational Accounting Standard 17 “Leases” (“IAS 17”) are referred to in this results announcement interchangeably with Hong KongFinancial Reporting Standard 16 “Leases” (“HKFRS 16”) and Hong Kong Accounting Standard 17 “Leases” (“HKAS 17”), respectively. TheGroup believes that the IAS 17 basis (“Pre-IFRS 16 basis”) metrics, which are not intended to be a substitute for, or superior to, the reportedmetrics on a IFRS 16 basis (“Post-IFRS 16 basis”), better reflect management’s view of the Group’s underlying operational performance. IAS17 basis metrics financial information is regularly reviewed by management and used for resource allocation, performance assessment andinternal decision-making. As a result, the Group has provided an alternative presentation of the Group’s EBITDA, EBIT and profit attributable to ordinary shareholders prepared under the Pre-IFRS 16 basis relating to the accounting for leases for the six months ended 30 June 2020 and2021. Unless otherwise specified, the discussion of the Group’s operating results in this results announcement is on a Pre-IFRS 16 basis asmentioned above.
(2) Total revenue, earnings before interest expenses and other finance costs, tax, depreciation and amortisation (“EBITDA”) and earnings beforeinterest expenses and other finance costs and tax (“EBIT”) include the Group’s proportionate share of associated companies and joint ventures’ respective items.
(3) Reported earnings represent profit attributable to shareholders. Reported earnings per share for the six months ended 30 June 2021 and 2020is calculated based on profit attributable to ordinary shareholders and CKHH’s weighted average number of shares outstanding during theperiods of 3,855,552,464 and 3,856,240,500 respectively.
CKHH 2021 Interim Results Chairman’s Statement
Page 1 of 104

CHAIRMAN’S STATEMENT Recovery momentum continues to build across major economies in the first half of 2021 from the growing vaccination coverage and gradual easing of movement restrictions, particularly in the European regions. Uncertainty remains however as pandemic threats continue with multiple waves of infection in different geographies, particularly in Asia and in countries where vaccination rates have lagged. The Group’s solid performance in the first half demonstrates the success of the core businesses in adapting to the continuously changing business environment. Overall, the Group’s operations experienced robust recoveries as compared to the same period last year. The Group reported EBITDA and EBIT growth of 18% and 23% respectively in reported currency compared to first half of last year, primarily reflecting solid recoveries in the Ports and Retail divisions, profit contribution from the Group’s energy business(1) after the merger with Cenovus Energy Inc. (“Cenovus Energy”) in January 2021, a turnaround performance from a significant loss position last year and favourable currency translation impact. In local currencies, the Group’s reported EBITDA and EBIT grew 10% and 15% respectively from the same period last year. Profit attributable to ordinary shareholders for the first half of 2021 of HK$18,443 million was an increase of 40% in reported currency when compared to the first half of 2020. On a Post-IFRS 16 basis, profit attributable to ordinary shareholders was HK$18,300 million. Reported earnings per share were HK$4.75 for the six months ended 30 June 2021, an increase of 41% from HK$3.37 for the same period last year. By the end of 30 June 2021, the Group has completed five out of the six European telecommunication tower asset disposal transactions to Cellnex Telecom and received an aggregate proceed of €6.3 billion, of which €4.1 billion was received during the first half of 2021. The only remaining tower asset transaction yet to complete is in the UK which is currently undergoing regulatory approval. During the first half of 2021, the completion of the tower asset sales in Italy and Sweden resulted in a net gain attributable to shareholders of HK$25.3 billion(2). This gain is partly offset by a non-cash impairment of goodwill on the Group’s Italian telecommunication business of approximately HK$15.5 billion, as well as the recognition of a non-cash foreign exchange reserve loss of approximately HK$3.5 billion following the merger of the Group’s energy business with Cenovus Energy. In the same period last year, the Group also recognised a one-off net earnings benefit of HK$ 5.5 billion, comprising the net dilution gain arising from the merger of the Australian Telecommunication businesses, partly offset by impairments and write downs of the energy business and certain non-strategic equity investments in 2020. Excluding these one-off impacts in both periods, the Group’s underlying profit attributable to ordinary shareholders has increased 58% in the first half of 2021 compared to the same period last year.
(1) Following the merger of the Group’s energy business with Cenovus Energy in January 2021, the Group owns 15.71% in Cenovus Energy.
The share of Cenovus Energy’s results in 2021 forms part of the Finance & Investments and Others segment and the energy business no longer constitutes a core business of the Group.
(2) Under Post-IFRS 16 basis, the net gain attributable to shareholders was HK$25.3 billion. For further information, please see Note 5(b)(xvi) to the Financial Statements of this Announcement.
CKHH 2021 Interim Results Chairman’s Statement
Page 2 of 104

With a significant portion of the sales proceeds from the European telecommunication tower asset transaction received, as at 30 June 2021, the Group’s net debt to net total capital ratio(3) was 19.9%, reflecting a 2.3%-point and a 5.2%-point improvement from 31 December 2020 and 30 June 2020 respectively. Dividend The Board of Directors declares an interim dividend of HK$0.800 per share (30 June 2020 – HK$0.614 per share), payable on Thursday, 16 September 2021, to shareholders whose names appear on the Register of Members of the Company at the close of business on Tuesday, 7 September 2021, being the record date for determining shareholders’ entitlement to the interim dividend.
(3) The consolidated net debt to net total capital ratio under Post-IFRS 16 basis, after including IFRS 16 impact in total equity, was 20.3%
(30 June 2020: 25.6%).
CKHH 2021 Interim Results Chairman’s Statement
Page 3 of 104

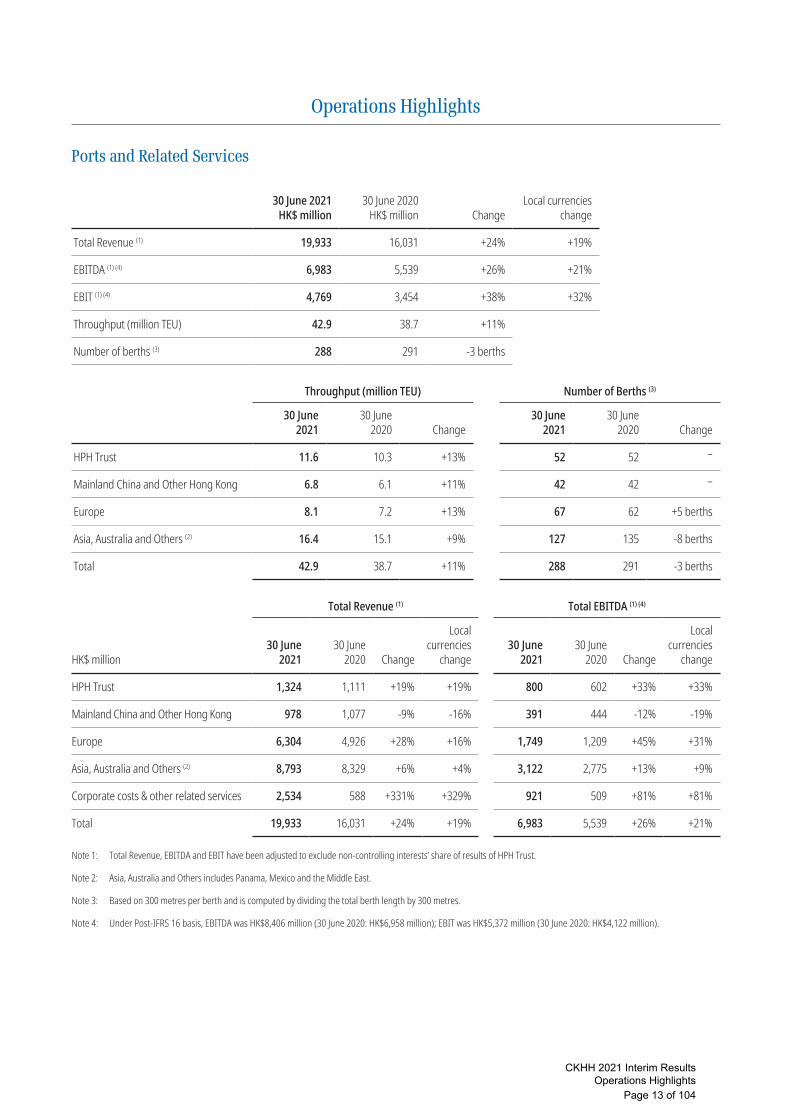
Ports and Related Services The Ports and Related Services division handled 42.9 million twenty-foot equivalent units (“TEU”) through 288 operating berths in the first half of 2021, a 11% growth compared to the same period last year. Higher volumes across all of the regions were primarily attributable to strong global consumer demands and gradual resumption of trade flows close to pre-pandemic levels, particularly in the Mainland where year-on-year growth momentum at Yantian port continues from the second half of last year. These improvements were partly offset by no contribution from the Dammam port in Saudi Arabia as the concession expired in September 2020. In reported currency, total revenue of HK$19,933 million, EBITDA(4) of HK$6,983 million and EBIT(4) of HK$4,769 million were 24%, 26% and 38% higher than same period last year respectively from the higher throughput as well as improved margins and continuous efforts in controlling costs. In local currencies, total revenue, EBITDA and EBIT increased 19%, 21% and 32% respectively. In March 2021, the UK government approved Freeport East as a Freeport which includes the division’s ports in Harwich and Felixstowe. Freeport East will be developed as a hub for global trade and green energy. As a Freeport, Harwich and Felixstowe will benefit from tax reliefs and simplified customs procedures measures, which are expected to boost economic and trade activity in the region. In June 2021, the division entered into a joint venture agreement with Shenzhen Yantian Port Group Company Limited to establish a 50/50 joint venture to construct, develop, operate and manage phase I of a container terminal with an approximate size of 120 hectares located in the eastern side of the Yantian International Container Terminals, Shenzhen with an approximately 1,470-metre quay length. The division will continue to exercise cost efficiency measures, focus on operational safety and cautiously look for expansion opportunities that will enhance its global footprint. The pandemic spotlighted the important role port operators play in maintaining and facilitating sustainable trade flows. The division will focus on the application and use of technological innovation and digitalisation of operational processes to maintain its market leadership and enhance profitability in a sustainable manner.
(4) Under Post-IFRS 16 basis, EBITDA was HK$8,406 million (30 June 2020: HK$6,958 million); EBIT was HK$5,372 million (30 June
2020: HK$4,122 million).
CKHH 2021 Interim Results Chairman’s Statement
Page 4 of 104

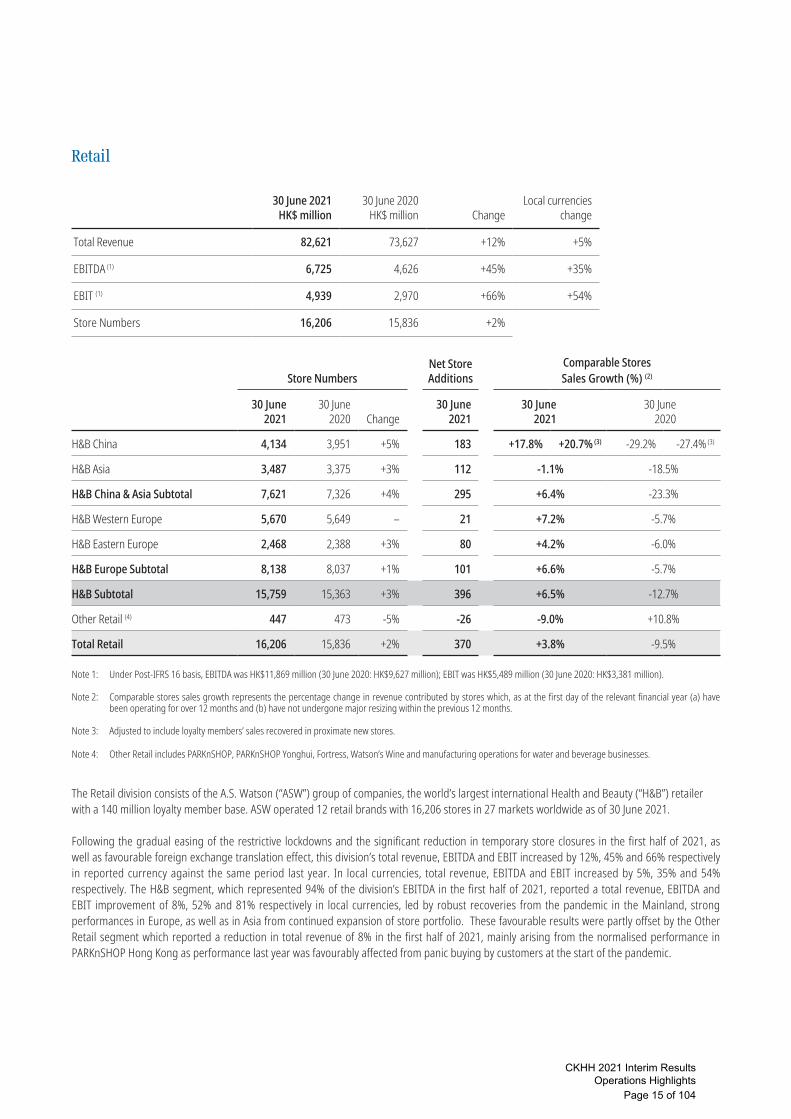
Retail The Retail division had 16,206 stores across 27 markets at the end of June 2021, a 2% increase compared to the same period last year. Customer engagement continues to be the key focus of the division with its loyalty member base continue to increase, reaching 140 million with 66% sales participation. Following the gradual easing of the restrictive lockdowns and the significant reduction in temporary store closures in the first half of this year, as well as favourable foreign exchange translation effect, this division’s total revenue, EBITDA(5) and EBIT(5) of HK$82,621 million, HK$6,725 million and HK$4,939 million increased by 12%, 45% and 66% respectively in reported currency against the same period last year. In local currencies, total revenue, EBITDA and EBIT increased by 5%, 35% and 54% respectively. For the Health and Beauty Segment(6) , total revenue, EBITDA and EBIT improved by 8%, 52% and 81% respectively in local currencies, reflecting the robust recoveries from the pandemic in major markets and from the successful strategic decision to drive further digital transformation in accelerating the integration of physical store portfolio and online channels. In the Mainland, with almost all stores remained open and a steady store traffic recovery in the first half of 2021, Health and Beauty China recorded a 53% growth in EBITDA in local currency as sales were recovered through its digital channels. Health and Beauty China also continued to expand its store portfolio, with a net increase of 183 stores compared to the same period last year. In Europe and the rest of Asia, footfall in a number of countries where the division operates was adversely impacted by lockdown measures imposed intermittently throughout the first half of 2021. The division’s major operations are in essential businesses which allowed stores to remain open during the lockdown periods. Health and Beauty operations in Europe delivered a very strong EBITDA growth of 66% in local currencies, primarily from the Benelux countries and Germany. Health and Beauty operations in Asia also recorded an EBITDA growth of 19% in local currencies, with Malaysia, Thailand and the Philippines as the key contributors amidst movement restrictions, demonstrating resilience of the businesses. The Retail division will continue with its strategic direction in accelerating its “Offline plus Online” platform strategy to provide seamless offline and online retail experiences, stronger customer connectivity and enhance growth and profitability on a sustainable basis. Whilst the market conditions and sentiments continue to be uncertain, health and beauty products remain essential daily consumables. Acknowledging changing customer trends in favour of more sustainable products and services, the division launched several product lines and platforms to help customers to easily identify sustainable product offerings. The division also continues to embark on its “2030 Sustainability Vision” journey which sets out its long-term goals to reduce greenhouse gas emissions by 40% by 2030 and to eliminate problematic or unnecessary packaging and incorporate 20% recycled plastic content in plastic packaging by 2025.
(5) Under Post-IFRS 16 basis, EBITDA was HK$11,869 million (30 June 2020: HK$9,627 million); EBIT was HK$5,489 million (30 June
2020: HK$3,381 million). (6) Includes Watsons, Kruidvat, Trekpleister, Rossmann, Savers, Superdrug, Drogas, ICI PARIS XL and The Perfume Shop.
CKHH 2021 Interim Results Chairman’s Statement
Page 5 of 104

Infrastructure The Infrastructure division comprises a 75.67%(7) interest in CK Infrastructure Holdings Limited (“CKI”), a subsidiary listed in Hong Kong as well as 10% of the economic benefits deriving from the Group’s direct holdings in six co-owned infrastructure investments with CKI. CKI CKI announced a net profit attributable to shareholders under Post-IFRS 16 basis of HK$3,011 million, 5% higher than the same period last year. The performance in the first half of 2021 was impacted by the deferred tax charges arising from the revision of the UK corporate tax rates. Excluding the one-off deferred tax impact for both periods, net profit increased 13% in the first half of 2021 compared to the same period last year. In 2021, a number of CKI’s regulated businesses in the UK and Australia have entered or are scheduled to enter new regulatory regimes. These are expected to result in lower revenues and allowable returns, reflecting the current low interest rate environment and the stringent stance taken by regulators. Nonetheless, the secure business models of CKI will continue to contribute solid revenue streams and returns. This division continues to partner with customers to deliver on net zero emissions ambitions. A particular area of leadership is in the transition to hydrogen where CKI is at the forefront of hydrogen development in gas networks in the UK and Australia.
(7) Based on the Group’s profit sharing ratio in CKI.
CKHH 2021 Interim Results Chairman’s Statement
Page 6 of 104

CK Hutchison Group Telecom Revenue, EBITDA( 8 ) and EBIT(8) of this division of HK$45,826 million (€4,901 million), HK$25,623 million (€2,645 million) and HK$15,996 million (€1,616 million) were 7%, 72% and 106% higher than the same period in 2020 respectively, primarily due to the recognition of HK$25,259 million disposal gain(9) on the tower assets in Italy and Sweden, partly offset by a non-cash impairment of goodwill on the Group’s Italian telecommunication business of HK$15,472 million. 3 Group Europe As at 30 June 2021, the active customer base of 3 Group Europe stands at 38.0 million, 2% lower against the same period last year mainly due to lower customer bases in both Italy and the UK, partly offset by net additions in other operations. Revenue, EBITDA(10) and EBIT(10) before one-time items mentioned above of HK$43,160 million, HK$14,772 million and HK$5,601 million were 4%, 8% and 34% lower against the same period last year respectively in local currencies. The results have been adversely impacted by the incremental tower service fees. On a normalised basis(11), EBITDA and EBIT were 5% and 31% lower year-on-year respectively in local currencies. The adverse EBITDA and EBIT reflected a 5% lower total margin mainly driven by lower customer base in Italy due to intense market competition, partly offset by disciplined spending on customer acquisition cost and operating expenses. EBIT of 3 Group Europe was further impacted by the increase in depreciation and amortisation from a higher asset base from its significant investments in IT and 5G rollouts. 3 Group Europe has continued to enhance its network capabilities which includes focusing on innovation in machine learning and AI to enable network optimisation, as well as sourcing energy efficient equipment to enhance profitability. With the performances of the operations in Italy and the UK both stabilising from various initiatives to improve margins and controlling costs as well as the gradual reopening of most European regions, 3 Group Europe will also continue its focus on capturing emerging opportunities by accelerating the rollout of 5G services in order to support meaningful recoveries in the second half of 2021. Hutchison Telecommunications Hong Kong HTHKH, our Hong Kong listed telecommunications subsidiary operating in Hong Kong and Macau, announced Post-IFRS 16 profit attributable to shareholders of HK$31 million and earnings per share of 0.64 HK cents. As of 30 June 2021, HTHKH had approximately 3.2 million active mobile customers in Hong Kong and Macau.
(8) Under Post-IFRS 16 basis, EBITDA was HK$29,830 million (30 June 2020: HK$18,665 million); EBIT was HK$16,485 million (30 June
2020: HK$7,946 million). (9) Under Post-IFRS 16 basis, the net gain attributable to shareholders was HK$25,316 million. For further information, please see Note
5(b)(xvi) to the Financial Statements of this Announcement. (10) Under Post-IFRS 16 basis, EBITDA was HK$18,714 million (30 June 2020: HK$17,974 million); EBIT was HK$6,027 million (30 June
2020: HK$7,887 million). (11) Comparison against first half 2020 results which excludes the proforma contribution from the tower assets in Sweden, Denmark, Austria
and Ireland.
CKHH 2021 Interim Results Chairman’s Statement
Page 7 of 104

Hutchison Asia Telecommunications Hutchison Asia Telecommunications (“HAT”) includes the Group’s telecommunication businesses in Indonesia, Vietnam and Sri Lanka. These countries are currently experiencing a devastating virus wave spread from the new variant with very low vaccination coverage. As of 30 June 2021, HAT had approximately 60.4 million active customer accounts, 24% higher than same period last year, primarily driven by its Indonesia operation which representing 73% of the total active customer base. Despite reporting customer base growth, total revenue and EBITDA(12) of HK$4,350 million and HK$803 million decreased 4% and 8% respectively when compared to same period last year, primarily driven by the Indonesia operation which faced aggressive pricing from other incumbents, as well as an unprecedented severity in the recent waves of the pandemic. HAT reported LBIT(12) of HK$76 million for the first half of 2021, compared to EBIT of HK$194 million in the same period last year, reflecting higher depreciation and amortisation from an enlarged asset base as a result of continuing network rollout and enhancements. In local currencies, Revenue, EBITDA and EBIT were 5%, 9% and 143% below same period last year respectively. Finance & Investments and Others The Group’s liquidity and financial profile remain strong. Consolidated cash and liquid investments totalled HK$190,416 million and consolidated total bank and other debts( 13 ) amounted to HK$354,701 million, resulting in consolidated net debt(13) of HK$164,285 million (30 June 2020 – HK$205,875 million) and net debt to net total capital ratio(13) of 19.9% (30 June 2020 – 25.1%). Following the gradual completion of the tower sales, the Group has deployed part of the tower sales proceeds amounting to approximately HK$460 million in on-market share repurchases in the first half of 2021 to reflect the underlying value of the Group. As the tower sales in Italy has also completed on 30 June 2021, the Group will continue assessing the various alternatives, including the continuation of the share repurchase plan in the second half and new investment opportunities, in order to maximise long term sustainable shareholder values.
(12) Under Post-IFRS 16 basis, EBITDA was HK$1,869 million (30 June 2020: HK$2,065 million); EBIT was HK$272 million (30 June 2020:
HK$708 million). (13) Total bank and other debts are defined, for the purpose of “Net debt” calculation, as the total principal amount of bank and other debts and
unamortised fair value adjustments arising from acquisitions. Net debt is defined as total bank and other debts less total cash, liquid funds and other listed investments. Net total capital is defined as total bank and other debts plus total equity (adjusted to exclude IFRS 16 effects) and loans from non-controlling shareholders net of total cash, liquid funds and other listed investments. The consolidated net debt to net total capital ratio under IFRS 16 basis, after including IFRS 16 impact in total equity, was 20.3% (30 June 2020: 25.6%).
CKHH 2021 Interim Results Chairman’s Statement
Page 8 of 104

Sustainability The Group’s core businesses have made significant progress in sustainability as demonstrated in the latest Sustainability Report released in June 2021 which stipulates the Group’s key strategic development to meaningfully drive Group-wide material sustainability impacts. The Group’s sustainability framework has been enhanced from last year and focuses on four pillars relating to Environmental, Social, Governance and Sustainable business model innovation, of which nine goals will form the foundational approach of the Group sustainability strategy. Four goals have been identified as priority focus areas for 2021 to 2022, which includes taking action to combat climate change, investing and adopting sustainable business models, creating amicable work places as well as protecting employees and supporting communities and other stakeholders through the pandemic. By signing up to the United Nations (“UN”) Global Compact, the Group is committed to making those principles part of its strategic decision making process and to advance the achievement of the UN Sustainable Development Goals. The Group will continue to disclose progress and milestone achievements of these goals by core businesses from an operational perspective, as well as continuing to make key capital allocation investment decisions which address climate change. The Group has made encouraging progress in carbon reduction target setting and investment and operating decisions are evolving to take into account the pathways towards a net zero future. Through making renewable energy and decarbonisation investments, such as the recent agreement entered into by Canadian Power Holdings Inc, a subsidiary of CKI, to acquire wind power facilities in Canada, Yantian port commencing trials on the use of hydrogen fuel cell terminal tractors, as well as the ongoing rollout of 5G and smart solutions by 3 Group Europe operations to enable vast emissions reductions, all of these business decisions and efforts will contribute to climate protection and a sustainable future.
CKHH 2021 Interim Results Chairman’s Statement
Page 9 of 104

Outlook
Global recovery from the pandemic is becoming steadier as global economic growth gathers strength supported by strong macro indicators, good progress in the reopening of major economies, as well as accommodative monetary and fiscal policies. However, the efficacy of the vaccines against new virus mutations, the new wave of infection particularly across developing countries with low vaccination rates, the effectiveness of policy support to facilitate the transition back to normalcy and the associated inflationary risks and supply constraints from subdued mobility caused by the pandemic, continue to pose risks and uncertainties ahead.
Since the start of the pandemic, the Group has maintained its resilience and agility in responding to the evolving market dynamics. From the successful execution of corporate transactions at opportune market junctures to the swift adaptation of operational strategies to changing business environment, such as digitalisation in both the Ports and Telecommunications divisions and the “Offline plus Online” platform strategy of the Retail division, the Group has maintained a steady course through the recovery. Together with a well-disciplined and prudent financial, liquidity and cash flow management, and increased emphasis across all core businesses on sustainability, barring any unforeseen circumstances, the Group should be able to continue on its current growth trajectory and expects to deliver a solid performance for the full year in 2021.
I would like to thank the Board of Directors and all our dedicated employees around the world for their continued loyalty, diligence, professionalism and contributions to the Group.
Victor T K Li Chairman Hong Kong, 5 August 2021
CKHH 2021 Interim Results Chairman’s Statement
Page 10 of 104

2
CK Hutchison Holdings Limited
2021 Interim Report
Financial Performance Summary
Pre-IFRS 16 (1)
Unaudited Results for the six monthsended 30 June 2021
HK$ million
Pre-IFRS 16 (1)(2)
Unaudited Resultsfor the six months
ended 30 June 2020HK$ million
Change%
Local currencieschange
%
Revenue (3)
Ports and Related Services (3) 19,933 16,031 24% 19%Retail 82,621 73,627 12% 5%Infrastructure 27,798 25,181 10% – CK Hutchison Group Telecom 45,826 42,702 7% -2%Hutchison Asia Telecommunications 4,350 4,521 -4% -5%Finance & Investments and Others 31,858 27,880 14% 10%
Total Revenue 212,386 189,942 12% 4%EBITDA (3)
Ports and Related Services (3) 6,983 5,539 26% 21%Retail 6,725 4,626 45% 35%Infrastructure 14,803 13,768 8% -4%CK Hutchison Group Telecom 25,623 14,921 72% 62%Hutchison Asia Telecommunications 803 872 -8% -9%Finance & Investments and Others 653 7,220 -91% -93%
Total EBITDA 55,590 46,946 18% 10%EBIT (3)
Ports and Related Services (3) 4,769 3,454 38% 32%Retail 4,939 2,970 66% 54%Infrastructure 9,686 8,989 8% -4%CK Hutchison Group Telecom 15,996 7,777 106% 99%Hutchison Asia Telecommunications (76) 194 -139% -143%Finance & Investments and Others (2,541) 3,293 -177% -177%
Total EBIT 32,773 26,677 23% 15%Interest Expenses and other finance Costs (3) (7,197) (7,434) 3%Profit Before Tax 25,576 19,243 33%Tax (3)
Current tax (3,637) (2,675) -36%Deferred tax (450) 326 -238%
(4,087) (2,349) -74%Profit after tax 21,489 16,894 27%Non-controlling interests and perpetual capital securities holders’
interests (3,046) (3,726) 18%PROFIT ATTRIBUTABLE TO ORDINARY SHAREHOLDERS (“NPAT”) 18,443 13,168 40% 32%
Note 1: As Hong Kong Financial Reporting Standards are fully converged with International Financial Reporting Standards in the accounting for leases, for ease of reference, International Financial Reporting Standard 16 “Leases” (“IFRS 16”) and the precedent lease accounting standard International Accounting Standard 17 “Leases” (“IAS 17”) are referred to in this results announcement interchangeably with Hong Kong Financial Reporting Standard 16 “Leases” (“HKFRS 16”) and Hong Kong Accounting Standard 17 “Leases” (“HKAS 17”), respectively. The Group believes that the IAS 17 basis (“Pre-IFRS 16 basis”) metrics, which are not intended to be a substitute for, or superior to, the reported metrics on a IFRS 16 basis (“Post-IFRS 16 basis”), better reflect management’s view of the Group’s underlying operational performance. IAS 17 basis metrics financial information is regularly reviewed by management and used for resource allocation, performance assessment and internal decision-making. As a result, the Group has provided an alternative presentation of the Group’s EBITDA, EBIT, interest expenses and other finance costs, tax, non-controlling interests and perpetual capital securities holders’ interests and profit attributable to ordinary shareholders prepared under the Pre-IFRS 16 basis relating to the accounting for leases for the six months ended 30 June 2020 and 2021. Unless otherwise specified, the discussion of the Group’s operating results in this results announcement is on a Pre-IFRS 16 basis as mentioned above.
Note 2: The six months ended 30 June 2020 comparative has been reclassified to enable a better comparison of performance. Subsequent to merger completion between Cenovus Energy and Husky in January 2021, the Group’s 15.71% share of Cenovus Energy is reported under Finance & Investments and Others segment. The Group’s 40.19% sharing of Husky’s results included in the Energy division for the six months ended 30 June 2020 have been reclassified to the Finance & Investments and Others segment to conform with the six months ended 30 June 2021 presentation.
Note 3: Total revenue, EBITDA, EBIT, interest expenses and other finance costs and tax include the Group’s proportionate share of associated companies and joint ventures’ respective items. Total revenue, EBITDA and EBIT were adjusted to exclude non-controlling interests’ share of results of HPH Trust.
CKHH 2021 Interim Results Financial Performance Summary
Page 11 of 104

3
CK Hutchison Holdings Limited
2021 Interim Report
Financial Performance Summary
Post-IFRS 16 (1)
Unaudited Results for the six monthsended 30 June 2021
HK$ million
Post-IFRS 16 (1)(2)
Unaudited Resultsfor the six months
ended 30 June 2020HK$ million
Change%
Revenue (3)
Ports and Related Services (3) 19,933 16,031 24%Retail 82,621 73,627 12%Infrastructure 27,798 25,181 10%CK Hutchison Group Telecom 45,826 42,702 7%Hutchison Asia Telecommunications 4,350 4,521 -4%Finance & Investments and Others 31,858 27,880 14%
Total Revenue 212,386 189,942 12%EBITDA (3)
Ports and Related Services (3) 8,406 6,958 21%Retail 11,869 9,627 23%Infrastructure 14,954 13,911 7%CK Hutchison Group Telecom 29,830 18,665 60%Hutchison Asia Telecommunications 1,869 2,065 -9%Finance & Investments and Others 1,239 8,115 -85%
Total EBITDA 68,167 59,341 15%EBIT (3)
Ports and Related Services (3) 5,372 4,122 30%Retail 5,489 3,381 62%Infrastructure 9,709 9,010 8%CK Hutchison Group Telecom 16,485 7,946 107%Hutchison Asia Telecommunications 272 708 -62%Finance & Investments and Others (2,518) 3,452 -173%
Total EBIT 34,809 28,619 22%Interest Expenses and other finance Costs (3) (9,390) (9,625) 2%Profit Before Tax 25,419 18,994 34%Tax (3)
Current tax (3,646) (2,657) -37%Deferred tax (440) 352 -225%
(4,086) (2,305) -77%Profit after tax 21,333 16,689 28%Non-controlling interests and perpetual capital
securities holders’ interests (3,033) (3,689) 18%PROFIT ATTRIBUTABLE TO ORDINARY SHAREHOLDERS (“NPAT”) 18,300 13,000 41%
Note 1: As Hong Kong Financial Reporting Standards are fully converged with International Financial Reporting Standards in the accounting for leases, for ease of reference, International Financial Reporting Standard 16 “Leases” (“IFRS 16”) and the precedent lease accounting standard International Accounting Standard 17 “Leases” (“IAS 17”) are referred to in this results announcement interchangeably with Hong Kong Financial Reporting Standard 16 “Leases” (“HKFRS 16”) and Hong Kong Accounting Standard 17 “Leases” (“HKAS 17”), respectively.
Note 2: The six months ended 30 June 2020 comparative has been reclassified to enable a better comparison of performance. Subsequent to merger completion between Cenovus Energy and Husky in January 2021, the Group’s 15.71% share of Cenovus Energy is reported under Finance & Investments and Others segment. The Group’s 40.19% sharing of Husky’s results included in the Energy division for the six months ended 30 June 2020 have been reclassified to the Finance & Investments and Others segment to conform with the six months ended 30 June 2021 presentation.
Note 3: Total revenue, EBITDA, EBIT, interest expenses and other finance costs and tax include the Group’s proportionate share of associated companies and joint ventures’ respective items. Total revenue, EBITDA and EBIT were adjusted to exclude non-controlling interests’ share of results of HPH Trust.
CKHH 2021 Interim Results Financial Performance Summary
Page 12 of 104
CK Hutchison Holdings Limited
2015 Interim Report
10
CK Hutchison Holdings Limited
2021 Interim Report
Operations Highlights
Ports and Related Services
30 June 2021HK$ million
30 June 2020HK$ million Change
Local currencieschange
Total Revenue (1) 19,933 16,031 +24% +19%
EBITDA (1) (4) 6,983 5,539 +26% +21%
EBIT (1) (4) 4,769 3,454 +38% +32%
Throughput (million TEU) 42.9 38.7 +11%
Number of berths (3) 288 291 -3 berths
Throughput (million TEU) Number of Berths (3)
30 June2021
30 June2020 Change
30 June 2021
30 June 2020 Change
HPH Trust 11.6 10.3 +13% 52 52 –
Mainland China and Other Hong Kong 6.8 6.1 +11% 42 42 –
Europe 8.1 7.2 +13% 67 62 +5 berths
Asia, Australia and Others (2) 16.4 15.1 +9% 127 135 -8 berths
Total 42.9 38.7 +11% 288 291 -3 berths
Total Revenue (1) Total EBITDA (1) (4)
HK$ million30 June
202130 June
2020 Change
Localcurrencies
change30 June
202130 June
2020 Change
Localcurrencies
change
HPH Trust 1,324 1,111 +19% +19% 800 602 +33% +33%
Mainland China and Other Hong Kong 978 1,077 -9% -16% 391 444 -12% -19%
Europe 6,304 4,926 +28% +16% 1,749 1,209 +45% +31%
Asia, Australia and Others (2) 8,793 8,329 +6% +4% 3,122 2,775 +13% +9%
Corporate costs & other related services 2,534 588 +331% +329% 921 509 +81% +81%
Total 19,933 16,031 +24% +19% 6,983 5,539 +26% +21%
Note 1: Total Revenue, EBITDA and EBIT have been adjusted to exclude non-controlling interests’ share of results of HPH Trust.
Note 2: Asia, Australia and Others includes Panama, Mexico and the Middle East.
Note 3: Based on 300 metres per berth and is computed by dividing the total berth length by 300 metres.
Note 4: Under Post-IFRS 16 basis, EBITDA was HK$8,406 million (30 June 2020: HK$6,958 million); EBIT was HK$5,372 million (30 June 2020: HK$4,122 million).
CKHH 2021 Interim Results Operations Highlights
Page 13 of 104

CK Hutchison Holdings Limited
2015 Interim Report
11
CK Hutchison Holdings Limited
2021 Interim Report
Throughput increased by 11% to 42.9 million TEU in the first half of 2021, with 62% and 38% local and transhipment volume respectively (1H 2020: 63% and 37% local and transhipment volume respectively).
Throughput increased across majority of the portfolio was primarily attributable to strong consumer demands and gradual recovery of trade flows across all regions since the second half of last year. Improvements were particularly strong in Yantian, BEST Barcelona, Klang in Malaysia, as well as ports in the Americas. The favourable operating performance is partly offset by no contribution from Dammam port as a result of concession expiry at the end of September 2020 and lower contribution from Shanghai Mingdong Container Terminals due to partial disposal of 20% interest in 2020. Correspondingly, total revenue in the first half of 2021 was 24% and 19% above the same period last year in reported currency and local currencies respectively. EBITDA and EBIT increased 26% and 38% respectively in reported currency against the same period last year. In local currencies, EBITDA and EBIT increased 21% and 32% respectively, mainly due to higher volume as mentioned above, improved margins, continued efforts in controlling costs across all the regions, as well as strong performance of an associated company in the container shipping business due to the accelerated pricing levels.
CKHH 2021 Interim Results Operations Highlights
Page 14 of 104
CK Hutchison Holdings Limited2015 Interim Report
12
CK Hutchison Holdings Limited
2021 Interim Report
Retail
30 June 2021HK$ million
30 June 2020HK$ million Change
Local currencieschange
Total Revenue 82,621 73,627 +12% +5%
EBITDA (1) 6,725 4,626 +45% +35%
EBIT (1) 4,939 2,970 +66% +54%
Store Numbers 16,206 15,836 +2%
Store NumbersNet StoreAdditions
Comparable StoresSales Growth (%) (2)
30 June2021
30 June2020 Change
30 June2021
30 June2021
30 June2020
H&B China 4,134 3,951 +5% 183 +17.8% +20.7% (3) -29.2% -27.4% (3)
H&B Asia 3,487 3,375 +3% 112 -1.1% -18.5%
H&B China & Asia Subtotal 7,621 7,326 +4% 295 +6.4% -23.3%
H&B Western Europe 5,670 5,649 – 21 +7.2% -5.7%
H&B Eastern Europe 2,468 2,388 +3% 80 +4.2% -6.0%
H&B Europe Subtotal 8,138 8,037 +1% 101 +6.6% -5.7%
H&B Subtotal 15,759 15,363 +3% 396 +6.5% -12.7%
Other Retail (4) 447 473 -5% -26 -9.0% +10.8%
Total Retail 16,206 15,836 +2% 370 +3.8% -9.5%
Note 1: Under Post-IFRS 16 basis, EBITDA was HK$11,869 million (30 June 2020: HK$9,627 million); EBIT was HK$5,489 million (30 June 2020: HK$3,381 million).
Note 2: Comparable stores sales growth represents the percentage change in revenue contributed by stores which, as at the first day of the relevant financial year (a) have been operating for over 12 months and (b) have not undergone major resizing within the previous 12 months.
Note 3: Adjusted to include loyalty members’ sales recovered in proximate new stores.
Note 4: Other Retail includes PARKnSHOP, PARKnSHOP Yonghui, Fortress, Watson’s Wine and manufacturing operations for water and beverage businesses.
The Retail division consists of the A.S. Watson (“ASW”) group of companies, the world’s largest international Health and Beauty (“H&B”) retailerwith a 140 million loyalty member base. ASW operated 12 retail brands with 16,206 stores in 27 markets worldwide as of 30 June 2021.
Following the gradual easing of the restrictive lockdowns and the significant reduction in temporary store closures in the first half of 2021, as well as favourable foreign exchange translation effect, this division’s total revenue, EBITDA and EBIT increased by 12%, 45% and 66% respectively in reported currency against the same period last year. In local currencies, total revenue, EBITDA and EBIT increased by 5%, 35% and 54% respectively. The H&B segment, which represented 94% of the division’s EBITDA in the first half of 2021, reported a total revenue, EBITDA and EBIT improvement of 8%, 52% and 81% respectively in local currencies, led by robust recoveries from the pandemic in the Mainland, strong performances in Europe, as well as in Asia from continued expansion of store portfolio. These favourable results were partly offset by the Other Retail segment which reported a reduction in total revenue of 8% in the first half of 2021, mainly arising from the normalised performance in PARKnSHOP Hong Kong as performance last year was favourably affected from panic buying by customers at the start of the pandemic.
CKHH 2021 Interim Results Operations Highlights
Page 15 of 104

CK Hutchison Holdings Limited2015 Interim Report
13
CK Hutchison Holdings Limited
2021 Interim Report
Total Revenue Total EBITDA (1)
HK$ million30 June
2021 %30 June
2020 % Change
Localcurrencies
change30 June
2021 %EBITDAMargin
30 June2020 %
EBITDAMargin Change
Localcurrencies
change
H&B China 11,599 14% 8,805 12% +32% +21% 1,546 23% 13% 927 20% 11% +67% +53%
H&B Asia 13,499 16% 12,906 18% +5% +2% 1,137 17% 8% 917 20% 7% +24% +19%
H&B China & Asia Subtotal 25,098 30% 21,711 30% +16% +10% 2,683 40% 11% 1,844 40% 8% +45% +36%
H&B Western Europe 35,332 43% 29,838 40% +18% +7% 2,551 38% 7% 1,274 28% 4% +100% +82%
H&B Eastern Europe 8,466 10% 7,299 10% +16% +9% 1,057 16% 12% 711 15% 10% +49% +39%
H&B Europe Subtotal 43,798 53% 37,137 50% +18% +8% 3,608 54% 8% 1,985 43% 5% +82% +66%
H&B Subtotal 68,896 83% 58,848 80% +17% +8% 6,291 94% 9% 3,829 83% 7% +64% +52%
Other Retail (4) 13,725 17% 14,779 20% -7% -8% 434 6% 3% 797 17% 5% -46% -45%
Total Retail 82,621 100% 73,627 100% +12% +5% 6,725 100% 8% 4,626 100% 6% +45% +35%
H&B loyalty members’ participation & exclusives sales contribution 30 June 2021 30 June 2020
Total loyalty members in H&B segment (million) 139 136
Loyalty members’ sales participation in H&B segment (%) 64% 63%
Exclusives sales contribution to total H&B sales (%) 36% 34%
Comparable stores sales growth for the H&B segment of 6.5% in the first half of 2021 was mainly contributed by the encouraging improvement in H&B China, which reported a notable 17.8% comparable stores sales growth. Taking into account of the loyalty members’ sales recovered in proximate new stores, the comparable stores sales growth was 20.7%. H&B operations in Europe also recorded a robust comparable stores sales growth of 6.6%, primarily from the Benelux countries and Germany, with stores remained open during the lockdown periods. Despite a 1.1% comparable stores sales decline as a result of tightened restrictive measures with rising number of infected cases in the region, H&B Asia delivered an EBITDA growth of 19% in local currencies from continued store portfolio expansion and enhanced operational efficiencies.
The H&B segment opened 310 new stores during the first half of 2021 with the store numbers increased to 15,759 stores as of 30 June 2021. The quality of new store opening remains high with an average new store cash payback period within 12 months.
CKHH 2021 Interim Results Operations Highlights
Page 16 of 104

CK Hutchison Holdings Limited
2015 Interim Report
14
CK Hutchison Holdings Limited
2021 Interim Report
Infrastructure
30 June 2021HK$ million
30 June 2020HK$ million Change
Local currencieschange
Total Revenue (1) 27,798 25,181 +10% –
EBITDA (1) (2) 14,803 13,768 +8% -4%
EBIT (1) (2) 9,686 8,989 +8% -4%
CKI Reported Net Profit (under Post-IFRS 16 basis) 3,011 2,860 +5%
Note 1: Total revenue, EBITDA and EBIT include the Group’s share of results on the remaining 10% direct interest in the co-owned infrastructure assets with CKI after the divestment of 90% of the direct economic benefits in October 2018.
Note 2: Under Post-IFRS 16 basis, EBITDA was HK$14,954 million (30 June 2020: HK$13,911 million); EBIT was HK$9,709 million (30 June 2020: HK$9,010 million).
The infrastructure division comprises the Group’s 75.67% (3) interest in CK Infrastructure Holdings Limited (“CKI”) and the Group’s 10% economic benefits deriving from the Group’s direct holdings in six co-owned infrastructure assets.
CKI
CKI is the largest publicly listed infrastructure company on the SEHK, with diversified investments in energy, transportation and water infrastructure, waste management, waste-to-energy, household infrastructure and infrastructure-related businesses. CKI operates in Hong Kong, the Mainland, the UK, Continental Europe, Australia, New Zealand, Canada and the United States. CKI announced profit attributable to shareholders under Post-IFRS 16 basis of HK$3,011 million in the first half of 2021, 5% higher against the same period last year. Both the first half in 2021 and 2020 included deferred tax charges from the revision of the UK corporate tax rates. Excluding the one-off deferred tax impact for both periods, net profit increased 13% in the first half of 2021 compared to the same period last year.
CKI has always been committed to prudent financial management and the risk management approach is conservative with the underlying financial position closely monitored. CKI’s financial strength continues to be solid, with HK$8.1 billion cash on hand and a net debt to net total capital ratio of 19% as at 30 June 2021. Credit rating from Standard & Poor’s maintained at “A/ Stable”. CKI has redeemed US$1.2 billion perpetual capital securities in March 2021 with subsequent issuance of US$300 million securities in each of June and July 2021, which is expected to generate meaningful savings in distributions to securities holders going forward.
Note 3: In January 2015, CKI completed a share placement and share subscription transaction that resulted in the Group’s interest in CKI reducing from 78.16% to 75.67%. On 1 March 2016, CKI issued new shares in connection with an issue of perpetual capital securities. Subsequent to this transaction, the Group holds a 71.93% interest. As these new shares are disregarded for the purpose of determining the number of shares held by the public, the Group’s profit sharing in CKI continues to be 75.67%.
CKHH 2021 Interim Results Operations Highlights
Page 17 of 104

CK Hutchison Holdings Limited
2015 Interim Report
15
CK Hutchison Holdings Limited
2021 Interim Report
CK Hutchison Group Telecom
In million30 June 2021
HK$30 June 2020
HK$ ChangeLocal currencies
change30 June 2021
EURO30 June 2020
EUROTotal Revenue 45,826 42,702 +7% -2% 4,901 5,021Total Margin 32,012 30,494 +5% -5% 3,424 3,586
Total CACs (8,118) (7,326) -11% (869) (860)Less: Handset revenue 6,218 5,509 +13% 665 646
Total CACs (net of handset revenue) (1,900) (1,817) -5% (204) (214)Operating Expenses (14,276) (13,756) -4% (1,526) (1,619)Gain on disposal of tower assets 25,259 – +100% 2,620 –Impairment of goodwill (15,472) – -100% (1,669) –EBITDA (1) 25,623 14,921 +72% +62% 2,645 1,753Depreciation & Amortisation (9,627) (7,144) -35% (1,029) (840)EBIT (1) 15,996 7,777 +106% +99% 1,616 913
33 Group Europe (2)
In million30 June 2021
HK$30 June 2020 (3)
HK$ ChangeLocal currencies
changeTotal Revenue 43,160 40,524 +7% -4%Total Margin 30,512 28,899 +6% -5%
Total CACs (7,866) (7,068) -11%Less: Handset revenue 6,052 5,360 +13%
Total CACs (net of handset revenue) (1,814) (1,708) -6%Operating Expenses (13,926) (13,179) -6%
Opex as a % of total margin 46% 46%EBITDA 14,772 14,012 +5% -5%
EBITDA Margin % (4) 40% 40%Depreciation & Amortisation (9,171) (6,664) -38%EBIT 5,601 7,348 -24% -31%
EBITDA per above 14,772 14,012 +5% -5%Proforma contribution from tower assets – 437Reported EBITDA (5) 14,772 14,449 +2% -8%EBIT per above 5,601 7,348 -24% -31%Proforma contribution from tower assets – 374Reported EBIT (5) 5,601 7,722 -27% -34%
Note 1: Under Post-IFRS 16 basis, EBITDA was HK$29,830 million; EBIT was HK$16,485 million. Note 2: 3 Group Europe results above is before one-off items in 1H 2021, which represented gain on disposal of tower assets completed in 1H 2021 of HK$25.3 billion and
non-cash impairment of goodwill of the Group’s Italian telecommunication business of HK$15.5 billion (1H 2020: nil).Note 3: As the disposals of tower assets in Denmark, Austria and Ireland were completed in December 2020 and in Sweden was completed in January 2021, comparison was
made against normalised 1H 2020 results which exclude the proforma contribution from tower assets of these operations for comparability purpose. The % changes in EBITDA and EBIT are compared against the normalised 1H 2020 numbers.
Note 4: EBITDA margin % represents EBITDA as a percentage of total revenue (excluding handset revenue).Note 5: Under Post-IFRS 16 basis, EBITDA was HK$18,714 million; EBIT was HK$6,027 million.
3 Group Europe’s total revenue and margin of HK$43,160 million and HK$30,512 million were 4% and 5% lower against the same period last year respectively in local currencies, primarily reflecting lower customer base in Italy due to intense market competition. Encouragingly, the trend has relatively stabilised since Wind Tre launched second brand Very Mobile in mid-2020 to compete in the prepaid segment. Active customer base as at 30 June 2021 of 38.0 million is 2% lower against the same period last year, mainly due to lower customer bases in both Italy and in the UK, partly offset by net additions in other operations. Management continues to focus on managing churn and the average monthly customer churn rate of the contract customer base maintained at 1.2% for the half year, flat against first half of 2020.
3 Group Europe’s net ARPU and net AMPU of €13.00 and €11.35 respectively are both stable as compared to first half of 2020. Total data usage increased 30% to approximately 3,331 petabytes in first half of 2021. Data usage per active customer was approximately 92.0 gigabytes per user in first half of 2021 compared to 68.6 gigabytes per user in first half of 2020.
3 Group Europe’s results have been adversely impacted by the incremental tower service fees. On a normalised basis, EBITDA and EBIT were 5% and 31% lower year-on-year respectively in local currencies, mainly driven by lower total margin, partly offset by disciplined spending on customer acquisition cost and operating expenses. EBIT was further impacted by the increase in depreciation and amortisation from a higher asset base from its significant investments in IT and 5G rollouts. CKHH 2021 Interim Results
Operations HighlightsPage 18 of 104

CK Hutchison Holdings Limited
2015 Interim Report
16
CK Hutchison Holdings Limited
2015 Interim Report
17
CK Hutchison Holdings Limited
2021 Interim Report
CK Hutchison Holdings Limited
2021 Interim Report
In millionUK
GBPItaly (6)
EUROSweden (7)
SEKDenmark (7)
DKKAustria (7)
EUROIreland (7)
EURO
33 Group Europebefore one-off (7) (8)
HK$HTHKH
HK$
Corporate and Othersand one-off (8)
HK$CKHGT
HK$CKHGTEURO
1H 2021 1H 2020 1H 2021 1H 2020 1H 2021 1H 2020 1H 2021 1H 2020 1H 2021 1H 2020 1H 2021 1H 2020 1H 2021 1H 2020 1H 2021 1H 2020 1H 2021 1H 2020 1H 2021 1H 2020 1H 2021 1H 2020Normalised Tower Assets Reported
Total Revenue 1,176 1,116 2,085 2,324 3,259 3,249 1,102 1,127 425 417 279 294 43,160 40,524 – 40,524 2,565 1,982 101 196 45,826 42,702 4,901 5,021% change +5% -10% – -2% +2% -5% +7% +29% -48% +7% -2%
Local currencies change % -4% -2%
Total margin 719 713 1,580 1,740 2,111 2,019 873 880 312 309 217 229 30,512 28,899 – 28,899 1,486 1,570 14 25 32,012 30,494 3,424 3,586% change +1% -9% +5% -1% +1% -5% +6% -5% -44% +5% -5%
Local currencies change % -5% -5%Total CACs (457) (391) (141) (176) (636) (1,105) (118) (123) (59) (50) (36) (39) (7,866) (7,068) – (7,068) (252) (258) – – (8,118) (7,326) (869) (860)Less: Handset Revenue 358 280 103 141 411 877 46 49 51 45 34 35 6,052 5,360 – 5,360 166 149 – – 6,218 5,509 665 646
Total CACs (net of handset revenue) (99) (111) (38) (35) (225) (228) (72) (74) (8) (5) (2) (4) (1,814) (1,708) – (1,708) (86) (109) – – (1,900) (1,817) (204) (214)Operating Expenses (368) (351) (650) (747) (849) (809) (459) (460) (143) (135) (128) (130) (13,926) (13,179) 437 (12,742) (848) (830) 498 (184) (14,276) (13,756) (1,526) (1,619)
Opex as a % of total margin 51% 49% 41% 43% 40% 40% 53% 52% 46% 44% 59% 57% 46% 46% 44% 57% 53% N/A N/A 45% 45% 45% 45%Gain on disposal of tower assets – – – – – – – – – – – – – – – – – – 25,259 – 25,259 – 2,620 –Impairment of goodwill – – – – – – – – – – – – – – – – – – (15,472) – (15,472) – (1,669) –EBITDA 252 251 892 958 1,037 982 342 346 161 169 87 95 14,772 14,012 437 14,449 552 631 10,299 (159) 25,623 14,921 2,645 1,753
% change – -7% +6% -1% -5% -8% +5% -13% +6577% +72% +51%Local currencies change % -5% +62%
EBITDA margin % (9) 31% 30% 45% 44% 36% 41% 32% 32% 43% 45% 36% 37% 40% 40% 41% 23% 34% 65% 40% 62% 40%Depreciation & Amortisation (208) (165) (519) (386) (586) (540) (203) (200) (72) (71) (64) (59) (9,171) (6,664) (63) (6,727) (453) (415) (3) (2) (9,627) (7,144) (1,029) (840)EBIT 44 86 373 572 451 442 139 146 89 98 23 36 5,601 7,348 374 7,722 99 216 10,296 (161) 15,996 7,777 1,616 913
% change -49% -35% +2% -5% -9% -36% -24% -54% +6495% +106% +77%Local currencies change % -31% +99%
EBITDA per above 252 251 892 958 1,037 982 342 346 161 169 87 95 14,772 14,012Proforma contribution from tower assets – – – – – 144 – 57 – 20 – 11 – 437Reported EBITDA 252 251 892 958 1,037 1,126 342 403 161 189 87 106 14,772 14,449
% change – -7% -8% -15% -15% -18% +2%Local currencies change % -8%
EBIT per above 44 86 373 572 451 442 139 146 89 98 23 36 5,601 7,348Proforma contribution from tower assets – – – – – 125 – 51 – 16 – 9 – 374Reported EBIT 44 86 373 572 451 567 139 197 89 114 23 45 5,601 7,722
% change -49% -35% -20% -29% -22% -49% -27%Local currencies change % -34%
Capex (excluding licence) (307) (192) (618) (348) (612) (606) (145) (82) (75) (58) (62) (72) (11,130) (6,650) (324) (105) (1) (7) (11,455) (6,762) (1,225) (772)Reported EBITDA less Capex (55) 59 274 610 425 520 197 321 86 131 25 34 3,642 7,799 228 526 10,298 (166) 14,168 8,159 1,420 981Licence (10) (280) – – – (492) – (544) – – – – – (4,237) – (500) (202) – – (4,737) (202) (500) (24)HK dollar equivalents of Reported EBITDA and EBIT are summarised as follows:
EBITDA-pre IFRS 16 basis (HK$) 2,726 2,429 8,345 8,150 958 898 430 459 1,504 1,608 809 905 14,772 14,449 552 631 10,299 (159) 25,623 14,921 €2,645 € 1,753EBITDA-post IFRS 16 basis (HK$) 3,278 2,936 11,279 10,553 1,095 1,038 485 544 1,615 1,821 962 1,082 18,714 17,974 760 850 10,356 (159) 29,830 18,665 €3,095 € 2,193EBIT-pre IFRS 16 basis (HK$) 474 828 3,488 4,860 416 452 175 225 835 970 213 387 5,601 7,722 99 216 10,296 (161) 15,996 7,777 €1,616 € 913EBIT-post IFRS 16 basis (HK$) 577 923 3,735 4,832 428 465 179 233 859 1,015 249 419 6,027 7,887 105 220 10,353 (161) 16,485 7,946 €1,669 € 934
Note 6: Wind Tre’s results include fixed line business revenue of €488 million (30 June 2020: €504 million) and EBITDA of €117 million (30 June 2020: €123 million).Note 7: As the disposals of tower assets in Denmark, Austria and Ireland were completed in December 2020 and in Sweden was completed in January 2021, comparison was made
against normalised 1H 2020 results which exclude the proforma contribution from tower assets of these operations for comparability purpose. The % changes in EBITDA and EBIT are compared against the normalised 1H 2020 numbers.
Note 8: 3 Group Europe results do not include one-off items in 1H 2021, which represented gain on disposal of tower assets completed in 1H 2021 of HK$25.3 billion and non-cash impairment of goodwill of the Group’s Italian telecommunication business of HK$15.5 billion (1H 2020: nil).
CKHGT - Results by operations
Note 9: EBITDA margin % represents EBITDA as a percentage of total revenue (excluding handset revenue).Note 10: 1H 2020 licence cost for Hong Kong represents investment for 40 MHz of 3500 MHz spectrum acquired in October 2019 for 15 years from April 2020. 1H 2021 licence cost
for UK represents investment for 20 MHz of 700 MHz spectrum acquired in May 2021, the licence cost for Sweden represents 1000 MHz of 3500 MHz spectrum acquired in January 2021, the licence cost for Denmark represents 2x20 MHz of 2100 MHz spectrum, 120 MHz in 3500 MHz spectrum and 1000 MHz in 2.6 GHz spectrum acquired in April 2021, and the licence cost for Hong Kong represents investment for 10 MHz of 900 MHz spectrum renewed for 15 years from January 2021.
UK Italy Sweden Denmark Austria Ireland 33 Group Europe HTHKH 1H 2021 1H 2020 1H 2021 1H 2020 1H 2021 1H 2020 1H 2021 1H 2020 1H 2021 1H 2020 1H 2021 1H 2020 1H 2021 1H 2020 1H 2021 1H 2020Total registered customer base (million) 12.9 13.3 21.0 22.5 2.2 2.1 1.5 1.5 3.4 3.6 2.8 2.4 43.8 45.4 3.9 3.9Total active customer base (million) 9.5 9.5 19.2 20.3 2.2 2.1 1.5 1.5 2.8 2.9 2.8 2.4 38.0 38.7 3.2 3.3Contract customers as a % of the total registered customer base 61% 56% 48% 45% 69% 69% 57% 59% 74% 72% 71% 67% 56% 53% 37% 37%Average monthly churn rate of the total contract registered customer base (%) 1.2% 1.3% 1.4% 1.3% 1.2% 1.5% 1.7% 1.7% 0.3% 0.2% 0.7% 0.9% 1.2% 1.2% 1.1% 1.1%Active contract customers as a % of the total contract registered customer base 99% 98% 94% 95% 100% 100% 100% 100% 100% 100% 100% 100% 97% 97% 100% 100%Active customers as a % of the total registered customer base 73% 72% 91% 90% 98% 97% 100% 100% 84% 81% 100% 100% 87% 85% 84% 85%LTE coverage by population (%) 94% 94% 100% 100% 93% 91% 100% 100% 96% 98% 99% 99% – – 90% 90%Six month data usage per active customer (Gigabyte) 92.0 68.6 41.3 35.2
CKHH 2021 Interim Results Operations Highlights
Page 19 of 104

CK Hutchison Holdings Limited
2015 Interim Report
18
CK Hutchison Holdings Limited
2021 Interim Report
Key Business Indicators
Registered Customer Base
Registered Customers at 30 June 2021 (’000)
Registered Customer Growth (%) from 31 December 2020 to 30 June 2021
Registered Customer Growth (%) from 30 June 2020 to 30 June 2021
Non-contract Contract Total Non-contract Contract Total Non-contract Contract Total
United Kingdom 5,074 7,827 12,901 -8% +3% -2% -14% +6% -3%
Italy (11) 10,950 10,044 20,994 -2% -3% -2% -11% -1% -7%
Sweden 709 1,558 2,267 +4% +2% +3% +8% +5% +6%
Denmark 638 844 1,482 +3% -1% +1% +6% -1% +2%
Austria 874 2,495 3,369 -6% -4% -5% -13% -4% -7%
Ireland 813 1,964 2,777 -2% +10% +6% +3% +24% +17%
3 Group Europe Total 19,058 24,732 43,790 -4% – -2% -10% +3% -3%
HTHKH 2,433 1,423 3,856 +1% – +1% – -2% -1%
Active (12) Customer Base
Active Customers at 30 June 2021 (’000)
Active Customer Growth (%) from 31 December 2020 to 30 June 2021
Active Customer Growth (%) from 30 June 2020 to 30 June 2021
Non-contract Contract Total Non-contract Contract Total Non-contract Contract Total
United Kingdom 1,719 7,730 9,449 -22% +3% -3% -25% +6% -1%
Italy (11) 9,751 9,479 19,230 -2% -2% -2% -8% -2% -5%
Sweden 654 1,558 2,212 +4% +2% +3% +11% +5% +7%
Denmark 632 844 1,476 +3% -1% +1% +6% -1% +2%
Austria 355 2,488 2,843 +4% -4% -3% +8% -4% -3%
Ireland 813 1,964 2,777 -2% +10% +6% +3% +24% +17%
3 Group Europe Total 13,924 24,063 37,987 -4% – -1% -9% +3% -2%
HTHKH 1,810 1,423 3,233 -2% – -1% -2% -2% -2%
Note 11: In addition to the above, Wind Tre has 2.9 million fixed line customers.
Note 12: An active customer is one that generated revenue from an outgoing call, incoming call or data/content service in the preceding three months.
CK Hutchison Group Telecom (continued)
CKHH 2021 Interim Results Operations Highlights
Page 20 of 104

CK Hutchison Holdings Limited
2015 Interim Report
19
CK Hutchison Holdings Limited
2021 Interim Report
12-month Trailing Average Revenue per Active User (“ARPU”) (13) to 30 June 2021
Non-contract ContractBlended
Total
% Variancecompared to30 June 2020
United Kingdom £4.97 £21.98 £18.24 +3%Italy (16) €10.62 €12.57 €11.58 -1%Sweden SEK116.54 SEK312.78 SEK255.81 -7%Denmark DKK86.38 DKK145.41 DKK120.65 -4%Austria €11.82 €21.93 €20.73 +1%Ireland €14.72 €16.57 €15.99 -14%3 Group Europe Average (16) €10.22 €19.11 €15.75 –HTHKH HK$8.78 HK$194.60 HK$91.05 -3%
12-month Trailing Net Average Revenue per Active User (“Net ARPU”) (14)
to 30 June 2021
Non-contract ContractBlended
Total
% Variancecompared to30 June 2020
United Kingdom £4.97 £15.04 £12.82 +2%Italy €10.62 €11.21 €10.91 -1%Sweden SEK116.54 SEK206.73 SEK180.55 -4%Denmark DKK86.38 DKK134.58 DKK114.36 -4%Austria €11.82 €18.11 €17.36 +1%Ireland €14.72 €12.74 €13.37 -16%3 Group Europe Average €10.22 €14.69 €13.00 -1%HTHKH HK$8.78 HK$171.24 HK$80.71 -2%
12-month Trailing Net Average Margin per Active User (“Net AMPU”) (15)
to 30 June 2021
Non-contract ContractBlended
Total
% Variancecompared to30 June 2020
United Kingdom £4.34 £13.29 £11.32 +3%Italy €9.16 €9.66 €9.41 +2%Sweden SEK100.51 SEK180.59 SEK157.34 -2%Denmark DKK73.01 DKK111.36 DKK95.27 -4%Austria €10.13 €16.09 €15.39 –Ireland €13.50 €11.55 €12.16 -15%3 Group Europe Average €8.86 €12.87 €11.35 +1%HTHKH HK$7.51 HK$148.39 HK$69.89 -4%
Note 13: ARPU equals total monthly revenue, including incoming mobile termination revenue and contributions for a handset/device in contract bundled plans, divided by the average number of active customers during the period.
Note 14: Net ARPU equals total monthly revenue, including incoming mobile termination revenue but excluding contributions for a handset/device in contract bundled plans, divided by the average number of active customers during the period.
Note 15: Net AMPU equals total monthly revenue, including incoming mobile termination revenue but excluding contributions for a handset/device in contract bundled plans, less direct variable costs (including interconnection charges and roaming costs) (i.e. net customer service margin), divided by the average number of active customers during the period.
Note 16: Wind Tre’s ARPU for the period ended 30 June 2020 has been restated to conform with the definition of 3 Italy before the merger with WIND.
CKHH 2021 Interim Results Operations Highlights
Page 21 of 104

CK Hutchison Holdings Limited
2015 Interim Report
20
CK Hutchison Holdings Limited
2021 Interim Report
CK Hutchison Group Telecom (continued)
United Kingdom
3 UK’s EBITDA remains flat in local currency compared to the same period last year, mainly driven by improvements in other margins from MVNOs, together with lower costs associated to acquisition and retention activities due to lockdown, fully offset the lower net customer service margin from lower weighted average customer base. EBIT decreased by 49% in local currency compared to the same period last year, mainly due to increased depreciation from higher asset base driven by IT investments and accelerated 5G network rollout.
Italy
Wind Tre’s EBITDA decreased by 7% compared to the same period last year, mainly driven by intense competition resulting in revenue decline of 10%, partly offset by cost savings and certain dispute settlement benefit. EBIT decreased by 35% against the first half of 2020 due to higher depreciation and amortisation from the enlarged asset base as network enhancement continues.
Sweden
Sweden, where the Group has a 60% interest, on a normalised basis and in local currency, reported EBITDA and EBIT growth of 6% and 2% respectively when compared to same period last year, primarily driven by 5% growth in total margin from customer base growth, together with stringent control on total CACs, partly offset by higher operating costs and depreciation and amortisation from enlarged network base and new spectrum licence acquired in early 2021.
Denmark
The operation in Denmark, where the Group has a 60% interest, reported local currency EBITDA and EBIT decreased by 1% and 5% respectively on a normalised basis, primarily driven by the 1% decrease in total margin as a result of a more adverse lockdown impact with all shops being closed for two months during the first half of 2021.
Austria
On a normalised basis, EBITDA and EBIT in local currency decreased by 5% and 9% respectively compared to the same period last year, primarily driven by higher network related expenses due to network expansion, higher total CACs and operating costs, partly offset by higher contribution in other margin from MVNOs.
Ireland
On a normalised basis, EBITDA and EBIT in local currency decreased by 8% and 36% respectively compared to the same period last year driven by 5% lower total margin mainly due to lower net AMPU from reduced out of bundle spend and the dilutive impact of higher mix of low value Internet of things (IoT) customers, which more than offsets the base growth. The adverse variance is partly offset by stringent control on total CACs and operating cost. EBIT also reflected higher depreciation and amortisation from an enlarged asset base.
Hutchison Telecommunications Hong Kong Holdings
Total revenue of HK$2,565 million was 29% higher as compared to the same period last year, primarily driven by increase in hardware sales, partly offset by lower net customer service revenue as roaming service revenue continued to be impacted by the prolonged travel restrictions. EBITDA of HK$552 million was 13% lower as compared to the same period last year, mainly due to lower interest income from lower bank deposit interest rate and lower net customer service margin. EBIT of HK$99 million was 54% lower than the first half of 2020 due to higher depreciation and amortisation from an enlarged asset base.
CKHH 2021 Interim Results Operations Highlights
Page 22 of 104

CK Hutchison Holdings Limited
2015 Interim Report
21
CK Hutchison Holdings Limited
2021 Interim Report
Hutchison Asia Telecommunications
30 June 2021HK$ million
30 June 2020HK$ million Change
Local currencieschange
Total Revenue 4,350 4,521 -4% -5%- Indonesia 3,757 3,952 -5% -6%- Vietnam 382 363 +5% +3%- Sri Lanka 211 206 +2% +8%
EBITDA (17) 803 872 -8% -9%- Indonesia 810 899 -10% -12%- Vietnam 15 (2) +850% +850%- Sri Lanka 37 19 +95% +105%- Corporate costs (59) (44) -34% -34%
EBIT (17) (76) 194 -139% -143%- Indonesia 163 430 -62% -64%- Vietnam (142) (140) -1% +1%- Sri Lanka (38) (52) +27% +21%- Corporate costs (59) (44) -34% -34%
Total active customer account (’000) 60,365 48,846 +24%
Note 17: Under Post-IFRS 16 basis, EBITDA was HK$1,869 million (30 June 2020: HK$2,065 million); EBIT was HK$272 million (30 June 2020: HK$708 million).
As of 30 June 2021, Hutchison Asia Telecommunications (“HAT”) had approximately 60.4 million active customer accounts, 24% higher than same period last year. Indonesia and Vietnam represent 73% and 20% of the total active customer account numbers respectively.
Indonesia operation continues to expand its 4G network to over 31,000 4G base transceiver station (“BTS”), covering more than 37,000 villages as at 30 June 2021. For the first half of 2021, revenue and EBITDA were 6% and 12% below same period last year in local currency primarily due to the intense market competition and pandemic impact, resulting in decline in ARPU which more than offset the 30% growth in active customer accounts. EBIT was 64% lower than same period last year in local currency, primarily due to the higher depreciation from continued investment in network expansion in the second half of 2020.
The Vietnam operation reported revenue growth of 3% in local currency from same period last year, primarily driven by 13% increase in active customer accounts, partly offset by the decline in ARPU as a result of market pressure. The operation continues to deliver steady results and reported positive EBITDA in first half of 2021, reflecting the revenue growth and disciplined cost controls. LBIT improved slightly by 1% in local currency from same period last year, reflecting the EBITDA improvement was mostly offset by higher depreciation charges.
Despite facing challenging market conditions due to pandemic, the operation in Sri Lanka continues to improve and reported 8%, 105% and 21% growth in revenue, EBITDA and EBIT respectively in local currency when compared to the first half of 2020, reflecting margin improvement and stringent cost controls.
CKHH 2021 Interim Results Operations Highlights
Page 23 of 104

22
CK Hutchison Holdings Limited
2021 Interim Report
Finance & Investments and Others
30 June 2021 (1)
HK$ million30 June 2020 (1)
HK$ million ChangeLocal currencies
change
Total Revenue 31,858 27,880 +14% +10%
EBITDA (2) 653 7,220 -91% -93%- Underlying 4,167 1,525 +173% +164%- One-off items (3,514) 5,695 -162% -162%
EBIT (2) (2,541) 3,293 -177% -177%- Underlying 973 (2,402) +141% +141%- One-off items (3,514) 5,695 -162% -162%
Note 1: The share of of Husky’s results for the six months ended 30 June 2020 were reclassified from Energy division to Finance & Investments and Others segment to conform with the six months ended 30 June 2021 presentation, which included the Group’s 15.71% share of Cenovus Energy Post-IFRS 16 results.
Note 2: Under Post-IFRS 16 basis, EBITDA was HK$1,239 million (30 June 2020: HK$8,115 million); EBIT was HK$(2,518) million (30 June 2020: HK$3,452 million).
Finance & Investments and Others segment includes returns earned on the Group’s holdings of cash and liquid investments, Hutchison Whampoa (China) Limited, listed associate TOM Group, the Marionnaud businesses, listed associate CK Life Sciences Group and listed subsidiary, Hutchison Telecommunications (Australia) Limited, which has a 25.05% interest in TPG Telecom Limited. Following the merger of the Group’s energy business with Cenovus Energy in January 2021, the Group’s 15.71% share of Cenovus Energy’s results forms part of the Finance & Investments and Others segment. The share of Husky’s results for the first half of 2020 were also reclassified to this segment to conform with the six months ended 30 June 2021 presentation.
In the first half of 2021, EBITDA and EBIT in this segment included the recogniton of a non-cash foreign exchange reserve loss following the energy business merger of HK$3.5 billion. This is compared to the one-off net gains of HK$5.7 billion in the same period last year, which comprised the net dilution gain arising from the merger of the Australian Telecommunication businesses, partly offset by impairment and write-downs of the energy business and certain non-strategic equity investments.
Excluding the one-off items, underlying EBITDA and EBIT grew 173% and 141% respectively from first half of 2020 primarily due to the turnaround contribution from the Group’s energy business.
As at 30 June 2021, the Group’s holdings of cash and liquid investments totalled HK$190,416 million. Further information on the Group’s treasury function can be found in the “Group Capital Resources and Liquidity” section of this results announcement.
Interest Expense, Finance Costs and Tax
The Group’s consolidated interest expenses and other finance costs for the six months ended 30 June 2021, including its share of associated companies’ and joint ventures’ interest expenses, amortisation of finance costs and after deducting interest capitalised on assets under development, amounted to HK$7,197 million, decreased by 3% when compared to the same period last year. The Group’s weighted average cost of debt for the six months ended 30 June 2021 was 1.6% (30 June 2020: 1.7%).
The Group recorded current and deferred tax charges of HK$4,087 million in the six months ended 30 June 2021, an increase of 74% compared to the same period last year, primarily reflected the higher profit before tax for the first half of 2021.
CKHH 2021 Interim Results Operations Highlights
Page 24 of 104

Report on Review of Interim Financial Statements
TO THE BOARD OF DIRECTORS OF CK HUTCHISON HOLDINGS LIMITED (incorporated in the Cayman Islands with limited liability)
Introduction
We have reviewed the interim financial statements set out on pages 26 to 96, which comprises the condensed consolidated statement of financial position of CK Hutchison Holdings Limited (the “Company”) and its subsidiaries (together, the “Group”) as at 30 June 2021 and the condensed consolidated income statement, the condensed consolidated statement of comprehensive income, the condensed consolidated statement of changes in equity and the condensed consolidated statement of cash flows for the six-month period then ended, and a summary of significant accounting policies and other explanatory notes. The Rules Governing the Listing of Securities on The Stock Exchange of Hong Kong Limited require the preparation of a report on interim financial statements to be in compliance with the relevant provisions thereof and Hong Kong Accounting Standard 34 “Interim Financial Reporting” issued by the Hong Kong Institute of Certified Public Accountants. The directors of the Company are responsible for the preparation and presentation of these interim financial statements in accordance with Hong Kong Accounting Standard 34 “Interim Financial Reporting”. Our responsibility is to express a conclusion on these interim financial statements based on our review and to report our conclusion solely to you, as a body, in accordance with our agreed terms of engagement and for no other purpose. We do not assume responsibility towards or accept liability to any other person for the contents of this report.
Scope of Review
We conducted our review in accordance with Hong Kong Standard on Review Engagements 2410, “Review of Interim Financial Information Performed by the Independent Auditor of the Entity” issued by the Hong Kong Institute of Certified Public Accountants. A review of interim financial statements consists of making inquiries, primarily of persons responsible for financial and accounting matters, and applying analytical and other review procedures. A review is substantially less in scope than an audit conducted in accordance with Hong Kong Standards on Auditing and consequently does not enable us to obtain assurance that we would become aware of all significant matters that might be identified in an audit. Accordingly, we do not express an audit opinion.
Conclusion
Based on our review, nothing has come to our attention that causes us to believe that the interim financial statements of the Group are not prepared, in all material respects, in accordance with Hong Kong Accounting Standard 34 “Interim Financial Reporting”.
PricewaterhouseCoopers Certified Public Accountants
Hong Kong, 5 August 2021
CKHH 2021 Interim Results Independent Auditor’s Report
Page 25 of 104

Condensed Consolidated Income Statementfor the six months ended 30 June 2021
Unaudited
2021 # 2021 2020US$ million Note HK$ million HK$ million
17,371 Revenue 4, 5 135,496 124,651
(6,293) Cost of inventories sold 6 (49,082) (43,867)
(2,395) Staff costs (18,682) (17,642)
(1,020) Expensed customer acquisition and retention costs (7,956) (7,184)
(2,921) Depreciation and amortisation 5 (22,783) (19,776)
(5,317) Other expenses and losses ## 6 (41,475) (23,349)
3,415 Other income and gains ## 6 26,634 11,838
Share of profits less losses of:
314 Associated companies 2,450 (3,379)
253 Joint ventures 1,972 1,619
3,407 26,574 22,911
(690) Interest expenses and other finance costs 7 (5,382) (5,387)
2,717 Profit before tax 21,192 17,524
(236) Current tax 8 (1,838) (1,073)
264 Deferred tax credit 8 2,060 244
2,745 Profit after tax 21,414 16,695
Profit attributable to non-controlling interests and
(399) holders of perpetual capital securities (3,114) (3,695)
2,346 Profit attributable to ordinary shareholders 18,300 13,000
Earnings per share for profit attributable to ordinary
US 60.9 cents shareholders 9 HK$ 4.75 HK$ 3.37
Details of distribution paid to the holders of perpetual capital securities and interim dividend payable to the ordinary shareholders are set out in note 10.
# See note 38.## See note 6 for reclassification of certain comparative information.
Unaudited
CKHH 2021 Interim Results Financial Statements
Page 26 of 104
Condensed Consolidated Statement of Comprehensive Incomefor the six months ended 30 June 2021
Unaudited
2021 # 2021 2020US$ million HK$ million HK$ million
2,745 Profit after tax 21,414 16,695
Other comprehensive income (losses)
Items that will not be reclassified to profit or lossRemeasurement of defined benefit obligations recognised directly
92 in reserves 720 (574) Equity securities at fair value through other comprehensive income (“FVOCI”)
25 Valuation gains (losses) recognised directly in reserves 193 (326) 64 Share of other comprehensive income of associated companies 498 -
121 Share of other comprehensive income of joint ventures 945 82 (11) Tax relating to items that will not be reclassified to profit or loss (86) 127
291 2,270 (691)
Items that may be reclassified to profit or lossDebt securities at FVOCI
(2) Valuation gains (losses) recognised directly in reserves (18) 62 (1) Valuation losses (gains) previously in reserves recognised in income statement (4) 89 51 Gains (losses) on cash flow hedges recognised directly in reserves 396 (162) 13 Gains on net investment hedges recognised directly in reserves 97 3,097
Losses on translating overseas subsidiaries’ net assets recognised (40) directly in reserves (311) (2,713)
Losses previously in reserves related to subsidiaries, associatedcompanies and joint ventures disposed during the period recognised
374 in income statement 2,921 2,384 304 Share of other comprehensive income (losses) of associated companies 2,375 (2,243) 199 Share of other comprehensive income (losses) of joint ventures 1,553 (2,995)
- Tax relating to items that may be reclassified to profit or loss (4) 9
898 7,005 (2,472)
1,189 Other comprehensive income (losses), net of tax 9,275 (3,163)
3,934 Total comprehensive income 30,689 13,532
Total comprehensive income attributable to non-controlling interests (545) and holders of perpetual capital securities (4,250) (2,924)
3,389 Total comprehensive income attributable to ordinary shareholders 26,439 10,608
# See note 38.
Unaudited
CKHH 2021 Interim Results Financial Statements
Page 27 of 104

Condensed Consolidated Statement of Financial Positionat 30 June 2021
Unaudited Unaudited Audited30 June 30 June 31 December
2021 # 2021 2020US$ million Note HK$ million HK$ million
Non-current assets16,434 Fixed assets 11 128,186 132,101 10,186 Right-of-use assets 12 79,453 83,805
9,018 Telecommunications licences 13 70,342 66,944 11,798 Brand names and other rights 14 92,022 91,453 37,655 Goodwill 15 293,709 319,718 17,987 Associated companies 16 140,297 136,076 18,443 Interests in joint ventures 17 143,857 141,465
2,887 Deferred tax assets 18 22,515 19,926 1,062 Liquid funds and other listed investments 19 8,287 10,588 1,838 Other non-current assets 20 14,341 14,944
127,308 993,009 1,017,020
Current assets23,350 Cash and cash equivalents 21 182,129 155,951
3,098 Inventories 24,163 24,565 7,220 Trade receivables and other current assets 22 56,319 55,809
33,668 262,611 236,325 - Assets classified as held for sale 23 - 1,251
33,668 262,611 237,576
Current liabilities 9,545 Bank and other debts 24 74,450 48,021
269 Current tax liabilities 2,100 2,639 2,381 Lease liabilities 12 18,573 18,621
12,739 Trade payables and other current liabilities 25 99,365 103,881
24,934 194,488 173,162 - Liabilities directly associated with assets classified as held for sale 23 - 284
24,934 194,488 173,446
8,734 Net current assets 68,123 64,130
136,042 Total assets less current liabilities 1,061,132 1,081,150
Non-current liabilities35,497 Bank and other debts 24 276,876 301,050
100 Interest bearing loans from non-controlling shareholders 27 779 798 8,987 Lease liabilities 12 70,101 75,644 2,282 Deferred tax liabilities 18 17,800 17,672
377 Pension obligations 28 2,939 3,804 6,387 Other non-current liabilities 29 49,819 52,119
53,630 418,314 451,087
82,412 Net assets 642,818 630,063
# See note 38.
CKHH 2021 Interim Results Financial Statements
Page 28 of 104

Condensed Consolidated Statement of Financial Positionat 30 June 2021
Unaudited Unaudited Audited30 June 30 June 31 December
2021 # 2021 2020US$ million Note HK$ million HK$ million
Capital and reserves493 Share capital 30 (a) 3,848 3,856
31,272 Share premium 30 (a) 243,920 244,377 34,098 Reserves 31 265,965 246,063
65,863 Total ordinary shareholders’ funds 513,733 494,296 1,580 Perpetual capital securities 30 (b) 12,326 12,415
14,969 Non-controlling interests 116,759 123,352
82,412 Total equity 642,818 630,063
# See note 38.
CKHH 2021 Interim Results Financial Statements
Page 29 of 104

Condensed Consolidated Statement of Changes in Equityfor the six months ended 30 June 2021
Unaudited Share capital Total ordinary Perpetual Non- Unaudited
Total and share shareholders’ capital controlling Totalequity # premium (a) Reserves (b)
funds securities interests equityUS$ million HK$ million HK$ million HK$ million HK$ million HK$ million HK$ million
80,777 At 1 January 2021 248,233 246,063 494,296 12,415 123,352 630,063
2,745 Profit for the period - 18,300 18,300 246 2,868 21,414
Other comprehensive income (losses)
Equity securities at FVOCI
25 Valuation gains recognised directly in reserves - 194 194 - (1) 193
Debt securities at FVOCI
(2) Valuation losses recognised directly in reserves - (18) (18) - - (18)
Valuation gains previously in reserves recognised
(1) in income statement - (4) (4) - - (4)
Remeasurement of defined benefit obligations
92 recognised directly in reserves - 566 566 - 154 720
Gains on cash flow hedges recognised directly
51 in reserves - 276 276 - 120 396
Gains on net investment hedges recognised
13 directly in reserves - 73 73 - 24 97
Losses on translating overseas subsidiaries’ net
(40) assets recognised directly in reserves - (193) (193) - (118) (311)
Losses previously in reserves related to subsidiaries
and associated companies disposed during the
374 period recognised in income statement - 2,921 2,921 - - 2,921
Share of other comprehensive income of
368 associated companies - 2,535 2,535 - 338 2,873
Share of other comprehensive income of
320 joint ventures - 1,860 1,860 - 638 2,498
Tax relating to components of other
(11) comprehensive income (losses) - (71) (71) - (19) (90)
1,189 Other comprehensive income, net of tax - 8,139 8,139 - 1,136 9,275
3,934 Total comprehensive income - 26,439 26,439 246 4,004 30,689
Transactions with owners in their capacity as owners:(840) Dividends paid relating to 2020 - (6,555) (6,555) - - (6,555)
(484) Dividends paid to non-controlling interests - - - - (3,768) (3,768)
(43) Distribution paid on perpetual capital securities - - - (335) - (335)
325 Equity contribution from non-controlling interests - - - - 2,534 2,534
(1,200) Redemption of perpetual capital securities by a subsidiary - - - - (9,360) (9,360)
Transaction costs in relation to equity contribution
(1) from non-controlling interests - (8) (8) - (3) (11)
Buy-back and cancellation of issued shares (see(60) note 30(a)(i)) (465) (1) (466) - - (466)
4 Unclaimed dividends write back of a subsidiary - 27 27 - - 27
(2,299) (465) (6,537) (7,002) (335) (10,597) (17,934)
82,412 At 30 June 2021 247,768 265,965 513,733 12,326 116,759 642,818
# See note 38.(a) See note 30(a) for details on share capital and share premium.(b) See note 31 for details on reserves.
Attributable to
Ordinary shareholders
CKHH 2021 Interim Results Financial Statements
Page 30 of 104
Condensed Consolidated Statement of Changes in Equityfor the six months ended 30 June 2021
Unaudited Share capital Total ordinary Perpetual Non- UnauditedTotal and share shareholders’ capital controlling Total
equity # premium (a) Reserves (b) funds securities interests equity
US$ million HK$ million HK$ million HK$ million HK$ million HK$ million HK$ million
76,534 At 1 January 2020 248,233 216,052 464,285 12,410 120,268 596,963
2,141 Profit for the period - 13,000 13,000 241 3,454 16,695
Other comprehensive income (losses)
Equity securities at FVOCI
(42) Valuation losses recognised directly in reserves - (290) (290) - (36) (326)
Debt securities at FVOCI
8 Valuation gains recognised directly in reserves - 62 62 - - 62
Valuation losses previously in reserves recognised
12 in income statement - 89 89 - - 89
Remeasurement of defined benefit obligations
(74) recognised directly in reserves - (453) (453) - (121) (574)
Losses on cash flow hedges recognised directly
(21) in reserves - (119) (119) - (43) (162)
Gains on net investment hedges recognised
397 directly in reserves - 2,344 2,344 - 753 3,097
Losses on translating overseas subsidiaries’ net
(348) assets recognised directly in reserves - (2,076) (2,076) - (637) (2,713)
Losses previously in reserves related to subsidiaries,
associated companies and joint ventures disposed
306 during the period recognised in income statement - 2,342 2,342 - 42 2,384
Share of other comprehensive income (losses) of
(288) associated companies - (2,146) (2,146) - (97) (2,243)
Share of other comprehensive income (losses) of
(373) joint ventures - (2,254) (2,254) - (659) (2,913)
Tax relating to components of other
17 comprehensive income (losses) - 109 109 - 27 136
(406) Other comprehensive income (losses), net of tax - (2,392) (2,392) - (771) (3,163)
1,735 Total comprehensive income - 10,608 10,608 241 2,683 13,532
Transactions with owners in their capacity as owners:(1,137) Dividends paid relating to 2019 - (8,870) (8,870) - - (8,870)
(451) Dividends paid to non-controlling interests - - - - (3,513) (3,513)
(42) Distribution paid on perpetual capital securities - - - (326) - (326)
(26) Relating to purchase of non-controlling interests - (202) (202) - 1 (201)
2 Relating to partial disposal of subsidiary companies - (10) (10) - 25 15
(1,654) - (9,082) (9,082) (326) (3,487) (12,895)
76,615 At 30 June 2020 248,233 217,578 465,811 12,325 119,464 597,600
# See note 38.(a) See note 30(a) for details on share capital and share premium.(b) See note 31 for details on reserves.
Attributable toOrdinary shareholders
CKHH 2021 Interim Results Financial Statements
Page 31 of 104

Condensed Consolidated Statement of Cash Flows for the six months ended 30 June 2021
Unaudited
2021 # 2021 2020US$ million Note HK$ million HK$ million
Operating activitiesCash generated from operating activities before interest expenses
5,192 and other finance costs, tax paid and changes in working capital 32 (a) 40,497 37,647 (690) Interest expenses and other finance costs paid (net of capitalisation) (5,384) (5,382) (310) Tax paid (2,414) (2,143)
4,192 Funds from operations (before principal elements of lease payments) 32,699 30,122 (487) Changes in working capital 32 (b) (3,799) (1,349)
3,705 Net cash from operating activities 28,900 28,773
Investing activities(1,359) Purchase of fixed assets (10,603) (9,311)
(607) Additions to telecommunications licences (4,737) (202) (432) Additions to brand names and other rights (3,373) (749)
7 Purchase of subsidiary companies, net of cash acquired 32 (c) 56 - (7) Additions to unlisted investments (52) (2) 47 Repayments of loans from associated companies and joint ventures 365 15
Purchase of and advances to associated companies and joint (73) ventures (571) (757) 29 Proceeds from disposal of fixed assets 230 463
4,926 Proceeds from disposal of subsidiary companies, net of cash disposed 32 (d) 38,425 13 Proceeds from disposal / partial disposal of associated companies
108 and joint ventures 845 1,492
Cash flows from (used in) investing activities before additions to / 2,639 disposal of liquid funds and other listed investments 20,585 (9,038)
41 Disposal of liquid funds and other listed investments 318 283 (3) Additions to liquid funds and other listed investments (22) (1,595)
2,677 Cash flows from (used in) investing activities 20,881 (10,350)
6,382 Net cash inflow before financing activities 49,781 18,423
Financing activities5,540 New borrowings 32 (e) 43,215 28,803
(4,823) Repayment of borrowings 32 (e) (37,621) (21,934) (1,199) Principal elements of lease payments 32 (e) (9,351) (9,529)
Issue of equity securities by subsidiary companies to non-controlling 11 shareholders 86 -
(251) Payment to acquire additional interests in subsidiary companies (1,955) (201) - Proceeds from partial disposal of subsidiary company - 15
Proceeds on issue of perpetual capital securities by a subsidiary,299 net of transaction costs 2,329 -
(1,200) Redemption of perpetual capital securities by a subsidiary (9,360) - (60) Payments for buy-back and cancellation of issued shares (466) -
(840) Dividends paid to ordinary shareholders (6,555) (8,870) (460) Dividends paid to non-controlling interests (3,590) (3,361)
(43) Distribution paid on perpetual capital securities (335) (326)
(3,026) Cash flows used in financing activities (23,603) (15,403)
3,356 Increase in cash and cash equivalents 26,178 3,020 19,994 Cash and cash equivalents at 1 January 155,951 137,127
23,350 Cash and cash equivalents at 30 June 182,129 140,147
# See note 38.
Unaudited
CKHH 2021 Interim Results Financial Statements
Page 32 of 104
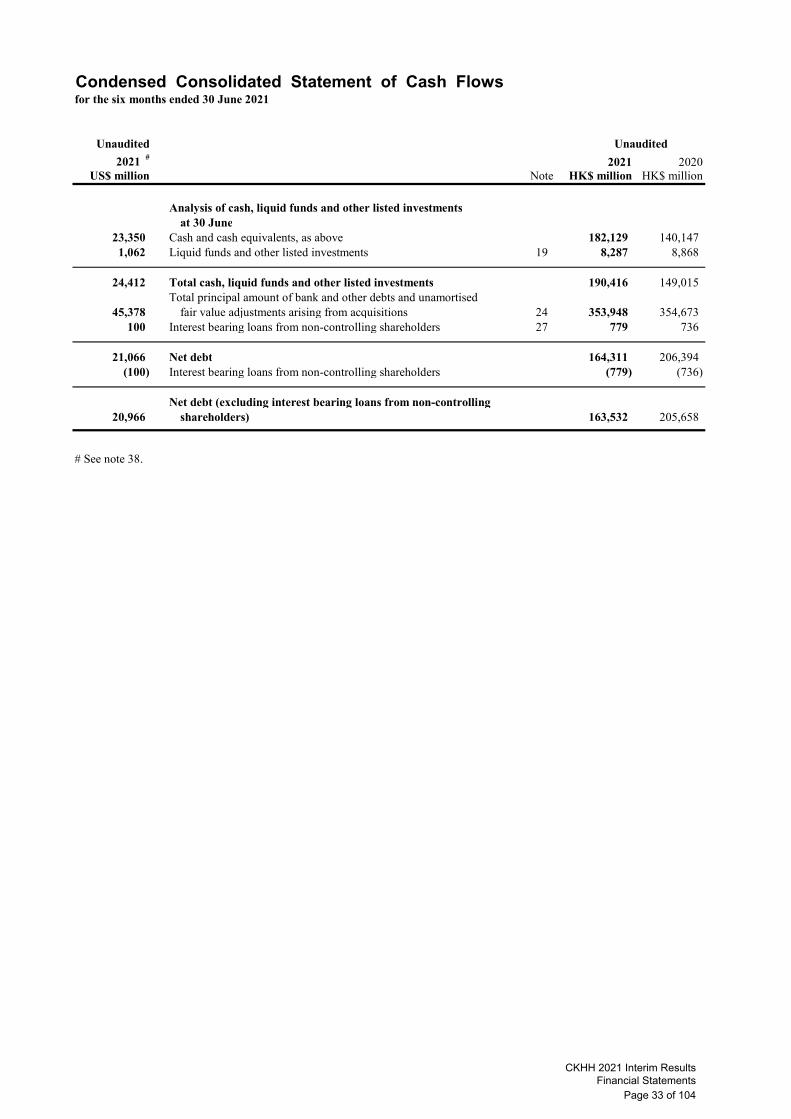
Condensed Consolidated Statement of Cash Flows for the six months ended 30 June 2021
Unaudited
2021 # 2021 2020US$ million Note HK$ million HK$ million
Unaudited
Analysis of cash, liquid funds and other listed investmentsat 30 June
23,350 Cash and cash equivalents, as above 182,129 140,147 1,062 Liquid funds and other listed investments 19 8,287 8,868
24,412 Total cash, liquid funds and other listed investments 190,416 149,015 Total principal amount of bank and other debts and unamortised
45,378 fair value adjustments arising from acquisitions 24 353,948 354,673 100 Interest bearing loans from non-controlling shareholders 27 779 736
21,066 Net debt 164,311 206,394 (100) Interest bearing loans from non-controlling shareholders (779) (736)
Net debt (excluding interest bearing loans from non-controlling 20,966 shareholders) 163,532 205,658
# See note 38.
CKHH 2021 Interim Results Financial Statements
Page 33 of 104

Notes to the Interim Financial Statements
1 General information
CK Hutchison Holdings Limited (the “Company”) is a company incorporated in the Cayman Islands with limited liability and the shares of the Company are listed on The Stock Exchange of Hong Kong Limited (“Stock Exchange”). The interim condensed consolidated financial statements of the Company and its subsidiaries (collectively, the “Group”) as at and for the six months ended30 June 2021 (the “Interim Financial Statements”) were authorised for issue by the Company’s board of directors on 5 August 2021.
The Chairman’s Statement and Operations Highlights, issued as part of the Group’s 2021 Interim Results announcement andInterim Report, include discussions on the performance of the Group’s businesses for the current period and other important events that occurred since the end of the 2020 financial year.
The Group Capital Resources and Other Information, issued as part of the Group’s 2021 Interim Results announcement and Interim Report, includes discussions on the Group’s liquidity and financial profile.
2 Use of judgements, estimates and assumptions
In preparing the Interim Financial Statements, the Group has made accounting related estimates based on assumptions about current and, for some estimates, future economic and market conditions that the Group considers are relevant and reasonable. It is reasonably possible that actual conditions could differ significantly from our expectations, given the road to post-pandemic normal and economic recovery will not be straightforward. Hence, our accounting estimates and assumptions could change over time in response to how economic and market conditions develop. Note 40 sets out further information on our significant accounting judgements, estimates and assumptions applied in preparing the Interim Financial Statements.
3 Basis of preparation
The Interim Financial Statements have been prepared in accordance with Hong Kong Accounting Standard 34 “Interim Financial Reporting”, issued by the Hong Kong Institute of Certified Public Accountants (the “HKICPA”). They do not include all of the information required for a complete set of financial statements prepared in accordance with Hong Kong Financial Reporting Standards (“HKFRSs”). The Interim Financial Statements should be read in conjunction with the consolidated financial statements of the Group as at and for the year ended 31 December 2020 (the “2020 Annual Financial Statements”) which have been prepared in accordance with HKFRSs.
The accompanying financial statements and notes are unaudited. The results reported in the Interim Financial Statements should not be regarded as necessarily indicative of results that may be expected for the entire year.
Management has assessed the potential cash generation of the Group, the liquidity of the Group and existing funding available to the Group. On the basis of these assessments, management has determined that, at the date on which the Interim Financial Statements were authorised for issue, the use of the going concern basis of accounting to prepare the Interim Financial Statements is appropriate.
The significant accounting policies adopted in preparing the Interim Financial Statements are described in note 41.
CKHH 2021 Interim Results Financial Statements
Page 34 of 104
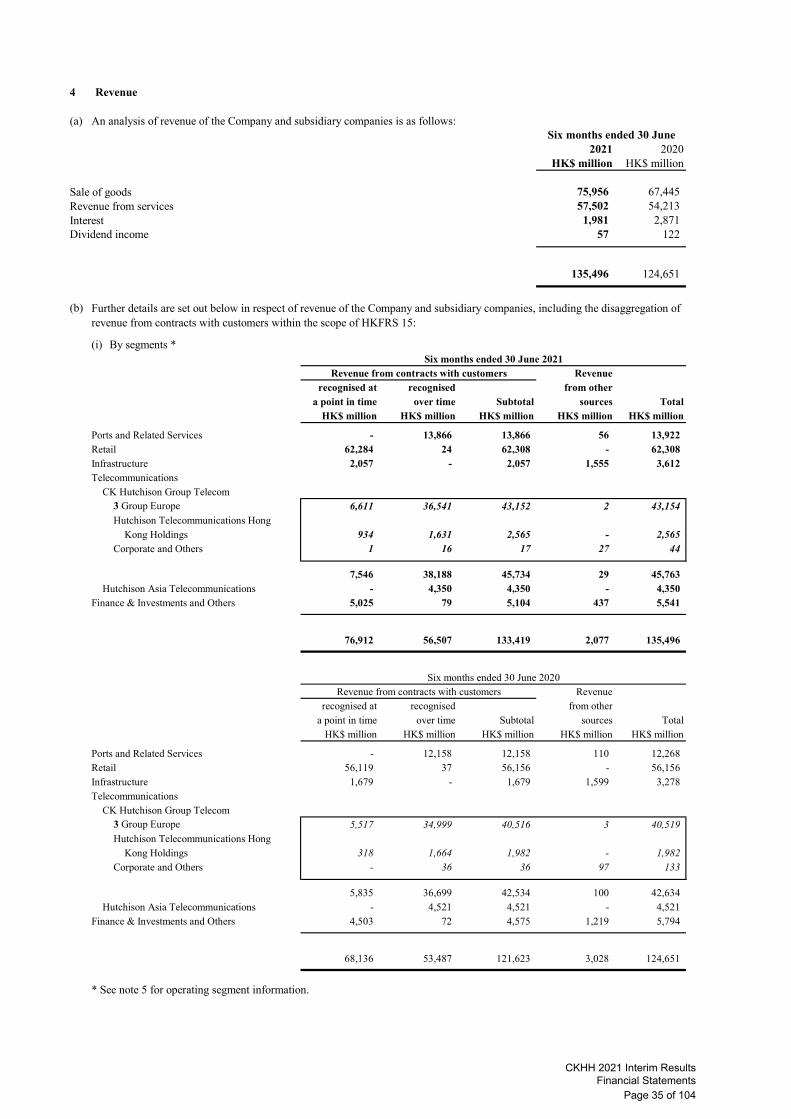
4 Revenue
(a) An analysis of revenue of the Company and subsidiary companies is as follows:
2021 2020HK$ million HK$ million
Sale of goods 75,956 67,445 Revenue from services 57,502 54,213 Interest 1,981 2,871 Dividend income 57 122
135,496 124,651
(b)
(i) By segments *
Revenuerecognised at recognised from other
a point in time over time Subtotal sources TotalHK$ million HK$ million HK$ million HK$ million HK$ million
Ports and Related Services - 13,866 13,866 56 13,922 Retail 62,284 24 62,308 - 62,308 Infrastructure 2,057 - 2,057 1,555 3,612 Telecommunications
CK Hutchison Group Telecom3 Group Europe 6,611 36,541 43,152 2 43,154 Hutchison Telecommunications Hong
Kong Holdings 934 1,631 2,565 - 2,565 Corporate and Others 1 16 17 27 44
7,546 38,188 45,734 29 45,763 Hutchison Asia Telecommunications - 4,350 4,350 - 4,350
Finance & Investments and Others 5,025 79 5,104 437 5,541
76,912 56,507 133,419 2,077 135,496
Revenuerecognised at recognised from other
a point in time over time Subtotal sources TotalHK$ million HK$ million HK$ million HK$ million HK$ million
Ports and Related Services - 12,158 12,158 110 12,268 Retail 56,119 37 56,156 - 56,156 Infrastructure 1,679 - 1,679 1,599 3,278 Telecommunications
CK Hutchison Group Telecom3 Group Europe 5,517 34,999 40,516 3 40,519 Hutchison Telecommunications Hong
Kong Holdings 318 1,664 1,982 - 1,982 Corporate and Others - 36 36 97 133
5,835 36,699 42,534 100 42,634 Hutchison Asia Telecommunications - 4,521 4,521 - 4,521
Finance & Investments and Others 4,503 72 4,575 1,219 5,794
68,136 53,487 121,623 3,028 124,651
* See note 5 for operating segment information.
Revenue from contracts with customers
Revenue from contracts with customers
Six months ended 30 June
Further details are set out below in respect of revenue of the Company and subsidiary companies, including the disaggregation of revenue from contracts with customers within the scope of HKFRS 15:
Six months ended 30 June 2020
Six months ended 30 June 2021
CKHH 2021 Interim Results Financial Statements
Page 35 of 104

4 Revenue (continued)
(b)
(ii) By geographical locations *
Revenuerecognised at recognised from other
a point in time over time Subtotal sources TotalHK$ million HK$ million HK$ million HK$ million HK$ million
Hong Kong 14,265 1,629 15,894 18 15,912 Mainland China 13,795 291 14,086 12 14,098
The People’s Republic of China 28,060 1,920 29,980 30 30,010
Europe 31,009 42,357 73,366 1,131 74,497 Canada - - - 127 127 Asia, Australia and Others 12,818 12,151 24,969 352 25,321
43,827 54,508 98,335 1,610 99,945
71,887 56,428 128,315 1,640 129,955 Finance & Investments and Others 5,025 79 5,104 437 5,541
76,912 56,507 133,419 2,077 135,496
Revenuerecognised at recognised from other
a point in time over time Subtotal sources TotalHK$ million HK$ million HK$ million HK$ million HK$ million
Hong Kong 14,792 1,631 16,423 174 16,597 Mainland China 10,707 180 10,887 8 10,895
The People’s Republic of China 25,499 1,811 27,310 182 27,492
Europe 26,215 39,554 65,769 1,105 66,874 Canada - - - 115 115 Asia, Australia and Others 11,919 12,050 23,969 407 24,376
38,134 51,604 89,738 1,627 91,365
63,633 53,415 117,048 1,809 118,857 Finance & Investments and Others 4,503 72 4,575 1,219 5,794
68,136 53,487 121,623 3,028 124,651
* See note 5 for operating segment information.
Revenue from contracts with customers
Revenue from contracts with customersSix months ended 30 June 2020
Six months ended 30 June 2021
Further details are set out below in respect of revenue of the Company and subsidiary companies, including the disaggregation of revenue from contracts with customers within the scope of HKFRS 15 (continued):
CKHH 2021 Interim Results Financial Statements
Page 36 of 104
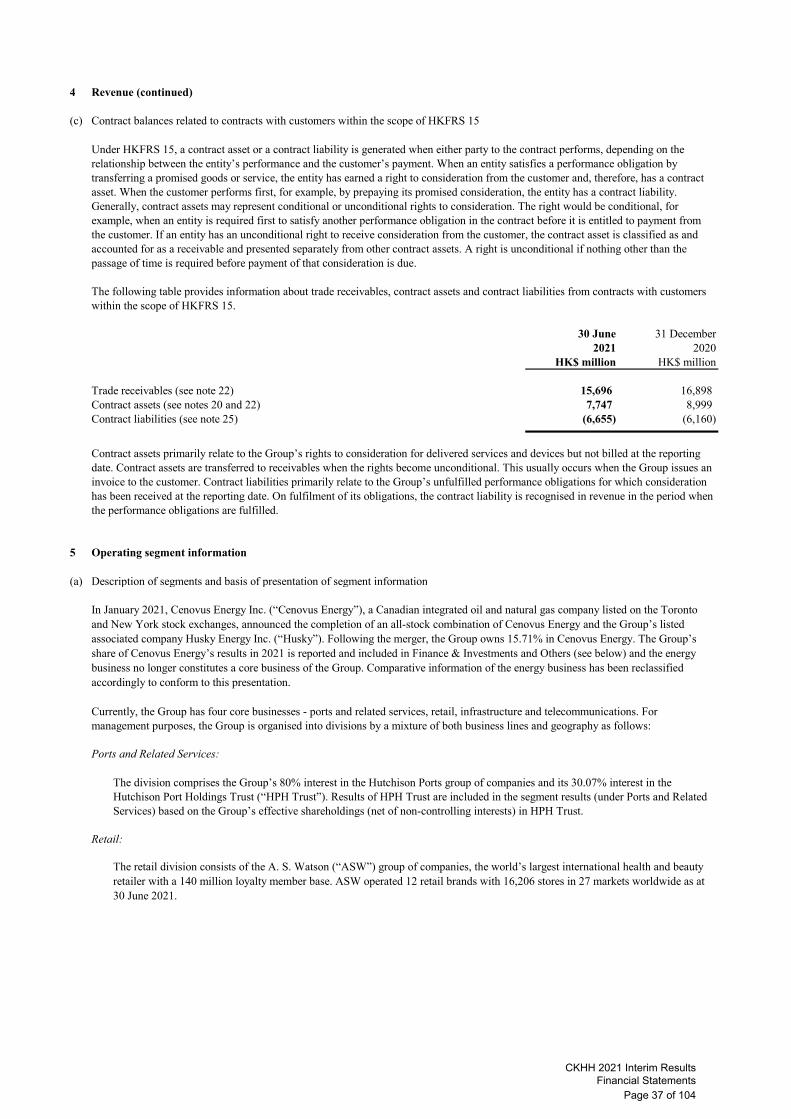
4 Revenue (continued)
(c) Contract balances related to contracts with customers within the scope of HKFRS 15
Under HKFRS 15, a contract asset or a contract liability is generated when either party to the contract performs, depending on the relationship between the entity’s performance and the customer’s payment. When an entity satisfies a performance obligation by transferring a promised goods or service, the entity has earned a right to consideration from the customer and, therefore, has a contract asset. When the customer performs first, for example, by prepaying its promised consideration, the entity has a contract liability. Generally, contract assets may represent conditional or unconditional rights to consideration. The right would be conditional, for example, when an entity is required first to satisfy another performance obligation in the contract before it is entitled to payment from the customer. If an entity has an unconditional right to receive consideration from the customer, the contract asset is classified as and accounted for as a receivable and presented separately from other contract assets. A right is unconditional if nothing other than the passage of time is required before payment of that consideration is due.
The following table provides information about trade receivables, contract assets and contract liabilities from contracts with customers within the scope of HKFRS 15.
30 June 31 December2021 2020
HK$ million HK$ million
Trade receivables (see note 22) 15,696 16,898 Contract assets (see notes 20 and 22) 7,747 8,999 Contract liabilities (see note 25) (6,655) (6,160)
Contract assets primarily relate to the Group’s rights to consideration for delivered services and devices but not billed at the reporting date. Contract assets are transferred to receivables when the rights become unconditional. This usually occurs when the Group issues an invoice to the customer. Contract liabilities primarily relate to the Group’s unfulfilled performance obligations for which consideration has been received at the reporting date. On fulfilment of its obligations, the contract liability is recognised in revenue in the period when the performance obligations are fulfilled.
5 Operating segment information
(a) Description of segments and basis of presentation of segment information
Currently, the Group has four core businesses - ports and related services, retail, infrastructure and telecommunications. For management purposes, the Group is organised into divisions by a mixture of both business lines and geography as follows:
Ports and Related Services:
The division comprises the Group’s 80% interest in the Hutchison Ports group of companies and its 30.07% interest in the Hutchison Port Holdings Trust (“HPH Trust”). Results of HPH Trust are included in the segment results (under Ports and Related Services) based on the Group’s effective shareholdings (net of non-controlling interests) in HPH Trust.
Retail:
The retail division consists of the A. S. Watson (“ASW”) group of companies, the world’s largest international health and beauty retailer with a 140 million loyalty member base. ASW operated 12 retail brands with 16,206 stores in 27 markets worldwide as at 30 June 2021.
In January 2021, Cenovus Energy Inc. (“Cenovus Energy”), a Canadian integrated oil and natural gas company listed on the Toronto and New York stock exchanges, announced the completion of an all-stock combination of Cenovus Energy and the Group’s listed associated company Husky Energy Inc. (“Husky”). Following the merger, the Group owns 15.71% in Cenovus Energy. The Group’s share of Cenovus Energy’s results in 2021 is reported and included in Finance & Investments and Others (see below) and the energy business no longer constitutes a core business of the Group. Comparative information of the energy business has been reclassified accordingly to conform to this presentation.
CKHH 2021 Interim Results Financial Statements
Page 37 of 104

5 Operating segment information (continued)
(a) Description of segments and basis of presentation of segment information (continued)
Infrastructure:
Telecommunications:
Finance & Investments and Others is presented to reconcile to the totals included in the Group’s income statement and statement of financial position. Finance & Investments and Others covers the activities of other areas of the Group that are not presented separately and includes a 87.87% interest in the Australian Securities Exchange listed Hutchison Telecommunications (Australia) (“HTAL”), which has a 25.05% interest in a listed associated company TPG Telecom Limited (“TPG”) (formerly known as Vodafone Hutchison Australia (“VHA”)), Hutchison Whampoa (China), Hutchison E-Commerce, the Marionnaud business, listed associated companies Hutchison China MediTech (“HUTCHMED”), TOM Group, CK Life Sciences Int’l., (Holdings) Inc. and Cenovus Energy, corporate head office operations and the returns earned on the Group’s holdings of cash and liquid investments.
Saved as disclosed in the notes below, the column headed as Company and Subsidiaries refers to the holding company of the Group and subsidiary companies’ respective items and the column headed as Associates and JV refers to the Group’s share of associated companies and joint ventures’ respective items.
In 2019, the Group has adopted the HKFRS 16 “Leases” accounting standard (which relates to accounting for leases) for its statutory reporting but its management reporting has remained on the precedent lease accounting standard Hong Kong Accounting Standard 17 “Leases” (“HKAS 17”). The Group believes that the HKAS 17 basis metrics, which are not intended to be a substitute for, or superior to, the reported metrics on a HKFRS 16 basis (“Post-HKFRS 16 basis”), better reflect management’s view of the Group’s underlying operational performances. HKAS 17 basis metrics financial information is regularly reviewed by management and used for resource allocation, performance assessment and internal decision-making. Accordingly, segmental information is presented on a HKAS 17 basis (“Pre-HKFRS 16 basis”), except where indicated otherwise, together with reconciliations to the total under the Post-HKFRS 16 basis. In addition, section (c) of this note sets out reconciliation from Pre-HKFRS 16 basis metrics to Post-HKFRS 16 basis metrics for the Group’s consolidated income statement, consolidated statement of comprehensive income, and consolidated statement of cash flows for the current and comparative periods, and the Group’s consolidated statement of financial position as at 30 June 2021 and 31 December 2020.
For management purposes and in a manner consistent with the way in which information is reported internally to the Group’s most senior executive management and board of directors for the purposes of making decisions about resource allocation and performance assessment, the Group presents its operating segment information based on these core businesses.
The Infrastructure division comprises the Group’s 75.67% interest in CK Infrastructure Holdings Limited (“CKI”), a subsidiary company listed on the Stock Exchange as well as 10% of the economic benefits derived from the Group’s direct holdings in six infrastructure investments co-owned with CKI comprising of interests in Northumbrian Water, Park’N Fly, UK Rails, Australian Gas Networks, Dutch Enviro Energy and Wales & West Utilities.
The Group’s telecommunications division consists of CK Hutchison Group Telecom Holdings (“CK Hutchison Group Telecom”) and Hutchison Asia Telecommunications.
CKHH 2021 Interim Results Financial Statements
Page 38 of 104
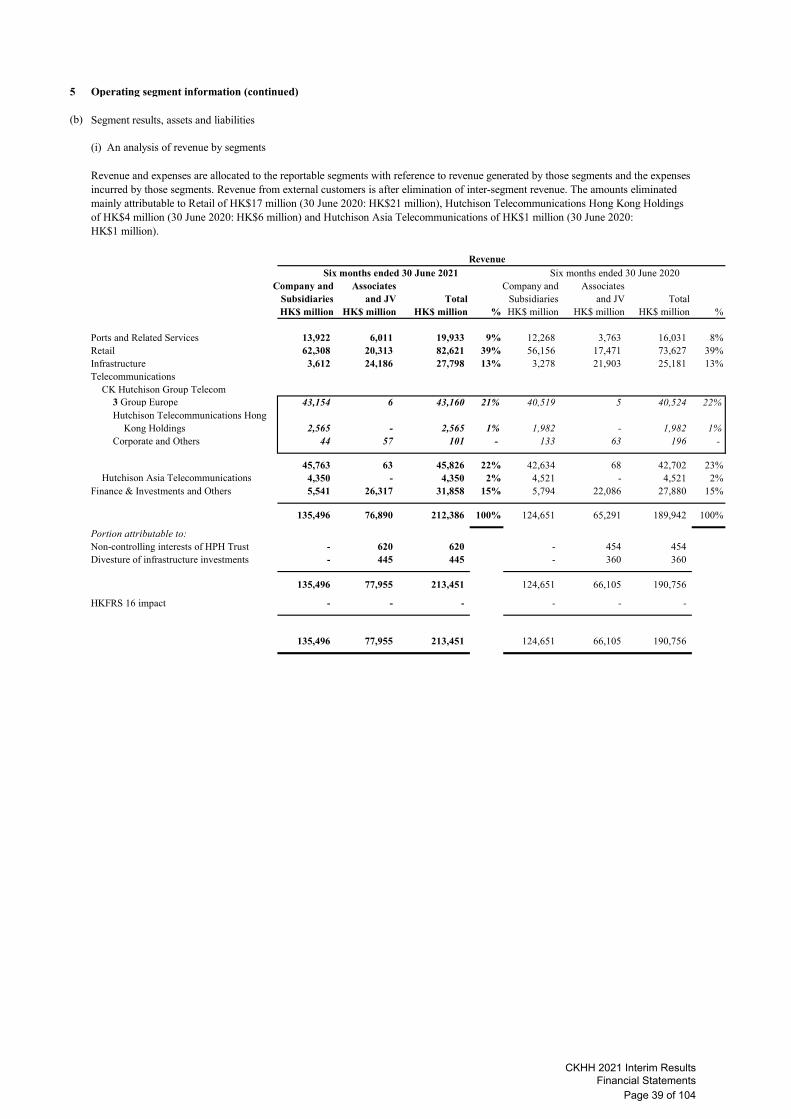
5 Operating segment information (continued)
(b) Segment results, assets and liabilities
(i) An analysis of revenue by segments
Revenue and expenses are allocated to the reportable segments with reference to revenue generated by those segments and the expenses incurred by those segments. Revenue from external customers is after elimination of inter-segment revenue. The amounts eliminated mainly attributable to Retail of HK$17 million (30 June 2020: HK$21 million), Hutchison Telecommunications Hong Kong Holdings of HK$4 million (30 June 2020: HK$6 million) and Hutchison Asia Telecommunications of HK$1 million (30 June 2020: HK$1 million).
Revenue
Company and Associates Company and AssociatesSubsidiaries and JV Total Subsidiaries and JV TotalHK$ million HK$ million HK$ million % HK$ million HK$ million HK$ million %
Ports and Related Services 13,922 6,011 19,933 9% 12,268 3,763 16,031 8%Retail 62,308 20,313 82,621 39% 56,156 17,471 73,627 39%Infrastructure 3,612 24,186 27,798 13% 3,278 21,903 25,181 13%Telecommunications
CK Hutchison Group Telecom3 Group Europe 43,154 6 43,160 21% 40,519 5 40,524 22%Hutchison Telecommunications Hong
Kong Holdings 2,565 - 2,565 1% 1,982 - 1,982 1%Corporate and Others 44 57 101 - 133 63 196 -
45,763 63 45,826 22% 42,634 68 42,702 23%Hutchison Asia Telecommunications 4,350 - 4,350 2% 4,521 - 4,521 2%
Finance & Investments and Others 5,541 26,317 31,858 15% 5,794 22,086 27,880 15%
135,496 76,890 212,386 100% 124,651 65,291 189,942 100%
Portion attributable to:Non-controlling interests of HPH Trust - 620 620 - 454 454 Divesture of infrastructure investments - 445 445 - 360 360
135,496 77,955 213,451 124,651 66,105 190,756
HKFRS 16 impact - - - - - -
135,496 77,955 213,451 124,651 66,105 190,756
Six months ended 30 June 2021 Six months ended 30 June 2020
CKHH 2021 Interim Results Financial Statements
Page 39 of 104

5 Operating segment information (continued)
(b) Segment results, assets and liabilities (continued)
The Group uses two measures of segment results, EBITDA (see note 5(b)(xiv)) and EBIT (see note 5(b)(xv)). Analyses of segment resultsby EBITDA and EBIT are set out in (ii), (iii), (ix), (x) and (xiii) below.
(ii) An analysis of EBITDA by segments
EBITDA (LBITDA) (xiv)
Company and Associates Company and AssociatesSubsidiaries and JV Total Subsidiaries and JV TotalHK$ million HK$ million HK$ million % HK$ million HK$ million HK$ million %
Ports and Related Services 4,389 2,594 6,983 13% 4,025 1,514 5,539 12%Retail 4,961 1,764 6,725 12% 3,472 1,154 4,626 10%Infrastructure 1,994 12,809 14,803 27% 1,686 12,082 13,768 29%Telecommunications
CK Hutchison Group Telecom
3 Group Europe 14,772 - 14,772 27% 14,449 - 14,449 31%Hutchison Telecommunications Hong
Kong Holdings 523 29 552 1% 598 33 631 1%
Corporate and Others (xvi) 10,304 (5) 10,299 18% (147) (12) (159) -
25,599 24 25,623 46% 14,900 21 14,921 32%Hutchison Asia Telecommunications 803 - 803 1% 872 - 872 2%
Finance & Investments and Others (xvii) (3,823) 4,476 653 1% 8,801 (1,581) 7,220 15%
EBITDA 33,923 21,667 55,590 100% 33,756 13,190 46,946 100%
Portion attributable to:Non-controlling interests of HPH Trust - 483 483 - 320 320
EBITDA ^ 33,923 ^ 22,150 ^ 56,073 ^ 33,756 ^ 13,510 ^ 47,266 ^
Depreciation and amortisation (13,594) (9,360) (22,954) (10,751) (9,654) (20,405) Interest expenses and other finance costs (3,516) (3,681) (7,197) (3,610) (3,824) (7,434) Current tax (1,829) (1,808) (3,637) (1,091) (1,584) (2,675) Deferred tax 2,047 (2,497) (450) 222 104 326 Non-controlling interests (3,127) (265) (3,392) (3,732) (178) (3,910)
13,904 4,539 18,443 14,794 (1,626) 13,168
HKFRS 16 impactEBITDA ^ 11,012 ^ 1,565 ^ 12,577 ^ 10,702 ^ 1,693 ^ 12,395 ^Depreciation and amortisation (9,189) (1,352) (10,541) (9,025) (1,428) (10,453) Interest expenses and other finance costs (1,866) (327) (2,193) (1,777) (414) (2,191) Current tax (9) - (9) 18 - 18 Deferred tax 13 (3) 10 22 4 26 Non-controlling interests 13 - 13 37 - 37
13,878 4,422 18,300 14,771 (1,771) 13,000
^ Reconciliation to Post-HKFRS 16 basis EBITDA:
Pre-HKFRS 16 basis EBITDAper above 33,923 22,150 56,073 33,756 13,510 47,266
HKFRS 16 impact per above 11,012 1,565 12,577 10,702 1,693 12,395
Post-HKFRS 16 basis EBITDA (see note 32(a)(i)) 44,935 23,715 68,650 44,458 15,203 59,661
Six months ended 30 June 2021 Six months ended 30 June 2020
CKHH 2021 Interim Results Financial Statements
Page 40 of 104

5 Operating segment information (continued)
(b) Segment results, assets and liabilities (continued)
(iii) An analysis of EBIT by segments
EBIT (LBIT) (xv)
Company and Associates Company and AssociatesSubsidiaries and JV Total Subsidiaries and JV TotalHK$ million HK$ million HK$ million % HK$ million HK$ million HK$ million %
Ports and Related Services 2,909 1,860 4,769 14% 2,604 850 3,454 13%Retail 3,584 1,355 4,939 15% 2,170 800 2,970 11%Infrastructure 1,845 7,841 9,686 30% 1,563 7,426 8,989 34%Telecommunications
CK Hutchison Group Telecom3 Group Europe
EBITDA before the following non-cash items: 14,772 - 14,772 14,449 - 14,449
Depreciation (5,316) - (5,316) (4,186) - (4,186) Amortisation of licence fees,
customer acquisition and retention costs and other rights (3,855) - (3,855) (2,541) - (2,541)
EBIT - 3 Group Europe 5,601 - 5,601 17% 7,722 - 7,722 29%Hutchison Telecommunications Hong
Kong Holdings 93 6 99 - 206 10 216 1%
Corporate and Others (xvi) 10,301 (5) 10,296 32% (149) (12) (161) -1%
15,995 1 15,996 49% 7,779 (2) 7,777 29%Hutchison Asia Telecommunications (76) - (76) - 194 - 194 1%
Finance & Investments and Others (xvii) (3,928) 1,387 (2,541) -8% 8,695 (5,402) 3,293 12%
EBIT 20,329 12,444 32,773 100% 23,005 3,672 26,677 100%
Portion attributable to:Non-controlling interests of HPH Trust - 346 346 - 184 184
EBIT ^ 20,329 ^ 12,790 ^ 33,119 ^ 23,005 ^ 3,856 ^ 26,861 ^
Interest expenses and other finance costs (3,516) (3,681) (7,197) (3,610) (3,824) (7,434)
Current tax (1,829) (1,808) (3,637) (1,091) (1,584) (2,675) Deferred tax 2,047 (2,497) (450) 222 104 326 Non-controlling interests (3,127) (265) (3,392) (3,732) (178) (3,910)
13,904 4,539 18,443 14,794 (1,626) 13,168
HKFRS 16 impactEBIT ^ 1,823 ^ 213 ^ 2,036 ^ 1,677 ^ 265 ^ 1,942 ^Interest expenses and other finance
costs (1,866) (327) (2,193) (1,777) (414) (2,191) Current tax (9) - (9) 18 - 18 Deferred tax 13 (3) 10 22 4 26 Non-controlling interests 13 - 13 37 - 37
13,878 4,422 18,300 14,771 (1,771) 13,000
^ Reconciliation to Post-HKFRS 16basis EBIT:
Pre-HKFRS 16 basis EBIT per above 20,329 12,790 33,119 23,005 3,856 26,861
HKFRS 16 impact per above 1,823 213 2,036 1,677 265 1,942
Post-HKFRS 16 basis EBIT 22,152 13,003 35,155 24,682 4,121 28,803
Six months ended 30 June 2021 Six months ended 30 June 2020
CKHH 2021 Interim Results Financial Statements
Page 41 of 104

5 Operating segment information (continued)
(b) Segment results, assets and liabilities (continued)
(iv) An analysis of depreciation and amortisation expenses by segments
Company and Associates Company and AssociatesSubsidiaries and JV Total Subsidiaries and JV TotalHK$ million HK$ million HK$ million HK$ million HK$ million HK$ million
Ports and Related Services 1,480 734 2,214 1,421 664 2,085 Retail 1,377 409 1,786 1,302 354 1,656 Infrastructure 149 4,968 5,117 123 4,656 4,779 Telecommunications
CK Hutchison Group Telecom3 Group Europe 9,171 - 9,171 6,727 - 6,727
Hutchison Telecommunications Hong Kong Holdings 430 23 453 392 23 415 Corporate and Others 3 - 3 2 - 2
9,604 23 9,627 7,121 23 7,144 Hutchison Asia Telecommunications 879 - 879 678 - 678
Finance & Investments and Others 105 3,089 3,194 106 3,821 3,927
13,594 9,223 22,817 10,751 9,518 20,269 Portion attributable to:Non-controlling interests of HPH Trust - 137 137 - 136 136
13,594 9,360 22,954 10,751 9,654 20,405
HKFRS 16 impact 9,189 1,352 10,541 9,025 1,428 10,453
22,783 10,712 33,495 19,776 11,082 30,858
(v) An analysis of capital expenditure by segments
Telecom- Brand names Telecom- Brand namesFixed munications and other Fixed munications and otherassets licences rights Total assets licences rights Total
HK$ million HK$ million HK$ million HK$ million HK$ million HK$ million HK$ million HK$ million
Ports and Related Services 647 - 367 1,014 726 - - 726 Retail 880 - - 880 628 - - 628 Infrastructure 183 - 1 184 113 - - 113 Telecommunications
CK Hutchison Group Telecom3 Group Europe 8,131 4,237 2,999 15,367 5,913 - 737 6,650 Hutchison
TelecommunicationsHong Kong Holdings 324 500 - 824 105 202 - 307
Corporate and Others 1 - - 1 1 - 6 7
8,456 4,737 2,999 16,192 6,019 202 743 6,964 Hutchison Asia
Telecommunications 1,080 - - 1,080 1,787 - - 1,787 Finance & Investments
and Others 39 - 6 45 52 - 6 58
11,285 4,737 3,373 19,395 9,325 202 749 10,276
HKFRS 16 impact (682) - - (682) (14) - - (14)
10,603 4,737 3,373 18,713 9,311 202 749 10,262
Six months ended 30 June 2020 Six months ended 30 June 2021Capital expenditure (xxi)
Depreciation and amortisationSix months ended 30 June 2020Six months ended 30 June 2021
CKHH 2021 Interim Results Financial Statements
Page 42 of 104

5 Operating segment information (continued)
(b) Segment results, assets and liabilities (continued)
(vi) An analysis of total assets by segments
Investments Investmentsin associated Assets in associated
Deferred companies and Deferred classified companies andSegment tax interests in Total Segment tax as held for interests in Total
assets (xix) assets joint ventures assets assets (xix) assets sale (xxii) joint ventures assetsHK$ million HK$ million HK$ million HK$ million HK$ million HK$ million HK$ million HK$ million HK$ million
Ports and Related Services 73,373 258 21,704 95,335 73,386 152 - 19,370 92,908 Retail 199,726 1,018 16,155 216,899 201,517 1,043 - 16,451 219,011 Infrastructure 56,126 6 174,594 230,726 61,119 6 - 171,174 232,299 Telecommunications
CK Hutchison Group Telecom3 Group Europe 309,183 19,360 12 328,555 334,695 16,696 979 10 352,380 Hutchison
TelecommunicationsHong Kong Holdings 15,888 41 257 16,186 15,730 84 - 282 16,096
Corporate and Others 55,683 - 46 55,729 30,603 - - 36 30,639
380,754 19,401 315 400,470 381,028 16,780 979 328 399,115 Hutchison Asia
Telecommunications 18,477 - - 18,477 17,508 - - - 17,508 Finance & Investments
and Others 151,690 33 72,629 224,352 147,044 34 - 71,349 218,427
880,146 20,716 285,397 1,186,259 881,602 18,015 979 278,672 1,179,268
HKFRS 16 impact 68,805 1,799 (1,243) 69,361 74,276 1,911 272 (1,131) 75,328
948,951 22,515 284,154 1,255,620 955,878 19,926 1,251 277,541 1,254,596
(vii) An analysis of total liabilities by segments
LiabilitiesCurrent & Current & directly
non-current non-current associated borrowings (xx) borrowings (xx) with assets
and other Current & and other classified Current &Segment non-current deferred tax Total Segment non-current as held for deferred tax Total
liabilities (xix) liabilities liabilities liabilities liabilities (xix) liabilities sale (xxii) liabilities liabilitiesHK$ million HK$ million HK$ million HK$ million HK$ million HK$ million HK$ million HK$ million HK$ million
Ports and Related Services 9,339 15,397 4,637 29,373 9,138 15,342 - 4,165 28,645 Retail 25,616 14,874 10,295 50,785 26,315 16,840 - 10,404 53,559 Infrastructure 5,388 37,204 629 43,221 6,359 33,973 - 669 41,001 Telecommunications
CK Hutchison Group Telecom3 Group Europe 37,200 21,369 566 59,135 39,493 22,506 1 899 62,899 Hutchison
TelecommunicationsHong Kong Holdings 1,545 990 - 2,535 1,662 565 - - 2,227
Corporate and Others 2,294 72,720 8 75,022 4,443 80,171 - 11 84,625
41,039 95,079 574 136,692 45,598 103,242 1 910 149,751 Hutchison Asia
Telecommunications 11,442 13,200 2 24,644 11,999 13,075 - 2 25,076 Finance & Investments
and Others 10,933 226,941 4,689 242,563 9,971 219,718 - 5,069 234,758
103,757 402,695 20,826 527,278 109,380 402,190 1 21,219 532,790
HKFRS 16 impact 87,221 (771) (926) 85,524 92,570 (202) 283 (908) 91,743
190,978 401,924 19,900 612,802 201,950 401,988 284 20,311 624,533
Total assets
31 December 202030 June 2021
31 December 2020
Total liabilities
30 June 2021
CKHH 2021 Interim Results Financial Statements
Page 43 of 104

5 Operating segment information (continued)
(b) Segment results, assets and liabilities (continued)
(viii) An analysis of revenue by geographical locations
Company and Associates Company and AssociatesSubsidiaries and JV Total Subsidiaries and JV TotalHK$ million HK$ million HK$ million % HK$ million HK$ million HK$ million %
Hong Kong 15,912 4,288 20,200 10% 16,597 2,113 18,710 10%Mainland China 14,098 2,805 16,903 8% 10,895 2,735 13,630 7%
The People’s Republic of China 30,010 7,093 37,103 18% 27,492 4,848 32,340 17%
Europe 74,497 34,641 109,138 51% 66,874 30,420 97,294 51%Canada 127 1,399 1,526 1% 115 1,063 1,178 1%Asia, Australia and Others 25,321 7,440 32,761 15% 24,376 6,874 31,250 16%
99,945 43,480 143,425 67% 91,365 38,357 129,722 68%
129,955 50,573 180,528 85% 118,857 43,205 162,062 85%Finance & Investments and Others 5,541 26,317 31,858 15% 5,794 22,086 27,880 15%
135,496 76,890 212,386 ** 100% 124,651 65,291 189,942 ** 100%
** see note 5(b)(i) for reconciliation of segment revenue to revenue presented in the consolidated income statement.
(ix) An analysis of EBITDA by geographical locations
Company and Associates Company and AssociatesSubsidiaries and JV Total Subsidiaries and JV TotalHK$ million HK$ million HK$ million % HK$ million HK$ million HK$ million %
Hong Kong 679 1,784 2,463 5% 805 889 1,694 4%Mainland China 1,974 974 2,948 5% 1,658 845 2,503 5%
The People’s Republic of China 2,653 2,758 5,411 10% 2,463 1,734 4,197 9%
Europe 29,445 9,529 38,974 70% 17,355 8,685 26,040 55%Canada 133 780 913 2% 115 540 655 2%Asia, Australia and Others 5,515 4,124 9,639 17% 5,022 3,812 8,834 19%
35,093 14,433 49,526 89% 22,492 13,037 35,529 76%
37,746 17,191 54,937 99% 24,955 14,771 39,726 85%Finance & Investments and Others (3,823) 4,476 653 1% 8,801 (1,581) 7,220 15%
33,923 21,667 55,590 ## 100% 33,756 13,190 46,946 ## 100%
## see note 5(b)(ii) for reconciliation of segment EBITDA to profit or loss presented in the consolidated income statement.
(x) An analysis of EBIT by geographical locations
Company and Associates Company and AssociatesSubsidiaries and JV Total Subsidiaries and JV TotalHK$ million HK$ million HK$ million % HK$ million HK$ million HK$ million %
Hong Kong 50 1,206 1,256 4% 350 395 745 3%Mainland China 1,455 690 2,145 6% 1,031 556 1,587 6%
The People’s Republic of China 1,505 1,896 3,401 10% 1,381 951 2,332 9%
Europe 19,256 6,232 25,488 78% 9,717 5,444 15,161 57%Canada 132 440 572 2% 116 254 370 1%Asia, Australia and Others 3,364 2,489 5,853 18% 3,096 2,425 5,521 21%
22,752 9,161 31,913 98% 12,929 8,123 21,052 79%
24,257 11,057 35,314 108% 14,310 9,074 23,384 88%Finance & Investments and Others (3,928) 1,387 (2,541) -8% 8,695 (5,402) 3,293 12%
20,329 12,444 32,773 @@ 100% 23,005 3,672 26,677 @@ 100%
@@ see note 5(b)(iii) for reconciliation of segment EBIT to profit or loss presented in the consolidated income statement.
Revenue
EBITDA (LBITDA) (xiv)
EBIT (LBIT) (xv)
Six months ended 30 June 2021 Six months ended 30 June 2020
Six months ended 30 June 2021 Six months ended 30 June 2020
Six months ended 30 June 2021 Six months ended 30 June 2020
CKHH 2021 Interim Results Financial Statements
Page 44 of 104
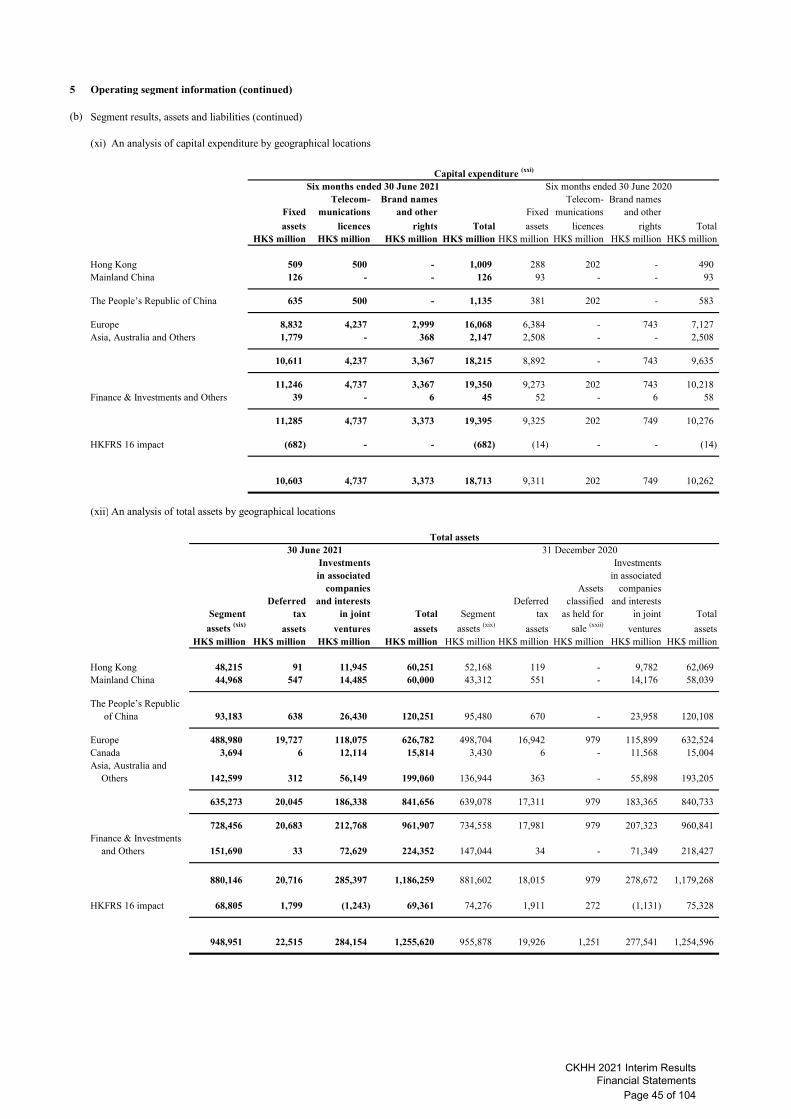
5 Operating segment information (continued)
(b) Segment results, assets and liabilities (continued)
(xi) An analysis of capital expenditure by geographical locations
Telecom- Brand names Telecom- Brand namesFixed munications and other Fixed munications and other
assets licences rights Total assets licences rights TotalHK$ million HK$ million HK$ million HK$ million HK$ million HK$ million HK$ million HK$ million
Hong Kong 509 500 - 1,009 288 202 - 490 Mainland China 126 - - 126 93 - - 93
The People’s Republic of China 635 500 - 1,135 381 202 - 583
Europe 8,832 4,237 2,999 16,068 6,384 - 743 7,127 Asia, Australia and Others 1,779 - 368 2,147 2,508 - - 2,508
10,611 4,237 3,367 18,215 8,892 - 743 9,635
11,246 4,737 3,367 19,350 9,273 202 743 10,218 Finance & Investments and Others 39 - 6 45 52 - 6 58
11,285 4,737 3,373 19,395 9,325 202 749 10,276
HKFRS 16 impact (682) - - (682) (14) - - (14)
10,603 4,737 3,373 18,713 9,311 202 749 10,262
(xii) An analysis of total assets by geographical locations
Investments Investmentsin associated in associated
companies Assets companiesDeferred and interests Deferred classified and interests
Segment tax in joint Total Segment tax as held for in joint Total
assets (xix) assets ventures assets assets (xix) assets sale (xxii) ventures assetsHK$ million HK$ million HK$ million HK$ million HK$ million HK$ million HK$ million HK$ million HK$ million
Hong Kong 48,215 91 11,945 60,251 52,168 119 - 9,782 62,069 Mainland China 44,968 547 14,485 60,000 43,312 551 - 14,176 58,039
The People’s Republic of China 93,183 638 26,430 120,251 95,480 670 - 23,958 120,108
Europe 488,980 19,727 118,075 626,782 498,704 16,942 979 115,899 632,524 Canada 3,694 6 12,114 15,814 3,430 6 - 11,568 15,004 Asia, Australia and
Others 142,599 312 56,149 199,060 136,944 363 - 55,898 193,205
635,273 20,045 186,338 841,656 639,078 17,311 979 183,365 840,733
728,456 20,683 212,768 961,907 734,558 17,981 979 207,323 960,841 Finance & Investments
and Others 151,690 33 72,629 224,352 147,044 34 - 71,349 218,427
880,146 20,716 285,397 1,186,259 881,602 18,015 979 278,672 1,179,268
HKFRS 16 impact 68,805 1,799 (1,243) 69,361 74,276 1,911 272 (1,131) 75,328
948,951 22,515 284,154 1,255,620 955,878 19,926 1,251 277,541 1,254,596
Capital expenditure (xxi)
31 December 2020
Six months ended 30 June 2020Six months ended 30 June 2021
30 June 2021Total assets
CKHH 2021 Interim Results Financial Statements
Page 45 of 104

5 Operating segment information (continued)
(b) Segment results, assets and liabilities (continued)
(xiii) An analysis of results (EBITDA and EBIT) before net gains from major transaction activities and other one-off items by segments and geographicallocations
An analysis of EBITDA by segments
EBITDA (LBITDA) (xiv)
Six months ended 30 June 2021 Six months ended 30 June 2020
Company and Associates Company and Associates
Subsidiaries and JV Total Subsidiaries and JV TotalHK$ million HK$ million HK$ million % HK$ million HK$ million HK$ million %
EBITDA before one-off items (see below)
Ports and Related Services 4,389 2,594 6,983 14% 4,025 1,514 5,539 13%Retail 4,961 1,764 6,725 14% 3,472 1,154 4,626 11%Infrastructure 1,994 12,809 14,803 30% 1,686 12,082 13,768 33%Telecommunications
CK Hutchison Group Telecom
3 Group Europe 14,772 - 14,772 30% 14,449 - 14,449 35%Hutchison Telecommunications
Hong Kong Holdings 523 29 552 1% 598 33 631 2%
Corporate and Others 517 (5) 512 1% (147) (12) (159) -
15,812 24 15,836 32% 14,900 21 14,921 37%Hutchison Asia Telecommunications 803 - 803 2% 872 - 872 2%
Finance & Investments and Others (309) 4,476 4,167 8% 4 1,521 1,525 4%
27,650 21,667 49,317 100% 24,959 16,292 41,251 100%
One-off itemsGains from disposal of European
telecommunications tower assets (xvi) 25,259 - 25,259 - - -
Impairment of Wind Tre’s goodwill (xvi) (15,472) - (15,472) - - - Foreign exchange reclassification
adjustment (xvii) (3,514) - (3,514) - - - Dilution gain from merger of VHA and
TPG Corporation Limited (xvii) - - - 10,105 - 10,105 Share of Husky’s impairments and other
charges (xvii) - - - - (3,102) (3,102) Write-downs on certain non-strategic
equity investments (xvii) - - - (1,308) - (1,308)
33,923 21,667 55,590 ## 33,756 13,190 46,946 ##
## see note 5(b)(ii) for reconciliation of segment EBITDA to profit or loss presented in the consolidated income statement.
The Group’s EBITDA and EBIT for the six months ended 30 June 2021 included the net gain attributable to shareholders from the disposal of interests in the Group’s European telecommunications tower assets that completed in first half of 2021 of HK$25,259 million (see note 5(b)(xvi)). This gain was partly offset by impairment of Wind Tre’s goodwill of HK$15,472 million (see note 5(b)(xvi)) and foreign exchange reclassification adjustment charge of HK$3,514 million (see note 5(b)(xvii)).
For the comparative period, the Group’s EBITDA and EBIT for the six months ended 30 June 2020 included a dilution gain from the merger of VHA with TPG Corporation Limited of HK$10,105 million (see note 5(b)(xvii)). This gain was partly offset by the Group’s share of Husky’s impairments and other charges of HK$3,102 million and write-downs on certain non-strategic equity investments of HK$1,308 million (see note 5(b)(xvii)).
CKHH 2021 Interim Results Financial Statements
Page 46 of 104

5 Operating segment information (continued)
(b) Segment results, assets and liabilities (continued)
(xiii) An analysis of results (EBITDA and EBIT) before net gains from major transaction activities and other one-off items by segments and geographicallocations (continued)
An analysis of EBITDA by geographical locations
EBITDA (LBITDA) (xiv)
Six months ended 30 June 2021 Six months ended 30 June 2020
Company and Associates Company and Associates
Subsidiaries and JV Total Subsidiaries and JV TotalHK$ million HK$ million HK$ million % HK$ million HK$ million HK$ million %
EBITDA before one-off items (see below)
Hong Kong 679 1,784 2,463 5% 805 889 1,694 4%Mainland China 1,974 974 2,948 6% 1,658 845 2,503 6%
The People’s Republic of China 2,653 2,758 5,411 11% 2,463 1,734 4,197 10%
Europe 19,658 9,529 29,187 59% 17,355 8,685 26,040 63%Canada 133 780 913 2% 115 540 655 1%
Asia, Australia and Others 5,515 4,124 9,639 20% 5,022 3,812 8,834 22%
25,306 14,433 39,739 81% 22,492 13,037 35,529 86%
27,959 17,191 45,150 92% 24,955 14,771 39,726 96%Finance & Investments and Others (309) 4,476 4,167 8% 4 1,521 1,525 4%
27,650 21,667 49,317 100% 24,959 16,292 41,251 100%
One-off itemsGains from disposal of European
telecommunications tower assets (xvi) 25,259 - 25,259 - - -
Impairment of Wind Tre’s goodwill (xvi) (15,472) - (15,472) - - - Foreign exchange reclassification
adjustment (xvii) (3,514) - (3,514) - - - Dilution gain from merger of VHA and
TPG Corporation Limited (xvii) - - - 10,105 - 10,105 Share of Husky’s impairments and other
charges (xvii) - - - - (3,102) (3,102) Write-downs on certain non-strategic
equity investments (xvii) - - - (1,308) - (1,308)
33,923 21,667 55,590 ## 33,756 13,190 46,946 ##
## see note 5(b)(ii) for reconciliation of segment EBITDA to profit or loss presented in the consolidated income statement.
CKHH 2021 Interim Results Financial Statements
Page 47 of 104

5 Operating segment information (continued)
(b) Segment results, assets and liabilities (continued)
(xiii) An analysis of results (EBITDA and EBIT) before net gains from major transaction activities and other one-off items by segments and geographicallocations (continued)
An analysis of EBIT by segments
EBIT (LBIT) (xv)
Six months ended 30 June 2021 Six months ended 30 June 2020Company and Associates Company and Associates
Subsidiaries and JV Total Subsidiaries and JV TotalHK$ million HK$ million HK$ million % HK$ million HK$ million HK$ million %
EBIT before one-off items (see below)Ports and Related Services 2,909 1,860 4,769 18% 2,604 850 3,454 16%Retail 3,584 1,355 4,939 19% 2,170 800 2,970 14%Infrastructure 1,845 7,841 9,686 36% 1,563 7,426 8,989 43%Telecommunications
CK Hutchison Group Telecom3 Group Europe 5,601 - 5,601 21% 7,722 - 7,722 37%Hutchison Telecommunications
Hong Kong Holdings 93 6 99 - 206 10 216 1%Corporate and Others 514 (5) 509 2% (149) (12) (161) -1%
6,208 1 6,209 23% 7,779 (2) 7,777 37%Hutchison Asia Telecommunications (76) - (76) - 194 - 194 1%
Finance & Investments and Others (414) 1,387 973 4% (102) (2,300) (2,402) -11%
14,056 12,444 26,500 100% 14,208 6,774 20,982 100%
One-off itemsGains from disposal of European
telecommunications tower assets (xvi) 25,259 - 25,259 - - -
Impairment of Wind Tre’s goodwill (xvi) (15,472) - (15,472) - - - Foreign exchange reclassification
adjustment (xvii) (3,514) - (3,514) - - - Dilution gain from merger of VHA and
TPG Corporation Limited (xvii) - - - 10,105 - 10,105 Share of Husky’s impairments and other
charges (xvii) - - - - (3,102) (3,102) Write-downs on certain non-strategic
equity investments (xvii) - - - (1,308) - (1,308)
20,329 12,444 32,773 @@ 23,005 3,672 26,677 @@
@@ see note 5(b)(iii) for reconciliation of segment EBIT to profit or loss presented in the consolidated income statement.
CKHH 2021 Interim Results Financial Statements
Page 48 of 104

5 Operating segment information (continued)
(b) Segment results, assets and liabilities (continued)
(xiii) An analysis of results (EBITDA and EBIT) before net gains from major transaction activities and other one-off items by segments and geographicallocations (continued)
An analysis of EBIT by geographical locations
EBIT (LBIT) (xv)
Six months ended 30 June 2021 Six months ended 30 June 2020Company and Associates Company and Associates
Subsidiaries and JV Total Subsidiaries and JV TotalHK$ million HK$ million HK$ million % HK$ million HK$ million HK$ million %
EBIT before one-off items (see below)Hong Kong 50 1,206 1,256 5% 350 395 745 3%Mainland China 1,455 690 2,145 8% 1,031 556 1,587 8%
The People’s Republic of China 1,505 1,896 3,401 13% 1,381 951 2,332 11%
Europe 9,469 6,232 15,701 59% 9,717 5,444 15,161 72%Canada 132 440 572 2% 116 254 370 2%Asia, Australia and Others 3,364 2,489 5,853 22% 3,096 2,425 5,521 26%
12,965 9,161 22,126 83% 12,929 8,123 21,052 100%
14,470 11,057 25,527 96% 14,310 9,074 23,384 111%Finance & Investments and Others (414) 1,387 973 4% (102) (2,300) (2,402) -11%
14,056 12,444 26,500 100% 14,208 6,774 20,982 100%
One-off itemsGains from disposal of European
telecommunications tower assets (xvi) 25,259 - 25,259 - - -
Impairment of Wind Tre’s goodwill (xvi) (15,472) - (15,472) - - - Foreign exchange reclassification
adjustment (xvii) (3,514) - (3,514) - - - Dilution gain from merger of VHA and
TPG Corporation Limited (xvii) - - - 10,105 - 10,105 Share of Husky’s impairments and other
charges (xvii) - - - - (3,102) (3,102) Write-downs on certain non-strategic
equity investments (xvii) - - - (1,308) - (1,308)
20,329 12,444 32,773 @@ 23,005 3,672 26,677 @@
@@ see note 5(b)(iii) for reconciliation of segment EBIT to profit or loss presented in the consolidated income statement.
CKHH 2021 Interim Results Financial Statements
Page 49 of 104

5 Operating segment information (continued)
(b) Segment results, assets and liabilities (continued)
(xiv) EBITDA (LBITDA) represents the EBITDA (LBITDA) of the Company and subsidiary companies as well as the Group’s share of the EBITDA (LBITDA) of associated companies and joint ventures except for HPH Trust which are included based on the Group’s effective share of EBITDA for this operation and the Group’s interests in six co-owned infrastructure investments with CKI that are based on the Group’s 10% direct interests in these investments. EBITDA (LBITDA) is defined as earnings (losses) before interest expenses and other finance costs, tax, depreciation and amortisation. Information concerning EBITDA (LBITDA) has been included in the Group’s financial information and consolidated financial statements and is used by many industries and investors as one measure of gross cash flow generation. The Group considers EBITDA (LBITDA) to be an important performance measure which is used in the Group’s internal financial and management reporting to monitor business performance. EBITDA (LBITDA) is therefore presented as a measure of segment results in accordance with HKFRS 8. EBITDA (LBITDA) is not a measure of cash liquidity orfinancial performance under HKFRS and the EBITDA (LBITDA) measures used by the Group may not be comparable to othersimilarly titled measures of other companies. EBITDA (LBITDA) should not necessarily be construed as an alternative to cash flows or results from operations as determined in accordance with HKFRS.
(xv) EBIT (LBIT) represents the EBIT (LBIT) of the Company and subsidiary companies as well as the Group’s share of the EBIT (LBIT) of associated companies and joint ventures except for HPH Trust which are included based on the Group’s effective share of EBIT for this operation and the Group’s interests in six co-owned infrastructure investments with CKI that are based on the Group’s 10% direct interests in these investments. EBIT (LBIT) is defined as earnings (losses) before interest expenses and other finance costs and tax. Information concerning EBIT (LBIT) has been included in the Group’s financial information and consolidated financial statements and is used by many industries and investors as one measure of results from operations. The Group considers EBIT (LBIT) to be an important performance measure which is used in the Group’s internal financial and management reporting to monitor business performance. EBIT (LBIT) is therefore presented as a measure of segment results in accordance with HKFRS 8. EBIT (LBIT) is not a measure of financial performance under HKFRS and the EBIT (LBIT) measures used by the Group may not be comparable to other similarly titled measures of other companies. EBIT (LBIT) should not necessarily be construed as an alternative to results from operations as determined in accordance with HKFRS.
(xvi)
(xvii) Included in the current period balance is a charge of HK$3,514 million (HK$3,514 million at Post-HKFRS 16 basis) arising from the merger of Husky and Cenovus Energy completed in January 2021. The amount represents reclassification adjustment of foreign exchange losses previously recognised in reserves. This amount is at EBITDA and EBIT levels and is reported under “Finance & Investments and Others” in the segment results and is included under “Other expenses and losses” in the consolidated income statement. See note 6(b).
In addition, the Group’s 40.19% owned listed associated company, Husky recognised a non-cash before-tax impairment of C$1.4 billion during the comparative six months ended 30 June 2020. These were primarily related to Husky’s upstream assets in North America and were largely due to lower long-term commodity price assumptions. The Group’s share of this charge was HK$3,102 million (HK$3,102 million at Post-HKFRS 16 basis) at the EBITDA and EBIT levels, and is reported under “Finance & Investments and Others” in the segment results. The Group’s share of this charge (after tax) was HK$2,306 million (HK$2,306 million at Post-HKFRS 16 basis) and was included in “Share of profits less losses of associated companies” in the consolidated income statement.
Furthermore, write-downs on certain non-strategic equity investments totalling HK$1,308 million (HK$1,308 million at Post-HKFRS 16 basis) was reported under the “Finance & Investments and Others” in the segment results during the comparative six months ended 30 June 2020.
(xviii) The geographical location of customers is based on the location at which the services were provided or goods delivered. Hong Kong is the location of principal place of business of the Company.
During the comparative six months ended 30 June 2020, joint venture VHA and TPG Corporation Limited have completed the merger of their telecommunications businesses in Australia. As a result, the Group’s attributable interest in VHA had been diluted from 43.93% to 22.01%. The Group has recognised a gain arising from the dilution during the comparative period. The amount of the gain was HK$10,105 million (HK$10,186 million at Post-HKFRS 16 basis) at EBITDA and EBIT levels and was reported under “Finance & Investments and Others” in the segment results and included in “Other income and gains” in the consolidated income statement. The gains attributable to ordinary shareholders amounted to HK$9,177 million (HK$9,247 million at Post-HKFRS 16 basis). Pursuant to the merger, VHA was renamed as TPG.
Included in the current period balance are disposal gains of HK$25,259 million (HK$25,316 million at Post-HKFRS 16 basis) arising from disposal of interests in telecommunications tower assets in Sweden and Italy completed in January and June 2021 respectively and an impairment charge of HK$15,472 million (HK$15,472 million at Post-HKFRS 16 basis) against Wind Tre’s goodwill. Both amounts are at EBITDA and EBIT levels and are reported under “Telecommunications: CK Hutchison Group Telecom - Corporate and Others” in the segment results. In the consolidated income statement, the disposal gains are reported in “Other income and gains” and the impairment charge is reported under “Other expenses and losses”. See notes 6(f) and 15.
CKHH 2021 Interim Results Financial Statements
Page 50 of 104

5 Operating segment information (continued)
(b) Segment results, assets and liabilities (continued)
(xix) Segment assets and segment liabilities are measured in the same way as in the financial statements.
Segment assets are assets other than deferred tax assets, assets classified as held for sale, and investments in associated companies and interests in joint ventures.
Segment liabilities are liabilities other than bank and other debts, interest bearing loans from non-controlling shareholders, tax liabilities (including deferred tax liabilities), liabilities directly associated with assets classified as held for sale and other non-current liabilities.
The specified non-current assets are non-current assets other than financial instruments, deferred tax assets, post-employment benefit assets, and rights arising under insurance contracts. The geographical location of the specified non-current assets is based on the physical location of the asset (for fixed assets, right-of-use assets and other operating assets), the location of the operation in which they are allocated (for assets classified as held for sale, intangible assets and goodwill), and the location of operations (for associated companies and interests in joint ventures).
Geographical analysis of the Group’s non-current assets (based on Post-HKFRS 16 basis) other than financial instruments, deferred tax assets, post-employment benefit assets, and rights arising under insurance contracts is as follows:
30 June 31 December2021 2020
HK$ million HK$ million
Hong Kong 74,283 74,264 Mainland China 69,201 79,034
The People’s Republic of China 143,484 153,298
Europe 564,954 591,099
Canada 56,791 41,431 Asia, Australia and Others 190,434 193,953
812,179 826,483
955,663 979,781
(xx) Current and non-current borrowings comprise bank and other debts and interest bearing loans from non-controlling shareholders.
(xxi) For the purpose of segmental information analysis, expenditures incurred for leases are not regarded as capital expenditures.
(xxii) See note 23.
CKHH 2021 Interim Results Financial Statements
Page 51 of 104

5 Operating segment information (continued)
(c) Reconciliation from Pre-HKFRS 16 basis metrics to Post-HKFRS 16 basis metrics
(i) Consolidated income statement
Six months ended 30 June 2020Pre- Effect on Post- Pre- Effect on Post-
HKFRS 16 adoption of HKFRS 16 HKFRS 16 adoption of HKFRS 16 basis HKFRS 16 basis basis HKFRS 16 basis
HK$ million HK$ million HK$ million HK$ million HK$ million HK$ million
Revenue 135,496 - 135,496 124,651 - 124,651 Cost of inventories sold (49,097) 15 (49,082) (43,882) 15 (43,867) Staff costs (18,682) - (18,682) (17,642) - (17,642) Expensed customer acquisition and retention costs (8,195) 239 (7,956) (7,399) 215 (7,184) Depreciation and amortisation (13,594) (9,189) (22,783) (10,751) (9,025) (19,776) Other expenses and losses (52,176) 10,701 (41,475) (33,740) 10,391 (23,349) Other income and gains 26,577 57 26,634 11,757 81 11,838 Share of profits less losses of:
Associated companies 2,510 (60) 2,450 (3,353) (26) (3,379) Joint ventures 2,029 (57) 1,972 1,738 (119) 1,619
24,868 1,706 26,574 21,379 1,532 22,911 Interest expenses and other finance costs (3,516) (1,866) (5,382) (3,610) (1,777) (5,387)
Profit before tax 21,352 (160) 21,192 17,769 (245) 17,524 Current tax (1,829) (9) (1,838) (1,091) 18 (1,073) Deferred tax credit 2,047 13 2,060 222 22 244
Profit after tax 21,570 (156) 21,414 16,900 (205) 16,695
Profit attributable to non-controlling interests and holders of perpetual capital securities (3,127) 13 (3,114) (3,732) 37 (3,695)
Profit attributable to ordinary shareholders 18,443 (143) 18,300 13,168 (168) 13,000
Earnings per share for profit attributable to ordinary shareholders HK$ 4.78 (HK$ 0.03) HK$ 4.75 HK$ 3.41 (HK$ 0.04) HK$ 3.37
Six months ended 30 June 2021
CKHH 2021 Interim Results Financial Statements
Page 52 of 104

5 Operating segment information (continued)
(c) Reconciliation from Pre-HKFRS 16 basis metrics to Post-HKFRS 16 basis metrics (continued)
(ii) Consolidated statement of comprehensive income
Six months ended 30 June 2020Pre- Effect on Post- Pre- Effect on Post-
HKFRS 16 adoption of HKFRS 16 HKFRS 16 adoption of HKFRS 16 basis HKFRS 16 basis basis HKFRS 16 basis
HK$ million HK$ million HK$ million HK$ million HK$ million HK$ million
Profit after tax 21,570 (156) 21,414 16,900 (205) 16,695
Other comprehensive income (losses)
Items that will not be reclassified to profit or lossRemeasurement of defined benefit obligations recognised directly
in reserves 720 - 720 (574) - (574) Equity securities at FVOCI
Valuation gains (losses) recognised directly in reserves 193 - 193 (326) - (326) Share of other comprehensive income of associated companies 498 - 498 - - - Share of other comprehensive income of joint ventures 945 - 945 82 - 82 Tax relating to items that will not be reclassified to profit or loss (86) - (86) 127 - 127
2,270 - 2,270 (691) - (691)
Items that may be reclassified to profit or lossDebt securities at FVOCI
Valuation gains (losses) recognised directly in reserves (18) - (18) 62 - 62 Valuation losses (gains) previously in reserves recognised in income
statement (4) - (4) 89 - 89 Gains (losses) on cash flow hedges recognised directly in reserves 396 - 396 (162) - (162) Gains on net investment hedges recognised directly in reserves 97 - 97 3,097 - 3,097 Losses on translating overseas subsidiaries’ net assets recognised
directly in reserves (714) 403 (311) (2,868) 155 (2,713) Losses previously in reserves related to subsidiaries, associated
companies and joint ventures disposed during the period recognised in income statement 2,921 - 2,921 2,384 - 2,384
Share of other comprehensive income (losses) of associated companies 2,374 1 2,375 (2,245) 2 (2,243) Share of other comprehensive income (losses) of joint ventures 1,549 4 1,553 (2,997) 2 (2,995) Tax relating to items that may be reclassified to profit or loss (4) - (4) 9 - 9
6,597 408 7,005 (2,631) 159 (2,472)
Other comprehensive income (losses), net of tax 8,867 408 9,275 (3,322) 159 (3,163)
Total comprehensive income 30,437 252 30,689 13,578 (46) 13,532
Total comprehensive income attributable to non-controlling interests and holders of perpetual capital securities (4,125) (125) (4,250) (2,937) 13 (2,924)
Total comprehensive income attributable to ordinary shareholders 26,312 127 26,439 10,641 (33) 10,608
Six months ended 30 June 2021
CKHH 2021 Interim Results Financial Statements
Page 53 of 104

5 Operating segment information (continued)
(c) Reconciliation from Pre-HKFRS 16 basis metrics to Post-HKFRS 16 basis metrics (continued)
(iii) Consolidated statement of financial position
Pre- Effect on Post- Pre- Effect on Post-HKFRS 16 adoption of HKFRS 16 HKFRS 16 adoption of HKFRS 16
basis HKFRS 16 basis basis HKFRS 16 basisHK$ million HK$ million HK$ million HK$ million HK$ million HK$ million
Non-current assetsFixed assets 129,651 (1,465) 128,186 132,920 (819) 132,101 Right-of-use assets - 79,453 79,453 - 83,805 83,805 Leasehold land 6,726 (6,726) - 6,940 (6,940) - Telecommunications licences 70,342 - 70,342 66,944 - 66,944 Brand names and other rights 92,022 - 92,022 91,766 (313) 91,453 Goodwill 293,709 - 293,709 319,718 - 319,718 Associated companies 140,609 (312) 140,297 136,329 (253) 136,076 Interests in joint ventures 144,788 (931) 143,857 142,343 (878) 141,465 Deferred tax assets 20,716 1,799 22,515 18,015 1,911 19,926 Liquid funds and other listed investments 8,287 - 8,287 10,588 - 10,588 Other non-current assets 14,025 316 14,341 14,536 408 14,944
920,875 72,134 993,009 940,099 76,921 1,017,020 Current assetsCash and cash equivalents 182,129 - 182,129 155,951 - 155,951 Inventories 24,163 - 24,163 24,565 - 24,565 Trade receivables and other current assets 59,092 (2,773) 56,319 57,674 (1,865) 55,809
265,384 (2,773) 262,611 238,190 (1,865) 236,325 Assets classified as held for sale - - - 979 272 1,251
265,384 (2,773) 262,611 239,169 (1,593) 237,576 Current liabilities Bank and other debts 74,584 (134) 74,450 48,096 (75) 48,021 Current tax liabilities 2,104 (4) 2,100 2,646 (7) 2,639 Lease liabilities - 18,573 18,573 - 18,621 18,621 Trade payables and other current liabilities 100,818 (1,453) 99,365 105,576 (1,695) 103,881
177,506 16,982 194,488 156,318 16,844 173,162 Liabilities directly associated with assets classified as held for sale - - - 1 283 284
177,506 16,982 194,488 156,319 17,127 173,446 Net current assets 87,878 (19,755) 68,123 82,850 (18,720) 64,130 Total assets less current liabilities 1,008,753 52,379 1,061,132 1,022,949 58,201 1,081,150 Non-current liabilitiesBank and other debts 277,495 (619) 276,876 301,170 (120) 301,050 Interest bearing loans from non-controlling shareholders 779 - 779 798 - 798 Lease liabilities - 70,101 70,101 - 75,644 75,644 Deferred tax liabilities 18,722 (922) 17,800 18,573 (901) 17,672 Pension obligations 2,939 - 2,939 3,804 - 3,804 Other non-current liabilities 49,837 (18) 49,819 52,126 (7) 52,119
349,772 68,542 418,314 376,471 74,616 451,087
Net assets 658,981 (16,163) 642,818 646,478 (16,415) 630,063
Capital and reservesShare capital 3,848 - 3,848 3,856 - 3,856 Share premium 243,920 - 243,920 244,377 - 244,377 Reserves 278,102 (12,137) 265,965 258,327 (12,264) 246,063 Total ordinary shareholders’ funds 525,870 (12,137) 513,733 506,560 (12,264) 494,296 Perpetual capital securities 12,326 - 12,326 12,415 - 12,415 Non-controlling interests 120,785 (4,026) 116,759 127,503 (4,151) 123,352
Total equity 658,981 (16,163) 642,818 646,478 (16,415) 630,063
31 December 202030 June 2021
CKHH 2021 Interim Results Financial Statements
Page 54 of 104

5 Operating segment information (continued)
(c) Reconciliation from Pre-HKFRS 16 basis metrics to Post-HKFRS 16 basis metrics (continued)
(iv) Consolidated statement of cash flows
Six months ended 30 June 2020Pre- Effect on Post- Pre- Effect on Post-
HKFRS 16 adoption of HKFRS 16 HKFRS 16 adoption of HKFRS 16 basis HKFRS 16 basis basis HKFRS 16 basis
HK$ million HK$ million HK$ million HK$ million HK$ million HK$ million
(A) (B) (A) (B)Operating activitiesCash generated from operating activities before interest expenses
and other finance costs, tax paid and changes in working capital 30,018 10,479 40,497 27,184 10,463 37,647 Interest expenses and other finance costs paid (net of capitalisation) (3,518) (1,866) (5,384) (3,605) (1,777) (5,382) Tax paid (2,414) - (2,414) (2,143) - (2,143)
Funds from operations (Funds from operations under (B) is before principal elements of lease payments) 24,086 8,613 32,699 21,436 8,686 30,122
Changes in working capital (4,414) 615 (3,799) (2,168) 819 (1,349)
Net cash from operating activities 19,672 9,228 28,900 19,268 9,505 28,773
Investing activitiesPurchase of fixed assets (11,285) 682 (10,603) (9,325) 14 (9,311) Additions to telecommunications licences (4,737) - (4,737) (202) - (202) Additions to brand names and other rights (3,373) - (3,373) (749) - (749) Purchase of subsidiary companies, net of cash acquired 56 - 56 - - - Additions to unlisted investments (52) - (52) (2) - (2) Repayments of loans from associated companies and joint ventures 365 - 365 15 - 15 Purchase of and advances to associated companies and
joint ventures (571) - (571) (757) - (757) Proceeds from disposal of fixed assets 230 - 230 463 - 463 Proceeds from disposal of subsidiary companies, net of cash disposed 38,425 - 38,425 13 - 13 Proceeds from disposal / partial disposal of associated companies
and joint ventures 845 - 845 1,492 - 1,492
Cash flows from (used in) investing activities before additions to / disposal of liquid funds and other listed investments 19,903 682 20,585 (9,052) 14 (9,038)
Disposal of liquid funds and other listed investments 318 - 318 283 - 283 Additions to liquid funds and other listed investments (22) - (22) (1,595) - (1,595)
Cash flows from (used in) investing activities 20,199 682 20,881 (10,364) 14 (10,350) Net cash inflow before financing activities 39,871 9,910 49,781 8,904 9,519 18,423
Financing activitiesNew borrowings 43,897 (682) 43,215 28,803 - 28,803 Repayment of borrowings (37,744) 123 (37,621) (21,944) 10 (21,934) Principal elements of lease payments - (9,351) (9,351) - (9,529) (9,529) Issue of equity securities by subsidiary companies to non-controlling
shareholders 86 - 86 - - - Payment to acquire additional interests in subsidiary companies (1,955) - (1,955) (201) - (201) Proceeds from partial disposal of subsidiary company - - - 15 - 15 Proceeds on issue of perpetual capital securities by a subsidiary,
net of transaction costs 2,329 - 2,329 - - - Redemption of perpetual capital securities by a subsidiary (9,360) - (9,360) - - - Payments for buy-back and cancellation of issued shares (466) - (466) - - - Dividends paid to ordinary shareholders (6,555) - (6,555) (8,870) - (8,870) Dividends paid to non-controlling interests (3,590) - (3,590) (3,361) - (3,361) Distribution paid on perpetual capital securities (335) - (335) (326) - (326)
Cash flows used in financing activities (13,693) (9,910) (23,603) (5,884) (9,519) (15,403)
Increase in cash and cash equivalents 26,178 - 26,178 3,020 - 3,020 Cash and cash equivalents at 1 January 155,951 - 155,951 137,127 - 137,127
Cash and cash equivalents at 30 June 182,129 - 182,129 140,147 - 140,147
Analysis of cash, liquid funds and other listed investments at 30 JuneCash and cash equivalents, as above 182,129 - 182,129 140,147 - 140,147 Liquid funds and other listed investments 8,287 - 8,287 8,868 - 8,868 Total cash, liquid funds and other listed investments 190,416 - 190,416 149,015 - 149,015 Total principal amount of bank and other debts and unamortised
fair value adjustments arising from acquisitions 354,701 (753) 353,948 354,890 (217) 354,673 Interest bearing loans from non-controlling shareholders 779 - 779 736 - 736 Net debt 165,064 (753) 164,311 206,611 (217) 206,394 Interest bearing loans from non-controlling shareholders (779) - (779) (736) - (736) Net debt (excluding interest bearing loans from non-controlling
shareholders) 164,285 (753) 163,532 205,875 (217) 205,658
Six months ended 30 June 2021
CKHH 2021 Interim Results Financial Statements
Page 55 of 104

6 Presentation of other expenses and losses, other income and gains and cost of goods sold
2021 2020HK$ million HK$ million
Other expenses and losses:
Cost of providing services (a) 13,391 12,042
Office and general administrative expenses and others 3,824 5,384
Expenses for short-term, low-value assets leases and payment for variable rent
(see note 12(b)) 2,147 2,235
Advertising and promotion expenses 2,300 1,685
Legal and professional fees 827 695
Goodwill impairment (see note 15) 15,472 -
Foreign exchange reclassification adjustment (b) 3,514 -
Write-downs on certain non-strategic equity investments (see note 5(b)(xvii)) - 1,308
41,475 23,349
2021 2020HK$ million HK$ million
Other income and gains:
Rent concessions (c) (260) (362)
Employment and other subsidies (d) (734) (912)
Gains and losses on disposal of fixed assets (see note 11) (101) 16
Gains and losses on disposals of interests in associated companies and joint ventures (e) (223) (10,584)
Gains and losses on disposal of subsidiaries
European telecommunications tower assets (f) (25,316) -
Other businesses - 4
(26,634) (11,838)
2021 2020HK$ million HK$ million
Cost of goods sold:
included in “cost of inventories sold” 49,082 43,867
included in “expensed customer acquisition and retention costs” 5,013 4,422
54,095 48,289
(a) Cost of providing services of HK$13,391 million (30 June 2020: HK$12,042 million) includes telecommunication network related costs of HK$7,493 million (30 June 2020: HK$6,943 million), repair and maintenance of HK$2,978 million (30 June 2020: HK$2,650 million) and others of HK$2,920 million (30 June 2020: HK$2,449 million).
(b) The amount represents reclassification adjustment of foreign exchange losses previously recognised in reserves upon completion of the merger of Husky and Cenovus Energy in the current period.
(c) Benefits derived from changes in lease payments arising from COVID-19 related rent concessions.
(d) Benefits received from governments and other authorities under COVID-19 related employment and other support schemes.
(e) Comparative balance included dilution gain of HK$10,186 million arising from the merger of the Group’s former joint venture VHA and TPG Corporation Limited completed in the comparative period.
(f) The amount represents gains arising from the disposal of the Group’s interests in telecommunications tower assets supporting the Group’s mobile telecommunications businesses in Sweden and Italy completed in the current period.
Six months ended 30 June
This note provides additional details in respect of other expenses and losses, other income and gains and cost of goods sold. It follows the presentation format adopted in preparing the 2020 Annual Financial Statements. Accordingly, previously reported information in respect of the comparative period for these items have been reclassified to conform to this presentation.
Six months ended 30 June
Six months ended 30 June
CKHH 2021 Interim Results Financial Statements
Page 56 of 104
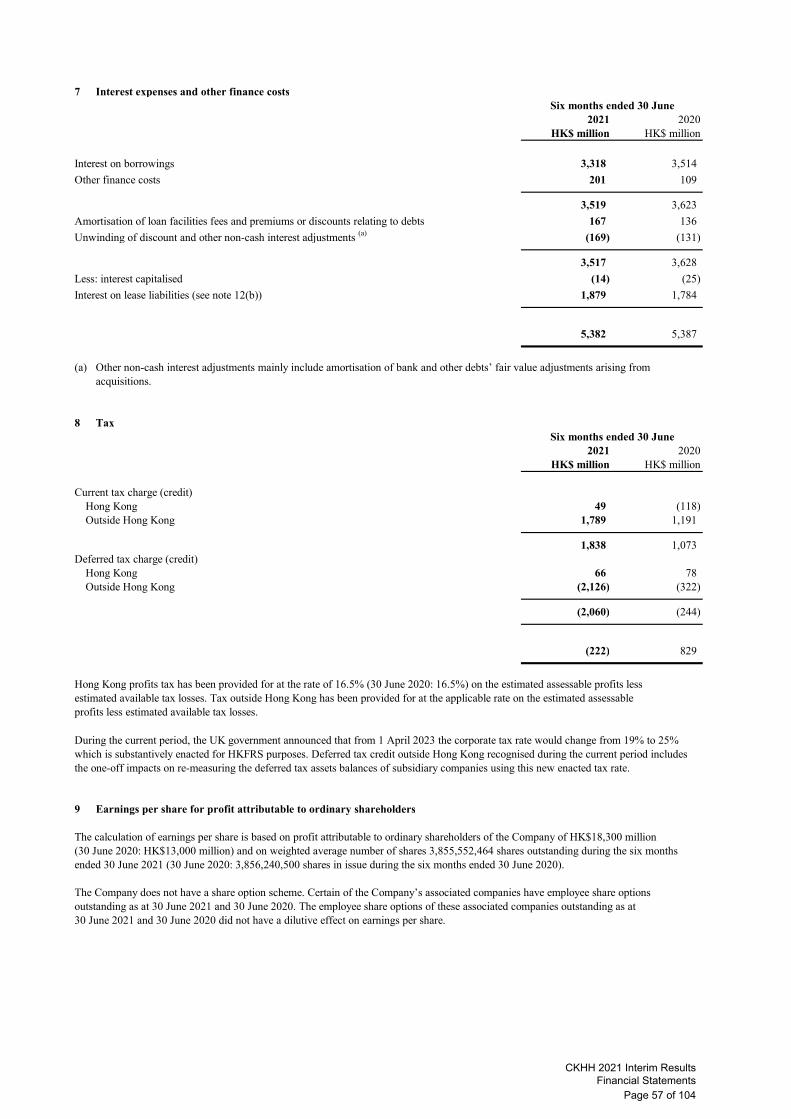
7 Interest expenses and other finance costs
2021 2020HK$ million HK$ million
Interest on borrowings 3,318 3,514
Other finance costs 201 109
3,519 3,623
Amortisation of loan facilities fees and premiums or discounts relating to debts 167 136
Unwinding of discount and other non-cash interest adjustments (a) (169) (131)
3,517 3,628
Less: interest capitalised (14) (25)
Interest on lease liabilities (see note 12(b)) 1,879 1,784
5,382 5,387
(a) Other non-cash interest adjustments mainly include amortisation of bank and other debts’ fair value adjustments arising from acquisitions.
8 Tax
2021 2020HK$ million HK$ million
Current tax charge (credit)Hong Kong 49 (118) Outside Hong Kong 1,789 1,191
1,838 1,073 Deferred tax charge (credit)
Hong Kong 66 78 Outside Hong Kong (2,126) (322)
(2,060) (244)
(222) 829
Hong Kong profits tax has been provided for at the rate of 16.5% (30 June 2020: 16.5%) on the estimated assessable profits lessestimated available tax losses. Tax outside Hong Kong has been provided for at the applicable rate on the estimated assessable profits less estimated available tax losses.
During the current period, the UK government announced that from 1 April 2023 the corporate tax rate would change from 19% to 25% which is substantively enacted for HKFRS purposes. Deferred tax credit outside Hong Kong recognised during the current period includes the one-off impacts on re-measuring the deferred tax assets balances of subsidiary companies using this new enacted tax rate.
9 Earnings per share for profit attributable to ordinary shareholders
The calculation of earnings per share is based on profit attributable to ordinary shareholders of the Company of HK$18,300 million (30 June 2020: HK$13,000 million) and on weighted average number of shares 3,855,552,464 shares outstanding during the six months ended 30 June 2021 (30 June 2020: 3,856,240,500 shares in issue during the six months ended 30 June 2020).
The Company does not have a share option scheme. Certain of the Company’s associated companies have employee share options outstanding as at 30 June 2021 and 30 June 2020. The employee share options of these associated companies outstanding as at 30 June 2021 and 30 June 2020 did not have a dilutive effect on earnings per share.
Six months ended 30 June
Six months ended 30 June
CKHH 2021 Interim Results Financial Statements
Page 57 of 104

10 Distributions and dividends
(a) Distribution paid on perpetual capital securities
2021 2020HK$ million HK$ million
Distribution paid on perpetual capital securities 335 326
(b) Dividends
2021 2020HK$ million HK$ million
Interim dividend, declared of HK$0.80 per share (30 June 2020: HK$0.614 per share) 3,079 2,368
In addition, final dividend in respect of the year 2020 of HK$1.70 per share totalling HK$6,555 million (2019: HK$2.30 per sharetotalling HK$8,870 million) was approved and paid during the current period.
11 Fixed assets
During the six months ended 30 June 2021, the Group has acquired fixed assets with a cost of HK$10,603 million (30 June 2020: HK$9,311 million). Fixed assets with a net book value of HK$131 million (30 June 2020: HK$479 million) were disposed of during the period, resulting in a gain of HK$101 million (30 June 2020: loss of HK$16 million) (see note 6).
Telecom-Land and munications Otherbuildings network assets assets Total
HK$ million HK$ million HK$ million HK$ millionAt 31 December 2020Cost 29,239 81,084 83,150 193,473 Accumulated depreciation and impairment (5,401) (26,632) (29,339) (61,372)
23,838 54,452 53,811 132,101
Opening net book value 23,838 54,452 53,811 132,101 Additions 485 1,766 8,352 10,603 Relating to subsidiaries acquired (see note 32(c)) 84 - 93 177 Disposals (26) (27) (78) (131) Relating to subsidiaries disposed (see note 32(d)) (98) (4,690) (44) (4,832) Depreciation charge for the period (548) (4,811) (3,651) (9,010) Transfer between categories (22) 5,225 (5,203) - Exchange translation differences (56) (668) 2 (722)
Closing net book value 23,657 51,247 53,282 128,186
At 30 June 2021Cost 30,063 77,942 86,589 194,594 Accumulated depreciation and impairment (6,406) (26,695) (33,307) (66,408)
23,657 51,247 53,282 128,186
Six months ended 30 June
Six months ended 30 June
Six months ended 30 June 2021
CKHH 2021 Interim Results Financial Statements
Page 58 of 104
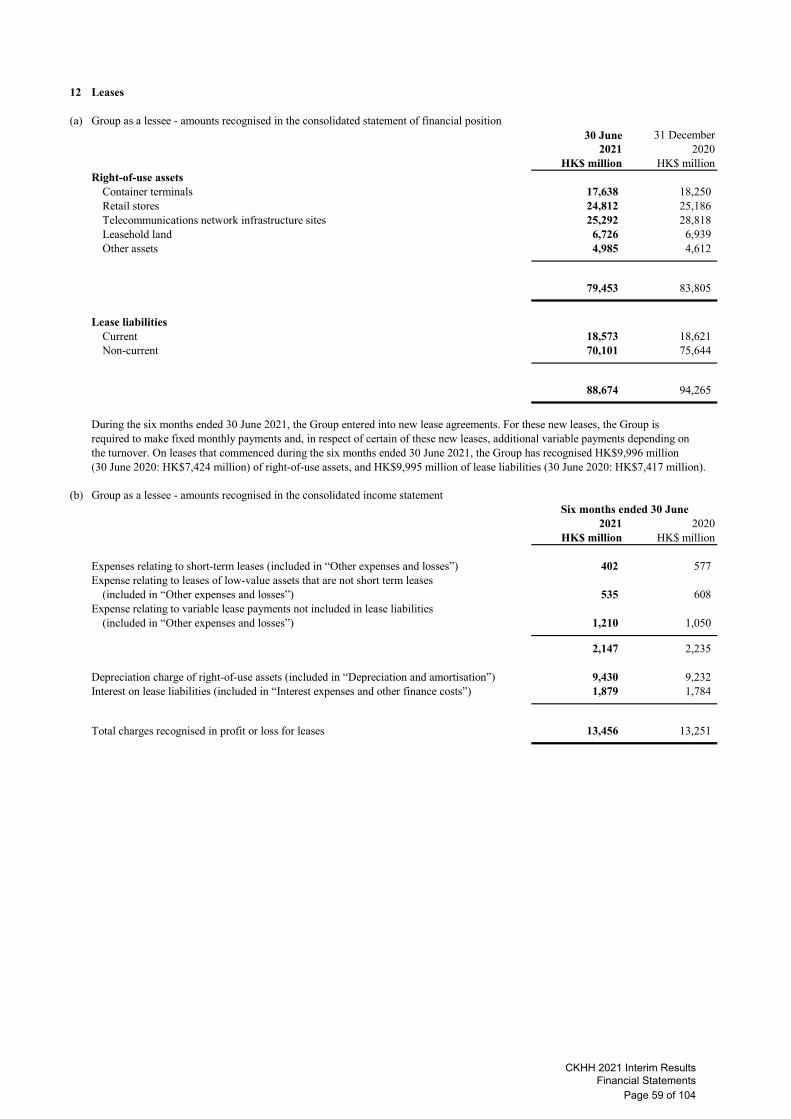
12 Leases
(a) Group as a lessee - amounts recognised in the consolidated statement of financial position30 June 31 December
2021 2020HK$ million HK$ million
Right-of-use assetsContainer terminals 17,638 18,250 Retail stores 24,812 25,186 Telecommunications network infrastructure sites 25,292 28,818 Leasehold land 6,726 6,939 Other assets 4,985 4,612
79,453 83,805
Lease liabilitiesCurrent 18,573 18,621 Non-current 70,101 75,644
88,674 94,265
During the six months ended 30 June 2021, the Group entered into new lease agreements. For these new leases, the Group isrequired to make fixed monthly payments and, in respect of certain of these new leases, additional variable payments depending on the turnover. On leases that commenced during the six months ended 30 June 2021, the Group has recognised HK$9,996 million(30 June 2020: HK$7,424 million) of right-of-use assets, and HK$9,995 million of lease liabilities (30 June 2020: HK$7,417 million).
(b) Group as a lessee - amounts recognised in the consolidated income statement
2021 2020HK$ million HK$ million
Expenses relating to short-term leases (included in “Other expenses and losses”) 402 577 Expense relating to leases of low-value assets that are not short term leases
(included in “Other expenses and losses”) 535 608 Expense relating to variable lease payments not included in lease liabilities
(included in “Other expenses and losses”) 1,210 1,050
2,147 2,235
Depreciation charge of right-of-use assets (included in “Depreciation and amortisation”) 9,430 9,232 Interest on lease liabilities (included in “Interest expenses and other finance costs”) 1,879 1,784
Total charges recognised in profit or loss for leases 13,456 13,251
Six months ended 30 June
CKHH 2021 Interim Results Financial Statements
Page 59 of 104

13 Telecommunications licences
During the six months ended 30 June 2021, the Group has acquired telecommunications licences with a cost of HK$4,737 million (30 June 2020: HK$202 million).
The Group’s telecommunications licences in the UK and Italy (except for a licence with carrying value at 30 June 2021 of HK$66 million (31 December 2020: HK$133 million)) are considered to have an indefinite useful life. As at 30 June 2021, telecommunications licenceswith indefinite useful life in the UK and Italy with a carrying value of HK$21,701 million and HK$36,328 million respectively (31 December 2020: HK$18,061 million and HK$37,231 million respectively) have been allocated to the Telecommunications segment.
HK$ millionAt 31 December 2020Cost 73,354 Accumulated amortisation (6,410)
66,944
Opening net book value 66,944 Additions 4,737 Amortisation for the period (755) Exchange translation differences (584)
Closing net book value 70,342
At 30 June 2021Cost 77,271 Accumulated amortisation (6,929)
70,342
14 Brand names and other rights
During the six months ended 30 June 2021, the Group has acquired brand names and other rights with a cost of HK$3,373 million (30 June 2020: HK$749 million).
Brand names are considered to have an indefinite useful life. The carrying value of brand names at 30 June 2021 of HK$50,600 million (31 December 2020: HK$50,741 million) and HK$19,735 million (31 December 2020: HK$19,913 million) has been allocated to Retail segment and the Telecommunications segment respectively.
Other rights primarily include operating, service content and connection rights of HK$11,982 million (31 December 2020: HK$10,135 million) and resource consents and customer lists of HK$9,487 million (31 December 2020: HK$10,440 million). Other rights are amortised over their finite useful lives.
Brand names Other rights TotalHK$ million HK$ million HK$ million
At 31 December 2020Cost 70,945 30,312 101,257 Accumulated amortisation (67) (9,737) (9,804)
70,878 20,575 91,453
Opening net book value 70,878 20,575 91,453 Additions - 3,373 3,373 Relating to subsidiaries acquired (see note 32(c)) - 12 12 Amortisation for the period (6) (1,688) (1,694) Relating to subsidiaries disposed (see note 32(d)) - (333) (333) Exchange translation differences (319) (470) (789)
Closing net book value 70,553 21,469 92,022
At 30 June 2021Cost 70,626 32,909 103,535 Accumulated amortisation (73) (11,440) (11,513)
70,553 21,469 92,022
Six months ended 30 June 2021
Six months ended 30 June 2021
CKHH 2021 Interim Results Financial Statements
Page 60 of 104
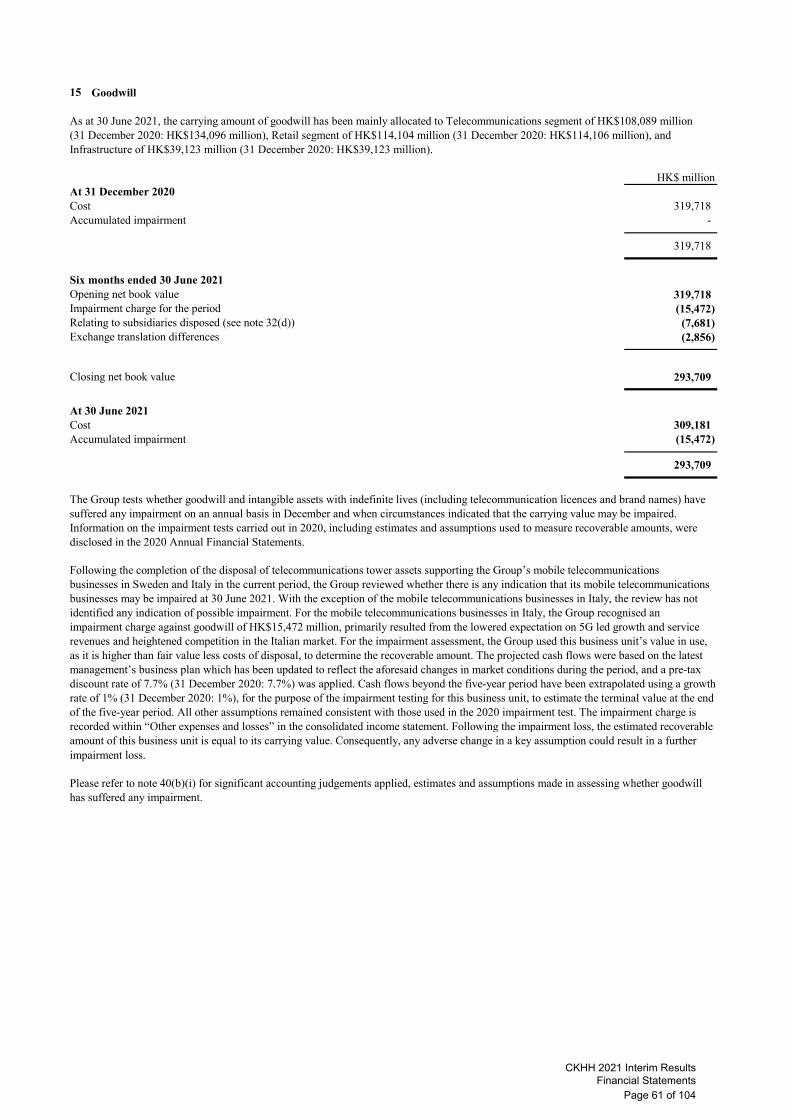
15 Goodwill
As at 30 June 2021, the carrying amount of goodwill has been mainly allocated to Telecommunications segment of HK$108,089 million (31 December 2020: HK$134,096 million), Retail segment of HK$114,104 million (31 December 2020: HK$114,106 million), and Infrastructure of HK$39,123 million (31 December 2020: HK$39,123 million).
HK$ millionAt 31 December 2020Cost 319,718 Accumulated impairment -
319,718
Opening net book value 319,718 Impairment charge for the period (15,472) Relating to subsidiaries disposed (see note 32(d)) (7,681) Exchange translation differences (2,856)
Closing net book value 293,709
At 30 June 2021Cost 309,181 Accumulated impairment (15,472)
293,709
The Group tests whether goodwill and intangible assets with indefinite lives (including telecommunication licences and brand names) have suffered any impairment on an annual basis in December and when circumstances indicated that the carrying value may be impaired. Information on the impairment tests carried out in 2020, including estimates and assumptions used to measure recoverable amounts, were disclosed in the 2020 Annual Financial Statements.
Following the completion of the disposal of telecommunications tower assets supporting the Group’s mobile telecommunications businesses in Sweden and Italy in the current period, the Group reviewed whether there is any indication that its mobile telecommunications businesses may be impaired at 30 June 2021. With the exception of the mobile telecommunications businesses in Italy, the review has not identified any indication of possible impairment. For the mobile telecommunications businesses in Italy, the Group recognised an impairment charge against goodwill of HK$15,472 million, primarily resulted from the lowered expectation on 5G led growth and service revenues and heightened competition in the Italian market. For the impairment assessment, the Group used this business unit’s value in use, as it is higher than fair value less costs of disposal, to determine the recoverable amount. The projected cash flows were based on the latest management’s business plan which has been updated to reflect the aforesaid changes in market conditions during the period, and a pre-tax discount rate of 7.7% (31 December 2020: 7.7%) was applied. Cash flows beyond the five-year period have been extrapolated using a growth rate of 1% (31 December 2020: 1%), for the purpose of the impairment testing for this business unit, to estimate the terminal value at the end of the five-year period. All other assumptions remained consistent with those used in the 2020 impairment test. The impairment charge is recorded within “Other expenses and losses” in the consolidated income statement. Following the impairment loss, the estimated recoverable amount of this business unit is equal to its carrying value. Consequently, any adverse change in a key assumption could result in a further impairment loss.
Please refer to note 40(b)(i) for significant accounting judgements applied, estimates and assumptions made in assessing whether goodwill has suffered any impairment.
Six months ended 30 June 2021
CKHH 2021 Interim Results Financial Statements
Page 61 of 104

16 Associated companies30 June 31 December
2021 2020HK$ million HK$ million
Unlisted shares 9,182 9,420 Listed shares, Hong Kong 62,919 61,070 Listed shares, outside Hong Kong 81,012 104,123 Share of undistributed post acquisition reserves (16,645) (42,262)
136,468 132,351 Amounts due from (net with amounts due to) associated companies 3,829 3,725
140,297 136,076
The Group’s associated company Husky and Cenovus Energy have completed the merger of their energy businesses in the current period. Following the completion of the merger the Group holds 15.71% in Cenovus Energy.
17 Interests in joint ventures30 June 31 December
2021 2020HK$ million HK$ million
Unlisted shares 98,874 98,594 Share of undistributed post acquisition reserves 5,879 3,854
104,753 102,448 Amounts due from (net with amounts due to) joint ventures 39,104 39,017
143,857 141,465
CKHH 2021 Interim Results Financial Statements
Page 62 of 104

18 Deferred tax30 June 31 December
2021 2020HK$ million HK$ million
Deferred tax assets 22,515 19,926 Deferred tax liabilities 17,800 17,672
Net deferred tax assets 4,715 2,254
Analysis of net deferred tax assets (liabilities):30 June 31 December
2021 2020HK$ million HK$ million
Tax losses 18,537 15,446 Accelerated depreciation allowances (3,848) (3,700) Fair value adjustments arising from acquisitions (11,553) (11,191) Revaluation of investment properties and other investments 35 39 Withholding tax on undistributed profits (363) (335) Other temporary differences 1,907 1,995
4,715 2,254
The deferred tax assets and liabilities are offset when there is a legally enforceable right to set off and when the deferred income taxes relate to the same fiscal authority. The amounts shown in the consolidated statement of financial position are determined after appropriate offset.
At 30 June 2021, the Group has recognised accumulated deferred tax assets amounting to HK$22,515 million (31 December 2020:HK$19,926 million) of which HK$19,500 million (31 December 2020: HK$16,856 million) relates to 3 Group Europe.
Unutilised tax losses, tax credits and other deductible temporary differences for which the Group has not recognised deferred tax assetstotalling HK$143,361 million (31 December 2020: HK$163,468 million). Their potential tax effect amounted to HK$33,181 million at30 June 2021 (31 December 2020: HK$37,268 million).
19 Liquid funds and other listed investments30 June 31 December
2021 2020HK$ million HK$ million
Financial assets at amortised cost
Managed funds - cash and cash equivalents, outside Hong Kong 48 50
Financial assets at FVOCI (a)
Listed equity securities, Hong Kong (b) 737 3,423
Listed equity securities, outside Hong Kong (b) 550 198
Managed funds - listed equity securities, outside Hong Kong (b) 259 226
Managed funds - listed debt securities, outside Hong Kong (c) 6,693 6,691
8,239 10,538
8,287 10,588
(a) The fair values are based on quoted market prices.
(b) These equity securities are not investments held for trading purpose. The Group made an irrevocable election at initial recognition to recognise and measure these investments at fair value through other comprehensive income. The Group considered this FVOCIcategory to be the most appropriate classification.
(c) Managed funds - listed debt securities comprised predominately US Treasury notes and government and government guaranteed notes.
CKHH 2021 Interim Results Financial Statements
Page 63 of 104

20 Other non-current assets30 June 31 December
2021 2020HK$ million HK$ million
Investment properties 396 396 Customer acquisition and retention costs (a) 3,921 4,095 Contract assets 3,164 3,345 Unlisted investments
Financial assets at amortised costs - debt securities (b) 185 179 Financial assets at FVOCI - equity securities (c) 2,388 2,347 Financial assets at FVPL - equity securities 2,630 2,614 Financial assets at FVPL - debt securities 170 358
Pension assets (see note 28) 120 158 Derivative financial instruments
Fair value hedges - Interest rate swaps - 108 Cash flow hedges - Other contracts 100 13 Net investment hedges
Forward foreign exchange contracts 22 85 Cross currency swaps 173 40
Other derivative financial instruments 756 823 Lease receivables 316 383
14,341 14,944
(a) Customer acquisition and retention costs primarily relate to incremental commission costs incurred to obtain telecommunications contractswith customers. The amount of customer acquisition and retention costs shown above is after deducting the amortisation charged to thecurrent period’s income statement of HK$1,894 million (30 June 2020: HK$1,155 million). Further, there was no impairment loss in relation to the cost capitalised. The Group applies the practical expedient in paragraph 94 of HKFRS 15, and recognises the incrementalcosts of obtaining contracts as an expense when incurred if the amortisation period of the costs that the Group otherwise would haverecognised is one year or less.
(b) The carrying value of the debt securities approximate their fair values as these investments bear floating interest rates and are repricedwithin one to six-month periods at the prevailing market interest rates.
(c) These equity securities are not investments held for trading purpose. The Group made an irrevocable election at initial recognition torecognise and measure these investments at fair value through other comprehensive income. The Group considered this FVOCI category to be the most appropriate classification. Fair value for these investments are determined by using valuation techniques, including discounted cashflow analysis.
21 Cash and cash equivalents30 June 31 December
2021 2020HK$ million HK$ million
Cash at bank and in hand 58,945 36,463 Short term bank deposits 123,184 119,488
182,129 155,951
The carrying amounts of cash and cash equivalents approximate their fair values.
CKHH 2021 Interim Results Financial Statements
Page 64 of 104
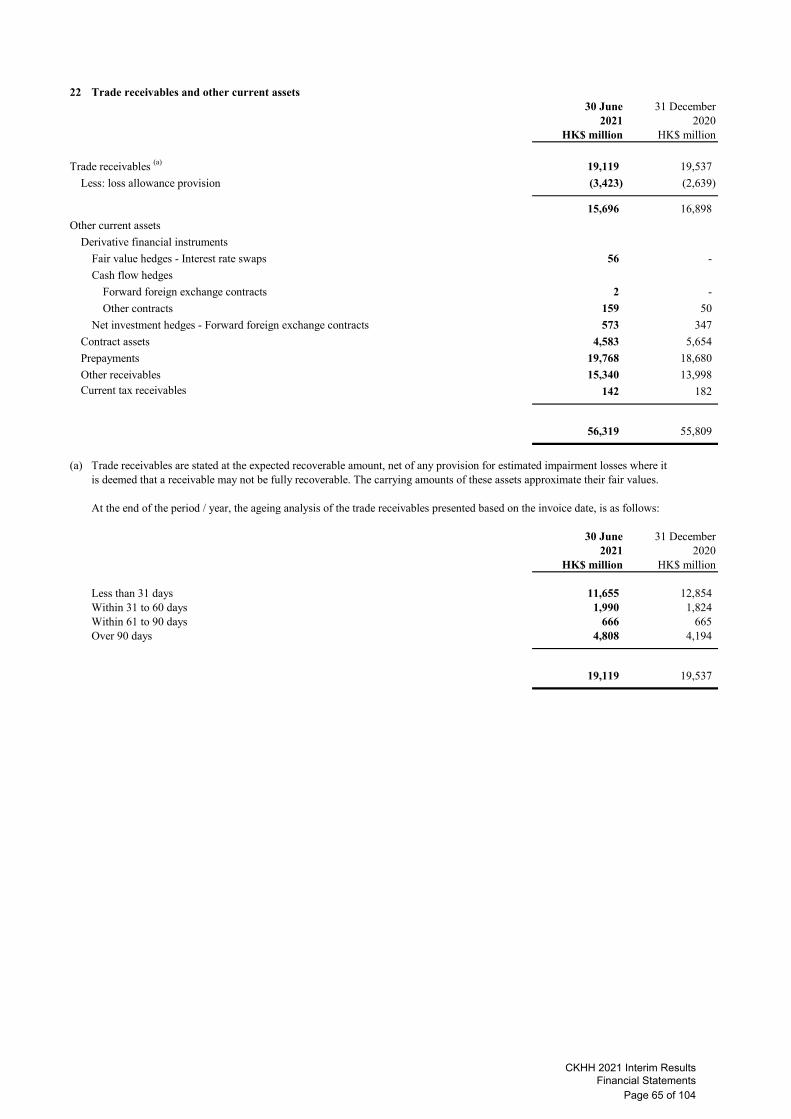
22 Trade receivables and other current assets30 June 31 December
2021 2020HK$ million HK$ million
Trade receivables (a) 19,119 19,537
Less: loss allowance provision (3,423) (2,639)
15,696 16,898
Other current assets
Derivative financial instruments
Fair value hedges - Interest rate swaps 56 -
Cash flow hedges
Forward foreign exchange contracts 2 -
Other contracts 159 50
Net investment hedges - Forward foreign exchange contracts 573 347
Contract assets 4,583 5,654
Prepayments 19,768 18,680
Other receivables 15,340 13,998 Current tax receivables 142 182
56,319 55,809
(a) Trade receivables are stated at the expected recoverable amount, net of any provision for estimated impairment losses where itis deemed that a receivable may not be fully recoverable. The carrying amounts of these assets approximate their fair values.
At the end of the period / year, the ageing analysis of the trade receivables presented based on the invoice date, is as follows:
30 June 31 December2021 2020
HK$ million HK$ million
Less than 31 days 11,655 12,854 Within 31 to 60 days 1,990 1,824 Within 61 to 90 days 666 665 Over 90 days 4,808 4,194
19,119 19,537
CKHH 2021 Interim Results Financial Statements
Page 65 of 104

23 Assets and liabilities classified as held for sale
In November 2020, CK Hutchison Group Telecom entered into agreements to dispose interests in its European telecommunications tower assets in six countries. The Denmark transaction, Austria transaction and Ireland transaction were completed in December 2020, and theSweden transaction and Italy transaction were completed during the current period. The UK transaction is currently undergoing regulatory approval.
The comparative balances at 31 December 2020 represented the assets and liabilities associated with the Sweden transaction which were classified for accounting purposes as disposal group held for sale as at that date. Following the completion of the Sweden transaction inJanuary 2021, the assets and liabilities associated with the Sweden transaction previously classified as held for sale were de-recognisedfrom the consolidated statement of financial position.
The major classes of assets and liabilities classified as held for sale at 31 December 2020 were as follows:
30 June 31 December2021 2020
HK$ million HK$ millionAssets
Fixed assets - 923 Right-of-use assets - 269 Deferred tax assets - 59
Assets classified as held for sale - 1,251
LiabilitiesLease liabilities - 283 Other non-current liabilities - 1
Liabilities directly associated with assets classified as held for sale - 284
Net assets directly associated with disposal group - 967
Cumulative amounts included in other comprehensive income:Exchange reserve surplus - 20
Reserves of disposal group classified as held for sale - 20
Disposal group held for sale is presented within total assets and total liabilities of “Telecommunications: CK Hutchison Group Telecom - 3 Group Europe” segment in note 5(b)(vi), 5(b)(vii) respectively and total assets of “Europe” in note 5(b)(xii).
CKHH 2021 Interim Results Financial Statements
Page 66 of 104

24 Bank and other debts
30 June 2021 31 December 2020Current Non-current Current Non-currentportion portion Total portion portion Total
HK$ million HK$ million HK$ million HK$ million HK$ million HK$ millionPrincipal amounts
Bank loans 27,251 83,402 110,653 27,222 94,078 121,300 Other loans 4 257 261 4 270 274 Notes and bonds 46,908 192,586 239,494 20,800 205,384 226,184
74,163 276,245 350,408 48,026 299,732 347,758 Unamortised fair value adjustments
arising from acquisitions 344 3,196 3,540 23 3,861 3,884
Subtotal before the following items 74,507 279,441 353,948 48,049 303,593 351,642
Unamortised loan facilities fees andpremiums or discounts related to debts (19) (2,565) (2,584) (28) (2,562) (2,590)
Adjustments to carrying amounts pursuant to unrealised gains (losses) on interest rate swap contracts (38) - (38) - 19 19
74,450 276,876 351,326 48,021 301,050 349,071
Bank and other debts at principal amount are scheduled for repayment by calendar year as follows:
Bank Other Notes andloans loans bonds Total
HK$ million HK$ million HK$ million HK$ million
2021, remainder of year 5,236 2 20,455 25,693 2022 26,358 4 30,352 56,714 2023 47,880 4 32,270 80,154 2024 25,043 174 32,382 57,599 2025 2,138 4 6,953 9,095 2026 to 2030 3,998 21 75,172 79,191 2031 to 2040 - 52 25,140 25,192 2041 and thereafter - - 16,770 16,770
110,653 261 239,494 350,408 Less: current portion (27,251) (4) (46,908) (74,163)
83,402 257 192,586 276,245
Bank Other Notes andloans loans bonds Total
HK$ million HK$ million HK$ million HK$ million
2021 27,222 4 20,800 48,026 2022 42,356 4 30,525 72,885 2023 34,709 4 32,925 67,638 2024 14,907 182 32,750 47,839 2025 2,106 5 7,125 9,236 2026 to 2030 - 21 71,781 71,802 2031 to 2040 - 54 18,578 18,632 2041 and thereafter - - 11,700 11,700
121,300 274 226,184 347,758 Less: current portion (27,222) (4) (20,800) (48,026)
94,078 270 205,384 299,732
30 June 2021
31 December 2020
CKHH 2021 Interim Results Financial Statements
Page 67 of 104

25 Trade payables and other current liabilities30 June 31 December
2021 2020HK$ million HK$ million
Trade payables (a) 25,225 25,042 Other current liabilities
Derivative financial instrumentsCash flow hedges
Interest rate swaps 8 - Cross currency interest rate swaps 424 481 Forward foreign exchange contracts - 4
Net investment hedgesForward foreign exchange contracts 72 1,023 Cross currency swaps - 7
Other derivative financial instruments - 4 Interest free loans from non-controlling shareholders 427 380 Contract liabilities 6,655 6,160 Obligations for telecommunications licences and other rights 1,425 1,342 Provisions (see note 26) 2,670 3,185 Expenses and other accruals 37,294 38,774 Other payables 25,165 27,479
99,365 103,881
(a) At the end of the period / year, the ageing analysis of the trade payables is as follows:
30 June 31 December2021 2020
HK$ million HK$ million
Less than 31 days 18,173 16,155 Within 31 to 60 days 2,874 3,769 Within 61 to 90 days 1,643 2,375 Over 90 days 2,535 2,743
25,225 25,042
26 Provisions30 June 31 December
2021 2020HK$ million HK$ million
Provision for commitments, onerous contracts and other guarantees 22,495 23,513 Closure obligation 98 92 Assets retirement obligation 1,669 2,163 Other provisions 1,239 1,402
25,501 27,170
Provisions are analysed as:Current portion (see note 25) 2,670 3,185 Non-current portion (see note 29) 22,831 23,985
25,501 27,170
The provision for commitments, onerous contracts and other guarantees represents the unavoidable costs of meeting these commitments and obligations after deducting the associated, expected future benefits and / or estimated recoverable value. The provision for closure obligations represents the estimated costs to execute integration plans and store closures. The provision for assets retirement obligations represents the present value of the estimated future costs of dismantling and removing fixed assets when they are no longer used and restoring the sites on which they are located.
CKHH 2021 Interim Results Financial Statements
Page 68 of 104

27 Interest bearing loans from non-controlling shareholders
At 30 June 2021, these loans bear interest at rates at EURIBOR+2.0% (31 December 2020: EURIBOR+2.0%) per annum. The carrying amounts of the borrowings approximate their fair values.
28 Pension obligations
The Group operates a number of defined benefit and defined contribution plans, the assets of which are held independently of the Group’s assets in trustee administered funds. The Group’s major defined benefit plans are in Hong Kong, the United Kingdom and the Netherlands. The amounts recognised in the consolidated statement of financial position are determined as follows:
30 June 31 December2021 2020
HK$ million HK$ million
Present value of defined benefit obligations 24,389 24,502 Fair value of plan assets 21,573 20,859
2,816 3,643 Restrictions on assets recognised 3 3
Net defined benefit liabilities 2,819 3,646
Amounts recognised in the consolidated statement of financial position are as follows:
Other non-current assets (see note 20) 120 158 Pension obligations 2,939 3,804
Net defined benefit liabilities 2,819 3,646
29 Other non-current liabilities30 June 31 December
2021 2020HK$ million HK$ million
Derivative financial instrumentsCash flow hedges
Interest rate swaps 329 436 Cross currency interest rate swaps 1,036 1,956
Net investment hedges - Cross currency swaps 495 773 Other derivative financial instruments 376 499
Obligations for telecommunications licences and other rights 7,408 7,666
Other non-current liabilities (a)15,178 14,638
Liabilities relating to the economic benefits agreements (b)2,166 2,166
Provisions (see note 26) 22,831 23,985
49,819 52,119
(a) Includes equipment purchase payables of HK$8,156 million (31 December 2020: HK$7,426 million).
(b) In October 2018, the Group completed the divesture of an aggregated 90% economic benefits in Australian Gas Networks. As part of the arrangement, upon the occurrence of certain events, the Group is required to return the consideration. The Group recognises liabilities measured by reference to the amount of consideration it received under this arrangement from entities outside the Group.
CKHH 2021 Interim Results Financial Statements
Page 69 of 104

30 Share capital, share premium and perpetual capital securities
(a) Share capital and share premiumShare Share
Number capital premium Totalof shares HK$ million HK$ million HK$ million
Authorised:Ordinary shares of HK$1 each 8,000,000,000 8,000 - 8,000
Issued and fully paid:Ordinary shares
At 1 January 2020, 31 December 2020 and 1 January 2021 3,856,240,500 3,856 244,377 248,233
Buy-back and cancellation of issued shares (i) (7,830,500) (8) (457) (465)
At 30 June 2021 3,848,410,000 3,848 243,920 247,768
(i) The Company acquired a total of 7,830,500 of its own ordinary shares through purchases on the Stock Exchange during the current period. The purchased shares were subsequently cancelled during the period. The total amount paid to acquire these shares was approximately HK$466 million, of which HK$465 million has been deducted from share capital and share premium, and HK$1 million has been deducted from retained profits.
(ii) On 2 July 2021, the Company acquired a total of 117,000 of its own ordinary shares through purchases on the Stock Exchange. The purchased shares were cancelled subsequent to the reporting date of 30 June 2021. The total amount paid to acquire these shares was approximately HK$7 million which will be deducted from share capital and share premium subsequent to the reporting date of 30 June 2021.
(b) Perpetual capital securities 30 June 31 December
2021 2020HK$ million HK$ million
US$1,000 million issued in 2017 7,842 7,842 EUR500 million issued in 2018 4,484 4,573
12,326 12,415
In May 2017 and December 2018, wholly owned subsidiary companies of the Group issued perpetual capital securities with nominalamount of US$1,000 million (approximately HK$7,800 million) and EUR500 million (approximately HK$4,475 million) respectively for cash.
These securities are perpetual, subordinated and the payment of distributions is optional in nature. Therefore, perpetual capital securities areclassified as equity instruments and recorded in equity in the consolidated statement of financial position.
CKHH 2021 Interim Results Financial Statements
Page 70 of 104
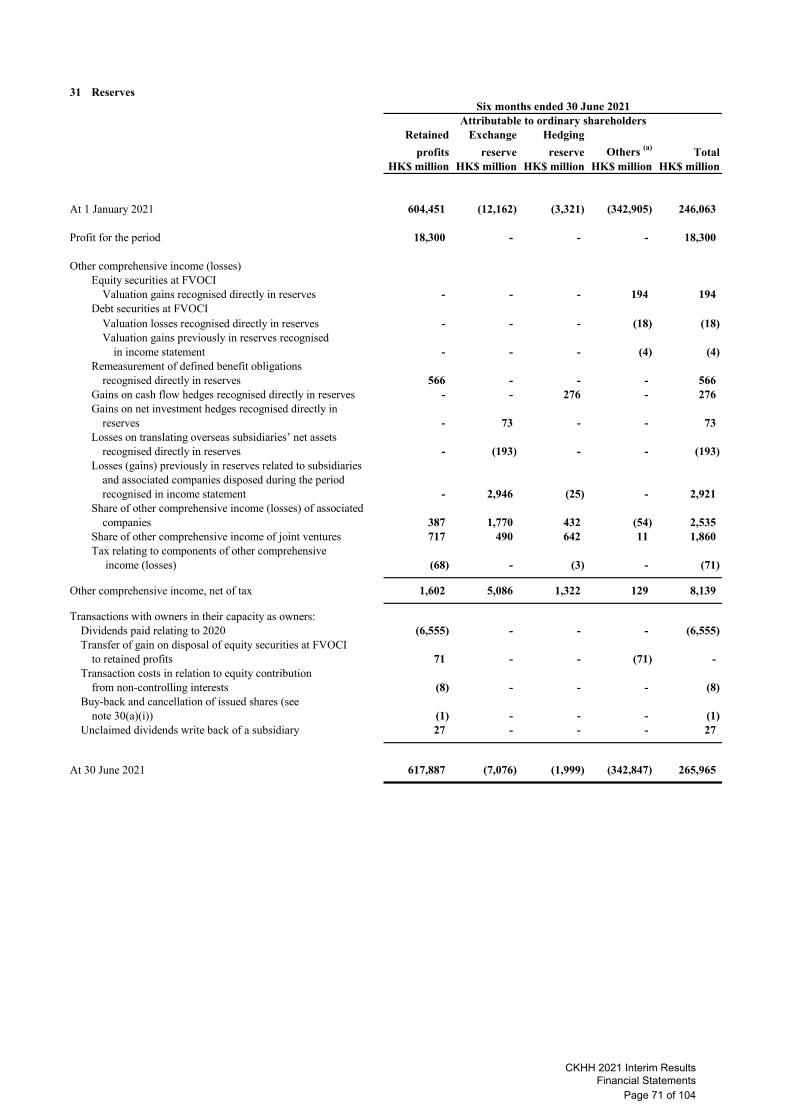
31 Reserves
Retained Exchange Hedging
profits reserve reserve Others (a) TotalHK$ million HK$ million HK$ million HK$ million HK$ million
At 1 January 2021 604,451 (12,162) (3,321) (342,905) 246,063
Profit for the period 18,300 - - - 18,300
Other comprehensive income (losses)Equity securities at FVOCI
Valuation gains recognised directly in reserves - - - 194 194 Debt securities at FVOCI
Valuation losses recognised directly in reserves - - - (18) (18) Valuation gains previously in reserves recognised
in income statement - - - (4) (4) Remeasurement of defined benefit obligations
recognised directly in reserves 566 - - - 566 Gains on cash flow hedges recognised directly in reserves - - 276 - 276 Gains on net investment hedges recognised directly in
reserves - 73 - - 73 Losses on translating overseas subsidiaries’ net assets
recognised directly in reserves - (193) - - (193) Losses (gains) previously in reserves related to subsidiaries
and associated companies disposed during the periodrecognised in income statement - 2,946 (25) - 2,921
Share of other comprehensive income (losses) of associated companies 387 1,770 432 (54) 2,535
Share of other comprehensive income of joint ventures 717 490 642 11 1,860 Tax relating to components of other comprehensive
income (losses) (68) - (3) - (71)
Other comprehensive income, net of tax 1,602 5,086 1,322 129 8,139
Transactions with owners in their capacity as owners:Dividends paid relating to 2020 (6,555) - - - (6,555) Transfer of gain on disposal of equity securities at FVOCI
to retained profits 71 - - (71) - Transaction costs in relation to equity contribution
from non-controlling interests (8) - - - (8) Buy-back and cancellation of issued shares (see
note 30(a)(i)) (1) - - - (1) Unclaimed dividends write back of a subsidiary 27 - - - 27
At 30 June 2021 617,887 (7,076) (1,999) (342,847) 265,965
Attributable to ordinary shareholdersSix months ended 30 June 2021
CKHH 2021 Interim Results Financial Statements
Page 71 of 104

31 Reserves (continued)
Attributable to ordinary shareholdersRetained Exchange Hedging
profits reserve reserve Others (a) TotalHK$ million HK$ million HK$ million HK$ million HK$ million
At 1 January 2020 592,705 (30,760) (1,513) (344,380) 216,052
Profit for the period 13,000 - - - 13,000
Other comprehensive income (losses)Equity securities at FVOCI
Valuation losses recognised directly in reserves - - - (290) (290) Debt securities at FVOCI
Valuation gains recognised directly in reserves - - - 62 62 Valuation losses previously in reserves recognised
in income statement - - - 89 89 Remeasurement of defined benefit obligations
recognised directly in reserves (453) - - - (453) Losses on cash flow hedges recognised directly in reserves - - (119) - (119) Gains on net investment hedges recognised directly in
reserves - 2,344 - - 2,344 Losses on translating overseas subsidiaries’ net assets
recognised directly in reserves - (2,076) - - (2,076) Losses (gains) previously in reserves related to subsidiaries,
associated companies and joint ventures disposed during the period recognised in income statement - 2,342 1 (1) 2,342
Share of other comprehensive income (losses) of associated companies (1) (1,261) (777) (107) (2,146)
Share of other comprehensive income (losses) of joint ventures 63 (1,539) (780) 2 (2,254) Tax relating to components of other comprehensive
income (losses) 101 - 8 - 109
Other comprehensive income (losses), net of tax (290) (190) (1,667) (245) (2,392)
Transactions with owners in their capacity as owners:Dividends paid relating to 2019 (8,870) - - - (8,870) Transfer of gain on disposal of equity securities at FVOCI
to retained profits 62 - - (62) - Relating to purchase of non-controlling interests - - - (202) (202) Relating to partial disposal of subsidiary companies - - - (10) (10)
At 30 June 2020 596,607 (30,950) (3,180) (344,899) 217,578
(a) Other reserves comprise revaluation reserve and other capital reserves. As at 30 June 2021, revaluation reserve deficit amountedto HK$1,621 million (1 January 2021: HK$1,712 million, 30 June 2020: HK$3,396 million and 1 January 2020: HK$3,111 million), and other capital reserves deficit amounted to HK$341,226 million (1 January 2021: HK$341,193 million, 30 June 2020:HK$341,503 million and 1 January 2020: HK$341,269 million). Included in the other capital reserves account is a deficit of HK$341,336 million, relating to the fair value of shares of Cheung Kong (Holdings) Limited, the former holding company of the Group, cancelled as part of the reorganisation completed in 2015. Revaluation surplus (deficit) arising from revaluation to market value of listed debt securities and listed equity securities are included in the revaluation reserve.
Six months ended 30 June 2020
CKHH 2021 Interim Results Financial Statements
Page 72 of 104

32 Notes to condensed consolidated statement of cash flows
(a) Reconciliation of profit after tax to cash generated from operating activities before interest expenses and other finance costs, tax paid and changes in working capital
2021 2020HK$ million HK$ million
Profit after tax 21,414 16,695 Less: share of profits less losses of
Associated companies (2,450) 3,379 Joint ventures (1,972) (1,619)
16,992 18,455 Adjustments for:
Current tax charge 1,838 1,073 Deferred tax credit (2,060) (244) Interest expenses and other finance costs 5,382 5,387 Depreciation and amortisation 22,783 19,776 Others - 11
EBITDA of Company and subsidiaries (i) 44,935 44,458 Dividends received from associated companies and joint ventures 5,240 5,006 Goodwill impairment (see note 15) 15,472 - Foreign exchange reclassification adjustment (see note 6(b)) 3,514 - Losses (gains) on disposal of fixed assets (101) 16 Gains and losses on disposals of interests in associated companies and joint ventures
(see note 6) (223) (10,584) Gains and losses on disposal of subsidiaries (see note 6)
European telecommunications tower assets (25,316) - Other businesses - 4
Customer acquisition and retention costs capitalised in the period (1,789) (1,551) Other non-cash items (1,235) 298
40,497 37,647
2021 2020HK$ million HK$ million
(i) Reconciliation of EBITDA:
EBITDA of Company and subsidiaries 44,935 44,458
Share of EBITDA of associated companies and joint venturesShare of profits less losses:
Associated companies 2,450 (3,379) Joint ventures 1,972 1,619
Adjustments for:Depreciation and amortisation 10,712 11,082 Interest expenses and other finance costs 4,008 4,238 Current tax charge 1,808 1,584 Deferred tax charge (credit) 2,500 (108) Non-controlling interests 265 178 Others - (11)
23,715 15,203
EBITDA (see notes 5(b)(ii)) 68,650 59,661
Six months ended 30 June
Six months ended 30 June
CKHH 2021 Interim Results Financial Statements
Page 73 of 104
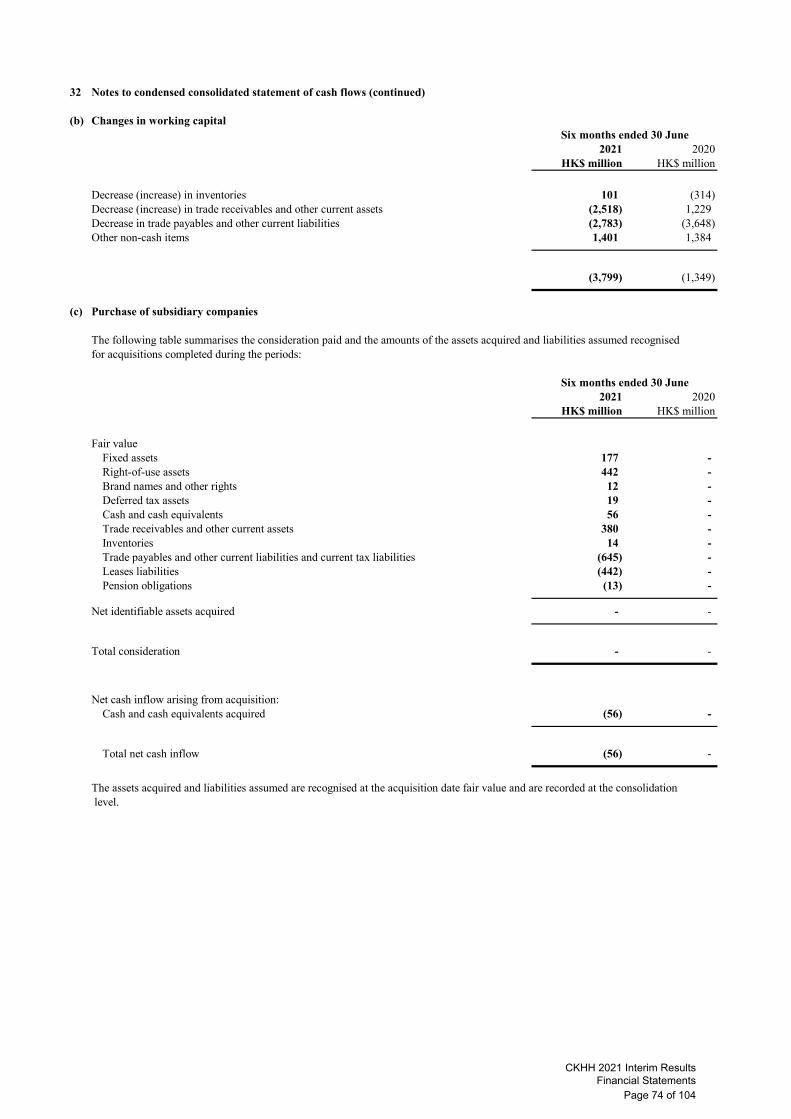
32 Notes to condensed consolidated statement of cash flows (continued)
(b) Changes in working capital
2021 2020HK$ million HK$ million
Decrease (increase) in inventories 101 (314) Decrease (increase) in trade receivables and other current assets (2,518) 1,229 Decrease in trade payables and other current liabilities (2,783) (3,648) Other non-cash items 1,401 1,384
(3,799) (1,349)
(c) Purchase of subsidiary companies
The following table summarises the consideration paid and the amounts of the assets acquired and liabilities assumed recognised for acquisitions completed during the periods:
2021 2020HK$ million HK$ million
Fair valueFixed assets 177 - Right-of-use assets 442 - Brand names and other rights 12 - Deferred tax assets 19 - Cash and cash equivalents 56 - Trade receivables and other current assets 380 - Inventories 14 - Trade payables and other current liabilities and current tax liabilities (645) - Leases liabilities (442) - Pension obligations (13) -
Net identifiable assets acquired - - -
Total consideration - -
Net cash inflow arising from acquisition:Cash and cash equivalents acquired (56) -
Total net cash inflow (56) -
The assets acquired and liabilities assumed are recognised at the acquisition date fair value and are recorded at the consolidation level.
Six months ended 30 June
Six months ended 30 June
CKHH 2021 Interim Results Financial Statements
Page 74 of 104

32 Notes to condensed consolidated statement of cash flows (continued)
(d) Disposal of subsidiary companies
2021 2020HK$ million HK$ million
Consideration received or receivableCash and cash equivalents 38,425 16
Total disposal consideration 38,425 16 Carrying amount of net assets disposed (13,696) (19) Cumulative exchange gain (loss) in respect of the net assets of subsidiaries
reclassified from equity to profit or loss on loss of control of subsidiaries 587 (1)
Gains (losses) on disposal 25,316 (4)
Net cash inflow (outflow) on disposal of subsidiariesCash and cash equivalents received as consideration 38,425 16 Less: Cash and cash equivalents disposed - (3)
Total net cash consideration 38,425 13
Analysis of assets and liabilities over which control was lostFixed assets 4,832 1 Right-of-use assets 4,238 4 Goodwill 7,681 - Brand names and other rights 333 - Deferred tax assets 58 - Trade receivables and other current assets 238 1 Inventories - 16 Assets classified as held for sale 1,241 - Trade payables and other current liabilities and current tax liabilities - (2) Leases liabilities (4,389) (4) Other non-current liabilities (252) - Liabilities directly associated with assets classified as held for sale (284) -
Net assets (excluding cash and cash equivalents) disposed 13,696 16 Cash and cash equivalents disposed - 3
Net assets disposed 13,696 19
The effect on the Group’s results from the subsidiaries disposed during the period are not material for the periods ended 30 June 2021 and 2020.
Disposal of subsidiary companies for the current period mainly related the disposal of interests in tower assets in Sweden and Italy. The gains (losses) on disposal for the six months ended 30 June 2021 and 30 June 2020 were recognised in the consolidated income statement and were included in the line item titled “Other income and gains”. See note 6(f).
Six months ended 30 June
CKHH 2021 Interim Results Financial Statements
Page 75 of 104
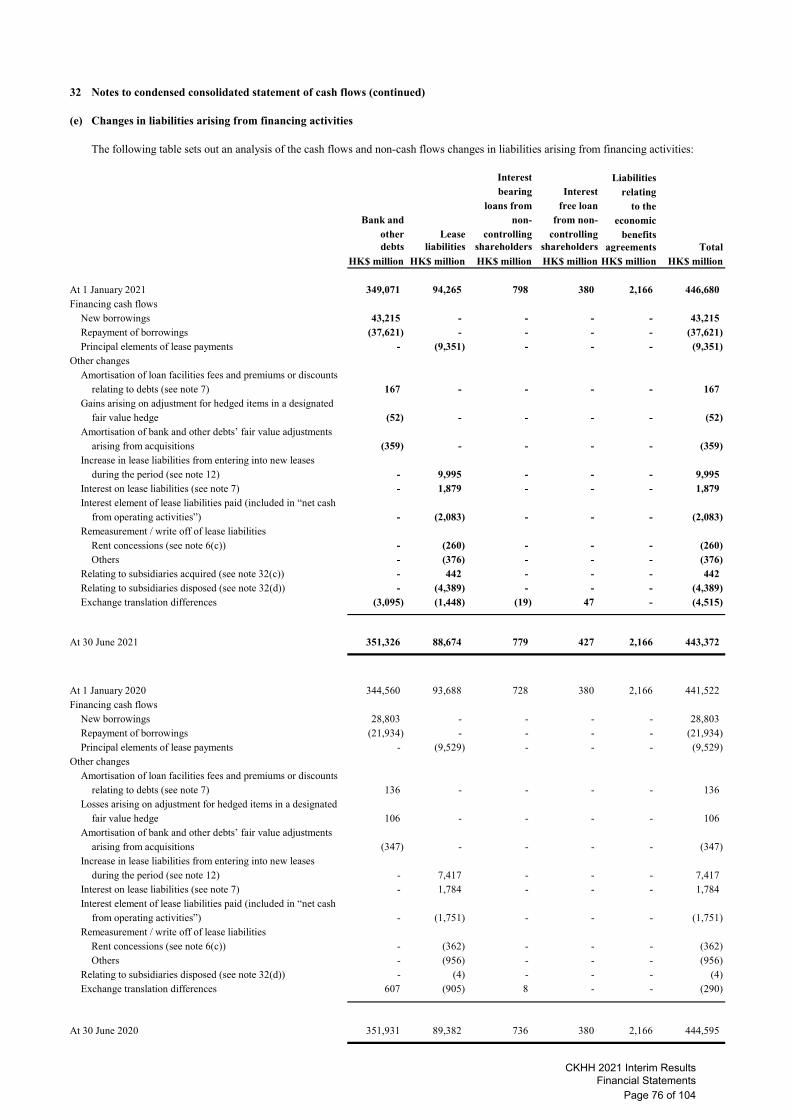
32 Notes to condensed consolidated statement of cash flows (continued)
(e) Changes in liabilities arising from financing activities
The following table sets out an analysis of the cash flows and non-cash flows changes in liabilities arising from financing activities:
Interest Liabilitiesbearing Interest relating
loans from free loan to theBank and non- from non- economic
other Lease controlling controlling benefitsdebts liabilities shareholders shareholders agreements Total
HK$ million HK$ million HK$ million HK$ million HK$ million HK$ million
At 1 January 2021 349,071 94,265 798 380 2,166 446,680 Financing cash flows
New borrowings 43,215 - - - - 43,215 Repayment of borrowings (37,621) - - - - (37,621) Principal elements of lease payments - (9,351) - - - (9,351)
Other changesAmortisation of loan facilities fees and premiums or discounts
relating to debts (see note 7) 167 - - - - 167 Gains arising on adjustment for hedged items in a designated
fair value hedge (52) - - - - (52) Amortisation of bank and other debts’ fair value adjustments
arising from acquisitions (359) - - - - (359) Increase in lease liabilities from entering into new leases
during the period (see note 12) - 9,995 - - - 9,995 Interest on lease liabilities (see note 7) - 1,879 - - - 1,879 Interest element of lease liabilities paid (included in “net cash
from operating activities”) - (2,083) - - - (2,083) Remeasurement / write off of lease liabilities
Rent concessions (see note 6(c)) - (260) - - - (260) Others - (376) - - - (376)
Relating to subsidiaries acquired (see note 32(c)) - 442 - - - 442 Relating to subsidiaries disposed (see note 32(d)) - (4,389) - - - (4,389) Exchange translation differences (3,095) (1,448) (19) 47 - (4,515)
At 30 June 2021 351,326 88,674 779 427 2,166 443,372
At 1 January 2020 344,560 93,688 728 380 2,166 441,522 Financing cash flows
New borrowings 28,803 - - - - 28,803 Repayment of borrowings (21,934) - - - - (21,934) Principal elements of lease payments - (9,529) - - - (9,529)
Other changesAmortisation of loan facilities fees and premiums or discounts
relating to debts (see note 7) 136 - - - - 136 Losses arising on adjustment for hedged items in a designated
fair value hedge 106 - - - - 106 Amortisation of bank and other debts’ fair value adjustments
arising from acquisitions (347) - - - - (347) Increase in lease liabilities from entering into new leases
during the period (see note 12) - 7,417 - - - 7,417 Interest on lease liabilities (see note 7) - 1,784 - - - 1,784 Interest element of lease liabilities paid (included in “net cash
from operating activities”) - (1,751) - - - (1,751) Remeasurement / write off of lease liabilities
Rent concessions (see note 6(c)) - (362) - - - (362) Others - (956) - - - (956)
Relating to subsidiaries disposed (see note 32(d)) - (4) - - - (4) Exchange translation differences 607 (905) 8 - - (290)
At 30 June 2020 351,931 89,382 736 380 2,166 444,595
CKHH 2021 Interim Results Financial Statements
Page 76 of 104
33 Contingent liabilities and guarantees
At 30 June 2021, CK Hutchison Holdings Limited, and its subsidiaries provide guarantees in respect of bank and other borrowing facilities to its associated companies and joint ventures of HK$6,912 million (31 December 2020: HK$7,022 million).
The amount utilised by its associated companies and joint ventures are as follows:
30 June 31 December2021 2020
HK$ million HK$ million
To associated companies 3,265 3,200
To joint ventures 3,101 3,046
At 30 June 2021, the Group had provided performance and other guarantees of HK$8,007 million (31 December 2020: HK$7,868 million).
34 Commitments
There have been no material changes in the total amount of capital commitments since 31 December 2020 except for the amounts taken up during the period in the normal course of business.
35 Related parties transactions
There have been no material changes in the total amount of outstanding balances with associated companies and joint ventures since31 December 2020.
Transactions between the Company and its subsidiaries have been eliminated on consolidation. Saved as disclosed elsewhere in the Interim Financial Statements, transactions between the Group and other related parties during the period are not significant to the Group.No transactions have been entered with the directors of the Company (being the key management personnel) during the period other than the emoluments paid to them (being the key management personnel compensation).
36 Legal proceedings
At 30 June 2021, the Group is not engaged in any material litigation or arbitration proceedings, and no material litigation or claim isknown by the Group to be pending or threatened against it.
CKHH 2021 Interim Results Financial Statements
Page 77 of 104

37 Fair value measurements
(a) Carrying amounts and fair values of financial assets and financial liabilities
The fair values of financial assets and financial liabilities, together with the carrying amounts in the consolidated statement of financial position, are as follows:
Carrying Fair Carrying FairClassification under amounts values amounts values
Note HKFRS 9 HK$ million HK$ million HK$ million HK$ million
Financial assetsLiquid funds and other listed investments
Cash and cash equivalents (included inManaged funds) 19 Amortised cost 48 48 50 50
Listed equity securities, Hong Kong 19 FVOCI 737 737 3,423 3,423 Listed equity securities, outside
Hong Kong 19 FVOCI 550 550 198 198 Listed equity securities
(included in Managed funds) 19 FVOCI 259 259 226 226 Listed debt securities
(included in Managed funds) 19 FVOCI 6,693 6,693 6,691 6,691 Unlisted investments
Unlisted debt securities 20 Amortised cost 185 185 179 179 Unlisted equity securities 20 FVOCI 2,388 2,388 2,347 2,347 Unlisted equity securities 20 FVPL 2,630 2,630 2,614 2,614 Unlisted debt securities 20 FVPL 170 170 358 358
Derivative financial instrumentsFair value hedges - Interest rate swaps 20 & 22 Fair value - hedges 56 56 108 108 Cash flow hedges
Forward foreign exchange contracts 22 Fair value - hedges 2 2 - - Other contracts 20 & 22 Fair value - hedges 259 259 63 63
Net investment hedges Forward foreign exchange contracts 20 & 22 Fair value - hedges 595 595 432 432 Cross currency swaps 20 Fair value - hedges 173 173 40 40
Other derivative financial instruments 20 FVPL 756 756 823 823 Lease receivables 20 Amortised cost 316 316 383 383 Cash and cash equivalents 21 Amortised cost 182,129 182,129 155,951 155,951 Trade receivables 22 Amortised cost 15,696 15,696 16,898 16,898 Other receivables 22 Amortised cost 15,340 15,340 13,998 13,998 Amount due from associated companies Amortised cost 4,365 4,365 4,442 4,442 Amount due from joint ventures Amortised cost 39,487 39,487 39,397 39,397
272,834 272,834 248,621 248,621
Financial liabilities
Bank and other debts (i) 24 Amortised cost 351,326 364,871 349,071 358,717 Trade payables 25 Amortised cost 25,225 25,225 25,042 25,042 Derivative financial instruments
Cash flow hedges Interest rate swaps 25 & 29 Fair value - hedges 337 337 436 436 Cross currency interest rate swaps 25 & 29 Fair value - hedges 1,460 1,460 2,437 2,437 Forward foreign exchange contracts 25 Fair value - hedges - - 4 4
Net investment hedgesForward foreign exchange contracts 25 Fair value - hedges 72 72 1,023 1,023 Cross currency swaps 25 & 29 Fair value - hedges 495 495 780 780
Other derivative financial instruments 25 & 29 FVPL 376 376 503 503 Interest free loans from non-controlling
shareholders 25 Amortised cost 427 427 380 380 Expenses and other accruals 25 Amortised cost 37,294 37,294 38,774 38,774 Other payables 25 Amortised cost 25,165 25,165 27,479 27,479 Lease liabilities 12 Amortised cost 88,674 88,674 94,265 94,265 Interest bearing loans from
non-controlling shareholders Amortised cost 779 779 798 798 Obligations for telecommunications licences
and other rights 25 & 29 Amortised cost 8,833 8,833 9,008 9,008 Liabilities relating to the economic benefits
agreements 29 Amortised cost 2,166 2,166 2,166 2,166 Amount due to associated companies Amortised cost 536 536 717 717 Amount due to joint ventures Amortised cost 383 383 380 380
543,548 557,093 553,263 562,909
(i)
30 June 2021 31 December 2020
The fair values of the bank and other debts are based on market quotes or estimated using discounted cash flow calculations based upon the Group’s current incremental borrowing rates for similar types of borrowings with maturities consistent with those remaining for the debt being valued.
CKHH 2021 Interim Results Financial Statements
Page 78 of 104

37 Fair value measurements (continued)
(a) Carrying amounts and fair values of financial assets and financial liabilities (continued)
Carrying Fair Carrying Fairamounts values amounts values
HK$ million HK$ million HK$ million HK$ million
Representing: Financial assets measured at
Amortised cost 257,566 257,566 231,298 231,298 FVOCI 10,627 10,627 12,885 12,885 FVPL 3,556 3,556 3,795 3,795 Fair value - hedges 1,085 1,085 643 643
272,834 272,834 248,621 248,621
Financial liabilities measured atAmortised cost 540,808 554,353 548,080 557,726 FVPL 376 376 503 503 Fair value - hedges 2,364 2,364 4,680 4,680
543,548 557,093 553,263 562,909
30 June 2021 31 December 2020
CKHH 2021 Interim Results Financial Statements
Page 79 of 104

37 Fair value measurements (continued)
(b) Financial assets and financial liabilities measured at fair value
Fair value hierarchy
The table below analyses recurring fair value measurements for financial assets and financial liabilities. These fair value measurementsare categorised into different levels in the fair value hierarchy based on the inputs to valuation techniques used. The different levelsare defined as follows:
Level 1: Quoted prices (unadjusted) in active markets for identical assets or liabilities;Level 2: Inputs other than quoted prices included within Level 1 that are observable for the assets or liabilities, either directly
(i.e. as prices) or indirectly (i.e. derived from prices); andLevel 3: Inputs for the assets or liabilities that are not based on observable market data (i.e. unobservable inputs).
Level 1 Level 2 Level 3 Total Level 1 Level 2 Level 3 Total
Note HK$ million HK$ million HK$ million HK$ million HK$ million HK$ million HK$ million HK$ million
Financial assets
Liquid funds and other listed investments
Listed equity securities, Hong Kong 19 737 - - 737 3,423 - - 3,423
Listed equity securities, outside
Hong Kong 19 550 - - 550 198 - - 198
Listed equity securities
(included in Managed funds) 19 259 - - 259 226 - - 226
Listed debt securities
(included in Managed funds) 19 6,693 - - 6,693 6,691 - - 6,691
Unlisted investments
Unlisted equity securities - FVOCI 20 - - 2,388 2,388 - - 2,347 2,347
Unlisted equity securities - FVPL 20 - 2,136 494 2,630 - 2,136 478 2,614
Unlisted debt securities 20 - - 170 170 - 180 178 358
Derivative financial instruments
Fair value hedges - Interest rate swaps 20 & 22 - 56 - 56 - 108 - 108
Cash flow hedges
Forward foreign exchange contracts 22 - 2 - 2 - - - -
Other contracts 20 & 22 - 259 - 259 - 63 - 63
Net investment hedges
Forward foreign exchange contracts 20 & 22 - 595 - 595 - 432 - 432
Cross currency swaps 20 - 173 - 173 - 40 - 40
Other derivative financial instruments 20 - 756 - 756 - 823 - 823
8,239 3,977 3,052 15,268 10,538 3,782 3,003 17,323
Financial liabilities
Derivative financial instruments
Cash flow hedges
Interest rate swaps 25 & 29 - 337 - 337 - 436 - 436
Cross currency interest rate swaps 25 & 29 - 1,460 - 1,460 - 2,437 - 2,437
Forward foreign exchange contracts 25 - - - - - 4 - 4
Net investment hedges
Forward foreign exchange contracts 25 - 72 - 72 - 1,023 - 1,023
Cross currency swaps 25 & 29 - 495 - 495 - 780 - 780
Other derivative financial instruments 25 & 29 - 376 - 376 - 503 - 503
- 2,740 - 2,740 - 5,183 - 5,183
During the six months ended 30 June 2021 and 2020, there were no transfers between the Level 1 and Level 2 fair value measurements, and no transfers into or out of Level 3 from or to Level 1 or Level 2 fair value measurements.
30 June 2021 31 December 2020
The fair value of financial assets and financial liabilities that are not traded in active market is determined by using valuation techniques. Specific valuation techniques used to value financial assets and financial liabilities include discounted cash flow analysis, are used to determine fair value for the financial assets and financial liabilities.
CKHH 2021 Interim Results Financial Statements
Page 80 of 104

37 Fair value measurements (continued)
(b) Financial assets and financial liabilities measured at fair value (continued)
Level 3 fair values
The movements of the balance of financial assets and financial liabilities measured at fair value based on Level 3 are as follows:
2021 2020HK$ million HK$ million
At 1 January 3,003 2,647 Total gains (losses) recognised in
Income statement - 113 Other comprehensive income (10) (48)
Additions 51 1 Exchange translation differences 8 (31)
At 30 June 3,052 2,682
Total gains recognised in income statement relating to those financial assets and financial liabilities held at the end of the reporting period - 113
The fair value of financial assets and financial liabilities that are grouped under Level 3 is determined by using valuation techniques including discounted cash flow analysis. In determining fair value, specific valuation techniques are used with reference to inputssuch as dividend stream and other specific input relevant to those particular financial assets and financial liabilities.
Changing unobservable inputs used in Level 3 valuation to reasonable alternative assumptions would not have significant impact onthe Group’s profit or loss.
38 US dollar equivalents
Amounts in these financial statements are stated in Hong Kong dollars (HK$), the functional currency of the Company. The translation into US dollars (US$) of these financial statements as of, and for the six months ended, 30 June 2021, is for convenience only and has been made at the rate of HK$7.8 to US$1. This translation should not be construed as a representation that the Hong Kong dollar amounts actually represented have been, or could be, converted into US dollars at this or any other rate.
39 Rounding of amounts
All amounts disclosed in the financial statements and notes have been rounded off to the nearest million currency units unless otherwise stated.
Six months ended 30 June
CKHH 2021 Interim Results Financial Statements
Page 81 of 104

40 Significant accounting judgements, estimates and assumptions
In applying the Group’s accounting policies, which are described in note 41, the directors are required to make judgements that have a significant impact on the amounts recognised and to make estimates and assumptions about the carrying amounts of assets and liabilitiesthat are not readily apparent from other sources. The estimates and associated assumptions are based on historical experience and otherfactors that are considered to be relevant and reasonable under the circumstance. Although our current estimates contemplate current and,as applicable, expected future conditions, it is reasonably possible that actual conditions could differ from our expectations. Uncertainty about these judgements, estimates and assumptions could result in outcomes that require a material adjustment to the carrying amount of assets or liabilities affected and the amount and timing of results of operations, cash flows and disclosures in future periods.
(a) Significant judgements in applying the Group’s accounting policies
The following are the significant judgements, apart from those involving estimations (which are presented separately below), that the directors have made in the process of applying the Group’s accounting policies and that have the most significant effect on theamounts recognised in financial statements.
(i) Basis of consolidation and classification of investee entities
The determination of the Group’s level of control over another entity will require exercise of judgement under certain circumstances. The Company controls an entity when it is exposed, or has rights, to variable returns from its involvement with the investee and has the ability to affect those returns through its power over the investee. The Group also considers, in particular, whether it obtains benefits, including non-financial benefits, from its power to control the entity. As such, the classification of the entity as a subsidiary, a joint venture, a joint operation, an associate or a cost investment might require the application of judgement through the analysis of various indicators, such as the percentage of ownership interest held in the entity, the representation on the entity’s board of directors and various other factors including, if relevant, the existence of agreement with other shareholders, applicable statutes and regulations and their requirements, the practical ability to exercise control.
(ii) Allocation of revenue for bundled telecommunications transactions with customers
The Group has bundled transactions under contract with customers including sales of both services and hardware (for example handsets). Revenue is allocated to the respective element in an amount that reflects the consideration to which the Group expects to be entitled in exchange for the services and device. Device revenue is recognised at the inception of the contract upon delivery to the customer and services revenue is recognised throughout the contract period as the services areprovided. Significant judgement is required in assessing fair values of both of these elements by considering inter alia, standalone selling price, the consideration to which the Group expects to be entitled in exchange for transferring the services and hardware to the customer, and other relevant observable market data. Changes in the allocation may cause the revenue recognised for sales of services and hardware to change individually but not the total bundled revenue from a specific customer throughout its contract term. The Group periodically re-assesses the allocation of the elements as a result of changes in market conditions.
(iii) Determination of lease term
In determining the lease term, the Group considers all facts and circumstances that create an economic incentive to exercise an extension option, or not exercise a termination option. Extension options (or periods after termination options) are only included in the lease term if the lease is reasonably certain to be extended (or not terminated). The following factors are
normally the most relevant:
• If there are significant penalties to terminate (or not extend), the Group is typically reasonably certain to extend (or not terminate).
• If any leasehold improvements are expected to have a significant remaining value, the Group is typically reasonably certain to extend (or not terminate).
• Otherwise, the Group considers other factors including historical lease durations and the costs and business disruptionrequired to replace the leased asset.
The lease term is reassessed if an option is actually exercised (or not exercised) or the Group becomes obliged to exercise (or not exercise) it. The assessment of reasonable certainty is only revised if a significant event or a significant change in circumstances occurs, which affects this assessment, and that is within the control of the lessee.
CKHH 2021 Interim Results Financial Statements
Page 82 of 104

40 Significant accounting judgements, estimates and assumptions (continued)
(a) Significant judgements in applying the Group’s accounting policies (continued)
(iv) Business combinations
As disclosed in note 41(c), the Group applies the provisions of HKFRS 3 to transactions and other events that meet the definition of a business combination within the scope of HKFRS 3. When the Group completes a business combination, the identifiable assets acquired and the liabilities assumed, including intangible assets, contingent liabilities and commitments, are recognised at their fair value. Judgement is required to determine the fair values of the assets acquired, the liabilities assumed, the date of acquisition, and the purchase consideration, and on the allocation of the purchase consideration to theidentifiable assets and liabilities. If the purchase consideration exceeds the fair value of the net assets acquired then the incremental amount paid is recognised as goodwill. If the purchase price consideration is lower than the fair value of the net assets acquired then the difference is recorded as a gain in the income statement. Allocation of the purchase consideration between finite lived assets and indefinite lived assets such as goodwill affects the subsequent results of the Group as finite lived intangible assets are amortised, whereas indefinite lived intangible assets, including goodwill, are not amortised.
(b) Key sources of estimation uncertainty
The key assumptions concerning the future and other key sources of estimation uncertainty at the reporting date, that have a significant risk of causing a material adjustment to the carrying amounts of assets and liabilities within the next financial year, aredescribed below.
The Group based its estimates and assumptions on parameters available when the consolidated financial statements were prepared. Existing circumstances and assumptions about future developments, however, may change due to market changes or circumstances arising that are beyond the control of the Group. Revisions to accounting estimates and assumptions are recognised prospectively and could impact fair value and carrying amounts of assets and liabilities, amount and timing of results of operations and cash flows in future periods.
(i) Impairment of goodwill and long-lived assets
Goodwill and intangible assets that have an indefinite useful life (including telecommunication licences and brand names) arenot subject to amortisation and are tested for impairment annually and when there is indication that the asset may be impaired. Other assets are reviewed for impairment to determine whether there is any indication that the carrying value of these assets may not be recoverable and have suffered an impairment loss. If any such indication exists, the recoverable amount of the asset is estimated in order to determine the extent, if any, of the impairment loss. An impairment loss is recognised for the amount by which the asset’s carrying amount exceeds its recoverable amount. The recoverable amount is the higher of an asset’s fair value less costs of disposal and value in use. For the purposes of assessing impairment, assets are grouped at the lowest levels for which there are separately identifiable cash inflows which are largely independent of thecash inflows from other assets or groups of assets (cash-generating units). Non-financial assets other than goodwill that suffered an impairment are reviewed for possible reversal of the impairment at the end of each reporting period.
In assessing whether these assets have suffered any impairment, the carrying value of the asset or its respective businessunit is compared with its recoverable amount, which is the higher of the fair value less costs of disposal and value in use. Fair value is derived, when available and appropriate, by making reference to performance metrics (such as revenue, EBITDA, earnings) and valuation multiples (such as EV/EBITDA, EV/S, P/E) of completed transactions of comparable businesses or comparable public companies, or by making reference to traded prices and with consideration for possiblepremiums, or is measured using discounted cash flow projections (Level 3 of the HKFRS 13 fair value hierarchy). The selection of comparable companies requires management judgement and is based on a number of factors, including comparable companies’ location, sizes, growth rates, industries, and development stages.
In determining the value in use of the investment, discounted cash flow models will be used to estimate the present value of the estimated future cash flows expected to be generated from the operations and from the ultimate disposal of the investment. The cash flows used in the financial projections (discounted cash flow models) are based on the latest approved financial budgets for the next five years. The Group prepared the financial budgets reflecting current and prior year performances and experience, market development expectations, including the expected market share and growth momentum, and where available and appropriate, observable market data. There are a number of estimates and assumptions involved for the preparation of the budget, the cash flow projections for the period covered by the approved budget and the estimated terminal value at the endof the budget period. Significant estimates and assumptions inherent in the discounted cash flow models include the amount and timing of future cash flows attributable to the respective business unit. Other key estimates and assumptions, where applicable, include the respective business unit’s projected revenue, costs, gross margin, inventory level, working capital and capital investments, as well as the discount rate and long term growth rate applied, and the estimated terminal value assumptions.
It is reasonably possible that the judgements, estimates and assumptions described above could change in future periods. Further, unanticipated market or macroeconomic events and circumstances may occur, which could affect the accuracy or validity of the estimates and assumptions. Changes to the judgements, estimates and assumptions can significantly affect the carrying amount of the investment in future periods.
CKHH 2021 Interim Results Financial Statements
Page 83 of 104

40 Significant accounting judgements, estimates and assumptions (continued)
(b) Key sources of estimation uncertainty (continued)
(ii) Impairment assessment on investment accounted for using equity method
Investments accounted for using equity method are subject to impairment testing requirements. The requirements to test for impairment are applied to the net investment in the equity accounted investee. Fair value adjustments and goodwill recognised on acquisitions of equity-accounted investees are not recognised separately. Goodwill recognised on acquisitions of an equity-accounted investee is not subject to annual impairment test. Instead, after applying equity accounting method, the net investment is tested for impairment when there is an indication of possible impairment. The guidance in HKAS 28 “Investments in Associates and Joint Ventures” is used to determine whether it is necessary to perform an impairment test for investments in equity-accounted investees. If there is an indication of impairment, then the impairment test applied follows the principles in HKAS 36 “Impairment of Assets”.
In assessing whether these assets have suffered any impairment, the net investment is compared with its recoverable amount, which is the higher of the fair value less costs of disposal and value in use. Fair value is derived, when available andappropriate, by making reference to performance metrics (such as revenue, EBITDA, earnings) and valuation multiples (EV/EBITDA, EV/S, P/E) of completed transactions of comparable businesses or comparable public companies, or by making reference to traded prices and with consideration for possible premiums, or, where financial projections are available, is measured using discounted cash flow projections (Level 3 of the HKFRS 13 fair value hierarchy). The selection of comparable companies requires management judgement and is based on a number of factors, including comparable companies’ location, sizes, growth rates, industries, and development stages.
In determining the value in use of the investment in an equity-accounted investee, discounted cash flow models will be usedto estimate (i) the Group’s share of the present value of the estimated future cash flows expected to be generated by theassociate or joint venture, including the cash flows from the operations of the associate or joint venture and from the ultimate disposal of the investment; or (ii) the present value of the estimated future cash flows to the Group expected to arise from dividends to be received from the investment and from its ultimate disposal.
Significant estimates and assumptions inherent in the discounted cash flow models include the amount and timing of future cash flows attributable to the estimated future cash flows expected to be generated by the associate or joint venture, including the cash flows from the operations of the associate or joint venture, the present value of the estimated future cashflows to the Group expected to arise from dividends to be received from the investment and the ultimate disposal of the investment. Other key estimates and assumptions, where applicable, include estimates of the investee’s projected revenue, costs, gross margin, inventory level, working capital and capital investments, as well as the discount rate and long term growth rate applied, and, where applicable, dividend yield, and the estimated terminal value assumptions.
It is reasonably possible that the judgements, estimates and assumptions described above could change in future periods. Further, unanticipated market or macroeconomic events and circumstances may occur, which could affect the accuracy or validity of the estimates and assumptions. Changes to the judgements. estimates and assumptions can significantly affect the carrying amount of the investment in future periods.
(iii) Pension costs and estimation of defined benefit pension obligation
The Group operates several defined benefit plans. Pension costs for defined benefit plans are assessed using the projected unit credit method in accordance with HKAS 19, “Employee Benefits”. Under this method, the cost of providing pensions is charged to the income statement so as to spread the regular cost over the future service lives of employees in accordance with the advice of the actuaries who carry out a full valuation of the plans. The liability or asset recognised in the consolidated statement of financial position in respect of defined benefit pension plans is the present value of the defined benefit obligation at the end of the reporting period less the fair value of the plan assets. The present value of the defined benefit obligation is measured by discounting the estimated future cash outflows using interest rates determined by reference to market yields at the end of the reporting period based on government agency or high quality corporate bonds with currency and term similar to the estimated term of benefit obligations. Remeasurements arising from defined benefit plans are recognised in other comprehensive income in the period in which they occur and reflected immediately in retained profit. Remeasurements comprise actuarial gains and losses, the return on plan assets (excluding amounts included in net interest on the net defined benefit liability (asset)) and any change in the effect of the asset ceiling (excluding amounts included in net interest on the net defined benefit liability (asset)).
Management appoints actuaries to carry out full valuations of these pension plans to determine the pension obligations that are required to be disclosed and accounted for in the financial statements in accordance with the HKFRS requirements.
The actuaries use assumptions and estimates in determining the fair value of the defined benefit plans and evaluate and update these assumptions on an annual basis. Judgement is required to determine the principal actuarial assumptions todetermine the present value of defined benefit obligations and service costs. Changes to the principal actuarial assumptionscan significantly affect the present value of plan obligations and service costs in future periods.
CKHH 2021 Interim Results Financial Statements
Page 84 of 104
40 Significant accounting judgements, estimates and assumptions (continued)
(b) Key sources of estimation uncertainty (continued)
(iv) Provisions for commitments, onerous contracts and other guarantees
The Group has entered into a number of procurement, supply and other contracts related to specific assets in the ordinarycourse of its business and provided guarantees in respect of bank and other borrowing facilities to associated companies and joint ventures. Where the unavoidable costs of meeting the obligations under these procurement and supply contracts exceed the associated, expected future net benefits, an onerous contract provision is recognised, or where the borrowingassociated companies and joint ventures are assessed to be unable to repay the indebtedness that the Group has guaranteed, a provision is recognised. The calculation of these provisions will involve the use of estimates and assumptions. These onerous provisions are calculated by taking the unavoidable costs that will be incurred under the contract and deducting any estimate revenues or predicted income to be derived from the assets, or by taking the unavoidable costs that will be incurred under the guarantee and deducting any estimated recoverable value from the investment in such associated companies and joint ventures.
(v) Provision for income tax and recognition of deferred tax asset
The Group is subject to income taxes in numerous jurisdictions. Significant judgement and estimate are required in determining the worldwide provision for income taxes. There are many transactions and calculations for which the ultimate tax determination is uncertain during the ordinary course of business. The Group recognises liabilities for anticipated tax audit issues based on estimates of whether additional taxes will be due. Where the final tax outcome of these matters is different from the amounts that were previously recorded, such differences will impact the income tax and deferred tax provisions in the period in which such determination is made.
Deferred tax is recognised, using the liability method, on temporary differences arising between the tax bases of assets and liabilities and their carrying values in the financial statements. Deferred tax assets are recognised to the extent it is probable that future taxable profits will be available against which the deductible temporary differences and the carry forward of unused tax losses and tax credits can be utilised, based on all available evidence. Recognition primarily involves judgement regarding the future financial performance of the particular legal entity or tax group. A variety of other factors are also evaluated in considering whether there is convincing evidence that it is probable that some portion or all of the deferred tax assets will ultimately be realised, such as the existence of taxable temporary differences, group relief, tax planning strategies and the periods in which estimated tax losses can be utilised.
The ultimate realisation of deferred tax assets recognised for certain of the Group’s businesses depends principally on thesebusinesses maintaining profitability and generating sufficient taxable profits to utilise the underlying unused tax losses. It may be necessary for some or all of the deferred tax assets recognised to be reduced and charged to the income statement if there is a significant adverse change in the projected performance and resulting projected taxable profits of these businesses. Judgement is required to determine key assumptions adopted in the taxable profit and loss projections and changes to key assumptions used and estimates made can significantly affect these taxable profit and loss projections.
(vi) Estimation of useful life: Fixed assets
Depreciation of operating assets constitutes a substantial operating cost for the Group. The cost of fixed assets is charged asdepreciation expense over the estimated useful lives of the respective assets using the straight-line method. The Group periodically reviews changes in technology and industry conditions, asset retirement activity and residual values to determine adjustments to estimated remaining useful lives and depreciation rates. Actual economic lives may differ from estimated useful lives. Periodic reviews could result in a change in depreciable lives and therefore depreciation expense in future periods.
(vii) Estimation of useful life: Telecommunications licences, other licences, brand names, trademarks and other rights
Telecommunications licences, other licences, brand names, trademarks and other rights with a finite useful life are carried at cost less accumulated amortisation and are reviewed for impairment annually. Telecommunications licences, other licences, brand names, trademarks and other rights that are considered to have an indefinite useful life are not amortised and are tested for impairment annually and when there is indication that they may be impaired. Certain brand names related to Retail and Telecommunications are considered to have an indefinite useful life as there is no foreseeable limit to the period over which they are expected to generate net cash inflows.
Judgement is required to estimate the useful lives of the telecommunications licences, other licences, brand names, trademarks and other rights. The actual economic lives of these assets may differ from the current contracted or expected usage periods, which could impact the amount of amortisation expense charged to the income statement. In addition, governments from time to time revise the terms of licences to change, amongst other terms, the contracted or expected licence period, which could also impact the amount of amortisation expense charged to the income statement.
CKHH 2021 Interim Results Financial Statements
Page 85 of 104

40 Significant accounting judgements, estimates and assumptions (continued)
(b) Key sources of estimation uncertainty (continued)
(viii) Estimation of the amortisation period: Customer acquisition and retention costs
In accordance with HKFRS 15, customer acquisition and retention costs, which comprise the net costs to acquire and retain customers, are expensed and recognised in the income statement in the period in which they are incurred, where (i) the costs are incurred; (ii) the costs are incremental of obtaining a contract and they are expected to be recovered; and (iii) the costs relate directly to the contract, generate resources used in satisfying the contract and are expected to be recovered, then they are capitalised and amortised over the customer contract period. Appropriate allowances are recognised if the carrying amounts of the capitalised costs exceed the remaining amount that the Group expects to receive less any directly related costs that have not been recognised as expenses.
Judgement is required to determine the amount of the provision and the amortisation period. The actual amount to be received from the customer and customer period may differ from the expected amount and the contract periods, which could impact the amount of expense charged to the income statement.
41 Significant accounting policies
In the current period, the Group has adopted two amendments to HKFRSs, namely (i) Amendments to HKFRS 9, HKAS 39, HKFRS 7, HKFRS 4 and HKFRS 16: Interest Rate Benchmark Reform — Phase 2, and (ii) Amendment to HKFRS 16: COVID-19-Related Rent Concessions beyond 30 June 2021.
Interest Rate Benchmark Reform — Phase 2
The Interest Rate Benchmark Reform amendments to HKFRSs were issued by HKICPA in two phases. The Phase 1 amendments deal with pre-replacement issues (issues affecting financial reporting in the period before the replacement of an existing interest rate benchmark). The Phase 1 amendments provide temporary exceptions to specific hedge accounting requirements, to avoid entities having to discontinue hedging relationships solely due to the uncertainty arising from the reform of interest rate benchmarks. Theseamendments apply to annual reporting periods beginning on or after 1 January 2020, and were addressed in Amendments to HKFRS 7, HKFRS 9 and HKAS 39: Interest Rate Benchmark Reform, which the Group had adopted in 2020.
The Phase 2 amendments address issues that might affect financial reporting during the reform of interest rate benchmarks, including the effects of changes to contractual cash flows or hedging relationships arising from the replacement of an interest rate benchmark with an alternative benchmark rate (replacement issues). The Phase 2 amendments are effective for annual periods beginning on or after 1 January 2021 and are to be applied retrospectively. Restatement of prior periods is not required.
The Interest Rate Benchmark Reform — Phase 2 amendments include the following practical expedients:• A practical expedient to require contractual changes, or changes to cash flows that are directly required by the reform of
interest rate benchmarks, to be treated as changes to a floating interest rate, equivalent to a movement in a market rate ofinterest.
• Permit changes required by reform of interest rate benchmarks to be made to hedge designation and hedge documentation without the hedging relationship being discontinued.
• Provide temporary relief to entities from having to meet the separately identifiable requirement when an alternative nearly risk-free interest rate instrument is designated as a hedge of a risk component.
The Phase 2 amendments had no impact on the Interim Financial Statements. The Group intends to use the practical expedients in future periods if they become applicable.
COVID-19-Related Rent Concessions beyond 30 June 2021
The Group has early adopted Amendment to HKFRS 16: COVID-19-Related Rent Concessions beyond 30 June 2021 ahead of its effective date. The amendment extends, by one year, the original amendment issued by HKICPA in June 2020. It permits lessees, as a practical expedient, not to assess whether particular rent concessions occurring as a direct consequence of the COVID-19 pandemic are lease modifications and instead to account for those rent concessions as if they are not lease modifications. The amendment does not affect lessors. The amount recognised in profit or loss for the reporting period arising from application of the practical expedient is set out in note 6 to the Interim Financial Statements.
The adoption of these two amendments to HKFRSs does not have a material impact on the Group’s 2021 financial statements. Other than these changes the accounting policies and methods of computation used in the preparation of the Interim Financial Statements are consistent with those used in the 2020 Annual Financial Statements.
CKHH 2021 Interim Results Financial Statements
Page 86 of 104

41 Significant accounting policies (continued)
New standards and interpretations not yet adopted
Certain new accounting standards and interpretations have been published that are not mandatory for the current reporting periodand have not been early adopted by the Group. These standards are not expected to have a material impact on the Group in the current or future reporting periods and on foreseeable future transactions.
Set out below is a description of the significant accounting policies adopted in the preparation of these financial statements to the extent they have not already been disclosed in the other notes elsewhere in these financial statements. These policies have been consistently applied to all the periods presented, unless otherwise stated.
(a)
Subsidiaries are entities over which the Group has control. The Group controls an entity when the Group is exposed to, or has rights to, variable returns from its involvement with the entity and has the ability to affect those returns through its power to direct the activities of the entity. Subsidiaries are fully consolidated from the date on which control is transferred to the Group. They are deconsolidated from the date that control ceases. The acquisition method of accounting is used to account for business combinations by the Group.
Intercompany transactions, balances and unrealised gains on transactions between group companies are eliminated. Unrealised losses are also eliminated unless the transaction provides evidence of an impairment of the transferred asset. Accounting policies of subsidiaries have been changed where necessary to ensure consistency with the policies adopted by the Group.
Non-controlling interests in the results and equity of subsidiaries are shown separately in the consolidated income statement, consolidated statement of comprehensive income, consolidated statement of changes in equity and consolidated statement of financial position respectively.
(b)
Associates are entities over which the Group has significant influence but not control or joint control. This is generally the case where the Group holds between 20% and 50% of the voting rights.
A joint arrangement is an arrangement of which two or more parties have joint control and over which none of the participating parties has unilateral control. Investments in joint arrangements are classified either as joint operations or joint ventures, depending on the contractual rights and obligations each investor has. Joint operations arise where the investors have rights to the assets and obligations for the liabilities of an arrangement. The Group recognises its direct right to the assets, liabilities, revenue and expenses of joint operations and its share of any jointly held or incurred assets, liabilities, revenues and expenses. Joint ventures arise where the investors have rights to the net assets of the arrangement.
The results and net assets of associated companies and joint ventures are incorporated in these financial statements using the equity method of accounting, except when the investment is classified as held for sale, in which case it is accounted for under HKFRS 5, Non-current assets held for sale and discontinued operations. The total carrying amount of such investments is reducedto recognise any identified impairment loss in the value of individual investments.
Under the equity method, an investment in an associated company or a joint venture is recognised initially in the consolidated statement of financial position at cost and adjusted thereafter to recognise the Group’s share of the profit or loss and other comprehensive income of the associated company or joint venture. When the Group’s share of losses of an associated company or a joint venture exceeds the Group’s interest in that associate or joint venture (which includes any long-term interests that, in substance, form part of the Group’s net investment in the associated company or joint venture), the Group discontinues recognising its share of further losses. Additional losses are recognised only to the extent that the Group has incurred legal or constructive obligations or made payments on behalf of the associated company or joint venture.
An investment in an associated company or a joint venture is accounted for using the equity method from the date on which the investee becomes an associate or a joint venture. On acquisition of the investment in an associate or a joint venture, any excess ofthe cost of the investment over the Group’s share of the net fair value of the identifiable assets and liabilities of the investee isrecognised as goodwill, which is included within the carrying amount of the investment. Any excess of the Group’s share of the net fair value of the identifiable assets and liabilities over the cost of the investment, after reassessment, is recognised immediately in profit or loss in the period in which the investment is acquired.
Associated companies and joint arrangements
Subsidiary companies
CKHH 2021 Interim Results Financial Statements
Page 87 of 104

41 Significant accounting policies (continued)
(c)
The Group applies the provisions of HKFRS 3, Business combinations, to transactions and other events that meet the definition ofa business combination within the scope of HKFRS 3. Where the acquisition method of accounting is used to account for businesscombinations, the consideration transferred is the sum of the acquisition date fair values of the assets transferred, equity instruments issued or liabilities incurred by the Group to former owners of the acquiree and the amount of any non-controlling interest in the acquiree. For each business combination, the non-controlling interest in the acquiree is measured at either fair value or at the proportionate share of the acquiree’s identifiable net assets. Acquisition-related costs are generally recognised in profit or loss as incurred.
The difference between the fair value of the consideration transferred, the amount of any non-controlling interest in the acquiree and the fair value of any pre-existing investment in the acquiree over the acquisition date fair value of assets acquired and the liabilities assumed is recognised as goodwill. If the consideration transferred and the fair value of pre-existing investment in the acquiree is less than the fair value of the identifiable net assets acquired, being a bargain purchase to the Group, the difference is recognised as a gain directly in profit or loss by the Group on the acquisition date, but only after a reassessment of the identification and measurement of the net assets acquired, the non-controlling interest in the acquiree, if any, the considerationtransferred and the Group’s previously held equity interest in the acquiree. When the consideration transferred by the Group in a business combination includes a contingent consideration arrangement, thecontingent consideration is measured at its acquisition-date fair value and included as part of the consideration transferred in abusiness combination. Changes in fair value of the contingent consideration that qualify as measurement period adjustments areadjusted retrospectively, with corresponding adjustments against goodwill. Measurement period adjustments are adjustmentsthat arise from additional information obtained during the ‘measurement period’ (which cannot exceed one year from theacquisition date) about facts and circumstances that existed at the acquisition date.
The subsequent accounting for changes in the fair value of the contingent consideration that do not qualify as measurement period adjustments depends on how the contingent consideration is classified. Contingent consideration that is classified as equity is not remeasured at subsequent reporting dates and its subsequent settlement is accounted for within equity. Other contingent consideration is remeasured to fair value at subsequent reporting dates with changes in fair value recognised in profit or loss.
When a business combination is achieved in stages, the Group’s previously held interests (including joint operations) in the acquired entity are remeasured to its acquisition-date fair value and the resulting gain or loss, if any, is recognised in profit or loss.Amounts arising from interests in the acquiree prior to the acquisition date that have previously been recognised in other comprehensive income are reclassified to profit or loss, where such treatment would be appropriate if that interest were disposed of.
Business combinations are initially accounted for on a provisional basis. The Group retrospectively adjusts the provisional amounts recognised and also recognises additional assets or liabilities during the measurement period (see above), based on new information obtained about the facts and circumstances that existed as of the acquisition date.
(d) Goodwill
Goodwill is initially recognised and measured as set out in note 41(c) Business combinations.
Goodwill is not amortised but is subject to impairment test annually and when there is indication that the carrying value may not be recoverable. For the purpose of impairment testing, goodwill is allocated to each of the Group’s cash-generating units (or groups of cash-generating units) expected to benefit from the synergies of the combination. Cash-generating units to which goodwill has been allocated are tested for impairment annually, or more frequently when there is an indication that the unit may beimpaired. If the recoverable amount of the cash-generating unit is less than the carrying amount of the unit, the impairment loss isallocated first to reduce the carrying amount of any goodwill allocated to the unit and then to the other assets of the unit pro-rataon the basis of the carrying amount of each asset in the unit. An impairment loss recognised for goodwill is not reversed in a subsequent period.
On disposal of a cash-generating unit, the attributable amount of goodwill is included in the determination of the profit or loss on disposal (but does not include any attributable goodwill previously eliminated against reserves).
The Group’s policy for goodwill arising on the acquisition of an associate and a joint venture is described in note 41(b) above.
(e) Non-current assets (or disposal groups) held for sale and discontinued operations
Non-current assets (or disposal groups) are classified as held for sale if their carrying amount will be recovered principally through asale transaction rather than through continuing use and a sale is considered highly probable. They are measured at the lower of their carrying amount and fair value less costs to sell, except for assets such as deferred tax assets, assets arising from employee benefits, financial assets and investment property that are carried at fair value and contractual rights under insurance contracts, which are specifically exempt from this requirement.
Business combinations
CKHH 2021 Interim Results Financial Statements
Page 88 of 104

41 Significant accounting policies (continued)
(e) Non-current assets (or disposal groups) held for sale and discontinued operations (continued)
An impairment loss is recognised for any initial or subsequent write-down of the asset (or disposal group) to fair value less costs to sell. A gain is recognised for any subsequent increases in fair value less costs to sell of an asset (or disposal group), but not in excessof any cumulative impairment loss previously recognised. A gain or loss not previously recognised by the date of the sale of the non-current asset (or disposal group) is recognised at the date of derecognition.
Non-current assets (including those that are part of a disposal group) are not depreciated or amortised while they are classified as held for sale. Interest and other expenses attributable to the liabilities of a disposal group classified as held for sale continue to be recognised.
Non-current assets classified as held for sale and the assets of a disposal group classified as held for sale are presented separately from the other assets in the statement of financial position. The liabilities of a disposal group classified as held for sale are presented separately from other liabilities in the statement of financial position.
A discontinued operation is a component of the entity that has been disposed of or is classified as held for sale and that represents a separate major line of business or geographical area of operations, is part of a single co-ordinated plan to dispose of such a line of business or area of operations, or is a subsidiary acquired exclusively with a view to resale. The results of discontinued operations are presented separately in the income statement.
(f) Fixed assets
Fixed assets are stated at cost less depreciation and any impairment loss. Buildings are depreciated on the basis of an expected life of 50 years, or the remainder thereof, or over the remaining period of the lease of the underlying leasehold land, whichever is less. The period of the lease includes the period for which a right to renewal is attached.
Depreciation of other fixed assets is provided on the straight-line basis to write off their costs over their estimated useful lives. Theprincipal annual rates used for these purposes are as follows:
Motor vehicles 20 - 25%Plant, machinery and equipment 3 1/3 - 20% Container terminal equipment 3 - 20%Telecommunications equipment 2.5 - 20%Leasehold improvements Over the unexpired period of the lease or 15%, whichever is greater
The gain or loss on disposal or retirement of a fixed asset is the difference between the net sales proceeds and the carrying amount.
(g) Leases
(i) Group as a lessee
Leases are recognised as a right-of-use asset and a corresponding liability at the date at which the leased asset is available for useby the Group. Each lease payment is allocated between the lease liability and interest on lease liability. The interest on lease liabilityis charged to profit or loss over the lease period so as to produce a constant periodic rate of interest on the remaining balance of thelease liability for each period. The right-of-use asset is depreciated over the shorter of the asset’s useful life and the lease termon a straight-line basis.
Assets and liabilities arising from a lease are initially measured on a present value basis. Lease liabilities include the net present value of the following lease payments:• fixed payments (including in-substance fixed payments), less any lease incentives receivable.• variable lease payment that are based on an index or a rate.• amounts expected to be payable by the lessee under residual value guarantees.• the exercise price of a purchase option if the lessee is reasonably certain to exercise that option.• payments of penalties for terminating the lease, if the lease term reflects the lessee exercising that option.
The lease payments are discounted using the interest rate implicit in the lease. If that rate cannot be determined, the lessee’s incremental borrowing rate is used, being the rate that the lessee would have to pay to borrow the funds necessary to obtain an asset of similar value in a similar economic environment with similar terms and conditions.
Right-of-use assets are measured at cost comprising the following:• the amount of the initial measurement of lease liability.• lease payments made at or before the commencement date less any lease incentives received.• initial direct costs and restoration costs.
Payments associated with short-term leases and leases of low-value assets are recognised on a straight-line basis as an expense in profit or loss. Short-term leases are leases with a lease term of 12 months or less. Low-value assets comprise small items of office furniture and certain IT-equipment.
CKHH 2021 Interim Results Financial Statements
Page 89 of 104

41 Significant accounting policies (continued)
(g) Leases (continued)
(i) Group as a lessee (continued)
Some leases contain variable payment terms that are linked to sales generated from a store. For individual retail stores, lease payments are on the basis of variable payment terms and there is a wide range of sales percentages applied. Variable payment terms are used for a variety of reasons, including minimising the fixed costs base for newly established stores. Variable lease payments that depend on sales are recognised in profit or loss in the period in which the condition that triggers those payments occurs.
Extension and termination options are included in a number of leases across the Group. These terms are used to maximise operational flexibility in terms of managing contracts. The majority of extension and termination options held are exercisable only by the Groupand not by the respective lessor. In determining the lease term, management considers all facts and circumstances that create an economic incentive to exercise an extension option, or not exercise a termination option. Extension options (or periods after termination options) are only included in the lease term if the lease is reasonably certain to be extended (or not terminated).
(ii) Group as a lessor
A lease is classified as a finance lease if it transfers substantially all the risks and rewards incidental to the ownership of an underlying asset to the lessee. If this is not the case, the lease is classified as an operating lease.
However, when the Group is an intermediate lessor the sublease are classified as a finance lease or as an operating lease with reference to the right-of-use asset arising from the head lease, not with reference to the underlying asset.
(h) Investment properties
Investment properties are interests in land and buildings that are held to earn rentals or for capital appreciation or both. Such properties are carried in the statement of financial position at their fair value. Changes in fair values of investment properties are recorded in the income statement.
(i) Leasehold land
The acquisition costs and upfront payments made for leasehold land are presented on the face of the statement of financial position as leasehold land prior to 1 January 2019 and are grouped as part of right-of-use assets with effect from 1 January 2019. Leasehold land are expensed in the income statement on a straight-line basis over the period of the lease.
(j) Telecommunications licences, other licences, brand names, trademarks and other rights
Separately acquired telecommunications licences, other licences, brand names, trademarks and other rights are carried at historical cost. Telecommunications licences, other licences, brand names, trademarks and other rights with a finite useful life are carried atcost less accumulated amortisation. Amortisation is calculated using the straight-line method to allocate the cost of these assets over their estimated useful lives:
Telecommunications licences and other licences 2 to 20 years Brand names, trademarks and other rights 2 to 45 years
Telecommunications licences, other licences, brand names, trademarks and other rights that are considered to have indefinite usefullives to the Group are not amortised and are tested for impairment annually and when there is indication that they may be impaired.
(k) Customer acquisition and retention costs
Customer acquisition and retention costs (“CACs”) comprise the net costs to acquire and retain customers, which are mainly mobile telecommunication 3G and LTE customers. CACs are expensed and recognised in the income statement in the period in which they areincurred, except (i) the costs are incremental of obtaining a contract and they are expected to be recovered; and (ii) the costs relate directly to the contract, generate resources used in satisfying the contract and are expected to be recovered, then they are capitalised and amortised over the customer contract period. Appropriate allowance are recognised if the carrying amounts of the capitalised costs exceed the remaining amount that the Group expects to receive less any directly related costs that have not been recognised as expenses.
(l) Contractual customer relationships
Separately acquired contractual customer relationships are carried at historical cost. These contractual customer relationships are carried at cost less accumulated amortisation. Amortisation is calculated using the straight-line method from five to fifteen years overthe expected useful life of the customer relationship.
CKHH 2021 Interim Results Financial Statements
Page 90 of 104

41 Significant accounting policies (continued)
(m) Deferred tax
Deferred tax is recognised, using the liabilities method, on temporary differences arising between the tax bases of assets and liabilities and their carrying amounts in the financial statements. Deferred tax assets are recognised to the extent that it is probable that future taxable profit will be available against which the deductible temporary differences and the carry forward of unused tax losses and tax credits can be utilised.
(n) Liquid funds and other listed investments and unlisted investments
“Liquid funds and other listed investments” are investments in listed debt securities, listed equity securities and cash and cash equivalents. “Unlisted investments” disclosed under other non-current assets, are investments in unlisted debt securities, unlisted equity securities and other receivables. These investments are recognised and de-recognised on the date the Group commits to purchase or sell theinvestments or when they expire.
(i) Measurement
Debt instrument financial assets subsequent to initial recognition are measured as follows:
Amortised cost: Assets that are held for collection of contractual cash flows where those cash flows represent solely payments of principal and interest are measured at amortised cost. Interest income from these financial assets, impairment losses, foreign exchange gains and losses, and gain or loss arising on derecognition are recognised directly in profit or loss.
Financial assets at fair value through other comprehensive income (“FVOCI”): Assets that are held for collection of contractual cash flows and for selling the financial assets, where the assets’ cash flows represent solely payments of principal and interest, are measured at FVOCI. Movements in the carrying amount are taken through other comprehensive income, except for the recognition of impairment losses and reversals, interest revenue and foreign exchange gains and losses which are recognised in profit or loss. When the financial asset is derecognised, the cumulative gain or loss previously recognised in other comprehensive income is reclassified from equity to, and recognised in, profit or loss.
Financial assets at fair value through profit or loss (“FVPL”): Assets that do not meet the criteria for amortised cost or FVOCI, or designated as FVPL using fair value option, are measured at FVPL. A gain or loss on a debt instrument that is subsequently measured at FVPL is recognised in profit or loss in the period in which it arises.
Equity instrument financial assets are measured at fair value at and subsequent to initial recognition. Changes in the fair value of these financial assets are normally recognised in profit or loss. Dividends from such investments are recognised in profit or loss when the Group’s right to receive payments is established. Where an election is made to present fair value gains and losses on equity investments in other comprehensive income, there is no subsequent reclassification of fair value gains and losses to profit or loss following the derecognition of the investment.
(ii) Impairment
Under the expected loss approach, the Group assesses on a forward looking basis the expected credit losses associated with its financial assets. The impairment methodology applied depends on whether there has been a significant increase in credit risk. The impairment model under HKFRS 9 applies to debt instruments measured at amortised cost and at FVOCI, contract assets under HKFRS 15, lease receivables, loan commitments and certain financial guarantee contracts. The Group applies the simplified approach to recognise lifetime expected losses for trade receivables, due from customers and contract assets. As regards lease receivables, loan commitments, financial guarantee contracts, and certain other financial assets (which are presented under Liquid funds and otherlisted investments and unlisted investments) the Group considers that they have low credit risk and hence recognises 12-month expected credit losses for such items.
(o) Derivative financial instruments and hedging activities
Derivative financial instruments are utilised by the Group in the management of its foreign currency and interest rate exposures. Derivative financial instruments are recognised at fair value. At the end of each reporting period the fair value is remeasured. The gain or loss on remeasurement to fair value is recognised immediately in profit or loss, except where the derivatives qualify for cash flow hedge accounting or hedges of net investment in a foreign operation, in which case recognition of any resultant gain or loss depends on the nature of the item being hedged.
CKHH 2021 Interim Results Financial Statements
Page 91 of 104

41 Significant accounting policies (continued)
(o) Derivative financial instruments and hedging activities (continued)
For the purpose of hedge accounting, hedges are classified as:
• Fair value hedges when hedging the exposure to changes in the fair value of a recognised asset or liability or an unrecognised firm commitment.
• Cash flow hedges when hedging the exposure to variability in cash flows that is either attributable to a particular risk associated with a recognised asset or liability or a highly probable forecast transaction or the foreign currency risk in an unrecognised firm commitment.
• Hedges of a net investment in a foreign operation (net investment hedges).
At the inception of a hedge relationship, the Group formally designates and documents the hedge relationship to which it wishes to apply hedge accounting and the risk management objective and strategy for undertaking the hedge.
At the inception of the hedging, the Group documents the economic relationship between hedging instruments and hedged items, including whether changes in the cash flows of the hedging instruments are expected to offset changes in the cash flows of hedges items. The Group documents its risk management objective and strategy for undertaking its hedge transactions.
The full fair value of a hedging derivative is classified as a non-current asset or liability when the remaining maturity of the hedged item is more than 12 months; it is classified as a current asset or liability when the remaining maturity of the hedged item is less than 12months. Trading derivatives are classified as a current asset or liability.
Hedges that meet all the qualifying criteria for hedge accounting are accounted for, as described below:
Fair value hedges
The change in the fair value of a hedging instrument is recognised in the statement of profit or loss as other expense. The change in the fair value of the hedged item attributable to the risk hedged is recorded as part of the carrying value of the hedged item and is also recognised in the statement of profit or loss as other expense.
For fair value hedges relating to items carried at amortised cost, any adjustment to carrying value is amortised through profit or loss over the remaining term of the hedge using the effective interest rate (“EIR”) method. The EIR amortisation may begin as soon as an adjustment exists and no later than when the hedged item ceases to be adjusted for changes in its fair value attributable to the risk being hedged.
If the hedged item is derecognised, the unamortised fair value is recognised immediately in profit or loss.
When an unrecognised firm commitment is designated as a hedged item, the subsequent cumulative change in the fair value of the firm commitment attributable to the hedged risk is recognised as an asset or liability with a corresponding gain or loss recognised in profit or loss.
Cash flow hedges
Where a derivative financial instrument is designated as a hedging instrument in a cash flow hedge, the effective portion of any gain or loss on the derivative financial instrument is recognised in other comprehensive income and accumulated separately in equity in the hedging reserve. The ineffective portion of any gain or loss is recognised immediately in profit or loss.
If a hedge of a forecast transaction subsequently results in the recognition of a non-financial asset such as inventory, the associated gain or loss is reclassified from equity to be included in the initial cost of the non-financial asset. For all other hedged forecast transactions, the amount accumulated in the hedging reserve is reclassified from equity to profit or loss in the same period or periods during which the hedged cash flows affect profit or loss (such as when a forecast sale occurs or interest expense is recognised).
If a hedge no longer meets the criteria for hedge accounting (including when the hedging instrument expires or is sold, terminated or exercised), then hedge accounting is discontinued prospectively. When hedge accounting is discontinued, but the hedged forecast transaction is still expected to occur, the amount that has been accumulated in the hedging reserve remains in equity until the transaction occurs and it is recognised in accordance with the above policy. If the hedged transaction is no longer expected to take place, the amount that has been accumulated in the hedging reserve is reclassified from equity to profit or loss immediately.
Hedge of net investments in foreign operations
The effective portion of any foreign exchange gain or loss on the derivative financial instruments is recognised in other comprehensive income and accumulated in equity in the exchange reserve until the disposal of the foreign operation, at which time the cumulative gain or loss is reclassified from equity to profit or loss. The ineffective portion is recognised immediately in profit or loss.
CKHH 2021 Interim Results Financial Statements
Page 92 of 104

41 Significant accounting policies (continued)
(p) Cash and cash equivalents
Cash and cash equivalents comprise cash on hand and demand deposits, and other short-term highly liquid investments that are readily convertible to a known amount of cash and are subject to an insignificant risk of changes in value.
(q) Inventories
Inventories consist mainly of retail goods. The carrying value of retail stock is mainly determined using the weighted average cost method. Inventories are stated at the lower of cost and net realisable value. Cost includes all direct expenditure and other appropriate attributable costs incurred in bringing inventories to their present location and condition.
(r) Trade and other receivables, and contract assets
Trade receivables are recognised when the Group’s right to consideration is unconditional that only the passage of time is required before the payment is due.
Contract assets primarily relate to the Group’s rights to consideration for delivered goods or services but not billed at the reporting date. The contract assets are transferred to receivables when the rights become unconditional. This usually occurs when the Group issues an invoice to the customer.
Trade and other receivables and contract assets are initially recognised at fair value and subsequently measured at amortised cost using the effective interest method, less allowances for expected credit losses. The Group measured the loss allowance for its trade and other receivables and contract assets at an amount equal to the lifetime expected credit losses. Appropriate allowance for estimated irrecoverable amounts are recognised in the income statement when there is objective evidence that the asset is impaired. Trade andother receivables and contract assets are written off to the extent that there is no reasonable expectation of recovery.
(s) Borrowings and borrowing costs
Borrowings and debt instruments are initially measured at fair value, net of transaction costs, and are subsequently carried at amortised cost. Any difference between the proceeds (net of transaction costs) and the settlement or redemption amount is recognised over the period of the borrowings using the effective interest method.
Borrowing costs directly attributable to the acquisition, construction or production of qualifying assets, which are assets that necessarily take a substantial period of time to get ready for their intended use or sale, are added to the cost of those assets, until such time as the assets are substantially ready for their intended use or sale. All other borrowing costs are recognised in the income statement in the period in which they are incurred.
(t) Trade and other payables, and contract liabilities
Trade and other payables and contract liabilities are initially recognised at fair value and subsequently measured at amortised costusing the effective interest method.
The contract liabilities primarily relate to the advance consideration received from customers, where the Group has the unconditional right to considerations before the goods or services are delivered. They are released and revenues are recognised when theperformance obligations are satisfied upon transferring of goods and services to customers.
(u) Customer loyalty credits
Customer loyalty credits are accounted for as a separate component of the sales transaction in which they are granted.
(v) Share capital
Share capital issued by the Company are recorded in equity at the proceeds received, net of direct issue costs.
(w) Provisions
Provisions are recognised when it is probable that an outflow of economic benefits will be required to settle a present obligation as a result of past events and a reliable estimate can be made of the amount of the obligation.
CKHH 2021 Interim Results Financial Statements
Page 93 of 104

41 Significant accounting policies (continued)
(x) Asset impairment
Assets that have an indefinite useful life are tested for impairment annually and when there is indication that they may be impaired. Assets that are subject to depreciation and amortisation are reviewed for impairment to determine whether there is any indication that the carrying value of these assets may not be recoverable and have suffered an impairment loss. If any such indication exists, the recoverable amount of the asset is estimated in order to determine the extent of the impairment loss, if any. The recoverable amount is the higher of an asset’s fair value less costs to dispose and value in use. Such impairment loss is recognised in the income statement except where the asset is carried at valuation and the impairment loss does not exceed the revaluation surplus for that asset, in which case it is treated as a revaluation decrease.
(y) Pension plans
Pension plans are classified into defined benefit and defined contribution plans. The pension plans are generally funded by the relevant group companies taking into account the recommendations of independent qualified actuaries and by payments from employees for contributory plans.
The Group’s contributions to the defined contribution plans are charged to the income statement in the year incurred.
Pension costs for defined benefit plans are assessed using the projected unit credit method. Under this method, the cost of providing pensions is charged to the income statement so as to spread the regular cost over the future service lives of employees in accordance with the advice of the actuaries who carry out a full valuation of the plans. The liability or asset recognised in the consolidated statement of financial position in respect of defined benefit pension plans is the present value of the defined benefit obligation at the end of thereporting period less the fair value of the plan assets. The present value of the defined benefit obligation is measured by discounting the estimated future cash outflows using interest rates determined by reference to market yields at the end of the reporting period based on government agency or high quality corporate bonds with currency and term similar to the estimated term of benefit obligations.
Remeasurements arising from defined benefit plans are recognised in other comprehensive income in the period in which they occurand reflected immediately in retained profit. Remeasurements comprise actuarial gains and losses, the return on plan assets (excluding amounts included in net interest on the net defined benefit liability (asset)) and any change in the effect of the asset ceiling (excluding amounts included in net interest on the net defined benefit liability (asset)).
Pension costs are charged to the income statement within staff costs.
(z) Share-based payments
The Company and its subsidiary companies do not have share option scheme as at 30 June 2021 and 31 December 2020 but certain of the Company’s subsidiary companies and associated companies have issued equity-settled and cash-settled share-based compensation plans. Equity-settled share-based payments are measured at fair value (excluding the effect of non-market-based vesting conditions) at the date of grant. The fair value determined at the grant date of the equity-settled share-based payments is expensed on a straight-line basis over the vesting period, based on the respective group companies’ estimate of their shares that will eventually vest and adjusted for the effect of non-market-based vesting conditions.
For cash-settled share-based payments, a liability equal to the portion of the goods or services received is recognised at the current fair value determined at the end of the reporting period.
(aa) Foreign exchange
Transactions in foreign currencies are converted at the rates of exchange ruling at the transaction dates. Monetary assets and liabilities are translated at the rates of exchange ruling at the end of the reporting period.
The financial statements of foreign operations are translated into Hong Kong dollars using the period / year end rates of exchange for the statement of financial position items and the average rates of exchange for the period / year for the income statement items. Exchange differences are recognised in other comprehensive income and accumulated under the heading of exchange reserve. Exchange differences arising from foreign currency borrowings and other currency instruments designated as hedges of such overseas investments, are recognised in other comprehensive income and accumulated under the heading of exchange reserve.
Exchange differences arising from translation of inter-company loan balances between Group entities are recognised in othercomprehensive income and accumulated under the heading of exchange reserve when such loans form part of the Group’s net investment in a foreign entity. On the disposal of a foreign operation (i.e. a disposal of the Group’s entire interest in a foreign operation,or a disposal involving loss of control over a subsidiary that includes a foreign operation, a disposal involving loss of joint control over a joint venture that includes a foreign operation, or a disposal involving loss of significant influence over an associate that includesa foreign operation), all of the exchange gains or losses accumulated in exchange reserve in respect of that operation attributable to the owners of the Company are transferred out of the exchange reserve and are recognised in the income statement.
CKHH 2021 Interim Results Financial Statements
Page 94 of 104

41 Significant accounting policies (continued)
(aa) Foreign exchange (continued)
In addition, in relation to a partial disposal of a subsidiary that does not result in the Group losing control over the subsidiary that includes a foreign operation, the proportionate share of accumulated exchange differences are re-attributed to non-controlling interests and are not recognised in the income statement. For all other partial disposals (i.e. partial disposals of associates or joint ventures that do not result in the Group losing significant influence or joint control), the proportionate share of the accumulated exchange differences is transferred out of the exchange reserve and are recognised in the income statement.
For accounting purposes, Argentina is considered a hyper-inflationary economy for accounting periods ended after 1 July 2018. HKAS 29 “Financial Reporting in Hyperinflationary Economies” requires financial statements of these subsidiary companies whose functional currency is Argentine peso to be restated into the current purchasing power at the end of the reporting period before being included in the Group’s consolidated financial statements. Under this requirement, transactions during the reporting period and non-monetary balances at the end of the reporting period of these subsidiary companies have been restated to reflect a price index that is current at the statement of financial position date, using consumer price index published by The National Institute of Statistics and Censuses of Argentina of 483 in 30 June 2021 (31 December 2020: 386) as basis for hyperinflation adjustment calculation. All amounts, including income, expenses, assets, liabilities and equity items are then translated at the closing exchange rate into Hong Kong dollars. The differences from retranslation of opening equity are directly recognised in equity. As required by HKAS 29, comparative amountsof these subsidiary companies included in the comparative consolidated financial statements of the Group are not restated and continue to be those previously presented.
All other exchange differences are recognised in the income statement.
(ab) Revenue recognition
Revenue is measured at the fair value of the consideration received and receivable and represents amounts receivable for goods and services provided in the normal course of business. Revenue from contracts with customers is measured based on the consideration specified in a contract with a customer and exclude amounts collected on behalf of third parties. The Group recognises revenue when it transfers control over a product or service to a customer.
Ports and Related Services
Revenue from the provision of ports and related services is recognised over time when the services are rendered and the Group’s performance provides the benefits received and consumed simultaneously by the customer.
Retail
Revenue from the sale of retail goods is recognised at point of sale less an estimate for sales return based on past experience where goods are sold with a right to return. Retail sales are usually settled in cash or by credit card and debit card. The recorded revenue is the gross amount of sales, including credit card fees payable for the transaction.
Infrastructure
Operating lease income from the rental of rolling stock assets is recognised on a straight-line basis over the lease term.
Contributions related to the connection of new properties to the Group’s networks, comprising infrastructure charges, new connection charges, requisitioned mains and sewers and adopted assets, are recognised as deferred income and amortised to the income statement over the expected useful life of the connection, and other contributions to capital investment, most significantly mains and sewer diversions, the contributions are recognised in full in the income statement upon completion of the investment, which are typically the point at which the associated asset is brought into use.
Revenue from the provision of waste collection, commercial refuse and recycling services together with refuse transfer station operations and landfill operations is recognised when a performance obligation is satisfied, which is recognised at a point of time, based on the timing of control of the services underlying the particular performance obligation being transferred to the customer.
CKHH 2021 Interim Results Financial Statements
Page 95 of 104

41 Significant accounting policies (continued)
(ab) Revenue recognition (continued)
Telecommunications services
Revenue represents amounts earned for services rendered and for the sale of mobile and related devices. The Group recognises revenue for mobile devices when it transfers the control over the device to the customer which is usually the time the customer signs up to a contract. The Group recognises revenue for mobile telecommunication services as the services are rendered. Monthly recurring charges and additional airtime used by contract customers are invoiced and recorded as part of a periodic billing cycle and recognised as revenue over the related access period. Unbilled revenue resulting from services already provided from the billing cycle date to the end of each period is accrued, and unearned monthly access charges relating to periods after each accounting period are deferred. Products and services may be sold separately or in a bundled transaction. Revenue from the sale of prepaid credit is deferred until such time as the customer uses the airtime, or the credit expires.
For bundled transactions under contract comprising the provision of telecommunications services and sale of a device (e.g. handsets), the elements are accounted for separately if they are distinct. A product or service is distinct if they are separately identifiable from other items in the bundled package and if the customer can benefit from it. The revenue is allocated to the respective element in an amount that reflects the consideration to which the Group expects to be entitled in exchange for the services and device, where device revenue is recognised at the inception of the contract upon delivery to the customer and services revenue is recognised throughout the contract period as the services are provided.
Other service income is recognised when the service is rendered. Customer service revenue is mobile telecommunications service revenue, and where a customer is invoiced for a bundled transaction under contract, the invoiced amount less amounts related to accrued device revenue and also less other service income. Total revenue arising from telecommunications services comprises of service revenue, sale of device revenue and other service income.
Finance and investments
Dividend income from investments in securities is recognised when the Group’s right to receive payment is established.
Interest income is recognised on a time proportion basis using the effective interest method.
CKHH 2021 Interim Results Financial Statements
Page 96 of 104

CK Hutchison Holdings Limited
2016 Interim Report
24
CK Hutchison Holdings Limited
2020 Interim Report
Modified at: 2021-07-26 16:21
Group Capital Resources and Liquidity
Treasury Management
The Group’s treasury function sets financial risk management policies in accordance with policies and procedures that are approved by the Executive Directors, and which are also subject to periodic review by the Group’s internal audit function. The Group’s treasury policies are designed to mitigate the impact of fluctuations in interest rates and exchange rates on the Group’s overall financial position and to minimise the Group’s financial risks. The Group’s treasury function operates as a centralised service for managing financial risks, including interest rate and foreign exchange risks, and for providing cost-efficient funding to the Group and its companies. It manages the majority of the Group’s funding needs, interest rate, foreign currency and credit risk exposures. It is the Group’s policy not to have credit rating triggers that would accelerate the maturity dates of the Group’s borrowings. The Group uses interest rate and foreign currency swaps and forward contracts as appropriate for risk management purposes only, for hedging transactions and for managing the Group’s exposure to interest rate and foreign exchange rate fluctuations. The Group generally does not enter into foreign currency hedges in respect of its foreign currency earnings and no derivative instruments to hedge the Group’s earnings were entered during the period or remain outstanding at the end of the period. It is the Group’s policy not to enter into derivative transactions for speculative purposes. It is also the Group’s policy not to invest liquidity in financial products, including hedge funds or similar vehicles, that have significant underlying leverage or derivative exposure.
Cash Management and Funding
The Group operates a central cash management system for all of its unlisted subsidiaries. Except for listed and certain overseas entities conducting businesses in non-HK or non-US dollar currencies, the Group generally obtains long-term financing at the Group level to on-lend or contribute as equity to its subsidiaries and associated companies to meet their funding requirements and provide more cost-efficient financing. These borrowings include a range of capital market issues and bank borrowings, for which the proportions will change depending upon financial market conditions and projected interest rates. The Group regularly and closely monitors its overall debt position and reviews its funding costs and maturity profile to facilitate refinancing.
Interest Rate Exposure
The Group manages its interest rate exposure with a focus on reducing the Group’s overall cost of debt and exposure to changes in interest rates. When considered appropriate, the Group uses derivatives such as interest rate swaps and forward rate agreements to manage its interest rate exposure. The Group’s main interest rate exposure relates to US dollar, British Pound, Euro and HK dollar borrowings.
At 30 June 2021, approximately 29% of the Group’s total principal amount of bank and other debts were at floating rates and the remaining 71% were at fixed rates (31 December 2020: 35% floating; 65% fixed). The Group has entered into various interest rate agreements with major financial institution counterparties to swap approximately HK$5,460 million principal amount of fixed interest rate borrowings to effectively become floating interest rate borrowings. In addition, HK$15,581 million principal amount of floating interest rate borrowings that were used to finance long term investments have been swapped to fixed interest rate borrowings. After taking into consideration these interest rate swaps, approximately 26% of the Group’s total principal amount of bank and other debts were at floating rates and the remaining 74% were at fixed rates at 30 June 2021 (31 December 2020: 31% floating; 69% fixed). All of the aforementioned interest rate derivatives are designated as hedges and these hedges are considered highly effective.
Foreign Currency Exposure
For overseas subsidiaries, associated companies and other investments, which consist of non-HK dollar or non-US dollar assets, the Group generally endeavours to establish a natural hedge for debt financing with an appropriate level of borrowings in those same currencies. For overseas businesses that are in the development phase, or where borrowings in local currency are not or are no longer attractive, the Group may not borrow in the local currency or may repay existing borrowings and monitor the development of the businesses’ cash flow and the relevant debt markets with a view to refinance these businesses with local currency borrowings in the future when conditions are more appropriate. Exposure to movements in exchange rates for individual transactions (such as major procurement contracts) directly related to its underlying businesses is minimised by using forward foreign exchange contracts and currency swaps where active markets for the relevant currencies exist. The Group generally does not enter into foreign currency hedges in respect of its long-term equity investments in overseas subsidiaries and associated companies, except in relation to certain infrastructure investments.
Group Capital Resources and Other Information
CKHH 2021 Interim Results Group Capital Resources and Liquidity and Others
Page 97 of 104

CK Hutchison Holdings Limited
2016 Interim Report
25
CK Hutchison Holdings Limited
2020 Interim Report
Modified at: 2021-07-26 16:21
The Group has operations in about 50 countries and conducts businesses in over 50 currencies. The Group’s functional currency for reporting purposes is Hong Kong Dollars and the Group’s reported results in Hong Kong Dollars are exposed to exchange translation on its foreign currency earnings, net debt and net assets, in particular for Euro and British Pounds. EBITDA (1) for the first half of 2021 was HK$55,590 million, on a recurring basis (excluding the gain on disposal of tower assets, non-cash impairment of goodwill of the Group’s Italian telecommunication business and a non-cash foreign exchange reserve loss following the Cenovus-Husky merger), 59% was derived from European operations, including 23% from the UK. At 30 June 2021, of the Group’s total principal amount of bank and other debts after currency swap arrangements, 48% and 5% were denominated in Euro and British Pounds respectively, whilst liquid assets comprised 21% Euro and 3% British Pounds denominated cash and cash equivalents. As a result, 77% and 8% of the Group’s consolidated net debt(2) of HK$164,285 million were denominated in Euro and British Pounds respectively. Net assets (3) was HK$658,981 million, with 17% and 22% attributable to Continental Europe and the UK operations respectively.
At 30 June 2021, the Group’s total principal amount of bank and other debts were denominated as follows: 39% in Euro, 45% in US dollars, 3% in HK dollars, 5% in British Pounds and 8% in other currencies. The Group had currency swap arrangements with banks to swap US dollar principal amount of borrowings equivalent to HK$29,640 million to Euro principal amount of borrowings to reflect currency exposures of its underlying businesses. The Group’s total principal amount of bank and other debts, after the above swaps, were denominated as follows: 48% in Euro, 36% in US dollars, 3% in HK dollars, 5% in British Pounds and 8% in other currencies.
For purposes of illustrating the Group’s currency sensitivity, based on the results for the first half of 2021, a 10% depreciation of British Pounds would result in a HK$1.1 billion decrease in EBITDA, a HK$0.4 billion decrease in NPAT, HK$1.3 billion decrease in net debt and 0.2%-point increase in net debt to net total capital ratio. Similarly, a 10% depreciation of Euro would result in a HK$1.5 billion decrease in EBITDA, a HK$0.4 billion decrease in NPAT, HK$12.7 billion decrease in net debt and 1.0%-point decrease on net debt to net total capital ratio. Actual sensitivity will depend on actual results and cash flows for the period under consideration.
Credit Exposure
The Group’s holdings of cash, managed funds and other liquid investments, interest rate and foreign currency swaps and forward currency contracts with financial institutions expose the Group to credit risk of counterparties. The Group controls its credit risk to non-performance by its counterparties through monitoring their equity share price movements and credit ratings as well as setting approved counterparty credit limits that are regularly reviewed.
The Group is also exposed to counterparties credit risk from its operating activities, particularly in its ports businesses. Such risks are continuously monitored by the local operational management.
Credit Profile
Our long term credit rating from Moody’s, S&P and Fitch remained at A2 (stable outlook), A (stable outlook) and A- (stable outlook) respectively. The Group aims to maintain a capital structure that is appropriate for long-term investment grade ratings of A2 on the Moody’s Investor Service scale, A on the S&P Rating Services scale and A- on the Fitch Ratings scale. Actual credit ratings may depart from these levels from time to time due to economic circumstances. CK Hutchison Group Telecom Holdings (“CK Hutchison Group Telecom”), a wholly-owned subsidiary of the Group, obtained long term credit rating from Moody’s, S&P and Fitch at Baa1 (stable outlook), A- (stable outlook) and BBB+ (stable outlook) respectively. CK Hutchison Group Telecom will seek to maintain its ratings by applying the same financial disciplines as the Group.
Market Price Risk
The Group’s main market price risk exposures relate to listed debt and equity securities described in “Liquid Assets” below and the interest rate swaps described in “Interest Rate Exposure” above. The Group’s holding of listed debt and equity securities represented approximately 4% (31 December 2020 – approximately 6%) of the cash, liquid funds and other listed investments (“liquid assets”). The Group controls this risk through active monitoring of price movements and changes in market conditions that may have an impact on the value of these financial assets and instruments.
Note 1: Under Post-IFRS 16 basis, EBITDA for the first half of 2021 was HK$68,167 million (30 June 2020 – HK$59,341 million).
Note 2: Under Post-IFRS 16 basis, consolidated net debt as at 30 June 2021 was HK$163,532 million (31 December 2020 – HK$185,103 million).
Note 3: Under Post-IFRS 16 basis, net assets as at 30 June 2021 was HK$642,818 million (31 December 2020 – HK$630,063 million).CKHH 2021 Interim Results
Group Capital Resources and Liquidity and OthersPage 98 of 104

CK Hutchison Holdings Limited
2016 Interim Report
26
CK Hutchison Holdings Limited
2020 Interim Report
Modified at: 2021-07-26 16:21
Liquid Assets
The Group continues to maintain a robust financial position. Liquid assets amounted to HK$190,416 million at 30 June 2021, an increase of 14% from the balance of HK$166,539 million at 31 December 2020, mainly reflecting proceeds from disposal of tower assets, cash arising from positive funds from operations from the Group’s businesses and cash from new borrowings, partly offset by dividend payments to ordinary and non-controlling shareholders as well as distributions to perpetual capital securities holders, repayment and early repayment of certain borrowings, net redemption of perpetual capital securities, capital expenditure and investment spending. Liquid assets were denominated as to 16% in HK dollars, 50% in US dollars, 4% in Renminbi, 21% in Euro, 3% in British Pounds and 6% in other currencies.
Cash and cash equivalents represented 96% (31 December 2020 – 94%) of the liquid assets, US Treasury notes and listed debt securities 3% (31 December 2020 – 4%) and listed equity securities 1% (31 December 2020 – 2%). The US Treasury notes and listed debt securities, including those held under managed funds, consisted of US Treasury notes of 70%, government and government guaranteed notes of 17% and others of 13%. Of these US Treasury notes and listed debt securities, 99% are rated at Aaa/AAA or Aa1/AA+ with an average maturity of 1.4 years on the overall portfolio. The Group has no exposure in mortgage-backed securities, collateralised debt obligations or similar asset classes.
Cash FlowEBITDA in the first half of 2021 was HK$55,590 million, an increase of 18% compared to HK$46,946 million for the same period last year. Consolidated funds from operations (4) (“FFO”) before cash profits from disposals, capital expenditures, investments and changes in working capital was HK$24,086 million for the first half of 2021, an increase of 12% against the same period last year of HK$21,436 million.
The Group’s capital expenditures (including licences, brand name and other rights) for the first half of 2021 amounted to HK$19,395 million (30 June 2020 – HK$10,276 million). Capital expenditures (including licences, brand name and other rights) for the ports and related services division amounted to HK$1,014 million (30 June 2020 – HK$726 million); for the retail division HK$880 million (30 June 2020 – HK$628 million); for the infrastructure division HK$184 million (30 June 2020 – HK$113 million); for CK Hutchison Group Telecom HK$16,192 million (30 June 2020 – HK$6,964 million); for HAT HK$1,080 million (30 June 2020 – HK$1,787 million); and for the finance and investments and others segment HK$45 million (30 June 2020 – HK$58 million).
The Group’s dividends received from associated companies and joint ventures for the first half of 2021 amounted to HK$5,240 million (30 June 2020 – HK$5,006 million). Dividends received from associated companies and joint ventures for the ports and related services division amounted to HK$835 million (30 June 2020 – HK$626 million); for the retail division HK$892 million (30 June 2020 – HK$873 million); for the infrastructure division HK$3,115 million (30 June 2020 – HK$2,852 million); for Husky nil (30 June 2020 – HK$574 million); and for the finance and investments and others segment HK$398 million (30 June 2020 – HK$81 million).
The Group’s purchases of and advances to associated companies and joint ventures amounted to HK$571 million (30 June 2020 – HK$757 million). Purchases of and advances to associated companies and joint ventures for the ports and related services division amounted to HK$39 million (30 June 2020 – nil); the retail division HK$22 million (30 June 2020 – HK$308 million); for the infrastructure division HK$449 million (30 June 2020 – HK$220 million); for CK Hutchison Group Telecom HK$29 million (30 June 2020 – HK$53 million); and for the finance and investments and others segment HK$32 million (30 June 2020 – HK$176 million).
Net cash inflow before financing activities (5) was HK$39,871 million, an increase of 348% compared to HK$8,904 million for the same period last year, reflecting significant proceeds from the disposal of tower assets, improvement in underlying EBITDA, partly offset by adverse working capital movements and higher capital expenditures.
The capital expenditures and investments of the Group are primarily funded by cash generated from operations, cash on hand and to the extent appropriate, by external borrowings.
For further information of the Group’s capital expenditures by division and cash flow, please see Note 5(b)(v) and the “Condensed Consolidated Statement of Cash Flows” section of this Announcement.
Note 4: Under Post-IFRS 16 basis, FFO for the first half of 2021 was HK$32,699 million (30 June 2020 – HK$30,122 million).
Note 5: Under Post-IFRS 16 basis, net cash inflow before financing activities for the first half of 2021 was HK$49,781 million (30 June 2020 – HK$18,423 million).
CKHH 2021 Interim Results Group Capital Resources and Liquidity and Others
Page 99 of 104

CK Hutchison Holdings Limited
2016 Interim Report
27
CK Hutchison Holdings Limited
2020 Interim Report
Modified at: 2021-07-26 16:21
Debt Maturity and Currency ProfileThe Group’s total bank and other debts, including unamortised fair value adjustments from acquisitions, at 30 June 2021 amounted to HK$354,701 million (31 December 2020 – HK$351,837 million) which comprises principal amount of bank and other debts of HK$351,161 million (31 December 2020 – HK$347,953 million) and unamortised fair value adjustments arising from acquisitions of HK$3,540 million (31 December 2020 – HK$3,884 million). The Group’s total principal amount of bank and other debts at 30 June 2021 consist of 68% notes and bonds (31 December2020 – 65%) and 32% bank and other loans (31 December 2020 – 35%). The Group’s weighted average cost of debt for the period ended 30 June2021 is 1.6% (30 June 2020 – 1.7%). Interest bearing loans from non-controlling shareholders, which are viewed as quasi-equity, totalled HK$779million as at 30 June 2021 (31 December 2020 – HK$798 million).
The maturity profile of the Group’s total principal amount of bank and other debts at 30 June 2021 is set out below:
HK$ US$ Euro GBP Others Total
In the remainder of 2021 1% – 6% – - 7%In 2022 1% 5% 5% – 5% 16%In 2023 1% 4% 16% 1% 1% 23%In 2024 – 7% 8% – 1% 16%In 2025 – – 2% – 1% 3%In 2026 – 2030 – 11% 9% 3% – 23%In 2031 – 2040 – 4% 2% 1% – 7%Beyond 2040 – 5% – – – 5%
Total 3% 36% 48% 5% 8% 100%
The non-HK dollar and non-US dollar denominated loans are either directly related to the Group’s businesses in the countries of the currencies concerned, or the loans are balanced by assets in the same currencies. None of the Group’s consolidated borrowings have credit rating triggers that would accelerate the maturity dates of any outstanding consolidated Group’s debt.
Changes in Debt Financing and Perpetual Capital SecuritiesThe significant financing activities for the Group in the first half of 2021 were as follows:
• In January, prepaid EUR1,650 million (approximately HK$15,527 million) of a floating rate term loan facility of EUR2,100 million maturing inOctober 2022;
• In March, US$1,200 million (approximately HK$9,360 million) Guaranteed Perpetual Capital Securities issued by OVPH Limited andguaranteed by CKI were redeemed in full;
• In March, obtained two three year floating rate loan facilities of US$50 million (approximately HK$390 million) and US$100 million(approximately HK$780 million) and repaid a floating rate loan facility of US$150 million (approximately HK$1,170 million) on maturity;
• In March, repaid a floating rate loan facility of HK$1,000 million on maturity;
• In March, obtained a three year floating rate loan facility of US$130 million (approximately HK$1,010 million);
• In March, obtained a five year floating rate loan facility of HK$1,000 million and repaid a floating rate term loan of the same amount onmaturity;
• In March, obtained a five year floating rate loan facility of EUR260 million (approximately HK$2,410 million);
• In April, prepaid EUR280 million (approximately HK$2,597 million) of a floating rate loan facility maturing in August 2021;
• In April, issued US$500 million (approximately HK$3,900 million) guaranteed notes due 2026 and US$850 million (approximately HK$6,630million) guaranteed notes due 2031, as well as US$650 million (approximately HK$5,070 million) guaranteed notes due 2041;
• In April, prepaid US$500 million (approximately HK$3,900 million) of a floating rate syndicated loan facility maturing in June 2021;
• In May, obtained a three year floating rate loan facility of AUD100 million (approximately HK$602 million) and a five year floating rate loanfacility of AUD100 million (approximately HK$602 million) and repaid two floating rate loan facilities in aggregate amount of AUD200 million(approximately HK$1,204 million) on maturity;
• In May, obtained two three year floating rate term loan facilities of EUR200 million each (approximately HK$3,800 million);
• In May, repaid a floating rate term loan facility of EUR500 million (approximately HK$4,750 million) on maturity;
CKHH 2021 Interim Results Group Capital Resources and Liquidity and Others
Page 100 of 104

CK Hutchison Holdings Limited
2016 Interim Report
28
CK Hutchison Holdings Limited
2020 Interim Report
Modified at: 2021-07-26 16:21
• In June, prepaid two floating rate loan facilities of US$300 million (approximately HK$2,340 million) and US$250 million (approximatelyHK$1,950 million) maturing in September 2021 and obtained two three year floating rate term loan facilities of US$250 million (approximately HK$1,950 million) and US$200 million (approximately HK$1,560 million);
• In June, repaid two floating rate term loan facilities in aggregate amount of US$220 million (approximately HK$1,716 million) on maturity;and
• In June, US$300 million (approximately HK$2,340 million) guaranteed perpetual capital securities guaranteed by CKI were issued by CheungKong Infrastructure Finance (BVI) Limited.
Furthermore, the significant debt financing activities undertaken by the Group following the period ended 30 June 2021 were as follows,
• In July, prepaid EUR450 million (approximately HK$4,172 million) of a floating rate loan facility of EUR2,100 million maturing in October 2022
• In July, prepaid EUR1,050 million (approximately HK$9,734 million) of a floating rate loan facility of EUR2,100 million maturing in October2024;
• In July, prepaid EUR100 million (approximately HK$927 million) of a floating rate loan facility maturing in May 2023;
• In July, US$300 million (approximately HK$2,340 million) guaranteed perpetual capital securities guaranteed by CKI were issued by CheungKong Infrastructure Finance (BVI) Limited; and
• In July, obtained a one year floating rate term loan facility of US$1,800 million (approximately HK$14,040 million).
Capital, Net Debt and Interest Coverage RatiosThe Group’s total ordinary shareholders’ funds and perpetual capital securities (6) increased to HK$538,196 million as at 30 June 2021, compared to HK$518,975 million as at 31 December 2020, mainly reflecting the profit for the first half of 2021, partly offset by the Group’s 2020 final dividends and distributions paid and other items recognised directly in reserves.
As at 30 June 2021, the consolidated net debt of the Group, excluding interest bearing loans from non-controlling shareholders which are viewed as quasi-equity, was HK$164,285 million (31 December 2020 – HK$185,298 million), an 11% decrease compared to the net debt at the beginning of the year primarily due to proceeds from the disposal of tower assets, partly offset by dividend payments, capital expenditure and investment spending. The Group’s consolidated net debt to net total capital ratio (7) was 19.9% as at 30 June 2021 (31 December 2020 – 22.2%; 30 June 2020 – 25.1%). The Group’s consolidated cash and liquid investments as at 30 June 2021 were sufficient to repay all of the Group’s outstanding debt maturing before 31 December 2023 and cover 48% of outstanding debt due in 2024.
The Group’s consolidated cash interest expenses and other finance costs of subsidiaries, before capitalisation and net of interest income in the first half of 2021 was HK$1,537 million (30 June 2020 – HK$734 million) primary due to lower interest income of HK$890 million. EBITDA of HK$55,590 million (30 June 2020: HK$46,946 million) and FFO excluding net interest (8) of HK$25,623 million (30 June 2020 – HK$22,170 million) for the period covered consolidated net interest expenses and other finance costs 34.9 times (30 June 2020 – 60.0 times) and 16.7 times (30 June 2020 – 30.2 times) respectively.
Secured FinancingAt 30 June 2021, assets of the Group totalling HK$2,242 million (31 December 2020 – HK$1,411 million) were pledged as security for bank loans.
Borrowing Facilities AvailableCommitted borrowing facilities available to Group companies but not drawn at 30 June 2021 amounted to the equivalent of HK$4,337 million (31 December 2020 – HK$20,766 million).
Contingent LiabilitiesAt 30 June 2021, the Group provided guarantees in respect of bank and other borrowing facilities to its associated companies and joint ventures totalling HK$6,912 million (31 December 2020 – HK$7,022 million), of which HK$6,366 million (31 December 2020 – HK$6,246 million) has been drawn down as at 30 June 2021 and also provided performance and other guarantees of HK$8,007 million (31 December 2020 – HK$7,868 million).
Note 6: Under Post-IFRS 16 basis, total ordinary shareholders’ funds and perpetual capital securities as at 30 June 2021 was HK$526,059 million (31 December 2020 – HK$506,711 million).
Note 7: Under Post-IFRS 16 basis, net debt to net total capital ratio for the first half of 2021 was 20.3% (31 December 2020 – 22.7%; 30 June 2020 – 25.6%).
Note 8: Under Post-IFRS 16 basis, FFO excluding net interest for the first half of 2021 was HK$36,102 million (30 June 2020 – HK$32,633 million).CKHH 2021 Interim Results
Group Capital Resources and Liquidity and OthersPage 101 of 104

CK Hutchison Holdings Limited
2016 Interim Report
29
CK Hutchison Holdings Limited
2020 Interim Report
Modified at: 2021-07-26 16:21
Employee Relations
At 30 June 2021, the Company and its subsidiaries employed 172,907 people (30 June 2020 – 176,053 people). The employee costs for the six-month period, excluding Directors’ emoluments, totalled HK$20,823 million (2020 – HK$19,347 million). Including the Group’s associated companies, at 30 June 2021, the Group employed 294,021 people of whom 17,408 were employed in Hong Kong. All of the Group’s subsidiaries are equal opportunity employers, with the selection and promotion of individuals based on suitability for the position offered. The salary and benefit levels of the Group’s employees are kept at a competitive level and employees are rewarded on a performance related basis within the general framework of the Group’s salary and bonus system, which is reviewed annually.
The Company does not have a share option scheme for the purchase of ordinary shares in the Company. Certain subsidiaries and associates of the Group offer various equity-linked compensation elements appropriate to their sectors and markets. A wide range of benefits including medical coverage, provident funds and retirement plans and long service awards is also provided to employees. In addition, training and development programmes are provided on an on-going basis throughout the Group. Many social, sporting and recreational activities are arranged for employees on a Group-wide basis. Group employees also participated in community-oriented events.
Purchase, Sale or Redemption of Listed Securities
During the six months ended 30 June 2021, the Company repurchased a total of 7,830,500 ordinary shares of par value HK$1.00 each in the share capital of the Company (the “Shares”) on The Stock Exchange of Hong Kong Limited (the “SEHK”), with the aggregate consideration paid (before expenses) amounting to HK$464,489,550.00. All the Shares repurchased were subsequently cancelled. As at 30 June 2021, the total number of Shares in issue was 3,848,410,000 (9).
Particulars of the share repurchases are as follows:Number of Aggregate consideration
Date Shares repurchased Purchase price per Share (before expenses)Highest Lowest(HK$) (HK$) (HK$)
March 2021 200,000 61.00 60.45 12,163,000.00June 2021 7,630,500 60.20 58.65 452,326,550.00
Save as disclosed above, during the six months ended 30 June 2021, neither the Company nor any of its subsidiaries had purchased, sold or redeemed any of the listed securities of the Company.
Compliance with the Corporate Governance Code
The Company strives to attain and maintain high standards of corporate governance best suited to the needs and interests of the Company and its subsidiaries (the “Group”) as it believes that an effective corporate governance framework is fundamental to promoting and safeguarding interests of shareholders and other stakeholders and enhancing shareholder value.
The Company has complied throughout the six months ended 30 June 2021 with all code provisions of the Corporate Governance Code contained in Appendix 14 of the Rules Governing the Listing of Securities on the SEHK (the “Listing Rules”), other than as summarised below.
The position of Managing Director of the Company has been jointly held by Mr Victor T K Li and Mr Fok Kin Ning, Canning as Group Co-Managing Directors since June 2015, and Mr Li also took on the position of Chairman in 2018. With the Group being a multinational conglomerate with diverse businesses in about 50 countries, Mr Li and Mr Fok in their position as Group Co-Managing Directors share responsibilities in the overall strategic direction and day-to-day management of the Group, with no single individual having unfettered management decision power. Further, the Board of Directors (the “Board”) which comprises experienced and seasoned professionals continues to scrutinise material business matters and monitor performance of the Group to ensure that management function is effectively and properly exercised with balance of power and authority. The Audit Committee, Nomination Committee and Remuneration Committee, all chaired by an Independent Non-executive Director, also provide strong independent oversight of the management in their respective areas of responsibilities and expertise. Hence, the current arrangements provide checks and balances without jeopardising the independent exercise of powers of the Chairman and the Group Co-Managing Directors.
Note 9: Additional Shares (117,000 Shares) were repurchased subsequent to 30 June 2021 and were cancelled on 12 July 2021, resulting in the total number of Shares in issue being 3,848,293,000.
CKHH 2021 Interim Results Group Capital Resources and Liquidity and Others
Page 102 of 104

CK Hutchison Holdings Limited
2016 Interim Report
30
CK Hutchison Holdings Limited
2020 Interim Report
Modified at: 2021-07-26 16:21
Compliance with the Model Code for Securities Transactions by Directors
The Board has adopted the Model Code for Securities Transactions by Directors of Listed Issuers set out in Appendix 10 of the Listing Rules as the code of conduct regulating Directors’ dealings in securities of the Company. In response to specific enquiries made, all Directors confirmed that they have complied with the required standards set out in such code regarding their securities transactions throughout their tenure during the six months ended 30 June 2021.
Review of Interim Financial Statements
The unaudited condensed consolidated financial statements of the Company and its subsidiary companies for the six months ended 30 June 2021 have been reviewed by the Company’s auditor, PricewaterhouseCoopers, in accordance with Hong Kong Standard on Review Engagements 2410, “Review of Interim Financial Information Performed by the Independent Auditor of the Entity” issued by the Hong Kong Institute of Certified Public Accountants. The auditor’s independent review report of PricewaterhouseCoopers is set out on page 25 in the Announcement. The unaudited condensed consolidated financial statements of the Company and its subsidiary companies for the six months ended 30 June 2021 have also been reviewed by the Audit Committee of the Company.
Record Date for Interim Dividend
The record date for the purpose of determining shareholders’ entitlement to the interim dividend is Tuesday, 7 September 2021. In order to qualify for the interim dividend payable on Thursday, 16 September 2021, all transfers, accompanied by the relevant share certificates, must be lodged with the Company’s Hong Kong Share Registrar (Computershare Hong Kong Investor Services Limited at Rooms 1712-1716, 17th Floor, Hopewell Centre, 183 Queen’s Road East, Wanchai, Hong Kong) for registration no later than 4:30 pm on Tuesday, 7 September 2021.
Corporate Strategy
The principal objective of the Company is to enhance long-term total return for its shareholders. To achieve this objective, the Group focus on achieving recurring and sustainable earnings, cash flow and dividend growth without compromising the Group’s financial strength and stability. The Group executes disciplined management of revenue growth, margin and costs, capital and investments to return ratio targets, earnings and cash flow accretive merger and acquisition activities, as well as organic growth in sectors or geographies where the Group has strong management experience and resources. Technology transformation also remains a key initiative of the Group to capture new cost and revenue opportunities in all businesses. At the same time, the Group is committed to maintaining long-term investment grade ratings, preserving strong liquidity and flexibility, sustaining a long and balanced debt maturity profile and actively managing cash flow and working capital. The Group explores opportunities to enhance shareholders’ returns, which include potential telecom infrastructure divestures and solidifying strategic alliances with global technology partners. The Chairman’s Statement and the Operations Highlights contained in the 2021 interim results announcement and the Operations Analysis which are posted on the Company’s website (http://www.ckh.com.hk/en/ir/presentation.php), include discussions and analyses of the Group’s performance, the basis on which the Group generates and preserves value in the longer term and delivers the Group’s objective.
CKHH 2021 Interim Results Group Capital Resources and Liquidity and Others
Page 103 of 104

CK Hutchison Holdings Limited
2016 Interim Report
31
CK Hutchison Holdings Limited
2020 Interim Report
Modified at: 2021-07-26 16:21
Past Performance and Forward Looking Statements
The performance and the results of the operations of the Group contained in the 2021 interim results announcement are historical in nature, and past performance is no guarantee of the future results of the Group. Any forward-looking statements and opinions contained within the 2021 interim results announcement are based on current plans, estimates and projections, and therefore involve risks and uncertainties. Actual results may differ materially from expectations discussed in such forward-looking statements and opinions. The Group, the Directors, employees and agents of the Group assume (a) no obligation to correct or update the forward-looking statements or opinions contained in the 2021 interim results announcement; and (b) no liability in the event that any of the forward-looking statements or opinions do not materialise or turn out to be incorrect.
As at the date of this announcement, the Directors of the Company are:
Executive Directors: Non-executive Directors:Mr LI Tzar Kuoi, Victor (Chairman and Group Co-Managing Director) Mr CHOW Kun Chee, RolandMr FOK Kin Ning, Canning (Group Co-Managing Director) Mrs CHOW WOO Mo Fong, SusanMr Frank John SIXT (Group Finance Director and Deputy Managing Director) Mr LEE Yeh Kwong, CharlesMr IP Tak Chuen, Edmond (Deputy Managing Director) Mr George Colin MAGNUSMr KAM Hing Lam (Deputy Managing Director)Mr LAI Kai Ming, Dominic (Deputy Managing Director) Independent Non-executive Directors:Ms Edith SHIH Mr CHENG Hoi Chuen, Vincent
The Hon Sir Michael David KADOORIEMs LEE Wai Mun, RoseMr William Elkin MOCATTA (Alternate to The Hon Sir Michael David Kadoorie)Mr Paul Joseph TIGHEMr WONG Kwai LamDr WONG Yick-ming, Rosanna
CKHH 2021 Interim Results Group Capital Resources and Liquidity and Others
Page 104 of 104