unclassified ad 4 23964 - defense technical information center unclassified ad 4 23964 ... numerous...
TRANSCRIPT
UNCLASSIFIED
AD 4 23964
DEFENSE DOCUMENTATION CENTERFOR
SCIENTIFIC AND TECHNICAL INFORMATION
CAMERON STATION. ALEXANDRIA. VIRGINIA
UNCLASSIFIED

I
NOTICE: When government or other drawings, speci-fications or other data are used for any purposeother than in connection with a definitely relatedgovernment procurement operation, the U. S.Government thereby incurs no responsibility, nor anyobligation whatsoever; and the fact that the Govern-ment may have formulated., furnished, or in any waysupplied the said drawings, specifications, or otherdata is not to be regarded by implication or other-wise as in any manner licensing the holder or anyother person or corporation, or conveying any rigbtsor permission to manufacture, use or sell anypatented invention that my in any way be relatedthereto.

S IGRADUATE SCHOOL OF BUSINESS
STANFORD UNIVERSITY
CI171 PERCEPTION OF LEADERSHIP IN SMALL GROUPS
.. Thomas W. Harrell, Principal Investigator
Technical Report Number 4
S C/:) Correlations Between Seven Leadership Criteria
and Selected Variables
Lucy E. Burnham and Hans E. LeeNovember, 963 D C
19633
TISIA B
Prepared for:
Group Psychology Branch
Office of Naval Research
Nonr - 225 (62)
Reproduction of this report in whole or in part is permitted for any
purpose of the United States Government
k

Correlations Between Seven Leadership Criteria
and Selected Variables
Problem
The overall plan -for the study of leadership emergence in small groups
includes an attempt to predict the seven criteria of leadership from
numerous test variables by performing multiple regression analyses. This
report, presented as a preliminary study to carrying out these regression
analyses, involves a study of the rank order correlations between the
seven criteria of leadership and nine variables which were selected from
the total test battery. The purpose of this study was to see whether
personality test variables could be used to describe members of a small
group. The results of previous reports, particularly the finding in
Technical Report #3 that the observation data and the sociometric data
were highly correlated, influenced the decision to conduct a preliminary
study. There was also a concern, as indicated by the results reported
in Technical Report #2, that perhaps sociometric choices could not be
predicted as well by personality variables as they could be predicted
by performance variables such as academic achievement. All of these
considerations were taken into account in the present study.
Method
As reported in Technical Report #3, data were collected on 34 four-
and five-man groups who performed in task-oriented small discussion groups.
Seven criteria of leadership were obtained as listed in Table 1. In

Page 2
addition, each member of these groups had taken a battery of nine persona-
lity tests called the Management Potential Test Battery (KMTB) which
includes the grade point average as listed in Table 1. The nine variables
used in this study were selected from the total MPTB variables on the
following bases. In a review of the literature conducted prior to the
initiation of the small group studies, it was found that three scales
which were available in the MPTB were significantly correlated with leader-
ship in similar studies (Bass, 1953; Haythorn, 1958; and Mann, 1959).
These same three scales, the Ascendance scale (GZ-As) and the Social
Interest scale (GZ-SI) both from the Guilford-Zimmerman Temperament Survey,
and the Public Opinion Questionnaire (POQ) which is a modification of the
California F scale, were selected to be included in this study. Three
additional variables were selected because they correlated 1 .20 or greater
with the number of positive boss ratings received, as reported in Technical
Report #2. These scales are the MMPI-Pt scale, the General Activity scale
(GZ-GA) from the Guilford-Zimmerman Temperament Survey, and the Considera-
tion scale (LOQ-C) from the Leadership Opinion Questionnaire. The other
variables included in this study were the grade point average earned in
the first year of a two-year Master of Arts in Business program (GPA-l),
and the verbal and quantitative scores from the Admissions Test for the
Graduate School of Business given by 2ducational Testing Service (ETS-V and
ETS-Q). These last three variables were used because Technical Report #2
had suggested that they would produce higher correlations than the other
MPTB variables with the leadership criteria.
The 6-a used in this study were rank order scores for both the leader-
ship criteria and the selected variables. For each leadership criterion,

Page 3
such as category A, average scores were obtained for the members of the
group and these average scores were reranked within the group. These are
the same leadership data as were used for the correlations reported in
Techinical Report #3. Not all of the seven leadership criteria available
for each group were used, only those criteria which showed agreement among
the raters significant at the .05 level or greater as reported in Technical
Report #1. The rationale for this selection was that the ranked averages
for these criteria would be more reliable when there was significant agree-
ment among the raters. The data for the nine MPTB variables were ranked
for the four or five men within each group. Using Spearman's ran' )rder
correlation method, the rank scores for these nine variables were correlated
with the ranks for each leadership criterion within each group which showed
significant agreement azuong the raters. The number of correlations avail-
able for any given distribution will vary according to this restriction of
significant agreement on the leadership criteria.
Frequency distributions of these results are reported in Table 2
along with the number of cases which were available for analysis. The
rank order correlations in each distribution were converted to z scores
(McNemar, 1962) with a correlation of 1.00 treated as .99 throughout.
Average z scores were then calculated for each distribution and, recon-
verted to average correlations, are presented in Table 2. All of the
correlations reported in this study were performed on the average z scores
which allows a nearly normal distribution of correlations. Table 2 is the
only table where the actual or average correlations are reported. Although
Total Activity is included in Tables 2 and 3, it is not included in the

THIS
PAGEis
MISSING
IN
ORIGINAL. ITT71l MDOCU miN 1L

Page 5
between POQ and QuestLon 2 or guidance. Not only are these two significant
results in the opposite directions for the observation and the sociometric
data, but all of the average z scores for POQ and the observation data are
in the positive direction while all of the average z scores for POQ and
the sociometric data are in the negative direction. This seems to be a sub-
stantial indication that the observation data are measuring something
different from the sociometric data.
Reported in Table 4 are the results of the distribution of the average
z scores across the rows. In order to study this effect, the absolute
values of the z scores along any particular row were divided into above and
below the median z score for that row. Excluding Category C due to the
lack of data, this division into above and below the median was done for
all of the rows. The purpose was to point out any consistency of parti-
cular MPTB variables to produce high correlations across all of the leader-
ship criteria. Considering these calculaticns across the rows, the results
of which may be read at the bottom of each column in Table 4,, there seems to
be some consistency in the correlatia s between any one MTB variable and
all of the leadership criteria. Both GPA-l and POQ show average z scores
above the median of the rows for four out of five of the criteria. These
results lend themselves to the conclusion that GAP-l and POQ are measuring
something which is common to nearly all Of the leadership criteria. The
non-uniform distributions of the other variables suggest that these varia-
bles are tapping various aspects of the leadership criteria.
Turning to an analogous technique but here applied to the columns,
the results of which may be read from the end of each row in Table 5, two

Page 6
of the leadership criteria show consistently high correlations across the
MPTB variables. For both category A and Question 2, seven out of nine of
the average z scores are abuve the median for the columns. Again, this
suggests that both Category A and Question 2 have qualities in ccumon with
a number of different variables while the other criteria show differential
correltations with the variables. It is interesting that, while Category A
shows high correltations with most of the 1PTB variables, GPA-l is one out
of the two variables with which Category A shows a lack of correlation. This
is encouraging in the consideration of previous results which had indicated
that the grade point average would non-discriminately correlate with all of
the criteria.
Of the seven leadership criteria, Category A and Question 2 are the
most correlated with the selected variables. Considering the NPMB variables,
GPA-L and POQ show the highest correlations with the seven leadership cri"
teria. In the light of these results, attention should be called to the
intersections between the rows and the columns for Category A, POQ,
Question 2, and GPA-I, as have been indicated in Table 6. Of these four
average z scores, all are significantly correlated beyond the .05 level
except Category A and GPA-l which shows an average z score of .14. It
should also be noted that the correlation between POQ and Question 2'is
negative. This particular pattern seems to indicate further support of
the hpyothesis that the observation data and the sociometric choices are
measuring different qualities.
FIPage 7
Discussion
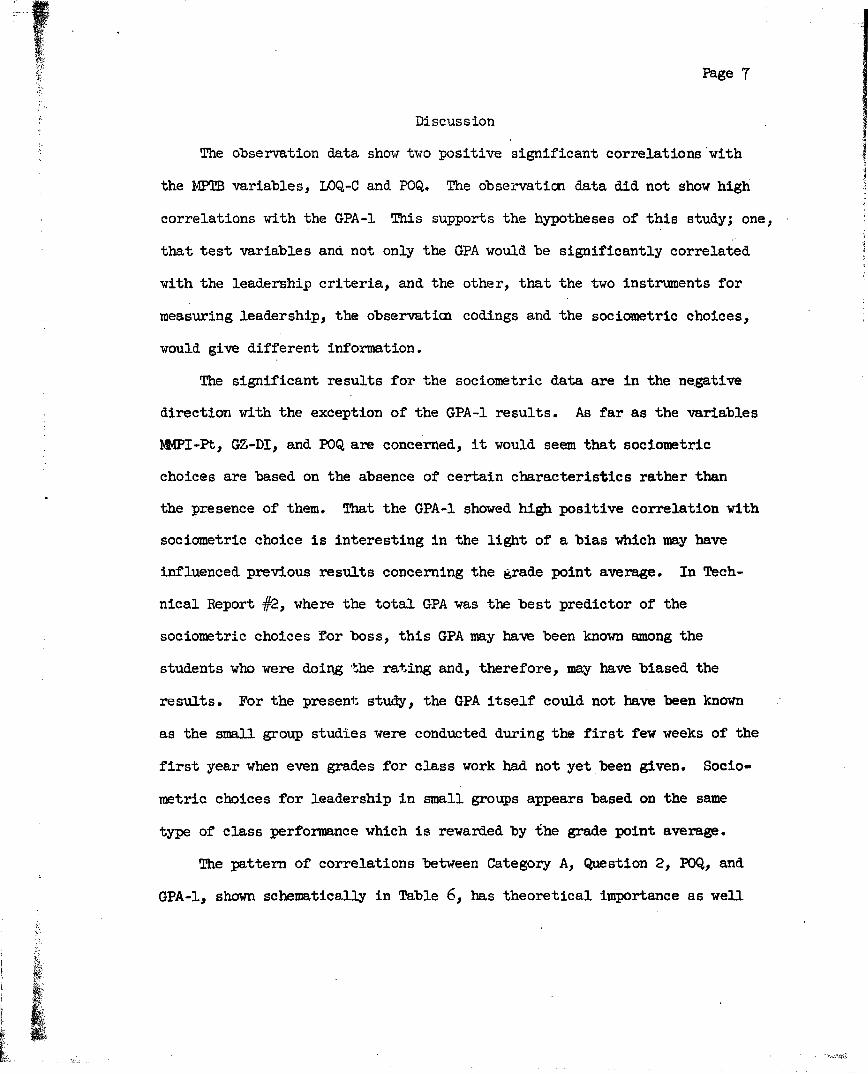
The observation data show two positive significant correlations with
the KMTB variables, LOQ-C and POQ. The observation data did not show high
correlations with the GPA-l This supports the hypotheses of this study; one,
that test variables and not only the GPA would be significantly correlated
with the leadership criteria, and the other, that the two instruments for
measuring leadership, the observatim codings and the sociometric choices,
would give different information.
The significant results for the sociometric data are in the negative
direction with the exception of the GPA-I results. As far as the variables
4P1-Pt, GZ-DI, and POQ are concerned, it would seem that sociometric
choices are based on the absence of certain characteristics rather than
the presence of them. That the GPA-l showed high positive correlation with
sociometric choice is interesting in the light of a bias which may have
influenced previous results concerning the grade point average. In Tech-
nical Report P, where the total GPA was the best predictor of the
sociometric choices for boss, this GPA may have been known among the
students who were doing the rating and, therefore, may have biased the
results. For the present study, the GPA itself could not have been known
as the small group studies were conducted during the first few weeks of the
first year when even grades for class work had not yet been given. Socio-
metric choices for leadership in small groups appears based on the same
type of class performance which is rewarded by the grade point average.
The pattern of correlations between Category A, Question 2, POQ, and
GPA-I, shown schematically in Table 6, has theoretical importance as well

Page 8
as supporting the rationale for this study. Category A is a measure of
observed behavior where the observers are asked to code strictly goal-oriented
acts in this category. It seems that this behavior is characterized by
high authoritarianism (POQ) but does not depend on qualities associated with
a high grade point average. The sociometric questionnaire represents
choices among the members of the group where Question 2 reflects a social
facilitation phenome&ion. This behavior is characterized by the reverse of
the task-oriented behavior, that is, qualities which are associated with a
high grade point average and a low authoritarianism. These results have
support in other leadership studies (Bales, 1950) which have found that
groups are characterized by two types of leaders, the task leader aid t h
socio-emotional leader.
A hypothesis for further research is suggested by the sociometric
data. Considering that GPA is highly correlated with both peer ratings
for desirability as boss and Question 2 for the guidance of the group, it
is hypothesized that boss ratings will also be correltated with guidance.
If thi& :hypothesis is confirmed, another significant step will be made
toward understanding the qualities which represent desirability as boss
and toward specifying the characteristics of the leader in small groups.
Summary
The purpose of this study was to indicate whether personality test
variables would be useful in predicting criteria of leadership. A corol-
lary purpose was to study the relatia ship between the two instruments for
measuring leadership, observation codings and sociometric choices, in the
way they correlated with selected Management Potential Test Battery variables.
L"

Page 9
While the GPA-I showed significant correlations with the sociometric
data, average corralation is +.57 with guidance of the group, GPA-1 was
not highly correlated with any of the observation data. In addition, the
POQ proved to be significantly correlated with both the observation data,
average correlation with task-oriented acts is +.50, and the sociometric
data, average correlation with guidance is -.37. These results, particu-
larly where the POQ correlated in the opposite directions with the obser-
vation data and the sociometric data, indicate that the sociometric choices
by members of the group are based on different qualities of leadership
than are observers' ratings of the same group behavior. Thus it may be
possible to obtain other personality correlates which will discriminate
between different types of leadership activity in the small group.
Of theoretical importance is the finding that observatia codings and
the sociometric choices seem to be measuring two different types of leader-
ship behavior, task-oriented behavior and socio-emotional behavior. The
task leader is characterized by high authoritarianism while the socio-emo-
tional leader is characterized by high academic achievement and low
authoritarianism.
Future analyses of these small group data plan to include using all
of the MPTB variables to predict each of the seven leadership criteria
in order to further understand the personality correlates of small group
leadership behavior.

References
Bales, Robert F. Interaction Process Analysis: A method for the study of
small grous. Cambridge: Addison-Wesley Press, 1950.
Bass, B. M., Wurster, C. R., Doll., and Clair, D. J. "Situational
factors in leadership among sorority women." Psycb.
Monographs. 1953, 6, 16.
Harrell, T. W. TPerception of leadership in small groups." ONR Technical
Report #1, Graduate School of Business, Stanford University,
February 1963.
Harrell, T. W. "Correlation between peer ratings and behavior patterns."
0NR Technical Report #2, Contract Nonr 225(62), Graduate
School of Business, Stanford University, May 1963.
Harrell, T. W. "A comparison of the results obtained from various measures
of leadership behavior." ORR Technical Report #3, Contract
Nonr 225(62), Graduate School of Business, Stanford University,
July 1963.
Haythorn, W. "The effects of varying combinations of authoritarian and
equalitarian leaders and followers." In Maccoby, E. et. al.,
(eds) Readings in Social Psychology. New York: Henry Holt
and Co., 1958.
Mann, R. D. "A review of the relationship between personality and perfor-
mance in small groups." Psych. Bull., 1959, 56, 241-270.
McNemar, Q. Psychological Statistics. New York: John Wiley and Sons, Inc.,
1962.

Page 11
Table 1
Available Data for Small Group Studies
Leadership Criteria
Observation data:
Category A - Task-oriented acts
Category B - Group solidarity acts
Category C - Individual prominence acts
Total Activity - Summation of Categories A, B, and C
Sociometric data:
Question 1 - Who contributed the best ideas during the discus-
sion? (best ideas)
Question 2 - Who did the most to guide the discuss4 on and keep
it moving effectively? (guidance)
Question 3 - Which member of the group stood out most definitely
as the leader in the discussion? (leader)
Management Potential Test Battery (NMB) Variables
Strong Vocational Interest Blank:
Engineer
Production Manager
Personnel Director
Accountant
Sales Manager
President of Manufacturing Concern
Masculinity -Femininity
(Table continued on next page)

Page 12
Minnesota Multiphasic Personality Inventory:
K, Hs, D, Hy, Pd, Mf, Pa, Pt, Sc, Ma, Si,
Ego Strength
Dominance
Builford-Zimmerman Temperament Survey:
General Activity
Restraint
Ascendance
Social Interest
Emotional Stability
Objectivity
Friendliness
Thoughtfulness
Personal Relations
Masculinity
Leadership Opinion Questionnaire:
Consideration
Initiating Structure
Ghiselli Self-Description Inventory:
Supervisory Qualities
Initiative
Self -Assurance
Ibcision -Making
Test of Imagination:
n Achievement
n Affiliation
n Power
(Table contibued on next page)

Page 13
Personnel Problems
Public Opinion Questionnaire
Graduate School of Business - Grade Point Average
F:

-14-
Table 2
Distributions of Spearman's Rank Order Correlations BetweenSeven Leadership Criteria and Nine MPTB Variables1
Category A Group Task-Oriented Acts:
X15 X22 x 24 X26 X27 X34 x41 X46 x47
40 80 90 80 80 100 100 80 10040 80 82 60 68 90 90 48 2018 62 80 42 65 88 70 -02 -4005 30 80 4o 50 4o 68 -18 -52-10 07 40 40 40 35 30 -22 -58-12 -25 10 20 38 20 22 -30 -62-25 -42 08 18 30 -28 20 -65 -70-38 -80 -02 12 20 -32 10 -90 -9o-62 -30 -10 -38 -32 -18-70 -32 -18 -50 -40 -20-80 -70 -32 -55 -60 -40-90 -92 -38 -100 -40
N =12 8 12 12 12 11 12 8 8
Avg.r =-32 14 10 15 01 45 50 -21 -40
Category B Group Solidarity Acts:
X15 X22 X24 X26 X27 X34 X41 X46 X47
80 5Q 70 70 88 82 40 100 8065 48 20 58 22 42 30 68 6042 20 -10 20 10 08 30 48 1532 -28 -70 08 -02 08 -20 20 -08-30 -30 -72 -25 -,2 -28 -30 -02 -10-78 -32 -82 -4o -85 -4o -50 -10 -50-90 -90 -90 -70 -85 -40 -65 -92 -82
N 7 7 7 7 7 6 7 7 7
Ave.r = -09 -19 -49 07 -13 20 15 36 o6
(Table continued on next page)

-15-1
Category C Individual Prominence Acts:
51 22 24 26 27 34 41 X4 6 X4 7
08 82 35 20 18 70 50 6o 90-02 32 -58 20 00 -10 10 42 -10-38 30 .-70 -30 -58 -12 12 38 -32-4o 12 -82 -82 -70 -68 -6o 32 -58
N 4 4 4 4 4 4 4 4 4
Ave.r,= -02 42 -52 26 32 20 03 45 12
Total Activity
X15 X22 X24 X26 X27 X34 X41 X46 X47
70 80 80 95 100 100 80 80 10055 80 80 80 80 90 80 48 5040 62 62 70 70 80 30 30 2040 50 60 60 70 80 22 25 0040 4o 50 6o 58 60 20 05 -32-02 20 4o 40 50 40 10 -02 -32-12 18 32 40 42 35 00 -18 -40-20 00 28 40. 40 -02 -10 -20 -6o-25 -10 10 22 25 -20 -28 -32 -62-38 -25 -12 22 20 -32 -30 -40 -80-42 -42 -30 -10 15 -32 -40 -65 -90-55 -4o -10 -55 -32 -4o-62 -50 -32 -62 -6o -80-80 -92 -62 -100 -9o
N 14 11 14 14 14 13 14 11 11
Ave.r = -05 36 13 38 30 .47 07 05 -24
IS

-16-
Question 1 Best ideas
x x x x x x x x x15 22 24 26 27 34 41 46 47
80 98 95 90 60 82 90 82 9048 98 82 70 55 58 58 80 4038 90 80 60 48 50 30 77 3838 62 77 50 30 40 30 48 3012 50 20 30 -10 18 10 10 2200 40 10 -02 -18 08 -10 00 20-08 22 00 -05 -18 -10 -15 -18 20-08 10 00 -10 -25 -30 -30 -30 10-25 -38 -10 -18 -52 -32 -40 -32 -12-30 -40 -18 -18 -60 -32 -50 -38 -30-50 -4o -70 -20 -80 -38 -52 -42 -42-62 -50 -80 -58 -82 -38 -60 -60 -70-78 -52 -90 -85 -90 -40 -80 -9o -78-90 -92 -90 -100 -100
N 14 13 14 14 14 13 14 13 13Ave.r= -13 38 -04 -04 -42 02 -24 01 03
Question 2 Guidance of the group
X15 X22 X24 X26 X27 X. X41 X46 x47
75 100 100 80 75 80 70 100 8060 82 98 80 70 80 58 68 5040 82 90 75 68 75 38 58 4020 68 70 70 60 60 30 48 3812 62 58 70 60 50 10 18 3000 50 48 70 35 12 -05 05 20-02 20 40 60 25 00 -10 -30 -18-22 20 38 40 20 -05 -60 -38 -32-32 08 -05 38 -10 -12 -62 -4o -52-55 -10 -10 12 -25 -18 -80 -40 -78-62 -10 -20 08 -40 -32 -80 -42 -80-62 -42 -40 -10 -42 -32 -80 -52 -80-65 -58 -18 -50 -4o -80-90 -80 -20 -78 -4o -80-90 -92 -92 -100 -90
N 15 12 15 15 15 14 15 12 12Ave.
-26 57 29 27 -09 15 -37 19 -12

-17-
Question 3 Leader
x x x x x x x x x15 22 24 26 27 34 41 46 47
70 95 95 95 70 95 60 95 9565 95 95 70 68 90 6o 82 7065 82 80 70 65 75 50 68 7035 68 70 68 60 70 42 60 5510 62 58 65 58 60 40 50 3802 30 35 65 50 3 30 48 20-02 20 32 40 40 35 20 35 20-12 20 12 40 35 35 10 22 -20-12 12 -02 22 35 10 00 -18 -30-18 -02 -10 10 18 00 -30 -18 -32-35 -10 -15 -02 15 -12 -30 -20 -38-62 -10 -18 -02 10 -20 -40 -25 -40-62 -25 -25 -10 00 -25 -55 -50 -6o-70 -40 -30 -18 -10 -30 -65 -60 -68-80 -70 -50 -25 -30 -32 -65 -65 -85-80 -62 -30 -32 -62 -85-80 -70 -50 -35 -70 -90
-100 -92 -90 -100 -90
N 18 15 18 18 18 17 18 15 15Ave.r = -37 28 06 16 10 19 -20 18 -04
1Key to variables:
X = NMPI-Pt15
X22 = First year grade point average (GPA-1)
X 24= GZ - General Activity
X26 = GZ - Ascendance
X27 = GZ - Social Interest
X34 = LOQ - Consideration
X41 = POQ - F Scale
X = ETS - Verbal score
X47= ETS - Quantitative score
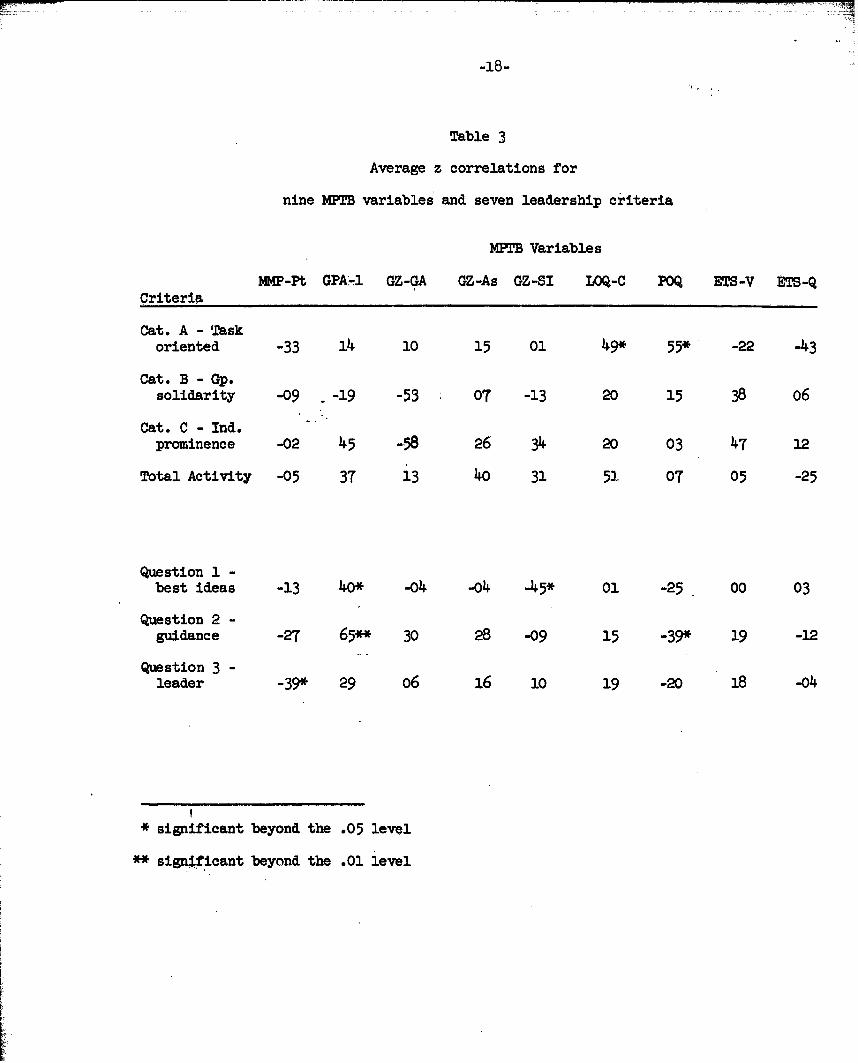
Table 3
Average z correlations for
nine KMT variables and seven leadership criteria
KMP~ Variables
MW-Pt GPA*-!l GZ-GA GZ-As GZ-SI LOQ-C POQ ETS -V ETS-QCriteria
Cat. A - Taskoriented -33 14 10 15 01 219* 55* -22 -43
Cat. B - Gp.solidarity -09 -19 -53 07 -13 20 15 38 06
Cat. C - Ind.prominence -02 415 -.58 26 34i 20 03 47 12
Total Activity -05 37 13.0o 31 51 07 05 -25
Question 1 -best ideas -13 4o* -o~4 -o.4 -45* 01 -25 00 03
Question 2 -guidance -27 65** 30 28 -09 15 -39* 19 -12
Question 3 -leader -391* 29 o6 16 10 19 -20 18 -04
*significant beyond the .05 level
**sigificant beyond the .01 level

Table 4
Distribution of' absolute z scores about the median
for each of the rows
MPTB Variables
lAMP-Pt GPA-l GZ-GA GZ-As GZ-SI LOQ-C POQ ETS-V ETS-QCriteria
Cat. A - Taskoriented + - - -+ + + +
Cat. B - Gp.solidarity -+ + - -+ -+-
Question 1 -
best ideas + + -- + -+--
Question 2 -
guidance -+ + + -- +--
Question 3 -leader + + --- + +--
No. scoresabove median 3 4 2 1 1 3 4 2 1
No. scoresbelow median 2 1 3 4 4 2 1 3 4

-20-
00 CU - Cj -.4
U2
- 1010
+ + ' +
+ +- +
0 +'+ +
4.,a
0
0 Hb 0 H)0 A)
w 0 a
4-4 H
0
q. 0++ + +
++ ++
CM
14rj4+3 4) II
H0, Il + +

-21-
Table 6
Matrix of average z scores for
four selected variables1
MPTB Variables
GPA-I POQ
Cat. A - Task
oriented 4 55*
Criteria
Question 2 -
guidance 65** -39*
These four variables were selected from the larger matrix shown
in Table 3.
*Significant beyond the .05 level
**Significant beyond the .01 level