unclassified ad number - defense technical … ad number ... r integrated computer-aided...
TRANSCRIPT
UNCLASSIFIED
AD NUMBER
ADB062457
NEW LIMITATION CHANGE
TOApproved for public release, distributionunlimited
FROMDistribution authorized to U.S. Gov't.agencies only; test and Evaluation; Jun1981. Other requests shall be referred toAir Force Wright Aeronautical Laboratory,Attn: MLTC, Wright-Patterson AFB, OH45433.
AUTHORITY
AFWAL ltr, 22 Apr 1982
THIS PAGE IS UNCLASSIFIED

THIS REPORT HAS BEEN DELIMITED
AID CLEARED FOR PUBLIC RELEASE
UNDER DOD DIRECTIVE 5200.20 ANDNO RESTRICTIONS ARE IMPOSED UPON
ITS USE AND DIGCLOSUREe
DISTRIBUTION STATE9ENT A
APPROVED FOR PUJBLIC RELEASEJ
DISTRIdJTION UNLIMITED,

THDOUN SW
THIS ISOUMN' BEST
QUALITY AVAILABLE. THE COPY
FURNISHIED TO DTIC CONTAINEDA SIGNIFICANT NUMBER OF
T" ES -TV HICH DO NOT
'RI2> UC] LEGIBLLY
REPRODUCED FROMBEST AVAILABLE COPY

IJ
AFWAL-TR-81-4023
VOLUME IV
ADB062457r INTEGRATED COMPUTER-AIDED MANUFACTURING (ICAM)
ARCHITECTURE PART II
VOLUME IV - FUNCTION MODELING MANUAL (IDEF 0 "
DTEQ,,-ELECTE.
SofTech. Inc. ' FEBOS, 0460 Totten Pond RoadWaltham, MA 02155u 0
FOR EARLY DOMESTIC DISSEMINATION
Because of its significant early commercial potential, this Information, which has beendeveloped under a U. S, Government program is being disseminated within the UnitedStates In advance of goneral publication. This Information may be duplicated and usedby the recipient with the expressed limitations that it not be published nor released toforeign parties without appropriate IIranses. Reiease or this information to otherdomestic parties by the recipient shall be made subject to these limitations. This legendshall be marked on any reproduction of this data In whole or in pert. These limitationsshall be considered void after two years after the release date on the data.
SUBJECT TO EXPORT CONTROL LAWSThis document contains information for manufacturing or using mu-nitions of war, Export of the Information contained herein, or releaseto foreign nationals within the United States, without first obtainingan export license, Is a violation of the International Traffic.in.ArmsRegulations. Such violation is subject to a penalty of up to 2 years im.prisonment and a fine of $100,000 under 22 USC 2778.Include this notice with any reproducea portion of this document,
"C.) DISTRIBUTION STATEMENTDistribution limited to United States Government agencies only: Test and Evaluation Data;
SiStatement applied June 15, 1961. Other requests for this document must be referredto AFWAL/MLTC, WPAFB, OH 45433,
MATERIALS LABORATORYAIR FORCE WRIGHT AERONAUTICAL LABORATORIESAIR FORCE SYSTEMS COMMANDWIGHT-PATTERSON AIR FORCE BASE, OHIO 45433 8 02 '8 023~~~~~~~~ 2... . . 0 .. • . .. .. • •• , ,,'I
-• , • '.• . ••,, V '• '., , • • .777 . .. . .,

NOTTC:S
When Govorpnunt drawlngs, Spoolif1ications, or other data are used for any purposaother than in connoction with a definitely related Govornmont procurement operation,the United States Governmont thazebY incurs no rvsponslbility nor any obligationwha.soeverl and the face that tho Govrnment may have formtulated, furnished, or ineny way supplied the said drawing.s;, ,•ocifici-ttions, or othor data, is not to beregarded by Implicatiun or othcrwivc'v as in any manner licensing the holdro or anyother person or corporation, or 'onvoiing any rights or pernmiAaon to manufaoture,U8e, or, sell shy patentod invention, that may- in eny way birelated, thereto.
Note that this documont, bears the label "1FED" an acronym for, "FOR ERLY DOMESTCDISSEMINATIOn" * The FWDD label is affixed to documents that may contain informationhaving high commorcial potential.
The FEDD concept was daveloped as a result of the desire to maintain-,U.S. leadershipin world trade markets and encourage a favorable balance of trade. Since the avail-ability of tax supported U. S. technology to foreign bueine•as interesse could repre-ve,it an unearned benefit. research results that may hava high ;ommnercial potentialare being distributed to U. S. industry in advance of general release.
The recipient of this report must treat the information it contains according to theconditiqns of the FDE label on tho front cover....
Thiv tchni..al xcpcrt has boon reviewed and is apparvavd for publicat,.on.
*"T;=iR.iI-1t CaptiUAProject ManagerComputer Integrated Mfg Branch
N.TIIAN G. TUPPERChiefComtputer Integrated Mfg Branch
"If your addrcss has changed, if you wish to be removed from our mailing list, orif tho addroseo is no longnr employed by your orgjanisation, ploase notifyMAIL/ILTC, Wright-Patt.ursoah AP13, Ohio 45433 to holp us maintain a 'ouront maillnglist,"
Co'pies of this rt.p'ort nhoo.Zd not b.-# returnad unleas return Ise i rcuired by securi•tconsidor,•iooe, contrn,'tuaJ obligationa, or ;2ot104 on a u~..oAi d~ouamnt.Wn FO..M.../. .8iuewy I$" - IS...
T 77i

UNCLASS IF7.EDSECURITY CLASSIFiCATION OF THIS PAGE i*.on DatKnfe•d)f , ,
REPORT DOCUMENTATION PAGE OKFR CIT.UCTONG '"I rFP5RT NUUF.-R 1:. OOVT ACCESSION NO. I. RIECIPIENT'S CATALOG NUMNEP,
AFWAL-TR-81-4023, Volume IV V) 6 6,1 /5'74 TIT LF (end Sr,hritlfw S. TYPE OF REPORT A PERIOD COVERED
INTEGRATED COMPUTER AIDED MANUFACTURING (ICAM) Final - 29 September 1978ARCIIITECTURE PART II- through 10 May 1981Volume IV.'lFunction Modeling Manual (XDEFo), S. PERIMORMINO ONO. REPONR NUME R
I AUTHORp.) I. CONTRACT OR ORANT NUMEER(4)
F33615-78-C-515f). PERIrORMINO 0IIAIIZATION NAA I: ki.d M"C.JDRI -, TAK
AliA& iIUIi AN Mi0SV
SofTech, Inc.
460 Totten Pond Road 78011FWaltham, MA 02154
II. CONTROLLINO OFFICE NAME AND AtIORESK IS, NREORT OATSMaterials Laboratory (AFWAL/MLTC) June 1981AP Wright Aeronautical Laboratories (AFSC) t1 Nom11 OF PA CWright-Patterson AFB, OH 45433 -T_ 167 (__ . i('
14 MONiTOu-O A V NAME A AOOq•ElS ,lTk! 11.ent trpia CIrplling (.il/rif) i. SECURITY CL ASS-(of this ,eperi)
UNCLASSIFIED
a ut"CAIbON/06WNORAING
16. OfIT MIIUION Em T I. h fl.1 .+,)Distribution limited to United States Government agencies onlyi Test and"Evaluation Data: Statement applied 15 June 1981. Other request. for thisdocument must be referred to AFWAL/MLTC, WPAFB, Oi 45433.
II. OI1TAIUTION STATEMENT ,'ol ;h.e abstraclt 8.18td '1 d11,10A 00, It dillItnI ftem Ropafl,)
I, ISUPPLEMENAMY NOTES
IW. KEY WOROS (Con#1nmu un rev&,.. aide It noeII Marywd Identify bl blect nlumber) t CAN MFI±1
Manufacturing Architecture IDEF 84C2Model of Manufacturing AUTOID3F0 MCMMO/MrGOIntegrated Computer Aided Manufacturing MFao BMCO/MFGOSubsystem Integration DESIGNO
40. ABSTRACT (Comnlin on PVI etall41 11440 II n"o004*680 011d Id4r011106 by 610c0 number)The overall objective of the Integrated Computer Aided Manufacturing (ICAM)Architecture Part II was to utilize and expand the manufacturing architecture.Included in this objective were the support and direction of future ICAN pro-jects, logical design of manufacturing systems, validation and verification ofICAM modules, integration of ICAM modules and the orderly transition of ICAMmodules into ICAM systems. This volume, Volume IV, is the manual given tostudents lesrninq the IDEFO function modeling methodology for describingmanufacturing functions.
'DD , R 1473 ErWYON OF I NOV 6l 1I OSlOLETI
IsCUlrIV CLAARgICMAVION OPF T10 1e4 (Owen Date. .,-,so
'31 1 110. 1F. _

UNCglaSSIFIED111SCURIY CLAIFI.ICATION Or THI PA0.(Wh1n De.s #ne.•e .
The report is presentted in the following eleven volumes.
1. Volume I - Architecture Part I1 Accomplishments2. Volume I1 - Architecture - A Structured Approach to Manufacturing3. Volume III - Integration Using Architecture4. Volume IV - Function Modl3ng Manual (IDEF0 )5. Volume V - Information Modeling Manual (ID.PI)6. Volume VI - Dynamics Modeling Manual (IDEF 2 )7. Volume VIZ - Composite Function Model of "Manufacture Product" (MPGO)8. Volume VIII - Composite Function Model of "Design Product" (DESIGNO)9. Volume IX - Composite Information Model of "Manufacture Product" (MFGl)
Part I - MPG DevelopmentPart 2 - MPFG Model
10. Volume X - Dynamics Model of a Sheet Metal Cmnter.Subsystem (SMC2)11. Volume XI - ICAM Library Maintenance and Distribution Procedures
ii
I --
UNCLASSIFIED' t' AWN.~ ICATIC. us eir * .I',
"n . ..w . ' , ,, ...

I,
FOREWORD
This report was prepared by SofTech, Inc., Waltham, Massachusetts underUSAF Contract F33615-78.C.5158. This is the final report describing thePart II work performed on thea ICAM Architecture of Manufacturing; Infor-mation Modeling; Subsystem Integration; Tools Development; User InterfaceRequirements; and the Architecture of Design. This work was performedduring the period of 29 September 1978 through 10 May 1981 and was initi-ated under the direction of the ICAM Program Manager, Mr. Dennis 2. Wimnosky,and sponsored by the Manufacturing Technology Division, Materials Laboratory,Air Force Wright Aeronauticel Laboratories at Wright.Patterson AFB, Ohio.The Air Force Project Managers for this project were: Mr. Richard Mayerthrough 30 June 1979 and Captain Steven R. LeClair through completion. Theprime contractor for the project was SofTech, Inc. The Project Manager for jSofTech was Mr. Reuben Jones. Primary Coalition Team Companies participatingon this project were: Rockwell International, Vought Corporation, HughesAircraft Company, Dan Appleton Company, Northrop Corporation, Boeing ComputerServices, Boeing Commercial Airplane Company, Pritaker & Associates, HighbrOrder Software, and Control Data Corporation.
Aocenntoan For
NTIS GRA&I
DTIC TATIAUunii • ot~ut e~d
JBy-t -t I '. t I ttou . _. .
D l.•;t r I hu l on ,1/
uTAvltilnbility CodssTAvili and/orf Tio Dist Spocial
iCo Ai

PREFACE
IDEF 0 is based upon SofTech's Structured Analysis and Design
Technique (SADT). SADT concepts stem from a long history of problem-
solving theoretical efforts by D. T. Ross, as influenced by the "Human-
directed Activity Cell Model" approach of Dr. S. Hort, then of IITRI. The
SADT method was first formalized in a joint course-preparation program
partially funded by ITT. Later a subset of this material was revised and
published as IDEF0 under the ICAM Program.
Principal contributors to the development of IDEF0 are:
D. T. Ross MIT and Developer of original conceptsSofTech, Inc.
' S. Hori IITRI Developer of Cell ModelingConcepts
C. G. Feldmann MIT and Primary author of first SADTSofTech, Inc. Reference Manual and manager
of first IDEF0 applicationsprojects.
D. E. Thornhill SofTech, Inc. Primary author of firstformal SADT course materialand application to governmentand commercial projects.
R. R. Bravoco SofTech, Inc. Application of SADT andIDEF to Manufacturing
M. F. Connor SofTech, Inc. Developer of revisedand D. A. Marca commercial SADT materials
and applications tocommercial projects.
Judy Kornfeld SofTech, Inc. Developed criteria for judg-ing quality of IDEF 0 models.
iv
e A. Lk., K . .... . . . ...... ......."N

TABLE OF CONTENTS
Section Pp
1 INTRODUCTION1'12 IDEF C~ONCEPTS 53 UNDERSTANDING IDSF 0 DIAGRAMS 1?
4 READING IDEF 0 DIAGRAMS 47
5 IDEF FORMS AND PROCEDURES 59
6 AUTHOR'S GUIDE TO CREATING IDEF0 DIAGRAMS 81
7 DATA 'COLLECTION FOR IDEF MODELING 135
8 IDEF GLOSSARY 1470
9 IDEF0 INDEX OF TERMS '153
Appondix
A SYNOPSES OF VOL. I THROUGH VOL. XI 163
B ARCHITECTURE PART 11 - FINAL REPORT 167DOCUMENT REQUEST ORDER FORM

SECTION 1
INTRODUCTION
CONTROL
INPUT FUNCTION OUTPUT
IM
[ ~MECHAN ISM
1!

INTRODUCTION
The U. S. Air Force Program for Integrated Computer Aided
Manufacturing (ICAM) is directed toward increasing manufacturingproductivity through the systematic application of computer technology.
The ICAM Program approach is to develop structured methods for applying
computer technology to manufacturing and to use those methods to better
understand how best to improve manufacturing productivity.
The ICAM Program identified a need to better communicate and
analyze manufacturing for the people involved in improving productivity.
To satisfy that need, the ICAM Program developed the IDEF (ICAM
Definition) method to address particular characteristics of manufacturing.
IDEF is comprised of three modeling methodologies which graphically
cha±eacterize manufacturingi
IDEF0 is used to produce a function model which is a structured
representation of the functions of a manufacturing system or environment,
and of the information and objects which interrelate those functions.
IDEF 1 is used to produce an information model which represents
the structure of information needed to support the functions of a
manufacturing system or environment.
IDEF?. Is used to produce a dynamics model which represents the
time varying behavior o: functions, information and resources of a
manufacturing system of environment.
Each of the three models individually or any group of models can
form an "ARCHITECTURE" when the environment of system being modeled
is comprised of component systems, organizations and/or technologies
which must work together to accomplish the overall objective (production)
of the manufacturing environment or system. The significance of the
models being referred to as "ARCHITECTURES" is that they are blueprints
or frameworks which define graphically the fundamental relationships - the
fit Iya~'a. a a3'
.oa WAW I

functional interfaces, identification of common, shared and discrete
intormation, and dynamic interaction of resources. It is important to
recognize that the IDEF models become Archftectures when used to better
understand, communicate and analyze rot only the subject environment or
system (manufacturing) but how its constituent components (system,
organizations and technologies) fit together.
IDEF is a method, Architecture is a means and improving manu-
facturing productivity is the end which the ICAM Program Is pursuing
within the U. S. aerospace industry
The following material is a discussion of the fundamental concepts,
techniques and procedures regarding the use of IDEF0 to produce a
function model.
AL4

SECTION 2
IDEF CONCEPTS
CONTROL
INPUT - FUNCTION 10OUTPUT
MECHANISM
rI,'

IDEF0 CONCEPTS
2.1 )ýBackaround
The desire of the U. S. Air Force to reduce costs and lead times
by assisting the Aerospace Industry in its modernization efforts has beenevidenced irn the many'ýTech Modw"(Technology Modernization) programs (I
now underway. A ,imilar goal, but using an industry-wide target rather
than individual companies, was established under the ICAM Program. In
ICAM, the goal was to develop "generic subsystems" which could be usedby a large number of companies to provide a significant upgrade to the
industry as a whole, These A';ubsystem "'provide support for commonmanufacturing functions such as management of information, ahop floor
scheduling, and materials handling,
This ambitious goal needed a common baselinelf communicationvehicle around which to plan, develop, and implement the subsystems in
the individual Aerospace Companies. This baseline was called the
("Architecture of Manufacturing< since it was to provide an industry-wide
("architecture' showing how industry worko today and around whichgeneric subsystems could be planned, developed, and implemented.
To develop the Architecture of Manufacturing, a "language" was
needed in which to express and document current Aerospace Industryoperations, At the outset of ICAM, the Air Force issued a Request for
Proposal to build the architecture. A "cell modeling technique" was
"specified as the expreesive language (where a "cell" was defined as amanufacturing cell, or operational unit). To be successful, the languagehad to satisfy the following criteria:
0 Since the architecture is to depict manufacturing,it must be able to express manufacturing operationsin a natural and straightforward way.
4 Since the subject is so vast and complex, it must beconcise and provide a straightforward means oflocating details of interest easily and quickly.
7 .... .• ... .. . .... .. . •,,. •.
7;7

0 Since it must be used by a wide audience, it mustbe able to communicate to a wide variety of AerospaceIndustry manufacturing personnel as well as to AirForce ICAM Program Office Personnel.
* Since it must serve as a baseline for generic subsystemplanning, development, and implementation, it mustpermit sufficient rigor and precision to insure orderlyand correct repults.
0 Since the baseline must be developed through thecooperative effort of a large segment of the AerospaceIndustry, it must include a methodololy (rules andprocedures) for its use that'pier it many diversegroups to develop architecture pieces and that permitwide-spread review, critique, and approval.
Since the baseline must represent the entire AerospaceIndustry rather than any one company or industrysegment, the method must include a means of separating"organization" from "function"t that is, a commonagreement cannot be achieved unless the individualcompany organizational differences are separated outand only the comr-on functional thread is captured.
The cell-modeling technique selected by the Air Force was the SADT
(Structured Analysis and Design Technique) originally developed in the
early 1970's. The major subset of this technique used by the ICAM Program
Office was later re-named "IDEF
2.2 IDEFo Concepts
The IDEF0 methodology hag 'Jsic concepts which address each of
00]the needs listed above, These basic IDEF 0 concepts arel
1. Cell Modeling.Graphic Representation. The "box andarrow" graphics of an IDEF'diagram show the manu-facturing operation as the box, and the interfaces to/from the operation as the arrows entering /leaving thebox. In order to be able to express real-life manu-facturing operations, boxes operate simultaneoulywith other boxes, with the interface arrows providing"["constraints" as to when and how operations aretriggered and controlled.
8
,•. .. ' , , . . . . . . . .

2. Conciseness. The documentation of a manufacturingarchitecture must be concise to permit encompassingthe subject matter. The linear, verbose characteristicsof ordinary language text is clearly insufficient. Thetwo-dimensional form provided by a blueprint-likelanguage has the desired conciseness without losingthe ability to express relationships such as interfaces,feedback, and error paths.
3. Communication, There are several IDEF 0 conceptsw-ich are designed to enhance communicationst
0 Diagrams based upon very simple box andarrow graphics.
0 English textual labels to describe box andarrow meaning, as well as glossary and textto define precise meaning of diagram elements.
0 Gradual exposition of detail, featuring ahierarchy with major functions at the top andsuccessive levels of sub-functions revealingwell-bounded detail breakout.
a A "node chart" provides a quick index forlocating details within the hierarchic structureof diagrams.
0 Limitation of detail on each successive diagramto not more than six sub-functions for ease inreader comprehension.
4, Ri and Precision. The rules of IDEF0 requiresufficient rigor and precision to satisfy ICAMarchitecture needs without overly constraining theanalyst, IDEF rules include:
* Detail exposition control at each level (3-6 boxrule).
• Bounded Context (no omissions or additionalout-of-scope detail).
* Diagram Interface Connectivity (Node Numbers,Box Numbers, C-Numburs, and Detail ReferenceExpression (DRE).
0 Data Structure Connectivity (ICOM codes anduse of parentheses) .
9
kN¾
I).,.AJ

0 Uniqueness of labels and titles (no multiplenames).
* Syntax Rules for Graphics (boxes and arrows).
Data Arrow Branch Constraint (Labels forconstraining data flow on branches).
0 Input vs. Control Separation (Rule' fordetermining role of data).
* Data Arrow Label Requirements (minimumlabeling rules).
a Minimum Control of Function (all functionsrequire at least one control).
0 Purpose and Viewpoint (all models have apurpose and viewpoint statement).
5. Methodology. Step-by-step procedures are provided formodelri'g, review, and integration tasks. Formal coursesfor transferring the methodology are available for trainingAerospace Industry personnel in these procedures,
6. Organization vs. Function. The separation of organizationfrom function is included M n the purpose of the model, andcarried out by the selection of functions and interfacenames during model development. This concept is taughtin the IDEF 0 course, and continual review during modeldevelopment ensures that organizational viewpoints areavoided,
2. 3 Discussion of Individual IDEFo Concepts
In the remaining sub-sections descriptions of some of the basic
concepts are elaborated to clarify them and show their utility in ICAM,
2.3.1 Cell Modeling Graphics
The IDEF 0 methodology may be used to model a wide variety of"systems", where a system may include any combination of hardware,
software, and people. For new systems IDEF 0 may be used first to specify
the requirements and functions and then to design an implementation that
meets the requirements and performs the functions, For existing systems,
IDEF0 can be used to analyze the functions the system performs and to
record the mechanisms by which these are done.
10
"" I ixJ:".1. . .1 . .
S . : ..., :, +, ,.. .•.. .. .

The result of applying IDEF0 is a model. A model consists of
diagrams, texts, and glossary, cross-referenced to each other. Diagrams
are the major components of a model. All manufacturing functions andinterfaces are represented as boxes (functions) and arrows (interfaces)
on diagrams.
The position at which the arrow enters a box conveys the specific
role of the interface. The manufacturing controls enter the top of the
box, whereas the materials or information acted upon by the manufacturing
operation enter the box from the left, resulting in the output of the
operation, which leaves the right-hand side of the box, The mechanism
(person or automated system) which performs the operation enters the
bottom of the box (see Figure 2-1).
; !Controls
S•.enufacturln•
Inputs Function
Figure i-1. Function Box and Interface Arrows
These box and arrow meanings are used to relate several sub-
functions on a diagram comprising a more general function. This diagram
is a "constraint diagram" which shows the specific interfaces whichconstrain each sub-function, as well as the sources and targets of the
interface constraints (see Figure 2-2).
V1W

FiurUN2.CosrTItDigrm(FntoA scntandb n nu n w oto. n
produce- Zigeotu1 wihcosriiFnto )Hee tetem'cntr~ns easthtaFUNCTIONuestemerl
or nfmatonshon eteingu the bo2. anCteefrionstrained fromam
operating by the Interfacet the function cannot act until the contents ofthe interface arrow in provided, and the way In which the function operatesdepends upon the details (value, number, etc.) of the content. of theinterface arrow.
2.3.2 Comm'~iocatIon by Gradual Exposition of Detail
One of the most Important feature. of IDEF 0is that it graduallyintroduces greater and greater levels of detail through the diagram
structure comprising the model. In this way, communication is enhanced
by providing the reader with a well-bounded topic with a manageable
amount of new Information to learn from each diagram.
The structure of an IDEF0 model is shown in Figure 2-3. Here, a
series of four diagrams is shown with each diagram's relation to the others..
41
J. "'I4 V............

--0 MORE CENERAL
MORE DETAILED(
This diagram Isthe "parent" ofthis diagram. *----i
EVERY COMPONENT MAY BE DECOMPOSED IN ANOTHER DIAGRAM
EVERY DIAGRAM SHOWS THL "INSIDE" OF A BOX ON A PARENT DIAGRAM
Figure 2-3. IDEF Model Structure0
13
~ A .1~ r4i

An IDEF 0 model starts by representing the whole system as a simple
unit -- a box with arrow interfaces to functions outside the system. Since
the single box represents the system as a whole, the descriptive name
written in the box is general. The same is true of the interface arrows
since they also represent the complete set of external interfaces to the
system as a whole.
The box that represents the system as a single module is then
detailed on another diagram with boxes connected by interface arrows,
Theme boxes represent major sub-functions (submodules) of the single
parent module. This decomposition reveals a complete set of submodulee,
each represented as a box whose boundaries are defined by the interface
arrows. Each of these submodule boxes may be similarly decomposed to
expose even more detail.
IDEF 0 provides rules to introduce further detail during decomposi-
tion. A module is always divided into no fewer than three, but no more
than six submodules. The upper limit of six forces the use of a hierarchy
to describe complex subjects, The lower limit of three insures that enough
detail is introduced to make the decomposition of interest.
Each diagram in a model is shown in precise relationship to other
diagrams by means of interconnecting arrows. When a module is decomposed
into submodules, the interface between the submodules are shown anarrows. The name of each submodule box plus its labeled interfaces define
A bounded context for that submodule.
In all cases, every submodule is restricted to contain only those
elements that lie within the scope of its parent module. Further, the
module cannot omit any elements. Thus, as already indicated, the parent
box and its interfaces provide a context. Nothing may be added or removed
from this precise boundary.
14
IN,

2.3.3 Disciplined Teamwork
The IDEF methodology includes procedures for developing and
critiquing models by a large group of people, as well as integrating
support subsystems into an IDEF 0 Architecture, Additional supportingprocedures such as librarian rules and procedures, are also included in
the IDEF 0 methodology. (It should be noted that some of these rules andprocedures, such as the Kit Cycle critique procedure, are also
used with other IDEF techniques.)
The creation of an IDEF 0 model is the most basic of these
"disciplined teamwork" procedures. The creation of a model is a dynamic
process which usually requires the participation of more than one person.Throughout a project, authors create initial diagrams which are distributed
to project members for review and comment, The discipline requires thateach person expected to make comments about a diagram shall make them in
writing and submit them to the author of the diagram. This cycle continues
until the diagrams, and eventually, the entire model, are officially accepted.
IDEF includes procedures for retaining written records of alldecisions and alternate approaches as they unfold during the project.
Copies of the diagrams created by an author are critiqued by knowledgeable
commenters who document suggestions directly onto the copies, Authors
respond to each c'mment in writing on the same copy. Suggestions areaccepted or rejected in writing along with the reasoning used. As changes
and corrections are made, outdated versions of diagrams are retained inthe project files,
The diagrams are changed to reflect corrections and comments, Moredetail is added to the model by the creation of more diagrams which also
are reviewed and changed, The final model represents an agreement on arepresentation of the system from a given viewpoint and for a liven eurpose.
This representation can be easily read by others outside the initial project,
used for presenting the system definition in short stand-up briefings or inweek long walkthroughs, and for organizing new projects to work on system
changes.
is

tlNDERSTANDIN4OIDEFO DIACRAMIS
CONTROL
INPUT FUCIN OUTPUT
MECHANISM
mow inu~mm ms1-
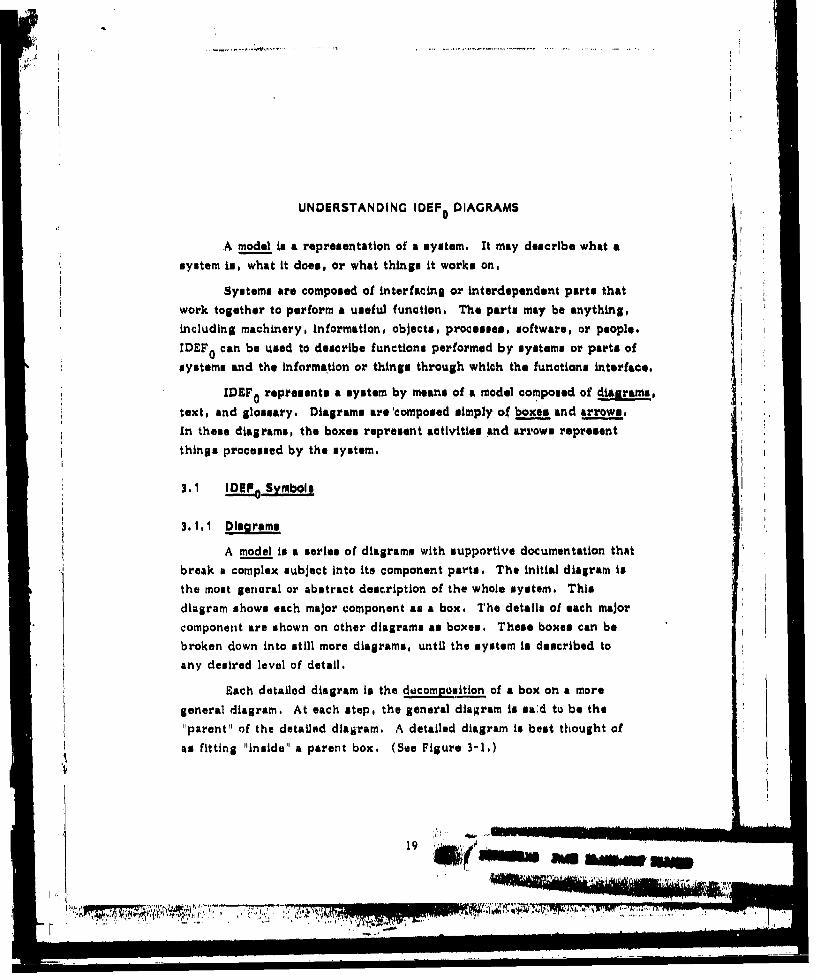
UNDERSTANDING IDEF DIAGRAMS0
A model is a representation of a system. It may describe what a
system is, what it does, or what things it works on,
Systems are composed of interfacing or interdependent parts thatwork together to perform a useful function. The parts may be anything,including machinery, information, objects, processes, software, or people.
IDEF 0 can be used to describe functions performed by systems or parts of
systems and the information or things through which the functions interface.
IDEF 0 represents a system by means of a model composed of diagrams,
text, and glossary. Diagrams are 'composed simply of boxes and arrows,In these diagrams, the boxes represent activities and arrows represent
things processed by the system,
3.1 IDEF Symbols
3.1.1 Diagrams
A model is a series of diagrams with supportive documentation thatbreak a complex subject into it. component parts. The initial diagram is
the most general or abstract description of the whole system. This
diagram shows each major component as a box. The details of each majorcomponent are shown on other diagrams as boxes, These boxes can bebroken down into still more diagrams, until the system is described to
* any desired level of detail.
Each detailed diagram is the decomposition of a box on a more
general diagram. At each step, the general diagram is sad to be the
"parent" of the detailed diagram. A detailed diagram Is best thought ofas fitting "inside" a parent box, (See Figure 3-1.)
19 WNW
P `

00 MORE GENERAL
-#
MORE DETAILED
This Idiagram Isthe "porenit" ofthis diagram. --
00 A41
Figure 3-1, Decomposition of Diagrams
20
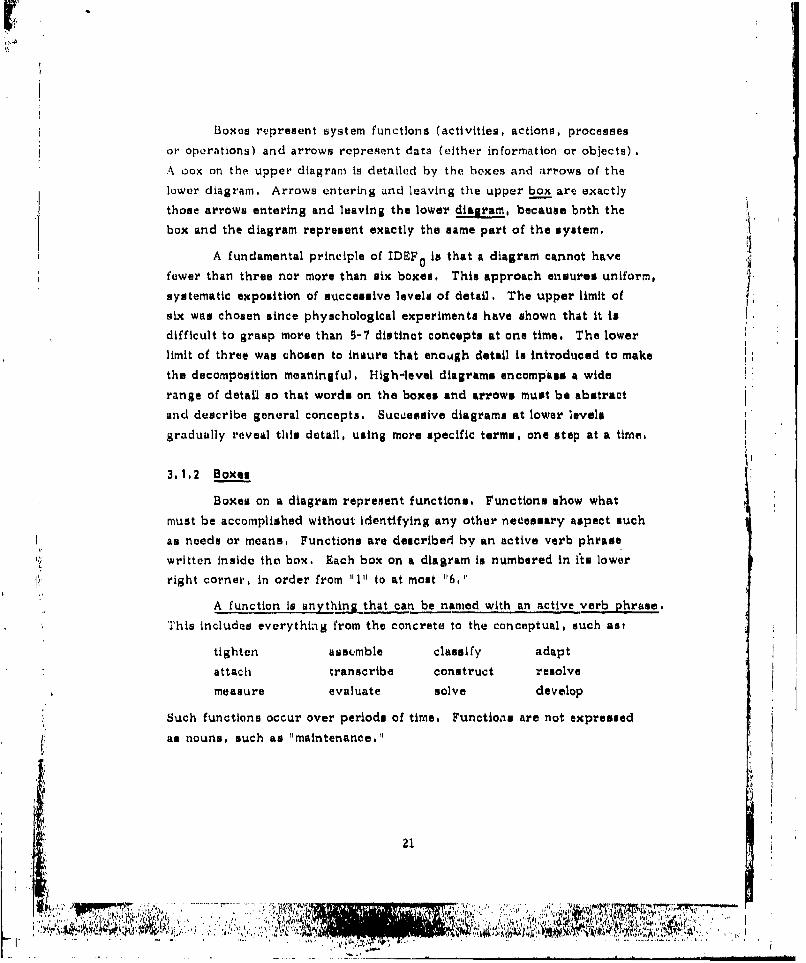
Boxes represent system functions (activities, actions, processes
or operations) and arrows represent data (either information or objects)
A oox on the upper diagram is detailed by the boxes and arrows of the
lower diagram. Arrows entering and leaving the upper box are exactly
those arrows entering and leaving the lower diag , because both the
box and the diagram represent exactly the same part of the system.
A fundamental principle of IDEF 0 is that a diagram cannot have
fewer than three nor more than six boxes. This approach ensures uniform,
systematic exposition of successive levels of detail. The upper limit of
six was chosen since physchological experiments have shown that it isdifficult to grasp more than 5-7 distinct concepts at one time. The lower
limit of three was chosen to insure that enough detail is introduced to make
the decomposition meaningful. High-level diagrams encompass a wide
range of detail so that words on the boxes and arrows must be abstract
and describe general. concepts. Sucuessive diagrams at lower levels
gradually reveal this detail, using more specific terms, one step at a time,
3.1.2 Boxes
Boxes on a diagram represent functions. Functions show what
must be accomplished without identifying any other necessary aspect such
as needs or means. Functions are described by an active verb phrase
written inside the box, Each box on a diagram is numbered in its lower
right corner, in order from "I" to at most "6."
A function is anythin. that can be named with an active verb phrase.
This includes everything from the concrete to the conceptual, such as:
tighten assemble classify adapt
attach transcribe construct resolve
measure evaluate solve de velop
Such functions occur over periods of time. Functions are not expressed
as nouns, such as "maintenance."
21
i ,
M ýU

3.1.3 Box/Arrow Relationship
The arrows that connect to a box represent objects or infor-
mation needed by or produced by the function. They are each labeled
with a.noun phrase, written beside the arrow. "Data" may be information,
objects, or anything that can be described with a noun phrase, The
arrows are constraints that define the boxes, not sequences or flows of
functions (Figure 3-2).
The side of t)ie box at which an arrow enters or leaves shows the
arrow's role as an input, a control or an output, Incoming arrows (left
and top of box) show the data needed to perform the function, Outgoing
arrows (right of box) show the data created when the function is performed.
From left to right (input to output), a function transforms data. An input
in converted by the function into the output. The terms input and output
convey the notion that a box represents a transition from a "before" to an"Rafter" state of affifrs,
These data are This date Isneeded to do the produced byFuncio doing the
Function
Figure 3-2. Arrows Clarify and Bound the Meaning of Each Box
A control describes the conditions or circumstances that govern
the function. The roles of input and control are different. The
distinction is important to understanding the operation of systems. The
assumption is that "an arrow is a control unless it obviously serves only
as input." Every function box will have at least one control arrow.
22
i I I

*it-
The bottom of a box is reserved to indicate a mechanism, which may
be the person or device which carries out the function. The input and
output shows WHAT is done by the function, the control shows WHY it i4
done, and the nmechaniam shows HOW it Is done. (Figure 3-3).
-r r*"V*Mg# AVi Mott PC em" g wmi
Figure 3-3. Box/Arrow Relltionship
Boxes represent collections of related functions, not just monolithic
actions, A box may perform various parts of its function under different
circumstancus, using different combinations of its input and controls and
producing different outputs. These are called the different activations
of the box. There may be several arrows on any one side of a box which
may indicate different activations.
If it is unclear whether a particular word is a noun (data) or a
verb (function), an1 "(n) " or I"(v)0 may be appended to the word. For
example, the word "Record" could mean a record, or the action of
recording. "Record (n)1 is used for the former case, and "Record (v)
is used for the latter,
The arrows on an IDEF 0 diagram represent data constraints,
They do not represent flow or sequence. Connecting the output of one
box to the input or control of another box showb a constraint. (Figure 3-4).
The box receiving the data is constrained, since the function cannot be
performed until the data is made available by the box that produces it.
The arrows entering a box show all the data that is needad for the function
to be p•erformed,
23.3\54.1

-ii
K]-L
Figure s-5.Simultaneous0 re SAct
I C-I
•i' "~~~* le .... . .... !'L+ "- -
Figur,. 3-4. MeanIng c4 Constraint
Several functions on a single diagram colidd be performeid sitnial-
taneously, if the needed constraints have been~ satisfied, Arrows connect
boxes, and an output of one box may provide* some nz .11 uf thea data
needed by one or more other boxes. (Figure 3-5).
aI e a 1#404 A
Figure 3-5. Simuftanejus Actioti

Neither sequence nor time is explicit in IDEF0 diagrams. Feedback,
iteration, continuous processes, and overlapping OIn time) functions are
easily shown by arrows, (Figure 3-6). The arrows connecting the left("input") or top ("control") of a box are constraints. They represent
data or objects needed to perform some part of the function. For example,
a draft system specification submitted for review may be approved and
thus become final, or it may be returned with comments and with a request
that a new draft be submitted. The latter reactivates the design function.
Both the design and the review are done with respect to the system
requirements.
Figure 3-6. Example of Feedback
Arrows may branch (implying that the same data is needed by more
than one function) or they may join (implying that the same class of data
may be produced by more than one function). The branches may each
represent the same thing, or different things of the same general type.
Labels state what the arrows represent. The labels on branches and joins
provide a detailing of the content of the more general arrow just as lower
level diagrams provide detailing of boxes,
25
S. ... : ...... • ., i i Ill mR m .. . . .: ..~ il O) •ei4 ,*rd"U ,,. [r$ ' '?T" .
,•,•--=- 'L, " ' ' '" • ""4'' '• ,U • • ••<'• •'' ' "• .... " i,'•• "!•• " , .. .,•,"" •';W

Data arrows, like function boxes, represent categories. It is
useful to think of high level data arrows as "pipelines" or 'conduits."
High level arrows have general labels. If they branch, each branch will
have a more specific label. (Figure 3-7). Arrow labels must convey the
author's intent to the reader, Using fewer arrows will reduce clutter and
make a diagram easier to understand but requires careful choice of
meaningful words to convey the message.
PIP&I&NW A S&Pireg iove@a VROLE c5 re Poevi
Figure 3-7. Example of Arrow Branching
On any given diagram, data may be represented by an internal
arrow (both ends connected to boxes shown on the diagram) or a
boundary arrow (one end unconnected, implying production by or use
by a function outside the scope of the diagram).
26
~~7*7.77 7 Mr T. ~ *~'

3. 1. 3. 1 Arrow Connections Between Boxes
To form a complete diagram, from three to six boxes az'e drawn and
connected by input, output, and control arrows. Any output arrow may
provide some or all of the input or control (or mechanism) to any other
box. All manner of arrow branches and joins are used to show box
relationshipd. An output arrow may branch and provide data to several
boxes, Arrows that are unconnected at one end represent data that is
supplied or consumed outside the scope of the diagram.
This brench means that "Alss" This L means that "account entre"(prodruce-* y box 1) are com- are created by some from DELIVZRposed of "customer records" PRODUCTS (box 2) and/or some from(needed by box 2) and "Price DO BILI.NG (box 3).and Tax Tables" (needed bybox 3).
EUIP ari& ganueeqss rANre~ f
P R O Ba d r~ l A c do u ~ r
/ 'Hyvoetaj
This chain of input and output arrows meansthat "orders," upon delivery (box 2), arerecorded as "transactions," which, when billed
/ (box 3), are reflected on "invoices,"
FIgure 3-8. Arrow Connections
I I ....... . , , ,p4

3.1.3.2 Mechanism Arrows
A box represents a function. The input data (on the left) are
transformed into output data (on the right). Controls (on the top) govern
the way the function is done. Mechanisms (on the bottom) indicate the
means by which the function is performed. (Figure 3-9). A "mechanism"
might be a person or a computer or a machine or some other device which
aids in carrying out the function. The box itself, with its inputs,
controls, and outputs indicates WHAT the system does. The mechanism
shows HOW that function is accomplished. Diagrams drawn without
mechanisms show what functions a system must perform. Mechanisms will
specify how those functions are to be performed.
BLUEPRINT
PRIONT12110 SCIILOULE
RAW MAT AL 4 AKEP FABRICATED PAIRTj-----•SCRAP
TOOLS MACHINE
TEMPILA'a .'
Figure 3-9. Example of Mechanism
A downward-pointing mechanism arrow (known as a "call") indicates
a "system" that completely performs the function of the box. If there is a
need for further detailing, it will be found in a separate model of the
mechanism itself, (Figure 3-10).
28
7_ _ __ _ __ _ 77-
I"' Iq

__stop_ AMC_ 1.61
MFGA53 P'0rIR~? DETAI '"tT
(F$114 3-11)U
Figure 3-1. E Iamleuofratin outufht eoe MechanismMoeCal
Mcais arrowsmaybetheoutputofother boxe. it those
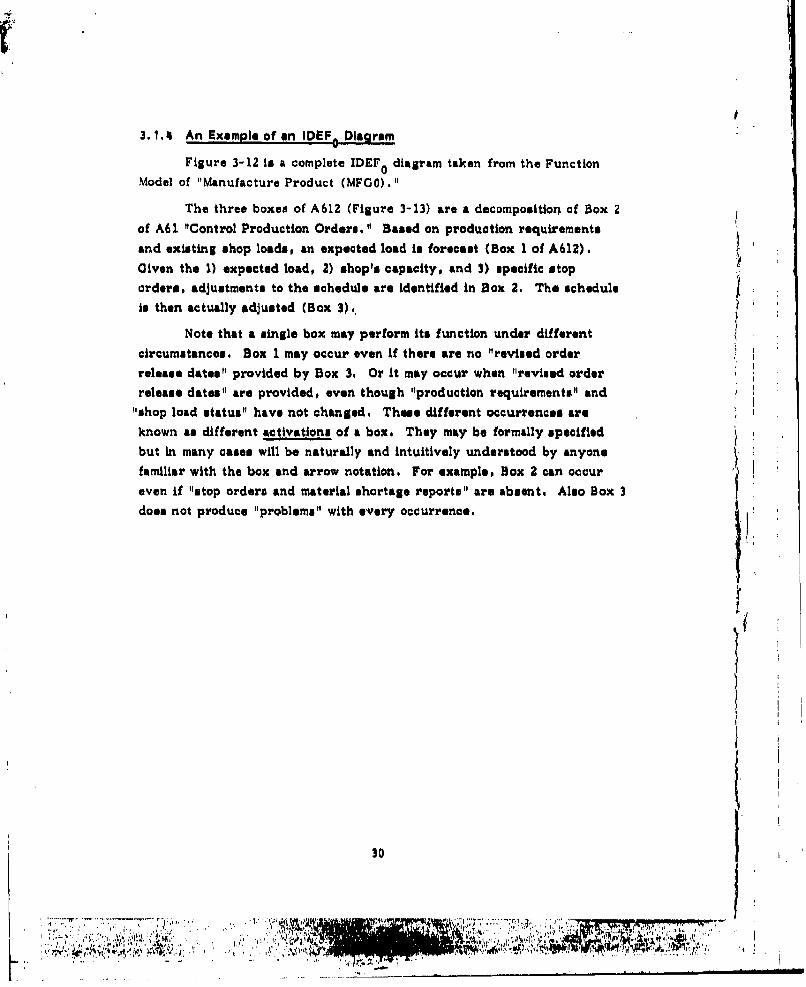
3.1.4 An Example of an IDEF, Diagram
Figure 3-12 in a complete IDEF 0 diagram taken from the FunctionModel of "Manufacture Product (MFGO). "
The three boxes of A612 (Figure 3-13) are a decompositiorn of Box 2
of A61 "Control Production Orders." Based on production requirements
and existing shop loads, an expected load is forecast (Box 1 of A612).Given the 1) expected load, 2) shop's capacity, and 3) specific stop
orders, adjustments to the schedule are identified in Box 2. The scheduleis then actually adjusted (Box 3).,
Note that a single box may perform its function under differentcircumstances. Box 1 may occur even if there are no "revised orderrelease dates" provided by Box 3. Or it may occur when "revised order
release dates" are provided, even though "production requirements" and"shop load status" have not changed. These different occurrences areknown as different activations of a box. They may be formally specified
but in many cases will be naturally and intuitively understood by anyonefamiliar with the box and arrow notation. For example, Box 2 can occur
even if "stop orders and material shortage reports" are absent. Also Box 3does not produce "problems" with every occurrence.
30
rr0
A- T
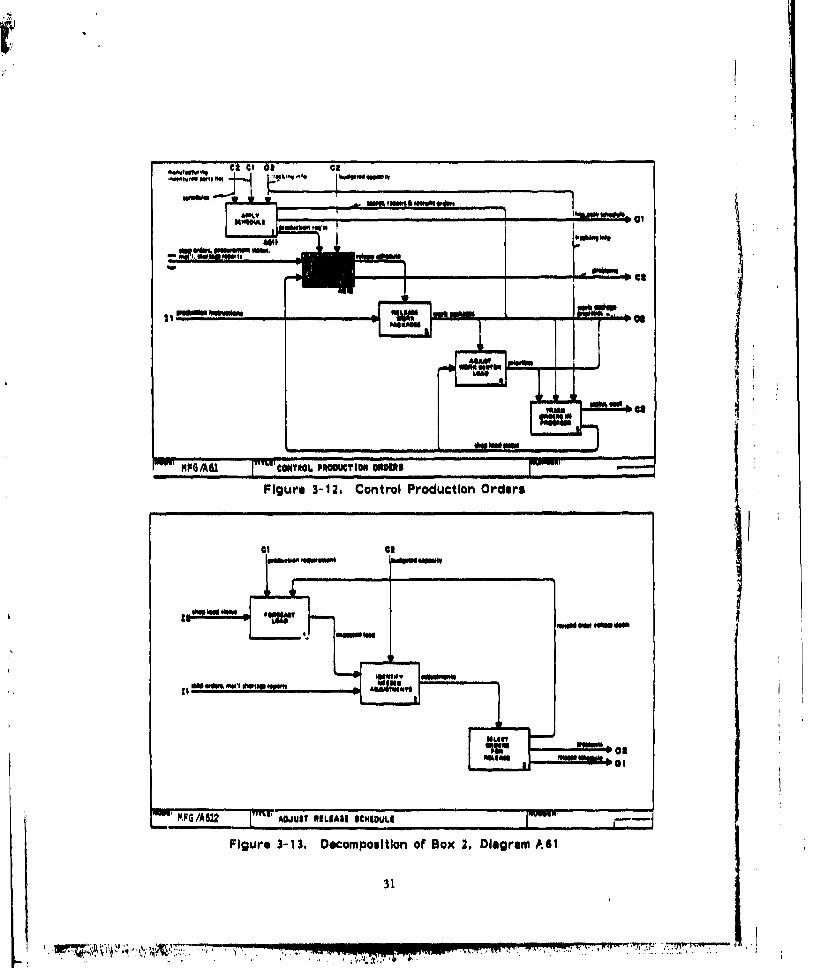
Fiur 3-12 Conro PrdctoaOd
MPG WI -A1 .1 US hPIS SI 4DL-
Figure ~ ~ ~ ~ ~ ~ ~ '"MS 303 eops1ino o 2 ~ga
" 3II-10
Aso ..

3.2 Additional Symbols
Further notation is needed to structure diagrams so that they form
a coherent, consistent model.
To create a model composed of diagrams, FEO's, text, and glossary,we need toi
* indicate the position of each diagram in a modeland the supportive documentation associated with
each diagram. This will be done with referenceexpressions '
0 indicate the connection of boundary arrows toarrows of thf, parent diagram. This will be donewith ICOM cokl.si
* suppress unnecessary detail. This will be donewith tunnelled arrows.
These conventions fill out the set of symbols that enable diagrams to
accurately reflect real system functions.
3. 2. 1 Reference Expressions
3.2,1.1 NodeNumbers
As explained in Section 3.1. 1, each diagram is limited to three to
six boxes, Each box on a diagram Is numbered. A box on any diagram
may' be further described by a "lower" diagram which may also be further
detailed in more diagrams. This forms a hierarchy of diagrams.
Node numbers are used to indicate the position of any diagram or
box in the hierarchy. For example, A21 is the diagram that details box 1
on the A2 diagram. Similarly, A2 details box 2 on the AD diagram which is
the top-most complete diagram of a model. This hierarchy may be shown in
a chart of diagram names and node numbers called a node tree. Figure 3-14
is a typical node tree,
32,1
-1 1 ~N "A iM'

AG
MANUFACTURE
PRODUCT
Al A2 A3MAK(E AND
PLAN FOR ADMINISTER PLANMANUFACTURE SCHEDULES PRODUCTION
AND NUOCITS
All A12 Al3 AI'4
ASSUME A ESTIMATE OEVELO.P IDEVELOPSTRUCTURE AND REQUIRUMENTS, PRDCINSUPPORTMETY1100 up MFG, COST, TIME PRDCINACTIVITIES
TO PRODUCE PLANS PLAN
I ~Figure 3-14l. Diagrams form a 'Hiesrarchyll showm by a Node TresI
All node numbers of IDEF0 diagramin beglin with the letter A, whichidentifies them as "Activity" or function diagrams. A one-box diagram isprovided as the "context" or parent of the whole model. By convention,Ak'..the diagram h-is the nodef number "A-0O" (A minus zero). If a full diagramW. provided to make the context of the A-0 complete, that io numbered"A-1.'" This can , If necessary j proceed upw~rd. Some uomplex subjectshave actually *tiarted with "A-4,"1 even though A-0 is still the "top" of
the model, An example of this can be found In the Function Model of
"Manufzcture Product" (MFGO). Volume VII of this report.
33
_________71___

Other node numbers are sometimes used. A "FEO" ("For Exposition
Only") diagram is any diagram that falls outside the strict hierarchy,
FEO's may contain more than six boxes, partial arrow structures, or
anything needed by an author to illustrate a point. Node numbers for
FEO's contain "F" (e.g., A2F). Glossary definition& support diagrams.
Node numbers for a glossary contain '0" (e.g., A1G). Text numbers
contain 'T" and follow the node number of the diagram with which they
are associated (e.g., A2T). There may be more than one FEO or glossary
(e.g., AWF1, A2F2.,,), but there should be no more than one page of
text associated with a given diagram. (Text, FEO's Paid Glossary are
explained in Section 6,)
Node numbers ars also ,i.zd to Indicate the decomposition of a
box in a diagram. If a box has been decomposed, the node number of
the diagram which represents the decomposition is written outside the box
under the right hand corner, In Figure 3-15, the reference expression
under boxes 1 and 2 indicate that they have been decomposed.
3.2.1.2 Model Names and Node Numbers
Each model has a ftame, which should be chosen for maximum
clarity to di.stinguish it from other models. For examplei
TOPIC
Diagrams in the model are referred to by adding a slash and the node
number to the model name. For example:
TOPIC/A3
It Is this form which is usually written as the complete node number of
each diagram of a model.
34
.. ...- -- --- -- -
Wq.P#IAm_ _ _ _ _ 116t -l
MFGA,61 "CCONTRKPOD oUCT ION ONauma'
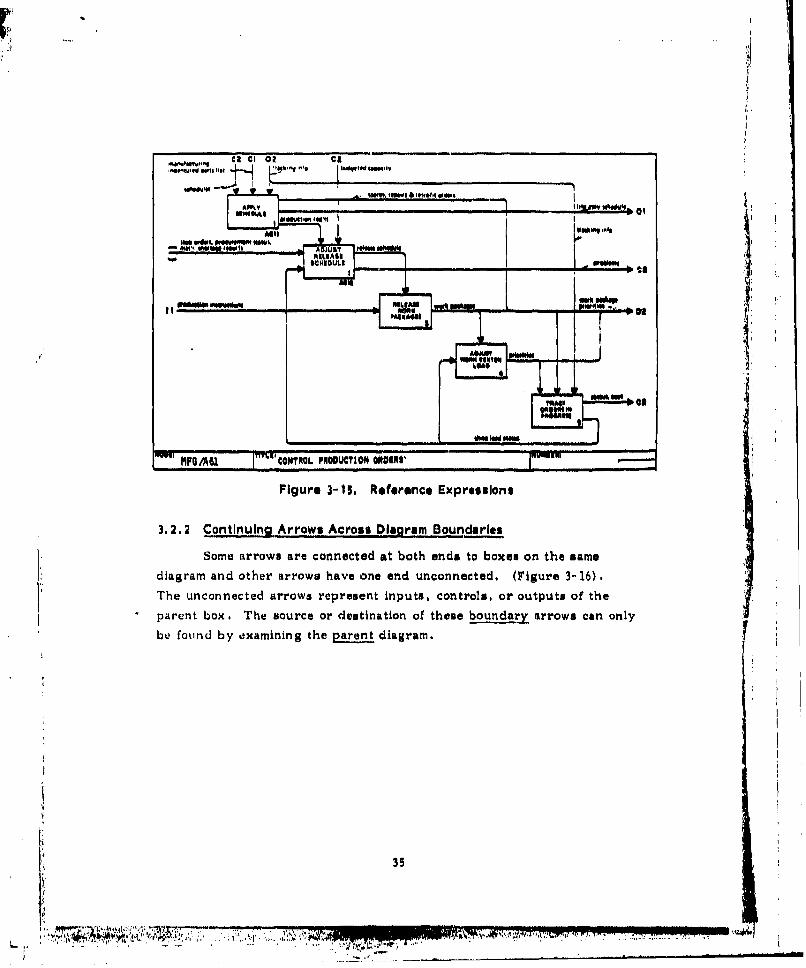
Figure 3-15. Reference ExpresBIons
3.2.2 Continuing.Arrows Across Diagram Boundaries
Same arrows are connected at both ends to boxces on the samediagram and other arrows have one end unconnected. (Figure 3-16).
The unconnected arrows represent inputs, controls, or output. of theparent box. The source or destination of theme boundary arrows can only
be found by examining the parent diagram.
35

Figure 3-16. Boundary Arrows are Derived from the Parent Diagram
The unconnected ends must match the arrows on the parent diagram. All
such boundary arrows must continue on~ the parent to inake the model
complete and consistent.
Ow% Thi Wren'' IsA.-l

IBouldary arrows at the A-0 level are called external rrows because
the A-O diagram establishes the context of the model and all arrows related
between the modclv anid that which is external to the context or scope of
the model,
3.2.3 Coding Boundary Arrow.
A specific notation, called ICOM codes, specifies the matching
connections, The letter 1, C, 0, or M is written near the unconnected
ond of each boundary arrow on the detail diagram. This identifies that
the arrow is shown as an Input, Control, Output, or Mechanism on theparent box. This letter is followed by a number giving the position at
which the arrow is shown entering or leaving the parent box, numbering
left to right and top to bottom.. roe example, "C3" written on an arrowin the detail diagram indicates that this arrow corresponds to the third
control arrow entering the parent box.
This coding relates each diagram to iti own parent. New codes are
assigned when th.! detail diagram becomes a parent diagram through
decomposition. Using this letter-number dtatchinrg scheme', an arrow
shown as control or as input on a parent diagram is' not limited to the
same role on a detail diagram. In Figiure 3-18, C2'on the parentbox appears as an input to box 1 on its detail diagram. ICOM codes must
be written at the unconnected ends of all boundary arrows except for
the very topmost diagram in a model, and on tunneled arrows.
I".
' 37

4
Th ais i 12below This to @1 bola,
Figure 3-18. Codes are Written on the Detail Diagram
3.2.5 Tunnelled Arrows
Tunnelled arrows indicate that the data conveyed by these arrows
was rnot i elavant to a particular level of detail.
Figure 3-19. Tunnelled Arrows at Connected End
Tunnelling an arrow where it connects to a box (Figure 3-1Q)indicates that the data conveyed is rnot necessary at the next level of
ciecomposition.
38
~'I I4,

T i
Figure 3-20. Tunnelled Arrows at Unconnected Ends
Tunnelling an arrow at the unconnected end (Figure 3-20) indicates
that the data conveyed is not relevant to or supplied bj the parent
diagram.
Parenthesizing the unconnected ends says, "This arrow does not
appear in the parent diagram. It has no ICOM code." Paren-
thesizing the end where the arrow connects to the box says, "This arrow
does not appear in detail diagrams. Its ICOM code is not tracked from
here on and may never be explicitly referenced." It ti possible for an
arrow to have a parenthesized arrowhead, disappear for one or more
levels of detail, and then be reintroduced at some specific level ofdetail with a parenthesized end, If the original source or destination isknown, that too should be noted with the appropriate reference
expression, written beside the parentheses.
'1.'
K J 39
711ý71 '7.'7 7

Control will notbe shown andetail diagram.
still designated
asC
A4% *,4,Rovr vmoAm/-s
sttsrpr/o Otu ocotolrsshw/nprn
of ficediag a
/LDU IG./
Fiue32.Eape fTneldArw
TI.N

3. 2.6 An Example of DecomposItion
Using the F'unction Model of "Manufacture Product' (MrGO) , it is
possible to view the overall function of "Manufacture Product" as beingcomposed of thij following subfunctions:
* Plan for Manufacture
* Make and Administer Schedules and Budgets
* Plan Production
* Provide* Production Resources
* Obtain Manufacturing Materials
* Produce Product
Any of theme may then be further subdivided. "Plan for Manu-facture" may contain the subfunctionsi
* Assume a Structure and Method of Manufacture
* Estimate Requirements, Cost, Time to Produce
* Develop Production Plans
0 Develop Support Activities Plans
Each of these~ uubfunctions may be divided again to the limits of usefulness,
knowledge, or time available.
This structure ofI functions and subfunctions may be shown as a
"node tree. "(Figure 3-22).
41

ANUUACUrURIPR•ODUCT
Al
All A|ll| A14iASllI.UMl A Ili71MlA TII OIV1O 011OVIIGOP
ST MUCUMI AND MI1UIMIK NTS. PROD01UCTION AUP )IWSGor Op MNa COST. -1IME i PLANS ACIVITIllpO PtUODUCI PLAN
Figure 3-22. Node Tree
The structure of functions and subfunctions may also be shown as
"a "node index.," (Figure 3-23). This index format is similar to the format
f a table of contents and to the format of an "indentured parts list"
(bill of materials) used in manufacturing and engineering.
AO Manufacture Product
Al Plan for Manufacture
All Assume a Structure and Method of Mfg.
A12 Estimate Requirements, Cost, Time to Produce
A13 Develop Production Plans
A 14 Develop Support Activities Plan
AZ
Figure 3-23. Node Index
42
xi.~. '4J~

4.~
The following IDEP0 diagrams begin with the same subject found at
the top of the 'node tree." Figure 3-24, A-0, shows Information and
objects that bound what we mean by "Manufacture Product."1 The A-0
diagram establishes a context for describing "Manufacture Product."
Posit deagnIw. 410"llaw
MANUPACYU11111
,Pttlh SmePUI44 all seai I of fit wemuloturilg prauses.
MFG: O ~ cr'ANUFACT1iN( PRODUCT (COWIXT)
Figure 3-241. A-0, Manufacture Product"Manufacture Product" includes everything that starts with the
Inputs arnd Controls i
Procurable Items
* Product Design
Product Manufacturing Requirements
and finishes with the Outputs:
Manufacturing Capability Information
Product, Parts, Prototypes
Production Data
Manufacturing Information
43

What happens within the box shown on A-0, "Manufacture Product,"
is shown on the AO diagram, which has the same title.
J
Figur 3-25 POMNuctrPodt
Eachfuntiontha ispartof Manfactre rodut' s areconlzlkl
404
0:0114144 0-1411,111 PLA
MIN-.4. I.

Any of the boxt'm on AD may be further described with another
diagram. The first box of AD is detailed in Al "Plan for Manufacture".
Al shows only the functions and data that are part of "Plan for Manu-
facture" as defined by the arrows appearing on AO,
PLAN PON ANUPALTUR
Figure~~ ~1MM 3-6.Al la fr aufctr

SECTION 4 .READING IDEF DIAGRAMS
0
CONTROL
INPUT FUNCTION OUTPUT
MECHANISM
- 47
"~ ~~ ~ ~ ~ .. .,,, ...___.__.___.__.__.___.

READING IDEF 0 DIAGRAMS
A model is made up of a series of diagrams and associated materials
arranged in hierarchic manner. A node index or table of contents must
be provided. Placing the diagrams in hierarchical order gives an overall
view of the model and allows access to any portion,
Roading In done top-down. After the top levels are read, firstlevel diagrams are read, then second level diagrams are road. etc. If
specific details about a model are needed, the node index is used to
descend through the levels to the required detail.
When pubUshed, a model is bound in "page-pair" format and "node
index" order, "Page-pair" format means that each diagram and the entire
text associated with it appear on a pair of facing pages.
Iao T•A•i imaUsnr60 o lada-Im at
dialamu.
Th~i is%$U
diagratem.
Figure 4-,1. Page-Pair Format
I4,,

"Node index" order means that all. detail diagrams relating to ono
box on a diagram are presented before the details of the next box. Thisplaces related diagrams together in the same order used in an ordinary
table of contents.
AO Plan for ManufactureAl Assume a Structure and Method of Mfg.A2 Estimate Requirements, Cost, Time to Produce
A21 Estimate Resource NeedsA22 Estimate Costs to Purchase or Make diagrams inA23 Estimate Timing for Startup and Production a document
A3 Develop Production PlansA4 Develop Support Activities Plan
Figure 4-2. Node Index Showing Diagram Order
Iso
i,-
SOI
I0I
"I tU"k+• A . . . m I Iln I+I l i

4I
...
4. 1 Approaching a Model
Models provido an overview of the whole system as well as details
of a particular subject. To read a model for its overview, use the index
to find all high-level diagrams.
AO Manufacture ProductAl Plan for ManufactureAll Assume a Structure & Method of Mfg.A12 Estimate Requirements, Time, Cost to ProduceA 13 Develop Production PlansA14 Develo Support Activities PlanA.' Make & Administer Sceue 6"ugt
Aid Develop Master ScnecluieA22 Develop Coordinating ScheduleA23 Estimate Coats 6 Make BudgetsA24 Monitor Performance to Schedul, & Budget
L3Pan ro ucti on
Figure 4-3. Node Index Showing Overview Diagrams
To read a model for detail, use the index to find all diagrams detailing the
subject of interest,
AO Manufacture ProductAl Plan for ManufactureAll Assume a Structure & Method of Mfg.A12 Estimate Requirements, Time, Cost to ProduceA 13 Develop Production PlansA14 Develop Support Activities Plan
AA Make & Administer Schedules & BudgetsA21 Develop Master ScheduleA22 Develop Coordinating ScheduleA23 Estimate Costs & Make BudgetsA24 Monitor Performance to Schedule I Bidget
i3 Plan Production
Figure 4-4. Node Index Showing Specific Detail Dlaqrsms
t!51

pgi
Further detailing in a model may be traced by referring to the
reference expression just below the box number. This indicates either
the node number or page number of the detail diagz'am for that box. If
no reference expression appears the box has not yet been detailed,
For example, on diagram A24 means that the details of box 3
are found on diagrams with node nui' er A243,
Details may be shared within a model or found in a different
model, In this case, a down arrow indicates where the shared detailing
app•krs. (See Page 3-10).
Box 4 is detailed in model MQ by diagram A4, (This is known as a "call.")
4. 2 Disgram Reading Steps
The precise information about a system-Is in the diagrams them-
selves. The following reading sequence is recommended t
1, Scan the boxes of the diagram to gain an impressionof what is being described.
2. Refer back to the parent diagram and note the arrowconnections to the diagram, Try to identify a "mostimportant" input, control and an output.
3f Consider the arrows of the current diagram. Tryto determine if there in a main path linking the "mostimportant" input or control and the "most important"output.
4. Mentally walk through the diagram, from upper leftto lower right, using the main path as a guide. Notehow other arrows Interact with each box, Determineif there are secondary paths. Check the storybeing told by the diagram by considering how familiarsituations are handled.
5. Check to see If a related "FEe" diagram exists.
6. Finally, read the text and glossary if provided.
04,12

This sequince ensures that the majoir features of each diagrarn receive
att-ntion. The text will call attention to anything that the author wishes
to emphasize. The glossary will define the author's interpretation of the
,terminology used,
Each diagram has a central theme, running from the moat Important
incoming boundary arrow to the most important outgoing boundary arrow.
This main path through the boxes and arrows outlines the primary function
of the diagram. Other parts of the diagram represent qualifying or
alternative conditions which are secondary to the main path.
The system's operation can be mentally envisioned by pursuing
the main path. Specific kinds of data inputs, the handling of errors,
and poksible alternative outputs lend detail to the story. This walk-
through enhances understanding of the diagrams.
ON.
I
Figure II-•, Example of Main Path
53
•,...•. • •.•RAU& % M gt., ,,!,,: 96""U 'M" ;: . :.:;",•':.••.,:. . . •: .• •,..,:a•:'
, ,, ., ,. , ', . ,, '• ., , ',' .,., : ." ,' : , : , ,,• ,, • , ., , ;•, ' , ,L '- , "i , , ,, . ,,, A0 0 A' " "

14. 3 Semantics of Boxes and Arrows
The fundamental notion which must guide the interpretation of any
diagram, or set of diagrams ist
Only that which Is explicitly stated is necessarilyImplied.
This derives from the very nature of constraint diagrams. Unspeci-
fied constraints must not be assumedi necessary constraints must be
explicit.
The corollary is that:
Any further detailing not explicitly prohibited IsImplicitly allowed.
environment
Operating da gar sigqnalCondi tios
tTemperaturetemperature toernce
Figure 4-6. Example of Constraint
An assumption can be made using Figure 4-6 that the temperature is
measured "often enough" and the tolerances are changed "when appropriate"
and the temperature is monitored against the tolerances "often enough"
that the danger signal will be produced "soon enough." None of these
intuitive understandings would conflict with subsequent detailing which
showed that :
a. the temperature was measured by periodic sampling, or
b. current tolerances were requested only when thetemperature increased by some fixed amount, or
54

c a series of temperature values produced by box Iwas stored by box 2 which examined the patternof change to determine If the pattern was withinthe tolerances,
d. etc., etc.
,he gra.bic notations of a diagram are., by themselves, abstract.
However they do make important fundamental distinctions. Their
abstract nature should not detract from the intended breadth of possible
interpretations that are permitted.
4.3.1 Constraints Omit How and When
Either of the two representations.
says thati
the activity a2 Is dependent on "d"which is created or modified by the
activity al.
Each representation defines a constraint relationship between Ole two
boxes. All that is expiitly stated by the intermediate arrow for
either representation is expressed as followst some activation of box 2
requires something called "d" that Is produced by some activation of box 1,
Frequently, diagrams imply strongly that two or more boxes must
contend for the contents of an arrow, Thb meaning of the boxes and
arrows shown in Figure 4-7 is that something produced by box I is needed
by box 2 and by box 3. It may be that an activation of the arrow's "source"
(box 1) must precede every activation of its "destination" (box 2 or box 3).
It may be that one activation of the source is sufficient for every activation
of any destination, Without additional information, the boxes and arrows
alone permit either interpretation.
55

Figure 4-7. Boxes contending for contents of an arrowj
4- 3- 2 Multil~e Inputs, Controls, and OutpUtsThe basic interpretation of the box shown btelow isi In order to
produce any subset 0± the outputs (01, 02, 031, any subset of the entries(Il. 12, 13. C1, C2, C3, C41 !may be required. In the absence of furtherdetailing It cannot be assumed that:
a. any output can be produced without all ezitrim~spr'esent, or
b. any output requires all entries for Its production&,
101
13
Figure 4-8. Illustration of Multiple lCOMa
*1 5- A.~~~ ~

The partial detailing of the previous box (as it might appear in an
FEO diagram) indicates that 13, C2, C3, C4 are not required for producing
01. This illustrates the points that:
a. some form of further detailing will specify the exactrelationship of inputs and controls to outputst
b. until that detailing is provided, limiting assumptionsabout relationships "inside" each box should not bemade ;
c. reading of a diagram should concentrate on the arrows,which are explicit, rather than on box contents, whichkre only implicit.
Cl C2 C3 COi
-40212 - -,---*,-0 2
13
Figure 4-9. FEO representing detailing of multiple ICOMs
57 ,,

SE CTION 3
IDEF FORMS AND PROCEDURES
CONTROL
INPUT FUNCTION 10OUTPUT
MECHANISM
'do;I !f pl*N I
tWi
59
__________________________________________________

•1'
IDEF KIT CYCLE FORMS AND PROCEDURES
5.1 IDEr Teamwork Dlscipline
The development of any IDEF model (IDEF 0 , IDEF 1, and IDEF 2 )
Is a dynamic process which requires the participation of more than one
person. Throughout a project the draft portions of a model are created
by authors and distributed to other project members for review. These
draft portions of a model are called Kits and may contain diagrams, text,
glossary or any other information the author feels is pertinent to the
development of the model,
The IDEF teamwork discipline identifies all persons interested in
the review of a model as reviewers. Reviewers who are expected to make
a written critique of a Kit are called commenters. Reviewers who receive
a Kit for information only, are not expected to make written comments and
are called readers.
The discipline requires that each person expected to make comments
about a Kit shall make them in writing and submit them to the author of
the Kit, The author responds to each commenter in writing on the same
€, This cycle continues, encompassing all Kits pertaining to a parti-
cular model, until the model is complete and recommended for publication.
The evolution of a model is recorded by disseminating a model
(with most recent changes) every 3 months in the form of a Kit which is
sent to readers to assist them in maintaining current information about the
model.
The end effect of this process for organized teamwork is a high
assurance that final IDEF models are valid and are well expressed. The
Kits are changed to reflect corrections and valid comments. More detail
is added by the creation of more diagrams, text and glossary. More
comments are madel more changes are included. The final model represents
the agreument of the aut' r and reviewers on a representation of the
~systom being modeled from a given viewpoint and for a given eup~ose.

5.2 The IDEF Kit Cycoe
In creating a document, materials written or gathered by an author
are distributed to commenters in the form of a Standard Kit. Commenters
review the material and write comments about it, The commenters return
the Kit to the author who reacts to comments and may use the comments
to revise or expand the material. The Kit is returned to the commenter
with the reactions from the author. This is known as a Kit Cycle. The
steps of the Kit Cycle are as followes
0 The author assembles the material to be reviewed intoa Standard Kit*. A cover sheet is completed. Copiesof the kit are distributed to each of the commenters,and to the author, The original is filed for reference,
0 Within the response time specified, the commenter readsthe kit and wtites comments directly on the copy. Thekit is returned to the author.
, The author responds in writing directly on each corm-mentor's copy. The author may agree with the comment,noting it on his working copy, and incorporating it intothe next version of the model. If there is disagreement,the author notes the disagreement on the kit and returnsit to the commenter.
* The commenter reads the author's responses and, Ifsatisfied, files the kit, (Commented Kits are alwakysretained by the Commenter. ) If the commenter doesnot agree with the author's responses, a meeting isarranged with the author to resolve differences. Ifthis cannot be done, a list of issues is taken toappropriate authority for decision.
This cycle continues until a document is created which represents the
careful consideration of xdl project members. In addition, a complete
history of the process has been retained.
The results of this Kit Cycle are a document to which author and
commenters havo contributed, and, if necessary, a list of issues that
require management action.
Throughout the cycle, a project librarian handles copying, distri-
bution, filing, and transfer of kits between authors and commenters.
*Types of IDEF Kits are-explained in Section 5. 3.
62
j7•

lu
Io
63

.1
5. 2.1 Personnel Roles
The roles and functions of people involved are:
* Authors (Modelers) People who prepare any IDEF model, VCommenters (Expeets) People knowledgeable of the subject
being modeled from whom authorsmay have obtained information bymeans of interviews, and haveenough, trainin& in an IDEFtechnique to offer structuredcomments in writing.*
9 Readers (Experts) People knowledgeable of the subjectbeing modeled from whom authorsmay have ,nbtained information bymeans of interviews, and reviewdocuments for information but arenot expected to make writtencomments.
9 Librarian A persmn assigned the responsibilityof maintaining a file of documents,making copies, distributing kitsand keeping records.
A "role" has nothing to do with someone's job title, and the same
person may be asked to perform several roles. Thus, each individual's
participation is, in fact, unique and depends upon the kit involved.
5.2.1.1 Authors
An author interviews experts and creates documents. However,an author may or may not be the source of the technical content of a
document. An author may serve only as a technical writer or scribe
to record material gathered from other sources. An author often operates
in a role which in largely editorial: identifying, sorting out, and organiz-
ing the presentation of knowledge obtained from experts.
*Comments between commenter and author are considered rilegeinformation. Commented kits are not duplicated for distriution toanyone else on the program. The library does not retain a file ofcommented copies.
64
.I , AA' "".

5.2.1.2 Commenter
Commenters read material produced by authors and verify its
technical accuracy. Commenters are responsible for finding errors and
suggesting improvements. The role of a commenter is the key to
producing high quality results. The commenter determines whether the
author has followed the IDEF techniques consistently, whether the
viewpoint and purpose have been adhered to and whether errors or
oversights exist which should be brought to the author's attention.
5.2. 2 Guidelines for Authors and Commenters
5.2. ý. 1 Commenter Guidelines
No set pattern of questions and rules can be adequate for comment-
ing, since subject matter, style, and technique vary so widely. However,
guidelines do exist for improving quality. The major criteria for quality
arei Will the document communicate well to its intended audience? Does
it accomplish its purpose? Is it factually correct and accurate, given
the bounded context? Overall guidelines for commenting are:
0 Make notes brief, thorough and specific. As long anthe author understands that niceties are dropped forconciseness, this makes for easier communication andless clutter,
* Use the 0 notation to identify comments. To write(D-note, check the next number off the NOTES listnumber the note, circle the number, and connect thenote to the appropriate part with a squi gle "11/."(See Section 5.4 Standard Diagram Form)
* Make constructive criticisms. Try to suggestsolutions, not just make negative complaints.
* Take time to gather overall comments. Thesemay be placed on the cover or on a separatesheet. (But don't gather specific points ontothis sheet when they belong on the individualpages.) Agenda items for author/commentermeetings may be summarised. Make agendareferences specific.
65
.. . • .:; • , ., - , - .. . ' , ,, .. . . : : , '

The length of time spent critiquing depends on a variety of things
familiarity with what is being described, the number of times something
has been reviewed, the experience of the commenter and author, etc.
A kit returned to an author with no comments means that the commenter
Is in total agreement with the author. The commenter should realise that
there is a shared responsibility with the author for the quality of the
work.
5.2.2.2 Author /Commenter Interchonoes
When a commenter returns a kit, the author responds by putting
a 01 or "X" by each 0)-note, ",A4 means the author agrees with the
commenter and will Incorporate the comment into the next version of the
kit. "X" means the author disagrees. The author must state why In
writing where the comment appears. After the author has responded to
all comments, the kit is returned for the commenter to retain,
Aftor reading the author's responses, it is the commentera'e
responsibility to identify remaining points of disagreement and to request
a meeting with the author. This specific list of issues forms the agenda
for the meeting.
5.2.2.3 Meeting Rules
Until comments and reactions are on paper, commenters, and authors
are discouraged from conversing.
When a meeting Ls required, the procedure is as follows:
1. Each meeting should be limited in length.
2, Each session must start with a specific agenda oftopics to be considered and must stick to thesetopics.
3. Each session should terminate when the partici-pants agree that the level of productivity hasdropped and individual efforts would be morerewarding.
66
V'1

4. Each session must end with an agreed list of actionItems which may include the scheduling of follow-upsessions with specified agendas.
"5. In each session, a "scribe" should be designated totake minutes and note actions, decisions, and topics.
6. Serious unresolved differences should be handledprofessionally, by documenting both sides of thepicture.
The result of the meeting should be a written resolution of the
issues or a list of issues to be settled by appropriate managerial decision,
Resolution can take the form of more study by any of the participants,
5.3 IDEF Kits
A Kit is a technical document. It may contain diagrams, text,
glossaries, decision summaries, background information, or anything
packaged for review and comment,
An appropriate cover sheet distinguisheas the material as a kit.
The cover sheet has fields for author, date, project, document number,
title, status, and notes.
There are two types of IDEF Kitsi
* 'Standard Kit - All kits to be distributed for comment.It is considered a "working paper" to"assist the author in refining his total
, model and is limited to 20 pages.
Summary Kit - Contw:i.• the latest version of a model.It is son; for information only and isdesigned to aid in maintaining currentinformation about the total model whileportions of the model are being pro- Icessed through the Kit Cycle.
67

Standard Kits contain portions of a model and are submitted
frequently as work progresses. Standard Kits are submitted through
the IDEF Kit Cycle for review and are the type referred to in this mand,,l,
Summary Kits are submitted every three months. Theme kits
contain the latest version of the model. Recipients of Summary Kits are
not expected to make comments on them although they may choose to do so.
Summary Kits are kept by the recipients for their files. A description of
Summary Kits is found in the "ICAM Library User's Guide."
3.3.1 Completing a Cover Sheet for a Standard KIt
Complete one cover sheet for each kit submitted. (No reproductions),.
Fill in the following fields on the Cover Sheet (Figure 5-2).
1. MODEL/DOCUMENT DESCRIPTION:
Title - Should be descriptive of the kitLife Cycle Step - "AS IS" or "TO BE"IDEF Methr 0 , 1 or 2System - onym for System or SubsystemDistributio, Type - Specify if other than StandardKit Distribution*
2. PROJECT INFORMATION i
Author - Name of person submitting kit**Date - Date sent to LibraryCompany - Name of company submitting kitA.F. Project No, -Task No. -
3. KIT INFORMATIONt
"Check Standard Kit, indicate document number assignedby Library if this is a revision to a Standa'd Kit
4, REVIEW CYCLEi
To be signed and dated after review by commenterand author.
*Types of Distribution available are discussed in Volume XI of this report.
**In cases where a Standard Kit is submitted as a group effort (i.e., taskteam, committee, or co-authors) one individual from the group assumes"responsibilities as "author."
68

Ius
I
A a.LAI
. 5 1I-T Im
~ 69
~~wa

5. NODE INDEX/CONTENTS:
Node number, title and C-number of each pageof the document (including the cover sheet)CONTENTS SHEET, Figure 5-4 (if needed) isalways Page 2.
6. COMMENTS/SPECIAL INSTRUCTIONS:
Any other information for the reviewers. Thiscan also be used for special instructions to thelibrary about the handling of the document. Thelibrary also uses this field for specialInstructions to receiver of kits.
5.3.2 How to Prepare a Standard Kit
To avoid oversights, review the kit as if that were the only infor-
mation available. Catch any typographical errors. Add points of clari-
fication that come to mind as brief notes on the kit itself. Glossary
definitions for terms that appear in the kit should always be appended
as support material,
Gather helpfu! materials and append these for the commenter's
benefit. Never use this supplemental material to convey information which
should properly be conveyed by the diagram itself. Whenever possible, use
the most natural means of communication - diagrams - to show details
that are important for the reader in understanding the concepts. Combine
all material with a completed Cover Sheet and Node Index/Contents Sheet
and subm.t to the Library.
5.4 Standard Diagram Form
The Diagram Form (Figure 5-5) has minimum structure and
constraints. The sheet rupports only the functions important to the
discipline of structured analysis. They are:Establishment of context;
* Cross-referencing between pieces of paper;
* Notes about the content of each sheet.
70
S. .. ....... .. . .......... ...... ....... ... •. " • .. .. .... ... . .. .. , ,, .... . . .,,,

4A z
2L1 I1 11M
1 1 7H

I,6'
ww
72n
,T K*

The diagram form Is a single standard size for ease of filing and copying.
ThL form is divided into three major soctionsi
* Working Information (top)
* Message Field (center)
e Identification Fields (bottom)
The form is designed so that the working information at the top of the
form may be cut off when a final "approved for publication." version is
completed. The diagram form should be used for everything written.
5.4.1 Working Information
The "Author/Date/Project" FieldThis tells who originally created the diagram, the date that it was
first drawn, and the project title under which it was created. The "date"
field may contain additional dates, written below the original date. These
dates represent revisions to the original sheet. If a sheet is re-released
without any change, then no revision date is added.
The "Notes" Field
This provides a check-off for ^_ notes written on the diagram
sheet. As comments are made on a page, the notes are successively
crossed out, The crossing out provides a quick check for the number of
comments, while the circled number provides a unique reference to the
specific comment,
The "Status" Field
iThe status classifications provide a rankirng of approval, They
aru I
WORKING The diagram is a major change, regard-less of the previous status. New dia-grams are, of course, working copy.
73
' 4
4 Nor W,"
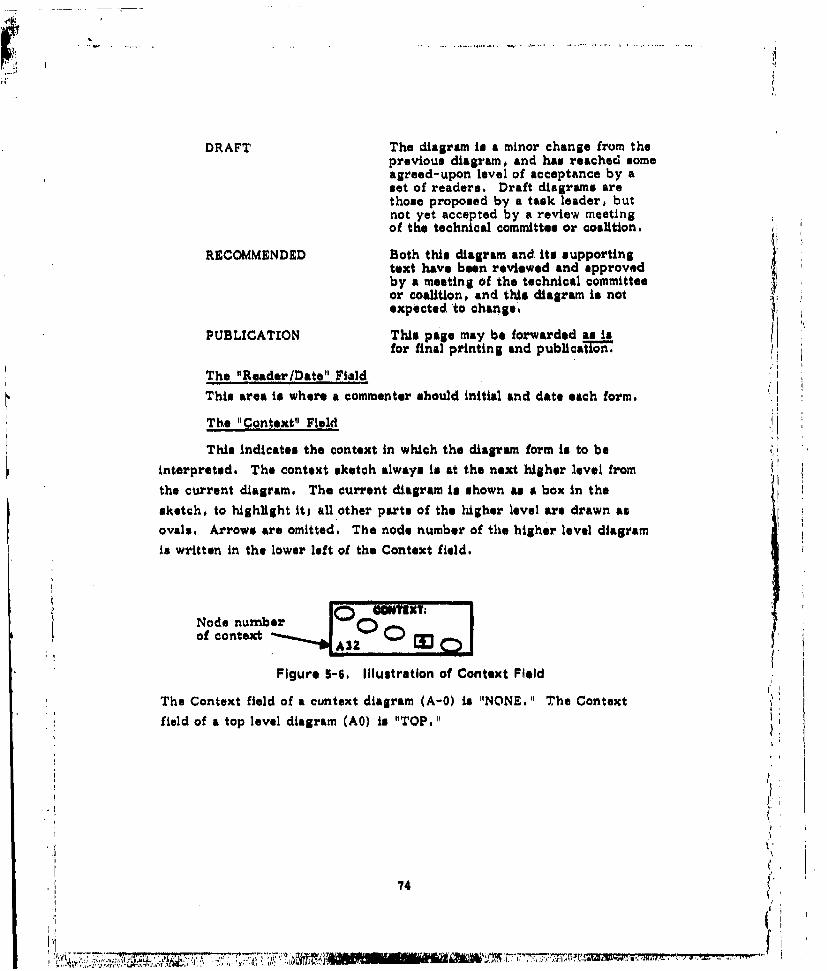
DRAFT The diagram is a minor change from theprevious diagram, and has reached someagreed-upon level of acceptance by aset of readers. Draft diagrams arethose proposed by a task leader, butnot yet accepted by a review meetingof the technical committee or coalition.
RECOMMENDED Both this diagram and. its supportingtext have been reviewed and approvedby a meeting of the technical committeeor coalition, and this diagram is notexpected to change '
PUBLICATION This page may be forwarded as isfor final printing and publicat on.
The "Reader/Date" FieldThis area is where a commenter should initial and date each form.
The "Context" Field
This indicates the context in which the diagram form is to be
interpreted. The context sketch always is at the next higher level from
the current diagram. The current diagram is shown as a box in the
sketch, to highlight it; all other parts of the higher level are drawn as
ovals. Arrows are omitted. The node number of the higher level diagramis written in the lower left of the Context field.
S~Node number l'0
Figure 5-6. Illustration of Context Field
The Context field of a cuntext diagram (A-O) is "NONE." The Context
field of a top level diagram (AO) is "TOP."
II74
MY 11,7777
The "Used At" Field
This in a list of diagrams, other than the immediate context,
which use this sheet in some way.
5. 4l. 2 The ,Messaae" Field
The Message field contains the primary message to be conveyed.
The field is normally used for diagramming, However, the field can be
used for any purposes glossary, checklists, notes, sketches, etc. The
author should use no paper other than diagram forms.
5. 4.3 The "Title" Field
The Title field contains the name of the material presented on the
Diagram Form. If the Message field contains a diagram, then the contents
of the Title field must precisely match the name w-itten in the parent box,
5. 4.4 The "Number" Field
This field contains all numbers by which this sheet may be
referenced.
C-Number
The C-number is composed of two or three letters of the author's
Initials followed by a number sequentially assigned by the author. This
C-number is placed in the lower left corner of the Number field and is
the primary means of reference to a sheet. Every diagram form used by
"an author receives a unique C-number. When a model is published, the
C-number may be replaced by a standard sequential page number (e. g.,
pg. 17").
Page Number
A kit page number is written by the librarian at the right hand
side of the Number field. This is composed of the document number
followed by a number identifying the sheet within the document.
75
T7Ii-i i i iiiII |mu a

5. 5 Keeing iles
Each persor participating in a project should maintain files of the
dcouments received. The librarian maintains the master and ref irernce
files for each kit submitted during the :,urse of a project, A complete
explaination of library files is given in the 'ICAM Program Library Main-
tenance Procedure.," Volume XI of this report.
Variations in the filing process may occur based on individual pre-
ferences but it is recommended that these files be maintained.
s Standard Kit Files, maintained by authors andcommenters
0 Summary Kit, maintained by authors, commenters,and readers
0 Working Files, maintained by authors
5. 5,1 Standard Kit File,
This file contains the Standard Kit. issued or received. A record
of kits filed should be maintained and should include any information that
allows convenient access to the contents of the kit.
5.5.2 Summary Kit File
This file contains the Summary Kits issues or received. A record
of these kits should also be maintained.
5.5.3 Working File
This file contains all documentation that has not been submitted in
a kit. Work in progress and notes should be kept in this file.
7 F[
4_ _

45.6 The IDEF Model Walk-Through Procedure
In addition to the Kit Cycle, a Walk-Through Procedure has been
deve~loped. This procedure may be used when the participants in building
a model can be assembled for commenting.
1. Present the model to be analyzed by using its node index.This is the model's table of contents and given therevitswer a quick overview of what is to come.
2. Present a Glossary of Terms. This will allow each reviewerto replace personal meanings of words with those thatthe presenting team has chosen. The meanings shouldnot be questioned at this point. A change in meaningnow would require many changes in the diagrams.
3. Present each diagram for review.
The diagram walk-through process is an orderly, step-by-step process
where questions can be asked that may identify potential weaknesses in
the diagram, Six steps of a structured walk-through follow below.
Diagram corrections may be proposed at any step. These
corrections may bm noted for execution at a later date or adopted
immediately.
Step ii SCAN THE DIAGRAM
This step allows the reader to obtain general impressions about
the content of the diagram. Typically, the reader will have reviewed
the parent diagram which depicted the current diagram as one of it@
boxes. The reader is now examining how the author decomposed that
box.
CRITERIA FOR ACCEPTANCE:
1. The decomposition is useful for its purpose andcomplete within the context of its parent box.All lower level functions or data can clearly becategorized under each of its boxes,
2. The diagram reflects, in the reviewer's opinion.a relevaj I point of view based on the purpose ofthe model.
77
,17:ito

rl
3. In the opinion of the reviewer, there is enough newinformation provided to extend understanding of theparent box. There is not so much detail that thediagram appears complex and hard to read.
Unless a problem is rather obvious, criticism may be delayed until
Step 3 below. However, first impressions should not be lost. They might
be put on a blackboard or flip chart pad until resolved.
Step 2: LOOK AT THE PARENT
Once the reader understands the current diagram's decomposition,
the parent diagram should be reviewed to insure compatibility.
CRITERIA FOR ACCEPTANCEt
1. The decomposition covers all of the points thereviewer anticipated wheii reading the parentdiagram.
2. Now that the decomposition of this portion of theparent diagram is revealed, the detail which thereviewer envisioned for this box should still seemcorrect. If not, note the missing detail,
It might be important at this step to return to the parent diagram
briefly and add new - notes or embellish existing ones, based upon
the added insight gained from this look at the decomposition.
Step 31 CONNECT THE PARENT BOX AND THE DETAIL DIAGRAM
This step tests the arrow interface connections from the parent to
child.
CRITERIA FOR ACCEPTANCE:
1, There are no missing or extra interface arrows,
2. Interface arrows are labeled with proper ICOM codes.
3. Child arrow labels are the same or an elaboratinnof its parent's matchng arrow. Labels convey thecorrect and complete arrow contents.
78
I4A

4. Examination of the connecting arrows reveal no problemsin the parent diagram. (An added interface may createa misunderstanding of the message conveyed by theparent.)
A clockwise tour of the four edges of the parent box, checking
each arrow, will provide a methodical way to check matching of ICOM codes
with parent arrows,
Step 41 EXAMINE INTERNAL ARROW PATTERN
The pattern of boxes and arrows constitute the primary expression
of the rmodel being created.
Each box will be examined in nods number order, and each arrowfollowed In ICOM order for each box. When this process is complete, the
reviewers should be led through the diagram to explore the consequences
of situations with which reviewers are familiar and to test the diagram's
capability to simulate the relationships known to exist.
CRITERIA FOR ACCEPTANCE,
1. The diagram does not look cluttered. The number ofarrow crossings and bends is minimised.
2. The boxes should be balanced with regard to detail.There should be an equal amount of detail withineach box, However, compromises on this critarionare acceptable for the sake of clarity,
3. The diagram should be consistent with the reviewer'sexperience and knowledge of the subject matter.Feedback and error conditions should be shown asthe reviewer expects.
Step St READ THE SUPPORTIVE DOC UMEN,.TATION 'This step examines the points that the author highlights in the
text, glossary and FEOs.
CRITERIA FOR ACCEPTANCE:
1. The text confirms the interpretation obtained fromexamining the diagram itself. ,
2. Normal-path., feedback, error-handling, and otherfeatures suggested by the text are found in thediagram or found in an FEO (For Exposition Only) "diagram.
79
RIL WO
, !

.. j 4
FI
3. Significant diagram features uncovered during Steps 1-4are found in the text, glossary or FEO.
4. References to the diagram are detailed enough toconnect text, glossary or FEO to specific parts of adiagram.
Step 6t SET THE STATUS OF THE DIAGRAM
1. Recommended as it stands.
2. Recommended as modified,
•3. Drafti Too many changes mad., a redraw isnecessary, and future review is required,
4. Not Accepted: A complete re-analysis isrequired.
I
'I
* '[
, 80
I r,.•?

SECTION 6
AUTHOR'S GUIDE TO CREATINGIDEF0 DIAGRAMS
CONTROL
INPUT FUNCTION 00OUTPUT
MECHAN ISM I.

AUTHOR'S GUIDE TO CREATING IDEF 0 DIAGRAMS
When creating any IDEF 0 diagram, the requirements to be satisfieda re that t
a& its purpose and viewpoint must match thestated purpose and viewpoint of the overallmodel i
b. its boundary arrows must correspond to those of itsparent diagram 1
ca its content must be exactly everything in its parentbox.
6.1 Basic Steps of Authoring
The step-by-step discipline of authoring makes it possible tocreate diagrams that form useful and coherent models, The discip!line
to follow Ist
a. Bound the subject matter more precisely than thetitle of t a function box suggests. This is donewith a list of data (objects or information) actedon or processed by the function.
b. Study the bounded set of subject matter and formpossible subfunctions of the total function.
c, Look for natural patterns of connection of thosesub functions.
d. Split and combine subfunctions to make other boxes.
e. Draw a final version of the diagram with carefulattention to layout and clarity.
6. 1.1 Selecting a Context, Viewpoint, and Pu'r l-
c Before beginning any model, it is important to determine the
model's orientation. "has includes the context, viewpoint, and purpose.
83 •,

The context establishes the subject of the model as part of a larger
whole. It create.-s a boundary with the environment by describing external
interfaces.
The viewpoint determines what can be "seen" within the context,
and from what "slant," It states the author's position as an observer of
or participant in the system for the benefit of an audience. Depending
on the audience (management, technical, customer, etc.), different
viewpoints may be adopted that emphasize different aspects of the
subject.
Only one viewpoint per model,
One model can serve to reflect only one purpose and can follow
only one viewpoint.
The purpose establishes the intent of the model or the goal of
communication that it serves. Purpose embodies the reason why the
model is created (functional specification, implementation design, customer
operations, etc.).
These concepts guide and conctrain the creation of a model. While
they may be refined as authoring proceeds, they must be consistent through-
out a model if Its orientation is to remain clear and undistorted,
Crystn ize your purpose.
Without conscious effort, in the process of detailing, the
author can stray from the original purpose.
The starting point for every analysis is to botund the context,
Decide what the focus is before the top-most box is created. Beware
of drifting out of this carefully-selected starLing domain,
48Ii
'" ~84
I, ý W y
... lI i- .. I1m

Every step should be checked against the starting purpose.
Things that don't fit may benoted for later modeling of the relevant
views.
Clarity is derived from the rigors of detailing. Knowing howfar to go, when to stop, when to change gears, and how the pieces
fit together will always depend on the purpose for whi ai a model is
created,
6.1.2 Creating the Context Diagram
To start a model, create the A-0 diagram. Draw a single box con-
taining the name of the function which encompasses the entire scope of the
system being described. Use arrows entering and leaving the box to
represent the data interfaces of the system to its environment. This
single-box diagram bounds the context for the enthie model and forms
the basis for further decomposition efforts.
Some authors find it easier to sketch the AO and then draw
the single box and interface arrows shown at level A-0. It may be
necessary to switch diagramming efforts back and forth between
A-0 and AO several times to obtain a good start for the decomponition.
If the A-0 diagram has begun at too low a level of detail, make
the A-0 box the basis of a new level AO diagrr.m. Move up one level to
a new A-0. Repeat this process until an A-J is reached which has
sufficient scope to cover all aspects of the system. (So.netimes such a
higher level will broaden rather than clarify the chosen viewpoint. If
so, make an A-1 multi-box context diagram and keep the A0 diagram to
the original intent.)
*1
85
e4'
:I, el"

6. 1. 3 Creating the Top-most Diagram
All system functions lie within the single box shown on the A-O
diagram. The diagram bounds the context of the system. The AO diagram
decomposes the A-0 diagram into its three to six major subfunctions.
The real "top" of the model is the AO diagram. It is the first and
most important expression of the model's viewpoint. Its structure clearly
shows what the A.,O diagram tried to &ay. The terms and structure of AO
also bound every subsequent level because it is a complete description of
the chosen subject. Lower levels delineate each of the AO functions
(boxes). If the purpose of the model is to be achieved, this chain of
detailing must be carefully followed at each step. Beginning at the top
is the challenge of authoring. It forces the author to maintain a level of
abstraction, keep an even model depth, and relegate details to a lower
level.
6.1.4 Creating Subsequent Dlagrams
To form the structure of diagrams, decompose each box on the AO
diagram into its major part. Form a new diagram which covers the same
topic as its parent box but in more detail,
To decompose each box into 3-6 boxes, obtain the needed additional
facts. Create a first-draft diagram by listing all data items and activities
contained in the box being decomposed. Take care that these lists cover
the entire topic of the parent box so that no portion is lost in the decom-
position. Draw boxes which are based on these lists and draw interface
arrows between these boxes.
To derive the clearest possible diagram, modify or re-draw the
diagram severAl times until satisfied. Spt (break up a box into two or
more parts) and cluster (combine two or more parts into a single box)
until satisfied.
Generate portions of more detailed-level diagrams to explore poin*s
which need clarification. Create several (0 or 4) diagrams as a set,
rather than one diagram at a time.
86
__ _ _ __ _ _ __ _

44
6.1.5 Creating Supporting Material
Eventually, each diagram will be accompanied by a page of narrative
text, glossary and, perhaps, FEOs. The text associated with the A-0 diagram
should complete the model's orientation and is written when the A-0 diagram is
created. The text complements the context (expressed in A-0 itself) by
expanding upon the stated viewpoint and purpose of the model.
Text for every other diagram (including AO) is quite different.
It tells a brief, concise story. It does not duplicate what the diagram
already says, but weaves through its patterns. At every level, this
captures the viewpoint in a way that furthers the purpose.
The glossary explains the definitions the author gives to functions
and data in a diagram. These definitions are important because the
terminology used in the model may have a completely different meaning in
one company from the meaning in another company.
FEO's (For Exposition Only) are diagrams that highlight a particu-
larly interesting or subtle aspect of a diagram, They are not bound by
IDEF syntax and may contain partial arrow structure, notes, etc. to,
emphasize their point.
6.1.6 Selecting a Box to Decompose
Given a complete parent diagram, "firm up" the higher levels before
overcommitting to details. That is, given AO, emphasize work on Al, A2
A3. Decomposing Al into All, Ail1, should be done later, This avoids
potential rework should changes be made to higher level diagrams.
Keeping an even depth is not a strict rule. The amount of depth
at any time depends on whether more depth would capture meaning better
than one diagram. Don't put off doing a lower level diagram, e.g. All,
sketch while the ideas are fresh. The important thing is to treat all such
forays as sketches until the "horizontal" even level is confirmed. Be
ready to rework the lower level material if it conflicts with higher level,
e.g., Al. A2, A3, (etc.).
87
WTi

Two guidelines are helpful in deciding which box to decompose:
1. Start with the "hard part" -- the part that i leaitfamiliar or is least clear.
2. Select the box whose decomposition will give the most
information about other boxes.
The simpler topics can be more easily decomposed later, with less risk of
error or oversight, and can be easily manipulated to fit the decomposition
of the more complex issues.
6. 1. 7 Author Activities
6. 1.7. 1 Data Gathering Phase
Read Background
The author gathers information about the subject matter by read-
ing source information.
Interview
The author personally interviews an expert on the subject matter.
This interview is not used for multi-pernon planning or review meetings.
Think
Digest the information obtained from readtnr and interviews before
actual diagramming begins.
Pick Box
Decide which box is the appropriate one to detail based on informa-
tion obtained,
6.1.7,2 Structuring Phase
Draw
This encompasses the actual creative rjroces:j of generating a dia-
gram. It Is not limited only to drawing boxes and arrows. It also includes
the ]isting of random data elements, making sketches, etc.. which precede
drawhi g boxus aAnd arrows.
88
'._ WS...... y j

El
Redraw
This covers the digestive stage of diagramming and corresponds to
editing and rework of verbat text. The activity here is concerned not
with creating, but with graphical editing and rearranging for clarity.
Fix Master
This applies to the correction of master drawings to incorporate
improvements. It is primarily a mechanical operation which results from
the fact that masters are set aside while changes are made on copies.
6.1.7.3 Presentation Phase
Write and Edit Text
Text accompanying any diagram should be precise. Editing will
often alleviate unnecessary detail and redundancy.
A semble
Assemble any material, diagrams, node, trees, glossaries, text,
etc. relevant to the subject, Include a completed Cover Sheet,
6.1.7. 4 Interaction Phase
React
This refers to the author reacting to comments, It is a combination
of reading and annotating reactions to the comments.
Talk
This represents time spent when an author and commenter actually
get together and talk about author reactions to the comments, I
Group Meeting.
This is the time spent in group meetings reviewing progress or
brainstorming next steps. The minutes of the group meetings will identify
the subject matter under disctussion.
89

6.2 Drawing an IDEF 0 Diagram
Diagram creation is the most subjective and creative activity of the
modeling process. It is open to wide variations between individual authors,
No one set of steps will work equally well for all authors. The steps
presented here are a proven sequence and are designed to assist a new
author in drawing IDEF 0 diagrams.
a. Create a relevant, but not yet structured list of data,List items within the context of the parentboxthat first come to mind. aroup-items, if possible, toshow similarities.
b. Name functions that act on the listed data and drawboxes around the names.
c. Sketch appropriate arrows. As each box is drawn,leave arrow "stubs" to make the box more meaningful.Make complete connections as it becomes obvious whatthe diagram is saying.
d. Draft a layout that presents the clearest box andarrow arrangement. Bundle arrows together if thestructure is too detailed. Leave only the essentialelements, and modify diagram as necessary.
e. Create text, glossary and FEO (For Exposition Only)diagrams, if necessary, to highlight aspects whichare important. Propose changes, if needed, in theparent diagram.
6.2.1 Generating Function Boxes
Function boxes are generated using the major subfunctions of the
parent. As subfunction names are written, draw boxes around them to
form the start of an actual diagram. At this stage the number of boxes.
is immaterial. They can be modified by clustering and splitting.
90
ilVY•
A .

Clustering will group two or more boxes to form a single box. Its
goal is to cluster related functions into a single, more general function,
It eliminates premature detail which obscures the message to be conveyed
at this level.
S1pitting will break a single box into two or more parts. It is the
inverse of clustering. Its goal is to provide more detail to present suffi-
cient understanding of the subject being decomposed.
Review the resulting set of function boxes. Look for good balance
between the factors chosen. See if the names can be made more specific.
Use special terms and abbreviations only when needed to promote communi-
cation with the intended audience and only at the detailed diagram levels.
Do not use them at the highest (A-O and AO) levels, Carefully define
special terms in the glossary. I
In all cases, make the function box names verb phrases. Whenever
the phrase can be interpreted as either a verb or a noun, use the notation
"(v) to signify the intended verb usage.
Boxes
1. In most cases, layout boxes diagonally from upperleft to lower right. While any layout which makesclear the author's intent is acceptable, verticalor horizontal formats tend to crowd arrowo and hindergood structured analysis style.
2. Boxes placed in the upper left "dominate" boxesplaced lower and to the right through the controlarrows that link them. Thic standard style makesit easier for readers to understand your meaning.
3. Number each box in its lower right corner. Assignthe box numbers on a diagram from left to right and fromtop to bottom. This defines" the node number for eachbox. The leading digits of the box's complete nodenumber are the same as this diagram's node number.The last digit of the node number Is this box number.If the box in Figure 6-1 is in diagram A4, thecomplete node number for this box Is A42.
91
ix..7

TITLE
Figure 6-1. Box Numbjr
4, On working or draft copies, write the authorC-number below the lower right corner of anybox that isdaecomposed.
5. No diagram may contain more than six boxes.
6,2.2 Creating Interface Arrows
Sketch data interface arrows on each individual box. Connect ends
of arrows to show which outputs supply which inputs and controls.
Recall that input data are transformed by the function to produce ,
the output. If an arrow contains both input and control data, show it as n,
a control. If it is uncertain whether an arrow is a control or an input,
make it a control. It it is unclear whether or not a particular piece of
data is needed at all, leave it out.
Output arrows show the results of possible activations of the
function. The syntax for output arrows does not indicate which patterns
of output arrows may occur under whjich circumstances. If the sequence
is of particular interest, draw a FEO illustrating the pattern. Do not
worry about sequence. Just make sure that all important cases are
allowed by the diagram,
Bundle groups of related arrows whenever possible. The most
common mistake when creating arrows is to make the arrow structure or
the arrow labels too detailed. The level of detail of arrows must match
the level of detail of boxes. At high levels, both box names and arrow
laibos will bo general.
As a final check, compare all arrows to the cdata list to insure that
tach correct data item appears. Elements that do not appear Fre either
incorruct for this level of dietall or were o'verlookod when crvating the arrows.
92
N..

Think control and constraint, not flow
A basic rule for layout of the arrow structure is "constrain,don't sequence." That is, make the diagram structure show relation-
ships that must. be true no matter which sequence is followed,
Even though something must progress from stage to Stage to
reach some desired end result, try to express the constraints that must
be satisfied or the invariant properties that must be true rather than
some one specific sequence of steps that will yield that result,
The reason is that all boxes may be active simultaneously. Thus,
sequence has no meaning,
It in always more powerful to constrain than to sequence. Where-
ever possible, diagrams should be created that say the right thing
regardless of what steps are thken first. Clearly, this is better than
restricting to only one of the possible sequencs,,
Often, it is easiest at first to think of submodule actions in a
particular sequence to get unstuck and get something on paper. This
may be a good way to get going, but always rework the first attempt
into a contraint structure.
Label carefully
Subordination of unneeded details highlights the meaningful ones.
Don't clutter your diagrams with too much information and too
Sarrows
93
4 1 -I''? = 17 ,7

Don't spend too long on a single level, Everything need not be
expressed at once to avoid being incomplete and misunderstood.
The whole point of the discipline is to get everything said,
eventually.
Also, if there is too much in a diagram, it becomes t . If thi•is allowed to happen, the diagram is weakened. Strenith comes from the. jhcmsfo thestructure. This can be accomplished by leaving details to the subfunctions,
Do iterate between high-level diagrams and subfunctions that fill
out the details,
Leave out questionable arrows
It is often hard to determine whether to show an arrow or not,
The easiest way to handle the arrow question, is "When in doubt,
leave it out. ' If the arrow isn't reall essential to the main backbone, if
there are questions about it, it is probably Incorrect to include it.
Incorrect omission of a questionable arrow now won't cause permanent
damage. The need for the arrow will be clearer in considering. subfunctions
and the ICOM discipline will force the arrow back up to this level. At that
time, there will be no question about it.
6.2.3 Level of Effort
The initial goal in generating a diagram should be a clear diagram
that represents a definite message and doe• not violate any syntax rules.
"when the diagram is finished, the critical guidelines of reading and review
by others can be used to improve the first try. Most diagrams can be
modified to make a second version that is in some sense better than the
first. The first will rarely be the very best.
As skill levels develop, first diagrams get better and authors feel
more comfortable using IDEF 0 . Reworking of diagrams will always be a
necessary part of the process. The key idea is to use a review cycle to
make progress on paper. In a series of orderly advances, all of the
important aspects will be properly handled,
94
,AA.
S.. . . .. .•.'1 , ,

IDEF 0 is a thought-forming methodology, not just a diagram-
making exercise. Putting thoughts on paper and letting the notation and
discipline work is a move towards a satisfactory resolution. Rely on an
ability to ask good questions, rather than on the expectation of providing
"perfect" answers.
6.3 Redrawing an IDEF, Diagram
6.3.1 ModifyIna Boxes
When first creating a diagram, 3-6 function boxes of approximately
the same level of detail are derived. Clustering and splitting will provide
a boundary which is more easily understood or which will provide a simpler
interaction between the function boxes.
Most often, clustering and splitting work together. Boxes are
split and the resulting pieces clustered into new boxes which more closely
convey the intended message. The tame subject matter is covered, but
pieces are grouped in a more understandable way.
Split and rephrase
It is important that all of the boxes of a diagram have a consistent
flavor. Changes elsewhere must not make one subfunction seem out of
place, Split and rephrase to restore the balance.
Sometimes a box does not flow with the other boxes of the current
diagram.
Frequently the trouble is that other aspects have undergone
change and clarification. That which earlier was a good idea, now has
the wrong slant or flavor.
Divide the offending box by splitting it into two or more pieces,
one of which still contains the essence of the original idea.
Do expect to change the wording of the box (or boxes). With the
separation, new ideas become clearer and mesh more closely with related
boxes.
"95
IL. / *-r-r. -t'.~ n p-n ---

Cluster and replace
A solid abstraction is both clearer and more powerful than pre-
mature detail. Cluster related boxes and replace by a single encompassingbox,
Frequently a good level of abstraction can be made even better by
clustering several boxes into a more general view and postponing the
details to thu next level down. Draw a line around the cluster and replace
them all with one box, suitably named. The extra level is not'an added
cornplexity, It is a better representation because the structure has been
shown more clearly.
This phenomenon arises often in conjunction with splittinz and in
one of the most powerful methods of explaining functions.
6.3.2 Bundling Arrows
Both arrows and boxes should be at a corresponding level of
abstraction in a diagram.
There are two basic ways to achieve this:
1. Bundle arrows with the same source and destinationunder a single more general label, and make one arrow.
2. Rename some boxes (using Split and Cluster) to betterdistribute the uubfunctions and rolabel resulting arrows.
It is seldom true that an excess of arrows indicates a mistake. It
may be that they are both accurate and precise. But it is always true
that an excess of is bad if things are obscured. The ability of
readers to understand what is being said should guide th,. number of
arrows used,
196
V'4'

6.3.3 Proposlng Modifications to the Context
The detailed understanding revealed by creating a now diagram
may uncover errors or oversights in the parent diagram. Parent modi-
fication is a natural and anticipated event. When creating the arrow
structure, the rule Is that "if there is any doubt whether a data arrow is
needed by a function box, leave it out -- later detailing will demonstrate
whether or not the arrow is really needed." This is the point where sucti
questions are resolved for a specific reason rather than through former
speculation.
Parent diagram changes may represent various degrees of difficulty,
If the change can be accommodated by a revision to the immediate parent
only, this in simpler than a revision which involves more remote diagrams
as well. When proposing a change, think it through carefully and assess
its complexity, Substituting simple changes for major ones can harm the
quality of the decomposition. When the correction is completed, check
all boundary connections to insure that ICOM codes are properly shown,
Inform other authors working on the diagram of the changes,
Always have in mind the parent diagram for the box being detailed,
It will aid in the creation process.
If the detailed diagram doesn't fit the context, either the current
work or the context is wrong. Change the context or change the current
work. They must match
I9
97

rf
6.3. 4 ICOM Syntax for Connecting Diagrams
An important aspect of understanding diagrams is the ability to
find and understand facts that are needed. Node numbers show the
structure of the box decomposition, The arrow network provides inter-.•i face connections.
f c M n ctode an e written on all arrows having one end unconnectedICOM codesae
on the diagram. These boundary arrows connect the arrow network
across diagrams, Each boundary .,-row is labeled with an ICOM code to
specif',' the connection of the arrow to the parent diagram,
6. I Graphic Layout
Layout the boxes diagonally according to the constraint structure,
from upper left to lower vight, with feedback arrows going up and left, At
this point, number the boxes from left to right.
It is best to start this layout with the most heavily used constraint
arrows only, adding less used paths later, This subset of the arrows will
permit the box position to be determined, Draw all boundary arrows shown
on the parent diagram and then add the remaining arrows,
6.11. 1 Constraints on the Diaprim
1. When an entry arrow serves both control and inputfunctions, show it as control. When in doubt, makeit control. An arrow appearing on a parent diagramas control can appear on the next level as control orinput or both, depending on its relationship to thesubfunction at this level.
2. Function boxes must always have control arrows,though they may not kways have inputs.
.1, 98
FF M
'T'

3. in general, do not split an arrow into both a controland an input to the same box. This detail is best shownon a lower level diagram where the destination of eachbranch and the reason for the split will appear. Whenit must be done choose labels for the two branches thatwilconvey your important decision.
4. Cyclic processing or data storage on an IDEF diagrammay be shown as
ori
4,
Only show it this way if the storage is to be thoughtof am being "at this level." Otherwise, show the feed-back loop at the next level of detail, that is, "inside"'the box,
5. Try to avoid redundancies such ast
MAK CONSIDERorX
In these cases the trivial box names merely repeat themessage conveyed by placement of the arrows. A littleadditional thought will usually produce more informativebox names.
99
TW 4 t r..-, T1"
. .R.. "

6.4.2 Arrow Placement
1. Draw arrows along horizontal and vertical lines, notdiagonally or as curves (except at corners).
2. Place arrow corners, Intersections, and labels areasonable distance away from boxes.
3. Don't use the keywords, i.e., "data," "function,""input," "output," "control," or "mechanism" innames or labels, unless absolutely necessary,
4. If an arrow is long, label it twice.
c ook cook •0
5, Place iCOM codes at the unconnected ends of arrows,
6. Connect open-ended boundary arrows to show all theplaces affected. Readers may miss connections otherwise.
rather than~ .A........
7. Don't draw arrows all the way to the margins of thediagram sheet,
Srather than •"
8. Space parallel arrows adequately. They are hard tofollow visually if they are lengthy and close together.
"r a th e r th a n --'- ---
S1), Place e~xtea arrowheads along arrows where neededfor clarity,
IOu
•O.,,r,. ,' "" "' T I".V..• . .. . ••,/•,•i '• - " l•q•• t• .;•l'€',,, -' ,, l;;,''""-.. . • . ' . .. ',.'..•• • • • •i.. - ,:, '••,'a L .•'"T . B •".i"'!''•;1',*":' . " " "' •'"?a " " ,' " . .". ..• "' "• "L .• ; • •.. .

6. 4,3 Arrow Layout
1. Bundle arrows with the same source and the same destina-tion unless the arrow in of such importance that makingit part of a pipeline would decease clarity,
E ~ rather thanDTS
2. On any one side of a box, there should never be morethan four arrows. If there are more, bundle some,label Wfh a suitable abstract label, and fan out branchesto their destinations.
rathe r than
3. Control feedbacks are clearer when shown as "up andover, II
Input feedbacks are clearer when shown as"down and under,"
101
L~
,t 711,,•,,, I0
~,

4. If an arrow branches and feeds into several Uoxes, drawit. at the saine relative ICOM position on each box, Ifpossible.
rather than
5. Lay out arrows so as to minimize unconnected crossinngs
rather than
6. Minimize curves and corners, whenever possiblet
7. Use the expresuive p~otential off branching arrows when .
and if it is appropriates
A ta B•A and BA d
Arather than
A ~A
B
102
i • ,,+. ' . •.•.,++:"•' '.+,• •: ,:-":. "'•• i; •" ... " T• +.• • • ;• :., •.*• ,•- +, •:• : ., ,,-•;1...4

8. To avoid clutter when showing an external arrow whichapplies identically to or is obtained identically fromeach and every box on a diagram, use the "to all"convention:
-- ~to AU X-
or
-- fro all Y -
6.5 Writing Text
The text that accompanies each diagram presents a brief overview
of the diagram. It is always less than a page in length, It highligh-s
features that the author feels are of special interest or significance by
walking the reader through the main ideas of the diagram. It does not
duplicate every detail shown on the diagram itself. If the diagram conveys
the intended message sufficiently well by itself, the text may be omitted.
Write the text only after a diagram has received a fairly high level
of review and approval. Waiting to write the text forces the diagram itself
to properly communicate the intended message, Text based on carefully
drawn diagrams will be as structured and as organized as the diagram
itself.
103
77 77 7 ,. : . ., '•

Include glossary definitions to explain the use of terms used in the
di.dgranr. A word may have different connotations from company to company
and even within one company. For example. "directives" could emanate
from the design or finance departments, government, corporate policy,
etc.
Try to get good text without adding a FEO. FEO's should be used
to illustrate subtle aspects that clarify the intent of a diagram but which
would clutter the diagram were they included. If a FEO is necessary, the
text that accompanies it should refer to the related diagram.
6.5.1 Writing the A-.0 Text
Write the A-0 level text when A-0 diagram is drawn and include it
whenever A-0 is presented. Since all decomposition proceeds from the
A-0 diagram, place any noteworthy facts which apply to the entire model
in the text associated with this diagram. The A-0 text must contain arl
di.cussion of the viewpoint and purpose of the model.
6. 5. 2 References and Notes
A brief' reference language may be used in writing text and notes
to refer to diagrams and specific parts of diagrams. For example:
02 means The boundary arrow with ICOM code 02
211 means Box 2 Input I
202 to 3C1 means The arrow from 202 to 3C1
0 Menans Note n
104
. ... ._UI I
-I.,'.,|

These items may be used individually if they refer to the current diagram
(e.g,, in 0 notes or text). Otherwise thty should be preceded by node
number, and if necessary, by model name, A period ". Is uýsed to mean11see" a certain thing on the specified diagram. D. example:
MODEL/A21.3C0 means In "Model" on diagram A21, seeBox 3 Control 2
A422.( means On diagram A42 in this model, see
note 3
Each reference needs only as much a- necessary to be completely
unambiguous, The fullest form lio
ACCT/A21(T56).102 to 4C3
which means in model "ACCT," diagram A2i, version T56, "ree" the arrow
from Box I Output 2 to Box 4 Control 3.
Add neat and complete references to your text, glossary and FEOQ
It is easy to be exact without causing the reader to falter.
When writing texts, scan the diagram continually to make the
story interresjl.K
Don't worry about adding references. That will impede the flow
and make sentences awkward.
When finished with thto text go through and add box-number
references to tie the text to the diagram exactly.
Most of the time a simple box number ("Box 3") or a reference to
a couple of arrows are sufficient ("Box 3, 01 and C2"). When a reader
needs to actually "See" the other diagram, use the "." of the reference
language.
105
`7 77777-7.01

References should be used for clarification. They will be
unobtrusive only if added after the story-line text is finished.
6.6 Model Quality Checklist
The material presented in the following sections provides definable
checks for constructing or evaluating the quality of IDEF0 models.
6.6.1 Syntax
Syntactic rules are constraints in the sense that they describe
logically what is represented graphically. Components of a diagram
in IDEF0 can be considered to be primitivesl syntactic constraints are
statements which specify allowable or valid relations and operations which
affect these primitives. In short, a syntactic constraint can be thought
of as a criterion: if the constraint is not satisfied, or is violated in
the graphic display, the criterion has not been met, and the resulting
diagram or model is deficient with respect to that particular constraint.
At least three different types of syntactic constraints are
distinguished, depending on the level of analysis or level of granhic
reprnsentation that is being addressed:
1) Local Construction:
These rules pertain to simple, first-order combinations orassociations of primitives. They are defined for FEO'sand diagrams, and must be followed for valid construction.Diagrams having missing components or showing relationsamong primitives other than those stated below are "invalidsyntactically.'
2) Global Construction t
These rules pertain to whole diagrams, but not to textor FEe's. Thus, they are defined over several con-structions, and can be verified only after the diagramhas been completed.
3) Model Construction:
Constraints in this category specify the layout ofnodes and numbering /lettering designations thatcreate an ordered hierarchy among diagrams.
106
27

The following checklists can be used as guidelines for determining
a minimum level of acceptability for IDEF 0 diagrams and models. Deficiencies
can be pinpointed at the local, global or whole model level. "Completeness"
and "correctness" are identified here as overall evaluation standards that
must be met, Working definitions (for IDEF 0 syntax) appear belows
COMPLETENESS5
DEFINITION DEGREE TO WHICH ALL REQUIRED FIELD-ENTRIES,
LABELS, BOXES, ARROWS, AND IDENTIFYING
NOTATIONS ARE PRESENT IN A DIAGRAM OR MODEL.
CORRECTNESS
DEFINITION DEGREE TO WHICH A DIAGRAM OR MODEL HAS BEENACCURATELY CONSTRUCTED, LABELLED, AND
IDENTIFIED; I.E., DECREE TO WHICH SYNTACTIC
RELATIONS HAVE BEEN REPRESENTED APPROPRIATELY
SiR S IN THE GRAPHICS, AND CONSTRAINTS OBEYED.
MEASURESI CHECK FOR ADHERENCE TO CONSTRAINTS ITEM BY ITEM.(SEE SECTIONS 6.6.1.1, 6.6.1.2, and 6.6.1.3).
6.6.1.1 Local Construction Syntax
a. One way arrow segments are made up of ordered pairs
of endpoints (SOURCE, SINK), where:
SOURCE points are one oft
boundary endpoint near diagram I, C, or M boundarybox endpoint on Box 0 sidefork sinkjoin sink
107
q TIE.

SINK points are one of:
boundary endpoint near diagram 0 boundarybox endpoint on Box I, C, M sidejoin sourcefork source
Note that all combinations are legal except a (diagramboundary, diagram boundary) arrow,
b. Arrow labels are associated with arrow segments.Line squiggles may be used to clarify the association.
c. Each ICOM code from the parent box must be associatedwith tl""-oundary endpoint of some arrow,
d. Boxes can have an integer number. Box numbers
start at 1 and increase by 1,
e. Names are associated with boxes and cannot stand alone.
f. E ndpoints or arrows at diagram boundaries havetunnel ",( )or an ICO9W-b=not Gboth
g, Endolints of arrows at box endpoints can havet-- e a--
6.6.1.2 Global Construction Syntax
I A finished IDEF diagram consists of no less than threean more than six-boxes, unless it Is an A-0diagram in which case it contains exactly one largebox.
* Each box must be named and numbered, On each diagramth• i-umbt'rs start at one and increase monotonicallyby one. The box on an A-O diagram is numbered 0, Notwo boxes on one diagram can have the same number.
* Each box must have at least one arrow source at its 0(right) side and one arrow sink at Its C (top) side.
* All endpoints of arrow segrmonts at diagram boundariesmu-st haTve eithr an IOM code or tunnel "( )', excepton an T-0 dFr:W 7o wch-t ere are neither ICOMcodes nor turnel "( )
108
04i
•'.,,': .... "..•,•• ",l':• .',. . ,.•'..: -,•.., ,,:" ,., ,.',•' .. : ,, •,,: ,-,...'. Ir....v

6.6. 1.3 Model Construction Syntax
Rules and Conventions for Valid Model Structure In IDEF0
A model is a hierarchically structured collection of nodes
representing successive refinements, each of which may be detailed on
one or more diagrams. The top node of the IDEF 0 diagrams in a model
is designated AO. A box has a node number dezived by appending the
box number to the node number of the diagram on which the box
appears, A diagram has the same node number as (is the same node as)
the box it details. However, when appending the box number, the "0"
(from the AO node) is treated as "null" and dropped. For example, the
decomposition of Box 2 on the diagram detailing node AO is designated
A2, Also the decomposition of Box 1 on the diagram detailing node '
A2315 is designated A23151.
A FEO that illuminates an IDEF diagram it designated by concaten-
ating the letter F to the right-hand end of the designator of the diagram,
Text or glossary that illuminate, an IDEF diagram or FEO is designated
by concatenating the letter T or 0, respectively, to the right-hand end
of the designator of the diagram or FEO. For example, the FEO
illuminating Box 3 of node A21 would be designated A213F. Text
illuminating node A114 would be designated A114T, Text illuminating
FEO A31F would be designated A31FT. Glossary definitions for terms
used on diagram A114 would be designated A114G, etc, Additionally,
if there is more than one illuminating FEO or glossary page, a
sequence number is concatenated to the right of the letter F, or
G. Thus, the two FEO's Illuminating diagram A213 would be designated
A213Fl and A213F2.
Although the top node of an IDEF function model is always AO,
there are other nodes at a "higher" level used to show context and
environment. Thea A-0 (A minus zero) shows the context of AO, The A-0
box may be shown in an A-I diagram, etc.
109
I •,
1 A ,. •9,
L.. ... , , t " ,•,', '. ' • ,

The interconnections between parent and child arrows are
maintained through the use of ICOM codes. The ICOM occurrences are
represented explicitly on the child diagram at the diagram buundary point
of an arrow. The corresponding ICOM on the parent box is determined
implicitly from the position of the arrow's context point. The letter
(I, C, 0, or M) corresponds to the side of the box on which the context
point oucurs. This is followed by a number determined by the order in
which the arrow appears on that side of the box (counting top down and
left to right). Note that ICOM codes will change as arrows are added,
deleted, or moved on the parent box.
6. 6. 2 Semantics
"Semantics" is a term that has been applied to a&wide range of
factors, all of which have some effect on the "meaning" of labels,
diagrams, and models in IDEF 0 . In order to establish criteria useful for
evaluating models, those aspects of "meaning" that relate to the consistent
and unambiguous naming of data and function in IDEF 0 will be dealt with.
Criteria for evaluating the overall "story," "message, or "sense" of a
diagram or model will be addressed in terms of accessing complexity.
At least five types of semantics should be evaluated. There area
1. COMPLETENESS
2. CONCISENESS
3. CONSISTENCY
, 4. CORRECTNESS
5, COMPLEXITY/UNDERSTANDABILITY
Each of these criteria is considered separately in the summarl
sections that follow.
11[I
110 JS ....- _ , , -.!! .::':, ,, , '.( '''".... '...... .... .............

Completeness
One useful measure for evaluating the adequacy of information-
coverage is amplification. This refers to the degree to which additional
details are introduced in a child diagram, relative to its parent. Ideally,
there should be sufficient detailing introduced to make the parent more
comprehensive in information content -- but not so much detail that theoverall model becomes complex and harder to understand. Also, there
should be a balance between the degree of detail conveyed by the
function-box labels, and that expressed by data arrow labels. A diagramwith very general ana abstractly-labelled function boxes, but with
minutely detailed labels on the data arrows is unbalanced semanticallyl
the amplification factor might also be low on successive child diagrams
because there would be limited room to do further detailing on data arrow
labels.
Definitions and Measures
DEFINITION SUFFICIENCY OF INFORMATION CONTENT TO COVERSUBJSCT MATTER (CONTEXT)
MEASURES DIAGRAM LEVEL: FOR ANY DIAGRAM, EXCEPT THE "AND
PARAMETERS TOPMOST - DEGREE OF ADEQUATE COVERAGE OFINFORMATION WITH RESPECT TO THE BOUNDED CONTEXT
ON THE PARENT.
111
, .., . .;•..l,' ' . %..',•ii•TJ•!• •,,, ,,•,'', • :- :,.. ";• i• •'; ;,.":'.•. : : ""'•,••:"' .•-'_......
~~~~~~~~~~,~ ... . . , .. it. . . . . i

F
00 (PARENT)
'0
DIAGRAM BEING ANALYZEDL OR CONSTRUCTED
WHOLE MODEL LEVELI
DEGREE OF DECOMPOSITION OF BOXES.
(VARIES ACCORDING TO PURPOSE OF MODEL;
AMOUNT OF DETAILING NEEDED TO FULLY COMMUNICATE THE PURPOSE)
DEGREE OF DETAILING OF ARROWS FROM TOP TO LOWEST
LEVEL IN A MODEL
[VARIES WITH LEVEL OF DETAIL AND ABSTRACTION OF
FUNCTION BOXES]
Conciseness
The "information value" of labels and titles in IDEF 0 is ultimately
the potential relevance of the diagram content to the reader, For thisreason, authors should strive to select label names that are in common
use, especially if they are associated with technical processes or practicesin the manufacturing environment. The words used on diagrams and in
accompanying texts should also be natural, irl the way they relate to
the anticipated reader-audience, For example, an audience of accountants
would relate to labels such as "indirect labor," "direct labor," and"G&A overhead," but project managers may prefer terms such as
"billable labor," "internally funded research," and "support labor."
112
.7,S . . . . .. ... .. .. . .... . . . .. . ".• :';',•.. " ',; - , • :• . • : . .. . ; ' .:;• -'> • " l . ., i: • . • _ - ...:. .• . . : - ... ..5

"Degree of redundancy" is difficult to measure when simply reading
over a diagram or series of diagrams. If authors provide a glossary of
key terms, and provide sufficiently detailed listings of characteristics
or properties of technical terms, readers and reviewers would have a
more objective means for deciding when two labels are just two different
words for the same thing, or whether they really name different things.
IDEF0 labels are candidate IDEF 1 entity and attribute class names:
.if an entity class is used as an IDEF 0 arrow label, attributes of the entity
class can aid in determining the precise arrow contents, and can be usedto understand and compare arrows. Attribute liptings for entities named
in diagrams would be a useful addition to glossary formats. Given an
attribute listing, "vedundancy" could be assessed by the degree of
overlap between sets of attributes.
Definitions and Measures
DEFINITION PRECISION OF INFORMATION CONTAINED IN AND/OR_ CONVEYED BY A DIAGRAM OR MODEL; APPROPRIATENESS
OF TERMINOLOGY AND SYMBOLOGY. ABSENCE OF
INFORMATION PERIPHERAL TO MODEL'S ORIENTATION.
MEASURES • INFORMATION VALUE OF LABELS, TITLES, AND
AND FUNCTION NAMESPARAMETER
DEGREE OF REDUNDANCIES IN LABEL NAMES
* NATURALNESS OF TERMINOLOGY: TO FIT --
e SUBJECT MATTER
• AUDIENCE
113
. ,.m,', OI~~~~ M"
• iOMEN

Consistency
The syntactic checks discussed earlier would serve to verify the
graphic notations that help convey consisten•y in labellng and trace-
ability of data arrows throughout the hierarchy of a model, The degree
that the content of the model is consistent is more a matter of judgement
on the part of reviewers and experts in the subfect matter being modelled,
Consistency of naming, however, in the case of function box andarrow designations, might be facilitated if attributii listings were provided
as part of glossaries with a diagram or model.
Definitions and Measures
DEFINITION INTERNAL: DEGREE OF UNIFORMITY OF NOTATION
SYMBOLOGY, AND TERMINOLOGY
(WITHIN THE MODEL) '
0 EXTERNAL: DEGREE THAT CONTENT IS TRACEABLE
TO THE SYSTEM BEING MODELED.
(OUTSIDE THE DIAGRAM OR MODEL)
MEASURES 0 CORRECTNESS OF ICOM LABELS: PLACEMENT ANDANDPARAMETERS TRACEABILITY THROUGH THE HIERARCHY
CORRECTNESS OF TUNNEL C ] USE
114
" '' ... '.,' •: " • ,•,.. '€'..;. ;.•,,; .. ..... . - - . •'•;:' .:'••'_ " "' , " ' ;_ _', ... .... . .. . _ _ .__ __ -_ , .. .. 3

Correctness
"Co'rectness" is perhaps the most subjective of the semantic
characteristics presented in this section, chiefly because the final
standard for assessment must come from the opinion of individuals who
have the most complete knowledge of the subject matter being mode7led,
The kit cycle in IDEF 0 has been designed to assist the construction
of models that can be judged "correct" on the basis of peer-review, as
well as by evaluation by technical experts.
DefinItions and Measures
: DEFINITION EXTENT TO WHICH INFORMATION EXPRESSED IN A
DIAGRAM OR MODEL IS AN ACCURATE DESCRIPTION
OF THE SYSTEM BEING MODELED.
0 DEGREE TO WHICH IMPLIED CONSTRAINT RELATIONS
AND DATA-TO-FUNCTION INTERFACES REPRESENT
VALID RELATIONS.
MEASURES a REVIEW OF MODEL BY EXPERTSAND
PARAMETERS • CHECKS IN COMPANY LITERATURE OR TEXTBOOK
SOURCES FOR TERMINOLOGY AND TECHNICAL
USAGE.
115
• ;.'' ._,,_._,, ,.___"-" ___________'"_- "____-. " "'___"__._,_W

Complexity/Unde rstandablilty
"Understandability" is an important but difficult criteria to
measure in assessing model quality, mainly because of its abstract and
subjective connotations, Another source of the problems associated with
measuring "understandability" is the strong interrelationship of syntactic
and semantic factors. Since we are defining "understandability" as afunction of how well the content of the model is portrayed via the syntax,
the relevant measures would be derived from both syntax and semantics,
No single feature of semantics would therefore appear to be a sufficient
index of how well an evaluator could understand a complete model.
Measuring "complexity," however, is a more feasible task. We are
suggesting that "understandability" and "complexity" be viewed as dual
measures - i~e., something that is highly complex can be expected to
be hard to understand; and similarly, something that has a low complexity
value is probably much more accessible to a user and more easily under-
stood.
Definitions and Measures
F~INITION e EXTENT TO WHICH PURPOSE OF MODEL OR DIAGRAM IS
CLEAR TO THE EVALUATOR.
DECREE TO WHICH "WHAT THE MODEL/DIAGRAM SAYS"
IS ACCURATELY DEPICTED VIA THE SYNTAX.
MEASURESl * EASE OF FINDING THE "MAIN PATH;"I ANDP METERS NUMBER OF ACTIVATIONS/BOX;
* NUMBER OF POTENTIAL SCENARIOS.
* FACILITY OF IDENTIFYING ACTIVATIONS AND SCENARIOS;
* EASE AND SUCCESS OF "REFINING THE LAYOUT;"
* COUPLING AND COHESION RATING SCHEME
116
iV;

Another measure that would be useful to IDEF authors and0
commenters is ease with which the layout on a diagram can be refined.
"Refining the layout" is defined here as the procedures that are necessary
to disambiguate the message of a diagram or model, as it is conveyed by
the pattern of the function box and data-arrow interfaces. As a model
becomes more and more complex, and thereby less and less understandable,the task of refining the layout becomes more complicated. Rules for
refining the layout of a diagram to reduce its complexity are presented
as follows:
0 Boundary arrows with more than one ICOM code mustbe split so that each ICOM has its own arrow.
Cl C3 C4
Cl ,C3,C4
4
Figure 6-2. Arrows with more than one ICOM code
II- I
I}.. 1117
•73
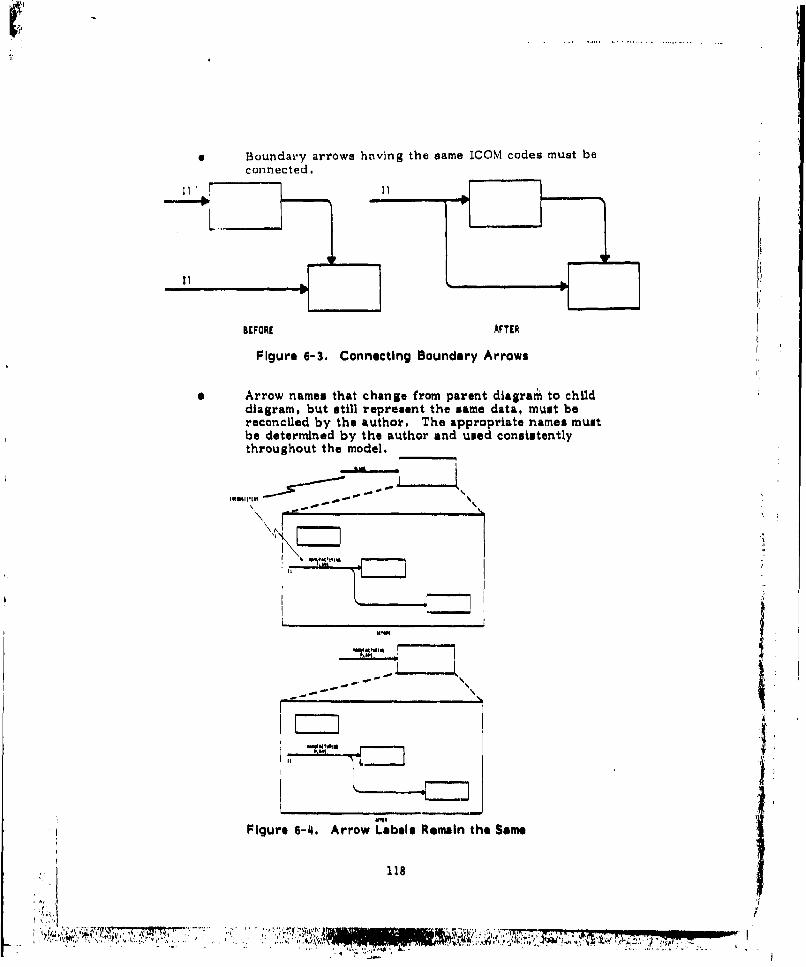
* Boundary arrows hnving the same ICOM codes must be
connected.
BEFORE AFTER
Figure 6-3. Connecting Boundary Arrows
* Arrow names that change from parent diagram to child
diagram, but still represent the same data, must be
reconciled by the author. The appropriate names must
be determined by the author and used consistentlythroughout the model.
Ss
777
S.",
"- -
Figure 6-4. Arrow Labels Remain the Same
118
S~~~~~~~~~~~~. . . .. . .. .. . . .. . ....*,• - . . . .. . . . . .. .. ,,• ...* : . :...

* Arrow names that are the same but are intended to havedifferent meanings must be assigned unique names byauthor.
ONDUE
Figure 6-5. Arrow Lebels Defined
119
"'4
#5~¶'

When dealing with arrows that split and join, anyunnamed line segments must be explicitly named byauthor.
' The name of this segment can bededuced to be "products," so thatthe explicit naming of the arrowis not necessary, u thes thedecomposition of box I shows
:: 70the arrow to have a name j
different from "products,
The name of this segmentcaneot be easily deduced withoutunderstanding of the model (it
A could be A, or D, or part ofboth). The name must bespecified by the author,
Figure 6-6. Label Arrow Splits
120
~ tg j' <i~ __________________________________

6.6. 3 Relationship Between Coupling and Cohesion
C 2 upLing describes the degree of Interconnectudness among
components. For [DEFO, one could describe the number and types of
connections between and among function boxes on a single diagram as
interconnections among components, Cohesion describes the degree of
relatedness of subparts within a given part. For IDEF 0 , "cohesion"
would therefore be a meaningful property to use in evaluating the
manner in which functions are grouped together in a single diagram.
The relevancy of these measures to assessing complexity Is as
follows I
"When components of a diagram or model are highly coupiodto each other, the model Is more complex. When compornontsare composed of unrelated (Incohesive) elements, the modelIs more complex."
Thus, IDEF0 diagrams should become more understandable if their
components are loosely coupled, but fall into functionally relatable and
cohosive patterns.
6. 6. 4 Metrics Based on Coupling and Cohesion
The understandability of a model increases and complexity
decruases as cohesion increases and coupling decreases. It follows
that metrica based on types of coupling and cohesion will be useful
for assessing the understandability/complexity of IDEF0 models. Having
a scale or code to identify different types of coupling and cohesion will
also provide model authors with a tool that they can use Li constructing
models which are more understandable and less complex.
6.6.4., Relation to Other Systems Engineering Properties
There are several additional advantages that can be gained by
establishing a metric to assess the types of coupling and cohesion in
IDEF models. In particular, it will be easier to transition an `AS IS"
system description to a "TO BE" status if coupling is reduced, thereby
121

.4.=
S .... .. V , , .
restricting the number of module connections so that as few modules as
possible depend directly on the same assumptions.*
The systems engineering principle of hiding describes the same
situation: informntion known only to a given set of modules is said to be
hidden (or isolated) from other modules. The advantage of information
hiding, like reduced coupling, is to facilitate local changes in a model or
a system design, without having to change an many modules or components
as might otherwise be necessary, There is, then, a direct relationship
between hiding and coupling, and an assessment of the degree of coupling
within a particular model will provide information about the extent of
information hiding as well,
Just as hiding appears to be isomorphic to coupling, localization
is isomorphic to cohesion. Localization is a principle describing the value
of bringing elements together in physical proximity -- the benefit of
this principle is to minimize redundancies that might otherwise occur if
the same information has to be stated over again in many scattered sites,
For example, consider the potential value of identifying generic manu-
facturing subsystems from the ICAM "AS IS" Architecture (Function
Model of Manufacturing). Localizing those functions relating to manu-
facturing control and materials management in a separate function model,
for instance, will facilitate a transition to a "TO BE" environment because
the relevant functions and data have been put into functional and
physical proximity, and can therefore be viewed as a separate, but
integral unit, When changes in the environment are anticipated, it would
be considerably more difficult to have to trace all possible side effects on
functions that are dispersed throughout the Architecture.
*Where "module connections" can be interpreted as the function/data interfaces on an IDEF 0 diagram.
l z. ...
x'r"'['24.!..........-r .~.'' .l.':,'4 ..* .- , n n , :.., ,.l0

6.6.14.2 Measures and Types of Coupllng
For purposes of this discussion, differences in types of coupling
will be illustrated by examining connections between functions in IDEF0.
6.68.4.2, I Vlewpolnt of the Descriptlon
Traditionally in the systems engineering literature, the coupling
between functions can be analyzed from two points of viewt the first
considers the nature of the data in the connection, and the second
identifies the relations among many tokens or examples of data in a
connection.
Figure 6-7 below displays this dual viewpoint analysis. The terms
used under each category are those found in the literature, and their
technical meening will be treated fn the following pages.
Nature of Connection Structure of the Connection
LooselyNormal Coupled Abstract
Co I AtControl Better Worse Record
Pathological TightlyEnvironmental
Coupled
Figure G-7. Analysis of Coupling Between Functions
6.6.4.2.2 Nature of Connections
Pathological: The Least Desirable
Two functions are said to be "pathologically coupled" if one
function references the contents of the other. This situation occurs when
the hiding principle has failed to apply, As an example, consider Figure 6-8.
123
4 , !
.. ,. "" r ,•" ,•,,:, .. ,. . - .. '.':/ " , ,..: ; . , . V"•. ''' '"'. ,'

TakeInventory
1 Remove
'.. WarehouseStock
2
Figure 6-8. Pathological Coupling
A data arrow going between boxes 1 and 2 is "pathological" and the boxes
are "content-coupled" by this definition, Clearly, the effect of box 2
removes the required materials that the activity in box 1 needs to operate
with, and connections of this type are usually not desirable, unless other
factors supply qualifications.
Control
Two functions are "control coupled" if data from one influences the
flow of control of the other, Flow-of-control is to be distinguished from
a control-arrow on 4 box, "Control" in this context refers to the kind
of data, not its position on a box, Control coupling occurs when a
function generates a controlling effect on another function's behavior.
This kind of coupling can be spotted by noting functlon-names that
produce "flags" along with an intended functions, such as "Record failure/
print error message."
Normal
Two functions aro "normally" coupled if the data connections
betw•en them exist independently of the contents of either function, or if
there is no influence on the flow-of-control from one function to the
other. This typct of coupling is the most desirable kind of connection,
since communication between functions is via explicitly-shown data, and
not via implicit references to the contents of one or the uther functions.
124
.- MAr

6. 6.4. 2.3 Structure of the Connection
Environmental
Two functions are environmentally coupled if they both reference
a generic data source, without cOearly specifying the relation of a
particular piece of data to any box. This situal ion can be represented by
the diagrams in Figure 6-9.
Company
FIgure 6-9. Environmental Couplihg
Problem's resulting f r m environmental coupling include the following:
1) The hidin?. principle is violated. Access is n'.trestricter4 to only th'.. nec;essary data.
2) Localization is violated, Data is not a-:-ociatedonly with its u.ers.
3) Error p'ro-,:,gation ju il',.'.eased, potentiaily.Changes to the envir.-nment may affect all.functionr, unpr•:ti ctaly,
i'34- ~~~. ..........-. • . . ,
*f:. .. ,•:,, ,•"" . j
. o _ . .. • :" ... .. . .. . .. . * - + = f l " " -k

Record
Two oe more functions are record-coupled if they reference a non-
global set of data, and do not necessarily depend on having all possible
interfaces displayed, as In environmental coupling. An IDEF 0 example
appears in Figure 6-10.
PersonnelS5etandards
Figure 6-10. Recor:' Coupling
The type of interface pattern shown here is preferied because the rala-tion of a particular data element to each box~ has been specified.
Abstract
Two elem'into have abstract coupling if the relation betweer~ aperticular element and itw potential "constituents" has been clearlyspecified. In IDEFO) a data arrow on a parent diagram that gets broken
dowr into detail components on chiIJ diagram~s represents an abstractcoupling relation. Hidingj in in effect, Insofar as the parant-level arrowit; "using the power of abstraction" to provide 4tcceus to the level ofabstraction required for more complete understanding of the data content&.
The notion of "arrow pipelines" in MDE%, corresponds to this use of abstractcoupling, and should bze maximized when constructing diagrams.
1 26

*1.
6.6. 5 Measures and Types of Cohesion
Whereas "coupling" refers to the connections between elements
(functionq or data), "cohesion" will be used to reference the binding or
internal-relatedness between factors on a diagram.
At least seven types of binding have been distinguished in the
literature.
Relatlve Value Worse
0 Coincidental
I Logical
2 Temporal
3 Procedural
4 Con municatlonal
5 Sequential
6 Functional Better
Each type will be identified briefly, and illustrated by way of a
sketch of a typical example in ID4FO.
UO CoIncidental: Least Desirable
Coincidental cohesion occurs when there is little or no constructive
r,ýlationship among the ,ilements of a module. This situation obtains
when the d.ta names on IDEF 0 arrows In a single diagram bear little
relation to each other. The extreme version of this case is shown in
Figure 6-11.
B
A C
I $.: 11i 7D F
2Figure 6-11. Coincidental BIrnding
127
, 41 II i , 'f - , ___nn________i__I______'_I___i___ii I •!'l l Ii• IPIR

(1) Logical
Logical binding occurs when the data arnd functions seem to have
been gathered bye'ause they fit finto a common class or set of elements -
but no rincessary ,functional relation can usually be identified.
Figure 6 12 illustratea the typical cause of logical binding.
Manuscripts Junl
Editt
Edited MaterialJIComicBooks
Figure 6-12, Logical Binding
(2) Temporal
Temporally bound elements appear to be clustered because they
represent functions associated In time -- data. are used simultaneously,
or functions are performed In parallel, rather than in series, A frequent
example can be found in diagrams showing functions all concerned with
"initialize" operations, as pictured in Figure 6-13.
StartI
L J StartUp~ U X r
UpU Z'
Figure 6-13. Temporal Binding
128
7kI

(3) Procedural
Procedurally-bound elements appear grouped together because they
are executed or performed during the same part of a cycle or process.
The common unit of process may be an iteration or decision-branch, or a
linear ordering of steps. An example of a procedurally-bound diagram
is given in Figure 6-14.
Fiue- PCoordlinat• A and B
Figure 6-14. Procedural Binding
are necessary before soame function downstream can proceed. Note that
boxes 1 and 2 have no other influence on each other, and they are
thereby bound by their relation to the process In box 3 i
) o uctoa Communicational
Diagrams exhibit communicational binding when boxes have been
grouped because they uwe the same input data and/or produce the same
output data. This Is the first type of binding discussed thusfar whichrepresents the preferred level of binding for IDEFO. One important
reason Is that none of the levels of cohesion discussed above in very
closely tied to the structure of a particular problem. Communicational
cohnesion is the lowest level at which we encounter a relationship among
processing elements which In intrinsically problem- depen dent.
Figure 6-15 illustrates the typical came.
129
' 4

AB
LA C
t2
Figure 6-15. Communicational Binding
(5) Sequential
Diagram@ having sequential binding have output from one functionserving as input data for the next function. The relationship amongelements on a diagram is more interrelated than at previously-mentionedbinding levels, insofar as cause- an d-effect transforms of data are beingapproximated. Hence, the high rating. Figure 6-16 illustrates sequentialbinding.
Figure 6-16. Sequential Binding
130
~__7* *.d"'t

P
(6) Functional
A diagram exhibits complete functional binding when all elements
of a function contribute to the performance of a single function or result.
A diagram that is purely functional contains no extraneous elementsrelated by sequential or weaker-valued types of binding. One way to
identify functionally-bound diagrams is to look for two boxes linked via
control arrows, as illustrated in Figure 6-17,
Figure 6-17. Functionsi Binding
II
In mathematical terms, the requirement for the simplest type of
functional binding, shown in Figure 6-17, is as followet
C - g(b) - g(f(A))
Other useful checks for functional binding include clues-by-
elimination, The guidelines that follow are meant as aids to help authors
and reviewers distinguish functional from non-functional binding.
0 If the only reasonable way of describing a diagramis by using a compound sentence, or a sentencecontaining a comma, or a sentence containing morethan one verb, then the diagram is probably lessthan functional, It is probably sequential,communicational, or logical in terms of cohesiveness.
131
,. •-,.. .. , ... '• • •; •.

0 If the descriptive sentence contains such time-oriented words as "first," "next," "after,""then, " "start, " "step, " "when, "r "untiU, " or"for all," then the diagram probably hastemporal or proceriural cohesion, sometimes,but le-s often,7suich words are indicative ofseuential cohesion, i
S rTf the predicate of the descriptive sentence does notcontain a single specific object following the verb,the diagram is probably logically cohesive.
Summary
Figure 6-18 contains a summary of the types of binding treated
In the previous qo-ctions, The important point to note is that levels 4-6
constitute the types of binding that IDEF0 developers consider critical
for having "quality" diagrams. Authors should strive to maximise the
presence of these binding-types.
6,6.6 Assessing Coupling and Cohesion In IDRF
The rating scales presented here were originally developed to
iassist systems engineers in selecting among design alternatives, and toclarify the relative desirability of alternate decompositions. The use ofsimilar scales is being proposed for IDEF0 as an aid to authors and
comnenters for ensuring the quality of models.
A few additional observations are in order, in the light of theseObjectives :
0 With relevance to IDEF , "coupling" and "binding"are really versions of the same concept, but differbecause they apply to distinct components of models,"Coupling" can be used to compare the complexityof connections between diagrams, or between boxeson a parent diagram."Binding" can be used to assess the strength ofthe links among different boxes within a diagram,or to measure the cohesiveness othe parent boxof a diagram,
132

b . . ..... .
I . l i.
U. • , !
II
I II
aI an

0 Immediate clues for identifying undesirable connectionscan be found by noticing tight coupling on a parentdiagram. This usually indicates low-valued binding(incohesion) on child diagrams. An author canimprove the quality of the model -- and make the setof parentichild diagrams more understandable byre-decomposing the parent to eliminate the complexcouplin g.
* Rating values for coupling and binding are additive.Many connections meet the definitions for more thanone category of the rating scale, and can accumulatemultiple values, For example, if a diagram is both"sequentially" and "communicationally" bound, it isbetter in bli.ding quality than being strictly communica-tional. But .f a connection is both "control" and"record" - coupled, it is worse (and more tightlycoupled) than being simply -control or record - coupledalone.
134......_ _ __,_,_
v W

SECTION 7
DATA COLLECTION FORIDEF MODELING
CONTROL
INPUT FUNCTION 0OUTPUT
T-MECHANISM
135
WI71

DATA COLLECTION FORIDEF MODELING
7. 1 Introduction
When analyzing or designing any system, it may be necessary to
obtain or verify facts about the system or subject matter at hand. There
are many sources of factual information. One might:
0 read existing documents, using each table ofcontents and index to locate needed information,
F * observe the system in operation, if it alreadyexists.
0 survey a large group of people, through question-naires or other such means.
* talk to one or more "'experts" who possess thedesired knowledge.
* use whatever i. already known by the author.
a guess or invent a hypothetical description, andask readero to help bring it closer to reality.
"Of all these methods, the most important is face-to-face interaction with
an vxpert, Seldom will all existing information be written. Preconceived
notions that are reflected in questionnaires are often faulty,
Obtaining information from an expert has been formalized in an
Interview process. This step by step process allows an interview to
"be conductiod without unduly influencing the expert with information
;diready obtainiecd by the interviewers.
A key part of interviewing is to record the information obtained,
IThiis can be done Aithur as informal notes, as activity and data lists, as
;i formal matrix of functions, or as diag•am sket ches,
137 Mal
INN
,F7

7.2 The Interview Process
The purpose of an intvrview is to gather information from an
individual who possesses an expertise considered important to the
analytical effort. There are four types of interviews that might be
conducted during the course of performing the analysis phase of an
IDEF project.
Four Types of Interviews
a) Fact finding for understanding current operation•.This type of interview is used to establish thecontent of a Current Operations Model, or to helpunderstand the existing environment.
b) Problem Identification to assist in the istablishmentof future requirementi. This type of interview isused to validate the Current Operationo Model andto provide the foundition for a Future OperationsModel,
c) Solution Discussion regardinu future system capa-bilities. This type of interview is used to establishthe content of a Future Operations Model.
d) IDEF Author/Commenter Talk Session. This typeof interview Is used to resolve problems which havesurfaced during the construction of an IDEF model,
The reason for identifying types of interviews is that during the
course of performing an actual interview, ingredients of each type appear.
The respondent might tell the interviewer facts about a given system in
terms of problems. Also, the respondent might identify problems in terms
of solutions to the problems. The interviewer, by constantly c lassifying
the respondants remarks, can obtabi the maximum useful information from
the interview,
138
*. .~ ',- .• '¢,, '.'•; .. , ., ,,N.! '=i:,.t;' .-• "., • t ' ! • ,,:,• :• . •., '•; ,,~, : ..""'-",1• I• •"", • "• 1 .. ,'•• -• .• •,,".. . ',•,,' ,. "'-'..'•, , . .. .. q:. .: -."

7.3 The Interview Kit
It is recommended that a "standard" Interview Kit be used for
recording the interview. It may be stored in an Interview File and it
may be distributed to appropriate individuals. This distribution might
include other members on the Analysis team or even the interview
respondent for corrections, additions, and deletions. The interview kit
would contain :
I, Cover Page (Kit cover),
2. Interview and Record Follow-up
a. Interviewer Name .(IDEF A.uthor Name)
b, Interview Date (IDEF Diagram Date)
c) Interview Duration (Start time, End time)
d) Respondent Name
e) Respondent Title and Organizational Responsibility
f) Respondent Telephone Number and Extensiomi
g+) Additional Sources of Information Identified
1) Documents - Title and Location
2) Other Interviewees - Name, Title,Organizational Responsibility,Address, Telephone number
h) Essential Elements of Infornmtion - A Summaryof the key points covered in the interview.
1) Follow-up questions and/or areas of concerneither not covered during the interview, orpostponed
j) New Terms for Project Glossary
3. Activity and Data List
4 4. Interview Agenda (Doveloped in preparation ofInterview - This is covered in following section)
5. Interviewý Notes and Rough Diagrams
139
I j.,~i Jl .

?.4 In~terview Guideline%
There are five stages to the successful interviewi each rntift be
performed in order to assure that the most infnrination is obtained arndý-corded in the least amount of timis.
* Preparation
* Initialization
* Interview
a Termination
0 Finalization
in each stage of an Interview there are certain basic activities which must
be performed. Additionally, associated %;ith each i~tage, there exist
psychological aids which will help the Interviewer establish an atmosphere
of profess ionaliim and trust with the respondent.
7.4.1 IrntervI~w reparaton
By thinkin-g through certain key Inter~view needs before the Inter-
view, a more organized and efficient dialogue ý:an be achieved. Prepara-
tion for an Interview should contain, but is not limited to, the following
actl~v.i ;es:
1. Select Interviewev
a) From areas of responsibility
b) From recommendations of others
C) From various levels of the organizalionalhierarchy - upper levels useful for "bigpicture."1 lower levals for detail Lnformation,and middle levels for bridging the gap
2. Make Appointment
a) Short duration -jto 1 hour
b) Not imm,-:diat~ely before lunch, nor late after'noon
C) Identify purpose of interview
di) Explain interviewer role
140
7 1 A-7T. A"

3. Establish Tentative Agenda
a) Topical areas - used as a foundation forinterview (this helps prepare "broadgeneral questions")
b) 7,pecific questions
4. Review applicable background information
5, Review appropriate terminology
6. Insure coordinatiun with othir interviews
Check interview file to ascertain that therespondent has or has not been previously
interviewed, If the interview is a follow-upinterview, then examine the results ofprevious irnterviews,
7, Fill out Interview Record ý,a.-_i Follow-up with pertinentinformation ,I'
8. Make out Interview Agenda
7. 4.2 Interview Initialization
This sta go of the inturview is directed at establishing a rapport
between the interviewer and respondent. The courtesy permitted by the
respondent at the start of an interview is usually short. This time is
important in motivating the respondent to help the interviewur. Thisstage of the interview should contain the followingl topics:
1, Provide respondent with a tangible means of introduction,e.g., a business card (this removes doubt on the part ofthe respondent as to how to pronor,,ce or spell thein'erviewer's name and can therefore remove a trequentcause of respondent embarrassment)
2, flstablish purpose of Interview
a) Expand on information provided in initial contact
b) Establish point of view for the interview. UseIntervkiw type 1, 2, 3 or 4 as a bais,i
c) Establish purpose of the interview - even if theinterviuw is a follow-up interview.
141
TIP~" 7.I'-"'o, 73

3. Establish the acceptability of fote taking. The respondentmay require assurance of confidentiality.
4. Esiablish the Expert/Author relationship - allevlatethe fear that the interview will be used to tell the,respondeht how' to do his job,- oz' that therespondent's job is, in Jeopardy.
5. stin with broad general quoutions which will get therespondert talkii•' .tb~ae should be baied upon the *1'topical arqpqs identified in the agenda.
6. 'Asseiss the reepondenItl ability to provide pertino'ntinformation - ifthe infoimation is too Veneral o0 'tdo' detailed fortho stage of the IDEF medol beong preparedevaluate respondent's abIlity to cozitribu.te., Terfainatethe interview if necess•ry - it may be 'a Watte of both,the initrviewer's and reipoh'dena's time.
7. Begin to formulate 6petific qUsstionsiWhich complementthe~ageruda.F
8. %.'ite, dOn't talk. I .
7.4.3 Conductlng the 1nterview . -
While it is not useful :to define questions to ask during an inter vi•w,
it in possible to identify guidelines that should be considered during the
interview. The first set of guidelinba deals with the qualification of the
information being obtained. The second set of, guidelines rlelate to the
4 stimulatioi, of information flow.
"Information Qualification: The human mind can comprehend at
double the rate at which people speak. The danger in interviewing is
that this rite difference is typically usod by the listener to think about
what should bo said in response instead of about what is being said.
1o assist the interviewer in thinking about what is being said,
there is a series of questions which may bo used to help the interviewer
keep his mind on the information being provided:
main points being discussed?
* How recent is the information?
142
'.1;gill,, •,•. • ,. .• • • . .. ,' ' ' : •\. ,,• •• ,• • • g • T i l! I • ] ; :% • ,• • ,• "-• .,.:• .•, ,• .: •.,,•, ,",,•, :• ''. ,'• , .,;,7 ,.:. .

How complete is the formation?
Do I really understand what is being said?
0 la the level of detail being presented appropriatefor my purpose?
0 Are there areas being omitted?
Has this information been discussed with someone else?
* How important is this information?
0 Are side-topics being discussed?
* Hias the interview viewpoint changed?
Information Flow Stimulr.tiont The following set of guidelines can
be Lived to stimulate the respundent into providing maximum reliable
information iSe Ke *p extraneous comments and conversations to aminimum, The interview is used to obtain informa-
tion, not make friends, or sell ideas.
* Be aware of the respondent's failure to identify problemareas in the environment. This may indicate that therespondent is not at ease with the interviewer.
' Provide the respondent time to think. Do not suggestanswers -or ask another question. A pause in the inter-view is useful to allow the respondent to recall vitalpieces of information,
0 Avoid outside distractions which tend to "uncouple"the train of thought. If at all possible, conduct inter-views outside of the respondent's normal habitat.
0 Be aware of internal distractions, signs that therespondent is not comfort&%ble or at ease with theinterview.
X 0 Try to determine if the information being obtained isfact or opinion.
0 Encourage elaboration by asking for a rephrasing ora summary of the information presented.
N• 143
1~
*77.' AXMy, MT17

* Ascertain the respondent t s background and associationwith the subject matter being discussed. Valuable insightinto the respondent's remarks can be obtained knowinghis relationship to the organization and existing systems.
I Do not enter into or encourage sarcasm and humor.
0 Do not mention or discuss any interview with anotherperson,
0 Record all questions asked by the respondent. Theinterviewer should answer all questions except thosedealing with user-organization management, plans, orpersonalities.
4 Show interest in what the respondent is saying.
* Concentrate on the unfamiliar and difficult aspects ofthe subject being discussed. Avoid the obvious.
a Be alert for the inconsistent or incorrect use of words,Ask for definitions for any unfamiliar or questionableterm. Record the definition for the project glossary,
0 Do not contradict the respondent even if facts do notsupport what is being said. Use the Kit Cycle to resolvesuch conflicts.
0 Be humble. The respondent is the expert, not theinterviewer.
a Postpone subjects which cannot be fully covered withinthe agreed upon time frame. Do not extend the interviewtime, but rather make another appointment.
* Appreciate different opinions on the same subject. UseIDEF to show these opinions and to resolve conflicts.
9 Stimulate the respondent with pertinent open endedquestions.
7,4.4 Terminstlon
The interview should be terminated for any of the four following
reasonsi
a) The information being obtained in the interview is notappropriate.
b) The time limit has been reached,
144

C) The interviewer has been saturated with information.
d) There is a clash of personalities between the interviewerand the respondent.
Depending upon the cause of termination, the following topics
should be considered during the termination of the interviews
* The interview should not be closed abruptly, but rathershould end with a few minutes of informal discussion,
The main points of the interview should be summarized.
Areas of concern which have been postponed or notcovered should be identified.
* A follow-up interview, if necessary, should be arranged.
The respondent should be asked to recommend otherpersons who should be interviewed.
* If the interview notes are to be reviewed by therespondent prior to distribution, this fact should bementioned during the termination.
* The respnndent should be thanked for his time and effort,
7,.45 Finalization IThis stage of the interview is directed at assuring that the infor-
mation obtained during the interview is properly recorded and disseminated
to the project team. The vehicle used to accomplish the finalization ofan interview is the Interview Kit. If note taking was not permitted by therespondent, thc interviewer should, upon termination of the interview,
immediately write down the saliunt points discussed. Finalization of the
interview includes the following:
a) Identify additional sources of information,
b) Summarize the Essential Elements of Information.
c) Identify new terms for the project glossary.
* d) List the follow-up questions and areas of concerneither postponud or not covered during the interview,
145
41' 1sw.'"'-"•' • '• , '' 4A!•,,l• W.gi:l' '. '._'-..,_..__"____,____,__,__________:,__.______:__',,!''• •=" , •,

e) Complete Activity and Data List.
f) Expand on a~ny notes with any Information recalledduring the review.
g) Prepare rough IDEF diagrams that reflect the informationobtained.
h) Identify any assumptions being madeor any items which are not clear.
i) Publish and distribute the Interview Kit.
j) Address the names. areas of expertise, phonenumbers. and addresses of persons mentionedin the interview.
146
,~.* 7,-
.....

SECTION 8
IDEF 0 GLOSSARY
CONTROL
INPUT FUNCTION OUTPUT
TMECHANISM
147
. •,• .',, ,..::-"•-, ,r " • ,-..... :s ,:'• • •_! .. 7....7"... . ' . . ...- .. ...-7 7!. . ..

Arrow A line representing data, its source (no point) and
its use (point on the end of the line).
Author The person who prepares any IDEF model.
Box A rectangle, containing a name and number, used torepresent an activity.
Branch A fork or a join.
C-Number A chronological number used near the lower righthand corner of an IDEF diagram form to: uniquelyidentify the diagraml trace the historý and filingof an author's diagrams. C-numbers may be usedas Detail Reference Expressions,
Call A pointer (outward pointer on the bottom of a box)used to show that the box is detailed by thedecomposition of another box.
Commenter A person who has enough training in an IDEFtechnique to offer structured comments using thenote numbering system and (often) referring toflaws in the application of the technique itself.
Context rhe immediate envieonment in which a model is tooperatel the limits of the model, In IDEF 0 thearrows around any box. but particularly the boxon an A-O diagram. Also, the small box on theIDEF form in which the parent diagram and box areidentified.
Control The class of arrows absociated with the top of anIDEF 0 box. Provides guidance to the transformation.
Data Anything namable by a noun phrase such as things,conditions or information. Usually refers to a class(such as person) but may mean a single instance("John Jonse") ,
Detail Reference The C-number or node number written beneathExpression an IDWLF box to show that it is detailed and where.
Draft An approval level for an IDEF diagram form above"working" and below "recommended."
4
149b
"Y:' .. . •4

Expert A person familiar with a part of the real worldsyntem being modeled. May serve as a source ofinformation or as a reviewer of part of the model.
FEO A diagram "For Exposition Only" in which violationof normal syntactic rules is allowed.
Fork The point at which an IDEF0 arrow (going fromsource to use) divides into two or more arrows.
Function An activity described by a verb phrase thatidentifies what must be accomplished.
Glossary A required section of an IDEF model which definesthe way in which words or phrases are used.
ICOM A single use of the ICOM code system. Theacronym of Input, Control, Output, Mechanism,The arrows -no labe•,-d.
IDEF Role A position in an IDEF project, See author, expert,commenter, reader, librarian.
Input The arrow class associated with the left hand sideof an IDEF 0 box. Usually becomes part of theoutput.
Join The point at which an IDEF arrow (going fromsource to use) joins with onA or more other arrowsto form a single arrow,
Kit The standardized packages of diagrams whichcontain portions of, or complete to date, modelsto be reviewed. See kit cycle.
Kit Cycle A formal procedure for obtaining peer or expertreview during model development.
Label The name associated with an IDEF0 arrow.
Librarian The person responsible fort
"e routing and trmcking of kits"e project ffles
Mechanism The arrow class associated with the bottoms ofIDEF 0 boxes.
1ý1*1 MAO
I !* l

Model A representation of a system which can be used to
answer questions about the system.
Modeler An alternate term for author,
Node A point at which subsidiary parts originate orcenter. The number associated with an IDEF boxor diagram. (Each activity may be shown on&eas a box and once as a diagram.)
Node List A listing, often indented, showing all nodes in anIDEF0 model in "outline" order,
Node Diagram A graphic representation of the relationshipbetween the nodes of an IDEFQ model.
Note A comment on an IDEF diagram to record a factoutside those normally treouted by the method ora comment by a reader or commenter about adiagram.
Output The class of arrows nasociated with the righthand side of the IDEF0 boxes. The result of an i VIDEF 0 transformation.
Parent The diagram on which the box appears which indetailed by the "offspring" diagram.
Project The organized task for which an IDEF model isprepared,
Project Manager The member of the project who has finalresponsibility for the finished. product.
Publication The highest approval level for an IDEF diagram.
Purpose A brief statement of thr use to be made of amodel to that the reason for its existence is clear.
Reader A person with no, or limited, training in an IDEFtechnique who sees part or all of the model, Areader will often comment, but his comments arenot expected to be structured. Individuals orgroups participating in a walkthrough of a diagramare normally grouped am "readers."
Recommended The next-to-hlghest approval level for an IDEFdiagram.
151

Technical Committee The group authorized to guide the developmiiw ofa model and, eventually, to approve U~s co'ttunts,
i't3Kt An overall verbal comment on an IDEF diagramappearing on a sepairate diagram formp
t"unnelled Arrow An IDEFQ0 arrow one end of which is not associatedwith qtn arrow on the parent or offspring diagram.
Vituwpoint An attempt to define the rubset of possible factswithin a context which will be portrayed. Oftenexpressed In terms of the persons whose perceptionsare portrayed.
Working The lowest aipproval level for an IDEF diagram.All IDEF diagrams tire initially classified "working.",
152

SECTION 9
IDEF INDEX OF TERMS
CONTROL
INPUT FUNCTION 0 OUTPUT
I.
MECHANISM
I
'153
'W-_!

IDEF INDEX OF TERMS
Sublect
Abstraction in Diagrams 14Activation of a Box 24Architecture
3Arrows, Boundary 26, 35
Arrows, Branching 35Arrows, Bundling
96Arrows, Call
28Arroww, Connecting Boxes 27Arrows, External
37Arrows, Incoming, Outgoing 22Arrows, Creating Interface 98Arrows, Internal 26Arrows, Joining 25Arrows, Labeling
25"Arrows, Layout
101Arrows, Mechanism
28Arrows, Pla'emient of 100Arrows, Split
120Arrows, Tunnelled
38Arrows, Unconnected (Boundary) 35Author
64Author Activities
Basic Steps of Diagram Creation 83Data Gathering Phase 88Structuring Phase 88Presentation Phase 89Interaction Phase 89
Author/Commenter Notes 66
1. "
An
.. ~ - J ~- -ki

INDEX (Continued)
§SujbjL4ct Page
Boundaries 3
Bounded Context 14
IGoxfArrow Relationship 2Box Numbering 21
aones, Generating Function 90
Boxes, Modifying 954Bra.i ~h 25
Bundling 96
Call or Downward-Pointing Mechanism A~rrw .28
Clusutering 91
Commenter * Comments 64
Commenting Guidelines 65
C-Number ?5Cohesion, Measures and Types of 127
Concepts 8
C:~ natraint(s) 54, 98
Context 14
Cintext, Firi' 74
Context, Modifying 911
i ntaxt, Purpoe an~d Viewpoint, Selecting 83Control(s) 22
Coupling a~nd Cohesion, Assessing 132
Coupling anid Cohesion, Relationship 121
Cover Sheet, How to Fill Out 68Cycle, IVEF Kit 62
156
7-7~fA ~~~* ;.

INDEX (Continued)
S.s1ub3 4e
D
Data Collection, Methods 137Data Defined
22Data Gathering Phase 88Data, Input and Output
22Decompose, Selecting a Box to 87Decomposition
19Decompositlon, Example of 41Diagram Creation
86.Diagram, Context
14Diagram Form, Standard How to Fill Out 70Diagram Parent
13Diagram Reading
49Diagrato Text
87Diagram Tree
33Drawing a Function Diagram, Steps 90
E
Experts 64
P.
Feedback or Iteration 25
FEO 87
File(s) 76
Format, Page-pair 49
Function Boxes, Generating 90
Function Defined 21
Function Diagrams, Definition of 11Function Simultaneous
25
157
INDEX (Continued)
Subject Ppag
Glossary 47
Graphic Layout 98 !
ii
Hierarchy 32
IICAM Architecture 3
ICAM Definition 3
ICOM Codes 37, 98
ICOM Codes, Multiple 56
ICOM Syntax for Connecting Diagrams 37 tIDEF Basic Concepts 8
IDEF Defined 3
IDEF Kits 67
IDEF Model Walk Through Procedure 77
Index, Nodes 42
Input 22
Interaction Phase 82
Interactive Review Process 15
Interface Arrows 11
Interface Arrows, Creating 92
Interview, Process 138
Iteration or Feedback 25
K
Kit Cover 69
Kit Cycle 62
Kits, Standard 68
Kits, Summary 68
155iilie
" d - .'
. . .. . . .... ...

INDEX (Continued)
Labelling Arrows 92Layout, Arrow 101
Librarian 64
M
Mechanism, Arrows 28Message Field 75Model Defined 11Model Namea 34
Model Quality Checklist 106
Modulu 14Modifying Boxes 95
N
Node Index 42
Node Index/Contents Sheet 71Node Numbers 32Node Tree 33
Notes, Author/Commenter 66
Notes Field 73Number Field 75
Numbering, Boxes 21
Order, Node Index 42
Output 22
159
'. r ... -L ... ', ,• ,.• ,,', ,"• ,. , . . • • .• • •,* '' '. , ••;",. ,, • 'r:- , • .- =.

INDEX (Continued)
SUbleCt PEms
P
Page-pair Format 49Parent Diagram 13Personnel Roles 61Presentation Phase 82Purpose iPurpose of Architecture 3
R
Reader 64Redrawing 96Reference Expresavions 32References and Notes 104jRedrawing Diagrams 95Review Process 1
Semantics 110Sequence 25Simultaneous Action 24Splittin g 91Standard Kit 70Status F iold 73Str~uctured Analysis and Design Technique 88Structuring Phase 8Submodule, Limiting 14Syntax 106System, Representation of 14System, Definition of 19
160

INDEX (Continued)
T
Talk 66Teamwork, Disciplined 15, 61Text 87Text Numbers 34Text Writing 103Time 35Tree, Diagram, Node 33Tunnelling 38v_
Version 0, 1, 2 Defined 3Viewpoint 15
W
Working File 76
161
*......
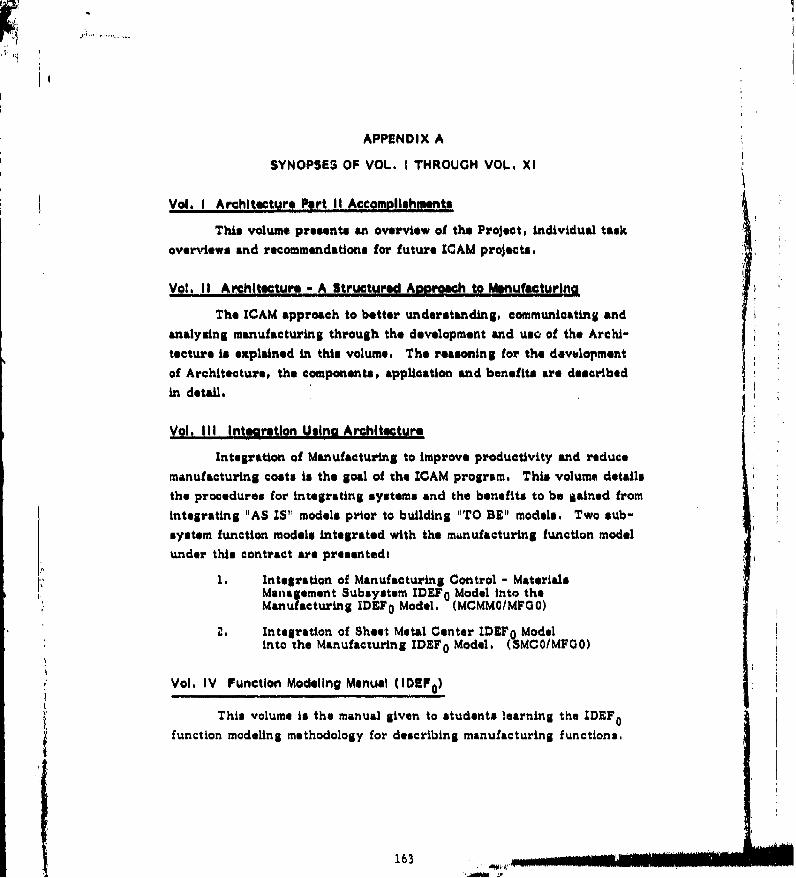
APPENDIX A
SYNOPSES OF VOL. I THROUGH VOL. XI
Vol. I Architecture Part II Accomplishments
This volume presents an overview of the Project, individual task
overviews and recommendations for future ICAM projects.
Vol. II Architecture - A StructMred Approh to M.nufecturlna
The ICAM approach to better understanding, communicating and
analysing manufacturing through the development and uso of the Archi-
tecture is explained in this volume. The reasoning for the devulopment
of Architecture, the components, application and benefits are described
in detail.
Vol. III Intaratlon Using Architecture
Integration of Manufacturing to improve productivity and reducemanufacturing costs is the goal of the ICAM program. This volume details
the procedures for integrating systems and the benefits to be gained from
integrating "AS IS" models prior to building "TO BE" models. Two sub-
system function models integrated with the m~nufacturing function modelunder this contract are presentedi
1. Integration of Manufacturing Control - MaterialsMan~agement Subsystem IDEF0 Model into theManufacturing IDEF 0 Model. (MCMM0/MFG0)
2.. Integration of Sheet Metal Center IDEF 0 Modelinto the Manufacturing IDEF 0 Model. (SMCO/MFOO)
Vol. IV Function Modeling Manuel (IDEF 0 )
This volume is the manual given to students learning the IDEF 0
function modeling methodology for describing manufacturing functions.
163

Vol. V Information Modeling Manuel (IDEF 1)
This volume is the manual given to students learning the IDEF 1
Information Modeling Methodology for describing manufacturing information,
Vol. VI Dynamics Modeling Manual (IDEF 2)
This volume It the manual given to students learning the IDEF 2
Dynamics Modeling Methodology for describing the time varying behavior
of functions and information.
Vol. VII Composite Functlo.i Model of "Man.fecture Product" (MF )F;
a "his volume presents the composite view depicting manufacturing
as It exists today in the form of an "AS I1" Function Model of Manufacturing.
Vol. Viii Composite Function Modl'.,q 1 "De$Ign Product' (DESICNO)
This volume presents the composite view depicting the design
proceas as it exists today in the form of an "AS IS" Function Mode!. of
Design.
VOL. IX Composite Information Model of "Manufacture Product" (MFG1)
This ',olume presonto the composite view depicting manufacturing
as it exists today in the form of an "AS IS" Information Model of Manu-
facturing. Because of its voluminous size, this model has been printed
in several parts to facilitate ease of handling.
Vol. IX, Part 1 MFG Development
This part explains the process of development thatthe MFG 1 model has undergone.
Vol, IX, Part 2 MFGI Model
The MFG i model diagrams and attribute classdefinitions comprise this part.
164
*-7 77777..

Vol. X Dynamics Model of a Sheet Metal Center Subsystem (SMC2)
Thin volume contains an IDEF 2 Dynamics Model of the sheet metal
center at Northrop Corporation's Mariposa facility. It demonstrates the
application of the IDEF2 Dynamics Modeling Methodology.
Vol. Xl ICAM Library Maintenance and Distribution Procedures
Contained in this volume are procedures developed to allow for
the proper dissemination of the material generated under the ICAM program.
They are the ICAM Program Library User's Guide and ICAM PFiogram
Library Maintenance Proceduris,
165

APPENDIX B
ARCHITECTURE PART Ii - FINAL REPORT
DOCUMENT REQUEST ORDER FORM
VOLUME I Architecture Part II Accomplishments
VOLUME II - Architecture - A Structured Approach to Manufacturing
VOLUME III - Integration Using Architecture
VOLUME IV - Function Modeling Manual (IDEF 0 )
VOLUME V - Information Modeling Manual (IDEF 1 )
VOLUME VI - Dynamics Modeling Manual (IDEF 2)
VOLUME VII - Composite Function Model of "Manufacture Product" (MFG0)
VOLUME VIII - Composite Function Model of "Deulgn Product" (DESIGNO)
VOLUME IX - Composite Information %.idel of "Manufacture Product" (MFG 1)
Part I - MFG1 Development
Part 2 - MFC1 Modal
VOLUME X - Dynamics Model of a Sheet Metal Center Subsystem (SMC2)
VOLUME XI - ICAM Library Maintenance and Distr•bution Procedures
Submit document requests to: ICAM Program LibraryAFWAL/MLTCWright-Patterson AFB, OH 45433
NAME
TITLE__________________ _
COMPANY_ _ _ _ ___DEPARTMENT
MAIL CODE ..... _-
STREET OR P.O. BOX
STATE, ZIP
PHONE # N.._________ _ __
167*U,S. yov*rnment printing Office' its1 -- 550-004/1044
Sl ii, ToTmm