unclassified gov/pgc/eth(2013)1 - oecd.org - oecd paper on public procurement... · unclassified...
TRANSCRIPT

Unclassified GOV/PGC/ETH(2013)1 Organisation de Coopération et de Développement Économiques Organisation for Economic Co-operation and Development
___________________________________________________________________________________________
_____________ English - Or. English PUBLIC GOVERNANCE AND TERRITORIAL DEVELOPMENT DIRECTORATE
PUBLIC GOVERNANCE COMMITTEE
DISCUSSION PAPER ON PUBLIC PROCUREMENT PERFORMANCE MEASURES
OECD Meeting of Leading Practitioners on Public Procurement
11-12 February 2012
Paris, OECD Conference Centre
The paper was prepared by the consultant Gian Luigi Albano, in cooperation with the OECD procurement team.
For further information please contact Elodie Beth; E-mail: [email protected]
Complete document available on OLIS in its original format
This document and any map included herein are without prejudice to the status of or sovereignty over any territory, to the delimitation of
international frontiers and boundaries and to the name of any territory, city or area.
GO
V/P
GC
/ET
H(2
01
3)1
Un
classified
En
glish
- Or. E
ng
lish

GOV/PGC/ETH(2013)1
2
NOTE FROM THE SECRETARIAT
1 Comments were provided by Janos Bertok, Elodie Beth, Fréderic Genest and Despina Pachnou.
To encourage countries to develop an evidence-based approach, the OECD has been a pioneer in estimating the size of procurement markets. In recent years the OECD has collected and updated information on procurement markets, actors and processes as part of Government at a Glance. The 2012 report to Council showed that although member countries increasingly collect basic data on procurement, few of them make a systematic analysis of this information to measure the performance of the procurement system. Also, evidence of the impact of procurement on public policy objectives such as SMEs development or sustainable development remains scarce.
To help shape future directions of this work on measuring procurement performance, this paper was developed by the consultant Gian Luigi Albano, in cooperation with the OECD procurement team1. The paper aims to provide a framework for identifying a set of performance measures of a procurement system. It provides a first attempt to discuss what indicators could be relevant for measuring the performance of a procurement system, keeping in mind the possible difficulties in gathering this data. The second part of the paper explores how public procurement strategies can affect key dimensions of national competitiveness such as market size and innovation.
FOR ACTION:
Experts are invited to:
Present existing performance measures or indicators in their country on the procurement system;
Discuss what additional data could be useful to measure the performance of their procurement system;
Shape directions for future work on data collection for developing benchmarks and indicators, including on the impact of procurement on competitiveness.

GOV/PGC/ETH(2013)1
3
TABLE OF CONTENTS
_Toc346721963
INTRODUCTION 5
PART I 6
1. The logic of the performance indicators 6 2. Strategic leadership 7 3. Objectives 8
3.1 Savings 9 3.2 Sustainability 12 3.3 Inclusion of Small and Medium Enterprises (SMEs) in public procurement markets 15
4. Procedures/Processes 16 5. People 20 6. Relationship with suppliers, end-users and other stakeholders 22
PART II 25
1. Public Procurement and National Competitiveness 25 1.1 On the notion of Competitiveness 25 1.2 The (Potential) Impact of Public Procurement on National Competitiveness 27
2. Measures of National Competitiveness 27 3. How Public Procurement May Affect National Competitiveness: The Main Transmission Chains 28
3.1 The Role of Institutions 29 3.2 Market Size and Efficiency 30 3.3 Innovation 32
Figures
Figure 1. Public Procurement and the Global Competitiveness Index 29
Boxes
Box 1. Strategic leadership: Examples of performance measures and indicators 7 Box 2. Savings 10 Box 2 (continue). Savings 11 Box 3. Sustainability-related aspects of procurement 14 Box 4. SMEs participation in procurement 15 Box 5. Efficiency of procurement processes: 17 Box 6. Openness of procurement processes 18 Box 7. Effectiveness/quality of procurement processes: 19 Box 8. Professionalism in the procurement function: 21 Box 9. Relationships with suppliers, end-users and other stakeholders 23

GOV/PGC/ETH(2013)1
4
Box 10: Public Procurement Market Size and Efficiency 32 Box 11: Procurement of R&D 33 Box 12: Procurement of Innovative Products/Services (“First” Procurement) 34 Box 13: Innovation through Procurement Processes 34

GOV/PGC/ETH(2013)1
5
INTRODUCTION
1. During the last two decades public procurement has undergone profound changes. Policy makers,
academics and practitioners alike share the broad view that public procurement has evolved from a clerical
signoff-ridden set of activities to a strategic tool to enhance efficiency in public organizations, to regulate
markets and promote sustainable development.
2. Governments often base their reforms on the assumption that public procurement is an effective
tool for pursuing a heterogeneous array of socially relevant objectives. Often, unfortunately, policy debates
tend to focus on how to expand the list of objectives rather than to assess the potential compatibility of
those agreed objectives. A major problem, however, has to be solved even before getting to the
compatibility issue, namely how to measure the effectiveness of procurement choices for each single
objective. The difficulty is such that most discussions about the outcomes of public procurement strategies
boil down to estimating the value of savings from competitive procedures and/or from streamlining
processes by using electronic means, although it far from being clear that commonly shared methodology
on how to compute savings has been reached.
3. This paper has two main objectives. In part I, we shall provide the main logic underlying the
construction of a set of performance measures of a procurement system, taking also into account some
indirect effects of procurement activities on the welfare of subjects who are not direct parties to a public
contract or even on the whole society. In part II, we shall tackle an arguably less obvious topic, namely
how public procurement strategies can affect national competitiveness.
4. All the indicators set forth in the paper might be applied in principle to a single public
organization as well as well as to a wider public subject such a specific part of the public sector (say, the
procurement system in the health sector) , a region and even the whole national procurement system.
Nonetheless two major difficulties are to be carefully taken into account when applying the set of
indicators simultaneously to a multitude of public organizations: i) the availability and the quality of data;
and ii) the recourse to descriptive statistics as average or median values that would inevitably smooth out
some heterogeneity among different public organizations. Therefore the paper also signals where it is
expected that few OECD countries are collecting this information2.
2 Those indicators labelled with an asterisk (“*”) are to be considered the most difficult to use in terms of the
quality/quantity of information they require, thus they ought to be applied in very advanced procurement systems.

GOV/PGC/ETH(2013)1
6
PART I
1. The logic of the performance indicators
5. What dimensions of public procurement ought to or need to be measured? To what extent is it
important to rely on objective rather on subjective measures of performance? Does there exist any
consensus on the ultimate meaning of the word “performance” when applied to a public procurement
system?
6. The last question deserves to be addressed before tackling the other two, since it seems a sound
logical argument to identify, even imprecisely, any social phenomenon before applying to it a set of
measurement systems. “Performance” is to be interpreted, at least in the relevant context we are
considering, as the “action or process of performing a task or function.”3 This definition becomes more
convoluted and multifaceted when applied to public procurement. First, public procurement processes
normally consist in a sequence of interlinked (simpler) (sub-)tasks. Second, the set of procurement
processes aim at achieving more than one objective at the time. Third, the actual performance depends
heavily on the behaviour of different agents who interact in an environment of co-opetition.4 Thus a rough
painting of the performance of a public procurement system would have to contain the following
ingredients: objectives and the objectives’ decision makers, the possible routes to achieve those objectives,
and the profiles/characteristics of those agents interacting along the road.
7. This line of reasoning leaves us in a less uncomfortable position to address the next critical
question: how would we recognize a good procurement system? Without any pretention of being
exhaustive and conclusive, it is possible to list at least two sets of (possibly sufficient) conditions for a
public procurement system to be considered as good or sound:
Existence of decision centres setting possible multiple and non-contradictory objectives, and
periodically assessing whether the system works coherently with those objectives;
The system is built on a set of processes that maximize the likelihood of reaching the system’s
objectives while minimizing the use of resources.
8. The succinct expression “use of resources” captures in fact multiple sub-dimensions comprising
the adoption of technological advanced solutions reducing the time for tasks completion, the quantity and
quality of the workforce, and the extent to which the interaction among involved parties is adversarial
rather than collaborative.
9. Consequently, we shall group the main indicators into the following five classes or families:
Strategic leadership
3 This definition is retrieved from oxforddictionaries.com.
4 We are perhaps abusing the concept as masterly discussed in Branderburger and Nalebuff (1997).

GOV/PGC/ETH(2013)1
7
Objectives
Procedures/processes
People
Relationship with suppliers, end-users and other stakeholders.
10. In the next sections, we shall define several examples of indicators for each class and provide the
rationales for our choice.
2. Strategic leadership
11. In most countries, the power to spend public money belongs to a multitude of different public
organizations, differing from each other in terms of location, size, and nature of the mission. This often
gives rise to an almost physically tangible fragmentation of the public procurement spend. This picture
does not only apply to a national procurement system as a whole. It could be easily brought to the level of
a single public entity consisting in several organizational units, each entrusted with the power of carrying
out procurement processes.
12. When the number of contracting authorities (or organizational units) is high enough and when
procurement processes pursue more than one single objective, it becomes of paramount importance to
assess whether there exist institutional actors steering the system towards the desired goal, that is, setting a
consistent set of objectives, designing an assessment system and correction mechanism.
13. We define this set of activities “strategic leadership” and gather some of indicators of the latter in
the following box.
Box 1. Strategic leadership: Examples of performance measures and indicators
Metrics ST1
Existence of a strategy (ies) explicitly stating the main objectives of procurement processes
Sub-metrics ST1.1
Number of distinct objectives listed in the strategy (for instance, savings/value for money;
sustainability; participation of SMEs; innovation)
Sub-metrics ST1.2
Existence of a prioritisation of these objectives in the strategy
Sub-metrics ST1.3
Existence of mandatory targets (e.g. to achieve socio-economic and/or environmental
objectives)
Sub-metrics ST1.3
Number of different actors (namely, different institutions at the national level or different

GOV/PGC/ETH(2013)1
8
organizational units at the single public entity level) consulted in the development of the
strategy
Metrics ST2
Adoption of a clear process to collect and publish data on the performance of public procurement
processes
Sub-metrics ST2.1
Number of different public organizations (or organizational units in the same organization)
gathering data on procurement processes or to which public buyers (or purchasing units in the
same organization) are obliged to provide data on procurement processes
Sub-metrics ST2.2
Number of different public organizations (or organizational units in the same organization)
publishing statistics on procurement processes
Metrics ST3
Existence of a specialised unit or institution in the government making formal assessments of the extent
to which procurement processes achieved their intended objectives (as listed possibly in the strategy)
Metrics ST4
Percentage (value) of procurement spending in goods / services / civil works that is benchmarked
Benchmarking here means using the outcome of a class of procurement processes to assess the goodness of
the system (at the national or the single organization’s level)
14. Remark. The list of indicators in box 1 reflects mainly whether or not “institutional leaders” are
active or are explicitly entrusted with the power of defining/assessing public procurement strategies. It is
far from being obvious to find objective measures of the consistency of different objectives. Since
“consistency” mainly points at the absence of contradiction among objectives, the same set of objectives
might show either a high or low level of consistency depending on the relative weight of each objective.
3. Objectives
15. This section aims at discussing the main objectives of public procurement strategies (e.g.
savings./value for money, sustainability, promotion of SMEs) and how these could be measured, building
on the experience of selected OECD countries.
16. Achieving value for money is a key driver of procurement reforms. This might result in
governments using procurement for:
Investment to boost the economy, for example in the form of fiscal stimulus packages. As an
immediate response to the financial and economic crisis many countries launched in 2008

GOV/PGC/ETH(2013)1
9
stimulus programmes, which resulted in increased funding for major investment projects in
infrastructure across key sectors of the economy such as housing and transport5.
Cost control, as part of their recent efforts to rein back public spending. This is very often done
by rationalizing public expenditure for goods and services, which account for a considerable
amount of resources. Being generally perceived as “politically less sensitive” than pensions or
health expenditure, public spending for goods and services becomes almost naturally the target of
cost-controlling policies.
17. While the financial dimension remains crucial, governments agencies are often willing to
exchange better (resp., worse) financial conditions for lower (resp., higher) quality standards. Public
buyers are also interested in how they can achieve the most suitable quality-price couple, namely the
overall cost of carrying out successfully procurement process. The achieved quality-price ratio and the
efficiency of public procurement processes constitute the three main ingredients of value for money in
public procurement. While the next section discusses measures of savings at the purchasing stage, we shall
postpone the analysis of transaction cost-related dimensions until the section on procurement
procedures/processes.
3.1 Savings
18. Governments usually calculate savings in public procurement as a result of competition. Savings
are very often considered as the natural consequence of transforming the acquisition process from one-to-
one (say, a bilateral negotiation) to a one-to-many relationship (say, an auction). The relevant question then
becomes how to estimate “savings” from using a competitive procurement procedure.
19. Auction theory6 teaches us that competition might make the buyer better off with respect the most
easily available outside option, consisting often (albeit not always) in negotiating a deal with a local,
possibly well-known, supplier. By attracting new bidders competition should in principle yields lower
purchasing cost than a private deal with the local supplier. Thus, for a given reserve price, the degree of
competition induced by the procurement procedure does have an impact on public buyers’ savings.
20. Before introducing the main indicators of this section, we define percentage savings, s, as
follows. Call r the buyer’s reserve price and p* the awarding price. Then
s [(r - p*)/r] 100.
5 See in particular Progress made in implementing the OECD Recommendation on Enhancing Integrity in
Public Procurement, Report to Council.
6 See, for instance, Krishna (2009).
GOV/PGC/ETH(2013)1
10
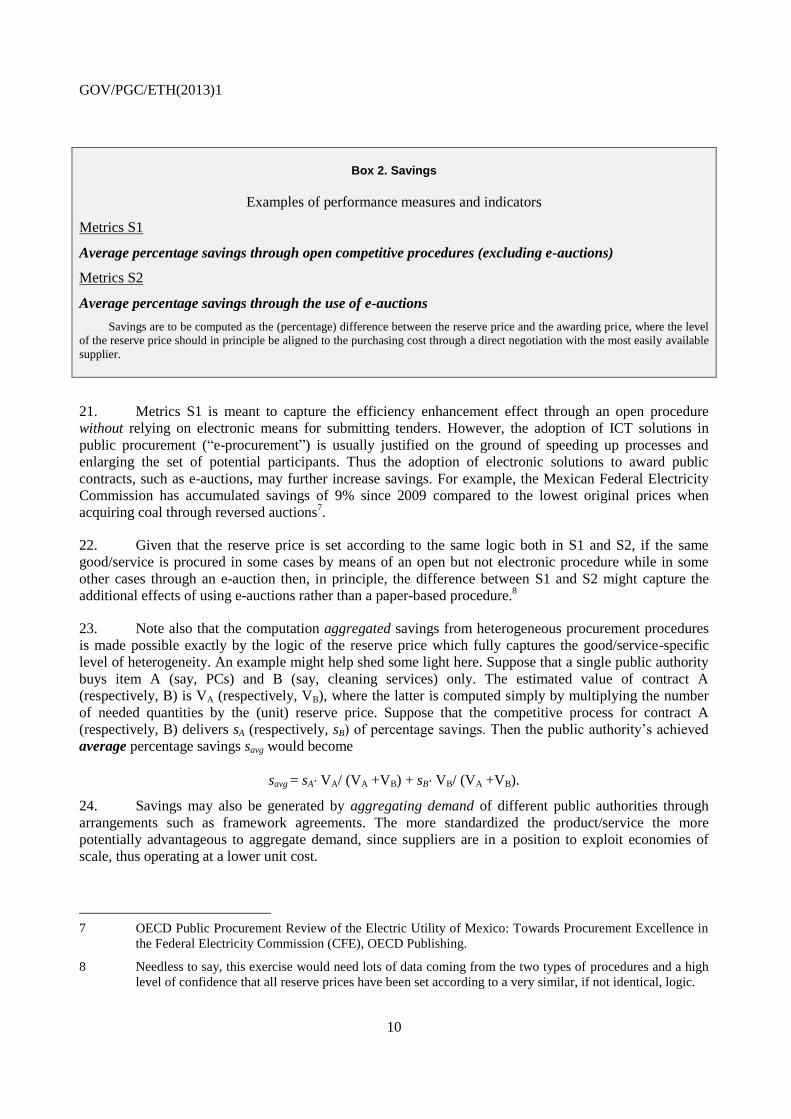
Box 2. Savings
Examples of performance measures and indicators
Metrics S1
Average percentage savings through open competitive procedures (excluding e-auctions)
Metrics S2
Average percentage savings through the use of e-auctions
Savings are to be computed as the (percentage) difference between the reserve price and the awarding price, where the level
of the reserve price should in principle be aligned to the purchasing cost through a direct negotiation with the most easily available
supplier.
21. Metrics S1 is meant to capture the efficiency enhancement effect through an open procedure
without relying on electronic means for submitting tenders. However, the adoption of ICT solutions in
public procurement (“e-procurement”) is usually justified on the ground of speeding up processes and
enlarging the set of potential participants. Thus the adoption of electronic solutions to award public
contracts, such as e-auctions, may further increase savings. For example, the Mexican Federal Electricity
Commission has accumulated savings of 9% since 2009 compared to the lowest original prices when
acquiring coal through reversed auctions7.
22. Given that the reserve price is set according to the same logic both in S1 and S2, if the same
good/service is procured in some cases by means of an open but not electronic procedure while in some
other cases through an e-auction then, in principle, the difference between S1 and S2 might capture the
additional effects of using e-auctions rather than a paper-based procedure.8
23. Note also that the computation aggregated savings from heterogeneous procurement procedures
is made possible exactly by the logic of the reserve price which fully captures the good/service-specific
level of heterogeneity. An example might help shed some light here. Suppose that a single public authority
buys item A (say, PCs) and B (say, cleaning services) only. The estimated value of contract A
(respectively, B) is VA (respectively, VB), where the latter is computed simply by multiplying the number
of needed quantities by the (unit) reserve price. Suppose that the competitive process for contract A
(respectively, B) delivers sA (respectively, sB) of percentage savings. Then the public authority’s achieved
average percentage savings savg would become
savg = sA VA/ (VA +VB) + sB VB/ (VA +VB).
24. Savings may also be generated by aggregating demand of different public authorities through
arrangements such as framework agreements. The more standardized the product/service the more
potentially advantageous to aggregate demand, since suppliers are in a position to exploit economies of
scale, thus operating at a lower unit cost.
7 OECD Public Procurement Review of the Electric Utility of Mexico: Towards Procurement Excellence in
the Federal Electricity Commission (CFE), OECD Publishing.
8 Needless to say, this exercise would need lots of data coming from the two types of procedures and a high
level of confidence that all reserve prices have been set according to a very similar, if not identical, logic.

GOV/PGC/ETH(2013)1
11
25. Lower production costs, however, may yield lower purchasing prices only if the buyer keeps
intact or increases its bargaining power. The degree of competition is usually expected to increase with the
value of procurement contracts. Particularly in markets where the public sector accounts for a relevant
share of the total demand, centralization, standardization and aggregation can put the winner of a single
competitive tendering in a position to significantly increase its market share. This strengthens the
bargaining power of the public agency awarding the contract, so leading the suppliers to compete more
fiercely to offer lower (purchasing) price9 and better quality.
26. Yet, two conflicting forces come into play. For a given number of competitors, demand
aggregation leads to fiercer competition. However, as the size of contracts gets larger, smaller firms may
find it impossible to participate in the competitive processes – because of more demanding economic and
financial requisites – thus leading to a lower number of competitors. Assuming that in most circumstances
the lower participation effect is not strong enough, demand aggregation usually leads to higher savings.
Box 2 (continue). Savings
Examples of performance measures and indicators
Metrics S3*
Average percentage savings through (competitive) demand aggregation arrangements (e.g. framework
agreements)
Savings are to be computed as the (percentage) difference between the reserve price and the awarding
price. Unlike S1 and S2, the reserve price should in principle reflect the average purchasing price that each
single public authority might fetch by carrying out a procurement process on its own.
Metrics S4
Average percentage variation of the awarding price (from possibly any type of procurement procedure)
between year t and t+1
The average percentage variation, t+1, is defined as
t+1 [(pt+1* - pt*)/ pt*] 100.
27. Remark 1. Computing savings in the case of aggregated (or joint) purchases is then a much
trickier exercise than in the case of a single purchasing entity. It would then be advisable to undertake such
a measurement exercise only if it is possible to interact with procurement personnel specialized in demand
aggregation (say, specialists working for a centralized procurement agency).
28. Remark 2. A positive value of S3 immediately implies that some forms of demand aggregation
generate a higher level of efficiency than procurement processes independently run by single public
authorities.
29. Remark 3. S4 provides a simple measure to monitor the evolution over time of the awarding
prices for homogenous public contracts.
9 The importance of measuring other financial dimensions arising over the relevant time horizon will be
considered in section below on sustainability.

GOV/PGC/ETH(2013)1
12
3.2 Sustainability
30. Sustainable public procurement (SPP) includes environment-related and social considerations in
the design of procurement strategies. SPP broadens the scope of public procurement by including a
potentially wide array of externalities, be them towards the environment or the welfare of stakeholders who
are not necessarily parties to the public contract. This section will discuss the two main components of
sustainability: environmental considerations (the so-called green public procurement) and social
considerations (the so-called socially responsible public procurement).
31. The broad objective of green public procurement (GPP) is to design procurement strategies so as
to minimize the amount of negative externalities on the environment. To better clarify this objective, it
would be useful to mention some of the main findings of a research project – called RELIEF10
– co-funded
by the EC, aiming at scientifically assessing the potential environmental benefits of EU-wide green
procurement strategies. The findings concluded that:
“If all public authorities across the EU demanded green electricity, this would save the equivalent
of 60 million tonnes of CO2, which is equivalent to 18% of the EU’s greenhouse gas reduction
commitment under the Kyoto Protocol. Nearly the same saving could be achieved if public
authorities opted for buildings of high environmental quality.
If all public authorities across the EU were to require more energy-efficient computers, and this
led the whole market to move in that direction, this would result in 830.000 tonnes of CO2
savings.
If all European public authorities opted for efficient toilets and taps in their buildings, this would
reduce water consumption by 200 million tonnes (equivalent to 0.6% of total household
consumption in the EU).”
32. The findings just mentioned emphasize “social” benefits stemming from green procurement, that
is, the reduction of negative externalities from lower CO2 and pollutants emissions or lower consumption
of raw materials. Thus, under normal circumstances, procurement strategies with a positive (respectively,
negative) environmental impact are typically cases of positive (respectively, negative) externalities. GPP
strategies may also generate private benefits, accruing directly to the public buyer. In most cases, they arise
from future savings due, for instance, to lower consumption of energy or water or from lower waste or
disposal cost. But sometimes there might be concerns about better or healthier working conditions for the
employees, which might also result in lower risks for the employer.
33. The distinction between social and private benefits is often blurred. The two effects often coexist
and are strongly related. Energy efficient solutions, for instance, allow lower consumption yielding both
lower operating expenditures for the buyer and lower pollution for the environment. In general, green
purchasing accruing private benefits to the buyer generates a positive externality on the environment as
well. The converse is not always true, though. In some cases, green products might leave unchanged or
even decrease the direct utility of the procurer. Consider, for instance, the use of recycled paper for
printers, which has a lower environmental impact than bleached paper but brings no advantage to the users,
either in terms of quality (which, on the contrary, may be perceived as lower) or in terms of costs (which
may be higher). Another example is the procurement of products with low environmental impact at the
production phase, which may result more costly without providing the user with any additional benefit.
10 For more on the RELIEF project see ICLEI, Local Government for Sustainability, 2001-2003

GOV/PGC/ETH(2013)1
13
34. Most guidelines on GPP seem to neglect this important distinction which, in turn, is likely to
strongly affect the buyers’ willingness to pay for green products. In 2010 over three-quarter of OECD
countries indicated that the primary concern of procurement officials in the use of GPP is the possibility of
higher prices resulting from more stringent environmental criteria.11
35. Assessing the costs of a good or service over its whole life cycle rather than at its market price
could address this, but implementation of this practice remains a challenge. In fact, public buyers might be
willing to pay a higher purchasing price against future savings on usage and disposal provided that there is
the budget flexibility to do so over time. However the absence of incentives for procurement officials to
take into account environmental considerations is an obstacle to the use of green public procurement – for
example, many OECD countries do not set mandatory targets for GPP and often fail in verifying whether
these targets were achieved in practice.
36. In order to assess, at least partially, the benefits from GPP strategies public buyers are bound to
stretch the time horizon for evaluating the financial dimension(s) of a public contract. Indeed evaluating
the financial component(s) at the purchasing stage only underestimates the buyer’s overall cost of
ownership, since it typically underestimates all kinds of costs arising throughout the life cycle of a good,
service and civil work. Stretching the time horizon for evaluating the financial dimension(s) of the value
for money may thus have at least two benefits: i) it makes all financial components more visible and
transparent, thereby allowing public buyers to trade-off, say, a higher purchasing cost today with a lower
maintenance cost tomorrow; ii) expenditures at different stages of the life-cycle are emphasized, thus
allowing public buyers to better plan - whenever admissible by public accounting rules - budgetary
predictions over several years.
37. The methodology to evaluate at the same time purchasing costs, operating costs (e.g., energy,
spares and maintenance) and end-of-life costs (e.g., decommissioning and removal) is known as whole life-
cycle or life-cycle costing (LCC). This approach has become a key tool for implementing GPP that has
become in recent years one of the pillars of international policy guidelines on public procurement.
38. While forcing public buyers to evaluate a contract’s financial terms by looking at the whole life
cycle, the LCC does not restrict per se the set of possible green solutions to be considered. In many cases,
though, public buyers are willing to send stronger signals to markets by raising the minimal environmental
standards that a good (or some of the phases of a production process) has to comply in order to be
considered an admissible solution.
39. Governments are also increasingly using socially responsible public procurement (SRPP), that is,
procurement operations taking into account one or more of the following social considerations:
employment opportunities, decent work, compliance with social and labor rights, social inclusion
(including persons with disabilities), equal opportunities, accessibility design for all, ethical trade issues
and wider voluntary compliance with corporate social responsibility (CSR).12
40. The dimensions included in SRPP are quite heterogeneous. The most frequently adopted social
dimensions would include:
11 OECD (2011), “Special feature: Green procurement”, in Government at a Glance 2011, OECD Publishing.
http://dx.doi.org/10.1787/gov_glance-2011-49-en
12 European Commission (2010), “Buying Social. A Guide to Taking Account of Social Considerations in
Public Procurement”, retrieved on 18th Sept 2012 from
http://ec.europa.eu/internal_market/publicprocurement/other_aspects/index_en.htm#social

GOV/PGC/ETH(2013)1
14
a) Workers’ welfare (e.g., compliance with core labor standards, occupational health and
safety, access to training, access to basic social protection);
b) Gender considerations (e.g., gender balance and non-discrimination, compliance with the
principle of equal treatment between women and men, including the principle of equal pay
for work of equal value);
c) Fight against discrimination on other than gender grounds (age, disability, religion and
belief, sexual orientation, etc.)
d) Accessibility.
41. Similarly to GPP, social considerations can enter technical specifications, selection criteria,
award criteria and contract performance clauses.
42. The discussion above leads to the following suggestions for sustainability-related indicators.
Box 3. Sustainability-related aspects of procurement
Examples of performance measures and indicators
Metrics GS1
Percentage (both number and value) of awarded procurement contracts in which environment-related technical
dimensions are considered either in the selection or the award criteria
Sub-metrics GS1.1
Percentage (both number and value) of awarded procurement contracts in which the whole life-cycle or
life-cycle costing is explicitly taken into consideration
Metrics GS1.2*
Estimated percentage reduction of CO2 emissions through the adoption of environmental-related
technical dimensions (either in the selection or the award criteria)
Metrics GS3
Percentage (both number and value) of awarded procurement contracts in which social dimensions are
considered either in the selection or the award criteria
43. Remark 1. Metrics GS1 and GS2 provide two admittedly rough measures of the extent to which
sustainability-related considerations enter procurement processes mainly for they fail to discriminate the
impact of those considerations in the selection rather than in the award criteria. They ought to be
considered as a sound starting point to evaluate how procurement strategies evolve over time to include
external effects. Both metrics could in principle be refined to capture the weight of sustainability-related
considerations in the selection criteria relatively to the one in the award criteria.
44. Remark 2. Unlike the first three metrics, GS4 aims at measuring the outcome brought about by
the adoption of environment-related criteria. If, for instance, the selection criteria were to include the
“ENERGY STAR” requirements for computers13
then it would be possible to estimate the average energy
consumption reduction over the computer’s life-cycle which would immediately translate in CO2
13 See http://www.energystar.gov/index.cfm?fuseaction=find_a_product.showProductGroup&pgw_code=CO

GOV/PGC/ETH(2013)1
15
reduction. A similar computation could also be performed for cars. Moving from a less stringent to a more
stringent certification label would also require the same kind of computation.
3.3 Inclusion of Small and Medium Enterprises (SMEs) in public procurement markets
45. Given the significance of SMEs to the global economy and labour market, which represent for
example 98% of enterprises in the EU, of which 92.2% are firms with ten or fewer employees, policy
makers are increasingly concerned about potential barriers to entry for SMEs in public procurement
markets. Since public procurement accounts for as much as 13.4% of GDP in OECD countries, it can have
a significant impact not only on the share of government contracts awarded to SMEs but also on job
creation.
46. The following section analyses both the measures to facilitate SMEs access to government
contracts as well as specific set-asides (to reserve a certain amount of procurement value for SMEs).
Box 4. SMEs participation in procurement
Examples of performance measures and indicators
Inclusion of SMEs in public procurement markets
Metrics IN1
Average percentage (both number and value) of procurement contracts that are awarded to SMEs
Sub-metrics IN1.1*
Average percentage (both number and value) of procurement contracts that are awarded to SMEs
through e-auctions
Sub-metrics IN1.2
Average percentage (both number and value) of procurement contracts that are awarded to SMEs when
demand aggregation arrangements are in place (e.g., fraction of contracts awarded to SMEs in
framework agreements)
Positively discriminatory policies in favor of SMEs and other classes of firms (according to the nature of
ownership, geographical location etc.)
Metrics IN2
Does public procurement regulation allow for set asides? (YES/NO)
“Set asides” are public contracts that can awarded only to a specific family of firms (say, SMEs but also minority-
owned firms).
Sub-metrics IN2.1*:
Number and value of requirements set aside for SMEs
Other measures to facilitate access of SMEs to procurement markets
Metrics IN3
Existence of preferential financial treatment of SMEs (e.g. waiving fees)

GOV/PGC/ETH(2013)1
16
47. Remark 1. Indicator IN1 is the most relevant in capturing the degree of fairness of the
procurement system towards SMEs. By comparing the value of IN1 in any given year to the share of SMEs
in the overall economy one gets an immediate measure of heterogeneity of the procurement market
relative to the whole economy. It would be advisable that the indicator be split according to different types
of procedures (say, competitive vs. non-competitive procedures).
48. Remark 2. Indicator IN1.1 focuses on the share of public contracts awarded to SMEs through e-
auctions, that are often considered an effective way to foster participation in competitive procurement
procedures. However, this does not imply per se that SMEs would benefit more than bigger firms in
participating in e-auctions. Thus, by comparing in any given year the values of IN1 and IN1.1* it would be
possible to roughly assess whether or not e-auctions have an adverse effect on SMEs.
49. Remark 3. Indicator IN1.3 focuses on SMEs’ shares of public contracts when some form of
aggregation of demand is in place. Under normal circumstances, aggregation of demand plays against
SMEs because the higher-than-average value of contracts becomes a barrier to entry. Consequently, one
would reasonably expect the value of IN1.3 to be lower than that of IN1 in any given year. It is then the
evolution over time of the difference between those two values which provides a meaningful piece of
information about whether or not pro-SMEs policies are effective.
50. Remark 4. IN2 helps us better interpret the value of IN1. It is indeed more likely that the value
of IN1 to be high if “YES” is the answer to IN2.
4. Procedures/Processes
51. How smoothly and effectively do public buyers reach the objectives set in the strategic plans?
What kind of organizational forms are implemented? To what extent public procurement processes are
open and competitive are public procurement processes? These are three among the most relevant
questions concerning the profile of the public procurement “machinery”, be it at the level of the whole
system or at the one of a single purchasing organization.
52. The organizational dimensions in public procurement refer to the set of arrangements designed to
meet needs for goods/services/civil works. More specifically, once needs are collected and classified
according to the relevant dimensions (e.g., intermediate consumption vs. investment, goods vs. services,
input- vs. output-driven etc.) one fundamental decision concerns to what extent public contracts are to be
bundled together. The level of “demand aggregation” is independent of whether we are considering a
single purchasing organization rather than the whole national system, although the level of complexity of
the problem is, needless to say, much higher in the latter case than in the former.
53. Different organizational solutions often imply different amount of human resources and duration
of the procurement processes (mainly until contract award). The next box gathers a set on indicators
aiming at capturing the main features in terms of i) demand aggregation, ii) level of specialization of
purchasing organizations; iii) quantity of workforce; and iv) duration of public procurement processes.

GOV/PGC/ETH(2013)1
17
Box 5. Efficiency of procurement processes:
Examples of performance measures and indicators
Metrics A1
Existence of a central purchasing body(ies) at central and/or local levels or shared services across
public contracting authorities (YES/NO)
Sub-metrics A1.2
Fraction of the overall value of procurement contracts awarded independently of any other
contracting authority
Metrics A2 Percentage of public contracts awarded through centralized/joint procurement procedures
across contracting authorities
Aggregation of public demand can be implemented by using two broad classes of arrangement: i) by
having a procurement agency (body) awarding contracts on behalf of other public organizations; ii) by a
cooperation agreement among purchasing organizations pooling resources to award contracts that satisfy
the organizations’ needs.
Metrics A3
Number of operating e-procurement platforms at the national and the local level and average value of
public contracts awarded by using the functionalities of each platform
Resource consumption
Metrics RC1
Average number of functional Full-Time Equivalents (FTEs) used process until contract award in i)
open; ii) restricted; and iii) negotiated procedures
A full-time equivalent (FTE) is a unit to measure employed persons in a way that makes them
comparable although they may work a different number of hours per week.
The unit is obtained by comparing an employee's average number of hours worked to the average number
of hours of a full-time worker. A full-time person is therefore counted as one FTE, while a part-time
worker gets a score in proportion to the hours he or she works. For example, a part-time worker employed
for 20 hours a week where full-time work consists of 40 hours, is counted as 0.5 FTE.14
Metrics RC2
Average value of a procurement process managed by each FTE
RC2 is to be constructed by taking the estimated value of procurement processes divided by the overall
number of procurement-related FTEs.
Metrics RC3
Average elapsed number of days between the publication of the call for tenders and contract award in i) open; ii) restricted; and iii) negotiated procedures
14 We borrow the definition of full-time equivalent from
http://epp.eurostat.ec.europa.eu/statistics_explained/index.php/Glossary:Full-time_equivalent

GOV/PGC/ETH(2013)1
18
54. Remark 1. Indicators A1 to A3 are meant to capture the main organizational features of a public
procurement system at either the national or regional level. Indicator A1.2 addresses a potentially relevant
characteristic of a single purchasing authority, namely the extent to which the latter is able to fulfil its
needs by relying on internal procurement capacities. If the authority’s procurement expenditure were to be
fairly evenly split among different items, then indicator A1.2 would be a good approximation of the degree
of procurement specialization (under the assumption that the procurement of a particular class of
goods/services/civil works is either completely insourced or entirely outsourced).
55. Remark 2. Indicators RC1 and RC3 simply capture how much/long it takes to award a contract
(by possibly distinguishing among different kinds of procurement procedures). Data are likely to be more
easily collected at a single purchasing authority level. In order to use both indicators for local vs. national
or international comparisons it seems more appropriate to stick to the “time” dimension (either in terms of
workforce’s days or elapsed time between the relevant interval) rather than the “cost” dimension.
56. Remark 3. It is not necessarily the case that a high measured value of RC1 goes always hand in
hand with a high value of RC3. For instance, if a public authority aggregates demand on behalf of other
public entities this might result in a higher RC1 and a lower RC3 than those of a public entity
independently carrying out its procurement processes. Indeed, in the first case procurement processes
might be shorter but require more people working simultaneously (specialized know-how).
57. Remark 4. The cost of human resources throughout the procurement process - that is, the
number of employed FTEs times the average wage per FTE - would provide in principle a ballpark
estimate of process costs. Thus one would be in principle in a good position to fully compare the
performance of two different procurement procedures, say, an open procedure vs. a negotiated one, both
aiming at awarding similar (albeit not necessarily identical) contracts. By comparing purchasing savings
and the cost of human resources one could rank the two options at least in term of (overall) cost
effectiveness. However, it is arguable that collecting data on the average wage per FTE might be difficult
per se and/or raise other kinds of concerns. Consequently, we have decided to focus on the number of
FTEs to capture the human resource dimension.
58. The next two boxes gather indicators on some qualitative dimensions of public procurement
processes, namely i) the extent to which they favour competition; ii) the extent to which the relationship
among the involved actors is adversarial; and iii) the ability to solicit different solutions from the market.
Box 6. Openness of procurement processes
Examples of performance measures and indicators
Metrics OT1
Percentage (both number and value) of procurement call for tenders being published online
Metrics OT2
Percentage (both number and value) of procurement contracts awarded by means of non-competitive
procedures (that is, exceptions to competition where the procuring entity contacts a single supplier in
order to solicit a proposal or a price quotation without competitive tendering)
Metrics OT3
Percentage (both number and value) of procurement contracts for which foreign suppliers are NOT
allowed to bid
GOV/PGC/ETH(2013)1
19
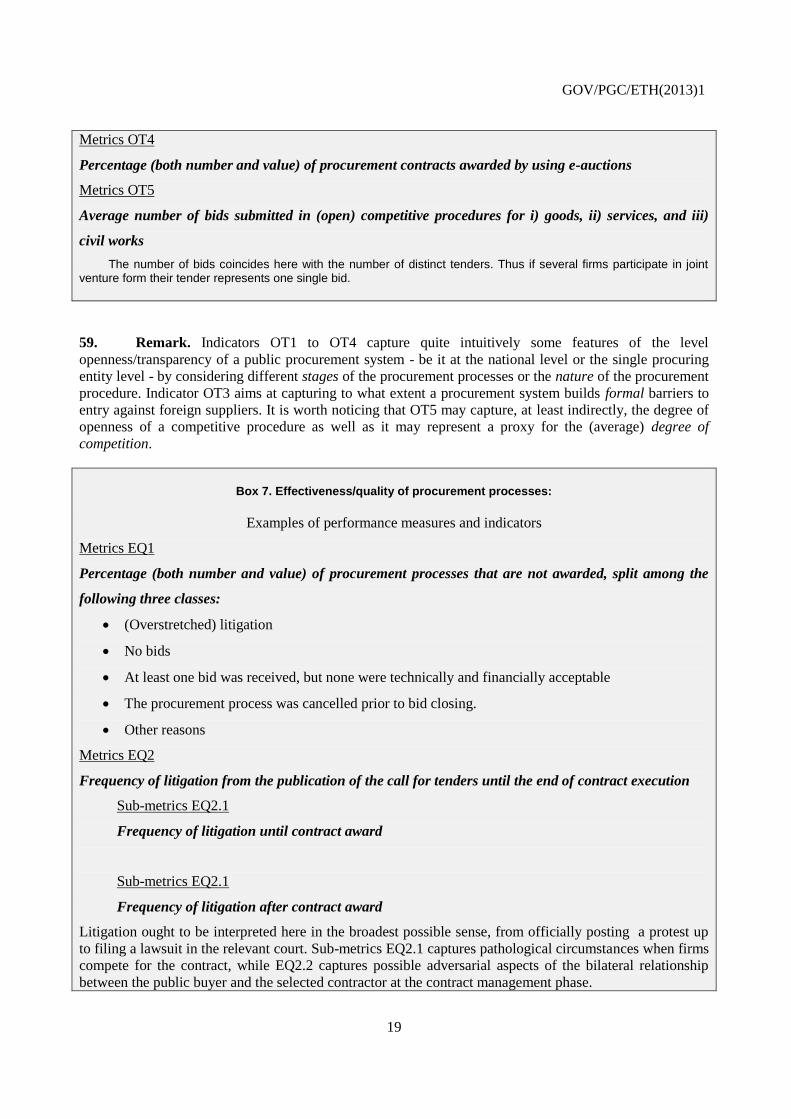
Metrics OT4
Percentage (both number and value) of procurement contracts awarded by using e-auctions
Metrics OT5
Average number of bids submitted in (open) competitive procedures for i) goods, ii) services, and iii)
civil works
The number of bids coincides here with the number of distinct tenders. Thus if several firms participate in joint venture form their tender represents one single bid.
59. Remark. Indicators OT1 to OT4 capture quite intuitively some features of the level
openness/transparency of a public procurement system - be it at the national level or the single procuring
entity level - by considering different stages of the procurement processes or the nature of the procurement
procedure. Indicator OT3 aims at capturing to what extent a procurement system builds formal barriers to
entry against foreign suppliers. It is worth noticing that OT5 may capture, at least indirectly, the degree of
openness of a competitive procedure as well as it may represent a proxy for the (average) degree of
competition.
Box 7. Effectiveness/quality of procurement processes:
Examples of performance measures and indicators
Metrics EQ1
Percentage (both number and value) of procurement processes that are not awarded, split among the
following three classes:
(Overstretched) litigation
No bids
At least one bid was received, but none were technically and financially acceptable
The procurement process was cancelled prior to bid closing.
Other reasons
Metrics EQ2
Frequency of litigation from the publication of the call for tenders until the end of contract execution
Sub-metrics EQ2.1
Frequency of litigation until contract award
Sub-metrics EQ2.1
Frequency of litigation after contract award
Litigation ought to be interpreted here in the broadest possible sense, from officially posting a protest up
to filing a lawsuit in the relevant court. Sub-metrics EQ2.1 captures pathological circumstances when firms
compete for the contract, while EQ2.2 captures possible adversarial aspects of the bilateral relationship
between the public buyer and the selected contractor at the contract management phase.

GOV/PGC/ETH(2013)1
20
Metrics EQ3
Percentage (both number and value) of competitive processes awarded by means of the value for money
criterion (in which both technical and financial dimensions are considered in the award criteria)
The “value for money” criterion (a.k.a. the “economically most advantageous tender” criterion)
allows a procuring entity to assess both financial and non-financial dimensions in the award criteria.
Usually, the call for tender specifies the relative importance (“weighting”) of the different classes of
dimensions for contract award.
60. Remark. While indicators EQ1 and EQ2 focuses on the quality/effectiveness of a procurement
process, indicators EQ2 and EQ3 look at the consequences of a(n) (average) procurement process. In
particular, EQ2 measures how often public buyers attempt at enlarging the range of possible buying
options by having recourse to an award criterion that evaluates at the same time financial and non-financial
dimensions.
5. People
61. Public procurement, like other supply management operations, has progressively moved away
from the transactional focus of purchase order processing to a strategic role in government. Traditionally,
compliance with policies and procedures was a primary focus, today’s public procurement professionals
encounter more complexity and a more central role in organizational performance. While traditionally
purchasing agents often executed purchase orders with suppliers identified by consumer agencies, today’s
procurement professionals are more central to defining and implementing procurement strategies for the
stakeholders/principal(s).15
Procurement professionals are asked to carry out market intelligence analyses,
to state and pursue several co-existing objectives, to handle complex contracting arrangements and to
execute and administer them. Further, the competing issues in centralization versus decentralization have
taken on new meaning as the role of procurement in overall organizational effectiveness and efficiency
becomes more recognized. In general, as public organizations focus more on the strategic implications of
performance management, procurement professionals find themselves in a continually evolving role.
62. Therefore public organizations find themselves more and more strained in their effort to recruit,
develop and retain good talents in the procurement function. In spite of the professionally evolving
character of the role of procurement officer, the career path in the civil service does not often the necessary
degrees of freedom to adequately reward the strategic value of valuable talents in the procurement
function.
63. In order to assess to what extent the acquisition and the development of human capital in the
public procurement is considered a top-ranked priority in any public procurement organization the
following dimensions could be considered:
Professional profile
Human capital development and career development.
15 See Yukins (2010).

GOV/PGC/ETH(2013)1
21
Box 8. Professionalism in the procurement function:
Examples of performance measures and indicators
Professional profile
Metrics PP1
Percentage of public officials working on procurement-related tasks (whose job profile includes some
procurement-related duties)
Sub-metrics PP1.1
Percentage of contractors vs. full-staff procurement officials
“Contractors” would include all workers who are not on the purchasing organization’s
payroll
Sub-metrics PP1.2
Percentage of public officials working full time on procurement-related tasks
Sub-metrics PP1.3
Existence of inter-disciplinary teams to bring together different expertise
Metrics PP2
Average number of years of experience of procurement officials
Metrics PP4
Percentage of full-staff procurement officials holding a higher level of education
Higher level of education is in fact very country-specific. In some cases, the indicator would capture a
higher-than-average number of years of education, in other cases, say, a University degree, while in some
others a mixture of education degree and number of years of experience.
Human capital development
Metrics HC1
Average number of hours of training on procurement topics received by each full-staff procurement
official in the previous year
Metrics HC2
Existence of a certification program (either compulsory or voluntary) for procurement officials
Sub-metrics HC1:
Percentage of officials having completed a certification program
Metrics HC3
Average job rotation across procurement entities

GOV/PGC/ETH(2013)1
22
64. Remark 1. Indicators PP1 to PP4 capture three main sub-dimensions of procurement officials
profiles: the degree of professionalization (full time vs. part time); the degree of insourcing of procurement
skills in any organization (full staff vs. contractors); the demographics of the procurement workforce.
65. Remark 2. Indicator HC1 captures whether or not minimal quality standards are implemented on
the procurement workforce, while HC2 measures the level investments in human capital in the
procurement profession. The quality of the procurement workforce is in principle higher the higher the
value of HC2 together with a certification program for procurement officials.
66. Remark 3. Job rotation can have different objectives: it could facilitate human capital
accumulation (the same official works on different tasks over her/his career), it could also be used as anti-
corruption device (by reducing the likelihood that the same procurement official interacts with the same set
of suppliers over a long period of time).
6. Relationship with suppliers, end-users and other stakeholders
67. A constructive and non-adversarial relationship with the supply market is quintessential to fully
reap the benefits of well-designed public procurement processes. This statement becomes even stronger
once a procurement process has been finalized and the contractor(s) has (have) been selected. It is only
after the contract award that a formal buyer-supplier relationship deploys all binding consequences. In spite
of this, the contract execution phase is often subject to a far lower level of scrutiny than the pre-award
phase. This is mainly due to the incorrect perception that all fair-competition concerns vanish once the
contractor is selected. More recently, though, it has been internationally recognized that proper execution
of public contracts does matter not only in terms integrity of procurement processes but also because it
protects the rights of all non-selected firms.16
Losing bidders ought to be reassured that they were not
selected because the selected contractor did not only submit the best “promised” value for money, but will
in fact deliver the best value-for-money performance. Were this not be the case the main goal of the
competitive mechanism would be undermined, thus distorting competition for the market of public
contracts. Only fair behavior at the execution stage, namely the overall compliance with contract
conditions set at the awarding stage, ensures a real and effective competition in the entire cycle of public
procurement.
68. Box 9 collects a set of indicators aiming at measuring the quality of the buyer-supplier
relationship also by relying on measurement systems that do not hinge on objective dimensions. Indeed, as
in any relationship, there exist soft dimensions that affect the quality of the relationship itself albeit they
cannot be measured according to objective (that is, verifiable by third parties) dimensions.17
69. Finally, box 10 collects some indicators pointing at the relationship with other stakeholders
(different from potential suppliers / contractors). That a local community has a stake in the realization of a
big infrastructural project seems evident. It may sound, however, less obvious that civil society or a certain
part of it claims a stake in the oversight of some phases of public procurement processes, most notably the
management of public contracts. One intuitive reason hinges on the growing collective interest in the
integrity of the government’s functions and, more recently, in the importance of sustainability dimensions
of public procurement.
16 Losing bidders may potentially play the role of “watchdogs” at the contract execution phase. See Racca et
al. (2011).
17 In the public procurement of consulting services one often-cited example of soft performance dimension is
the consultant’s degree of proactiveness.
GOV/PGC/ETH(2013)1
23
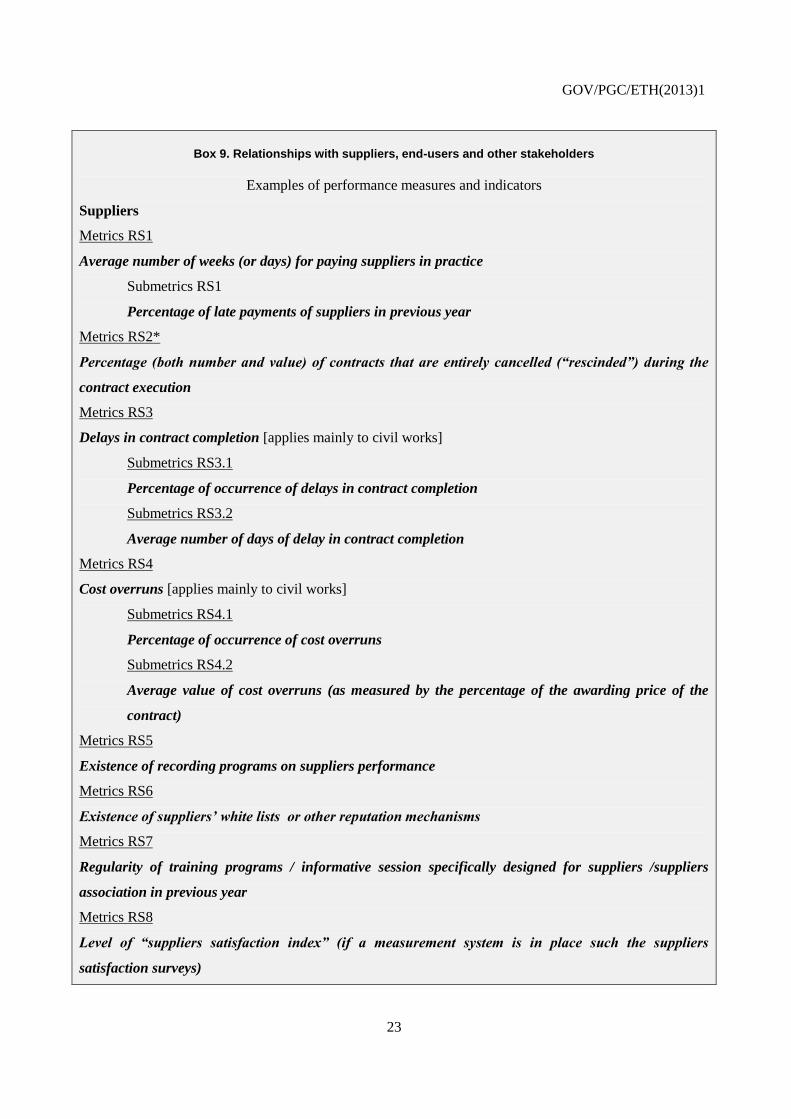
Box 9. Relationships with suppliers, end-users and other stakeholders
Examples of performance measures and indicators
Suppliers
Metrics RS1
Average number of weeks (or days) for paying suppliers in practice
Submetrics RS1
Percentage of late payments of suppliers in previous year
Metrics RS2*
Percentage (both number and value) of contracts that are entirely cancelled (“rescinded”) during the
contract execution
Metrics RS3
Delays in contract completion [applies mainly to civil works]
Submetrics RS3.1
Percentage of occurrence of delays in contract completion
Submetrics RS3.2
Average number of days of delay in contract completion
Metrics RS4
Cost overruns [applies mainly to civil works]
Submetrics RS4.1
Percentage of occurrence of cost overruns
Submetrics RS4.2
Average value of cost overruns (as measured by the percentage of the awarding price of the
contract)
Metrics RS5
Existence of recording programs on suppliers performance
Metrics RS6
Existence of suppliers’ white lists or other reputation mechanisms
Metrics RS7
Regularity of training programs / informative session specifically designed for suppliers /suppliers
association in previous year
Metrics RS8
Level of “suppliers satisfaction index” (if a measurement system is in place such the suppliers
satisfaction surveys)

GOV/PGC/ETH(2013)1
24
Relationship with end-users
Metrics RE1
Level of “customers satisfaction index” (if a measurement system is in place such as the customers
satisfaction surveys)
Metrics RE2
Adoption of other systems different from customer satisfaction surveys to gather end-users’ feedback
(“voice”)\
A “voice” system might include informal internet fora, publication of leaflets, “pressure groups” etc.
Relationship with other stakeholders
Metrics ROS1
Adoption of solutions involving civil society or other non-government stakeholders in the oversight of
the contract management

GOV/PGC/ETH(2013)1
25
PART II
70. Considering the economic importance of procurement which represents on average 13,4% of
GDP in OECD countries, governments are increasingly interested in understanding how public
procurement strategies can affect national competitiveness. Part II of the paper will explore a practical
chain of effects linking public procurement to national competitiveness as a first basis for future work on
this issue.
1. Public Procurement and National Competitiveness
1.1 On the notion of Competitiveness
71. Over the past two decades or so, the term competitiveness has been used in a variety of ways and,
sometimes abused. Both the questions and the issues that are at the heart of the concept of competitiveness
are basically those that policy makers and academic economists alike have been addressing for quite a long
time, namely how to improve well-being and the distribution of wealth. In the European context, for
instance, the Lisbon strategy18
pledges to make the EU the most competitive and dynamic knowledge-
based economy in the world, capable of sustainable economic growth with more and better jobs and greater
social cohesion.
72. While there seems to exist a wide consensus on the notion of competitiveness at the firm or
microeconomic level19
, at the macroeconomic level the same concept is more blurred and sometimes
strongly contested. Krugman (1994) and (1996), who goes so far as to depict the notion of national
competitiveness as a dangerous obsession, raises three points of opposition:
1. It is misleading to make an analogy between a nation and a firm; for example whereas an
unsuccessful firm will ultimately go out of business there is no equivalent “bottom-line” for a
nation.
2. Whereas firms can be seen to compete for market share and one firm’s success will be at the
expense of another’s, the success of one country or region creates rather than destroys
opportunities for others and trade between nations is well known not to be a zero-sum game.
18 European Commission (2010b)
19 At the firm level, competitiveness points clearly towards firms’ ability to compete, to grow and to be
profitable. Thus a competitive firm is able to produce profitably products that meet the requirements of an
open market in terms of price and quality. The more competitive a firm relative to its rivals the stronger its
ability to gain market share and ultimately the higher the likelihood the same firm will survive in the
market. Conversely, uncompetitive firms will see their market shares wane and, absent any external
support or protection, are likely to go out of business.

GOV/PGC/ETH(2013)1
26
3. If competitiveness has any meaning then it is simply another way of saying productivity; growth
in national living standards is essentially determined by the growth rate of productivity.
73. There is a growing consensus about the idea that improvements in one nation’s well-being need
not be at the expense of another’s (that is, at the global level nations are likely to play a positive-sum
game), and that productivity is one of the central concerns of competitiveness. This “consensus view” can
be illustrated by the following definitions.
“A nation’s competitiveness is the degree to which it can, under free and fair
market conditions, produce goods and services that meet the test of international
markets while simultaneously expanding the real incomes of its citizens.
Competitiveness at the national level is based on superior productivity
performance and the economy’s ability to shift output to high productivity
activities which in turn can generate high levels of real wages. Competitiveness
is associated with rising living standards, expanding employment opportunities,
and the ability of a nation to maintain its international obligations. It is not just a
measure of the nation’s ability to sell abroad, and to maintain a trade
equilibrium.”20
“[Competitiveness] may be defined as the degree to which, under open market
conditions, a country can produce goods and services that meet the test of
foreign competition while simultaneously maintaining and expanding domestic
real income.”21
“An economy is competitive if its population can enjoy high and rising
standards of living and high employment on a sustainable basis. More precisely,
the level of economic activity should not cause an unsustainable external
balance of the economy nor should it compromise the welfare of future
generations.”22
“Smart, sustainable and inclusive growth that secures the economic
competitiveness of the EU in high-value added, high-wage activities will require
a structural change of the EU economy towards higher knowledge intensity.”23
20 The President’s Commission on Competitiveness (1984).
21 OECD (1992).
22 European Commission (2000).
23 European Commission (2011).

GOV/PGC/ETH(2013)1
27
1.2 The (Potential) Impact of Public Procurement on National Competitiveness
74. To what extent is public procurement able to exert an impact on an economic system as whole?
Or, to put it more precisely, can public procurement influence a nation’s economic performance as
captured by macroeconomic indicators? These questions are far from being of purely theoretical nature
since, as discussed in the previous sections, public procurement is increasingly recognized as a tool for
promoting a wide array of socially valuable objectives. It is, however, unclear whether, say, the promotion
of comprehensive strategies of sustainable public procurement at a national level may represent a
competitive leverage for the same country in international markets.
75. To the best of our knowledge, there does not exist any proven direct link between the main
characteristics of a nation’s public procurement system and its degree of competitiveness. A nation’s
competitiveness is not important per se, but because it is instrumental to both short-term and long-term
growth. The previous section has made it clear that a unanimous and precise definition of national
competitiveness is still lacking.
76. In spite of this difficulty, a more operational definition of national competitiveness can be used
that would also be robust to Krugman’s criticism, namely “the set of institutions, policies and factors
that determine the level of productivity of a country.”24
The latter, in turn, sets the level of prosperity
that can be achieved by an economic system. Thus a nation’s standard of living hinges on the capacity of
its companies to both achieve high levels of productivity and to increase productivity over time. Economic
growth depends ultimately on a country’s ability to upgrade itself.25
77. Many factors shape productivity and, in turn, competitiveness. This is in fact one of the
historically most debated questions in economics that has spurred disputes among economics since Adam
Smith’s “An Enquiry into the Wealth of Nations”. Theories range from labor specialization to the role of
investments in physical capital and infrastructure and, more recently, have focused on human capital,
technological progress, good governance and market efficiency. The current debate seems to recognize that
multiple forces are at simultaneously at work in determining the level of national competitiveness (and
growth).26
2. Measures of National Competitiveness
78. Several institutions evaluate country competitiveness using a comprehensive approach which
emphasizes non-price factors. Periodically, they provide country ranking in various sectors, combining
statistical data and survey results. The following is a list of the main indicators:
Global Competitiveness Index (GCI) – published annually by the World Economic Forum
(WEF).27
It captures the microeconomic and macroeconomic foundations of national
competitiveness, including structural factors. The GCI considers 12 main determinants of
competitiveness called “pillars”: institutions, infrastructure, macroeconomic stability, health and
primary education, higher education and training, goods market efficiency, labor market
efficiency, financial market sophistication, technological readiness, market size, business
sophistication, and innovation.
24 World Economic Forum (2012), p.4.
25 Porter (1990), p.76.
26 See, among others, Aghion and Howitt (2009) and Alesina and Rodrik (1994).
27 The Global Competitiveness Paper 2012-13 can be downloaded from http://www.weforum.org/papers

GOV/PGC/ETH(2013)1
28
The World Competitiveness Index (WCI) – published by the IMD28
, uses more than 300 criteria
for evaluating enhancing factors for doing business and social welfare. It elaborates a country
profile measuring macroeconomic performance, governmental and private sector efficiency and
infrastructure levels.
The Doing Business Index – published annually by the World Bank and the International Finance
Corporation29
, investigates the business environment in countries, considering regulations that
enhance business activity and those that constrain it. In its 2012 report, the World Bank covered
183 economies analyzing 10 indicators: starting a business, dealing with construction permits,
getting electricity, registering property, getting credit, protecting investors, paying taxes, trading
across borders, enforcing contracts, and resolving insolvency.
The Competitive Industrial Performance Index (CIP) – developed by the United Nations
Industrial Development Organization (UNIDO) to benchmark national industrial performance.30
It builds on the notion that national competitiveness is an economy’s ability to create welfare.
The CIP index assesses industrial performance using indicators of an economy’s ability to
produce and export manufactured goods competitively. The CIP index has six main dimensions:
Industrial capacity (manufacturing value added per capita), manufactured export capacity, impact
on world manufacturing value added (MVA), impact on world manufactures trade,
industrialization intensity (share of manufacturing on GDP and share of medium and high-
technology products in manufacturing), export quality (share of manufacturing in export and
share of medium and high-technology products in manufactured exports).
Trade Performance Index (TPI) – published every two years by the International Trade Center
(ITC) in collaboration with UNCTAD, considers competitiveness level and export diversification
for 180 countries in 14 macrosectors (fresh food and raw agricultural products, processed food
and agro-based products, wood, wood products and paper, textiles, chemicals, leather and leather
products, metal and other basic manufacturing, non-electric machinery, computers and
telecommunications, electronic components, transport equipment, clothing, miscellaneous
manufacturing, minerals).31
For each country and sector, the TPI covers basic performance
characteristics, bringing out gains and losses in world market shares and shedding light on the
factors behind these changes, as well as monitoring the diversification of export products and
markets.
3. How Public Procurement May Affect National Competitiveness: The Main Transmission
Chains
79. None of the dimensions used to construct the above indexes makes neither an explicit nor a direct
link to public procurement. However, it is arguable that the latter can influence at least to some extent an
influence to a subset of the economic variables that contribute to determine the level of national
competitiveness. To this end it is worth focusing on the WEF’s GCI.
28 See http://www.imd.org/research/publications/wcy/upload/All_criteria_list.pdf
29 The paper can be downloaded from http://www.doingbusiness.org/papers/global-papers/doing-business-
2012
30 The UNIDO 2011 paper can be downloaded from
http://www.unido.org/fileadmin/user_media/Publications/IDR/2011/UNIDO_FULL_PAPER_EBOOK.pdf
31 See http://legacy.intracen.org/appli1/TradeCom/Documents/TradeCompMap-
Trade%20Performance%20Index-UserGuide-EN.pdf

GOV/PGC/ETH(2013)1
29
80. Table 1, borrowed from WEF (2012), provides the 12 pillars of competitiveness. At least three
pillars seem likely to be affected by public procurement policies and strategies at a national level:
Institutions, market size and innovation. In what follows we shall elaborate on the nature of the casual
links.32
Figure 1. Public Procurement and the Global Competitiveness Index
3.1 The Role of Institutions
81. The institutional environment is shaped by the legal and administrative framework in which
individuals, firms and governments operate to produce wealth. A sound and fair institutional framework is
quintessential to economic development. According to North and Thomas, dimensions such as innovation,
economies of scale, education and capital accumulation “are not causes of growth: they are growth”
(italics in original).33
North (1990, p. 3) offers a definition of institutions as “the rules of the game in a
society or, more formally, […] the humanly devised constraints that shape human interaction” thus
structuring “incentives in human exchange, whether political, social, or economic”.
82. Not only do economic institutions determine the aggregate potential of the economy, but also
affect an array of economic outcomes, among which the distribution of resources in the future. Thus the
main features of the institutional environment are likely to determine both the size of the aggregate pie and
how the pie is divided among different groups. For instance, the protection of property rights influence the
32 Upon browsing the list of pillars in table 1, one would be inclined to believe that public procurement
policies and processes affect also “Infrastructure”, “Health and Primary Education”, and “Higher
Education.” We are, however, also inclined to believe that public procurement has a more direct link to the
three selected pillars.
33 North and Thomas (1973), p. 2.
Basic requirements
subindex Efficiency enhancers
subindex Innovation and sophistication
factors subindex
GLOBAL COMPETITIVENESS INDEX
Pillar 1. Institutions
Pillar 2. Infrastructure
Pillar 3. Macroeconomic
environment
Pillar 4. Health and primary
education
Pillar 5. Higher education and
training
Pillar 6. Goods market and
efficiency
Pillar 7. Labor market efficiency
Pillar 8. Financial market
development
Pillar 9. Technological readiness
Pillar 10. Market size
Pillar 11. Business sophistication
Pillar 12. Innovation
PP
PP
PP
PP

GOV/PGC/ETH(2013)1
30
decisions of owners of land, corporate shares and intellectual property to invest in the improvement of their
property. Government attitude toward markets and freedom and its operational efficiency plays an
important role. Indeed phenomena such as corruption, red tape, lack of transparency and accountability,
dishonesty in the management of public contracts, inefficiency in law enforcement and in the functioning
of courts impose additional costs and uncertainty on firms, thus hampering significantly the process of
economic development.
83. Many features of a nation’s public procurement framework contribute substantially to determine
the overall quality of public institutions. More specifically, all the measures aiming at strengthening the
level of integrity of procurement processes34
would exert a positive impact on the quality of (public)
institutions as a whole.
3.2 Market Size and Efficiency
84. Market size may affect productivity via economy of scale. The size of available markets are in
principle constrained by national borders, but increasing globalization has caused exports to become a
(possibly imperfect) substitute for domestic markets. Although there does not exist unanimous scientific
consensus on the positive relation between trade openness and growth, few would deny that trade has a
positive effect on growth, especially for small countries. The case of the European Union illustrates the
importance of the market size for competitiveness, as important efficiency gains were realized through
closer integration during the past two decades. The trade in goods is in fact a major driver of growth in EU
manufacturing industries. Some 25% of the EU-27 GDP is generated by the goods sector. Intra-EU trade of
goods represents 75% of intra-EU trade flows. It has increased at an annual rate of 7.6% between 1999 and
2007.35
Although the reduction of trade barriers and the harmonization of standards within the European
Union have contributed to raising exports within the region, many factors still hamper the realization of a
true single market, in particular in services, thus leading to important border effects.
85. The public procurement market is likely to mirror most of the features of the market as a whole.
Thus while firms would certainly benefit from a larger absolute size of domestic markets, they would also
profit from additional business opportunities from cross-border public procurement. In this respect, the
potential size of the public procurement market which is relevant for firms located in a given country
results from the sum of the value of the domestic market and the value of all procurement procedures
abroad in which a non-domestic firm was allowed to participate. In other terms, the size of the procurement
market relevant to firms located in a given country depends also on the degree of openness of procurement
markets in all other countries. In practice cross-border procurement remains limited at the international
level, even in a single market such as the European Union which is ruled by a common set of Directives.
For example, in markets for public contracts which are the specific focus of EU public procurement
legislation, only a small proportion of contracts are awarded for firms from another Member State with
direct cross-border procurement accounting for 1.6% of awards.
86. While the absolute size of domestic market certainly matters for exploiting economies of scale,
ceteris paribus, the degree of demand aggregation is likely to strengthen such cost-reducing effect. Thus
for a given absolute value of the domestic public procurement market, the lower the number of procedures
the higher the likelihood that (bigger) firms are able to exploit economies of scale. However, a domestic
market with fewer and more sizeable public procurement procedures is more likely to cut off smaller firms
that in many countries contribute positively to the innovative potential in the market. At the same time,
smaller firms can participate in high-value procurement processes by either forming joint ventures to bid
directly for the contract or by carrying out a fraction of the procurement contract via subcontracting. Thus
34 See, for instance, OECD (2009).
35 See Monti (2010)

GOV/PGC/ETH(2013)1
31
any measure of demand centralization ought to be corrected by the degree of SMEs participation by means
of joint ventures and/or subcontracting.
87. The absolute size of procurement markets allows firms to produce in principle at lower unit cost,
but does not guarantee per se that the most efficient firms end up satisfying public buyers’ needs. That is, it
may well occur that large procurement markets reduce unit costs, but the most inefficient firms are being
selected to produce goods, services and civil works. Procurement markets are efficient if they select (in
most circumstances) the right mix of products/services for public buyers. This can be achieved when
market competition is healthy and thus allows (mainly) the most efficient firms to thrive.

GOV/PGC/ETH(2013)1
32
Box 10: Public Procurement Market Size and Efficiency
Examples of performance measures and indicators
Metrics MSE1
Descriptive statistics on the overall public procurement market (e.g., median (estimated) value;
distribution according to different contract value; distribution according to the typology of public
contract (goods, services, works)
Metrics MSE2
Total absolute value of the domestic public procurement market and value of procurement procedures
abroad in which non-domestic firms were allowed to participate
Metrics MSE3
Degree of competition of domestic public procurement markets. For instance,
a) Measure(s) of concentration
b) Number of lots (for a given class of values of contracts the average number of lots can be, at
least roughly, inferred by dividing the number of contract by the number of procedures)
3.3 Innovation
88. Innovation ultimately relies on production and diffusion of new knowledge, which can be seen as
a public good able to bring positive externalities for the whole economy36
. A simple economic argument
would provide the main rationale for public intervention in the innovation market.
89. A discussion about the public good nature of innovation goes far beyond the scope of this work.37
Yet, it is fairly evident that almost all governments do commonly implement policies aimed at promoting
innovation at different levels and through different instruments. Many of them are based on directly
supporting and sustaining the “producers” of innovation (“market push” approach): from infrastructures
building (say national high education systems) to subsidies to R&D activities.
90. On the other hand, innovation can also be boosted by acting on the demand side of the market
(“market-pull” approach). In this sense the public demand, if managed through strategic public
procurement strategies, can play an important role insofar as large-scale government purchases can be
oriented toward goods with different R&D content. For instance, the crucial role of US defense
acquisitions in triggering or boosting innovation in sectors like transports, ICT, electronics, new materials
is widely recognized.38
91. The major advantage of the “market-pull” approach is that it requires less information than the
“market-push” one. In the economic literature, such ideas have been outlined, for instance, by Geroski
(1990), Dalpé (1994) and Edler and Georghiou (2007). All of them emphasize how the effectiveness of a
36 This idea dates back at least to Arrow (1962).
37 More detailed discussion and further references on the relationship between procurement and innovation
are presented by Cabral et al. (2006). Scotchmer (2004) provides a discussion on the economics of
innovation. For a critique of the view of knowledge as a public good, see Boldrin and Levine (2005).
38 More examples and related references are provided by Cabral et al. (2006). The EU project OMC-PTP
(2009) provides a list of cases on recent experiences in the EU.

GOV/PGC/ETH(2013)1
33
demand-based approach to innovation policy stems from several facts. First, procurement initiatives can
make R&D projects to be driven by actual and clearly defined needs of the government. As a consequence,
procurement-based innovation policies can target the results of the R&D activity from the final user’s
perspective, rather than through an “external” evaluation of technical or scientific achievements. Secondly,
public demand, especially when aggregated, is able to provide those firms developing new products and
processes with an assured market whose size may be as relevant as to cover the risk of large investments
typically related with R&D. Thirdly, it has been noticed that, in many cases, the creation of a public market
for new products can trigger a “flywheel effect” for the rise of a private market. This spill-over effect is
relevant, in particular, for markets characterized by “network effects”, i.e. markets for products whose
value for customers increases with the number of their users.39
Finally, even beyond stimulating production
of innovative goods, the public sector is in a position to set forward (or even switch) the dominant standard
for commonly used products and processes..
Box 11: Procurement of R&D
Examples of performance measures and indicators
Metrics R&D1
Existence of a body of regulation governing public procurement of R&D
Metrics R&D2
Percentage of the overall procurement spend earmarked for procurement of R&D
Metrics R&D3*
Number of patents that can be linked to procurement of R&D relative to overall procurement budget for
R&D (or, alternatively, overall procurement budget)
The potential difficulty of implementing this metrics consists in finding a clear and direct link between a
certain procurement activity (or a set of activities) and patents.
39 See Katz and Shapiro (1985).

GOV/PGC/ETH(2013)1
34
Box 12: Procurement of Innovative Products/Services (“First” Procurement)
Examples of performance measures and indicators
Metrics FP1
Number of cases and total value of acquisition of innovative products/services40
relative to total
procurement spend
Metrics FP2
Most recurrent type of procurement procedure adopted for acquiring innovative products/services
among open, restricted and negotiated procedure
Metrics FP3
Easiness for public buyers to engage the market in early consultations (“To what extent is procurement
regulation restrictive with respect to early consultations with the market?”)
Box 13: Innovation through Procurement Processes
Examples of performance measures and indicators
Metrics IPP1
Frequency of reference to standards in tender documents
Metrics IPP2
Frequency of use of functional requirements in procurement contracts
40 Innovative products/services are those products/services which are “state of the art” but have not been
largely commercialized yet.

GOV/PGC/ETH(2013)1
35
REFERENCES
Aghion, P., Howitt, P., (2009), The Economics of Growth, The MIT Press, Cambridge (USA).
Albano, G. L., Sparro, M., (2010), “Flexible Strategies for Centralized Public Procurement,” Review of
Economics and Institutions, 1(2), Article 4, available at http://www.rei.unipg.it/rei/article/view/17.
Alesina, A., Rodrik, D., (1994), “Distributive Politics and Economic Growth.” Quarterly Journal of
Economics, 109 (2), pp. 465-90.
Arrow, Kenneth J. (1962), “Economic Welfare and the Allocation of Resources to Invention,” in R.R.
Nelson (ed.), The Rate and Direction of Economic Activity, Princeton University Press, N.Y.
Boldrin, M., Levine, D. K., (2008), Against Intellectual Monopoly, Cambridge University Press (retrieved
from http://levine.sscnet.ucla.edu/general/intellectual/againstnew.htm).
Brandenburger, A. M., Nalebuff, B. J., (1997), Co-Opetition: A Revolution Mindset That Combines
Competition and Cooperation; The Game Theory Strategy That's Changing the Game of Business,
Doubleday, New York (paperback edition)
Cabral, L., Cozzi, G., Denicolò. V., Spagnolo, G., Zanza, M., (2006), “Procuring Innovations,” in Dimitri,
N., Piga, G., Spagnolo, G., (Eds), Handbook of Procurement, Cambridge University Press,
Cambridge (UK).
Dalpé, R., (1994), “Effects of Government Procurement on Industrial Innovation,” Technology in Society,
16 (1), pp. 65-83.
Edler, J., Georghiou, L., (2007), “Public Procurement and Innovation - Resurrecting the Demand Side,”
Research Policy, 36(7), pp. 949-963.
European Commission, (2011), Innovation Union Competitiveness Paper, Ch. 4.
European Commission (2010a), “Buying Social. A Guide to Taking Account of Social Considerations in
Public Procurement”, retrieved on 18th Sept 2012 from
http://ec.europa.eu/internal_market/publicprocurement/other_aspects/index_en.htm#social
European Commission, (2010b), “Europe 2020 - A European Strategy for Smart, Sustainable and Inclusive
Growth,” retrieved from http://ec.europa.eu/commission_2010-
2014/president/news/documents/pdf/20100303_1_en.pdf
European Commission, (2000), European Competitiveness Paper, 2000-2002.
Geroski, P.A., (1990), “Procurement Policy as a Tool of Industrial Policy,” International Review of
Applied Economics, 4(2), pp. 182-198.

GOV/PGC/ETH(2013)1
36
Green, A., J. Preston, and G. Janmaat, (2006), Education, Equality and Social Cohesion: A Comparative
Analysis. Basingstoke: Palgrave Macmillan.
ICLEI, (2003), RELIEF - European research project on green procurement, retrieved from
http://www.iclei-europe.org/products-activities/?cmd=view&aid=74
Katz, M. L., Shapiro, C., (1985), “Network Externalities, Competition, and Compatibility,” The American
Economic Review, Vol. 75, No. 3, pp. 424-440.
Krishna, V., (2009), Auction Theory, Academic Press.
Krugman, P. R., (1994), “Competitiveness: A Dangerous Obsession”, Foreign Affairs, Vol.73(2), pp. 28-
44.
Krugman, P. R., (1996), “Making Sense of the Competitiveness Debate,” Oxford Review of Economic
Policy, Vol. 12, No. 3, pp. 17-25.
OECD, (2013), Public Procurement Review of the Electric Utility of Mexico: Towards Procurement
Excellence in the Federal Electricity Commission (CFE), OECD Publishing.
OECD, (2009), Principles for Integrity in Public Procurement, available online at:
www.oecd.org/document/25/0,3343,en_2649_34135_42768665_1_1_1_1,00.html
OECD (2011), “Special feature: Green procurement”, in Government at a Glance 2011, OECD Publishing,
available online at http://dx.doi.org/10.1787/gov_glance-2011-49-en
OECD, (1992), Programme on Technology and the Economy, Paris.
Monti, M., (2010), “A New Strategy for the Single Market - At the Service of Europe’s Economy and
Society,” Paper to the President of the European Commission José Barroso, available at
http://ec.europa.eu/bepa/pdf/monti_paper_final_10_05_2010_en.pdf
Nicholas, C., (2012), “A critical evaluation of the draft revised UNCITRAL Model Law Provisions on
Regulating Framework Agreements,” Public Procurement Law Review, 2, pp. 19-46.
North, D.C. (1990). Institutions, Institutional Change, and Economic Performance. Cambridge University
Press, New York.
North, D.C., Thomas, R.P. (1973). The Rise of the Western World: A New Economic History. Cambridge
University Press, Cambridge, UK.
OMC-PTP, (2009), Exploring Public Procurement as a Strategic Innovation Policy Mix Instrument,”
retrieved on 1st November 2012 from
http://www.ukmin.lt/uploads/documents/imported/lt/veikla/veiklos_sritys/viesieji-pirkimai/ES-
dokumentai/dokum/Analize.pdf
Porter, M. E., (1990), “The Competitive Advantage of Nations,” Harvard Business Review, March-April.
President’s Commission on Competitiveness, (1984), “The Paper of the President’s Commission on
Competitiveness,” written for the Reagan Administration.

GOV/PGC/ETH(2013)1
37
Racca, G. M., Cavallo Perin, R., and G. L. Albano, (2011), “Competition in the Execution Phase of Public
Procurement,” Public Contract Law Journal, Vol. 41/No.1.
Scotchmer, S., (2004), Innovation and Incentives, the MIT Press.
UNCITRAL, (2011), “Model Law on Procurement of Goods, Construction and Services, with Guide to
Enactment,” available at
http://www.uncitral.org/uncitral/en/uncitral_texts/procurement_infrastructure/2011Model.html
World Economic Forum, (2012), The Global Competitiveness Report 2012-2013, retrieved from
http://www.weforum.org/reports
Yukins, C. R., (2010), "A Versatile Prism: Assessing Procurement Law Through the Principal-Agent
Model," Public Contract Law Journal, 40, pp. 63-86.